2006 Baseline Study of India’s Industrial Training ... Baseline Study of India’s Industrial...
35
2006 Baseline Study of India’s Industrial Training Institutes: Institutional Performance and Employment of ITI Graduates March 2007 Hong Tan, Sangeeta Goyal, Yevgeniya Savchenko South Asia Region, Human Development Department (SASHD) The World Bank Prepared for the Directorate General for Employment and Training Ministry of Labor and Employment, Government of India As part of preparation for the India Vocational Training Improvement Project Public Disclosure Authorized Public Disclosure Authorized Public Disclosure Authorized Public Disclosure Authorized
-
Upload
truongthien -
Category
Documents
-
view
224 -
download
0
Transcript of 2006 Baseline Study of India’s Industrial Training ... Baseline Study of India’s Industrial...
2006 Baseline Study of India’s Industrial Training Institutes: Institutional Performance and Employment of ITI Graduates
March 2007
Hong Tan, Sangeeta Goyal, Yevgeniya Savchenko
South Asia Region, Human Development Department (SASHD)
The World Bank
Prepared for the Directorate General for Employment and Training
Ministry of Labor and Employment, Government of India
As part of preparation for the India Vocational Training Improvement Project
Pub
lic D
iscl
osur
e A
utho
rized
Pub
lic D
iscl
osur
e A
utho
rized
Pub
lic D
iscl
osur
e A
utho
rized
Pub
lic D
iscl
osur
e A
utho
rized
WB406484
Typewritten Text
96210
- 2 - 2
Contents
Executive Summary…………………………………………………………………….....3
1. Introduction: Institutional Performance and Employment of ITI
Graduates…………….............................................................................................4
2. Base-line Surveys……………………………………………………………….....5
3. Overview of ITI Performance...…………………………………………………...7
4. Labor Market Outcomes and Satisfaction with Training of
ITIs………………………………...……………………………………………..16
5. Findings and Recommendations…………………………………………………26
References………………………………………………………………………………..28
Annex…………………………………………………………………………………….29
- 3 - 3
Executive Summary
There is growing demand in India for a more educated and skilled workforce to support
on-going economic growth, to bridge emerging skill-gaps, and to correct skill
mismatches due to disconnect between the demand for and supply of skills.
Currently, around 0.71 million youth undertake training in about 5,000 plus public and
private industrial training institutes/industrial training centers (ITI/ITC).
Two studies were undertaken in 2006 to provide base-line information on ITI
performance and labor market outcomes of ITI pass-outs and usefulness of training given
in public sector ITIs. The former was assessed through an ITI Institutional Census
(2006) which canvassed data from all ITIs in the public domain; the latter through a
tracer study of ITI pass-outs, the ITI Tracer Study (2006).
ITI performance
From the ITI Institutional Census (2006), two factors emerge clearly that can seriously
affect the quality of training provided in ITIs: (a) a very high proportion (25 percent) of
instructor vacancies remaining unfilled and (b) lack of regular in-service training for most
vocational instructors (nearly 75 percent instructors had not received any in-service
training in the last three years). There are large variations across states but the nation-
wide averages for these variables are significant in magnitude.
There is lack of rationalization of course offerings which likely reduces the cost-
efficiency of ITIs. Courses with no demand continue to be offered, and there is evidence
of over-subscription in some courses.
The internal efficiency of ITIs as measured by pass-rates of enrollees is also low. Though
the pass rate varies considerably across states, on the average, only 61 percent of those
who enroll in ITIs pass the final exam.
Labor Market Outcomes
Labor market outcomes of ITI trainees assessed through a tracer study of ITI pass-outs
show poor results. Only 32 percent of ITI pass-outs interviewed in the tracer study had
found any employment within 12 months of graduating. Outcomes vary by states and by
duration of training course undertaken (whether one-year or two-years) but overall they
remain unsatisfactory.
The tracer study also asked graduates to rate the training they received along dimensions
of quality and usefulness. Their response clearly indicated that the scope of training
provided in ITIs needs to be extended to include general skills relevant for improving
their chances in the current labor market. Among skills identified by students as valued
by employers included communication, presentation, management and entrepreneurship.

- 4 - 4
1. Introduction
India’s economy has grown rapidly in the last decade and with rapid growth, demand has
grown for a more educated and skilled workforce. In response, the Government of India
(GoI) has expanded investments in general education and sought to expand and improve
delivery of post-school vocational training for youth not continuing into higher education.
The formal vocational training system in India currently consists of 1,882 public
Industrial Training Institutes (ITI) and 3,358 private Industrial Training Centers (ITC)
with a total annual training capacity of 740,000 plus students. This output is woefully
inadequate to meet the numerical needs of employers for skilled workers or the training
aspirations of school leavers. There is also reportedly a mismatch between the training
that institutions provide their pass-outs and the skills that employers need.
Despite these investments in the human capital of the workforce, the relative wages of
workers with secondary and higher levels of education have grown even as the supply of
these workers has also increased, providing evidence of a rising demand for educated and
skilled workers (World Bank, 2006). Even with rising demand for skilled labor, the labor
market outcomes for graduates of the training system are very poor. While nearly 60
percent of all graduates of the vocational training system remain unemployed, there is
evidence that employers are not able to hire trained labor in adequate numbers. An ILO
study (2003) showed that more than eighty percent of employers in Orissa and Andhra
Pradesh, and more than fifty percent of employers in Maharashtra frequently or
occasionally faced problems in finding skilled employees. Moreover, among those who
did find employment, nearly two-thirds worked in trades other than those they were
trained for.
The three most important reasons for poor labor market outcomes for graduates of the
training system are: (a) the low quality of training which results in the supply of
relatively low quality skills; (b) the mismatch between skills acquired and those in
demand in the labor market; and (c) the mismatch between skills taught and the
graduates’ own career and labor market aspirations. The low quality of skills supplied by
vocational training institutions is highlighted by the findings of several recent studies. A
2003 Directorate General of Employment and Training (DGET) study of graduates of
apprenticeship training programs in six states concluded that training provided had
doubtful relevance for the labor market. A 2002 survey by FICCI assessing the quality
and relevance of vocational and technical training from industry’s perspective came to
the same conclusion. According to this survey of 55 enterprises, about 60 percent of
respondents felt that training institutions were not geared to meeting the needs of
industry, and almost 87 percent felt that training should include exposure to industry
practices. Respondents stressed the importance of partnerships and collaboration between
the public and private sectors for achieving a better match between the supply of and
demand for skills.
The recent Report on Craftsmen Training and Employment (DGET, 2005) underscores
the findings of the earlier DGET (2003) and FICCI (2002) studies. The report sought to
evaluate ITIs in the states of Punjab, Haryana and Rajasthan. Based on responses from

- 5 - 5
ITI principals, faculty members and students, the report concluded that course offerings
and training in ITIs were rigid and did not respond to the changing demands of business
and industry. The percentage of students in various trades who were not employed at the
time of the survey (about a year after training) ranged from a little over 10 percent in a
few trades to as high as 60-80 percent in most others. The Report identified collaboration
between ITIs and industry/business as a critical factor in improving labor market
outcomes of graduates of the training system. Greater public and private sector
collaboration in training would enhance flexibility in responding to changing labor
market skill needs, aid in continuous upgrading of courses, curriculum development and
faculty support, and help mobilize resources, among other benefits.
2. Baseline Surveys
This report is based on two surveys undertaken in 2006. One was a baseline institutional
survey – the ITI Institutional Census (2006) – of all government managed and financed
industrial training institutes (ITI) in India. The second was a tracer study – ITI Tracer
Study (2006) – of past graduates from a sample of ITIs.1
The ITI Institutional Census (2006)
The ITI Institutional Census (2006) was conducted in collaboration with the Ministry of
Labour and Employment, Government of India (MoLE, GoI). The data for the survey
was collected in 2006. All 1,882 public ITIs across all Indian states were sent a
questionnaire through the MoLE. At the end of the data-collection exercise, 1,375 ITIs
had sent information. This provided coverage of approximately 73% of the Indian
population.
The survey collected data on the following aspects of ITIs:
(a) Management: questions on staff profile, vacancies, and the existence of a Centre
of Excellence (COE).
(b) Finance: disaggregated details on the recurrent and recurrent budget and expenses
of the ITI, and retained revenues.2
(c) Students: total enrolment, enrolment by gender and social group.
1 Both the base-line institutional database and the tracer study are intended to provide a base-line
benchmark of the pre-project status of a substantial part of the public vocational training system in India.
They will also provide the basis for establishing a monitoring and evaluation system for the sector under
the project. A brief description of the project is provided in the Annex.
2 While the survey sought to collect data on the financial aspects of ITIs, the actual data received was
largely incomplete and of poor quality. This report therefore does not provide any discussion on the
financial aspects of ITIs. Section A.4. of the Annex lists the data quality issues associated with the two
surveys.
- 6 - 6
(d) Teachers: composition of teaching staff, and their individual characteristics such
as their education and training and experience, their status and rank in the ITI and
the trades they teach.
(e) Trades: profile of trades taught in the ITI such as type of trade, its duration and
the numbers enrolled by gender, and internal efficiency indicators. Data on these
trade related indicators was obtained for the years 2003-04, 2004-05 and 2005-
06.3
ITI Tracer Study (2006)
The objective of the tracer study was to assess the labor market outcomes of those who
train in ITIs as well as to generate information on the quality of training and the
usefulness and market value of trades learnt in ITIs from the receivers of such training.4
The field-work for the tracer study was done by the survey firm of A. C. Nielsen ORG
MARG between the months of August and December 2006. Out of a population of 1,882
public ITIs, a sample of 400 representing nearly one-fifth of the total, was sought to be
selected. The distribution of the sample across the states reflected the actual distribution
of ITIs across the states.
The 400 ITIs were selected into the sample according to the following criteria:
(a) All 100 ITIs wherein Centres of Excellence (COE) were established by GoI
funding in the year 2004-2005 were selected into the sample.
(b) The second set of 100 ITIs that had been identified by MoLE, GoI for the
establishment of COEs in the year 2005-2006 were also selected into the sample.5
(c) The total number of ITIs to be selected into the sample for each state was
distributed across urban and rural areas according to the actual ratio of urban and
rural ITIs in that state. After the ITIs in each state were selected according to
criteria (a) and (b), the remaining rural and urban ITIs were randomly chosen
sorted by size.
For the tracer survey, it was decided to interview a sample of 20 past graduates from each
of the sample ITIs, giving a total sample size of 8000 graduates. Ten of the twenty past
3 The base-line institutional data-base will be updated every year of the period of the project, and will be
overseen by the Monitoring and Evaluation cells of the National Project Implementation Unit (NPIU) and
the State Project Implementation Units (SPIU). It is expected that the base-line will eventually become
integrated with a computer based management information system initially for the project and eventually
for the entire vocational training sector of the country.
4 The tracer study was also intended to provide one of the basic tools for monitoring and evaluation of the
project. It will enable the establishment of clear links between the base-line status and the results of the
interventions, namely providing a tool for demonstrating and measuring the progress achieved towards the
development objective targets of improved labor market outcomes for ITI graduates.
5 We will refer to the first and second set of 100 ITIs in this report as project ITIs. The remaining will be
considered as non-project ITIs.

- 7 - 7
graduates were to be pass-outs from the year 2004, and the other ten were to be pass-outs
from the year 2005. To reach an achieved sample of a total of 20 students, 16 graduates
were randomly chosen from the eligible list of students for each of the two years, 2004
and 2005. The extra numbers were to add a buffer margin, in those cases where either it
became infeasible to trace the sample graduate. Only those students who had passed their
final examination, and were not repeating the examination (because they had been unable
to clear it in a previous attempt) were considered eligible. This was done to reduce the
extent of any bias introduced due to unobserved systematic differences between first-time
successes, failures and repeaters.
The tracer study collected information on the following:
(a) Personal details including information on the socio-economic background of the
graduate.
(b) Enrollment, trade characteristics, and time taken to complete training.
(c) Employment history of the graduate from the time he/she passed out from the ITI.
(d) Graduate’s perceptions of the quality and usefulness of the trade(s) studied.
(e) Aspects of training in ITIs that require enhancement and/or improvement.
At the end of the survey, data was collected from 374 ITIs giving a total sample size of
over 7,144 past graduates.
3. Overview of ITI Performance
In this section, we report on the main findings of the ITI Institutional Census (2006)
along three dimensions: 1) management; 2) instructors; and 3) trades. We provide both a
national picture and the state-wise performance of ITIs along these dimensions. Wherever
possible we also indicate the differences between ITIs already selected into the project,
and the rest.
Management
Private Sector Participation in ITI Management: Historically, the involvement of the
private sector in the management of ITIs has been limited. The concept of an Institutional
Management Committee (IMC) that would have representation from the private sector
and the ITI faculty has been around for many years but had never been made a formal
requirement. It was left to individual ITIs discretion to constitute one.6 The role of IMCs
was envisaged to ensure greater and more active involvement of industry in all aspects of
training. They would also forecast emerging training areas, assess training needs, review
new curriculum for relevance, approve faculty training and appointments of contract
staff, and facilitate job placements of graduates.
6 Under the VTI project, a functioning IMC is a key eligibility criterion for an ITI to participate.

- 8 - 8
According to ITI Institutional Census, 37 percent of ITIs7 reported having IMC in place.
An average IMC had been functioning for 2.7 years8 (IMC age range was 0 to 11 years),
had 10 members (range 0-27 people) with half of them being private sector
representatives. The design of ITI Institutional Census (2006) did not give the possibility
to judge the quality of private sector involvement in IMC functioning.9 In the sub-sample
of project ITIs, 59 percent had IMC in place, 2.5 percent did not have IMC and 38.5
percent did not answer the question.10
Similar to the concept of IMCs, that of Centers of Excellence (CoE) has also been around
for a number of years, though it was never made a formal requirement, and has recently
gained urgency with the felt need to upgrade skills of those entering the labor market.
Within their specified trade sectors, CoEs were meant to provide courses that meet the
need for high quality craftsmen by the dominant local industries. The objective of CoEs
is to produce a multi-skilled workforce of world class standard.11 .In the baseline survey
only 85 ITIs, 6 percent of the total sample, reported that they have CoEs, 281 indicated
that they did not have CoE, and 1009 ITIs did not answer the question. It is probably safe
to assume that majority of the ITIs that did not answer the question also did not have
CoE, since CoE concept has been formally introduced only very recently. The average
age of CoE was 3.6 years12 (median 1 year, or alternatively, the median year of CoE
establishment was 2005).
ITI Staff Composition: A total of 1,308 ITIs provided detailed information about 16,816
staff members13. Table 3.2 shows the composition of ITI staff summed across all ITIs that
responded to the ITI Census. Of all ITI staff, 90 percent were vocational instructors, 3.5
percent were contract instructors, 6 percent were management personnel (including
principals and vice principals), and less than one percent was non-teaching staff. The
gender composition of teaching staff was similar across states, by ITI size and across
project & non-project ITIs. Women made up less than 12 percent of the ITI staff and
11.71 percent of all vocational instructors. Scheduled caste and Schedule Tribe (SC/ST)
staff constituted around 21 percent of ITI staff.
7 In fact, 514 ITIs reported having IMC in place, 131 did not have IMC. The rest, 730, did not answer the
question. We assumed that if ITI did not answer the question, it did not have IMC. However, when MIS
system collects ITI information in the future, the rules for answering the question should be very clearly
specified so that missing values are not allowed. 8 ITIs were asked to report the year of IMC establishment, we calculated the age of IMC using the
following formula: IMC age=2006- year of IMC establishment 9 Future editions of the institutional census will include questions on the quality of private sector
involvement in IMC functioning. 10 This should not be interpreted as project ITIs not complying with the requirement of having a formally
constituted IMC. Project ITIs in this report both those that have been exposed to the intervention (the first
100 ITIs) and those that have been identified for the next phase of the intervention (the second 100 ITIs). 11 The VTI project provides ITIs the option to establish CoEs. These will introduce one-year multi-skilling
courses, followed by another year with advanced/specialised modular courses by adopting an industry-wise
cluster approach, and with multi-entry and multi-exit provisions 12 ITIs were asked to report the year of CoE establishment, we calculated the age of CoE using the
following formula: CoE age=2006- year of CoE establishment. 13 Arunachal Pradesh and Jharkhand did not provide any piece of detailed information about staff members.
- 9 - 9
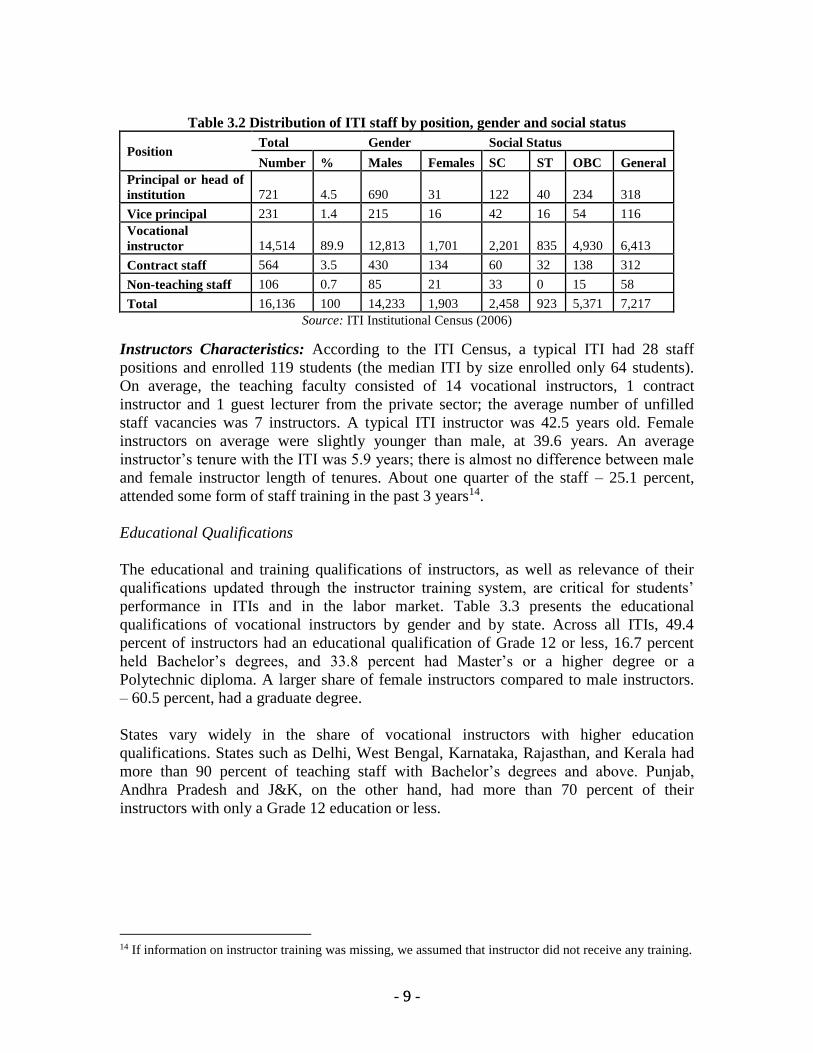
Table 3.2 Distribution of ITI staff by position, gender and social status
Position Total Gender Social Status
Number % Males Females SC ST OBC General
Principal or head of
institution 721 4.5 690 31 122 40 234 318
Vice principal 231 1.4 215 16 42 16 54 116
Vocational
instructor 14,514 89.9 12,813 1,701 2,201 835 4,930 6,413
Contract staff 564 3.5 430 134 60 32 138 312
Non-teaching staff 106 0.7 85 21 33 0 15 58
Total 16,136 100 14,233 1,903 2,458 923 5,371 7,217
Source: ITI Institutional Census (2006)
Instructors Characteristics: According to the ITI Census, a typical ITI had 28 staff
positions and enrolled 119 students (the median ITI by size enrolled only 64 students).
On average, the teaching faculty consisted of 14 vocational instructors, 1 contract
instructor and 1 guest lecturer from the private sector; the average number of unfilled
staff vacancies was 7 instructors. A typical ITI instructor was 42.5 years old. Female
instructors on average were slightly younger than male, at 39.6 years. An average
instructor’s tenure with the ITI was 5.9 years; there is almost no difference between male
and female instructor length of tenures. About one quarter of the staff – 25.1 percent,
attended some form of staff training in the past 3 years14.
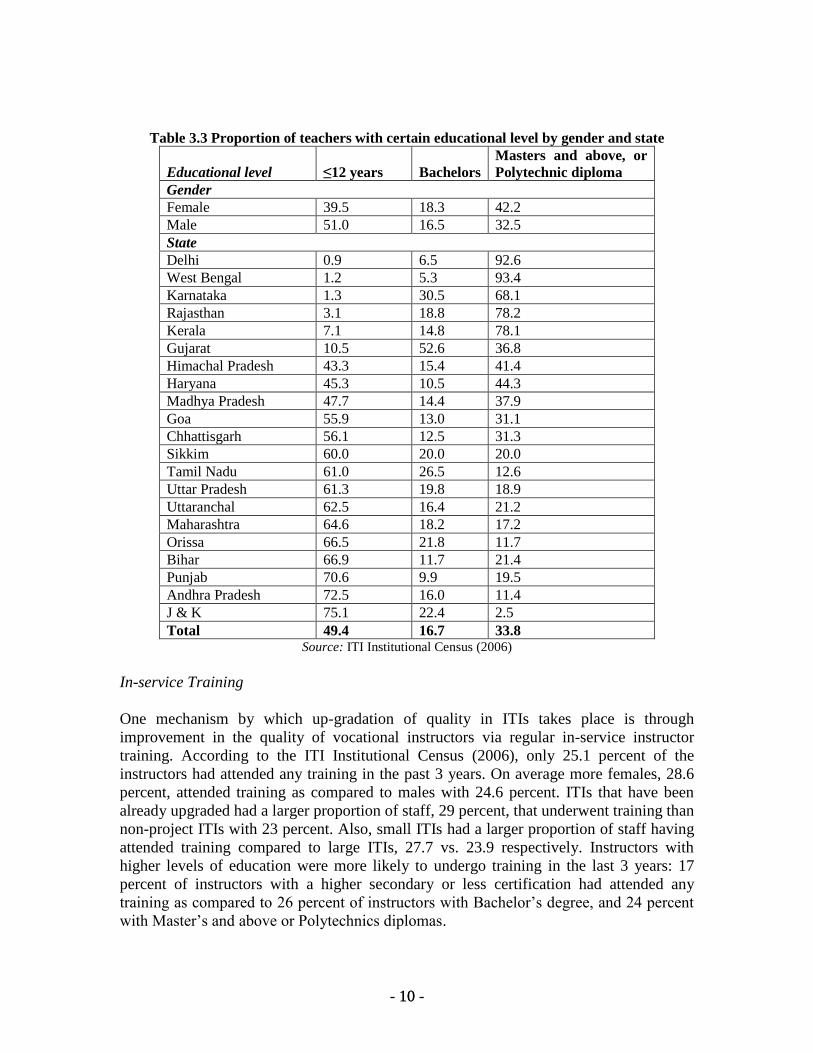
Educational Qualifications
The educational and training qualifications of instructors, as well as relevance of their
qualifications updated through the instructor training system, are critical for students’
performance in ITIs and in the labor market. Table 3.3 presents the educational
qualifications of vocational instructors by gender and by state. Across all ITIs, 49.4
percent of instructors had an educational qualification of Grade 12 or less, 16.7 percent
held Bachelor’s degrees, and 33.8 percent had Master’s or a higher degree or a
Polytechnic diploma. A larger share of female instructors compared to male instructors.
– 60.5 percent, had a graduate degree.
States vary widely in the share of vocational instructors with higher education
qualifications. States such as Delhi, West Bengal, Karnataka, Rajasthan, and Kerala had
more than 90 percent of teaching staff with Bachelor’s degrees and above. Punjab,
Andhra Pradesh and J&K, on the other hand, had more than 70 percent of their
instructors with only a Grade 12 education or less.
14 If information on instructor training was missing, we assumed that instructor did not receive any training.
- 10 - 10
Table 3.3 Proportion of teachers with certain educational level by gender and state
Educational level ≤12 years Bachelors
Masters and above, or
Polytechnic diploma
Gender
Female 39.5 18.3 42.2
Male 51.0 16.5 32.5
State
Delhi 0.9 6.5 92.6
West Bengal 1.2 5.3 93.4
Karnataka 1.3 30.5 68.1
Rajasthan 3.1 18.8 78.2
Kerala 7.1 14.8 78.1
Gujarat 10.5 52.6 36.8
Himachal Pradesh 43.3 15.4 41.4
Haryana 45.3 10.5 44.3
Madhya Pradesh 47.7 14.4 37.9
Goa 55.9 13.0 31.1
Chhattisgarh 56.1 12.5 31.3
Sikkim 60.0 20.0 20.0
Tamil Nadu 61.0 26.5 12.6
Uttar Pradesh 61.3 19.8 18.9
Uttaranchal 62.5 16.4 21.2
Maharashtra 64.6 18.2 17.2
Orissa 66.5 21.8 11.7
Bihar 66.9 11.7 21.4
Punjab 70.6 9.9 19.5
Andhra Pradesh 72.5 16.0 11.4
J & K 75.1 22.4 2.5
Total 49.4 16.7 33.8 Source: ITI Institutional Census (2006)
In-service Training
One mechanism by which up-gradation of quality in ITIs takes place is through
improvement in the quality of vocational instructors via regular in-service instructor
training. According to the ITI Institutional Census (2006), only 25.1 percent of the
instructors had attended any training in the past 3 years. On average more females, 28.6
percent, attended training as compared to males with 24.6 percent. ITIs that have been
already upgraded had a larger proportion of staff, 29 percent, that underwent training than
non-project ITIs with 23 percent. Also, small ITIs had a larger proportion of staff having
attended training compared to large ITIs, 27.7 vs. 23.9 respectively. Instructors with
higher levels of education were more likely to undergo training in the last 3 years: 17
percent of instructors with a higher secondary or less certification had attended any
training as compared to 26 percent of instructors with Bachelor’s degree, and 24 percent
with Master’s and above or Polytechnics diplomas.
- 11 - 11
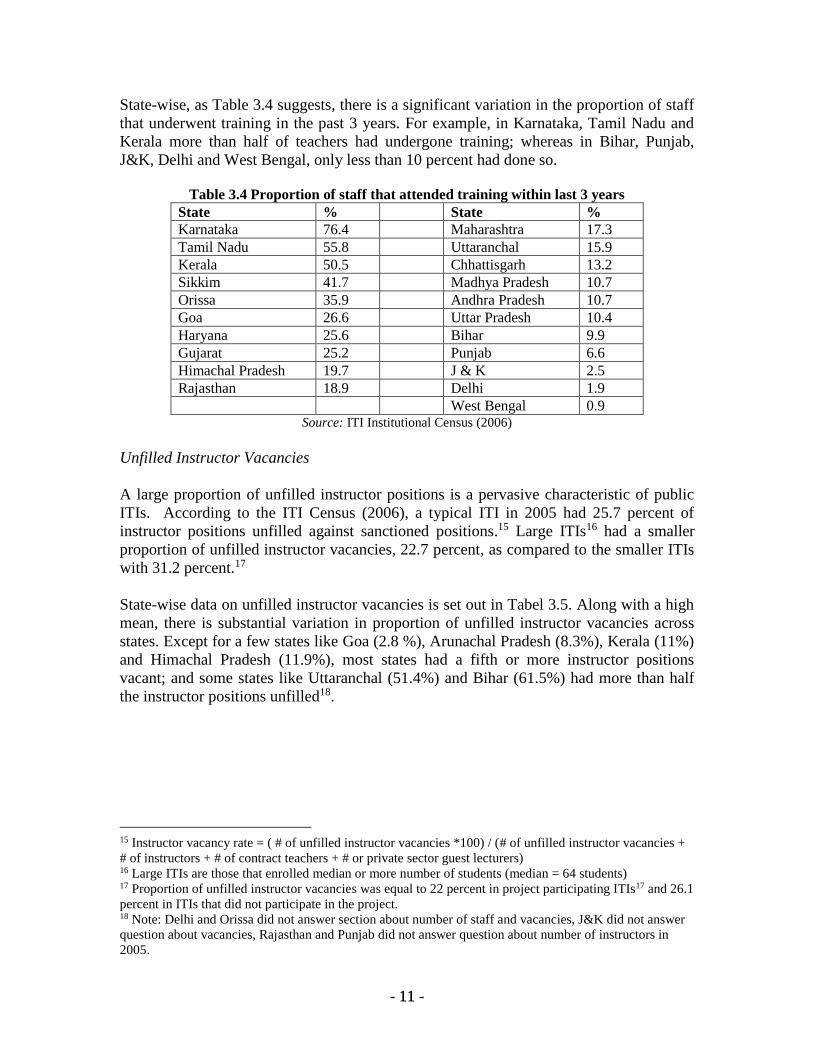
State-wise, as Table 3.4 suggests, there is a significant variation in the proportion of staff
that underwent training in the past 3 years. For example, in Karnataka, Tamil Nadu and
Kerala more than half of teachers had undergone training; whereas in Bihar, Punjab,
J&K, Delhi and West Bengal, only less than 10 percent had done so.
Table 3.4 Proportion of staff that attended training within last 3 years
State % State %
Karnataka 76.4 Maharashtra 17.3
Tamil Nadu 55.8 Uttaranchal 15.9
Kerala 50.5 Chhattisgarh 13.2
Sikkim 41.7 Madhya Pradesh 10.7
Orissa 35.9 Andhra Pradesh 10.7
Goa 26.6 Uttar Pradesh 10.4
Haryana 25.6 Bihar 9.9
Gujarat 25.2 Punjab 6.6
Himachal Pradesh 19.7 J & K 2.5
Rajasthan 18.9 Delhi 1.9
West Bengal 0.9 Source: ITI Institutional Census (2006)
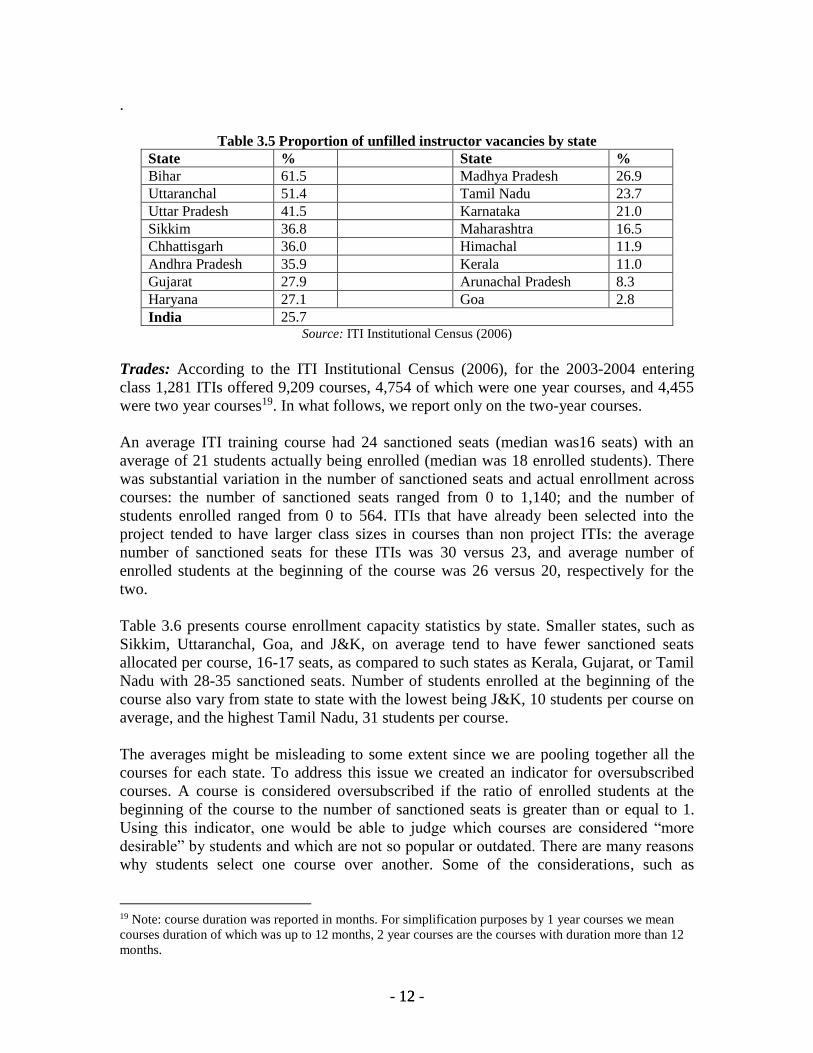
Unfilled Instructor Vacancies
A large proportion of unfilled instructor positions is a pervasive characteristic of public
ITIs. According to the ITI Census (2006), a typical ITI in 2005 had 25.7 percent of
instructor positions unfilled against sanctioned positions.15 Large ITIs16 had a smaller
proportion of unfilled instructor vacancies, 22.7 percent, as compared to the smaller ITIs
with 31.2 percent.17
State-wise data on unfilled instructor vacancies is set out in Tabel 3.5. Along with a high
mean, there is substantial variation in proportion of unfilled instructor vacancies across
states. Except for a few states like Goa (2.8 %), Arunachal Pradesh (8.3%), Kerala (11%)
and Himachal Pradesh (11.9%), most states had a fifth or more instructor positions
vacant; and some states like Uttaranchal (51.4%) and Bihar (61.5%) had more than half
the instructor positions unfilled18.
15 Instructor vacancy rate = ( # of unfilled instructor vacancies *100) / (# of unfilled instructor vacancies +
# of instructors + # of contract teachers + # or private sector guest lecturers) 16 Large ITIs are those that enrolled median or more number of students (median = 64 students) 17 Proportion of unfilled instructor vacancies was equal to 22 percent in project participating ITIs17 and 26.1
percent in ITIs that did not participate in the project. 18 Note: Delhi and Orissa did not answer section about number of staff and vacancies, J&K did not answer
question about vacancies, Rajasthan and Punjab did not answer question about number of instructors in
2005.
- 12 - 12
.
Table 3.5 Proportion of unfilled instructor vacancies by state
State % State %
Bihar 61.5 Madhya Pradesh 26.9
Uttaranchal 51.4 Tamil Nadu 23.7
Uttar Pradesh 41.5 Karnataka 21.0
Sikkim 36.8 Maharashtra 16.5
Chhattisgarh 36.0 Himachal 11.9
Andhra Pradesh 35.9 Kerala 11.0
Gujarat 27.9 Arunachal Pradesh 8.3
Haryana 27.1 Goa 2.8
India 25.7 Source: ITI Institutional Census (2006)
Trades: According to the ITI Institutional Census (2006), for the 2003-2004 entering
class 1,281 ITIs offered 9,209 courses, 4,754 of which were one year courses, and 4,455
were two year courses19. In what follows, we report only on the two-year courses.
An average ITI training course had 24 sanctioned seats (median was16 seats) with an
average of 21 students actually being enrolled (median was 18 enrolled students). There
was substantial variation in the number of sanctioned seats and actual enrollment across
courses: the number of sanctioned seats ranged from 0 to 1,140; and the number of
students enrolled ranged from 0 to 564. ITIs that have already been selected into the
project tended to have larger class sizes in courses than non project ITIs: the average
number of sanctioned seats for these ITIs was 30 versus 23, and average number of
enrolled students at the beginning of the course was 26 versus 20, respectively for the
two.
Table 3.6 presents course enrollment capacity statistics by state. Smaller states, such as
Sikkim, Uttaranchal, Goa, and J&K, on average tend to have fewer sanctioned seats
allocated per course, 16-17 seats, as compared to such states as Kerala, Gujarat, or Tamil
Nadu with 28-35 sanctioned seats. Number of students enrolled at the beginning of the
course also vary from state to state with the lowest being J&K, 10 students per course on
average, and the highest Tamil Nadu, 31 students per course.
The averages might be misleading to some extent since we are pooling together all the
courses for each state. To address this issue we created an indicator for oversubscribed
courses. A course is considered oversubscribed if the ratio of enrolled students at the
beginning of the course to the number of sanctioned seats is greater than or equal to 1.
Using this indicator, one would be able to judge which courses are considered “more
desirable” by students and which are not so popular or outdated. There are many reasons
why students select one course over another. Some of the considerations, such as
19 Note: course duration was reported in months. For simplification purposes by 1 year courses we mean
courses duration of which was up to 12 months, 2 year courses are the courses with duration more than 12
months.
- 13 - 13
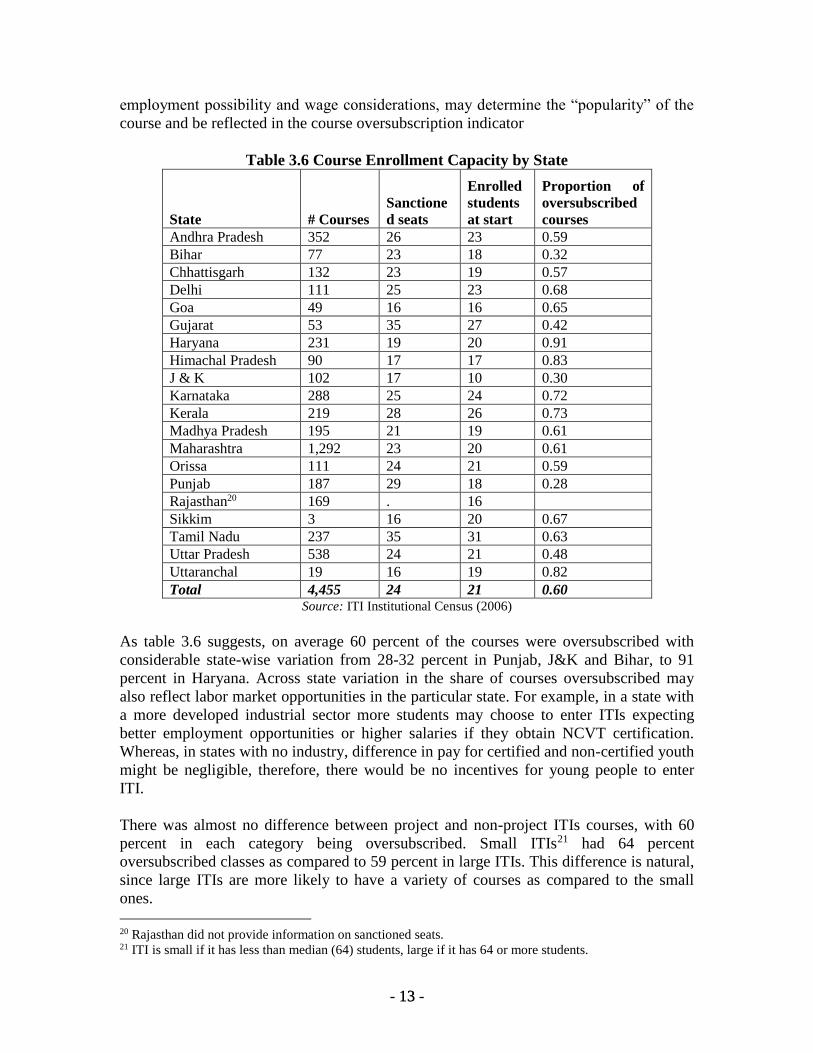
employment possibility and wage considerations, may determine the “popularity” of the
course and be reflected in the course oversubscription indicator
Table 3.6 Course Enrollment Capacity by State
State # Courses
Sanctione
d seats
Enrolled
students
at start
Proportion of
oversubscribed
courses
Andhra Pradesh 352 26 23 0.59
Bihar 77 23 18 0.32
Chhattisgarh 132 23 19 0.57
Delhi 111 25 23 0.68
Goa 49 16 16 0.65
Gujarat 53 35 27 0.42
Haryana 231 19 20 0.91
Himachal Pradesh 90 17 17 0.83
J & K 102 17 10 0.30
Karnataka 288 25 24 0.72
Kerala 219 28 26 0.73
Madhya Pradesh 195 21 19 0.61
Maharashtra 1,292 23 20 0.61
Orissa 111 24 21 0.59
Punjab 187 29 18 0.28
Rajasthan20 169 . 16
Sikkim 3 16 20 0.67
Tamil Nadu 237 35 31 0.63
Uttar Pradesh 538 24 21 0.48
Uttaranchal 19 16 19 0.82
Total 4,455 24 21 0.60 Source: ITI Institutional Census (2006)
As table 3.6 suggests, on average 60 percent of the courses were oversubscribed with
considerable state-wise variation from 28-32 percent in Punjab, J&K and Bihar, to 91
percent in Haryana. Across state variation in the share of courses oversubscribed may
also reflect labor market opportunities in the particular state. For example, in a state with
a more developed industrial sector more students may choose to enter ITIs expecting
better employment opportunities or higher salaries if they obtain NCVT certification.
Whereas, in states with no industry, difference in pay for certified and non-certified youth
might be negligible, therefore, there would be no incentives for young people to enter
ITI.
There was almost no difference between project and non-project ITIs courses, with 60
percent in each category being oversubscribed. Small ITIs21 had 64 percent
oversubscribed classes as compared to 59 percent in large ITIs. This difference is natural,
since large ITIs are more likely to have a variety of courses as compared to the small
ones.
20 Rajasthan did not provide information on sanctioned seats. 21 ITI is small if it has less than median (64) students, large if it has 64 or more students.

- 14 - 14
To investigate the courses’ differences further, we also report on the types of course
offered by trade. ITIs offered 76 different types of trades (see Annex A.1) for the 2003-
2004 entering class. Around a third of the trades were offered by 10 institutions or more;
half of the trades were offered only by 3 or fewer institutions. The most offered22 trades
were fitter, electrician, wireman, electronic mechanic, motor vehicle mechanic, turner,
radio and TV mechanic, machinist, civil and mechanical draughtsman, and refrigeration
and air conditioning mechanic.
Trade offerings reflect only the supply-side perspective. The oversubscription ratio, on
the other hand, shows students’ perspective on the usefulness of the trade. As shown in
Annex 3.1, the following trades had oversubscription ration equal to 1: watch and clock
maker, millwright, cutting and tailoring, plumber, sheet metal worker, and several
mechanic trades. Courses that were most offered – by 100 or more institutions - were 50
to 72 percent oversubscribed.
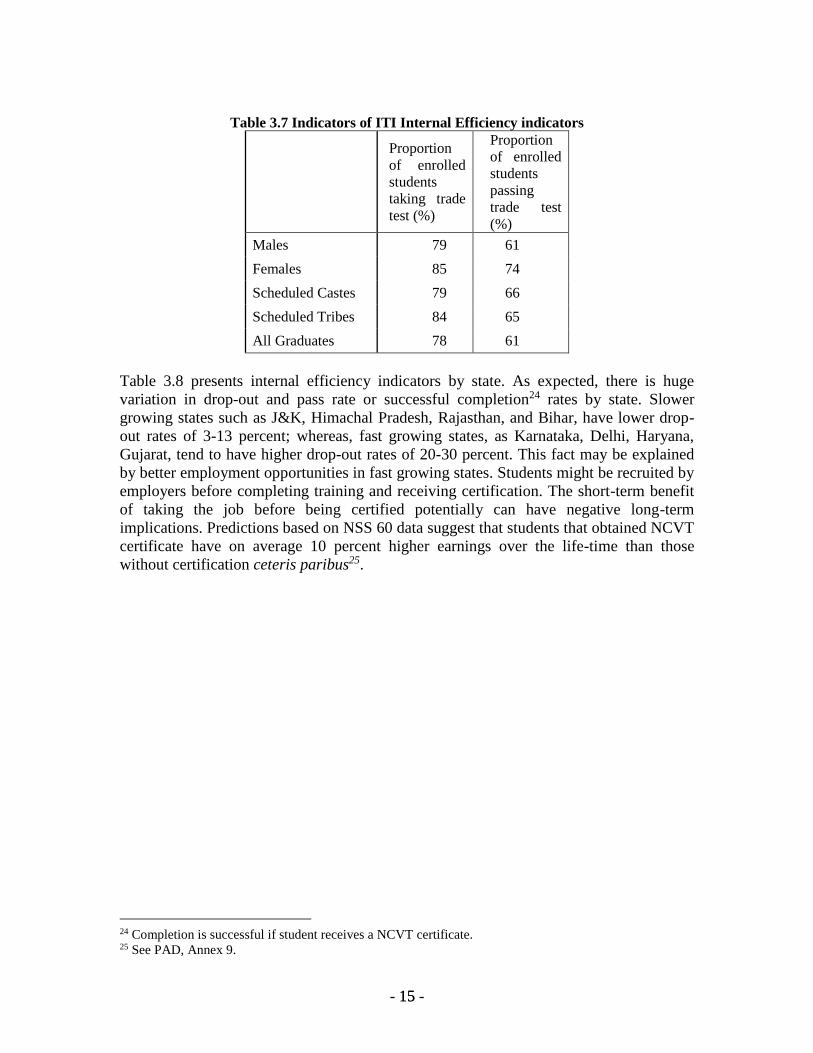
ITI internal efficiency: Table 3.7 presents estimates of the internal efficiency of ITIs by
students’ demographic characteristics. The indicators of internal efficiency are the
proportions of enrolled students that completed the training course and took the trade test,
or that successfully passed and obtained trade certification23. These estimates are for the
student enrolled in the 2003-04 year in two year courses. Subsequent cohorts had not
completed training and trade tests by the time of the survey for these courses. In
TableA.2. in the Annex, we provide state-wise and gender-wise of pass rates for those
taking the test for those who enrolled in either a 1 year or less/2 years or more course in
2003.
On average, 78 percent of the two-year program students took the trade test, but only 61
percent passed it. While females in one-year programs were more successful in both
taking and passing the trade test than their male counterparts, the difference between
them was negligible for the two-year program. A higher share of SC (79%) and ST (84%)
students enrolled and took and passed the test compared to the average (66% for SC and
65% for ST respectively).
22 Trades that were offered by 100 and more institutions. 23 The definition of students that passed the test would require clarification in the next monitoring round. In
the current survey, some trades had proportion of students that passed test more than 100 % (baseline is
number of students that were enrolled in the beginning). Such numbers may mean that principals when
responding do not give information only about the starting cohort, but about all the students received
certification in particular year. All the students that received certificate may include students who re-take
the test. Therefore, in the next monitoring round students from the starting cohort that receive certificate
should be monitored separately from everyone else.
- 15 - 15
Table 3.7 Indicators of ITI Internal Efficiency indicators
Proportion
of enrolled
students
taking trade
test (%)
Proportion
of enrolled
students
passing
trade test
(%)
Males 79 61
Females 85 74
Scheduled Castes 79 66
Scheduled Tribes 84 65
All Graduates 78 61
Table 3.8 presents internal efficiency indicators by state. As expected, there is huge
variation in drop-out and pass rate or successful completion24 rates by state. Slower
growing states such as J&K, Himachal Pradesh, Rajasthan, and Bihar, have lower drop-
out rates of 3-13 percent; whereas, fast growing states, as Karnataka, Delhi, Haryana,
Gujarat, tend to have higher drop-out rates of 20-30 percent. This fact may be explained
by better employment opportunities in fast growing states. Students might be recruited by
employers before completing training and receiving certification. The short-term benefit
of taking the job before being certified potentially can have negative long-term
implications. Predictions based on NSS 60 data suggest that students that obtained NCVT
certificate have on average 10 percent higher earnings over the life-time than those
without certification ceteris paribus25.
24 Completion is successful if student receives a NCVT certificate. 25 See PAD, Annex 9.

- 16 - 16
Table 3.8 Students’ Performance by State
State
proportion of
oversubscribed
classes
# of
enrolled
students
at start
# of
students
that took
test
# of
enrolled
students
that
passed
test
% of
enrolled
students
that took
test
% of
enrolled
students
that
passed
test
Bihar 0.32 17.6 15.5 16.2 86.8 83.6
Sikkim 0.67 19.7 16.3 15.0 84.7 78.3
Orissa 0.59 20.8 17.3 15.5 83.2 77.0
Uttar Pradesh 0.48 21.2 17.1 15.5 79.9 71.1
Goa 0.65 15.8 13.8 11.0 87.2 70.7
Tamil Nadu 0.63 30.6 26.7 21.4 87.2 70.6
Kerala 0.73 26.2 22.2 18.2 84.8 69.1
J & K 0.30 10.3 9.8 7.0 97.9 66.9
Rajasthan 16.3 14.4 10.1 88.3 62.2
Himachal Pradesh 0.83 16.7 15.4 10.1 92.8 61.0
Haryana 0.91 20.3 14.0 11.9 70.0 60.5
Punjab 0.28 17.7 13.6 10.1 78.1 60.1
Karnataka 0.72 23.9 19.5 14.6 80.9 60.0
Uttaranchal 0.82 19.3 12.7 11.4 65.9 59.1
Delhi 0.68 22.7 18.1 12.9 78.1 55.9
Gujarat 0.42 26.8 19.7 15.1 69.4 55.0
Maharashtra 0.61 19.7 13.8 10.7 70.7 54.7
Andhra Pradesh 0.59 22.8 16.7 11.9 70.2 49.2
Madhya Pradesh 0.61 19.0 14.5 9.2 76.2 47.9
Chhattisgarh 0.57 19.3 15.2 8.8 82.3 47.8
Total 0.60 21.0 16.4 12.9 77.8 60.6 Source: ITI Institutional Census (2006)
Successful completion rate varies from 48 percent in Chhattisgarh and Madhya Pradesh
to 77-84 percent in Orissa, Sikkim, and Bihar. It is also noteworthy that fast-growing
states, such as Gujarat, Delhi, Karnataka, and Haryana, do not have very high success
rates, ranging between 55-61 percent.
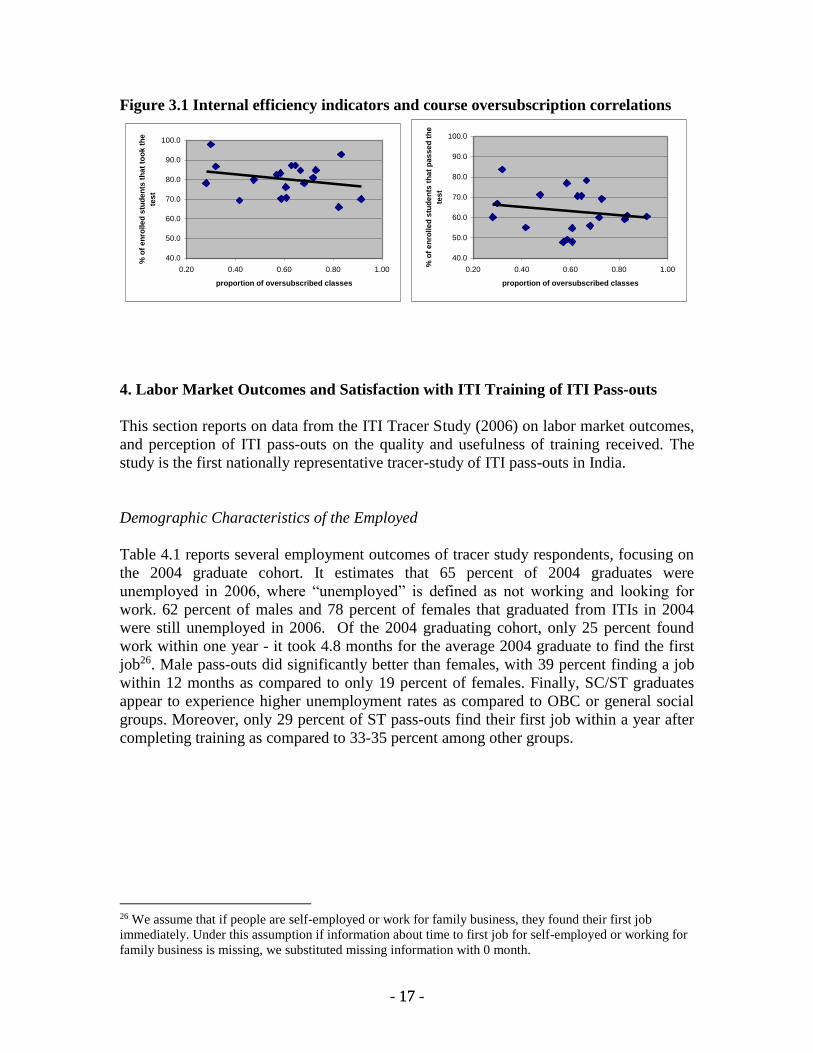
The proportion of students who took the test is negatively and significantly correlated
with share of oversubscribed courses (see Figure 3.1). In other words the higher
oversubscription rate is the more students drop out. This could be due to congestion and
reduction in training quality and/or more opportunity for students in these ‘popular’
courses. Even though proportion of oversubscribed classes is negatively correlated with
percent of students that received certification, this relationship is not significant
suggesting that other things might come into play, for example quality of teachers,
students abilities etc.
- 17 - 17
Figure 3.1 Internal efficiency indicators and course oversubscription correlations
40.0
50.0
60.0
70.0
80.0
90.0
100.0
0.20 0.40 0.60 0.80 1.00
proportion of oversubscribed classes
% o
f e
nro
lle
d s
tud
en
ts t
ha
t to
ok
th
e
tes
t
40.0
50.0
60.0
70.0
80.0
90.0
100.0
0.20 0.40 0.60 0.80 1.00
proportion of oversubscribed classes
% o
f e
nro
lle
d s
tud
en
ts t
ha
t p
as
se
d t
he
tes
t
4. Labor Market Outcomes and Satisfaction with ITI Training of ITI Pass-outs
This section reports on data from the ITI Tracer Study (2006) on labor market outcomes,
and perception of ITI pass-outs on the quality and usefulness of training received. The
study is the first nationally representative tracer-study of ITI pass-outs in India.
Demographic Characteristics of the Employed
Table 4.1 reports several employment outcomes of tracer study respondents, focusing on
the 2004 graduate cohort. It estimates that 65 percent of 2004 graduates were
unemployed in 2006, where “unemployed” is defined as not working and looking for
work. 62 percent of males and 78 percent of females that graduated from ITIs in 2004
were still unemployed in 2006. Of the 2004 graduating cohort, only 25 percent found
work within one year - it took 4.8 months for the average 2004 graduate to find the first
job26. Male pass-outs did significantly better than females, with 39 percent finding a job
within 12 months as compared to only 19 percent of females. Finally, SC/ST graduates
appear to experience higher unemployment rates as compared to OBC or general social
groups. Moreover, only 29 percent of ST pass-outs find their first job within a year after
completing training as compared to 33-35 percent among other groups.
26 We assume that if people are self-employed or work for family business, they found their first job
immediately. Under this assumption if information about time to first job for self-employed or working for
family business is missing, we substituted missing information with 0 month.

- 18 - 18
Table 4.1 Distribution of Time to First Job for All Graduates
Year of
graduation
Proportion
unemployed at
time of survey
Proportion (%) of graduating cohort finding
first job within: Average
months
to first
job 6 months 12 months 18 months
All Graduates
2004 65 25 34 34 4.8
2005 74 21 26 27 4.0
Males
2004 62 29 39 40 5.0
2005 72 24 30 31 4.1
Females
2004 78 16 19 19 3.5
2005 84 13 14 14 2.8
Scheduled Caste
2004 66 26 35 36 5.1
2005 76 21 25 26 3.9
Scheduled Tribe
2004 71 22 29 30 4.8
2005 83 15 20 21 4.6
Other Backward Classes
2004 65 25 33 34 4.9
2005 73 23 28 28 3.9
General
2004 63 26 35 35 4.6
2005 74 21 26 26 3.9
Source: ITI Tracer Study (2006)
Continuing education, training and apprenticeship
Nearly 40% of pass-outs, of both years 2004 and 2005, went for further training or
education after passing out of ITIs. Of these nearly half pursued an apprenticeship
and another quarter pursued some form of further education. Of the remaining most
pursued some form of training and a small share enrolled in polytechnics. The pattern
was similar across the pass-outs of both years, and is shown in Table 4.2 below.
Table 4.2: Further Education of ITI Pass-outs
Percentage Shares (%)
Further Education 2004 2005 Total
Polytechnic 0.85 1.49 1.17
Apprenticeship 20.15 20.28 20.21
Other Education 12.18 11.27 11.73
Other Training 5.58 4.36 4.98
None 61.23 62.6 61.9
Source: ITI Tracer Study (2006)
- 19 - 19
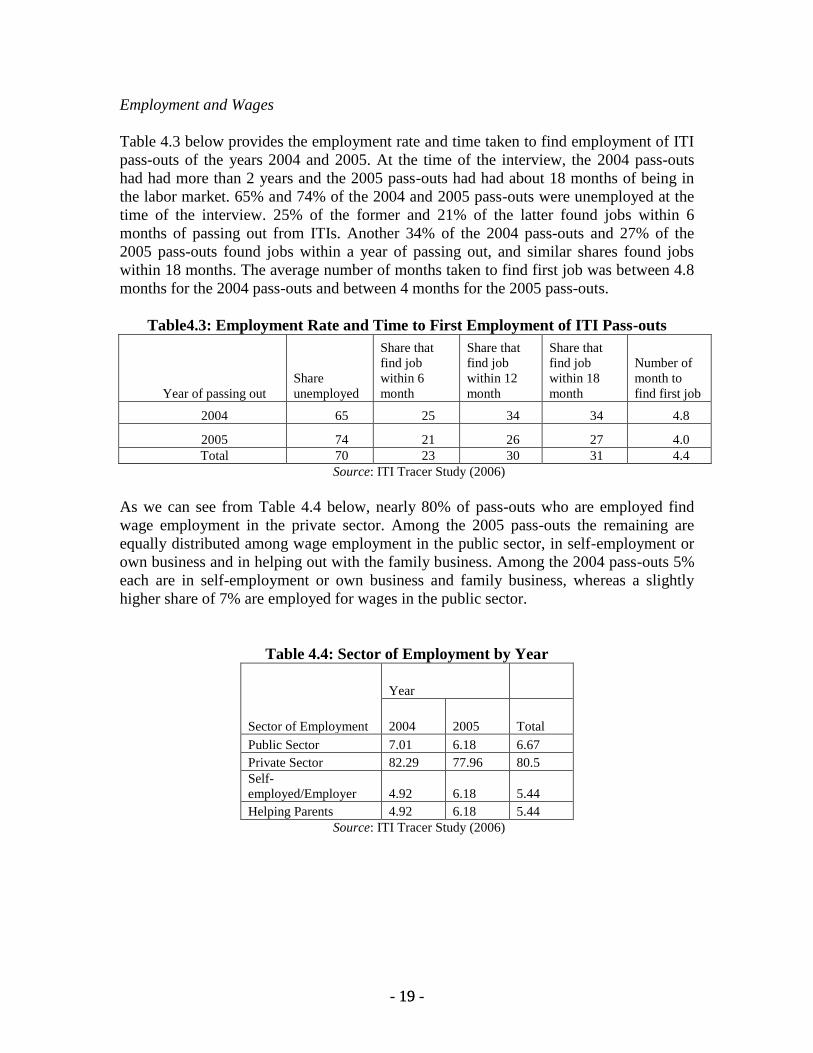
Employment and Wages
Table 4.3 below provides the employment rate and time taken to find employment of ITI
pass-outs of the years 2004 and 2005. At the time of the interview, the 2004 pass-outs
had had more than 2 years and the 2005 pass-outs had had about 18 months of being in
the labor market. 65% and 74% of the 2004 and 2005 pass-outs were unemployed at the
time of the interview. 25% of the former and 21% of the latter found jobs within 6
months of passing out from ITIs. Another 34% of the 2004 pass-outs and 27% of the
2005 pass-outs found jobs within a year of passing out, and similar shares found jobs
within 18 months. The average number of months taken to find first job was between 4.8
months for the 2004 pass-outs and between 4 months for the 2005 pass-outs.
Table4.3: Employment Rate and Time to First Employment of ITI Pass-outs
Year of passing out
Share
unemployed
Share that
find job
within 6
month
Share that
find job
within 12
month
Share that
find job
within 18
month
Number of
month to
find first job
2004 65 25 34 34 4.8
2005 74 21 26 27 4.0
Total 70 23 30 31 4.4
Source: ITI Tracer Study (2006)
As we can see from Table 4.4 below, nearly 80% of pass-outs who are employed find
wage employment in the private sector. Among the 2005 pass-outs the remaining are
equally distributed among wage employment in the public sector, in self-employment or
own business and in helping out with the family business. Among the 2004 pass-outs 5%
each are in self-employment or own business and family business, whereas a slightly
higher share of 7% are employed for wages in the public sector.
Table 4.4: Sector of Employment by Year
Sector of Employment
Year
2004 2005 Total
Public Sector 7.01 6.18 6.67
Private Sector 82.29 77.96 80.5
Self-
employed/Employer 4.92 6.18 5.44
Helping Parents 4.92 6.18 5.44
Source: ITI Tracer Study (2006)
- 20 - 20
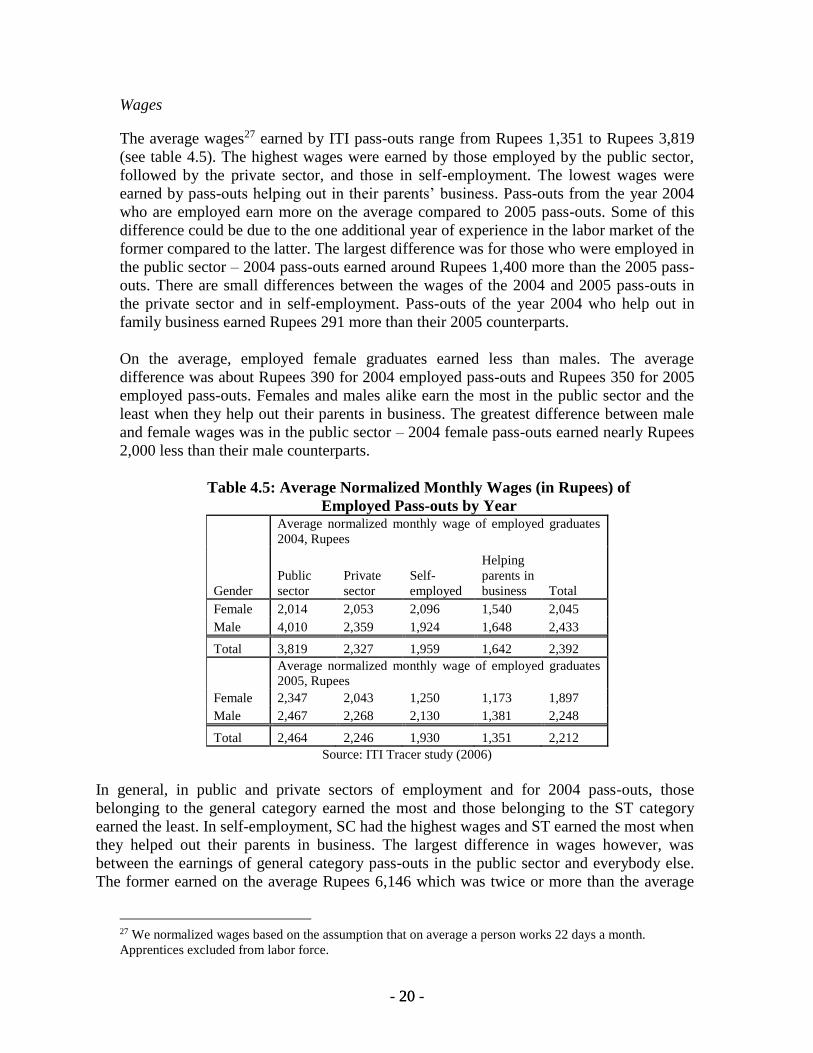
Wages
The average wages27 earned by ITI pass-outs range from Rupees 1,351 to Rupees 3,819
(see table 4.5). The highest wages were earned by those employed by the public sector,
followed by the private sector, and those in self-employment. The lowest wages were
earned by pass-outs helping out in their parents’ business. Pass-outs from the year 2004
who are employed earn more on the average compared to 2005 pass-outs. Some of this
difference could be due to the one additional year of experience in the labor market of the
former compared to the latter. The largest difference was for those who were employed in
the public sector – 2004 pass-outs earned around Rupees 1,400 more than the 2005 pass-
outs. There are small differences between the wages of the 2004 and 2005 pass-outs in
the private sector and in self-employment. Pass-outs of the year 2004 who help out in
family business earned Rupees 291 more than their 2005 counterparts.
On the average, employed female graduates earned less than males. The average
difference was about Rupees 390 for 2004 employed pass-outs and Rupees 350 for 2005
employed pass-outs. Females and males alike earn the most in the public sector and the
least when they help out their parents in business. The greatest difference between male
and female wages was in the public sector – 2004 female pass-outs earned nearly Rupees
2,000 less than their male counterparts.
Table 4.5: Average Normalized Monthly Wages (in Rupees) of
Employed Pass-outs by Year
Average normalized monthly wage of employed graduates
2004, Rupees
Gender
Public
sector
Private
sector
Self-
employed
Helping
parents in
business Total
Female 2,014 2,053 2,096 1,540 2,045
Male 4,010 2,359 1,924 1,648 2,433
Total 3,819 2,327 1,959 1,642 2,392
Average normalized monthly wage of employed graduates
2005, Rupees
Female 2,347 2,043 1,250 1,173 1,897
Male 2,467 2,268 2,130 1,381 2,248
Total 2,464 2,246 1,930 1,351 2,212
Source: ITI Tracer study (2006)
In general, in public and private sectors of employment and for 2004 pass-outs, those
belonging to the general category earned the most and those belonging to the ST category
earned the least. In self-employment, SC had the highest wages and ST earned the most when
they helped out their parents in business. The largest difference in wages however, was
between the earnings of general category pass-outs in the public sector and everybody else.
The former earned on the average Rupees 6,146 which was twice or more than the average
27 We normalized wages based on the assumption that on average a person works 22 days a month.
Apprentices excluded from labor force.

- 21 - 21
wages earned by the other social groups in public employment. The results for wages of the
employed 2005 pass-outs are more mixed. General category students earned the most in all
sectors of employment except when they helped out in family business. The differences
between the wages of SC, ST and OBC, presented in table 4.6, in all sectors of employment
were small, with the exception of public sector employment where the average earnings of
the SC is only Rupees 815 compared to the overall average of Rupees 2,464, and the average
wages are the highest for ST pass-outs, being nearly Rupees 350 more than the overall
average.
Table 4.6: Average Normalized Monthly Wages (in Rupees) of
Employed Pass-outs by Year, by Social Group
Social
Group
Average normalized monthly wage of employed graduates
2004, Rupees
Average normalized monthly wage of employed graduates
2005, Rupees
Public
sector
Private
sector
Self-
employed
Helping
parents in
business Total
Public
sector
Private
sector
Self-
employed
Helping
parents in
business Total
SC 2,595 2,358 2,045 2,142 2,355 815 2,201 1,149 1,499 2,112
ST 2,603 1,905 917 3,960 1,996 2,851 2,105 1,467 1,376 2,181
OBC 2,858 2,214 1,984 1,862 2,244 2,023 2,083 1,590 1,298 2,031
General 6,146 2,497 2,012 1,317 2,629 2,827 2,500 2,395 1,320 2,482
Total 3,819 2,327 1,959 1,642 2,392 2,464 2,243 1,930 1,351 2,210
Table 4.7 below shows the average wages earned by employed 2004 and 2005 pass-outs
by sector of work and household socio-economic status. Among the 2004 pass-outs, those
belonging to Above Poverty Line (APL) households earned the most when employed in
the public sector, the private sector and among the self-employed. In these three sectors,
across the economic classes Below Poverty Line (BPL) earned the least. In the category
of those who helped in the family business, the BPL pass-outs earned the most. They also
earned the highest wages among all BPL employed in various sectors, including more
than Antyodaya Anna Yojana (AAY) in private sector and self-employment. Among the
2005 pass-outs too, those belonging to APL households earned the most in all the sectors
except for self-employment where the highest wages were earned by AAY household
pass-outs.
Table 4.7: Average Normalized Monthly Wages (in Rupees) of
Employed Pass-outs by Year, by Socio-economic Status
Socio-
economic
status
Average normalized monthly wage of employed graduates
2004, Rupees
Average normalized monthly wage of employed graduates
2005, Rupees
Public
sector
Private
sector
Self-
employed
Helping
parents in
business Total
Public
sector
Private
sector
Self-
employed
Helping
parents in
business Total
BPL 1,931 1,982 1,019 2,400 1,975 2,073 2,015 1,143 998 1,977
AAY 3,199 2,169 1,247 1,570 2,185 1,656 2,429 3,667 1,012 2,365
APL 4,238 2,488 2,080 1,474 2,568 2,830 2,308 1,964 1,432 2,278
Total 3,831 2,329 1,959 1,642 2,393 2,464 2,245 1,930 1,351 2,212
Source: ITI Tracer Study (2006)
- 22 - 22
State-wise Labor Market Outcomes
There is a great deal of variation in the labor market outcomes of pass-outs from ITIs on
all our indicators of external efficiency.
Percentage of pass-outs finding employment within 12 months of graduation
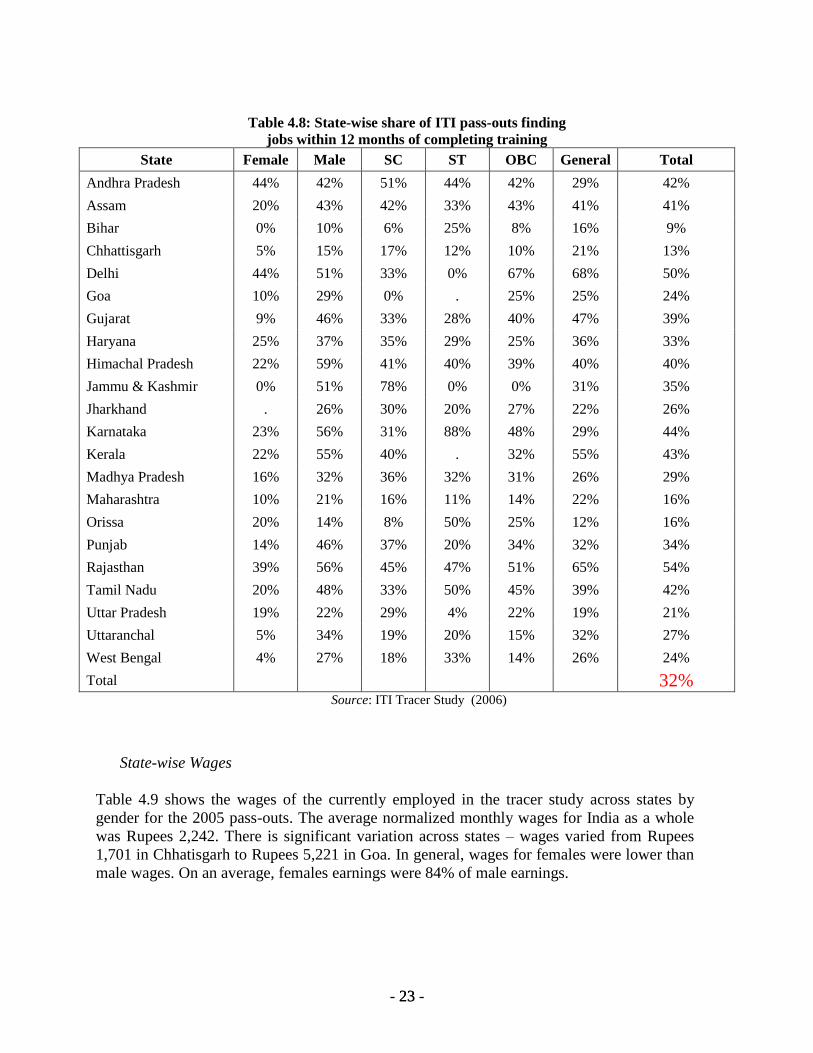
The share of pass-outs that find employment within 12 months of graduation ranged from
9% in Bihar to 54% in Rajasthan. The employment likelihood of ITI pass-outs seemed to
be particular poor in Bihar, Chattisgarh, Orissa and Uttar Pradesh as less than 20% of ITI
pass-outs were employed within a year. The better performing states were Delhi,
Himachal Pradesh, Karnataka, Kerala, Gujarat, Rajasthan and Tamil Nadu where 40% or
more of the ITI pass-outs were employed within 12 months. Table 4.8 sets out the
employment outcomes of ITI pass-outs by state, gender and social group.
The labor market outcomes for female pass-outs were on the average worse compared to
their male counterparts – in only 2 states – Andhra Pradesh and Orissa, was the share of
female pass-outs finding jobs within the year above males. In Bihar and Chattisgarh, the
shares were abysmally low being less than 1% and 5% respectively. In most of the other
states, the shares varied from a fifth to three quarters female- compared to male-pass-outs
find jobs within 12 months. There is a lot of variation in the employment rate by social
group across states. No clear pattern emerges with SC/ST/OBC doing better than the
general caste in some states and worse in others.
- 23 - 23
Table 4.8: State-wise share of ITI pass-outs finding
jobs within 12 months of completing training
State Female Male SC ST OBC General Total
Andhra Pradesh 44% 42% 51% 44% 42% 29% 42%
Assam 20% 43% 42% 33% 43% 41% 41%
Bihar 0% 10% 6% 25% 8% 16% 9%
Chhattisgarh 5% 15% 17% 12% 10% 21% 13%
Delhi 44% 51% 33% 0% 67% 68% 50%
Goa 10% 29% 0% . 25% 25% 24%
Gujarat 9% 46% 33% 28% 40% 47% 39%
Haryana 25% 37% 35% 29% 25% 36% 33%
Himachal Pradesh 22% 59% 41% 40% 39% 40% 40%
Jammu & Kashmir 0% 51% 78% 0% 0% 31% 35%
Jharkhand . 26% 30% 20% 27% 22% 26%
Karnataka 23% 56% 31% 88% 48% 29% 44%
Kerala 22% 55% 40% . 32% 55% 43%
Madhya Pradesh 16% 32% 36% 32% 31% 26% 29%
Maharashtra 10% 21% 16% 11% 14% 22% 16%
Orissa 20% 14% 8% 50% 25% 12% 16%
Punjab 14% 46% 37% 20% 34% 32% 34%
Rajasthan 39% 56% 45% 47% 51% 65% 54%
Tamil Nadu 20% 48% 33% 50% 45% 39% 42%
Uttar Pradesh 19% 22% 29% 4% 22% 19% 21%
Uttaranchal 5% 34% 19% 20% 15% 32% 27%
West Bengal 4% 27% 18% 33% 14% 26% 24%
Total 32%
Source: ITI Tracer Study (2006)
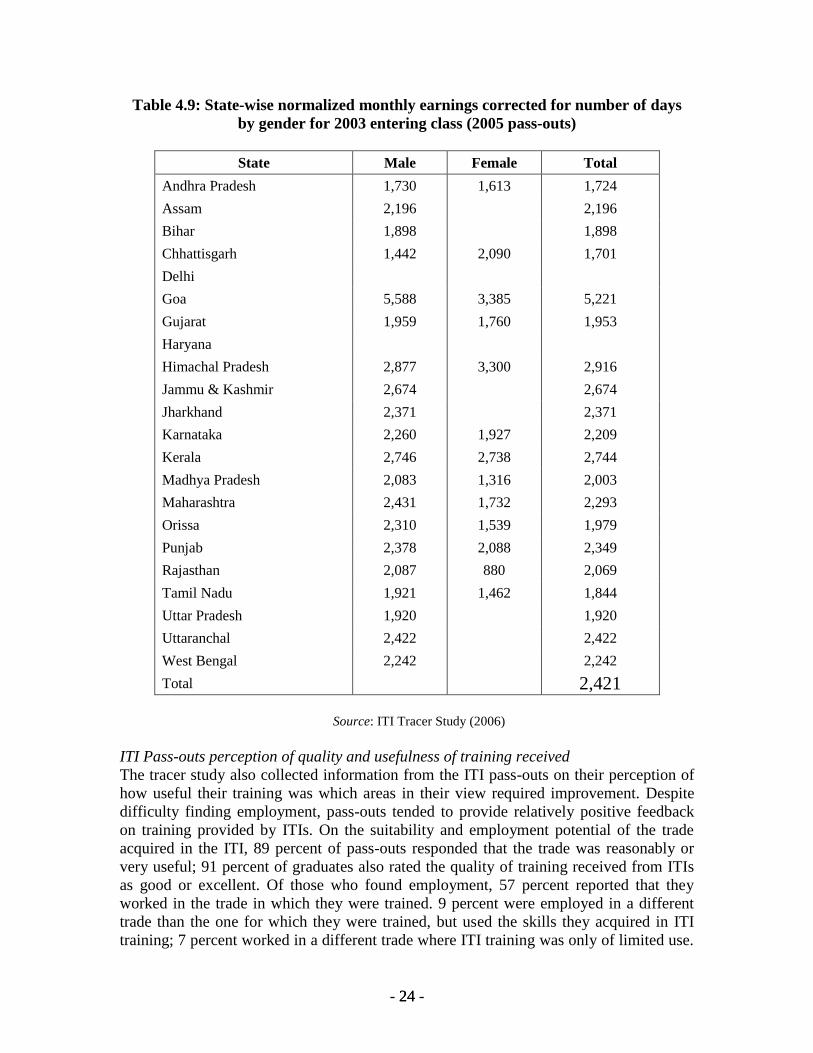
State-wise Wages
Table 4.9 shows the wages of the currently employed in the tracer study across states by
gender for the 2005 pass-outs. The average normalized monthly wages for India as a whole
was Rupees 2,242. There is significant variation across states – wages varied from Rupees
1,701 in Chhatisgarh to Rupees 5,221 in Goa. In general, wages for females were lower than
male wages. On an average, females earnings were 84% of male earnings.
- 24 - 24
Table 4.9: State-wise normalized monthly earnings corrected for number of days
by gender for 2003 entering class (2005 pass-outs)
State Male Female Total
Andhra Pradesh 1,730 1,613 1,724
Assam 2,196 2,196
Bihar 1,898 1,898
Chhattisgarh 1,442 2,090 1,701
Delhi
Goa 5,588 3,385 5,221
Gujarat 1,959 1,760 1,953
Haryana
Himachal Pradesh 2,877 3,300 2,916
Jammu & Kashmir 2,674 2,674
Jharkhand 2,371 2,371
Karnataka 2,260 1,927 2,209
Kerala 2,746 2,738 2,744
Madhya Pradesh 2,083 1,316 2,003
Maharashtra 2,431 1,732 2,293
Orissa 2,310 1,539 1,979
Punjab 2,378 2,088 2,349
Rajasthan 2,087 880 2,069
Tamil Nadu 1,921 1,462 1,844
Uttar Pradesh 1,920 1,920
Uttaranchal 2,422 2,422
West Bengal 2,242 2,242
Total 2,421
Source: ITI Tracer Study (2006)
ITI Pass-outs perception of quality and usefulness of training received
The tracer study also collected information from the ITI pass-outs on their perception of
how useful their training was which areas in their view required improvement. Despite
difficulty finding employment, pass-outs tended to provide relatively positive feedback
on training provided by ITIs. On the suitability and employment potential of the trade
acquired in the ITI, 89 percent of pass-outs responded that the trade was reasonably or
very useful; 91 percent of graduates also rated the quality of training received from ITIs
as good or excellent. Of those who found employment, 57 percent reported that they
worked in the trade in which they were trained. 9 percent were employed in a different
trade than the one for which they were trained, but used the skills they acquired in ITI
training; 7 percent worked in a different trade where ITI training was only of limited use.
- 25 - 25
The remaining 27 percent reported that ITI training did not help at all in the work they
were doing. In the sub-section below, we provide a more detailed description of ITI pass-
outs perception of quality and usefulness of training received.
Worked in the trade for which training acquired: As has already been documented above,
only 32.5% of ITI pass-outs had any experience of employment. Of this category, 56%
worked in the trade in which they had acquired training; 9.3% worked in a trade or area
where their training was useful to them; another 6.7% found some use of their training in
a related trade and the remaining 2.7% did not find any use for their trade.
These responses were similarly distributed across male and female ever employed pass-
outs. Across the different social groups, the share of ever employed SC and ST who
worked in a trade they were trained in was lower than the average of the entire sample –
51% and 48% respectively, and a higher share of the two groups - nearly 34%, reported
not finding any use for their training. A higher than the average share of OBC pass-outs –
63% - on the other hand reported finding employment in the trade they had trained for.
53% of the ever employed pass-outs belonging to BPL households compared to 58% of
those belonging to APL households reported working in the trade they were trained in.
Suitability and employment potential of trade acquired in ITI: Nearly 90% of all pass-
outs whether ever employed or never worked, said that they thought that the suitability
and employment potential of the trade they had acquired training in was very or
reasonably useful. 9.5% did not find their training very useful, and only a little more than
1% did not find the training useful at all. These responses were nearly similar across
genders, social groups and different economic classes.
Quality of Training: Similarly, nearly 90% of the pass-outs found the quality of training
received in ITIs of very good or good quality. A little more than 8% did not think the
training was of very good quality and only 1% said that the training quality was bad.
Areas in which training in ITIs can be improved: In each aspect of training, at least 50%
of all pass-outs wanted to see a lot or some improvement. The three areas which were
identified by nearly 80% of all pass-outs as requiring a lot or some improvement were:
(a) better information on employment opportunities, (b) meeting with employers, and (c)
training experience in industry. A higher share of females compared to males responded
this way, and a lower share of ST pass-outs compared to other social groups responded
this way. Again a higher share than average of pass-outs belonging to APL households
considered these factors of the utmost importance. A lower than average share of pass-
outs from BPL and AAY households responded this way. Nearly 60-75% of all pass-outs
and sub-groups thought that training in use of computers, use of machinery, equipment
maintenance, and the use of tools required a lot or some improvement. Between 50-60%
of ITI pass-outs wanted to see a lot or at least some improvement in communication and
team-work skills. The areas that were considered least problematic by pass-outs were
relevance of curriculum, use of drawings and use of written instruction.
- 26 - 26
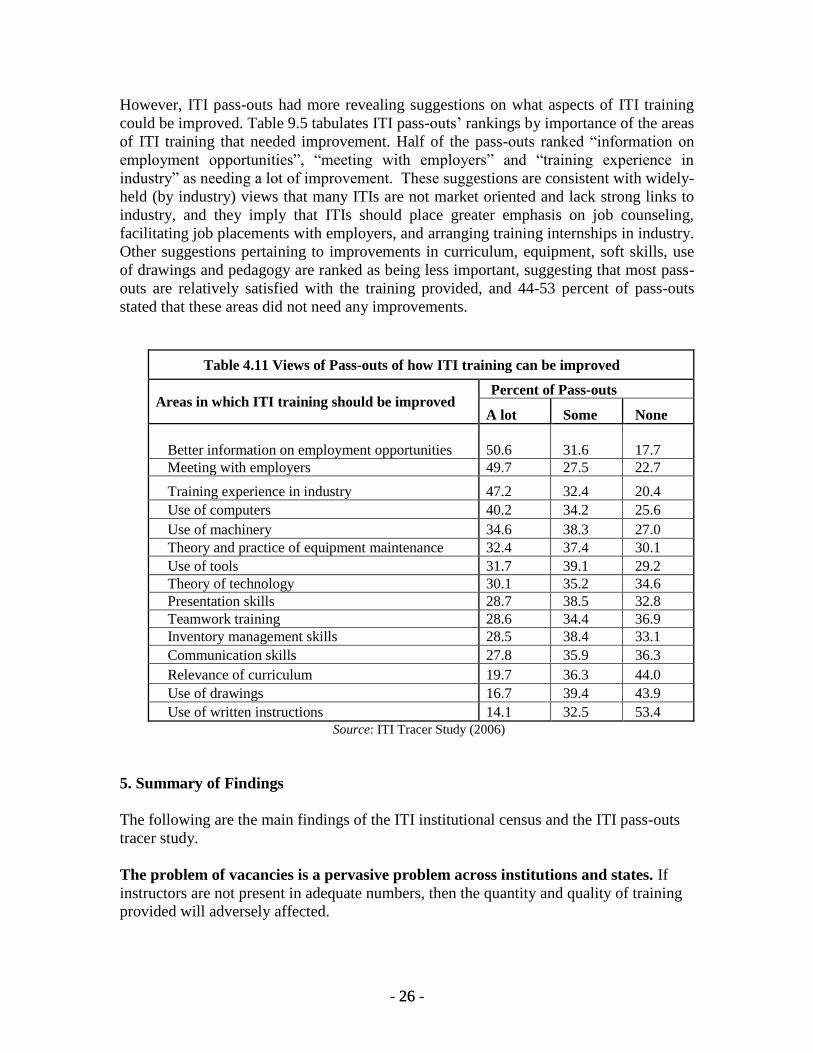
However, ITI pass-outs had more revealing suggestions on what aspects of ITI training
could be improved. Table 9.5 tabulates ITI pass-outs’ rankings by importance of the areas
of ITI training that needed improvement. Half of the pass-outs ranked “information on
employment opportunities”, “meeting with employers” and “training experience in
industry” as needing a lot of improvement. These suggestions are consistent with widely-
held (by industry) views that many ITIs are not market oriented and lack strong links to
industry, and they imply that ITIs should place greater emphasis on job counseling,
facilitating job placements with employers, and arranging training internships in industry.
Other suggestions pertaining to improvements in curriculum, equipment, soft skills, use
of drawings and pedagogy are ranked as being less important, suggesting that most pass-
outs are relatively satisfied with the training provided, and 44-53 percent of pass-outs
stated that these areas did not need any improvements.
Table 4.11 Views of Pass-outs of how ITI training can be improved
Areas in which ITI training should be improved Percent of Pass-outs
A lot Some None
Better information on employment opportunities 50.6 31.6 17.7
Meeting with employers 49.7 27.5 22.7
Training experience in industry 47.2 32.4 20.4
Use of computers 40.2 34.2 25.6
Use of machinery 34.6 38.3 27.0
Theory and practice of equipment maintenance 32.4 37.4 30.1
Use of tools 31.7 39.1 29.2
Theory of technology 30.1 35.2 34.6
Presentation skills 28.7 38.5 32.8
Teamwork training 28.6 34.4 36.9
Inventory management skills 28.5 38.4 33.1
Communication skills 27.8 35.9 36.3
Relevance of curriculum 19.7 36.3 44.0
Use of drawings 16.7 39.4 43.9
Use of written instructions 14.1 32.5 53.4
Source: ITI Tracer Study (2006)
5. Summary of Findings
The following are the main findings of the ITI institutional census and the ITI pass-outs
tracer study.
The problem of vacancies is a pervasive problem across institutions and states. If
instructors are not present in adequate numbers, then the quantity and quality of training
provided will adversely affected.

- 27 - 27
Training of trainers is infrequent and few trainers go for further in-service training. Training of instructors for up-gradation of their skills to keep up with changing industry
production technologies happens little and with very low frequency. More than three-
quarters of instructors in the sector had not gone for any training in the last three years.
For the sector to move along with industry, it is critical that the trainers themselves have
the necessary new skills.
Course offerings need to be rationalized. Many institutions offer courses that have no
or very low demand. Also, there is greater drop-out from oversubscribed courses, at least
to some extent due to course-congestion. There is the need to rationalize course-offerings
so that the more popular courses allow more people to join them, and outdated courses
which have few takers are dropped from the curricula. Regularly updating the curricula is
a critical aspect of a flexible vocational training sector.
Internal and external efficiency in the sector is weak. In many states, the share of
those enrolled who take and pass the test is low. External efficiency of the sector is quite
poor. A very small percentage of students who pass-out of ITIs find employment. Many
of them do not even work in areas for which they trained. To some extent employment is
determined by opportunities, but it is also determined by the quality of skills that a labor
market entrant has. If these skills are not demanded or perceived as being of poor quality,
demand for them will be low. The average time a student takes to find a job is also high.
This could be alleviated to some extent if mechanisms exist to connect students to
potential employers and jobs such as job fairs and information kiosks for both students
and employers.
The scope of training needs to be extended to include some general skills. The
students’ own perceptions of the adequacy of training shows that they would like to
receive skills in areas of communication, presentation, management and
entrepreneurship.
Institutional reforms are critical for the sector to become a value-giving training option
for youth to prepare for the labor market. The sector as it currently exists is not pro-
industry. Rigid and outdated curricula makes it a low-return, high cost sector for the
government and an option of last resort for students. The participation of the private
industrial sector in identifying needed skills and curricula content will be necessary for
the sector to become viable and valuable.
References:
DGE&T (2003). Tracer Study of Trained Apprentices to Assess the Effectiveness of
Apprenticeship Training Scheme. Directorate General of Employment and Training,
Ministry of Labor and Employment, India.
DGE&T (2005). Externally Aided Project for Reforms and Improvement in Vocational
Training Services rendered by Central and State Governments. Proposal of the
- 28 - 28
Directorate General of Employment and Training, Ministry of Labor and Employment,
India.
FICCI (2002). Survey of Employers on Education and Skill Needs. Survey Conducted by
the Federation of Indian Chamber of Commerce and Industry.
ILO( 2003). Industriual Training Institutes in India: The Efficiency Study Report. ILO
Subregional Office for South Asia, New Delhi
World Bank (2006) Skill Development in India-The Vocational Education and Training
System.

- 29 - 29
Annex
Table A. 1. Number of courses offered by ITIs for 2003 entering class
Course #
courses
%
courses
Proportion
over
subscribed
courses
Course # % Proportion
over
subscribed
courses
Fitter 703 15.76 0.69 Mechanic Medical
Electronics
4 0.09 0.33
Electrician 683 15.31 0.70 Cutting and
Tailoring
3 0.07 1.00
Wireman 389 8.72 0.67 Electrician (Mines) 3 0.07 0.00
Electronics Mechanic 376 8.43 0.61 Laboratory Assistant
(Chemical Plant)
3 0.06 0.00
Mechanic (Motor
Vehicle)
349 7.82 0.59 Material Handling
Equipment Mechanic
3 0.07 0.33
Turner 321 7.2 0.57 Plumber 3 0.07 1.00
Mechanic Radio and
Television
268 6.01 0.48 Footwear Maker 2 0.04 0.50
Machinist 217 4.86 0.54 Mechanic
Maintenance
(Chemical Plant)
2 0.04 0.50
Draughtsman (Civil) 200 4.48 0.51 Mechanic-cum-
Operator Electronic
Communications
2 0.04 0.00
Mechanic
(Refrigeration and
Air Conditioning)
189 4.24 0.57 Secretarial Practice 2 0.04 0.00
Draughtsman
(Mechanical)
123 2.76 0.47 Sheet Metal Worker 2 0.04 1.00
Painter (General) 80 1.79 0.36 Wireless Mechanic
cum Operator
2 0.04 0.50
Information
Technology &
Electronics Science
70 1.57 0.55 Computer Aided
Embroidery and
Needle w
1 0.02 0.00
Instrument Mechanic 67 1.5 0.48 Corporate House
Keeping
1 0.02 1.00
Mechanic (General
Electronics)
64 1.43 0.64 Dress Maker 1 0.02 0.00
Surveyor 64 1.43 0.47 Dress Making 1 0.02 0.00
Machinist (Grinder) 50 1.12 0.50 Farm Mechanic 1 0.02 0.00
Tool & Die Maker 39 0.87 0.69 Knitting With
Machine
1 0.02
Fashion Technology 18 0.4 0.19 Fruit and Vegetable
Processor
1 0.02 1.00
Electroplater 14 0.31 0.69 Mechanic (Earth
Moving Machinery)
1 0.02 1.00
Mechanic Machine 14 0.31 0.31 Mechanic 1 0.02

- 30 - 30
Tool Maintenance (Instrument Aircraft)
Instrument Mechanic
(Chemical Plant)
12 0.27 0.72 Mechanic (Marine
Diesel)
1 0.02 1.00
Mechanic
Agricultural
Machinery
12 0.27 0.27 Mechanic (Tractor) 1 0.02 1.00
Watch and Clock
Maker
10 0.22 1.00 Mechanic Auto
Electrical &
Electronics
1 0.02 1.00
Other 10 0.22 0.67 Mechanic
Communication
Equipment
Maintenance
1 0.02 1.00
Mechanic Radio &
Radar Aircraft
7 0.16 0.43 Mechanic Consumer
Electronics
1 0.02
Millwright
Maintenance
Mechanic
6 0.13 0.50 Mechanic
Mechatronics
1 0.02 0.00
Tire Repairer 6 0.13 0.17 Mill Hand 1 0.02 0.00
Welder 6 0.13 0.50 Mono Castor
Operator
1 0.02 1.00
Attendant Operator
(Chemical Plant)
5 0.11 0.40 Pump Mechanic 1 0.02 1.00
Mechanic (Diesel) 5 0.11 0.80 Pump Operator-
Cum-Mechanic
1 0.02 0.00
Mechanic Computer
Hardware
5 0.11 0.40 Rubber Technician 1 0.02 0.00
Mechanic
Maintenance (Textile
Machinery)
5 0.11 0.80 Stenography
Regional Language
1 0.02 0.00
Millwright (Rolling
Mills)
5 0.11 1.00 Tractor Mechanic 1 0.02 1.00
Pattern Maker 5 0.11 0.60 Weaving 1 0.02 1.00
Carpenter 4 0.09 0.50 Automobile
Engineering
1 0.02
Mechanic Advanced
Machine Tool
Maintenance
4 0.09 0.50 ET 1 0.02 1.00
Source: ITI Institutional Census (2006)
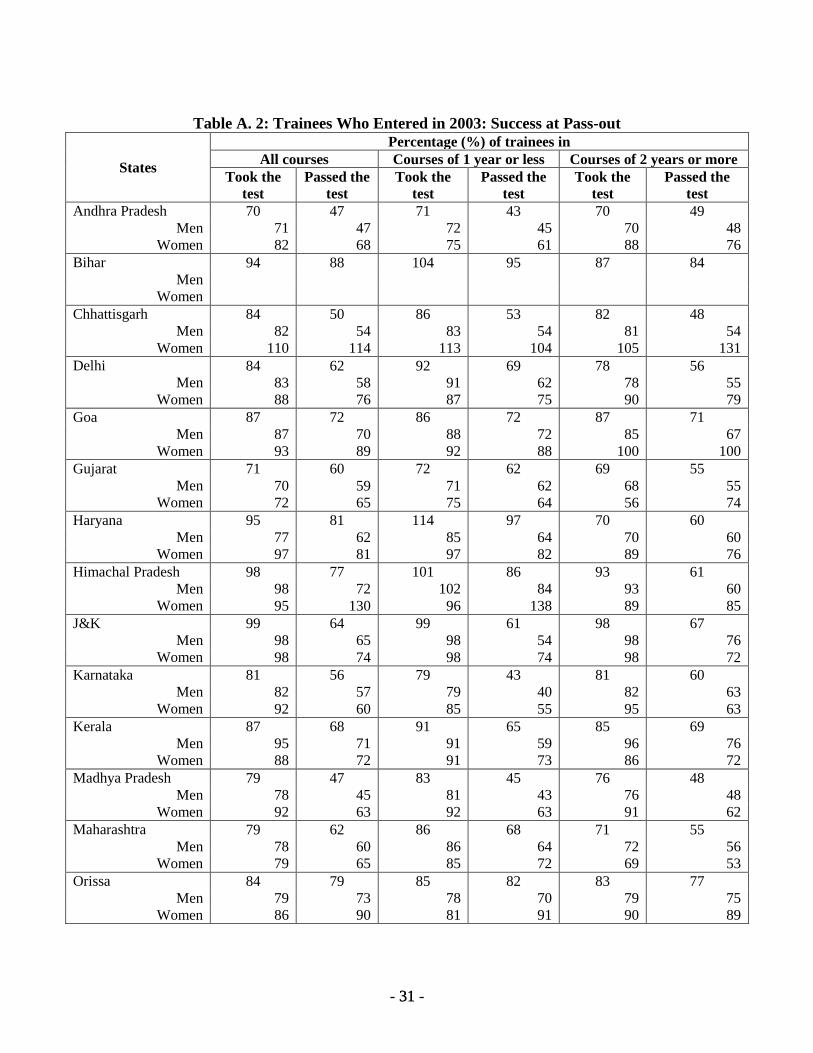
- 31 - 31
Table A. 2: Trainees Who Entered in 2003: Success at Pass-out
States
Percentage (%) of trainees in
All courses Courses of 1 year or less Courses of 2 years or more
Took the
test
Passed the
test
Took the
test
Passed the
test
Took the
test
Passed the
test
Andhra Pradesh 70 47 71 43 70 49
Men 71 47 72 45 70 48
Women 82 68 75 61 88 76
Bihar 94 88 104 95 87 84
Men
Women
Chhattisgarh 84 50 86 53 82 48
Men 82 54 83 54 81 54
Women 110 114 113 104 105 131
Delhi 84 62 92 69 78 56
Men 83 58 91 62 78 55
Women 88 76 87 75 90 79
Goa 87 72 86 72 87 71
Men 87 70 88 72 85 67
Women 93 89 92 88 100 100
Gujarat 71 60 72 62 69 55
Men 70 59 71 62 68 55
Women 72 65 75 64 56 74
Haryana 95 81 114 97 70 60
Men 77 62 85 64 70 60
Women 97 81 97 82 89 76
Himachal Pradesh 98 77 101 86 93 61
Men 98 72 102 84 93 60
Women 95 130 96 138 89 85
J&K 99 64 99 61 98 67
Men 98 65 98 54 98 76
Women 98 74 98 74 98 72
Karnataka 81 56 79 43 81 60
Men 82 57 79 40 82 63
Women 92 60 85 55 95 63
Kerala 87 68 91 65 85 69
Men 95 71 91 59 96 76
Women 88 72 91 73 86 72
Madhya Pradesh 79 47 83 45 76 48
Men 78 45 81 43 76 48
Women 92 63 92 63 91 62
Maharashtra 79 62 86 68 71 55
Men 78 60 86 64 72 56
Women 79 65 85 72 69 53
Orissa 84 79 85 82 83 77
Men 79 73 78 70 79 75
Women 86 90 81 91 90 89

- 32 - 32
Table A.2: Trainees Who Entered in 2003; Success at Pass-out (continued)
States
Proportion of trainees (%) in
All courses Courses of 1 year or less Courses of 2 years or more
Passed the
test
Took the
test
Passed the
test
Passed the
test
Took the
test
Passed the
test
Punjab 87 72 93 79 78 60
Men 84 66 94 72 76 61
Women 94 87 96 88 85 74
Rajasthan 89 63 89 64 88 62
Men 89 62 89 61 89 64
Women 82 59 84 65 78 43
Sikkim 87 70 88 68 85 78
Men 89 71 88 68 89 83
Women 50 50 . . 50 50
Tamil Nadu 91 72 96 75 87 71
Men 94 71 99 72 91 71
Women 111 96 113 103 110 90
Uttar Pradesh 85 76 93 84 80 71
Men 84 75 93 82 80 71
Women 85 82 87 84 70 63
Uttaranchal 79 72 93 86 66 59
Men 63 58 61 60 64 57
Women 105 96 110 101 88 79
Total 61 Source: ITI Tracer Study (2006)
- 33 - 33
A.3. A Brief Description of the Vocational Training Improvement Project (VTIP)
Skill mismatches between skills demanded and skills supplied and the low quality of
skills supplied are due in large part to the many constraints faced by the training system
in India faces, especially in the public vocational training system. These include outdated
equipment and course curricula, budget constraints, lack of accountability and
responsiveness to the needs of the labor market, limited involvement of the private sector
in managing training design and delivery, poor coordination among those managing the
sector, and limited flexibility provided training institutions to experiment and innovate.
The objective of the Vocational Training Improvement Project, undertaken by the
Ministry of Labour and Employment, Government of India, is to upgrade and reform the
vocational training system to re-orient and make it more responsive to the skills
demanded by the labor market, and to improve the quality of trained graduates produced
by it. The project addresses these constraints through (a) competitive grants provided to
selected ITIs for up-gradation to Centers of Excellence (CoE); (b) establishment of funds
to support innovation in training programs and training delivery; and (c) policy reforms,
capacity development and incentive funds for well-performing states to further develop
their vocational training systems.
The first project component will contribute towards provision of high quality
vocational training in trades important for the local economy. Competitive funding based
on institutional development plans submitted by ITIs will direct funding towards those
institutions that are more likely to use the funds efficiently. To be eligible, ITIs would
have a fully functioning Institutional Management Committee (IMC) with active private
sector participation and sufficient autonomy to generate revenue and set fees in
consultation with the state. They would forecast emerging training areas, assess training
needs, review new curriculum for relevance, approve faculty training and appointments
of contract staff, and facilitate job placements of graduates. The selection criteria favor
those states and institutions that will encourage greater private sector participation in
managing and developing the vocational training system, and those institutions that have
a clear and coherent vision for staff and student quality enhancement.
The second component will finance innovative interventions in the design and
delivery of training programs, including to previously poorly served populations. The
innovation funds can be accessed by states, public and private sector institutions, private
sector associations, NGOs and others.
The third component will alleviate systemic constraints faced by the vocational
training system in India. Currently, the vocational training system suffers from
management that is fragmented, blurred and duplicated between the centre and state
governments, with negligible private sector participation. This will be addressed in part
through the development of a national qualifications framework, which will also
contribute towards reforms of regulations under which private providers may enter and
operate. A ‘level playing field’ will ease the private supply of training in India. Attention
will also be given to developing a policy framework for training in the informal sector
which provides over 90 percent of employment in India. A training fund will be designed

- 34 - 34
to allocate resources to well-performing institutions in either the public or private sector
on the basis of performance criteria. Finally, it will explore the feasibility of using
financial incentives (e.g. tax deductions, matching funds) to encourage employers to
provide in-service training to their workers.
- 35 - 35
A.4. Data Quality Issues
The two surveys, the ITI Institutional Census (2006) and the ITI Tracer Study (2006), fill
important informational lacunae for the ITI sector in the country. With regards to the
quality of data of the two surveys, various lessons have emerged that will need to be
taken into account to improve the design of the future editions of the two surveys.
The data gathered through the ITI Institutional Census suffered from a number of
weaknesses:
a. There was incomplete coverage as not all ITIs responded.
b. Among ITIs that did respond, the filled out questionnaires was received from
them over a period of six months which reduces the comparability of data across
ITIs.
c. Questionnaires were not filled out completely.
d. In some sections the values provided were not consistent with each other
rendering the data unusable. This was especially true of data on ITI finances
where it was not even clear which unit the ITIs had provided the information in.
Among the critical design lessons provided by the ITI Tracer Study (2006) were:
a. The questions on employment history need to be asked more precisely.
b. The question on employment-unemployment-not in the labor force needs to be
made more precise to properly distinguish between the various alternatives.