
2005 annual reportlibrary.corporate-ir.net/library/71/715/71589/items/200622/2005AR.pdf2005 annual...
78
2005 annual report
Transcript of 2005 annual reportlibrary.corporate-ir.net/library/71/715/71589/items/200622/2005AR.pdf2005 annual...

PRODUCTIONS, INC.
IN CASE CHANGES TO TYPE NEED TO BE MAKE, USE THIS:
2 0 0 5 a n n u a l r e p o r t

K e n n e t h C o l e P r o d u c t i o n s , I n c . annual repor t 20 05

f r o m k e n n e t h
2005 was a year of change for Kenneth Cole Productions, Inc. Fortunately, change is what our
industry and business is about. Re-inventing, re-interpreting and being re-inspired by our
surroundings is embedded in the company’s culture. While we implemented several important
strategic initiatives over the past twelve months, we are very focused on the work yet to be done.
A few key changes to our management team over the past year were not planned; however
they did allow us to take necessary steps and redesign the management structure to address the
needs of our business today, as well as position ourselves for the future. As expected, our seasoned
executives rose to the challenge and we now have the best of both worlds, an opportunity rarely
afforded an established and growing business.
,
In 2005 we accelerated the repositioning and elevating of our brands, positioning Kenneth Cole
New York as an affordable luxury alternative, and replacing it with New York as an affordable luxury alternative, and replacing it with New York Kenneth Cole Reaction
as a coveted department store brand. Elevating the Kenneth Cole New York brand, which Kenneth Cole New York brand, which Kenneth Cole New York
had represented over 60% of our business, required that we reduce distribution by eliminating
a number of lifestyle department stores that could no longer carry the product or brand
a difficult decision for any company. Fortunately we were poised and ready to transition the
Kenneth Cole Reaction brand into those doors and onto that shelf space. Converting these
businesses was relatively seamless. All of our licensees have successfully transitioned to
Kenneth Cole Reaction in department stores and that brand now accounts for the majority of our
wholesale business. We are pleased with what we have achieved and are excited about the many
opportunities our new brand strategies will present.
,
Crucial to the success of these strategies is clearly the product. We have opened our eyes and
doors to new sourcing, higher quality materials and more relevant fabrications. The epitome
of our elevated brand strategy to date, the Kenneth Cole New York handbag collection, has Kenneth Cole New York handbag collection, has Kenneth Cole New York
shown tremendous success, driving an approximate 60% increase in our full-price retail handbag
business, and helping elevate brand awareness to a luxury level. By effectively shortening the
product cycle and committing to deliver a fresh product assortment on a more regular basis, we
are functioning as a vertical retailer more than ever before.
As we upgrade our brands, we have realized that we need to maximize our own retail store
environments as effective venues for this new product offering. As a result, we have begun
exploring and implementing alternative retail strategies, including “jewel boxes,” a fresh
Kenneth Cole New York retail concept. The “jewel box” formula was conceived to showcase our New York retail concept. The “jewel box” formula was conceived to showcase our New York
highly profitable accessory categories by dedicating premier real estate to them. This shift has
already proved successful on a small scale, with better fourth quarter performance in the converted
stores than in non-converted stores.
As we implement our new brand strategies, we believe it is the ideal time to explore the numerous
opportunities for international growth. We recently made an important strategic hire whose vision
complements our elevated brand strategies. Accordingly, we are repositioning ourselves in Asia
taking a more luxury position, consistent with the overall business strategy. In addition, we opened
an office in the UK, and we are currently exploring numerous opportunities for growth in Europe.
,
The challenges of the past year allowed us the opportunity to make many difficult but necessary
changes. Today we are stronger, smarter, and even more responsive to a fast changing and dynamic
market, and we look forward to applying all of our resources to continuing to create a lean and
exciting new business model, while returning to historical growth and profitability. Of course
the high level of product we offer requires the hard work, talent, and dedication of so many
I genuinely appreciate the efforts of my dedicated associates and vendors and the ongoing
support of our loyal shareholders and customers.
,
.

With the seamless conversion of our prior Kenneth Cole New York business to Kenneth Cole New York business to Kenneth Cole New York Kenneth Cole Reaction
licensing successfully moved our new brand strategy forward. We are especially excited about our
new partnership with Chaus to produce Kenneth Cole Reaction women’s apparel. We launched this new
collection in just over two hundred doors for spring 2006, with a substantial increase in doors planned
for fall 2006. Retailers are excited about the new collection and we believe Kenneth Cole Reaction
can fill the “better contemporary” void currently existing in department stores.
,
We also initiated our Home strategy with the launch of Kenneth Cole Reaction tabletop for
spring 2006. This collection made its debut in two hundred Macy’s Home stores, as well as over
one hundred additional department store doors. We are thrilled with the response the product
assortment has already received, including support from several major upscale bridal and
department store registries. We are confident this business will be a huge success for us and we
are excited about the plethora of opportunities this business has to offer.
Another first for us was the introduction of Kenneth Cole Reaction girls’ apparel. With the
Kenneth Cole Reaction boys’ business doubling its size in less than twelve months, we knew we had
tapped into a real need in the marketplace. We advertised boys’ and girls’ apparel for the first time
in fall 2005, and the response has been excellent. In fact, Kenneth Cole Reaction girls’ apparel was
expanded to over two hundred fifty doors for spring 2006, and we have already received requests
from vendors to expand the line even further to include girls’ play/active and dress-up wear.
l i c e n s i n g

Our fragrance business—in particular men’s fragrance—was one of the more notable successes
in our existing licensing businesses for 2005. Black –Kenneth Cole, Kenneth Cole Reaction and
Kenneth Cole New York SignatureKenneth Cole New York SignatureKenneth Cole New York , our most recent introduction, were consistently ranked among
the top ten men’s fragrances in department stores nationwide throughout 2005. Again, we feel
confident we’ve become a viable source for this consumer. We will continue to develop and support
this business and these top performers, and we anticipate the launch of a new Kenneth Cole men’s
fragrance in 2006.
We are excited about the opportunities our new brand strategies represent internationally
Goals for 2006 include successfully transitioning the elevated Kenneth Cole New York business Kenneth Cole New York business Kenneth Cole New York
to compete globally with other accessible luxury designer brands.
.

Can you say “Hudson Rivet”? It seems half of Hollywood can, as this hugely successful
Kenneth Cole New York handbag was photographed on the arms of many of Hollywood’s elite in Kenneth Cole New York handbag was photographed on the arms of many of Hollywood’s elite in Kenneth Cole New York
2005. This is just one example of how the new brand strategy is already proving effective for our
wholesale handbag business and, subsequently, our business as a whole. In many ways, wholesale
is leading the way, as we are better able to control every aspect of our product offering, allowing
us to source higher quality materials, offer more innovative designs, and be more strategic in
our channels of distribution. The result for our Kenneth Cole New York handbag business is an Kenneth Cole New York handbag business is an Kenneth Cole New York
impressive all door presence at Bloomingdale’s and increased presence at high-end venues like
Nordstrom. The upgrade to Kenneth Cole Reaction product has been extremely well received
and we have established a long-term strategic growth plan for the brand with Federated.
Our wholesale footwear businesses have also benefited from our new brand strategies. We have
improved our sourcing and adopted higher quality fabrications and more relevant designs. As a
result, both Kenneth Cole New York men’s and women’s footwear are being sold in most Kenneth Cole New York men’s and women’s footwear are being sold in most Kenneth Cole New York
Bloomingdale’s and have an elevated presence at Nordstrom. We are thrilled about the growth
potential these new high-end positions are sure to offer. Also ripe with potential is our men’s
Kenneth Cole New York with Silver Technology collection. The demand has been impressive, as with Silver Technology collection. The demand has been impressive, as with Silver Technology
we have once again tapped into a void in the marketplace with these functional and fashionable
men’s shoes.
w h o l e s a l e

Our Kenneth Cole Reaction footwear business is thriving. In fact, Kenneth Cole Reaction women’s
footwear posted the largest sales increase in the company in 2005. With our re-focused product
assortment and our accelerated sales strategies with Federated and Dillard’s, we are positioned
for accelerated growth in 2006. Also positioned for success, on top of its exciting 2005 growth
in sales, is our kids’ footwear business. Just as with boys’ and girls’ apparel, we believe
Kenneth Cole Reaction kids’ footwear fills a need that was not previously being met at the
department store level, and the results and opportunities are very exciting.
The launch of Tribeca women’s footwear was a big hit, with sales exceeding plans. This success
was a result of fresh, unencumbered design, creative marketing and a strategic distribution
plan positioning Tribeca as “the” choice for junior footwear at better department and specialty
stores. For our Unlisted business, analysis of our demographics led us to direct our men’s product Unlisted business, analysis of our demographics led us to direct our men’s product Unlisted
to the growing urban market, and to position ourselves as the women’s opening price point
“style essential” at Federated and other department stores. We also streamlined our distribution
channels for Unlisted, opening up opportunities for Bongo at the mid-tier level.

c o n s u m e r d i r e c t
Elevating the Kenneth Cole New York brand has changed the nature of our consumer direct Kenneth Cole New York brand has changed the nature of our consumer direct Kenneth Cole New York
business, requiring us to adjust our merchandising mix and our real estate strategy to leverage
the new position. We are currently focusing on several distinct strategies in order to improve our
performance. At the forefront of these initiatives is our “jewel box” store concept, dedicating
premier real estate to our highly profitable accessory category, specifically our luxury-driven
handbag assortment. We have found that a smaller store format merchandised primarily with
footwear and accessories can be more productive than a large format store. We now have seven of
these “jewel box“ stores and we have plans to convert eight additional locations to this format
over the course of the year. During the fourth quarter of 2005, the seven existing “jewel box
stores outperformed the remaining stores by about ten points on a comp basis. Based on successful
testing of the concept, we believe we have an opportunity for a number of full-line stores
but perhaps as many as two hundred “jewel box” format stores over the long term.
”
,
The upgrade and repositioning of our brands has highlighted potential opportunities in our outlet
business. By introducing specialty product and viewing these locations as a profit center and not
just a clearance center, we believe we will start achieving improved results by the end of this year.
In terms of product, we realize that the quality and fashion content of our Kenneth Cole New York
sportswear, in particular women’s, was not in keeping with the brand upgrade and the subsequent
price points. We have made changes in the way the women’s line is designed and sourced, and think
our margins and quality will be more appropriate. In contrast, we believe our men’s sportswear
assortment is compelling and will perform well throughout the year.
Another development that should favorably affect our consumer direct business in the long term
is the implementation of new retail systems designed to coordinate all aspects of our business
This includes product development, merchandising, customer relationship management, supply
chain and inventory management, store operations and labor optimization as well as financial
reporting. We expect to obtain quicker and better visibility to data across all of our retail and
outlets stores, catalog and web operations, as well as improve our wholesale systems as a supplier
to thousands of department and specialty stores worldwide.
.


17K e n n e t h C o l e P r o d u c t i o n s , I n c .
selected financial data 18
management’s discussion
and analysis of financial condition and results of operations 20
consolidated statements of income 39
consolidated balance sheets 40
consolidated statements of changes in shareholders’ equity 42
consolidated statements of cash flows 44
notes to consolidated financial statements 46
management’s responsibility for financial statements 74
report of independent registered public accounting firm 76
report of independent registered public accounting firm 78
market for registrant’s common equity, related shareholder
matters, and issuer purchases of equity securities 79
corporate directory and shareholder information 80
f i n a n c i a l s

18 K e n n e t h C o l e P r o d u c t i o n s , I n c .
The following selected financial data has been derived from the consolidated financial statements
of the Company and should be read in conjunction with the consolidated financial statements and
notes thereto that appear elsewhere in this Annual Report and in “Management’s Discussion and
Analysis of Financial Condition and Results of Operations.” (Amounts, except for per share amounts,
are in thousands.)
Ye a r E n d e d D e c e m b e r 31, 2 0 0 5 2 0 0 4 2 0 0 3 2 0 0 2 2 0 01
Income Statement Data :
Net sales $ 474,060 $ 473,438 $ 430,101 $ 404,336 $ 365,809
Royalty revenue 43,983 42,763 38,252 28,713 22,116
Net revenue 518,043 516,201 468,353 433,049 387,925
Cost of goods sold 283,727 284,817 258,457 235,255 217,221
Gross profit (2) 234,316 231,384 209,896 197,794 170,704
Selling and general
administrative expenses (1) 188,953 174,519 157,824 152,618 145,919
Impairment of long-lived assets — 448 1,153 4,446 —
Operating income 45,363 56,417 50,919 40,730 24,785
Interest and other income, net 4,151 1,411 825 1,102 2,135
Income before provision for
income taxes 49,514 57,828 51,744 41,832 26,920
Provision for income taxes 15,988 21,976 19,145 15,687 10,304
Net income 33,526 35,852 32,599 26,145 16,616
se lec ted f i n a n c i a l d a t a

19K e n n e t h C o l e P r o d u c t i o n s , I n c .
2 0 0 5 2 0 0 4 2 0 0 3 2 0 0 2 2 0 01
Earnings per share:
Basic $ 1.69 $ 1.79 $ 1.66 $ 1.33 $ 0.83
Diluted $ 1.65 $ 1.74 $ 1.59 $ 1.27 $ 0.80
Weighted-average shares
outstanding:
Basic 19,888 20,050 19,609 19,643 19,992
Diluted 20,318 20,652 20,486 20,590 20,745
Cash dividends per share 0.66 0.52 0.17 — —
2 0 0 5 2 0 0 4 2 0 0 3 2 0 0 2 2 0 01
Balance Sheet Data :
Working capital $ 187,106 $ 173,007 $ 154,161 $ 124,103 $ 96,709
Cash 63,747 80,014 111,102 91,549 68,966
Marketable Securities 66,400 40,000 — — —
Inventory 45,465 47,166 44,851 43,724 30,753
Total assets 340,671 304,587 273,841 240,317 201,889
Total debt, including
current maturities 3,000 — — 171 383
Total shareholders’ equity 244,660 216,528 196,334 164,902 140,894
(1) Includes warehousing and receiving expenses.(2) Gross profit may not be comparable to other entities, since some entities include the costs related to their distribution
network (receiving and warehousing) in cost of goods sold and other entities, similar to the Company, exclude these costs from gross profit, including them instead in a line item such as selling, general and administrative expenses.

20 K e n n e t h C o l e P r o d u c t i o n s , I n c .
The following discussion and analysis should be read in conjunction with the consolidated financial
statements and the notes thereto that appear elsewhere in this Annual Report.
ove r v i ew
Kenneth Cole Productions, Inc., designs, sources and markets a broad range of fashion footwear
and handbags and, through license agreements, designs and markets apparel and accessories
under its Kenneth Cole New York, Kenneth Cole Reaction, Unlisted, Bongo, and Tribeca brand
names. The Company’s products are targeted to appeal to fashion conscious consumers, reflecting
a casual urban perspective and a contemporary lifestyle uniquely associated with Kenneth Cole.
The Company markets its products to more than 6,000 department and specialty store locations, as
well as through its Consumer Direct business, which includes an expanding base of retail and outlet
stores, consumer catalogs and interactive websites, including online e-commerce.
The popularity of the Kenneth Cole brand names among consumers has enabled the Company to
expand its product offerings and channels of distribution through licensing agreements and offers
through these agreements a lifestyle collection of men’s product categories including tailored
clothing, dress shirts, dress pants, sportswear, neckwear, briefcases, portfolios, jewelry, fragrance,
belts, leather and fabric outerwear, swimwear, sunglasses, prescription eyewear, watches, luggage,
hosiery and small leather goods. Women’s product categories currently being sold pursuant to
license agreements include sportswear, small leather goods, belts, scarves and wraps, hosiery,
leather and fabric outerwear, sunglasses, prescription eyewear, watches, jewelry, fragrance,
swimwear, and luggage. In addition, the Company licenses boys’ and girls’ apparel, as well as
housewares, under the Kenneth Cole Reaction brand.
The Company recorded record revenues of $518.0 million for the year ended December 31, 2005.
Diluted earnings per share decreased 5.2% to $1.65 from $1.74 year over year. The Company’s
revenues for the year have improved over the prior year, primarily due to new product selection at
retail, and continued success in a wide variety of licensed product classifications. The Company’s
Balance Sheet remains strong with $130.1 million in cash and marketable securities. Additionally, the
m a n a g e m e n t ’ s d i s c u s s i o nand ana ly s i s o f f inanc ia l cond i t ion and resu l t s o f o pera t ions

21K e n n e t h C o l e P r o d u c t i o n s , I n c .
Company expects to continue its quarterly cash dividend, currently set at $0.18. The Company
continued its new strategic initiative to reposition the Kenneth Cole New York brand as an accessible
luxury brand. The Company believes that the repositioning of this brand will take the Company to
its next stage of development, which will place the Company in the best position to benefit from the
consolidation in the retail marketplace, maximize its own retail store concept and grow internationally.
While this will enable the Company’s brands to reach their potential, it will take time to fully transition
the brand and realize the full financial benefits. As such, the Company continues to focus on designing
and delivering high quality, fashionable products, creating efficient and compelling retail environments,
and maintaining close partnerships with its licensees to ensure brand quality and distribution integrity.
c r i t i c a l a c coun t ing p o l i c i e s and e s t ima t e s
General The Company’s management’s discussion and analysis of its financial condition and
results of operations are based upon the Company’s consolidated financial statements, which have
been prepared in accordance with accounting principles generally accepted in the United States.
The preparation of these financial statements requires the Company to make estimates and
judgments that affect the reported amounts of assets, liabilities, revenues and expenses, and
related disclosure of contingent assets and liabilities. On an on-going basis, the Company evaluates
its estimates, including those related to product returns, bad debts, inventories, income taxes,
financing operations, contingencies and litigation. The Company bases its estimates on historical
experience and on various other assumptions that are believed to be reasonable under the
circumstances, the results of which form the basis for making judgments about the carrying values
of assets and liabilities that are not readily apparent from other sources. Actual results may differ
from these estimates under different assumptions or conditions.
The Company believes the following critical accounting policies affect its more significant
judgments and estimates used in the preparation of its consolidated financial statements.
Inventory The Company writes down its inventory for estimated obsolescence equal to the
difference between the cost of inventory and the estimated market value based upon assumptions

22 K e n n e t h C o l e P r o d u c t i o n s , I n c .
about future demand and market conditions. If actual market conditions are less favorable than
those projected by management, additional inventory write-downs may be required.
Sales Returns and Allowances The Company’s ability to collect factor chargebacks for
deductions taken by its customers for returns, discounts, and allowances as well as potential future
customer deductions is significant to its operations. The Company reserves against known
chargebacks as well as potential future customer deductions based on a combination of historical
activity and current market conditions. Actual results may differ from these estimates under
different assumptions or conditions, which may have a significant impact on the Company’s results.
Allowance for Doubtful Accounts The Company maintains allowances for doubtful accounts
for estimated losses resulting from the inability of its customers to make required payments,
as well as royalties and advertising revenues from its licensing partners. These customers include
non-factored accounts and credit card receivables from third-party service providers. If the financial
conditions of these customers were to deteriorate, resulting in an impairment of their ability to
make payments, additional allowances may be required.
Income Taxes The Company’s income taxes are routinely under audit by federal, state, or local
authorities. These audits include questioning of the timing and amount of deductions and the
allocation of income among various tax jurisdictions. Based on its annual evaluations of tax
positions, the Company believes it has appropriately accrued for probable exposures. To the extent
the Company is required to pay amounts in excess of recorded income tax liabilities, the Company’s
effective tax rate in a given financial statement period could be materially impacted.
Litigation The Company is periodically involved in various legal actions arising in the normal
course of business. Management is required to assess the probability of any adverse judgements as
well as the potential range of any losses. Management determines the required accruals after a
careful review of the facts of each significant legal action. The Company’s accruals may change in
the future due to new developments in these matters.
m a n a g e m e n t ’ s d i s c u s s i o nand ana ly s i s o f f inanc ia l cond i t ion and resu l t s o f o pera t ions

23K e n n e t h C o l e P r o d u c t i o n s , I n c .
Contingencies In the ordinary course of business, the Company is involved in and subject to
compliance and regulatory reviews and audits by numerous authorities, agencies and other
governmental agents and entities from various jurisdictions. The Company is required to assess the
likelihood of any adverse outcomes of these matters. A determination of the amount of reserves
required, if any, for these reviews is made after careful analysis of each individual issue. The reserves
may change in the future due to new developments or final resolution in each matter, which may
have a significant impact on the Company’s results.
New Accounting and Tax Pronouncements In 2004, Internal Revenue Code Section 965 was
enacted, as part of the American Jobs Creation Act. This is a temporary provision that allows U.S.
companies to repatriate earnings from their foreign subsidiaries at a reduced tax rate provided that
specified conditions and restrictions are satisfied. In addition, FASB Staff Position FAS 109-2 was
issued to provide accounting and disclosure guidance relating to the repatriation provision. In 2005,
the Company’s Board of Directors approved and adopted a repatriation plan and, as such, the
Company repatriated $12.5 million of unremitted foreign earnings, which resulted in a tax benefit
of approximately $3.0 million for the year ended December 31, 2005, as a result of the Company
providing for taxes for the foreign earnings at the prior statutory rate.
In November 2004, the FASB issued Statement of Financial Accounting Standards No. 151, “Inventory
Costs—An Amendment of ARB No. 43, Chapter 4” (“SFAS 151”). SFAS 151 amends the guidance in
ARB No. 43, Chapter 4, “Inventory Pricing,” to clarify the accounting for abnormal amounts of idle
facility expense, freight, handling costs, and wasted material (spoilage). SFAS 151 is effective for fiscal
years beginning after June 15, 2005 and, as such, the Company adopted SFAS 151 on January 1,
2006. The adoption of SFAS 151 did not have a material impact on the Company’s consolidated
results of operations, financial position, or cash flows.

24 K e n n e t h C o l e P r o d u c t i o n s , I n c .
In December 2004, the FASB issued Statement of Financial Accounting Standards No 123R,
“Share-based Payments” (“SFAS 123R”), which supersedes APB Opinion No. 25. SFAS 123R requires
all share-based payments, including grants of employee stock options, to be recognized in the
financial statements based on their fair values. Under SFAS 123R, public companies will be required
to measure the cost of services received in exchange for stock options and similar awards based on
the grant-date fair value of the award and recognize this cost in the income statement over the
period during which an award recipient is required to provide service in exchange for the award.
The pro forma disclosures previously permitted under SFAS 123 no longer will be an alternative to
financial statement recognition. Under SFAS 123R, the Company must determine the appropriate
fair value model to be used for valuing share-based payments, the amortization method for
compensation cost and the transition method to be used at date of adoption. The transition
methods include modified prospective and retroactive adoption options. The Company adopted
SFAS 123R on January 1, 2006 using the modified prospective method. Under this method, the
Company will recognize compensation cost, on a prospective basis, for the portion of outstanding
awards for which the requisite service has not yet been rendered as of January 1, 2006, based upon
the grant-date fair value of those awards calculated under SFAS 123 for pro forma disclosure
purposes. Earnings and diluted earnings per share are expected to decrease by approximately
$5.4 million and $0.16, respectively, as a result of share-based grants in 2006, and those grants as of
December 31, 2005 for which compensation expense has not been recognized under SFAS 123.
Also in December 2004, the FASB issued SFAS No. 153, “Exchanges of Nonmonetary Assets—
An Amendment of APB Opinion No. 29, Accounting for Nonmonetary Transactions” (“SFAS 153”).
SFAS 153 eliminates the exception from fair value measurement for nonmonetary exchanges of
similar productive assets in paragraph 21(b) of APB Opinion No. 29, “Accounting for Nonmonetary
Transactions,” and replaces it with an exception for exchanges that do not have commercial
substance. SFAS 153 specifies that a nonmonetary exchange has commercial substance if the
future cash flows of the entity are expected to change significantly as a result of the exchange.
The adoption of SFAS 153 on January 1, 2006, did not have a material impact on the Company’s
consolidated results of operations or financial condition.
m a n a g e m e n t ’ s d i s c u s s i o nand ana ly s i s o f f inanc ia l cond i t ion and resu l t s o f o pera t ions

25K e n n e t h C o l e P r o d u c t i o n s , I n c .
In May 2005, the FASB issued SFAS No. 154, “Accounting Changes and Error Corrections,” (“SFAS 154”),
a replacement of Accounting Principles Board Opinion (APB) No. 20, “Accounting Changes,” and
FASB Statement No. 3, “Reporting Accounting Changes in Interim Financial Statements.” This
Statement requires retrospective application to prior periods’ financial statements of a change in
accounting principle. It applies both to voluntary changes and to changes required by an accounting
pronouncement if the pronouncement does not include specific transition provisions. APB 20
previously required that most voluntary changes in accounting principles be recognized by recording
the cumulative effect of a change in accounting principle. SFAS 154 is effective for fiscal years
beginning after December 15, 2005. The Company adopted this statement on January 1, 2006, and
does not anticipate that it will have a material effect on the Company’s consolidated results of
operations, financial position, or cash flows.
In March 2005, the Financial Accounting Standards Board issued FASB Interpretation No. 47,
“Accounting for Conditional Asset Retirement Obligations” (“FIN 47”). FIN 47 is an interpretation of
Statement of Financial Accounting Standards No. 143, “Accounting for Asset Retirement Obligations”
(“SFAS 143”), and clarifies the term conditional asset retirement obligation as used in SFAS 143,
which refers to a legal obligation to perform an asset retirement activity in which the timing and/or
method of settlement are conditional on a future event that may or may not be within the control
of the entity. Accordingly, the Company is required to identify any conditional asset retirement
obligations it may have with respect to its long-lived assets, and recognize a liability for the fair
value of any conditional asset retirement obligations, if the fair value of the liability can be reasonably
estimated. FIN 47 is effective for the fiscal year ending December 31, 2005. As such, the Company
adopted FIN 47 in 2005, which did not impact the Company’s results of operations, financial
position, or cash flows.
26 K e n n e t h C o l e P r o d u c t i o n s , I n c .
r e su l t s o f ope r a t i ons
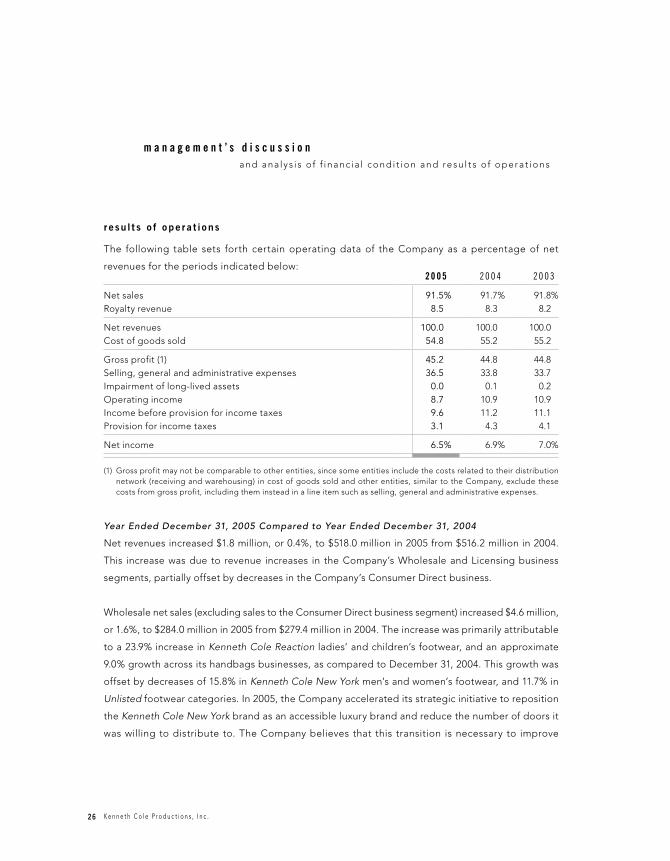
The following table sets forth certain operating data of the Company as a percentage of net
revenues for the periods indicated below:2 0 0 5 2 0 0 4 2 0 0 3
Net sales 91.5% 91.7% 91.8%Royalty revenue 8.5 8.3 8.2
Net revenues 100.0 100.0 100.0Cost of goods sold 54.8 55.2 55.2
Gross profit (1) 45.2 44.8 44.8Selling, general and administrative expenses 36.5 33.8 33.7Impairment of long-lived assets 0.0 0.1 0.2Operating income 8.7 10.9 10.9Income before provision for income taxes 9.6 11.2 11.1Provision for income taxes 3.1 4.3 4.1
Net income 6.5% 6.9% 7.0%
(1) Gross profit may not be comparable to other entities, since some entities include the costs related to their distribution network (receiving and warehousing) in cost of goods sold and other entities, similar to the Company, exclude these costs from gross profit, including them instead in a line item such as selling, general and administrative expenses.
Year Ended December 31, 2005 Compared to Year Ended December 31, 2004
Net revenues increased $1.8 million, or 0.4%, to $518.0 million in 2005 from $516.2 million in 2004.
This increase was due to revenue increases in the Company’s Wholesale and Licensing business
segments, partially offset by decreases in the Company’s Consumer Direct business.
Wholesale net sales (excluding sales to the Consumer Direct business segment) increased $4.6 million,
or 1.6%, to $284.0 million in 2005 from $279.4 million in 2004. The increase was primarily attributable
to a 23.9% increase in Kenneth Cole Reaction ladies’ and children’s footwear, and an approximate
9.0% growth across its handbags businesses, as compared to December 31, 2004. This growth was
offset by decreases of 15.8% in Kenneth Cole New York men’s and women’s footwear, and 11.7% in
Unlisted footwear categories. In 2005, the Company accelerated its strategic initiative to reposition
the Kenneth Cole New York brand as an accessible luxury brand and reduce the number of doors it
was willing to distribute to. The Company believes that this transition is necessary to improve
m a n a g e m e n t ’ s d i s c u s s i o nand ana ly s i s o f f inanc ia l cond i t ion and resu l t s o f o pera t ions

27K e n n e t h C o l e P r o d u c t i o n s , I n c .
the Company’s Wholesale net sales. The Company will continue to focus on improving product
offerings, advertising campaigns, marketing efforts, website, catalogs and growing retail presence,
combined with the marketing efforts of its licensees, which it believes will be significant factors
in strengthening and defining all of its distinct brands, including Kenneth Cole Reaction, Tribeca,
and Bongo across all product classifications, thereby increasing consumer demand for these brands
in the future.
Net sales in the Company’s Consumer Direct segment decreased $3.9 million, or 2.0%, to
$190.1 million in 2005 from $194.0 million in 2004. The decrease was primarily due to a decrease in
retail store sales of $5.4 million, or 2.9%, as compared to year ended December 31, 2004. Comparable
store sales decreased by $13.2 million, or 7.5%, offset by an increase of $7.8 million of new store sales
in 2005 plus the portion of 2005 sales for stores not open for all of 2004. In addition, the retail store
sales decline was offset by Catalog/Internet and Gift Program sales, which increased by 21.5% for
the year ended December 31, 2005. The Company believes the decrease in net sales in the Consumer
Direct segment is primarily due to the Company’s repositioning of the Kenneth Cole New York
brand in its retail stores, which was accelerated in 2005. The Company believes well-executed
Kenneth Cole New York products will be embraced by its customers, as illustrated by the success of
the Kenneth Cole New York handbags business. However, some of the other products were not as
well executed, and did not provide the consumer with the Company’s highest standard of price and
value, and were not well received. The Company is focusing on the design, price and value of its
Kenneth Cole New York products for 2006. In an effort to maintain, solidify, and build positive sales
results, the Company will continue to analyze inventory, focus on products and further scrutinize
consumer trends, as well as concentrate on quality, style and price to continue customer acceptance
of its brand respositioning strategy.
Royalty revenue increased $1.2 million, or 2.8%, to $44.0 million in 2005 from $42.8 million in 2004.
The increase was primarily from incremental minimum royalties from the Company’s existing licensees,
sales increases from fragrance and children’s apparel, and its European licensee, offset by a
reduction in minimum royalties from the transition of the women’s sportswear licensee. Brand
repositioning has slowed growth in 2005, as a result of the Company’s strategic plan. However, the

28 K e n n e t h C o l e P r o d u c t i o n s , I n c .
Company believes consumers look toward brands they know and feel are compatible with their
lifestyles; therefore the synergies from its efforts to reinforce its brand identities through greater
marketing efforts, by itself and its licensees across all product categories, will continue to strengthen
and define its brands to improve name recognition allowing growth in sales both domestically and
internationally throughout 2006.
Consolidated gross profit increased to 45.2% in 2005, as a percentage of net revenues, compared to
44.8% in 2004. The increase was primarily a result of an improvement in Consumer Direct margins
and the change in mix of the Company’s net revenues from its Wholesale, Consumer Direct and
Licensing segments. The Consumer Direct segment’s revenues decreased as a percentage of
net revenues, to 36.7%, for the year ended December 31, 2005, from 37.6% for the year ended
December 31, 2004, while the revenues in the Wholesale segment, which operates at a lower gross
profit percentage as compared to the Consumer Direct segment, increased as a percentage of net
revenues to 54.8% for the year ended December 31, 2005, compared to 54.1% for the year ended
December 31, 2004. The revenues in the Licensing segment, which carries no cost of goods sold,
increased as a percentage of revenue to 8.5% from the year ended December 31, 2005 compared to
8.3% for the year ended December 31, 2004. Consumer Direct segment margins increased
from higher price points on better quality products, as part of the Company’s strategic initiative to
reposition Kenneth Cole New York as an accessible luxury brand.
Selling, general and administrative expenses, including warehousing and receiving expenses
(“SG&A”), increased $14.5 million, or 8.3%, to $189.0 million (or 36.5% of net revenues) in 2005 from
$174.5 million (or 33.8% of net revenues) in 2004, which includes severance costs of approximately
$0.8 million in 2005. SG&A, as a percentage of net revenues, increased primarily due to investments
in people and systems, increases in fixed costs from new and expanding retail stores, and
the Company’s loss of leverage on its comparable stores’ sales base. Included within SG&A for the
year ended December 31, 2004 was a one-time cost of $1.1 million associated with the closing and
transition of the Company’s east coast distribution center to a third-party service provider.
m a n a g e m e n t ’ s d i s c u s s i o nand ana ly s i s o f f inanc ia l cond i t ion and resu l t s o f o pera t ions

29K e n n e t h C o l e P r o d u c t i o n s , I n c .
The Company did not record asset impairment charges for the year ended December 31, 2005, as
compared to the year ended December 31, 2004, in which the Company recorded approximately
$0.5 million for the write-down of stores’ leasehold improvements, furniture, and fixtures in the
Company’s Florida Mall store, located in Orlando, Florida and the Lexington Avenue store located
in New York City.
Interest and other income increased to $4.2 million for the year ended December 31, 2005 from
$1.4 million in 2004. The increase was primarily due to a $1.2 million gain on the sale of
marketable securities during the year ended December 31, 2005 and an average higher rate
of return on investments.
The Company’s effective tax rate decreased to 32.3% for the year ended December 31, 2005 from
38.0% for the year ended December 31, 2004, as a result of a temporary provision that allows U.S.
companies to repatriate earnings from their foreign subsidiaries at a reduced tax. The Company
repatriated approximately $12.5 million of prior years’ foreign earnings, which resulted in approximately
$3.0 million in tax savings for the year ended December 31, 2005.
As a result of the foregoing, net income decreased by $2.4 million, or 6.7%, to $33.5 million (6.5% of
net revenue), for the year ended December 31, 2005, from $35.9 million (6.9% of net revenue).
Year Ended December 31, 2004 Compared to Year Ended December 31, 2003
Net revenues increased $47.8 million, or 10.2%, to $516.2 million in 2004 from $468.4 million in 2003.
This increase was due to revenue increases in each of the Company’s business segments: Wholesale,
Consumer Direct and Licensing.
Wholesale net sales (excluding sales to the Consumer Direct business segment) increased
$24.8 million, or 9.7%, to $279.4 million in 2004 from $254.6 million in 2003. This increase was
attributable to improved sales across the Company’s footwear brands: Kenneth Cole New York,
Kenneth Cole Reaction, Bongo licensed footwear and the handbag businesses. This growth was
offset by a 15.6% decline in Unlisted footwear. The Company believes that selling products under

30 K e n n e t h C o l e P r o d u c t i o n s , I n c .
these trademark names, among others, to multiple demographics through several distribution
channels has improved the Company’s wholesale net sales. In addition, the improvement of
sell-thrus at retail from customer acceptance also contributed to the increase, as well as the
Company’s initiatives in repositioning its handbag businesses. The Company will continue to focus
on improving product offerings, advertising campaigns, marketing efforts, website, catalogs
and growing retail presence, combined with the marketing efforts of its licensees, which it believes
will be significant factors to strengthen and define its distinct brands, Kenneth Cole New York,
Kenneth Cole Reaction, Unlisted and Bongo across all product classifications, thereby increasing
consumer demand for the Company’s brands in the future. In addition, the Company believes that
the launch of Tribeca will also contribute to the Company’s growth.
Net sales in the Company’s Consumer Direct segment increased $18.4 million, or 10.5%, to
$194.0 million in 2004 from $175.6 million in 2003. Of the total increase, $10.7 million was attributable
to new store sales in 2004 plus that portion of 2004 sales for stores not open for all of 2003, as well
as an increase of $4.6 million or 2.8% in comparable store sales. The remaining sales increase of
$3.1 million was primarily derived from the Company’s Corporate Gift Program. The Company
believes the increase in net sales in the Consumer Direct segment is due in part to the economic
strengthening generally seen throughout the retail and apparel industry and direct merchandising
initiatives at its outlets. In an effort to maintain, solidify, and build on the positive sales results,
the Company will continue to analyze inventory, focus on products and further scrutinize
consumer trends.
Royalty revenue increased $4.6 million, or 12.0%, to $42.8 million in 2004 from $38.2 million in 2003.
The increase was primarily from incremental minimum royalties from the Company’s existing licensees,
most significantly women’s apparel and fragrance, and from the Company’s new men’s casual pants
licensee. This was offset by a decrease in royalties from the men’s sportswear licensee. The Company
believes consumers look toward brands they know and feel are compatible with their lifestyles.
Therefore, the synergies from its efforts to reinforce its brand identities through greater marketing
efforts, by itself and its licensees across all product categories, will continue to strengthen
m a n a g e m e n t ’ s d i s c u s s i o nand ana ly s i s o f f inanc ia l cond i t ion and resu l t s o f o pera t ions

31K e n n e t h C o l e P r o d u c t i o n s , I n c .
and define the Company’s brands to improve name recognition allowing growth in sales both
domestically and internationally through license partners.
Consolidated gross profit remained at 44.8%, as a percentage of net revenues, in 2004 and 2003.
This was primarily a result of an increase in the percentage of revenue and higher margins
contributed by the Consumer Direct segment, offset by decreased margins within the Wholesale
segment. The Consumer Direct segment increased as a percentage of net revenues, to 37.6%, for
the year ended December 31, 2004, from 37.5% for the year ended December 31, 2003, while the
wholesale segment, which operates at a lower gross profit percentage, decreased as a percentage
of net revenues to 54.1% for the year ended December 31, 2004, compared to 54.3% for the
year ended December 31, 2003. Consumer Direct segment margins increased from merchandising
initiatives at its outlet stores, new assortments, which focus on wear-now products that limit
vulnerability of the mix of products without compromising fashion and excitement, and a reduction
of point of sale promotions. Wholesale segment margins were lower from the impact the Euro had
on the US dollar, which reduced initial mark-ups in the segment during the first half of 2004.
SG&A increased $16.7 million, or 10.6%, to $174.5 million (or 33.8% of net revenues) in 2004 from
$157.8 million (or 33.7% of net revenues) in 2003. SG&A increased slightly as a percentage of net
revenues, primarily due to professional fees from the implementation and compliance with
the Sarbanes-Oxley Act of 2002 and higher labor costs in the Company’s Wholesale and Licensing
business segments.
The Company recorded asset impairment charges of approximately $0.5 million and $1.2 million for
the years ended December 31, 2004 and 2003, respectively, for the Company’s Florida Mall store,
located in Orlando, Florida and the Lexington Avenue store located in New York City. This asset
impairment charge equaled 0.1% of net revenues for the year ended December 31, 2004 and 0.2%
of net revenues for the year ended December 31, 2003, and is included as a separate item in
the Consolidated Statement of Income, within operating income. The impairment related to the
write-down of the stores’ leasehold improvements, furniture, and fixtures.
32 K e n n e t h C o l e P r o d u c t i o n s , I n c .
Interest and other income increased to $1.4 million for the year ended December 31, 2004 from
$0.8 million in 2003. The increase is the result of higher average cash balances. In addition, average
short-term interest rates have increased throughout 2004 improving investment rates of returns.
The Company’s effective tax rate increased to 38.0% for the year ended December 31, 2004 from
37.0% for the year ended December 31, 2003. The increase was a result of changes in tax laws
from state and local jurisdictions to which the Company’s earnings are subject.
As a result of the foregoing, net income increased $3.3 million, or 10.0%, to $35.9 million (6.9% of
net revenue), which includes an asset impairment charge of $0.5 million for the year ended
December 31, 2004, from $32.6 million (7.0% of net revenue), which included an asset impairment
charge of $1.2 million, for the year ended December 31, 2003.
l i qu i d i t y and c ap i t a l r e s ou r ce s
The Company’s cash requirements are generated primarily from working capital needs, retail
expansion, enhanced technology, and other corporate activities. The Company primarily relies upon
internally generated cash flows from operations to finance its operations and growth; however,
it also has the ability to borrow up to $25.0 million under its line of credit. Cash flows may vary from
time to time as a result of seasonal requirements of inventory, the timing of the delivery of merchandise
to customers and the level of accounts receivable and payable balances. At December 31, 2005,
working capital was $187.1 million compared to $173.0 million at December 31, 2004.
Net cash provided by operating activities was $33.9 million for the year ended December 31, 2005
compared to $37.9 million for the year ended December 31, 2004. This decrease was primarily
attributable to decrease in net income offset by the benefit for deferred taxes from the dividend
repatriation resulting from the American Jobs Creations Act, as well as the timing of receivables and
payables from operations.
m a n a g e m e n t ’ s d i s c u s s i o nand ana ly s i s o f f inanc ia l cond i t ion and resu l t s o f o pera t ions

33K e n n e t h C o l e P r o d u c t i o n s , I n c .
Net cash used in investing activities decreased to $45.0 million for the year ended December 31, 2005
compared to $50.0 million for the year ended December 31, 2004. This was primarily due to the sale
of marketable securities, in which the Company received $16.8 million in proceeds, which was offset by
the purchase of $41.0 million of marketable securities in 2005 versus $40.0 million of purchases in 2004.
Capital expenditures were approximately $13.9 million and $10.1 million for 2005 and 2004, respectively.
Expenditures on furniture, fixtures, and leasehold improvements for new retail store openings
and expansions were $8.3 million and $6.9 million in 2005 and 2004, respectively. The remaining
expenditures were primarily for leasehold improvements for the renovation of the Company’s
corporate headquarters and administrative offices and information system enhancements. In addition,
$6 million was used to purchase six million shares of Bernard Chaus, Inc., in connection with the
Company’s licensing agreement and strategic relationship with Bernard Chaus, Inc.
Net cash used in financing activities was $5.1 million for the year ended December 31, 2005
compared to $19.0 million for the year ended December 31, 2004. The decrease is primarily
attributable to the Company’s repurchase of 500,000 of its treasury shares for $13.9 million in 2004.
This was offset by cash dividend payments to Class A and B Common Stock shareholders of
$13.1 million in 2005 compared to $10.5 million in 2004. The Company also received proceeds of
$4.7 million for stock option exercises in 2005 compared to $5.2 million in 2004. In addition, the
Company entered into a short-term loan agreement related to the Company’s repatriation plan and
received $3.0 million in proceeds.
The Company currently sells substantially all of its accounts receivable to two factors without
recourse. In circumstances where a customer’s account cannot be factored without recourse,
the Company may take other measures to reduce its credit exposure, which could include requiring
the customer to pay in advance, or to provide a letter of credit covering the sales price of the
merchandise ordered.

34 K e n n e t h C o l e P r o d u c t i o n s , I n c .
The Company’s material obligations under contractual agreements, primarily commitments
for future payments under operating lease agreements as of December 31, 2005 are summarized
as follows:Payments Due by Period
Total1 Year or Less 2–3 Years 4–5 Years
After 5 Years
Operating Leases and Other Obligations $ 215,487,000 $ 27,713,000 $ 54,161,000 $ 48,990,000 $ 84,623,000
Purchase Obligations 61,238,000 61,238,000Building Purchase
Commitment 24,000,000 24,000,000Short-term Borrowings 3,000,000 3,000,000
Total Contractual Obligations $ 303,725,000 $ 115,951,000 $ 54,161,000 $ 48,990,000 $ 84,623,000
During 2006, the Company anticipates opening or expanding approximately 5 to 10 retail and outlet
stores. These new and expanded stores will require approximately $9.5 million in aggregate capital
expenditures and initial inventory requirements. The Company also anticipates that it will
require increased capital expenditures to support its information systems over its historical spend.
The Company signed an agreement with SAP to implement an integrated business platform
across the Company’s retail and outlet stores in 2006. The estimated expenditures related to the
implementation are expected to be approximately $8.0 million.
The Company currently has a line of credit, as amended, under which up to $25.0 million is available
to finance working capital requirements and letters of credit to finance the Company’s inventory
purchases. Borrowings available under the line of credit are determined by a specified percentage
of eligible accounts receivable and inventories and bear interest at (i) the higher of The Bank of
New York’s prime lending rate or the Federal Funds rate plus 0.5% at the date of borrowing or (ii) a
negotiated rate. In connection with the line of credit, the Company has agreed to eliminate all the
outstanding borrowings under the facility for at least 30 consecutive days during each calendar
year. In addition, borrowings under the line of credit are secured by certain receivables of the
Company. The Company had no outstanding advances during 2005 and 2004 under this line of
m a n a g e m e n t ’ s d i s c u s s i o nand ana ly s i s o f f inanc ia l cond i t ion and resu l t s o f o pera t ions

35K e n n e t h C o l e P r o d u c t i o n s , I n c .
credit; however amounts available under the line were reduced to $18.3 million by $6.7 million
standby letters of credit at December 31, 2005.
In 2005, in connection with the Company’s tax repatriation plan, one of the Company’s foreign
subsidiaries entered into a promissory note with a financial institution, which provided the foreign
subsidiary with $3,000,000. The note is due in September 2006. Interest is payable monthly at an
annual rate equal to the greater of the prime rate in effect on such date or the Federal Funds Rate
in effect on such date plus 0.50%. The agreement contains a number of customary covenants and
events of default. Upon the occurrence of an event of default, all borrowings and accrued interest
shall become immediately due and payable. In addition, the Company entered into a Cash Collateral
Pledge Agreement, for $3,000,000, with a financial institution, which serves as collateral on the loan
to the foreign subsidiary.
In 2004, the Company entered into an agreement to purchase the office building that it is currently
leasing for its corporate headquarters in New York City providing approximately 119,500 square feet
of office space for approximately $24 million. The closing date is scheduled for approximately
May 2006, the specific timing to be determined by the parties, based on the ability of the current
landlord to satisfy certain terms and conditions. The Company has incurred approximately
$18.2 million as of December 31, 2005 in capital improvements and furniture expenditures in
connection with this purchase.
Also in 2004, the Company entered into a 10-year lease for its administrative offices located in
New Jersey, for which it incurred approximately $0.2 million and $1.0 million in capital improvements
and expenditures during 2005 and 2004, respectively.
The Company believes that it will be able to satisfy its current expected cash requirements for 2006,
including requirements for its retail expansion, corporate and administrative office build-outs,
the purchase of the New York City corporate headquarters, enhanced information systems and the
payments of its quarterly cash dividend, primarily with cash flow from operations and cash on hand.

36 K e n n e t h C o l e P r o d u c t i o n s , I n c .
exchange r a t e s
The Company routinely enters into forward exchange contracts for its future purchases of inventory
denominated in foreign currencies, primarily the Euro. At December 31, 2005, forward exchange
contracts with a notional value totaling $7.0 million were outstanding with settlement dates ranging
from January 2006 through May 2006. Gains and losses on forward exchange contracts that are
used for hedges are accounted for on the balance sheet as inventory and an adjustment to equity,
and are subsequently accounted for as part of the purchase price of the inventory upon execution of
the contract. At December 31, 2005, the unrealized loss on these outstanding forward contracts is
approximately $184,000, net of taxes, which is included in Accumulated Other Comprehensive
Income in the Statements of Changes in Shareholders’ Equity and a decrease to inventory, which is
the underlying exposure on the consolidated balance sheet. The Company expects to continue to
routinely enter into additional foreign exchange contracts throughout the year. While the Company
believes that its current procedures with respect to the reduction of risk associated with currency
exchange rate fluctuations are adequate, there can be no assurance that such fluctuations will not
have a material adverse effect on the results of operations of the Company in the future.
Inventory from contract manufacturers in the Far East and Brazil are purchased in United States dollars
and the recent fluctuations of many of these currencies against the United States dollar has not had
any material adverse impact on the Company. However, future purchase prices for the Company’s
products may be impacted by fluctuations in the exchange rate between the United States dollar
and the local currencies of the contract manufacturer, which may affect the Company’s cost of
goods in the future. The Company does not believe the potential effects of such fluctuations would
have a material adverse effect on the Company.
e f f e c t s o f i n f l a t i on
The Company does not believe that the relatively low rates of inflation experienced over the last
few years in the United States, where it primarily competes, have had a significant effect on
revenues or profitability.
m a n a g e m e n t ’ s d i s c u s s i o nand ana ly s i s o f f inanc ia l cond i t ion and resu l t s o f o pera t ions

37K e n n e t h C o l e P r o d u c t i o n s , I n c .
quan t i t a t i ve and qua l i t a t i ve d i s c l o su r e s abou t marke t r i s k
The Company does not believe it has a material exposure to market risk. The Company is primarily
exposed to currency exchange rate risks with respect to its inventory transactions denominated
in Euro. Business activities in various currencies expose the Company to the risk that the eventual
net dollar cash flows from transactions with foreign suppliers denominated in foreign currencies
may be adversely affected by changes in currency rates. The Company manages these risks by
utilizing foreign exchange contracts. The Company does not enter into foreign currency
transactions for speculative purposes.
At December 31, 2005, the Company had forward exchange contracts totaling with notional values
$7.0 million, which resulted in an unrealized loss of approximately $184,000, net of taxes. The
Company’s earnings may also be affected by changes in short-term interest rates as a result of
borrowings under its line of credit facility. A two or less percentage point increase in interest rates
affecting the Company’s credit facility would not have had a material effect on the Company’s 2005
and 2004 net income.

38 K e n n e t h C o l e P r o d u c t i o n s , I n c .
0
5
10
15
20
25
30
35
40
45
0
100
200
300
400
500
600
0.0
0.5
1.0
1.5
2.0
(in millions)to ta l ne t revenuerevenue
net income
EPS
’04’03’02’01 ’05
$518.0
$33.5>>
$1.65>>
(in millions)net income
di lu ted eps
’04’03’02’01 ’05
’04’03’02’01 ’05
>>
0
5
10
15
20
25
30
35
40
45
0
100
200
300
400
500
600
0.0
0.5
1.0
1.5
2.0
(in millions)to ta l ne t revenuerevenue
net income
EPS
’04’03’02’01 ’05
$518.0
$33.5>>
$1.65>>
(in millions)net income
di lu ted eps
’04’03’02’01 ’05
’04’03’02’01 ’05
>>
0
5
10
15
20
25
30
35
40
45
0
100
200
300
400
500
600
0.0
0.5
1.0
1.5
2.0
(in millions)to ta l ne t revenuerevenue
net income
EPS
’04’03’02’01 ’05
$518.0
$33.5>>
$1.65>>
(in millions)net income
di lu ted eps
’04’03’02’01 ’05
’04’03’02’01 ’05
>>

39K e n n e t h C o l e P r o d u c t i o n s , I n c .
Ye a r E n d e d D e c e m b e r 31, 2 0 0 5 2 0 0 4 2 0 0 3
Net sales $ 474,060,000 $ 473,438,000 $ 430,101,000
Royalty revenue 43,983,000 42,763,000 38,252,000
Net revenue 518,043,000 516,201,000 468,353,000
Cost of goods sold 283,727,000 284,817,000 258,457,000
Gross profit 234,316,000 231,384,000 209,896,000
Selling, general, and administrative expenses 188,953,000 174,519,000 157,824,000
Impairment of long-lived assets — 448,000 1,153,000
Operating income 45,363,000 56,417,000 50,919,000
Interest and other income, net 4,151,000 1,411,000 825,000
Income before provision for income taxes 49,514,000 57,828,000 51,744,000
Provision for income taxes 15,988,000 21,976,000 19,145,000
Net income $ 33,526,000 $ 35,852,000 $ 32,599,000
Earnings per share:
Basic $ 1.69 $ 1.79 $ 1.66
Diluted $ 1.65 $ 1.74 $ 1.59
Dividends declared per share $ 0.66 $ 0.52 $ 0.17
Shares used to compute earnings per share:
Basic 19,888,000 20,050,000 19,609,000
Diluted 20,318,000 20,652,000 20,486,000
See accompanying notes to consolidated financial statements.
conso l idated s ta tement s o f i n c o m e

40 K e n n e t h C o l e P r o d u c t i o n s , I n c .
D e c e m b e r 31, 2 0 0 5 2 0 0 4
Asset s
Current assets:
Cash and cash equivalents $ 63,747,000 $ 80,014,000
Marketable securities 66,400,000 40,000,000
Due from factors 33,975,000 34,936,000
Accounts receivable, less allowance for doubtful accounts
of $298,000 and $302,000, respectively 18,691,000 16,978,000
Inventories 45,465,000 47,166,000
Prepaid expenses and other current assets 6,059,000 2,664,000
Deferred taxes, net 3,340,000 3,136,000
Total current assets 237,677,000 224,894,000
Property and equipment—at cost, less accumulated
depreciation and amortization 42,975,000 38,510,000
Other assets:
Deferred taxes, net 14,832,000 9,625,000
Deposits and sundry 16,776,000 8,826,000
Deferred compensation plans assets 28,411,000 22,732,000
Total other assets 60,019,000 41,183,000
Total assets $340,671,000 $ 304,587,000
See accompanying notes to consolidated financial statements.
conso l idated b a l a n c e s h e e t s
41K e n n e t h C o l e P r o d u c t i o n s , I n c .
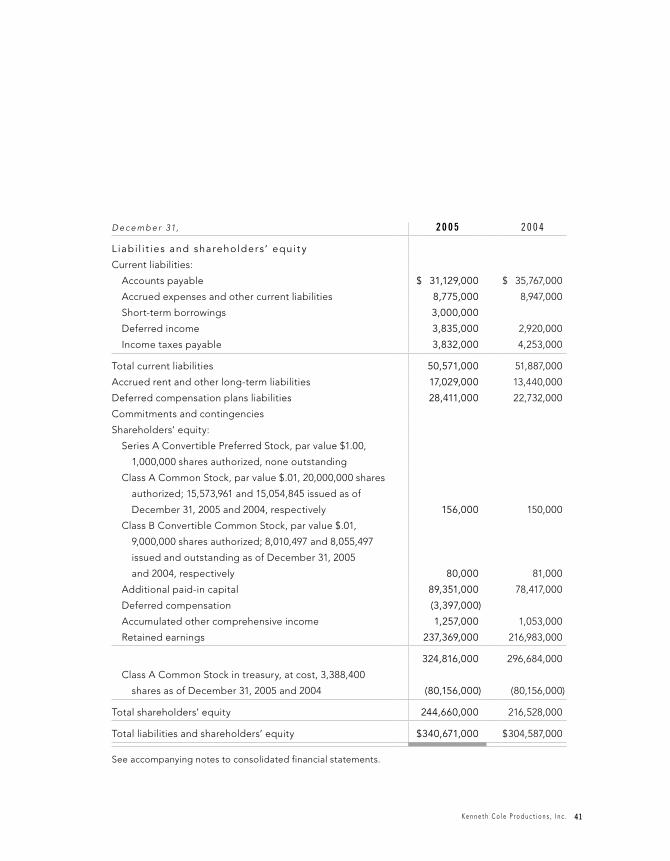
D e c e m b e r 31, 2 0 0 5 2 0 0 4
L iab i l i t ies and shareholder s’ equi t y
Current liabilities:
Accounts payable $ 31,129,000 $ 35,767,000
Accrued expenses and other current liabilities 8,775,000 8,947,000
Short-term borrowings 3,000,000
Deferred income 3,835,000 2,920,000
Income taxes payable 3,832,000 4,253,000
Total current liabilities 50,571,000 51,887,000
Accrued rent and other long-term liabilities 17,029,000 13,440,000
Deferred compensation plans liabilities 28,411,000 22,732,000
Commitments and contingencies
Shareholders’ equity:
Series A Convertible Preferred Stock, par value $1.00,
1,000,000 shares authorized, none outstanding
Class A Common Stock, par value $.01, 20,000,000 shares
authorized; 15,573,961 and 15,054,845 issued as of
December 31, 2005 and 2004, respectively 156,000 150,000
Class B Convertible Common Stock, par value $.01,
9,000,000 shares authorized; 8,010,497 and 8,055,497
issued and outstanding as of December 31, 2005
and 2004, respectively 80,000 81,000
Additional paid-in capital 89,351,000 78,417,000
Deferred compensation (3,397,000)
Accumulated other comprehensive income 1,257,000 1,053,000
Retained earnings 237,369,000 216,983,000
324,816,000 296,684,000
Class A Common Stock in treasury, at cost, 3,388,400
shares as of December 31, 2005 and 2004 (80,156,000) (80,156,000)
Total shareholders’ equity 244,660,000 216,528,000
Total liabilities and shareholders’ equity $ 340,671,000 $ 304,587,000
See accompanying notes to consolidated financial statements.

42 K e n n e t h C o l e P r o d u c t i o n s , I n c .
Class A Common Stock Class B Common StockAdditional
Paid-In Capital
Deferred Compensation
Accumulated Other
Comprehensive Income
Retained Earnings
Treasury Stock
TotalNumber of
Shares AmountNumber of Shares Amount
Number of Shares Amount
Balance at 12/31/02 13,921,817 $ 139,000 8,360,497 $ 84,000 $ 63,476,000 $ 654,000 $ 162,244,000 (2,688,400) $ (61,695,000) $ 164,902,000Net Income 32,599,000 32,599,000Translation adjustment Foreign currency, net of taxes $(69,000) (118,000) (118,000) Forward contracts, net of taxes $126,000 215,000 215,000
Comprehensive income 32,696,000
Exercise of stock options Related tax benefit $2,370,000 408,368 4,000 6,304,000 6,308,000Issuance of Class A Stock for ESPP 12,606 212,000 212,000Dividends paid on common stock (3,258,000) (3,258,000)Purchase of Class A Stock (200,000) (4,526,000) (4,526,000)Conversion of Class B to Class A Common Stock 192,000 2,000 (192,000) (2,000 )
Balance at 12/31/03 14,534,791 145,000 8,168,497 82,000 69,992,000 751,000 191,585,000 (2,888,400) (66,221,000) 196,334,000Net Income 35,852,000 35,852,000Translation adjustment Foreign currency, net of taxes $199,000 325,000 325,000 Forward contracts, net of taxes $(32,000) (53,000) (53,000) Unrealized gains on available for sale securities, net of taxes $18,000 30,000 30,000
Comprehensive income 36,154,000
Exercise of stock options Related tax benefit $3,031,000 398,113 4,000 8,204,000 8,208,000Issuance of Class A Stock for ESPP 8,941 221,000 221,000Dividends paid on common stock (10,454,000) (10,454,000)Purchase of Class A stock (500,000) (13,935,000) (13,935,000)Conversion of Class B to Class A common stock 113,000 1,000 (113,000) (1,000 )
Balance at 12/31/04 15,054,845 150,000 8,055,497 81,000 78,417,000 1,053,000 216,983,000 (3,388,400) (80,156,000) 216,528,000Net Income 33,526,000 33,526,000Translation adjustment Foreign currency, net of taxes $148,000 310,000 310,000 Forward contracts, net of taxes $(351,000) (737,000) (737,000)Unrealized gains on available for sale securities, net of taxes $301,000 631,000 631,000
Comprehensive income 33,730,000
Issuance of Restricted Stock, net of forfeitures 152,960 2,000 4,554,000 $(4,556,000)Amortization of deferred compensation 1,120,000 1,120,000Shares surrendered by employees to pay taxes on restricted stock (4,509) (134,000) (134,000)Stock-based compensation acceleration expense 100,000 39,000 139,000Exercise of options, related tax benefit $1,403,000 312,064 3,000 6,085,000 6,088,000Issuance of Class A Stock for ESPP 13,601 329,000 329,000Dividends paid on common stock (13,140,000) (13,140,000)Conversion of Class B to Class A common stock 45,000 1,000 (45,000) (1,000 )
Balance at 12/31/05 15,573,961 $ 156,000 8,010,497 $ 80,000 $ 89,351,000 $(3,397,000) $ 1,257,000 $ 237,369,000 (3,388,400) $ (80,156,000) $ 244,660,000
See accompanying notes to consolidated financial statements.
conso l idated s ta tement s o f c hang es in s h a r e h o l d e r s ’ e q u i t y

43K e n n e t h C o l e P r o d u c t i o n s , I n c .
Class A Common Stock Class B Common StockAdditional
Paid-In Capital
Deferred Compensation
Accumulated Other
Comprehensive Income
Retained Earnings
Treasury Stock
TotalNumber of
Shares AmountNumber of Shares Amount
Number of Shares Amount
Balance at 12/31/02 13,921,817 $ 139,000 8,360,497 $ 84,000 $ 63,476,000 $ 654,000 $ 162,244,000 (2,688,400) $ (61,695,000) $ 164,902,000Net Income 32,599,000 32,599,000Translation adjustment Foreign currency, net of taxes $(69,000) (118,000) (118,000) Forward contracts, net of taxes $126,000 215,000 215,000
Comprehensive income 32,696,000
Exercise of stock options Related tax benefit $2,370,000 408,368 4,000 6,304,000 6,308,000Issuance of Class A Stock for ESPP 12,606 212,000 212,000Dividends paid on common stock (3,258,000) (3,258,000)Purchase of Class A Stock (200,000) (4,526,000) (4,526,000)Conversion of Class B to Class A Common Stock 192,000 2,000 (192,000) (2,000 )
Balance at 12/31/03 14,534,791 145,000 8,168,497 82,000 69,992,000 751,000 191,585,000 (2,888,400) (66,221,000) 196,334,000Net Income 35,852,000 35,852,000Translation adjustment Foreign currency, net of taxes $199,000 325,000 325,000 Forward contracts, net of taxes $(32,000) (53,000) (53,000) Unrealized gains on available for sale securities, net of taxes $18,000 30,000 30,000
Comprehensive income 36,154,000
Exercise of stock options Related tax benefit $3,031,000 398,113 4,000 8,204,000 8,208,000Issuance of Class A Stock for ESPP 8,941 221,000 221,000Dividends paid on common stock (10,454,000) (10,454,000)Purchase of Class A stock (500,000) (13,935,000) (13,935,000)Conversion of Class B to Class A common stock 113,000 1,000 (113,000) (1,000 )
Balance at 12/31/04 15,054,845 150,000 8,055,497 81,000 78,417,000 1,053,000 216,983,000 (3,388,400) (80,156,000) 216,528,000Net Income 33,526,000 33,526,000Translation adjustment Foreign currency, net of taxes $148,000 310,000 310,000 Forward contracts, net of taxes $(351,000) (737,000) (737,000)Unrealized gains on available for sale securities, net of taxes $301,000 631,000 631,000
Comprehensive income 33,730,000
Issuance of Restricted Stock, net of forfeitures 152,960 2,000 4,554,000 $(4,556,000)Amortization of deferred compensation 1,120,000 1,120,000Shares surrendered by employees to pay taxes on restricted stock (4,509) (134,000) (134,000)Stock-based compensation acceleration expense 100,000 39,000 139,000Exercise of options, related tax benefit $1,403,000 312,064 3,000 6,085,000 6,088,000Issuance of Class A Stock for ESPP 13,601 329,000 329,000Dividends paid on common stock (13,140,000) (13,140,000)Conversion of Class B to Class A common stock 45,000 1,000 (45,000) (1,000 )
Balance at 12/31/05 15,573,961 $ 156,000 8,010,497 $ 80,000 $ 89,351,000 $(3,397,000) $ 1,257,000 $ 237,369,000 (3,388,400) $ (80,156,000) $ 244,660,000
See accompanying notes to consolidated financial statements.

4 4 K e n n e t h C o l e P r o d u c t i o n s , I n c .
Fo r t h e Ye a r s E n d e d D e c e m b e r 31, 2 0 0 5 2 0 0 4 2 0 0 3
Cash f lows f rom operat ing ac t iv i t iesNet income $ 33,526,000 $ 35,852,000 $ 32,599,000
Adjustments to reconcile net income to
net cash provided by operating activities:
Depreciation and amortization 9,400,000 7,844,000 7,604,000
Impairment of long-lived assets — 448,000 1,153,000
Unrealized gain on deferred
compensation plans (914,000) (1,127,000) (2,543,000)
Realized gain on sale of property
and equipment — (14,000) —
Realized gain on sale of marketable
securities (1,246,000) — —
Provision for doubtful accounts 294,000 227,000 262,000
Benefit for deferred taxes (5,791,000) (1,709,000) (399,000)
Tax benefit from stock options 1,403,000 3,031,000 2,370,000
Taxes related to restricted stock (134,000) — —
Unrealized gains from available-for-sale
securities (631,000) — —
Stock-based compensation expense 1,259,000 — —
Changes in operating assets and liabilities:
Decrease/(increase) in due from factors 961,000 (3,449,000) (601,000)
Increase in accounts receivable (2,007,000) (5,951,000) (3,632,000)
Decrease/(increase) in inventories 964,000 (2,368,000) (912,000)
Increase in prepaid expenses and other
current assets (3,395,000) (1,321,000) (269,000)
Increase in other assets (5,073,000) (4,404,000) (4,909,000)
(Decrease)/increase in income
taxes payable (421,000) 1,314,000 (3,301,000)
(Decrease)/increase in accounts payable (4,638,000) 1,920,000 213,000
Increase (decrease) in deferred income,
accrued expenses and other
current liabilities 1,057,000 1,044,000 (2,812,000)
Increase in other non-current liabilities 9,268,000 6,604,000 8,067,000
Net cash provided by operating activities 33,882,000 37,941,000 32,890,000
conso l idated s ta tement s o f c a s h f l o w s
45K e n n e t h C o l e P r o d u c t i o n s , I n c .
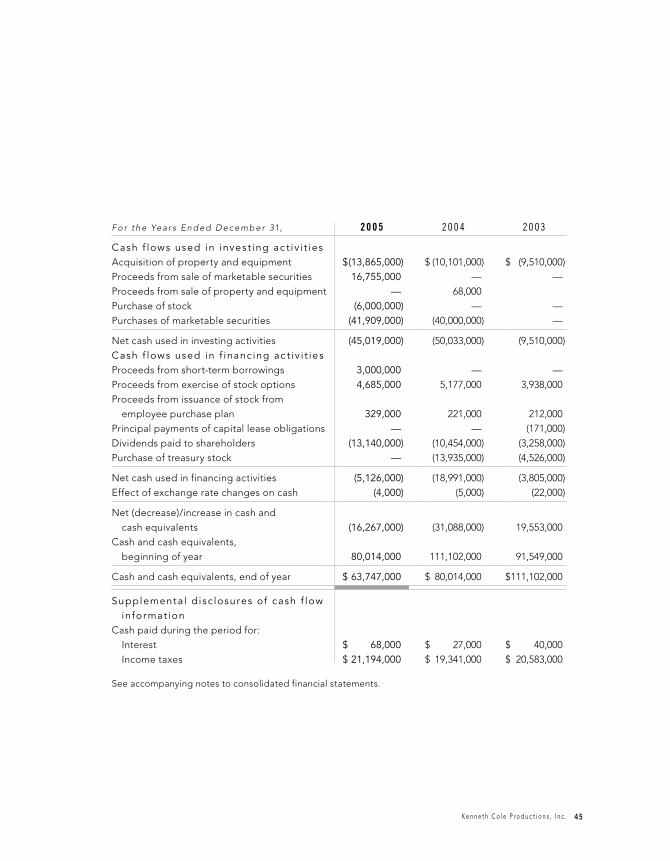
Fo r t h e Ye a r s E n d e d D e c e m b e r 31, 2 0 0 5 2 0 0 4 2 0 0 3
Cash f lows used in inves t ing ac t iv i t iesAcquisition of property and equipment $ (13,865,000) $ (10,101,000) $ (9,510,000)
Proceeds from sale of marketable securities 16,755,000 — —
Proceeds from sale of property and equipment — 68,000
Purchase of stock (6,000,000) — —
Purchases of marketable securities (41,909,000) (40,000,000) —
Net cash used in investing activities (45,019,000) (50,033,000) (9,510,000)
Cash f lows used in f inanc ing ac t iv i t iesProceeds from short-term borrowings 3,000,000 — —
Proceeds from exercise of stock options 4,685,000 5,177,000 3,938,000
Proceeds from issuance of stock from
employee purchase plan 329,000 221,000 212,000
Principal payments of capital lease obligations — — (171,000)
Dividends paid to shareholders (13,140,000) (10,454,000) (3,258,000)
Purchase of treasury stock — (13,935,000) (4,526,000)
Net cash used in financing activities (5,126,000) (18,991,000) (3,805,000)
Effect of exchange rate changes on cash (4,000) (5,000) (22,000)
Net (decrease)/increase in cash and
cash equivalents (16,267,000) (31,088,000) 19,553,000
Cash and cash equivalents,
beginning of year 80,014,000 111,102,000 91,549,000
Cash and cash equivalents, end of year $ 63,747,000 $ 80,014,000 $ 111,102,000
Supplementa l d isc losures of cash f low in format ion
Cash paid during the period for:
Interest $ 68,000 $ 27,000 $ 40,000
Income taxes $ 21,194,000 $ 19,341,000 $ 20,583,000
See accompanying notes to consolidated financial statements.

46 K e n n e t h C o l e P r o d u c t i o n s , I n c .
a S u m m a r y o f S i g n i f i c a n t A c c o u n t i n g Po l i c i e s
1 D e s c r i p t i o n o f b u s i n e s s Kenneth Cole Productions, Inc. and its subsidiaries (the
“Company”) designs, sources and markets a broad range of quality footwear and handbags, and
through license agreements, designs and markets men’s, women’s and children’s apparel and
accessories under its Kenneth Cole New York, Kenneth Cole Reaction, Unlisted, and Tribeca brands for
the fashion conscious consumer. In addition, the Company added the Bongo trademark for footwear
through a license agreement in 2003. The Company markets its products for sale to approximately
6,000 department stores and specialty store locations in the United States, as well as other locations
throughout the world, through its retail and outlet store base, and its interactive website.
The Company also distributes consumer catalogs that feature a variety of Kenneth Cole New York
and Kenneth Cole Reaction branded products.
2 P r i n c i p l e s o f c o n s o l i d a t i o n The consolidated financial statements include the
accounts of Kenneth Cole Productions, Inc. and its wholly owned subsidiaries. Intercompany
transactions and balances have been eliminated in consolidation.
3 U s e o f e s t i m a t e s The preparation of financial statements in conformity with accounting
principles generally accepted in the United States requires management to make estimates and
assumptions that affect the reported amounts of assets and liabilities and disclosure of contingent
assets and liabilities at the date of the financial statements, as well as the reported amounts of
revenues and expenses during the reporting period. Actual results could differ from those estimates.
4 C a s h a n d c a s h e q u i v a l e n t s The Company considers all highly liquid investments
with an original maturity of three months or less at the time of purchase to be cash equivalents.
5 M a r k e t a b l e s e c u r i t i e s In 2004, the Company began investing in auction rate
securities, debt securities backed by student loans, and which have maturity dates ranging from
approximately 2023 to 2038. The Company accounts for these investments as marketable securities,
and has classified them as available-for-sale securities under SFAS 115 “Accounting for Certain
Investments in Debt and Equity Securities” (“SFAS 115”). They are recorded at fair value, and are
reset every 7 to 35 days, and repurchased based on the Company’s cash needs. The purchase of
these securities is included in the accompanying Statement of Cash Flows as an investing activity.
n o t e s to conso l idated f inanc ia l s ta tement s

47K e n n e t h C o l e P r o d u c t i o n s , I n c .
6 I n v e n t o r i e s Inventories, which consist of finished goods, are stated at the lower of
cost or fair market value. Cost is determined by the first-in, first-out method.
7 P r o p e r t y a n d e q u i p m e n t Property and equipment are stated at cost less accumulated
depreciation and amortization. Depreciation and amortization is computed using the estimated
useful lives of the related assets ranging from three to seven years on a straight-line basis. Leasehold
improvements are amortized using the straight-line method over the term of the related lease or the
estimated useful life, whichever is less.
The Company reviews long-lived assets for possible impairment whenever events or changes in
circumstances indicate that the carrying amount of an asset may not be recoverable as measured by
comparing the undiscounted future cash flows to the asset’s net book value. Impaired assets are
recorded at the lesser of their carrying value or fair value.
8 I n c o m e t a x e s Income taxes are accounted for in accordance with SFAS No. 109,
“Accounting for Income Taxes.” Deferred income taxes reflect the net tax effects of temporary
differences between the carrying amounts of assets and liabilities for financial reporting purposes
and the amounts used for income tax purposes.
9 R e v e n u e r e c o g n i t i o n Wholesale revenues are recognized upon shipment of products
to customers since title passes upon shipment. Retail and outlet store revenues are recognized at
the time of sale. Both wholesale and retail store revenues are shown net of returns, discounts, and
other allowances. Reserves for estimated returns and allowances for discounts are provided when
sales are recorded. The Company has also entered into various trade name license agreements
that provide revenues based on minimum royalties and additional revenues based on percentage
of defined sales. Minimum royalty revenue is recognized on a straight-line basis over each period,
as defined in each license agreement. In circumstances whereby licensee sales exceed the
quarterly contractual minimums, but not the annual minimums, royalty contributions are deferred
on the balance sheet. As the licensee sales exceed the annual contractual minimums, the royalty
contributions are recognized.

48 K e n n e t h C o l e P r o d u c t i o n s , I n c .
10 A d v e r t i s i n g c o s t s The Company incurred advertising costs, including certain in-house
marketing expenses of $21.8 million, $20.0 million, and $16.8 million for the years ended December 31,
2005, 2004 and 2003, respectively. Advertising costs are expensed as incurred and are included in
Selling, General, and Administrative expenses in the accompanying Consolidated Statement of Income.
Included in advertising expenses are costs associated with cooperative advertising programs, under
which the Company generally shares the cost of a customer’s advertising expenditures.
In addition, licensee contributions toward advertising are recognized when licensed products are
sold by the Company’s licensees. Such contributions are based on contractual percentages of sales
and contain minimums. For licensees whose sales are not expected to exceed contractual sales
minimums, contributions relating to advertising are recognized based on the contractual minimums.
In circumstances whereby licensee sales exceed the quarterly contractual minimums, but not
the annual minimums, such contributions toward advertising are deferred on the balance sheet. As
the licensee sales exceed the annual contractual minimums, the licensee contributions toward
advertising are recognized.
11 S t o c k - b a s e d c o m p e n s a t i o n The Company measures compensation expense for its
stock-based compensation plans using the intrinsic value method prescribed in Accounting
Principles Board Opinion No. 25, “Accounting for Stock Issued to Employees” (“APB No. 25”)
and related Interpretations. The Company has adopted disclosure only provisions of Statement of
Financial Accounting Standards No. 123, “Accounting for Stock-Based Compensation” (“SFAS 123”).
Pro forma disclosures, as required by Statement of Financial Accounting Standard No. 148,
“Accounting for Stock-Based Compensation—Transition and Disclosure,” are computed as if the
n o t e s to conso l idated f inanc ia l s ta tement s

49K e n n e t h C o l e P r o d u c t i o n s , I n c .
Company recorded compensation expense based on the fair value for stock-based awards or grants.
The following pro forma information includes the effects of the options discussed above.
Ye a r E n d e d D e c e m b e r 31, 2 0 0 5 2 0 0 4 2 0 0 3
Net Income, as reported $ 33,526,000 $ 35,852,000 $ 32,599,000
Add: Stock-based compensation, related to restricted
stock, included in reported net income, net of related
tax effect 852,000 — —
Deduct: Stock-based employee compensation expense
determined under fair value method, net of related
tax effects (7,318,000) (3,429,000) (2,855,000)
Pro forma net income $ 27,060,000 $ 32,423,000 $ 29,744,000
Earnings per share:
Basic—as reported $ 1.69 $ 1.79 $ 1.66
Basic—pro forma $ 1.36 $ 1.62 $ 1.52
Diluted—as reported $ 1.65 $ 1.74 $ 1.59
Diluted—pro forma $ 1.33 $ 1.57 $ 1.45
The effects of applying SFAS 123 on this pro forma disclosure may not be indicative of future results,
and additional awards in future years may or may not be granted. (See Note k.)
12 D e r i v a t i v e i n s t r u m e n t s a n d h e d g i n g a c t i v i t i e s The Company uses derivative
instruments, typically forward contracts, to manage its risk associated with movements in the Euro
exchange rates in purchasing inventory. In accordance with SFAS No. 133 “Accounting for Derivative
Instruments and Hedge Activities” (“SFAS 133”), the Company recognizes all derivatives on the
Balance Sheet. Also, derivative instruments that meet certain criteria in SFAS 133 are classified as
cash flow hedges, and changes in fair value are recognized in Other Comprehensive Income, in the
accompanying Statement of Changes in Shareholders’ Equity, until the underlying transaction is
completed and the derivative is settled. Upon settlement, any amounts remaining in Other
Comprehensive Income are reclassified to earnings. Those derivatives that are not classified as cash
flow hedges are adjusted to fair value through earnings. The Company does not hold derivative
instruments for the purpose of trading or speculation, and designated all hedges as cash flow
hedges in 2005. (See Note f.)

50 K e n n e t h C o l e P r o d u c t i o n s , I n c .
13 S h i p p i n g a n d h a n d l i n g c o s t s The Company includes amounts billed to customers
for shipping costs in net sales. The related internal and external shipping and handling costs
incurred by the Company are included in the Cost of Goods Sold line item in the accompanying
Consolidated Statements of Income. Such costs include inbound freight costs, purchasing costs,
inspection costs, internal transfer costs, and other product procurement related charges.
14 C o s t o f g o o d s s o l d a n d s e l l i n g , g e n e r a l a n d a d m i n i s t r a t i v e e x p e n s e s
Costs associated with the production and procurement of product are included in the Cost
of Goods Sold line item in the accompanying Consolidated Statements of Income, including
inbound freight costs, purchasing costs, inspection costs, and other product procurement related
charges. All other expenses, excluding interest and income taxes, are included in selling, general,
and administrative expenses, including receiving, warehousing, and distribution expenses, as the
predominant expenses associated therewith, are general and administrative in nature.
15 R e s e a r c h a n d d e v e l o p m e n t c o s t s The Company does not incur research and
development costs.
b E a r n i n g s Pe r S h a r e
The Company calculates earnings per share in accordance with SFAS No. 128, “Earnings Per Share.”
Basic earnings per share are calculated by dividing net income by weighted-average common shares
outstanding. Diluted earnings per share are calculated similarly, except that it includes the dilutive
effect of the assumed exercise of securities under the Company’s stock incentive plans.
Dilutive securities, which include stock options, are determined under the treasury stock method
by calculating the assumed proceeds available to repurchase stock using the weighted-average
shares outstanding for the period. Stock options amounting to 946,000, 916,000, and 376,000 as of
December 31, 2005, 2004, and 2003, respectively, have been excluded from the diluted per share
calculations, since their effect would be antidilutive.
n o t e s to conso l idated f inanc ia l s ta tement s
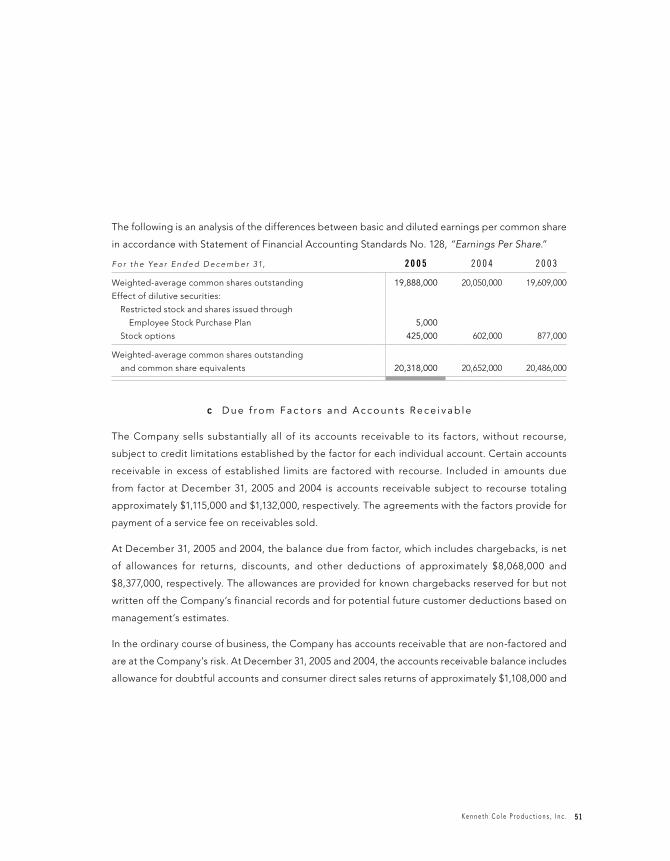
51K e n n e t h C o l e P r o d u c t i o n s , I n c .
The following is an analysis of the differences between basic and diluted earnings per common share
in accordance with Statement of Financial Accounting Standards No. 128, “Earnings Per Share.”
Fo r t h e Ye a r E n d e d D e c e m b e r 31, 2 0 0 5 2 0 0 4 2 0 0 3
Weighted-average common shares outstanding 19,888,000 20,050,000 19,609,000
Effect of dilutive securities:
Restricted stock and shares issued through
Employee Stock Purchase Plan 5,000
Stock options 425,000 602,000 877,000
Weighted-average common shares outstanding
and common share equivalents 20,318,000 20,652,000 20,486,000
c D u e f r o m Fa c t o r s a n d A c c o u n t s R e c e i v a b l e
The Company sells substantially all of its accounts receivable to its factors, without recourse,
subject to credit limitations established by the factor for each individual account. Certain accounts
receivable in excess of established limits are factored with recourse. Included in amounts due
from factor at December 31, 2005 and 2004 is accounts receivable subject to recourse totaling
approximately $1,115,000 and $1,132,000, respectively. The agreements with the factors provide for
payment of a service fee on receivables sold.
At December 31, 2005 and 2004, the balance due from factor, which includes chargebacks, is net
of allowances for returns, discounts, and other deductions of approximately $8,068,000 and
$8,377,000, respectively. The allowances are provided for known chargebacks reserved for but not
written off the Company’s financial records and for potential future customer deductions based on
management’s estimates.
In the ordinary course of business, the Company has accounts receivable that are non-factored and
are at the Company’s risk. At December 31, 2005 and 2004, the accounts receivable balance includes
allowance for doubtful accounts and consumer direct sales returns of approximately $1,108,000 and

52 K e n n e t h C o l e P r o d u c t i o n s , I n c .
$1,002,000. These customers include non-factored accounts and credit card receivables from third-
party service providers. The allowances provided for sales returns are for potential future retail
customer merchandise returns based on management’s estimates. The allowance for doubtful
accounts is provided for estimated losses resulting from the inability of its customers to make
required payments.
d P r o p e r t y a n d Eq u i p m e n t
Property and equipment consist of the following:
Decem ber 31, 2 0 0 5 2 0 0 4
Property and equipment—at cost:
Furniture and fixtures $ 27,871,000 $ 24,861,000
Machinery and equipment 17,473,000 14,311,000
Leasehold improvements 50,212,000 44,661,000
Leased equipment under capital lease — 967,000
95,556,000 84,800,000
Less accumulated depreciation 52,581,000 46,290,000
Net property and equipment $ 42,975,000 $ 38,510,000
e I m p a i r m e n t o f L o n g - L i ve d A s s e t s
In 2004 and 2003, the Company recorded non-cash asset impairment charges of $448,000 and
$1,153,000, respectively. Management reviews its retail stores’ estimated undiscounted future cash
flows and determines whether or not a write-down to current value is required. The impairment
charges related to stores’ leasehold improvements, and furniture and fixtures, and were separately
disclosed in the accompanying Consolidated Statement of Income.
n o t e s to conso l idated f inanc ia l s ta tement s

53K e n n e t h C o l e P r o d u c t i o n s , I n c .
f F o r e i g n C u r r e n c y Tr a n s a c t i o n s , D e r i v a t i ve I n s t r u m e n t s a n d H e d g i n g A c t i v i t i e s
The Company, in the normal course of business, routinely enters into forward contracts in
anticipation of future purchases of inventory denominated in foreign currencies. These forward
contracts are used to hedge against the Company’s exposure to changes in Euro exchange rates to
protect the purchase price of merchandise under such commitments. The Company has classified
these contracts as Cash Flow Hedges under SFAS 133. The Company had forward contracts of
$7,000,000, $24,000,000, and $9,500,000 at December 31, 2005, 2004 and 2003, respectively. At
December 31, 2005, forward contracts have maturity dates through May 2006.
All terms and conditions of the forward contracts are included in the measurement of the related
hedge effectiveness. The critical terms of the forward contracts are the same as the underlying
forecasted transactions; therefore changes in the fair value of the contracts should be highly
effective in offsetting changes in the expected cash flows from the forecasted transactions.
No gains or losses related to ineffectiveness of cash flow hedges were recognized in earnings
during 2005, 2004, and 2003. At December 31, 2005, the Company’s notional $7,000,000 in forward
exchange contracts resulted in an unrealized loss of approximately $184,000, net of taxes, which is
included in Accumulated Other Comprehensive Income in the Statement of Changes in Shareholders’
Equity and a decrease to inventory, which is the underlying exposure on the Consolidated Balance
Sheet. The Company expects to reclassify all of the unrealized loss from Other Comprehensive
Income into earnings within the next five-month period due to the actual executions of forward
contracts to purchase merchandise and the Company’s ultimate sale of that merchandise.
g S e g m e n t R e p o r t i n g
Kenneth Cole Productions, Inc. has three reportable segments: Wholesale, Consumer Direct, and
Licensing. The Wholesale segment designs and sources a broad range of fashion footwear, handbags
and accessories and markets its products for sale to approximately 6,000 department and specialty
store locations and to the Company’s Consumer Direct segment. The Consumer Direct segment

54 K e n n e t h C o l e P r o d u c t i o n s , I n c .
markets a broad selection of the Company’s branded products, including licensee products, for sale
directly to the consumer through its own channels of distribution, which include full price retail
stores, outlet stores, catalogs, and e-commerce (at website addresses www.kennethcole.com and
www.kennethcolereaction.com). The Licensing segment, through third-party licensee agreements, has
evolved the Company from a footwear resource to a diverse lifestyle brand competing effectively in
approximately 30 apparel and accessories categories for both men and women. The Company
maintains control over quality, image and distribution of the licensees. This segment primarily
consists of royalties earned on licensee sales to third parties of the Company’s branded products
and royalties earned on the purchase and sale to foreign retailers, distributors, or to consumers in
foreign countries.
The Company’s reportable segments are business units that offer products to overlapping consumers
through different channels of distribution. Each segment is managed separately, although planning,
implementation and results are reviewed internally by the executive management committee. The
Company evaluates performance and allocates resources based on profit or loss from each segment.
The Wholesale segment is evaluated on income from operations before income taxes. The Consumer
Direct segment is evaluated on profit or loss from operations before unallocated corporate
overhead and income taxes. The Licensing segment is evaluated based on royalties earned and
pretax segment profit. The accounting policies of the reportable segments are the same as those
described in the Summary of Significant Accounting Policies. Intersegment sales between the
Wholesale and Consumer Direct segment include a markup, which is eliminated in consolidation.
n o t e s to conso l idated f inanc ia l s ta tement s

55K e n n e t h C o l e P r o d u c t i o n s , I n c .
Financial information of the Company’s reportable segments is as follows (dollars in thousands):
Wholesale
Consumer
Direct Licensing Totals
Year Ended December 31, 20 05
Revenues $ 283,991 $ 190,069 $ 43,983 $ 518,043
Intersegment revenues 38,932 38,932
Interest income, net 4,151 4,151
Depreciation expense 3,059 6,333 8 9,400
Segment income (1)(2) 27,291 6,763 35,974 70,028
Segment assets 272,848 57,657 13,157 343,662
Expenditures for long-lived assets 3,048 10,817 13,865
Year Ended December 31, 20 04
Revenues $ 279,440 $ 193,998 $ 42,763 $ 516,201
Intersegment revenues 35,133 35,133
Interest income, net 1,411 1,411
Depreciation expense 2,745 5,087 12 7,844
Impairment of long-lived assets 448 448
Segment income (1)(3) 29,135 12,232 35,454 76,821
Segment assets 249,226 49,929 8,190 307,345
Expenditures for long-lived assets 3,150 6,949 2 10,101
Year Ended December 31, 20 03
Revenues $ 254,524 $ 175,577 $ 38,252 $ 468,353
Intersegment revenues 32,671 32,671
Interest income, net 825 825
Depreciation expense 2,698 4,893 13 7,604
Impairment of long-lived assets 1,153 1,153
Segment income (1) 30,644 6,843 31,556 69,043
Segment assets 219,111 48,454 8,414 275,979
Expenditures for long-lived assets 4,924 4,584 2 9,510
(1) Before elimination of intersegment profit, unallocated corporate overhead and provision for income taxes.(2) Segment income for the Wholesale segment includes one-time payment of $.8 million for severance.(3) Segment income for the Wholesale segment includes one-time payment of $1.1 million for costs associated with the
Company’s transfer to a third-party distribution center.

56 K e n n e t h C o l e P r o d u c t i o n s , I n c .
The reconciliation of the Company’s reportable segment revenues, profit and loss, and assets are as
follows (dollars in thousands):
2 0 0 5 2 0 0 4 2 0 0 3
Revenues
Revenues for reportable segments $ 518,043 $516,201 $ 468,353
Intersegment revenues for reportable segments 38,932 35,133 32,671
Elimination of intersegment revenues (38,932) (35,133) (32,671)
Total consolidated revenues $ 518,043 $516,201 $ 468,353
I ncome
Total profit for reportable segments $ 70,028 $ 76,821 $ 69,043
Elimination of intersegment profit (11,005) (9,303) (8,524)
Unallocated corporate overhead (9,509) (9,690) (8,775)
Total income before provision for income taxes $ 49,514 $ 57,828 $ 51,744
A sset s
Total assets for reportable segments $ 343,662 $ 307,345 $ 275,979
Elimination of inventory profit in consolidation (2,991) (2,758) (2,138)
Total consolidated assets $ 340,671 $ 304,587 $ 273,841
Revenues from international customers were approximately 2.4%, 1.9%, and 1.0% of the Company’s
consolidated revenues for the years ended December 31, 2005, 2004, and 2003, respectively.
h A c c r u e d E x p e n s e s a n d O t h e r L i a b i l i t i e s
Accrued expenses and other current liabilities consist of the following:
D e c e m b e r 31, 2 0 0 5 2 0 0 4
Rent $ 723,000 $ 448,000
Compensation 4,268,000 5,454,000
Customer credits 2,020,000 1,989,000
Other 1,764,000 1,056,000
$ 8,775,000 $ 8,947,000
n o t e s to conso l idated f inanc ia l s ta tement s

57K e n n e t h C o l e P r o d u c t i o n s , I n c .
i S h o r t - t e r m B o r r o w i n g s
In 2005, one of the Company’s foreign subsidiaries entered into a promissory note with a financial
institution, which provided the foreign subsidiary with $3,000,000. The note is due in September
2006. Interest is payable monthly at an annual rate equal to the greater of the prime rate in effect on
such date or the Federal Funds Rate in effect on such date plus .50%. The agreement contains a
number of customary covenants and events of default. Upon the occurrence of an event of default, all
borrowings and accrued interest shall become immediately due and payable. At December 31, 2005,
the subsidiary was in compliance with all covenants. The carrying value of the loan approximates fair
market value.
In addition, the Company entered into a Cash Collateral Pledge Agreement, for $3,000,000, with a
financial institution, which serves as collateral on the loan to the foreign subsidiary. The collateral
will be released to the Company at the time that the promissory note is settled with the financial
institution, and is included in Prepaid Expenses and Other Current Assets in the accompanying
Consolidated Balance Sheet.
j B e n e f i t P l a n s
1 4 0 1 ( k ) P l a n The Company’s 401(k) profit-sharing plan covers all non-union employees,
subject to certain minimum age and length of service requirements who are permitted to contribute
specified percentages of their salary up to the maximum permitted by the Internal Revenue Service.
The Company is obligated to make a matching contribution and may make an additional discretionary
contribution, as defined. Contributions to the plan for the years ended December 31, 2005, 2004
and 2003 were approximately $487,000, $395,000, and $268,000, respectively.
2 D e f e r r e d c o m p e n s a t i o n p l a n s The Kenneth Cole Productions, Inc. Deferred
Compensation Plans are non-qualified plans maintained primarily to provide deferred compensation
benefits for the Company’s Chief Executive Officer, as well as a select group of “highly compensated
employees,” which includes certain Company management. The Company accounts for the investments
in the deferred compensation plans as trading securities in accordance with SFAS 115. The amounts,
deferred at the election of the employee, are invested based upon various asset alternatives. The

58 K e n n e t h C o l e P r o d u c t i o n s , I n c .
assets are included in Deferred compensation plan assets, and the related liability is included in
Deferred compensation plan liabilities.
In 2005, 2004 and 2003, the Company deposited $1,215,000, $1,516,000, and $247,000, respectively,
into Supplemental Executive Retirement Plans (“SERP”) for certain key executives. The amounts
have been recorded in Deposits and Sundry in the accompanying Consolidated Balance Sheets.
These plans are non-qualified deferred compensation plans. Benefits payable under these plans are
based upon the performance of the individual directed investments from the Company’s cumulative
and future contributions. Benefits earned under the SERP begin vesting after 3 years from issuance,
and become 60% vested after 9 years of service, 75% vested upon the participant retiring at age 60
or later and 100% vested if the employee dies while in the Company’s employment. The value of
these investments at December 31, 2005 and 2004 were $5,818,000 and $5,206,000, respectively,
which the Company accounts for as trading securities in accordance with SFAS 115. The unrealized
gains and losses on the investments were recorded in Selling, General and Administrative Expenses
in the accompanying Consolidated Statements of Income. In addition, the Company has recorded
an accumulated long-term vested benefit obligation of approximately $2,377,000 and $1,814,000 at
December 31, 2005 and 2004, respectively, within Accrued Rent and Other Long-Term liabilities in
the accompanying Consolidated Balance Sheets. In addition, SERP participants are covered by life
insurance through a portion of the Company’s contribution.
3 E m p l o y e e S t o c k P u r c h a s e P l a n During 2000, the Company established a qualified
employee stock purchase plan (“ESPP”), the terms of which allow for qualified employees (as
defined) to participate in the purchase of designated shares of the Company’s Class A Common
Stock at a price equal to 85% of the lower of the closing price at the beginning or end of each
quarterly stock purchase period. For the years ended December 31, 2005, 2004, and 2003,
employees purchased 13,601, 8,941, and 12,606 shares, respectively. Total shares purchased through
December 31, 2005 were 76,555.
k S t o c k- B a s e d C o m p e n s a t i o n
The Company’s 2004 Incentive Stock Option Plan (the “Plan”), authorizes the grant of options to
employees for up to 5,320,162 shares of the Company’s Class A Common Stock. The Company
n o t e s to conso l idated f inanc ia l s ta tement s

59K e n n e t h C o l e P r o d u c t i o n s , I n c .
amended the Plan in 2005 and authorized an additional 1,000,000 shares. Certain options granted
under the Plan vest in one-third increments in each of the first, second and third years following the
date of grant, while certain other options vest over five years. Options granted under the “Plan”
have ten-year terms. Non-employee Director stock options granted have ten-year terms and vest 50%
on the first anniversary of the date of grant and become fully exercisable at the end of two years.
In 2005, the Company accelerated the vesting of 250,000 “out-of-the-money” stock options held by
Kenneth D. Cole. These options were originally granted on August 4, 2004 and would have vested
ratably in annual installments on the next three anniversaries of the date of grant. The per share
exercise price for these options was $32.09, which was above the $30.34 fair market value of the
Company’s Class A common stock on the date of acceleration. The purpose of the acceleration was
to eliminate future compensation expense recognition the Company would otherwise have been
required to recognize with respect to these accelerated options once Statement of Financial
Accounting Standards No. 123R “Share-Based Payment” (“SFAS 123R”) becomes effective in January
2006. The estimated future expense recognition that was eliminated was approximately $2,115,000.
The acceleration of these options did not trigger an expense for accounting purposes, as the stock
options had no intrinsic value at the date of acceleration.
Also in 2005, the Company accelerated the vesting of 224,500 stock options held by various
employees. These options were originally granted on July 1, 2004 and would have vested ratably in
annual installments on the next two anniversaries of the date of grant. The per share exercise price
for these options was $34.27, which was above the $25.50 fair market value of the Company’s
Class A common stock on the date of acceleration. The estimated future expense recognition
that was eliminated was approximately $1,400,000. The acceleration of these options did not
trigger an expense for accounting purposes, as the stock options had no intrinsic value at the date
of acceleration.
In 2005, the Company granted 152,960 Class A common shares of restricted stock to selected
employees, net of 5,084 of forfeited shares, which had a fair value of $4,556,000 on the grant dates.
The shares have graded vesting periods of up to four years. The Company has recorded the total
compensation expense as Deferred Compensation in the Condensed Consolidated Statement
of Changes in Shareholders’ Equity, and recognized $1,259,000 ($852,000 net of related taxes) of

60 K e n n e t h C o l e P r o d u c t i o n s , I n c .
compensation expense in the Condensed Consolidated Statement of Income for the year ended
December 31, 2005, which represents the amortization of the original deferred compensation on a
straight-line basis over the vesting period. Included in the compensation expense is approximately
$139,000, net of taxes, related to the expenses incurred upon termination of one of the Company’s
senior executives. The weighted-average grant-date fair value of the nonvested shares as of
December 31, 2005 was $4,265,000.
The following table summarizes information about currently outstanding and exercisable stock
options at December 31, 2005:
Outstanding Stock Options Exercisable Stock Options
Range of Exercise Prices
Outstanding Shares
Weighted- Average
Remaining Contractual Life
Weighted- Average Exercise
PriceExercisable
Shares
Weighted- Average Exercise
Price
$ 4.00 to $12.00 192,356 1.79 $ 11.36 192,356 $ 11.36
$12.01 to $24.00 1,156,996 5.49 $ 18.68 715,830 $ 24.47
$24.01 to $36.00 1,251,365 6.43 $ 30.11 1,064,116 $ 31.69
The following table summarizes all stock option transactions from December 31, 2002 through
December 31, 2005.
SharesWeighted-Average
Exercise Price
Outstanding at December 31, 2002 2,631,980 $ 17.44
Granted 657,500 $ 23.33
Exercised (316,216) $ 11.68
Forfeited (41,929) $ 19.87
Outstanding at December 31, 2003 2,931,335 $ 19.36
Granted 574,900 $ 32.97
Exercised (398,113) $ 12.97
Forfeited (159,186) $ 22.20
Outstanding at December 31, 2004 2,948,936 $ 22.71
Granted 46,667 $ 29.28
Exercised (312,064) $ 15.01
Forfeited (82,822) $ 26.31
Outstanding at December 31, 2005 2,600,717 $ 23.64
n o t e s to conso l idated f inanc ia l s ta tement s

61K e n n e t h C o l e P r o d u c t i o n s , I n c .
The fair value for these options was estimated at the date of grant using a Black-Scholes option pricing
model with the following weighted-average assumptions for 2005, 2004 and 2003, respectively:
risk-free interest rate of 4.1%, 3.2% and 4.0%; expected volatility factors of 49.1%, 59.7% and 64.5%
and expected lives of 7.6, 5.2 and 5.0 years. Dividend yield assumptions were 2.19%, 1.68% and
1.38% for 2005, 2004 and 2003, respectively. The weighted-average fair value of options granted
during 2005, 2004 and 2003 were $13.14, $15.63 and $14.48, respectively.
The Black-Scholes option valuation model was developed for use in estimating the fair value of
traded options, which have no vesting restrictions and are fully transferable. In addition, option
valuation models require the input of highly subjective assumptions including the expected stock price
volatility. As a result of the Company’s employee stock options having characteristics significantly
different from those of traded options, and because changes in the subjective input assumptions
can materially affect the fair value estimate, in management’s opinion, the existing models do not
necessarily provide a reliable single measure of the fair value of its employee stock options.
l I n c o m e Ta xe s
In 2004, Internal Revenue Code Section 965 was enacted, as part of the American Jobs Creation
Act. This is a temporary provision that allows U.S. companies to repatriate earnings from their
foreign subsidiaries at a reduced tax rate provided that specified conditions and restrictions are
satisfied. In addition, FASB Staff Position FAS 109-2 was issued to provide accounting and disclosure
guidance relating to the repatriation provision. In 2005, the Company’s Board of Directors approved
and adopted a repatriation plan and, as such, the Company repatriated $12.5 million of unremitted
foreign earnings, which resulted in a tax benefit of approximately $3.0 million for the year ended
December 31, 2005, as a result of the Company providing for taxes for the foreign earnings at
the prior statutory rate. The Company borrowed $3 million through its foreign subsidiary to fund a
portion of these remittances. (See Note i.)
The components of income before provision for income taxes are as follows:
Ye a r s E n d e d D e c e m b e r 31, 2 0 0 5 2 0 0 4 2 0 0 3
Domestic $ 45,341,000 $ 54,460,000 $ 51,063,000
International 4,173,000 3,368,000 681,000
$ 49,514,000 $ 57,828,000 $ 51,744,000

62 K e n n e t h C o l e P r o d u c t i o n s , I n c .
Significant items comprising the Company’s deferred tax assets and liabilities are as follows:
D e c e m b e r 31, 2 0 0 5 2 0 0 4
Deferred tax assets:
Inventory allowances and capitalization $ 1,927,000 $ 2,105,000
Allowance for doubtful accounts and sales allowances 940,000 1,031,000
Deferred rent 4,449,000 4,379,000
Deferred compensation 10,137,000 8,406,000
Asset impairment 1,835,000 1,879,000
Deferred income—licensing agreements 791,000 493,000
Other 511,000 38,000
$ 20,590,000 $ 18,331,000
Deferred tax liabilities:
Depreciation (1,662,000) (2,680,000)
Tax effect on unrealized gains on available-for-sale securities (381,000) —
Undistributed foreign earnings (375,000) (2,890,000)
(2,418,000) (5,570,000)
Net deferred tax assets $ 18,172,000 $ 12,761,000
The provision (benefit) for income taxes consists of the following:
D e c e m b e r 31, 2 0 0 5 2 0 0 4 2 0 0 3
Current:
Federal $ 19,477,000 $ 21,005,000 $ 16,816,000
State and local 1,882,000 2,483,000 2,587,000
Foreign 420,000 197,000 141,000
21,779,000 23,685,000 19,544,000
Deferred:
Federal (5,486,000) (1,574,000) (368,000)
State and local (305,000) (135,000) (31,000)
(5,791,000) (1,709,000) (399,000)
$ 15,988,000 $ 21,976,000 $ 19,145,000
n o t e s to conso l idated f inanc ia l s ta tement s

63K e n n e t h C o l e P r o d u c t i o n s , I n c .
The reconciliation of income tax computed at the U.S. federal statutory tax rate to the effective
income tax rate for 2005, 2004 and 2003 is as follows:
2 0 0 5 2 0 0 4 2 0 0 3
Federal income tax at statutory rate 35.0% 35.0% 35.0%
State and local taxes, net of federal tax benefit 3.0% 3.0% 2.0%
Repatriation benefit (5.7)%
32.3% 38.0% 37.0%
m C o m mi t m e n t s a n d C o n t i n g e n c i e s
1 O p e r a t i n g l e a s e s a n d o t h e r p r o p e r t y a g r e e m e n t s The Company leases office,
retail and warehouse facilities under non-cancelable operating leases between 5 and 20 years with
options to renew at varying terms. Future minimum lease payments for non-cancelable leases with
initial terms of one year or more consisted of the following at December 31, 2005:
2006 $ 27,713,000
2007 27,333,000
2008 26,828,000
2009 25,463,000
2010 23,527,000
Thereafter 84,623,000
Total minimum cash payments $ 215,487,000
In addition, certain of these leases contain rent escalation provisions and require additional
percentage rent payments to be made. Step rent provisions and escalation clauses are taken into
account in computing the minimum lease payments, recognized on a straight-line basis over the
minimum lease term. The Company may also receive capital improvement funding from landlords,
primarily as an incentive for the Company to lease retail and outlet store space from the landlords.
Such amounts are amortized as a reduction of rent expense over the life of the related lease.

64 K e n n e t h C o l e P r o d u c t i o n s , I n c .
Rent expense is as follows:
Fo r t h e Ye a r s E n d e d D e c e m b e r 31, 2 0 0 5 2 0 0 4 2 0 0 3
Minimum Rent $ 27,711,000 $ 24,340,000 $ 23,173,000
Contingent Rent and other 6,413,000 7,530,000 7,995,000
Total Rent Expense $ 34,124,000 $ 31,870,000 $ 31,168,000
Sub-tenants rental income for 2005, 2004, and 2003 was $849,000, $1,073,000, and $1,225,000,
respectively. Future minimum rental income from sub-tenants is $849,000 for 2006. Future minimum
rental income from sub-tenants does not include rent escalation and other charges that are
subsequently passed through to the sub-tenant.
In 2004, the Company entered into an agreement to purchase the office building that it is currently
leasing for its New York City worldwide headquarters for approximately $24 million. The contracted
closing date is May 2006. The specific timing of an earlier closing date can be determined by
the parties, based on the ability of the current landlord to satisfy certain terms and conditions of
the agreement.
Also in 2004, the Company entered into a new 10-year lease for 51,000 square feet in Secaucus,
New Jersey for its administrative offices and completed the move in June 2004. In 2004, the
distribution facility was moved to a third-party public warehouse and distribution center in New Jersey.
In addition to these two leases, the Company also leases a 23,500 square foot facility in Secaucus
used for outlet store space as well as an additional distribution warehousing facility. The Company
also has a technical and administrative office in Florence, Italy, and signed a lease for a similar office
in China in November 2005. The Company does not own or operate any manufacturing facilities.
The Company leases space for all of its 53 specialty retail stores (aggregating approximately 243,000
square feet) and 39 outlet stores (aggregating approximately 200,000 square feet). Generally, the
leases provide for an initial term of five to ten years and certain leases provide for renewal options
permitting the Company to extend the term thereafter.
n o t e s to conso l idated f inanc ia l s ta tement s

65K e n n e t h C o l e P r o d u c t i o n s , I n c .
2 L e t t e r s o f c r e d i t The Company was not contingently liable for any open letters of
credit as of December 31, 2005, and was contingently liable for $91,000 of open letters of credit as
of December 31, 2004. In addition, at December 31, 2005 and 2004, the Company was contingently
liable for approximately $6,679,000 and $6,576,000 of standby letters of credit, respectively.
3 C o n c e n t r a t i o n s In the normal course of business, the Company sells to major
department stores and specialty retailers and believes that its broad customer base will mitigate the
impact that financial difficulties of any such retailers might have on the Company’s operations. The
Company had no customer account for more than 10% of consolidated net sales for the years ended
December 31, 2005, 2004, and 2003.
The Company sources each of its product lines separately, based on the individual design, styling
and quality specifications of such products. The Company primarily sources its products directly
or indirectly through manufacturers in Italy, Spain, Brazil, and China. However, approximately
46% and 42% of total handbag purchases came from two manufacturers in China during the
years ended December 31, 2005 and 2004, respectively. Approximately 21% of Kenneth Cole and
Kenneth Cole Reaction men’s footwear purchases were from one manufacturer in China during
the year ended December 31, 2005, and approximately 37% of those purchases were from one
manufacturer in Italy utilizing many different factories during the year ended December 31, 2004.
Also, approximately 32% of Kenneth Cole ladies’ footwear was purchased from one Brazilian
manufacturer during the year ended December 31, 2005, while 33% of those purchases were from
one Italian manufacturer during the year ended December 31, 2004. Furthermore, approximately
44% of Kenneth Cole Reaction ladies’ footwear purchases were sourced through one Chinese
manufacturer during the year ended December 31, 2005, and 58% were purchased from one Italian
manufacturer during the year ended December 31, 2004. The Company believes it has alternative
manufacturing sources available to meet its current and future production requirements in the event
the Company is required to change current manufacturers or current manufacturers are unavailable
to fulfill the Company’s production needs.

66 K e n n e t h C o l e P r o d u c t i o n s , I n c .
4 S e v e r a n c e In October 2005, the Company entered into an agreement with a senior
executive of the Company relating to termination of employment. The Company incurred expenses
of approximately $900,000 of severance and other benefits related to such agreement, substantially
all in the three months ended December 31, 2005.
In 2004, in conjunction with the Company’s decision to close its east coast distribution center and
transfer the operation to a third-party service provider, the Company entered into a shutdown
agreement in 2004, with a local affiliate of the International Leather Goods, Plastics, Handbags and
Novelty Workers Union, Local I Division of Local 342-50 United Food and Commercial Workers
Union, which provided for, among other things, severance payments for employees covered by the
expiring collective bargaining agreement. In connection with this transition, the Company incurred
approximately $1.1 million in aggregate costs, including severance from the aforementioned
agreement, the write-off of unamortized leasehold improvements and moving costs. These costs
were expensed as incurred in accordance with SFAS No. 146 “Accounting for Costs Associated with
Exit or Disposal Activity” and recorded in Selling, General and Administrative expenses in the
Consolidated Statement of Income.
As of December 31, 2005 and 2004, the Company did not have any employees covered under a
collective bargaining agreement with a local union. As of December 31, 2003, the Company
had approximately 6% of its employees covered under a collective bargaining agreement with a
local union.
5 L i n e o f C r e d i t F a c i l i t y The Company has a Line of Credit Facility (the “Facility”)
that, as amended, allows for uncommitted borrowings, letters of credit and banker’s acceptances
subject to individual maximums and in the aggregate, an amount not to exceed the lesser of
$25,000,000 or a “Borrowing Base.” The Borrowing Base is calculated on a specified percentage of
eligible amounts due under factoring arrangements, eligible non-factored accounts receivable, and
eligible inventory. Borrowings under the revolving loan portion of the Facility (“Advances”) are due
on demand. The Company may pay down and re-borrow at will under the Facility. Advances bear
interest at the Alternate Base Rate (defined as the higher of the Prime Rate or the Federal Funds
in effect at borrowing date plus ½ of 1%) or the Note Rate (which will be agreed upon between
n o t e s to conso l idated f inanc ia l s ta tement s

67K e n n e t h C o l e P r o d u c t i o n s , I n c .
the lender and the Company). There were no outstanding advances under this agreement at
December 31, 2005, and 2004.
Amounts available under the Facility at December 31, 2005 were reduced by $6,679,000 of standby
letters of credit. In connection with the line of credit, the Company has agreed to eliminate all
the outstanding advances under the Facility for at least 30 consecutive days during each calendar
year, which the Company has complied with. In addition, borrowings under the line of credit are
secured by certain assets of the Company.
6 O t h e r In April 2005, a purported class action lawsuit was filed against the Company
in the Superior Court of California for the County of San Diego. The individual plaintiff is a floor
supervisor in one of the Company’s retail stores who purports to bring suit on behalf of him and
other similarly situated current and former floor supervisors. Among other claims, the plaintiff
alleges that he and other floor supervisors worked hours for which they were entitled to receive,
but did not receive, overtime compensation under California law. The lawsuit seeks damages,
penalties, restitution, equitable relief, interest and attorneys’ fees and costs. The Company denies
the allegations in the complaint and plans to defend the action vigorously. The Company does not
believe that the outcome will have a material effect on its business operations.
In September 2004, a purported class action lawsuit was filed against the Company in the Superior
Court of California for the County of Los Angeles. The individual plaintiffs are current or former
store managers or assistant managers who purport to bring suit on behalf of themselves and other
similarly situated store managers and assistant managers. Among other claims, the plaintiffs allege that
they worked hours for which they were entitled to receive, but did not receive, overtime compensation
under California law. The lawsuit sought damages, penalties, restitution, reclassification and
attorneys’ fees and costs. In January 2006, the Company reached an agreement in principle to settle
the matter, and the parties filed a fully executed Stipulation of Class Settlement and Release. The
Court signed and entered an order granting preliminary approval to the settlement. The settlement
provides for a maximum settlement of $900,000, which includes all payments to class members,
incentive awards, attorney’s fees and administration costs. While there is still uncertainty relating to
the ultimate settlement amount, the Company believes that its reserves as of December 31, 2005
are adequate.

68 K e n n e t h C o l e P r o d u c t i o n s , I n c .
The Company is, from time to time, a party to other litigation that arises in the normal course of its
business operations. The Company is not presently a party to any other litigation that it believes
might have a material adverse effect on its business operations.
n S h a r e h o l d e r s ’ Eq u i t y
1 C o m m o n s t o c k C l a s s A Common Shareholders are entitled to one vote for each
share held of record and Class B Common Shareholders are entitled to ten votes for each share held
of record. Each share of Class B Common Stock is convertible into one share of Class A Common
Stock at the option of the Class B Shareholder. The Class A Common Shareholders vote together
with Class B Common Shareholders on all matters subject to shareholder approval, except that
Class A Common Shareholders vote separately as a class to elect 25% of the Board of Directors of the
Company. Shares of neither class of common stock have preemptive or cumulative voting rights.
2 P r e f e r r e d s t o c k The Company’s Certificate of Incorporation authorizes the issuance
of 1,000,000 shares of preferred stock. The preferred stock may be issued from time to time as
determined by the Board of Directors of the Company, without shareholder approval. Such
preferred stock may be issued in such series and with such preferences, conversion or other rights,
voting powers, restrictions, limitations as to dividends, qualifications or other provisions, as may be
fixed by the Board of Directors.
3 C o m m o n s t o c k r e p u r c h a s e In December 2004, the Company repurchased 500,000
of its shares from Liz Claiborne, Inc. at an aggregate price of $13.9 million, which were originally
acquired by Liz Claiborne, Inc. in connection with its licensing agreement with the Company. In
December 2003, 2,888,400 shares were repurchased in the open market at an aggregate price of
$66,221,000. The Company’s stock purchase plan authorizes the repurchase of an aggregate of
4,250,000 of shares of Class A common stock. No shares were repurchased in 2005, and the Company
had 861,600 shares available for repurchase as of December 31, 2005. In 2006, the Company’s Board
of Directors increased the authorization for the Company’s repurchase plan by approximately
1,138,400, and now has an aggregate of 2 million shares available for repurchase.
n o t e s to conso l idated f inanc ia l s ta tement s

69K e n n e t h C o l e P r o d u c t i o n s , I n c .
o L i c e n s i n g A g r e e m e n t s
In 2005, the Company entered into a Stock Purchase Agreement (the “Stock Purchase Agreement”)
with Bernard Chaus, Inc., (“Chaus”), pursuant to which the Company purchased 6,000,000 shares of
Chaus common stock for an aggregate purchase price of $6,000,000. The Stock Purchase Agreement
provides the Company with one demand and one piggyback registration right. The Company
recorded the shares at their fair value at the date of acquisition, and classified the shares as
“available for sale” under SFAS 115, which is included in Deposits and Sundry in the accompanying
Consolidated Balance Sheet. The Company has recorded unrealized gains of $414,000, net of taxes,
related to the Chaus shares, in Accumulated Other Comprehensive Income in the accompanying
Statement of Changes in Shareholders’ Equity.
In addition, the Company also entered into a license agreement (“License Agreement”) with Chaus,
dated June 13, 2005. The License Agreement grants Chaus an exclusive license to design, manufacture,
sell and distribute women’s sportswear under the Company’s trademark, Kenneth Cole Reaction.
The initial term of the License Agreement expires on December 31, 2010. Chaus has the option to
renew the License Agreement for an additional term of three years if it meets specified sales targets
and is in compliance with the License Agreement. The License Agreement provides that the
Company receives payment of specified royalties on net sales. The License Agreement also requires
Chaus to achieve certain minimum sales levels, to pay certain minimum royalties and to maintain a
minimum net worth. Chaus is also obligated to pay specified percentages of net sales to support
advertising and to expend a specified amount in the period ending December 31, 2007 to support
the initial launch of the Licensed Products, as defined.
In November 2004, the Company entered into a licensing agreement with G-III Apparel Group, LTD
(“G-III”), in connection with worldwide manufacturer, sale, and distribution of women’s and men’s
outerwear. The agreement commenced on January 1, 2005 and continues through December 31,
2008, with options to renew based on certain milestones to be met by G-III. As part of the agreement,
the Company will earn royalties based on a percentage of G-III’s net sales. The Company will receive
$3,000,000 over the term of the agreement, as consideration for the grant of the license, and also
received 50,000 shares of its G-III’s unregistered stock, with a value of $297,000 at the date of
receipt. The cash and stock consideration are being amortized over the term of the agreement as

70 K e n n e t h C o l e P r o d u c t i o n s , I n c .
part of the royalty stream. In addition, the Company recorded the shares as an “available for sale”
investment under SFAS 115, which is included in Deposits and Sundry in the accompanying
Consolidated Balance Sheet.
p R e l a t e d Pa r t y Tr a n s a c t i o n s
The Company has an exclusive license agreement with Iconix Brand Group, Inc., formerly Candies,
Inc., and its trademark holding company, IP Holdings, LLC (“Candies”), to use the Bongo trademark
in connection with worldwide manufacture, sale and distribution of women’s, men’s and children’s
footwear. The Chief Executive Officer and Chairman of Candies is the brother of the Company’s
Chief Executive Officer and Chairman. The initial term of the agreement is through December 31,
2007, with options to renew through December 31, 2016 based upon the Company reaching certain
sales thresholds. The license agreement with Candies was entered into at arm’s-length. During
these periods, the Company is obligated to pay Candies a percentage of net sales based upon
the terms of the agreement. The Company recorded approximately $1,260,000 and $1,070,000
in aggregate royalty and advertising expense with respect to Candies for the years ended
December 31, 2005 and December 31, 2004, respectively.
q N e w A c c o u n t i n g P r o n o u n c e m e n t s
In November 2004, the FASB issued Statement of Financial Accounting Standards No. 151, “Inventory
Costs—An Amendment of ARB No. 43, Chapter 4” (“SFAS 151”). SFAS 151 amends the guidance in
ARB No. 43, Chapter 4, “Inventory Pricing,” to clarify the accounting for abnormal amounts of idle
facility expense, freight, handling costs, and wasted material (spoilage). SFAS 151 is effective for fiscal
years beginning after June 15, 2005 and, as such, the Company adopted SFAS 151 on January 1,
2006. The adoption of SFAS 151 did not have a material impact on the Company’s consolidated
results of operations, financial position, or cash flows.
n o t e s to conso l idated f inanc ia l s ta tement s

71K e n n e t h C o l e P r o d u c t i o n s , I n c .
In December 2004, the FASB issued SFAS 123R, which supersedes APB Opinion No. 25. SFAS 123R
requires all share-based payments, including grants of employee stock options, to be recognized in
the financial statements based on their fair values. Under SFAS 123R, public companies will be
required to measure the cost of services received in exchange for stock options and similar awards
based on the grant-date fair value of the award and recognize this cost in the income statement over
the period during which an award recipient is required to provide service in exchange for the award.
The pro forma disclosures previously permitted under SFAS 123 no longer will be an alternative to
financial statement recognition. Under SFAS 123R, the Company must determine the appropriate
fair value model to be used for valuing share-based payments, the amortization method for
compensation cost and the transition method to be used at date of adoption. The transition
methods include modified prospective and retroactive adoption options. The Company adopted
SFAS 123R on January 1, 2006 using the modified prospective method. Under this method, the
Company will recognize compensation cost, on a prospective basis, for the portion of outstanding
awards for which the requisite service has not yet been rendered as of January 1, 2006, based upon
the grant-date fair value of those awards calculated under SFAS 123 for pro forma disclosure
purposes. Earnings and diluted earnings per share are expected to decrease by approximately
$5.4 million and $0.16, respectively, as a result of share-based grants in 2006, and those grants as of
December 31, 2005 for which compensation expense has not been recognized under SFAS 123.
Also in December 2004, the FASB issued SFAS No. 153, “Exchanges of Nonmonetary Assets—
An Amendment of APB Opinion No. 29, Accounting for Nonmonetary Transactions” (“SFAS 153”).
SFAS 153 eliminates the exception from fair value measurement for nonmonetary exchanges of
similar productive assets in paragraph 21(b) of APB Opinion No. 29, “Accounting for Nonmonetary
Transactions,” and replaces it with an exception for exchanges that do not have commercial
substance. SFAS 153 specifies that a nonmonetary exchange has commercial substance if the
future cash flows of the entity are expected to change significantly as a result of the exchange.
The adoption of SFAS 153 on January 1, 2006, did not have a material impact on the Company’s
consolidated results of operations or financial condition.

72 K e n n e t h C o l e P r o d u c t i o n s , I n c .
In May 2005, the FASB issued SFAS No. 154, “Accounting Changes and Error Corrections,” (“SFAS 154”),
a replacement of Accounting Principles Board Opinion (APB) No. 20, “Accounting Changes,” and
FASB Statement No. 3, “Reporting Accounting Changes in Interim Financial Statements.” This
Statement requires retrospective application to prior periods’ financial statements of a change in
accounting principle. It applies both to voluntary changes and to changes required by an accounting
pronouncement if the pronouncement does not include specific transition provisions. APB 20
previously required that most voluntary changes in accounting principles be recognized by recording
the cumulative effect of a change in accounting principle. SFAS 154 is effective for fiscal years
beginning after December 15, 2005. The Company adopted this statement on January 1, 2006, and
does not anticipate that it will have a material effect on the Company’s consolidated results of
operations, financial position, or cash flows.
In March 2005, the FASB issued FASB Interpretation No. 47, “Accounting for Conditional Asset
Retirement Obligations” (“FIN 47”). FIN 47 is an interpretation of Statement of Financial Accounting
Standards No. 143, “Accounting for Asset Retirement Obligations” (“SFAS 143”), and clarifies the
term conditional asset retirement obligation as used in SFAS 143, which refers to a legal obligation
to perform an asset retirement activity in which the timing and/or method of settlement are
conditional on a future event that may or may not be within the control of the entity. Accordingly,
the Company is required to identify any conditional asset retirement obligations it may have
with respect to its long-lived assets, and recognize a liability for the fair value of any conditional
asset retirement obligations, if the fair value of the liability can be reasonably estimated. FIN 47 is
effective for the fiscal year ending December 31, 2005. As such, the Company adopted FIN 47
in 2005, which did not materially impact the Company’s consolidated results of operations, financial
position, or cash flows.
n o t e s to conso l idated f inanc ia l s ta tement s

73K e n n e t h C o l e P r o d u c t i o n s , I n c .
r Q u a r t e r l y F i n a n c i a l D a t a ( U n a u d i t e d )
Summarized quarterly financial data for 2005 and 2004 appear below (in thousands, except per
share data):First Quarter Second Quarter Third Quarter Fourth Quarter
2 0 0 5Net sales $ 120,292 $ 109,281 $ 124,720 $ 119,767
Royalty revenue 9,606 10,054 11,059 13,264
Net revenues 129,898 119,335 135,779 133,031
Gross profit 56,166 55,369 60,533 62,248
Operating income 11,184 11,208 12,618 10,353
Net income 7,489 7,708 10,853 7,476
Earnings per share basic $ 0.38 $ 0.39 $ 0.54 $ 0.37
Earnings per share diluted $ 0.37 $ 0.38 $ 0.53 $ 0.37
Dividends declared $ 0.16 $ 0.16 $ 0.16 $ 0.18
2 0 0 4Net sales $ 113,351 $ 103,720 $ 132,929 $ 123,438
Royalty revenue 9,026 9,337 11,784 12,616
Net revenues 122,377 113,057 144,713 136,054
Gross profit 52,468 51,374 63,624 63,918
Operating income 11,676 10,992 19,280 14,469
Net income 7,393 7,027 12,158 9,274
Earnings per share basic $ 0.37 $ 0.35 $ 0.60 $ 0.46
Earnings per share diluted $ 0.36 $ 0.34 $ 0.59 $ 0.45
Dividends declared $ 0.12 $ 0.12 $ 0.14 $ 0.14
s S u b s e q u e n t E ve n t
On March 1, 2006, the Board of Directors declared a quarterly cash dividend of $0.18 per share
payable on March 30, 2006 to shareholders of record at the close of business on March 9, 2006.

74 K e n n e t h C o l e P r o d u c t i o n s , I n c .
The accompanying consolidated financial statements of Kenneth Cole Productions, Inc. presented
in this report were prepared by management, which is responsible for their integrity and objectivity.
The financial statements have been prepared in accordance with accounting principles generally
accepted in the United States. Some of the amounts included in the consolidated financial information
are necessarily based on estimates and judgments of management.
The Company maintains accounting and related internal control systems designed to provide,
among other things, reasonable assurance that transactions are executed in accordance with
management’s authorization and that they are recorded and reported properly. The control
environment is augmented by the Company’s internal audit function, which performs audits
and evaluates the adequacy of and the adherence to these controls, policies, and procedures.
The Company’s management is responsible for establishing and maintaining adequate internal
controls over financial reporting. Under the supervision and with the participation of management,
the Company conducted an evaluation of the effectiveness of internal controls over financial reporting
as of December 31, 2005 based on the framework in Internal Control—Integrated Framework issued
by the Committee of Sponsoring Organizations of the Treadway Commission. Management has
concluded that internal controls over financial reporting are effective as of December 31, 2005. The
Company has also carried out an evaluation of the effectiveness of the design and operation of
disclosure controls and procedures and has concluded that the Company’s disclosure controls and
procedures are effective to ensure that material information relating to the Company and its
consolidated subsidiaries would be made known to management by others within those entities to
allow timely decisions regarding disclosure.
m a n a g e m e n t ’ s r e s p o n s i b i l i t y fo r f inanc ia l s ta tement s

75K e n n e t h C o l e P r o d u c t i o n s , I n c .
The consolidated financial statements and management’s assessment of internal controls over
financial reporting as of December 31, 2005, have been audited by the Company’s independent
registered public accounting firm, Ernst & Young, LLP. Their audits expressed unqualified opinions
on our consolidated financial statements and on management’s assessment of internal control over
financial reporting as of December 31, 2005. Their audits are performed in accordance with the
standards of the Public Company Accounting Oversight Board (United States).
The Audit Committee of the Board of Directors, which is composed of independent directors, who
are financially literate, meets regularly with management, internal auditors, and the Company’s
independent registered public accounting firm to review the results of their work and to satisfy itself
that their responsibilities are being properly discharged. The independent registered public
accounting firm and internal auditors have unrestricted access to the Audit Committee without
management present.
Kenneth D. Cole David P. Edelman
Chairman of the Board and Chief Financial Officer
Chief Executive Officer
76 K e n n e t h C o l e P r o d u c t i o n s , I n c .
To The Board of Directors and Shareholders of Kenneth Cole Productions, Inc.
We have audited management’s assessment that Kenneth Cole Productions, Inc. and subsidiaries
(the “Company”) maintained effective internal control over financial reporting as of December 31,
2005, based on criteria established in Internal Control—Integrated Framework issued by the
Committee of Sponsoring Organizations of the Treadway Commission (the COSO criteria). The
Company’s management is responsible for maintaining effective internal control over financial
reporting and for its assessment of the effectiveness of internal control over financial reporting.
Our responsibility is to express an opinion on management’s assessment and an opinion on the
effectiveness of the company’s internal control over financial reporting based on our audit.
We conducted our audit in accordance with the standards of the Public Company Accounting
Oversight Board (United States). Those standards require that we plan and perform the audit to
obtain reasonable assurance about whether effective internal control over financial reporting was
maintained in all material respects. Our audit included obtaining an understanding of internal
control over financial reporting, evaluating management’s assessment, testing and evaluating the
design and operating effectiveness of internal control, and performing such other procedures as we
considered necessary in the circumstances. We believe that our audit provides a reasonable basis
for our opinion.
A company’s internal control over financial reporting is a process designed to provide reasonable
assurance regarding the reliability of financial reporting and the preparation of financial statements
for external purposes in accordance with generally accepted accounting principles. A company’s
internal control over financial reporting includes those policies and procedures that (1) pertain to
the maintenance of records that, in reasonable detail, accurately and fairly reflect the transactions
and dispositions of the assets of the company; (2) provide reasonable assurance that transactions
are recorded as necessary to permit preparation of financial statements in accordance with
generally accepted accounting principles, and that receipts and expenditures of the company are
being made only in accordance with authorizations of management and directors of the company;
and (3) provide reasonable assurance regarding prevention or timely detection of unauthorized
acquisition, use, or disposition of the company’s assets that could have a material effect on the
financial statements.
re por t o f i n d e p e n d e n t r e g i s t e r e d p u b l i c a c c o u n t i n g f i r m

77K e n n e t h C o l e P r o d u c t i o n s , I n c .
Because of its inherent limitations, internal control over financial reporting may not prevent or
detect misstatements. Also, projections of any evaluation of effectiveness to future periods are
subject to the risk that controls may become inadequate because of changes in conditions, or that
the degree of compliance with the policies or procedures may deteriorate.
In our opinion, management’s assessment that Kenneth Cole Productions, Inc. and subsidiaries
maintained effective internal control over financial reporting as of December 31, 2005 is fairly stated,
in all material respects, based on the COSO criteria. Also, in our opinion, Kenneth Cole Productions,
Inc. and subsidiaries maintained, in all material respects, effective internal control over financial
reporting as of December 31, 2005, based on the COSO criteria.
We also have audited, in accordance with the standards of the Public Company Accounting
Oversight Board (United States), the consolidated balance sheets of Kenneth Cole Productions, Inc.
and subsidiaries as of December 31, 2005 and 2004, and the related consolidated statements
of income, cash flows and changes in shareholders’ equity for each of the three years in the
period ended December 31, 2005 and our report dated March 9, 2006 expressed an unqualified
opinion thereon.
New York, New York
March 9, 2006

78 K e n n e t h C o l e P r o d u c t i o n s , I n c .
To The Board of Directors and Shareholders of Kenneth Cole Productions, Inc.
We have audited the accompanying consolidated balance sheets of Kenneth Cole Productions, Inc.
and subsidiaries (the “Company”) as of December 31, 2005 and 2004, and the related consolidated
statements of income, cash flows and changes in shareholders’ equity for each of the three years in
the period ended December 31, 2005. These financial statements are the responsibility of the
Company’s management. Our responsibility is to express an opinion on these financial statements
based on our audits.
We conducted our audits in accordance with the standards of the Public Company Accounting
Oversight Board (United States). Those standards require that we plan and perform the audit to
obtain reasonable assurance about whether the financial statements are free of material misstatement.
An audit includes examining, on a test basis, evidence supporting the amounts and disclosures
in the financial statements. An audit also includes assessing the accounting principles used and
significant estimates made by management, as well as evaluating the overall financial statement
presentation. We believe that our audits provide a reasonable basis for our opinion.
In our opinion, the financial statements referred to above present fairly, in all material respects, the
consolidated financial position of Kenneth Cole Productions, Inc. and subsidiaries at December 31,
2005 and 2004, and the consolidated results of their operations and their cash flows for each of the
three years in the period ended December 31, 2005, in conformity with U.S. generally accepted
accounting principles.
We also have audited, in accordance with the standards of the Public Company Accounting Oversight
Board (United States), the effectiveness of Kenneth Cole Productions, Inc. and subsidiaries internal
control over financial reporting as of December 31, 2005, based on criteria established in Internal
Control—Integrated Framework issued by the Committee of Sponsoring Organizations of
the Treadway Commission and our report dated March 9, 2006 expressed an unqualified
opinion thereon.
New York, New York
March 9, 2006
re por t o f i n d e p e n d e n t r e g i s t e r e d p u b l i c a c c o u n t i n g f i r m
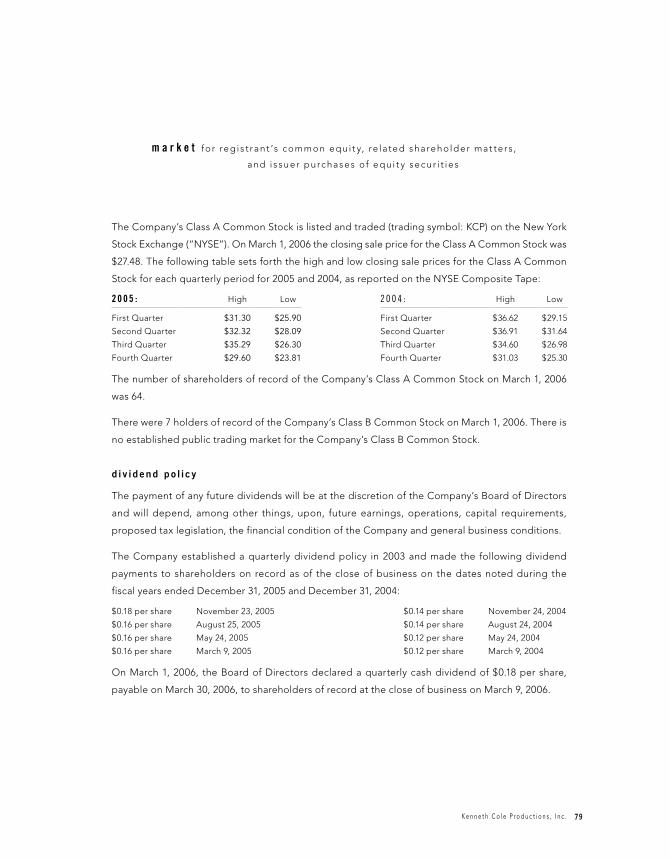
79K e n n e t h C o l e P r o d u c t i o n s , I n c .
The Company’s Class A Common Stock is listed and traded (trading symbol: KCP) on the New York
Stock Exchange (“NYSE”). On March 1, 2006 the closing sale price for the Class A Common Stock was
$27.48. The following table sets forth the high and low closing sale prices for the Class A Common
Stock for each quarterly period for 2005 and 2004, as reported on the NYSE Composite Tape:
2 0 0 5 : High Low 2 0 0 4 : High Low
First Quarter $ 31.30 $ 25.90 First Quarter $ 36.62 $ 29.15
Second Quarter $ 32.32 $ 28.09 Second Quarter $ 36.91 $ 31.64
Third Quarter $ 35.29 $ 26.30 Third Quarter $ 34.60 $ 26.98
Fourth Quarter $ 29.60 $ 23.81 Fourth Quarter $ 31.03 $ 25.30
The number of shareholders of record of the Company’s Class A Common Stock on March 1, 2006
was 64.
There were 7 holders of record of the Company’s Class B Common Stock on March 1, 2006. There is
no established public trading market for the Company’s Class B Common Stock.
d i v i dend po l i c y
The payment of any future dividends will be at the discretion of the Company’s Board of Directors
and will depend, among other things, upon, future earnings, operations, capital requirements,
proposed tax legislation, the financial condition of the Company and general business conditions.
The Company established a quarterly dividend policy in 2003 and made the following dividend
payments to shareholders on record as of the close of business on the dates noted during the
fiscal years ended December 31, 2005 and December 31, 2004:
$0.18 per share November 23, 2005 $0.14 per share November 24, 2004
$0.16 per share August 25, 2005 $0.14 per share August 24, 2004
$0.16 per share May 24, 2005 $0.12 per share May 24, 2004
$0.16 per share March 9, 2005 $0.12 per share March 9, 2004
On March 1, 2006, the Board of Directors declared a quarterly cash dividend of $0.18 per share,
payable on March 30, 2006, to shareholders of record at the close of business on March 9, 2006.
m a r k e t fo r reg i s t rant ’s common eq ui t y, re la ted shareho ld er mat te r s ,
and i s suer purc hases of eq u i t y sec ur i t ie s
80 K e n n e t h C o l e P r o d u c t i o n s , I n c .
c o r p o r a t e d i r e c t o r y and shareho ld er in fo r mat ion
Board o f D i r e c t o r s
Kenneth D. ColeChairman of the Board and Chief Executive Officer
Martin E. Franklin*Chairman and Chief Executive Officer, Jarden Corporation
Robert C. Grayson*President, Robert C. Grayson & Associates, Inc. Partner, Berglass-Grayson
Denis F. Kelly*Managing Partner, Scura, Rise & Partners, LLC
Philip B. Miller*Principal, Philip B. Miller Associates
Philip R. Peller*Retired Partner, Arthur Andersen LLP
* Members of the Audit Committee and Compensation Committee
E xecu t i ve O f f i c e r s and Sen i o r Management
Kenneth D. ColeChairman of the Board and Chief Executive Officer
Joel NewmanChief Operating Officer
David P. EdelmanChief Financial Officer
Michael F. ColosiCorporate Vice President, General Counsel and Secretary
Michael DeVirgilioExecutive Vice President, Business Development
Doug JakubowskiSenior Vice President, Reaction Brand
Harry KubetzSenior Vice President of Operations
Henrik MadsenSenior Vice President, International Operations
Linda Nash MerkerSenior Vice President of Human Resources
Richard OlickerExecutive Vice President, Wholesale
Carol SharpeSenior Vice President, Consumer Direct
Lori WagnerSenior Vice President, Marketing
Co rpo ra t e Headquar t e r s
Kenneth Cole Productions, Inc. 603 West 50th Street New York, New York 10019
In t e rne t Addre s se s
www.kennethcole.com www.reactiononline.com
Annua l Mee t ing
The Annual Meeting of Shareholders will be held at 10:00 a.m. Wednesday, May 17, 2006 at the Company’s Administrative Offices, 400 Plaza Drive, Secaucus, New Jersey 07094.
Clas s A Common Stock
Shares of the Company’s Class A Common Stock are listed and traded on the New York Stock Exchange (trading symbol KCP).
Co rpo ra t e Gove rnance
The Company’s Corporate Governance Guidelines are available through the Investor Relations Corporate Governance link on our website www.kennethcole.com.
Independen t Aud i t o r s
Ernst & Young LLP 5 Times Square New York, New York 10036
Trans f e r A gen t
Bank of New YorkShareholder Relations Department 11E P.O. Box 11258 Church Street Station New York, New York 10286 http://stock.bankofny.com 1-800-524-4458
In f o rmat i on Reques t s
Copies of the Company’s Annual Report on Form 10-K as filed with the Securities and Exchange Commission are available free of charge to shareholders either on the Company’s website or upon request to:
Inve s t o r Re la t i ons
Kenneth Cole Productions, Inc. 400 Plaza Drive Secaucus, New Jersey 07094 (201) 864-8080 [email protected] d
esig
ned
by
curr
an &
co
nno
rs, i
nc. /
ww
w.c
urra
n-co
nno
rs.c
om