2004 Food Processing Report · Web viewReport Highlights: The food processing industry in...
44
Required Report - public distribution Date: 4/4/2006 GAIN Report Number: CH6602 CH4605 China, Peoples Republic of Food Processing Ingredients Sector Food Processing 2006 Approved by: Keith Schneller Prepared by: Daniel Taylor, revised and updated by Matt Van Osdol Report Highlights: The food processing industry in China continues to grow rapidly. In 2004 revenue for the industry was over USD$157.7 billion. Strong economic growth and rapid urbanization have contributed to higher disposable incomes and increased demands from Chinese consumers for high quality processed foods at home and in restaurants. China is also becoming a profitable base for export oriented food processing. Although China’s food processing industry is growing rapidly, it is still relatively underdeveloped. It should continue to see consistent growth in the double-digit range for the foreseeable future, with increased demand for certain high quality American ingredients. Includes PSD Changes: No Includes Trade Matrix: No Annual Report Guangzhou [CH3] [CH] USDA Foreign Agricultural Service GAIN Report Global Agriculture Information Network Template Version 2.09
Transcript of 2004 Food Processing Report · Web viewReport Highlights: The food processing industry in...

Required Report - public distribution
Date: 4/4/2006
GAIN Report Number: CH6602
CH4605
China, Peoples Republic ofFood Processing Ingredients SectorFood Processing2006
Approved by:Keith Schneller
Prepared by:Daniel Taylor, revised and updated by Matt Van Osdol
Report Highlights:The food processing industry in China continues to grow rapidly. In 2004 revenue for the industry was over USD$157.7 billion. Strong economic growth and rapid urbanization have contributed to higher disposable incomes and increased demands from Chinese consumers for high quality processed foods at home and in restaurants. China is also becoming a profitable base for export oriented food processing. Although China’s food processing industry is growing rapidly, it is still relatively underdeveloped. It should continue to see consistent growth in the double-digit range for the foreseeable future, with increased demand for certain high quality American ingredients.
Includes PSD Changes: NoIncludes Trade Matrix: No
Annual ReportGuangzhou [CH3]
[CH]
USDA Foreign Agricultural Service
GAIN ReportGlobal Agriculture Information Network
Template Version 2.09

GAIN Report – CH5607 Page 2 of 33
Table of Contents
Section II: Executive Summary Page 3 of 33
Section II: Market Summary Page 5 of 33
A. Sector Size Page 5 of 33
B. Sector Geographic Distribution Page 6 of 33
C. Sector Growth Page 7 of 33
D. Consumer Trends and Sales Patterns Page 9 of 33
E. Challenges and Opportunities Page 16 of 33
Section III: Road Map for Market Entry Page 19 of 33
A. Entry Strategy Page 19 0f 33
B. Distribution Page 19 of 33
C. Company Profiles Page 22 of 33
Section IV: Competition Page 26 of 33
A. Domestic Competition Page 26 of 33
B. Non-US Competition Page 27 of 33
Section V: Best Product Prospects Page 30 of 33
Section VI: Growing opportunities for Chinese holiday food ingredients
Page 31 of 33
Section VI: Post Contact Information Page 33 of 33
UNCLASSIFIED USDA Foreign Agricultural Service

GAIN Report – CH5607 Page 3 of 33
Section I: Executive Summary
China’s population is over 1.3 billion and growing by nearly 10 million people, or 0.57 percent, annually. Its per capita GDP is approximately $1,280 USD and its economy has sustained an annual growth rate of a staggering 9 percent. China is currently the sixth largest economy in the world and is predicted to surpass Britain and France as the world’s fourth largest in 2006. In 2004 the value of all exports was $593 billion USD and the value of imports was $561 billion USD. Its major agricultural products include rice, wheat, potatoes, sorghum, peanuts, tea, millet, barley, cotton, oilseed, pork, and fish.
China is one of the world’s largest consumers of food. For example, China consumes 51 percent of the world’s pork, 33 percent of rice, 19 percent of ice cream, 19 percent of poultry and 12 percent of beef. In raw figures China consumes 8.5 million tons of meat per year, 40 million tons of vegetables and over 12.5 million tons of fruit. According to 2004 official statistics food constituted over 37 percent of the average urban household’s annual consumption expenditure.
Only about 30 percent of food in China is processed, compared to about 80 percent in western nations. While most consumers still prefer to purchase fresh foods, the market for processed foods is growing in China especially in urban areas where higher concentrations of wealth and busier lifestyles have led many to seek out more convenient alternatives to cooking with fresh ingredients. China’s current sales of packaged foods constitute nearly 4.0 percent of the world market and is estimated that in 2009 it will rise to more than 5 percent with a value of over $71.9 billion USD. Demands for healthier choices, convenience, and trends turning the younger population’s tastes toward western styles of food are opening the door to high quality imported ingredients. Recent food poisoning incidents have also increased consumer concern over food quality and safety and many are now looking towards food products that are packaged with big-name brands that they feel they can trust. In many urban areas, 40 percent of food is processed which shows promising growth with room for further increases. Furthermore, China’s inexpensive labor makes it a profitable center for export-oriented production.
The food processing industry in China is based around the east coast urban regions of Shanghai, Guangzhou and Beijing. In 2004, according to official statistics, there were 20,526 food-processing ventures in China each with annual sales revenue in excess of $5 million RMB (approximately $600,000 USD). The total sales revenue for the industry was $157.73 billion USD. Here it is important to remember that numbers and statistics in China should be used as guidelines as many statistics, both official and unofficial can be misleading or inaccurate. While the Chinese government only keeps track of enterprises with sales in excess of 5 million RMB per year, there are thousands of small outfits in operation as the industry is still very fragmented. In fact, it is not uncommon to find newspaper articles reporting that China has over 900,000 food processing ventures on the mainland, from mom-and-pop storefronts to multinational corporations. The fragmented nature of the industry is bolstered by research that shows that many of the largest ventures have less than a 5 percent market share in their respective sub-sectors.
Official statistics report that the industry grew 16 percent in 2001-2002 and 23 percent in 2002-2003. This continued growth is furthermore highlighted by the fact that from 1999 to 2004 sales of packaged foods rose 45%. These numbers are staggering but many industry insiders feel that it is safer to assume double-digit growth in excess of 10 percent. The president of the China Food Industry Association was recently quoted as expecting 10 percent-12 percent annual growth for the food processing sector. While this outlook is less than the official numbers of 16 percent and 23 percent it still shows strong growth with excellent potential. In fact, some estimates believe that the output of the food industry by the year 2010 may double from that of the year 2000, when it was valued at about 800 billion RMB ($102.7 billion USD).
Retail sales of processed food as well as the restaurant and catering industries have also shown impressive growth in the double-digit range over the last few years. Packaged foods, especially baked goods, dairy products, oils and fats, baby food and ice cream have all demonstrated exceptional growth in recent years. Multinational fast-food chains such as KFC and McDonald's continue to establish their presence in China with already over 1,500 and 600 restaurants respectively as they look to the Chinese market as their main source of growth. Institutional catering is also on the rise as the number of factory workers skyrockets and companies outsource feeding their employees.
In the upcoming years the industry will focus on the development of corn and wheat goods, dairy products, food additives and seasoning essentials. Demands for imported poultry, cereals, fish, nuts, soybeans are
UNCLASSIFIED USDA Foreign Agricultural Service

GAIN Report – CH5607 Page 4 of 33
expected to continue while US exporters may find new markets in baking ingredients and fruit flavorings. Good prospects include: almonds, pistachios, prunes, raisins, oranges, hazelnuts, macadamia nuts, cherries, poultry, pork, potato flour, frozen potato products, corn, juices and concentrates, seafood--lobsters, scallops, salmon, pollock --infant formula, baking ingredients (dried fruits and nuts, whey powder, flours), fruit flavorings (blueberry), stabilizers and table grapes. In regards to beef and BSE, the Hong Kong market is now open and industry insiders and government officials expect China to fully open its markets within the first half of 2006.
UNCLASSIFIED USDA Foreign Agricultural Service

GAIN Report – CH5607 Page 5 of 33
Section II: Market Summary
· The food processing industry had combined sales of $157 billion USD in 2004.· The industry is mainly based in Shanghai, Guangdong and Shandong provinces.· Industry is very fragmented with many small-scale operations but there is slow growth of larger
firms as consolidation begins.· Double-digit growth is a safe assumption based on current industrial and retail statistics.· The primary processing sector has demonstrated the highest consistent growth in both sales
revenue and number of players.· Expect strongest growth rate in baby food, oils and fats, dairy, baked goods, and dried foods.· Expect strong growth in all sub-sectors.
A. Sector Size
Figure 1. The Food Processing Industry in China, 2004
Enterprises* Sales Revenue**Number of Firms % Share billion RMB % Share
Food Processing 12,244 60 781,097 60Manufacture of Foods 4,950 24 268,896 21Manufacture of Beverages 3,332 16 243,461 19
Total 20,526 100 1,293,454 100* Statistics are only available for firms with annual sales revenue in excess of 5 million RMB.** 1 US. Dollar is equal to approximately 8.25 RMBSource: China Statistical Yearbook, 2005
Official statistics separate industrial food production into three categories in China: food processing, food manufacturing and beverage manufacturing. The food-processing sector includes primary activities such as rice milling, flour milling, oil refining, sugar refining, slaughtering, salt processing, feed processing, and aquatic product processing. The food-manufacturing sector is composed of packaged food, pastries and confections, dairy products, canned foods, fermented products, and condiments. The beverage sector involves the making of alcoholic beverages (i.e. distilled spirits, beer and wine), soft drinks and tea.
In 2004 there were a total of 20,526 registered food production enterprises with annual combined sales revenue of just over $157 billion USD. By far the majority of these enterprises are involved in primary food-processing, comprising more than half of the industry while food manufacturing and beverage manufacturing account for approximately 20 percent each. (Again, one must keep in mind that statistics are only kept for operations that have annual revenue of more than 5 million RMB per year. China does not publish statistics for industrial enterprises, state-owned or private with sales below the 5 million RMB mark.)
The industry is still very fragmented. While there may be a few giants and mergers and acquisitions continue, the bulk of food processing is done by medium-sized outfits. For example Statistics from China’s Dairy Industry Association show that there are over 1,500 dairy processors in China and that 90 to 95 percent are small and medium-sized enterprises. In retail sales of packaged food Hsin International Group is the industry’s largest player and only has four percent of the overall market share. This is most likely because the industry is still very young. Furthermore, with disparate incomes between urban and rural residents, regional variations in taste and, most importantly, limited infrastructure it will take some time for the industry to consolidate and capitalize on economies of scale.
B. Sector Geographic
UNCLASSIFIED USDA Foreign Agricultural Service

GAIN Report – CH5607 Page 6 of 33
Distribution
Figure 2. Regional Distribution of Food Industry (Regions covered by ATO offices)
Number of EnterprisesSales Revenue(billion RMB)
National Industry Total 19,022 1,013.67
ATO Beijing Region Total 1200 92.35
Beijing 394 30.85Tianjin 370 25.79Qingdao 124 9.38Jilin 392 26.33
ATO Guangzhou Region Total 2,113 113.55
Fujian 465 16.34Hainan 209 11.4Guangdong 1,282 82.22Guangxi 157 3.59
ATO Shanghai Region Total 3,134 170.15
Shanghai 641 35.46Jiangsu 1,353 78.48Zhejiang 1,140 56.21
China’s food processing industry is concentrated in the three coastal regions of Shanghai, Guangdong Province and Shandong Province. These areas have access to seaports, domestic logistics and imported
UNCLASSIFIED USDA Foreign Agricultural Service
Guangdong
Fujian
Guangxi
Hainan
Beijing
Jilin
Jiangsu
Zhejiang
Shanghai
TianjinQingdao

GAIN Report – CH5607 Page 7 of 33
technology. Furthermore, east coast consumers have benefited the most from economic development and are the wealthiest consumers, comprising the largest market for processed and imported food.
Guangdong is the second largest food-processing center in China with a total of 1,282 enterprises and is a major center for seafood processing. It is also, according to industry insiders, the center for distribution of imported ingredients and processed goods. While many imported goods enter directly through Guangdong's capital of Guangzhou, the city also handles a large amount of goods that are shipped via Hong Kong. Guangdong also has a large restaurant/catering business as Guangdong consumers spend more per capita in both real terms and as a percentage of income on dining out than anywhere else in China. Guangzhou is known for its diverse cuisine as exemplified by a common saying that the Cantonese will eat anything with four legs except the table. Owing to this, many processors and importers feel that Guangzhou is a good place to test out foreign foods as they will likely find early acceptance here allowing a foothold in the Chinese market.
Income, population and growth have all made the Yangtze River delta a major center for the food processing industry, and an important market for U.S. food ingredients. In 2003 the food processing industry for the region, including both food and beverage manufacturers, included some 3,134 enterprises with a total sales value of $170 billion RMB ($20.5 billion USD). Although Shanghai’s industry remains large (at $4.3 billion), many food processors have moved to lower-cost areas in neighboring Jiangsu and Zhejiang provinces, and the food processing industries in these areas are now larger than Shanghai. Jiangsu is the largest of the three, with a 2003 sales value of $9.5 billion in an industry that employs over 214,000 people. The key cities for Jiangsu’s food manufacturing industry include Zhanjiagang, Kunshan and Suzhou. Provincial statistics indicate that profit margins are tight, particularly for food processing (margins for beverage manufacturers a considerably higher). As a result, manufacturers in the Shanghai region are looking for ways to improve or otherwise distinguish their products from the competition. Many are turning to imported ingredients.
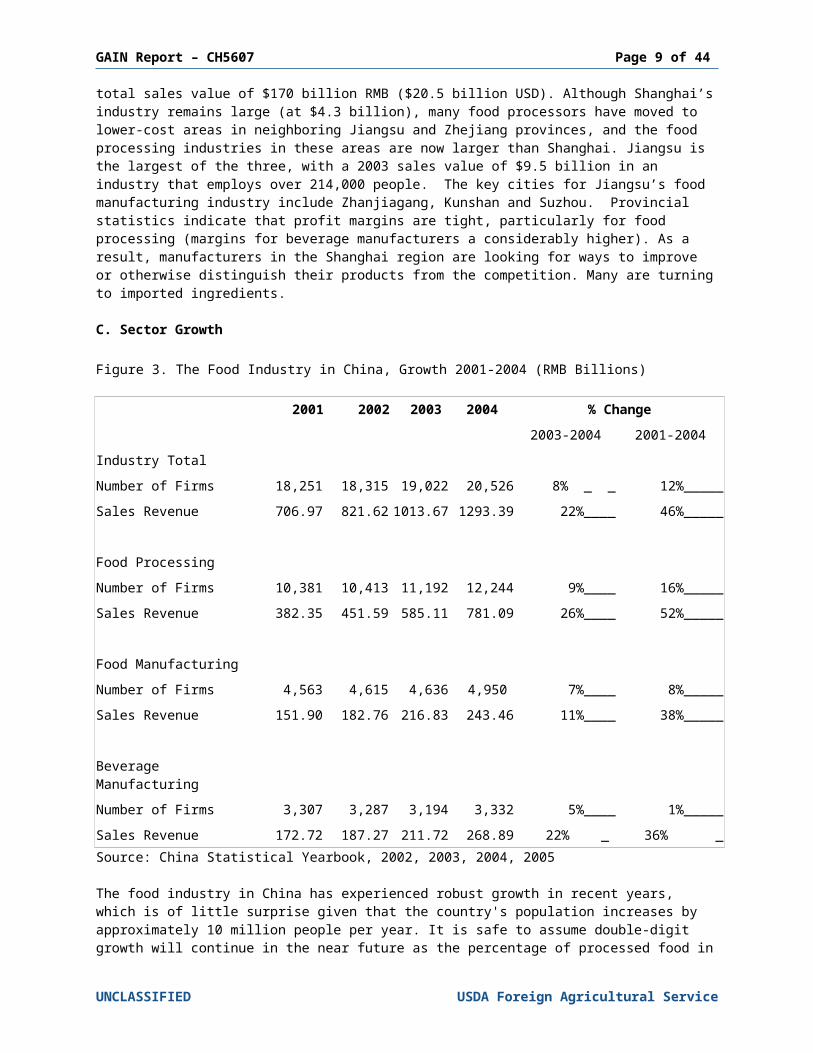
C. Sector Growth
Figure 3. The Food Industry in China, Growth 2001-2004 (RMB Billions)
2001 2002 2003 2004 % Change2003-2004 2001-2004
Industry Total
Number of Firms 18,251 18,315 19,022 20,526 8% _ _ 12%_____
Sales Revenue 706.97 821.62 1013.67 1293.39 22%____ 46%_____
Food Processing
Number of Firms 10,381 10,413 11,192 12,244 9%____ 16%_____
Sales Revenue 382.35 451.59 585.11 781.09 26%____ 52%_____
Food Manufacturing
Number of Firms 4,563 4,615 4,636 4,950 7%____ 8%_____
Sales Revenue 151.90 182.76 216.83 243.46 11%____ 38%_____
Beverage Manufacturing
Number of Firms 3,307 3,287 3,194 3,332 5%____ 1%_____
Sales Revenue 172.72 187.27 211.72 268.89 22% _ 36% _ Source: China Statistical Yearbook, 2002, 2003, 2004, 2005
UNCLASSIFIED USDA Foreign Agricultural Service

GAIN Report – CH5607 Page 8 of 33
The food industry in China has experienced robust growth in recent years, which is of little surprise given that the country's population increases by approximately 10 million people per year. It is safe to assume double-digit growth will continue in the near future as the percentage of processed food in Chinese diets continues to increase. Currently only about 30 percent of food in China is processed, compared to about 80 percent in more developed countries. Clearly there is more room for growth.
As the table above demonstrates, while the increase in the number of enterprises has slowed, especially in the beverage sector, sales revenue continues to grow. This is due to the fact that while mergers and competition have either swallowed companies or put others out of business, the market continues to grow. (Again, keep in mind that this may only be true of larger scale operations as there are still thousands of small-scale operations in China) While official statistics show 2003-2004 growth in sales revenue at 22% percent and 2001-2004 growth at 46 percent it is prudent to assume slower, yet still stable growth. Most industry insiders project a continued growth in the food processing industry of between 10 percent and 12 percent. Again, when dealing with China, assume stable growth but take all statistics with a word of caution.
With an apparent 52% percent growth in sales for 2001-2004 the processing sector is clearly the best performer as its growth exceeds those of both the manufacturing and beverage industries. Although the figures may be inflated, the disparity between the sub-sectors seems justified given the fact that the food processing industry in China is young and that initial growth should be in the primary sector of the industry.
Figure 4. Retail Value of Processed Foods 2000-2004 (RMB millions)
2000 2001 2002 2003 2004
Packaged food 345,183.50 372,713.60 403,053.70 436,625.80 473,223.90 Confectionery 28,393.50 30,721.60 33,405.90 36,219.20 38,596.10 Bakery products 49,057.00 53,713.70 58,776.20 63,667.70 69,030.20 Ice cream 19,401.70 20,939.20 22,474.00 23,909.40 26,223.50 Dairy products 23,885.80 28,038.60 32,468.90 37,243.10 41,939.30 Sweet and savory snacks 12,507.50 13,485.50 14,432.50 15,434.00 16,561.50 Ready meals 1,943.90 2,082.00 2,240.20 2,420.50 2,622.70 Soup 68.9 71.3 74 77.5 81.1 Pasta 22.2 22.9 23.9 24.9 25.9 Noodles 31,381.40 34,363.70 37,417.9 41,107.80 45,230.70 Canned/preserved food 42,678.80 43,978.80 45,448.90 46,909.20 48,602.70 Frozen processed food 23,836.30 25,434.70 27,275.10 28,993.60 30,835.00 Dried processed food 32,073.20 35,120.40 38,245.20 42,003.10 46,201.90 Chilled processed food 8,916.90 9,392.10 9,956.70 10,503.60 11,134.20 Meat and Fish (frozen, chilled, canned) 59,233.10 61,942.50 65,048.90 68,067.80 71,448.50 Oils and fats 11,213.30 13,095.90 15,654.40 20,103.80 24,874.20 Sauces, dressings and condiments 57,103.70 59,351.90 62,033.00 64,645.50 67,668.30 Spreads 2,699.40 2,901.30 3,126.90 3,362.90 3,596.60Source: Euromonitor
Figure 5. Growth Rate in Product Type 2000-2004
2000-01 2001-02 2002-03 2003-04
Packaged food 7.9 8.1 8.3 8.4 Confectionery 8.2 8.7 8.4 6.6 Bakery products 9.5 9.4 8.3 8.4 Ice cream 7.9 7.3 6.4 9.7 Dairy products 17.4 15.8 14.7 12.6
UNCLASSIFIED USDA Foreign Agricultural Service
GAIN Report – CH5607 Page 9 of 33
Sweet and savory snacks 7.8 7 6.9 7.3 Ready meals 7.1 7.6 8.1 8.4 Soup 3.5 3.8 4.7 4.7 Pasta 3.6 4.1 4.1 4.4 Noodles 9.5 8.9 9.9 10 Canned/preserved food 3 3.3 3.2 3.6 Frozen processed food 6.7 7.2 6.3 6.4 Dried processed food 9.5 8.9 9.8 10 Chilled processed food 5.3 6 5.5 6 Meat and Fish (frozen, chilled, canned) 4.6 5 4.7 5 Oils and fats 16.8 19.5 28.4 23.7 Sauces, dressings and condiments 3.9 4.5 4.2 4.7 Baby food 12.8 10.5 11.3 15.1 Spreads 7.5 7.8 7.5 6.9Source: Euromonitor
The total retail value of packaged food has showed consistent 8 percent growth since 2000. Baby food, oils and fats, dairy, ice cream, and dried foods all show higher than average growth, although the average rate of 8 percent is very strong. Using the growth rate of the retail value of processed foods should provide a reasonable estimate of the growth rate for the entire industry. In fact, many industry insiders feel that the above listed growth rates are accurate for the industry as a whole. However, with more and more companies using China as a platform for export oriented processing, these numbers may increase.
D. Consumer Trends and Sales Patterns
· Overall expenditure on food shows consistent growth.· There is a large urban and rural divide. Urban centers will still be the largest market for processed
food until rural incomes increase and market penetration and distribution logistics improve.· Urban areas show the most growth and the highest growth in expensive value-added items.· Urban areas show strong growth in milk, yogurt, milk powder, baby food products, oils and fats,
meat and poultry, and seafood.· Consumption patterns are highly regional.· While unprocessed grain consumption decreases, baked goods and processed cereals increases.· Fish, poultry, baked goods, milk and yogurt show parallel increases with income.· Watch for increasing trends in convenience, health foods, low fat, fortified foods.· Safety and imitations are still concerns.· The organic market is fledgling but being promoted by the government and is bolstered by health
and safety concerns.· More and more food is purchased in supermarkets and hypermarkets· The retail food service industry increases as more people eat out, especially in urban areas.
Figure 6. The Urban-Rural Divide: Per Capita Income and Food Expenditure in China (RMB)
% Change2001 2002 2003 2004 2003-2004 2001-2004
UrbanDisposable Income 6,859 7,702 8,472 9,422 11% 28%Food Expenditure 2,014 2,271 2,416 2,709 11% 26%
RuralDisposable Income 2,366 2,475 2,622 2,936 11% 20%Food Expenditure 830 872 886 1,031 15% 20%
Source: China Statistical Yearbook 2002, 2003, 2004, 2005
UNCLASSIFIED USDA Foreign Agricultural Service

GAIN Report – CH5607 Page 10 of 33
According to the tables above, per capita expenditure on food in urban areas increased by about 11 percent between 2003 and 2004 while in rural areas the increase was an even greater 15 percent. There was a parallel increase of 11 percent in amounts of disposable income between rural and urban households. What is important to recognize here though is that while growth in food expenditure is strong in both urban and rural areas, rural disposable income and food expenditure is less than one-third of the urban counterpart. It is also worth mentioning that due to price factors and availability most of the food consumed in rural areas is fresh rather than processed. Therefore the strength of the processed food market and the drivers for tastes and products still reside in urban areas.
Figure 7. Urban Household Per Capita Annual Purchases of Major Commodities (kg)2001 2002 2003 2004
Grain 79.69 78.48 79.52 78.18Fresh Vegetables 115.86 116.52 118.34 122.32Edible Vegetable Oil 8.08 8.52 9.2 9.29Pork 15.95 20.28 20.43 19.19Beef and Mutton 3.17 3 3.31 3.66Poultry 5.3 9.24 9.2 6.37Fresh Eggs 10.41 10.56 11.19 10.35Aquatic Products 10.33 13.2 13.35 12.48Milk 11.9 15.72 18.62 18.83Fresh Melons and Fruits 59.9 56.52 57.79 56.45Nuts and Kernels 3.37 2.76 2.7 2.94Liquor 9.68 9.12 9.39 8.94Cake 3.26 3.84 4.18 4.33Milk Powder 0.5 0.6 0.56 0.51Yogurt 1.36 1.8 2.53 2.85Source: China Statistical Yearbook
Figure 8. Rural Household Per Capita Annual Purchases of Major Commodities (kg)
2001 2002 2003 2004Grain (Unprocessed) 250.23 236.50 222.44 250.23
Wheat 80.27 76.31 73.23 80.27Rice 126.82 123.11 119.31 126.82
Soybeans and Related Products 5.49 5.76 5.28 5.49Soybean 2.53 2.20 2.05 2.53
Fresh Vegetable 111.98 110.55 107.40 106.74Edible Oil 7.06 7.53 6.27 7.06Meats, Poultry and Related Products 18.30 18.60 19.68 18.30
Pork 13.28 13.70 13.78 13.28Beef 0.52 0.52 0.50 0.52Mutton 0.61 0.65 0.76 0.61Poultry 2.81 2.91 3.20 2.81
Eggs and Related Products 4.77 4.66 4.81 4.77Milk and Related Products 1.06 1.19 1.71 1.06Aquatic Product 3.92 4.36 4.65 3.92Sugar 1.28 1.64 1.24 1.28Fruits and Related Products 18.31 18.77 17.54 7.02Nuts and Related Product 0.74 0.78 0.72 0.74
UNCLASSIFIED USDA Foreign Agricultural Service

GAIN Report – CH5607 Page 11 of 33
Source: China Statistical Yearbook
As the tables above show there have been substantial increases in poultry, milk, yogurt, cake and pork consumption amongst urban residents. Urban residents are also eating less grain and nuts. However, this data is most likely for raw forms of food and does not indicate consumption of processed grains or packaged/processed nuts, the consumption of which has been increasing. While not all of the foods listed in these tables are processed, the data, along with the market value in figures 4 and 5, indicate strong preferences for certain types of food that will affect the food processing industry.
Growth in overall food consumption in rural areas remains limited with emphasis on meats, dairy and fish products while other foods such as edible oils actually declined. There is very little data for processed food consumption in rural areas, which is indicative, of how little is consumed.
It is worth noting that over 90 percent of urban households have refrigerators today while only around 18 percent of rural households have them. Furthermore, less than 7 percent of urban households have freezers. Therefore, the urban market is ready for foods that require refrigeration while it will most likely be several years before they can be sold in rural markets. While the frozen food market has consistently increased it probably indicates that most frozen food is eaten soon after it is purchased. Frozen food is not particularly popular with consumers in the south of China but is still widely used in the food service industry there. Furthermore the number of households with access to refrigerators is increasing annually, 10 percent between 2001 and 2003. Although no official statistics exist, microwaves are rapidly becoming a more common appliance in urban households. For example retail surveys in Shanghai show that over 450,000 microwave ovens were sold in retail outlets across the city in 2002. Furthermore this represents a 37 percent increase over 2001.
Figure 9. Urban Per Capita Annual Food Consumption by Income Bracket (kg)
Income Bracket Average High HighestCake 4.18 5.58 5.74Milk 18.62 26.82 28.29Yogurt 2.53 3.92 4.33Fresh Fruit and Melons 56.57 70.84 75.08Shrimp 1.33 2.15 2.72Fish 9.79 12.43 14.05Poultry 9.2 11.54 12.77Source: China Statistical Yearbook
The table above shows that certain prized foods are consumed in larger amounts as wealth increases.
Figure 10. Urban Income and Food Expenses in High Income Regions (RMB per capita)*
National Average Shanghai Beijing Zhejiang Guangdong Tianjin Fujian
Total Income 9061.22 16380.25 14959.30 14295.38 13451.13 10971.57 10816.32Disposable Income 8472.20 14867.49 13882.62 13179.53 12380.43 10312.91 9999.54Living Expenditure 6510.94 11040.34 11123.84 9712.89 9636.27 7867.53 7356.26Food 2416.92 4102.65 3522.69 3558.41 3583.72 2963.85 3104.80
Grain 194.15 195.77 224.11 182.99 230.24 217.41 248.98Starches and Tubers 17.08 23.26 26.12 12.62 11.45 24.71 17.22Beans/Bean Products 31.40 56.63 38.15 45.10 25.89 28.05 37.48Oil and Fats 78.46 84.27 81.63 63.42 86.17 79.46 83.28Meat and Poultry 473.19 618.80 575.01 474.87 846.22 479.36 662.66Eggs 60.97 65.73 71.80 47.89 44.85 93.27 71.91
UNCLASSIFIED USDA Foreign Agricultural Service

GAIN Report – CH5607 Page 12 of 33
National Average Shanghai Beijing Zhejiang Guangdong Tianjin Fujian
Aquatic Products 170.31 534.09 160.94 547.10 359.79 271.92 581.56Vegetables 236.44 336.30 266.62 311.38 287.91 249.97 271.53Condiments 35.22 49.59 67.06 36.33 36.21 56.18 44.37Sugar 26.51 54.21 44.56 28.42 36.32 24.24 21.91 Beverages 120.11 212.17 246.46 173.46 106.87 170.61 131.54Dried/Fresh Fruits 174.89 294.26 313.01 255.48 225.50 241.72 207.43Nuts and Kernels 26.14 49.93 64.42 39.21 28.20 55.12 24.71Cake 53.46 118.82 125.94 62.58 73.05 84.08 49.23Dairy Products 124.70 241.82 255.99 139.17 124.01 139.08 153.00Dining Out 438.24 896.85 829.68 827.63 924.09 612.07 346.64* Bold figures indicate notably high amountsSource: China Statistical Yearbook
Regional consumption of packaged foods
Regional variations must be accounted for in the food processing industry. While China may have 1.3 billion people, there is a great urban/rural divide and further variations among urban consumers. Exporters should be aware of where in China their products will have the most impact and educate themselves about the Chinese market. One of the biggest complaints from Chinese importers and distributors of food ingredients is that American exporters often know very little about the Chinese market. In the past, it was very convenient for US companies to ship to brokers in Hong Kong and allow the brokers to worry about distribution and market acceptance. If US companies want to be successful in today’s China market, they need to spend time in China visiting with their importers/distributors to better understand the needs of the market and to take advantage of the great opportunities that lie in this market in the future.
While Guangdong province may rank 4th among the wealthiest areas it spends far more on meat and poultry and dining out than its wealthier counterparts. In fact, demand for meat in Guangdong far outstrips supply--it can only supply 60 percent of its meat demands—making it a coveted market for meat processing enterprises. Guangdong brings in about four million tons of pork each year from surrounding provinces due to increasing demand and restrictions on land and water use within the province.
Take as further examples seafood consumption in Fujian or egg consumption in Tianjin, which is much higher than in other more wealthy areas. Fujian's seafood consumption is roughly triple that of Beijing even though its disposable income is only 70 percent of its wealthier counterpart. In short, agricultural exporters must be aware of significant regional variations and not consider China as a single, large market.
Figure 11: Retail Sales of Packaged Food by Region: Value 1999-2004 (RMB billion)
1999 2000 2001 2002 2003 2004Region
East China 80,656.3 86,966.9 93,969.2 101,765.1 110,503.8 120,020.5Central China 48,683.9 51,868.6 55,618.9 59,875.3 64,290.8 69,118.2North and Northeast China 56,424.7 61,648.3 67,308.2 73,481.9 80,312.9 87,611.0Northwest China 15,480.8 16,710.8 17,829.9 18,988.2 20,207.7 21,758.8South China 54,225.5 58,412.6 62,880.8 67,755.0 73,283.7 79,311.8Southwest China 31,694.3 34,404.2 37,462.4 40,874.4 44,530.7 48,718.2
TOTAL 287,165.5 310,011.5 335,069.5 362,740.0 393,129.5 426,538.4
Source: Euromonitor International estimates
In general China’s market for consumption of packaged foods can be divided into 6 major regions: East, Central, North and Northeast, Northwest, South, and Southwest.
UNCLASSIFIED USDA Foreign Agricultural Service

GAIN Report – CH5607 Page 13 of 33
East China is clearly the largest regional market for packaged foods in China. In terms of value this region will account for 28 percent of all packaged food sold in China. Shanghai is one of China’s leading commercial centers and home to its largest port. With a population of 20 million and a 2004 GDP estimated at $93 billion, the city is at the center of a massive web of development. Shanghai is an aggressively cosmopolitan city, which derives much of its strong sense of identity from a bleeding-edge knowledge of international brands and fashions. This region leads the market for most high-end packaged foods including confectionary, ice cream, dairy products, and other western-style foods such as pasta, packaged bread and Western sauces. This region also has a well established distribution infrastructure and a large number of supermarkets and hypermarkets making transportation and accessibility less of a problem than in other regions. Because of this and the general high level of income, education and openness to western food styles, this region is also an excellent launch area for many new products.
The North and Northeast packaged food markets are also well developed, accounting for nearly 20 percent of total value sales in the country. In general, people in northern China prefer a meatier and starch heavy diet. Combined with somewhat less complicated foods than consumers are used to in the South, northern food and North China constitutes a sizable and tangible market for international food processing businesses in China. Large cities such as Beijing, Harbin and Shenyang provide a strong base for demand. The consumption of noodles, mostly made from wheat flour, is particularly high in this region. Key characteristics of the processed food industry in North China are as follows:
1. Logistical bottlenecks: Especially in Northeast China, the agricultural production supply chain suffers from inefficiency. This is also a reason the processed food industry is less developed in the region. 2. Highly stratified and distribution facility development is not fully in place. For the same reason Carrefour and other big retail players consider establishing their own regional distribution centers in cities of North East China such as Shenyang in 2006. The rationale is to grow trade in local markets before competitors can move in to these segments. 3. Severe weather conditions leaves a shorter window of opportunity to actively market to consumers and businesses. On the other hand, fewer competitors translate into more opportunities to establish markets. This means an offset of transportation and other costs to establish a solid foothold in regional markets. Two recent examples are Anheuser Busch's purchase of Harbin Beer in Northeast China's Heilongjiang Province and New Zealand's Fonterra teaming up with Sanlu Milk Powder of Hebei Province. Both local partners are influential brands that can give the joint venture an advantage on expanding existing market shares. It is anticipated that the food processing sector in Northeast China will repeat the development pattern of those in the Pearl and Yangtze River Deltas several years ago, but with an accelerated pace, since North China is the focus of strategic development for the Country in the 11th five year plan, and stakeholders all have in mind a race against their southern peers. 4. A review of Shandong Province is somewhat representative of the North China food processing sector. In 2005 Shandong had 13 enterprises listed in the top 100 food processors ranking it the first in terms of number of businesses among other provinces. However, compared with peers in Shanghai or Jiangsu Province, they all had lower profit rates, economies of scale, etc. Also, Shandong has more primary food processing rather than manufacturing businesses which means products with lower added value and greater vulnerability with regard to meeting competition, especially when there are price increases in raw materials. Currently, in the value-added food processing sector, Japanese and Korean businesses are more present in Shandong and North East China. The southwest market is the fastest growing with a 9 percent in sales increase in 2004. This fast paced growth is largely due to urbanization of cities like Kunming, Chengdu, and Chongqing. Tourism in these areas has also lead to the consumption of more packaged foods. Sichuan cooking is famous in these regions so it is not surprising that this region has the highest growth rate for sauces, dressings, and condiments and that demand for oil and fats rose 25 percent 2004.
South China is a market whose proximity to Hong Kong and large mainland cities like Guangzhou and Shenzhen is reflected in its high disposable incomes and customer knowledge about new products. In 2004 this region was the largest for oils and fats and the second largest for canned/preserved and chilled foods. Fastest growth is expected for sales of bakery products, dairy products and baby food.
UNCLASSIFIED USDA Foreign Agricultural Service

GAIN Report – CH5607 Page 14 of 33
The Northwest is a relatively underdeveloped market with few large cities and poor distribution channels as is reflected in the fact that it accounts for a mere 5 percent of total packaged food sales.
Sales Patterns
· Presence of traditional wet markets is decreasing.· Presence of hypermarkets and supermarkets is increasing.· The food retail service industry continues to grow rapidly.· Above factors mean a higher presence of processed foods.· 46 percent of retail processed food is sold in hypermarkets and supermarkets.
Figure 12: Food Retailer Sales by Type of Outlet 1999-2003 (RMB billion)
1999 2000 2001 2002 2003
Hypermarkets 96.3 118.5 142.3 170.5 200.8Convenience stores 61.4 67.4 73.5 82.6 92.1Supermarkets 623.5 664.0 721.0 810.5 875.4Other grocery retailers 1,028.8 1,120.3 1,263.0 1,347.4 1,450.3
Total 1,810.0 1,970.2 2,199.8 2,411.0 2,618.6Source: Euromonitor
Supermarkets and hypermarkets are increasing in number and in their share of food sales. Between 2003 and 2004, the number of supermarkets increased by almost 17%. Furthermore, convenience stores such as 7-Eleven are gaining in numbers as well. Traditional wet markets are losing market share, as more and more consumers are concerned about hygiene and food safety while government tax structures are making it more and more difficult for wet markets to operate. These developments bode well for the food processing industry as currently 46 percent of retail processed food is sold in hypermarkets and supermarkets and more than 10 percent in convenience stores. The rest is split between independent grocery stores and other outlets. Targeting middle-class consumers who are increasingly short on time, hypermarkets offer a wide variety of processed products, ranging from fish fillets to ready-made meals.
Figure 13. Consumer Expenditure on Food in Retail Foodservice 1999-2004 (RMB Billion)
Year 2000 2001 2002 2003 2004Expenditure 130.3 137.9 139.7 148.4 160.7
Source: Euromonitor Consumer Food Service in China Report 2005
Eating out is very popular among Chinese consumers and has become a regular occurrence for most in recent years due to the strength of the economy. Most Chinese meals are still prepared at home, but this figure is in decline. The growth in the number of working women and dual-income households, particularly dual-income households without children, has led to an overall improvement in the disposable incomes of Chinese consumers. In larger cities, the fast pace of life leads many to eat out more often. For example, according to a report by the Chinese research institution Sinomonitor International, over 90% of Beijing’s young white-collars aged 18-35 eat out frequently. Also, during the workweek, 54% of working people eat out more than four times per week. These trends have resulted in considerable growth for restaurants, cafés, and fast food and home delivery businesses across the country. With increased purchasing power and more exposure to western lifestyles, Chinese consumers’ tastes have become more and more varied. They are spending more on eating out, demanding a wider variety of food options, and expecting high-quality food.
The growth of a high end food industry is particularly evident in Shanghai. Shanghai had a total of 30,800 registered restaurants in 2004, slightly less than in 2003. Revenues, however, jumped by almost 20% to
UNCLASSIFIED USDA Foreign Agricultural Service

GAIN Report – CH5607 Page 15 of 33
reach 7.5 billion RMB ($937 million). The declining number of entities relative to income reflects continued consolidation in the industry as chain stores and professional food service operations continue to displace small enterprises. It is also important to keep in mind that a) this number lumps restaurants and catering together, and b) the number almost certainly grossly understates the size of the industry, as many small or informal restaurants go unregistered.
Traditionally, the catering industy has been viewed as a poor venue for imported products, due to its focus on box lunches produced at a cost of less than $1 per unit. This is starting to change, however, as consumer concerns about food safety have led many Shanghainese to distrust traditional box lunch manufacturers. In response, several high-end restaurants in commercial districts have started producing box lunches, and several retailers (including Lawson’s convenience stores) have begun offering Japanese-style box lunches. Significantly more expensive than traditional box lunches, the main appeal is combination of high quality with convenience. This has created a potential opportunity for U.S. products, and several companies have held discussions with Lawson’s with an eye to including their products in box lunches.
Shanghai is home to one of China’s most vibrant and innovative restaurant scenes. Although separate statistics on the restaurant industry are not available, the city has seen tremendous development. Shanghai now hosts a cohort of world-class restaurants, including Jean-Georges, Sens et Bund and Laris, catering to the city’s growing business elite. Pizza restaurants are becoming increasingly popular, becoming an important driver for demand for cheese.
One of the most important trends in Shanghai’s restaurant industry is the rapid emergence of high-end Chinese restaurant chains, such as Shanghai Uncle, Xiaonanguo, and Lulu. Shanghainese typically prefer to entertain guests in restaurants rather than at home, and gain a great deal of ‘face’ by taking guests to a high-end restaurant. This is especially true for business dinners, which place a premium on over-the-top displays of generosity. At the same time, they prefer to go to a place that is seen to have reliable quality: foreign cuisines are interesting, but unfamiliar and unsuitable for some occasions. These high-end chain restaurants specialize in providing a reliably excellent dining experience with high-end ingredients and consistent preparation, at a price. They innovate in recipes, but only within certain limits. These restaurants’ demand for consistent high quality, willingness to pay higher prices and very high volume (Xiaonanguo has twenty very large restaurants), makes these an excellent venue for imported ingredients. All already serve imported wines, and most already import a number of other ingredients. Shanghai Uncle has an exclusive arrangement with Gallo Wines, and Lulu featured fresh Washington state cherries as part of a promotion last fall.
Shanghai also has a large community of western restaurants, serving a mixed clientele of western expatriates, Taiwanese and local Chinese who have either lived abroad or are just interested in trying something new. Unofficial estimates put the number of western restaurants at 1,600, serving 20 different cuisines, to an expatriate community estimated at 350,000. Western restaurants are important both as customers for high end products such as wine, and as a means of introducing new products to the market. Some western restaurants have expanded to the point that they generate significant volume on their own: Moon River Diner (U.S. owned and operated), for example, now has three outlets in Shanghai. Specialty restaurants and ethnic restaurants are becoming increasingly common, creating niche markets for very high-end products. Organic food is also becoming an emerging trend, with at least two high-end organic restaurants opening in the past year. Demand is so strong that one local retailer has established strictly controlled greenhouse vegetable farms in the suburbs to cater to the needs of these restaurants.
Demand for knowledge about the preparation and handling of western food is at a premium, and the city suffers from a chronic shortage of well-trained western chefs. One estimate put the number of fully qualified chief chefs (for western food) at 100, most of them working in the star-rated hotels. This constitutes an excellent opportunity for exporters and distributors willing to commit the time to introduce and explain their products. In conjunction with the local chef associations, ATO/Shanghai regularly organizes chef seminars throughout East China that are invariably packed. These events provide USDA cooperator groups such as the Alaska Seafood Marketing Institute, the U.S. Meat Export Federation, the USA Poultry and Egg Export Council, Sunkist Growers, and the California Table Grape Commission, the opportunity to not just introduce new or unusual products, but to explain the proper preparation techniques and potential innovative uses of their products.
UNCLASSIFIED USDA Foreign Agricultural Service

GAIN Report – CH5607 Page 16 of 33
Hotels
Shanghai’s hotel sector is already extremely well developed, but is expanding rapidly under pressure from overwhelming demand. Five and four star hotels are routinely fully booked, and during peak seasons there may be no rooms available at this level in the city. At the end of 2004 Shanghai had 359 star-rated hotels, of which 61 were rated four stars or higher—an increase of 21 over the previous year, 11 of which were four or five star hotels. Expansion is likely to continue or accelerate: Marriott has specifically targeted the Yangtze River Delta for development, while Holiday Inn plans to build hotels in every city in China with an airport in the next few years, including 7 new hotels in Shanghai. Business revenues for Shanghai’s hotel industry amounted to over $1.7 billion in 2004, and average room rates for 5-star hotels reached roughly $150/night, according to local government statistics.
Shanghai Hotel Industry Statistics2003-2004Year Total Five Star Four Star Others2004 359 24 37 2792003 338 20 30 288Source: Shanghai Statistical Yearbook, 2004 and 2005
Restaurants and four and five star hotels continue to form the cutting edge of cuisine in Shanghai, despite growing competition from world-class standalone restaurants like Laris. This makes the hotel industry an ideal entry point for now-to-market and high-end imported food ingredients. As noted earlier, top hotel restaurants have the best qualified chefs for foreign cuisine, and they are generally more familiar with imported products. Whereas other restaurants are willing to be convinced of the virtues of new products, ATO’s experience indicates that these top restaurants aggressively seek them out. They are also more familiar with menu promotions, and their high profile in the restaurant community means that other restaurants tend to follow their lead.
Despite the growth of high end restaurants in large cities like Shanghai, the most popular type of catering outlets in China are still small, cheap, full-service restaurants. These usually provide a range of local dishes, often seasonal in nature, although economic development is reducing seasonal variations in availability of produce. However, the expanding middle class is developing a taste for fast food and quick service restaurants—many office workers buy breakfast snacks on the way to work and eat out for lunch, often more than 3 times a week. Fast food restaurants are rapidly gaining in popularity, especially amongst younger consumers. US-based Yum! Brands Inc, which owns KFC, Pizza Hut and Taco Bell, is the market leader, with 2004 revenue of 9.4 billion RMB ($ 1.1 billion USD) and over 1,200 open in 280 Chinese cities. McDonald's also has over 600 outlets in China. However, fast-food chains must compete with local restaurants that have competitive prices. A typical Chinese take-away lunch box with rice, meat and vegetables costs about $1 USD.
The surge in the popularity of eating out along with the influx of foreign food has had a substantial impact on retail sales of processed food. Consumers often to go supermarkets in search of new foods they have tried in restaurants. The growing number of cafés selling gourmet sandwiches has contributed to an increase in supermarket sales of specialty breads and cheeses. Furthermore, manufacturers have responded to the popularity of ethnic food by creating ready-made sauces and meals and many supermarkets now have specific sections for imported Western, Japanese, Korean and other Asian foods.
E. Challenges and Opportunities
Figure 14: Market Challenges and Opportunities
Opportunity ChallengeWorld’s largest food market; food sector growth in the double digits. China’s economy large enough to survive setbacks that hurt others.
Fragmented market; 65- 70% of people are scattered in the countryside. Poor logistics and infrastructure hamper producers, processors, distributors.
UNCLASSIFIED USDA Foreign Agricultural Service
GAIN Report – CH5607 Page 17 of 33
Opportunity ChallengeFood is an essential part of Chinese culture and social life.
The Chinese have very strong taste preferences. While they are willing to experiment, they are less willing to incorporate foreign tastes into their daily life without product information.
China is incomprehensibly large. Though many consumers still lack the income to purchase imports, millions join the middle class every year.
Regional differences in culture and taste can be quite stark. Promotions with limited budgets must target specific groups.
Chinese consumers spend nearly half of their disposable income on food and beverages. Higher living standards, health education drive consumers to demand better quality, more variety in new diets.
Chinese consumers are price-sensitive: imported products have difficulty competing with domestic substitutes on price.
Changes in urban living styles favor consumption of more processed food.
Basic agricultural production is not well integrated with commercial food processing sector.
Undeveloped agriculture means processors may need to import even basic ingredients to develop their food businesses.
Competition among foreign firms in China is heavy.
Imported goods are generally regarded as high in quality. Many U.S. brands, such as Budweiser, Coca- Cola, M&Ms, Snickers, Campbell’s, Heinz, Wrigley’s, and Pringles are widely recognized in China.
Imports are regarded as luxury goods: the vast majority of consumers do not believe they can afford them.
China is new to food processing, open to foreign processes and technologies.
Intellectual property issues. Successful products are quickly counterfeited and innovative processes may be stolen.
Foreign-invested companies on leading edge of industry, more likely to use imported ingredients.
Local producers catch up quickly; market life of new product may be short.
Low wage structure makes China a good base for value-added processing.
Most Chinese firms are looking for investment, marketing, packaging, and management support.
New markets for imported products are appearing in fast-growing cities throughout China.
Transportation and logistics for these cities remains difficult, and many lack the presence of a qualified distributor for imports.
Overseas fast-food chains are extremely popular, and provide exposure for foreign foods. Overseas retail chains are growing quickly, and carry more imported products than domestic counterparts.
Foreign fast-food chains source most of their products locally. Few of these chains import directly from overseas, working instead through distributors. Many retail chains charge high listing fees to promote new products.
Overseas retail chains and convenience chains are increasingly interested in establishing house brands. This is creating opportunities for bulk shipment of quality foods.
Although interested in quality for their house labels, these chains are tough negotiators, and will leave suppliers with little room for profit.
Food safety concerns favor imported products, especially for health food products including fresh fruit and baby food.
Registering food labels on imported products is a lengthy bureaucratic process. Counterfeiting has a negative impact on perceived quality and safety of foreign brands.
Under WTO, China’s duties on imported foods have fallen, and more products are shipped directly to China, instead of through Hong Kong. WTO entry leads to lower tariffs and import barriers, market and legal reform, and increased access for distributors.
Increased access for imports has resulted in greater competition from other exporting countries for products like beef, seafood and pistachios. Non-tariff barriers such as SPS rules and local protectionism will not disappear quickly despite WTO. Import procedures can be costly, obstructive,
UNCLASSIFIED USDA Foreign Agricultural Service

GAIN Report – CH5607 Page 18 of 33
Opportunity Challengeand inconvenient.
The Chinese market often moves en-masse. If a product becomes trendy, sales can skyrocket overnight.
If a product is successful, it is likely to be counterfeited or imitated.
UNCLASSIFIED USDA Foreign Agricultural Service

GAIN Report – CH5607 Page 19 of 33
Section III: Road Map for Market Entry
· Economic reform and market liberalization, removal of price controls and foreign exchange controls, and movement toward removal of import licensing have enhanced the possibilities for exports to China.
· Regional inconsistency is still a problem.· Although import rules are changing most still use an agent.· Relationships and knowledge of Chinese business practices are essential· Logistics are modernizing but still need a lot of improvement.· Cold storage still limited.· Shrink still a problem, especially for fresh ingredients.
A. Entry Strategy
China's food processing market is extremely diverse and fragmented which makes it nearly impossible to suggest one model for getting US products into the market. However there are certain factors that all exporters should consider such as the great importance of relationships and market knowledge.
China has an ancient business culture that, like its American counterpart, values efficiency and profit. However, there are considerable differences that exporters must take into account. Personal relationships are extremely important as is respect for hierarchy. Do not be surprised if the more economic option is usurped by a long-standing relationship. It is essential to understand the Chinese concept of face and orientation towards groups and not individuals. The emphasis Chinese place on food extends into business practices as well. Dinners and lunches are an essential and informal way to cement relationships. On the ground work and regular visits to China are essential.
As mentioned above, the food market in China is incredibly diverse and varies between urban and rural and from region to region. One should not think of China as a single market of 1.3 billion people but rather as several markets that are loosely connected. It is essential to conduct targeted research on a specific consumer groups and ensure that there will be a market for processed food that needs your exports. Try and figure out how your product can be used in, or add innovation to, typical Chinese food products. Only once a successful business model is established, should it then be attempted in different markets. It is said that US exporters often make the mistake of seeing China as one large market and attempting to spread their product over too large an area without a focus on local promotion and market development. In fact, one of the biggest complaints from Chinese distributors about American exporters is their lack of knowledge about the Chinese market and expectations from local importers and distributors.
When looking for a distributor try to find one that not only has established wholesale and retail outlets but one that has relationships in your target market. Its one thing to accept orders for your product, its another thing to make sure your product is penetrating the market and ensuring future growth. Look for distributors that have technicians on staff and experience working with other exporters. Make sure you visit their facilities and warehouses especially if you are shipping through the cold chain and beware of any company claiming they can ship throughout China. You are better off dealing with individual distributors in different regions. Be prepared to offer technical assistance and support. Also, be sure you and your importer or distributor have a clear understanding of who will pay certain fees as many times the brand owner is expected to pay fees, which in other countries an importer or distributor might otherwise cover.
All exporters should take full advantage of ATO assistance and producer associations as they have on-the-ground experience and relationships with both Chinese and American agricultural interests. Furthermore it is highly recommended that exporters visit the various agricultural and food industry trade-shows that are held throughout China. Contact one of the three ATO offices in China for more information about the most successful trade shows.
B. Distribution
The system for importing agricultural products into China is improving but still remains a rather confusing mix of transport modes and authorities. Once an informal system dominated by Hong Kong and Chinese entrepreneurs, the distribution channel has become more open and more formal where Western ideas, capital and management have greater influence. As more foreign retailers set up operations in China,
UNCLASSIFIED USDA Foreign Agricultural Service

GAIN Report – CH5607 Page 20 of 33
international standards of logistics have been introduced into the country. For example, fast food chains like McDonald’s and KFC have set up cold chain systems that service nearly 200 outlets throughout China.Further change and improvement is still needed to cope with increasing imports. For example, distribution accounts for up to 30 percent of a product’s cost in China, while the figure is as low as 10 percent in the United States. Cold storage is still limited and shrink remains a problem for distributors. While the system is more transparent and tariffs on imported goods are dropping there still remain many roadblocks to smooth and easy importing of foreign agricultural products. In fact, over 70 percent of importers still use an import agent to help navigate the Chinese bureaucracy.
Importers have historically been limited to a small number of state-owned companies that do not make purchasing decisions but rather have official import rights, handle customs and logistics documentation, facilitate government inspection and certification processes and remit payment for the imported products. Purchase decisions are generally made by distributors who do not have import licenses but often handle import logistics, themselves or through a contracted agent, and have an established network of retail customers. However, this is scheduled to change as China, as of April 6th 2004, revamped the import-export license system. By the end of 2005, any company will be allowed to start an import-export activity in China, with no need to get an official license whatsoever. Bear in mind that this change in regulation may sound good in theory but it will no doubt take at least a few years for the change in legislation to have an effect on the practice of importing.
For purposes of food ingredients distribution, China is generally divided into three regions: North China (China north and east of the Yellow River, including Beijing, Tianjin and Manchuria); Huadong, which includes the coast from Shandong to Fujian provinces, the city of Shanghai, and Jiangsu, Zhejiang and Anhui provinces; and South China, mostly Guangdong province. Distribution, retail and food markets in the west of China are still largely undeveloped and virtually inaccessible to processors and importers.
Figure 15: Major Chinese Ports (with annual volume over 100 million tons)
(10, 000 tons)Seaport 2000 2001 2002 2003 2004
Shanghai 20,440 22,099 26,384 31,621 37,896 Ningbo 11,547 12,852 15,398 18,543 22,586 Guangzhou 11,128 12,823 15,324 17,187 21,520 Tianjin 9,566 11,369 12,906 16,182 20,619 Qingdao 8,636 10,398 12,213 14,090 16,256 Dalian 9,084 10,047 10,851 12,602 14,516 Qinhuangdao 9,743 11,302 11,167 12,562 15,037
Total 80,144 90,890 104,243 122,787 148,430Source: China Statistical Yearbook, 2004
Methods of distribution into China:
WholesalersWholesalers are self-financed, specialized business organizations or people who have their own sales and distribution network. They are capable of purchasing large quantities of goods directly from the manufacturers/exporters or from an importing company. The imported goods are sold through wholesalers to the local enterprises with a relatively quick transfer of assets. The wholesalers assume the risk of sale once the foreign products are delivered to a Chinese agent. To a large extent, the wholesalers control the demand and the pricing of the goods.
Commission BasisThe manufacturers/exporters entrust the goods with a business organization or person and agree to settle payment after the goods are sold. As the business organizations or persons incur minimal risk (no capital cost) in selling the products, many of them are willing to sell/distribute the products for a share of the profit or a contractual payment. The manufacturers/exporters do not have to invest in a sales infrastructure but
UNCLASSIFIED USDA Foreign Agricultural Service

GAIN Report – CH5607 Page 21 of 33
their investment is tied down for the duration of the commissioned sale. A high level of trust is required of the parties involved in this method of distribution. It is not appropriate for new business partners.
Third Party LogisticsA small group of foreign-managed companies have been established in ports and free trade zones offering customs clearance, foreign exchange conversion, bonded warehousing and shipment. This channel often requires the supplier to establish a representative office to handle sales and technical support. WTO reforms should enable third party logistics to increase the scope and geographical reach of their work.
Gray Channel The Gray Channel refers to shipments via Hong Kong through local import agents with distribution connections on the mainland. This channel has historically been cheaper than mainland channels as goods are often shipped from Hong Kong outside of official channels or using various methods to evade customs and VAT payments. US exporters should know that this channel is illegal and is an option that is discouraged. Here, the US supplier has little control over their product after it reaches Hong Kong and technical support and supplies are not reliable. Furthermore, non-US products may often be “mislabeled” by Hong Kong agents as being US products.
Many importers report that importing through the same port at different times of the day will result in different tariffs and procedures as the staff has changed. For this reason some find Hong Kong a more consistent port to import through.
While authorities are attempting to gain some control of the gray channel, many estimate that 90 percent of goods destined for south China still travel through Hong Kong. Lower tariffs reduced the cost advantage of moving products through the Hong Kong “gray channel,” and more northerly ports like Shanghai and Qinhuangdao are beefing up infrastructure in hopes of grabbing some of the business. Despite the anticipation, importers and distributors are cautious about the changing shape of the industry. For example, Beijing-based fruit distributors are already importing 90 percent of their fruit directly, with only 10 percent coming via Guangdong through the gray channel. On the other hand Shanghai distributors say they are still buying about 70 percent of their fruit from wholesale markets in Guangzhou, which is the central hub of the gray channel market for imported fruit. So while lower tariffs may allow importers near port cities to displace gray channel imports, it may take a while for newer ports to displace the power of the gray channel in certain areas.
Direct DistributionThe manufacturers/exporters set up their sales outlet and sell their products directly in China rather than through a local business organization or person. The advantage is that the manufacturers/exporters can meet the consumers face to face and learn the market condition and trends. They can also reap the benefits of their sales promptly. The drawback is the need to invest in developing a sales network and the high cost of learning to operate in a foreign market This method should be made easier with China’s revamping of the import-export system.
Exporters must complete the following documentation:· Bill of Lading· Label Certificate (required for all packaged food products)· Invoice· Packing list describing item, weight, and packing material· Certificate of Origin· Sanitary/Phytosanitary Certificates
Importers are responsible for the following documentation:· Import authorization document· Customs Declaration· Quarantine Certificates· Additional product specific documents
UNCLASSIFIED USDA Foreign Agricultural Service

GAIN Report – CH5607 Page 22 of 33
Figure 16. Distribution Flow Chart
C. Company Profiles
Figure 17. Package Food Major Companies by Market Share and Retail Value RMB (millions)
2001 2002 2003% Value % Value % Value
Ting Hsin International Group 3.8 13,058.50 3.7 13,729.30 3.7 14,780.40Kuok Oils & Grains Pte Ltd 1.2 4,245.20 1.3 4,855.70 1.9 7,780.90Inner Mongolia Yili Industrial Group 1.1 3,831.00 1.5 5,547.50 1.8 7,147.00Shineway Group 1.2 4,303.10 1.7 6,263.80 1.7 6,872.20Nestlé SA 1.4 4,939.80 1.5 5,569.80 1.5 6,160.90Lee Kum Kee Co Ltd 1.3 4,647.40 1.4 5,114.90 1.5 5,909.60Bright Dairy & Food Co Ltd - - - - 1.4 5,478.90Foshan Haitian Flavouring & Food Ltd 1.4 4,920.50 1.3 4,837.70 1.3 5,341.10Jiangsu Yurun Food Industry Group 1.3 4,483.40 1.3 4,837.80 1.3 5,267.70Uni-President Enterprises Corp 1.2 4,068.20 1.1 4,216.10 1.2 4,644.40Hai Pa Wang International Food Group 1.1 3,826.60 1.1 3,986.80 1 4,207.60China National Cereals, Oils & Foodstuffs Imp & Exp Corp 0.8 2,727.10 0.8 3,161.40 1 4,133.00Hebei Hua Long Food Co Ltd 0.6 2,036.60 0.8 2,956.80 0.9 3,823.00Danone, Groupe 0.9 2,951.20 0.9 3,456.90 0.9 3,794.20Inner Mongolia Mengniu Group 0.3 1,010.60 0.6 2,155.20 0.9 3,765.80Unilever Group 0.8 2,706.20 0.9 3,290.50 0.9 3,583.50Shijiazhuang Sanlu Group 0.6 2,068.40 0.8 2,888.30 0.8 3,137.60Long Fong Group 0.9 3,225.00 0.9 3,294.10 0.7 2,974.90McCormick & Co Inc 0.5 1,888.00 0.7 2,495.00 0.7 2,726.50Source: Euromonitor Market Database
UNCLASSIFIED USDA Foreign Agricultural Service

GAIN Report – CH5607 Page 23 of 33
As the above table shows, the food processing industry in China is still very fragmented, a fact confirmed by many in the industry. While the retail sale of processed food in the United States is typically a two-horse race between products such as Coca-Cola and Pepsi, this is clearly not the case in China. The leading retail food processing company only has a total market share of 3.7 percent while the rest in the top twenty have between .7 and 1.9 percent. In fact, 40 percent of the market is shared by over 80 companies, while a tiny portion of the market is taken by artisanal labels with the bulk being in the hands of many small-scale operations. Furthermore, as the table below demonstrates, while there is some stratification in sub-sectors with single entities having a greater share, fragmentation remains.
Figure 17. Processed Food Retail Sub-Sector Market Share (%)
2001 2002 2003Baby food Nestlé SA 17.2 18.5 18.3 Bristol-Myers Squibb Co 11.4 11.4 11.5Bakery products Ting Hsin International Group 1.7 1.7 1.8 Kraft Foods Inc 0.8 1.5 1.5Canned/preserved food Shineway Group 8.5 11.2 11.9 Jiangsu Yurun Food Industry Group 4.9 5.2 5.4Chilled processed food Jiangsu Yurun Food Industry Group 25 25 26 Shineway Group 5.8 11.8 12.2Confectionery Wrigley Jr Co, William 6.1 6.4 6.5 BVI Hsu-Fu-Chi Holdings Ltd 5 4.9 4.9Dairy products Bright Dairy & Food Co Ltd - - 14.6 Inner Mongolia Yili Industrial Group Co Ltd 7.1 9.9 11.2Dried processed food Ting Hsin International Group 34.3 32.9 32.2 Uni-President Enterprises Corp 10.9 10.3 10.4Noodles Ting Hsin International Group 35.1 33.7 32.9 Uni-President Enterprises Corp 11.2 10.6 10.7Oils and fats Kuok Oils & Grains Pte Ltd 32.4 31 38.7 China National Cereals, Oils & Foodstuffs Imp & Exp Corp 19.4 18.8 19.4Pasta Dongguan Humen Ri Long Food Factory 14 15 15.3 Zhuhai Yat Hing Food Ltd 10.5 10.5 10.7Ready meals Hangzhou Wahaha Group 19.5 19.5 19.5 Shanghai Maling Food Co Ltd 18 17.5 17.8Sauces, dressings and condiments Lee Kum Kee Co Ltd 7.8 8.2 9.1 Foshan Haitian Flavouring & Food Ltd 8.3 7.8 8.3Sweet and Savory snacks Hefei Huatai Food Co Ltd 6.5 8.1 8.1 Guangdong Strong (Group) Co Ltd 7.3 7.4 7.3Soup
UNCLASSIFIED USDA Foreign Agricultural Service

GAIN Report – CH5607 Page 24 of 33
2001 2002 2003 Unilever Group 29.9 33.1 36.4 McCormick & Co Inc 15 15 15.5Spreads QP Corp 8.4 8 7.8 McCormick & Co Inc 5.9 6.3 6.4Source: Euromonitor Market Database
As the above table demonstrates, sub-sectors of the retail market remain generally fragmented. Although the top two companies in each sector may account for over 50 percent of the market there are usually more than 20 other enterprises in the sector with shares between .1 and 10 percent. More often than not 20 to 70 percent of the market share goes to companies too small to list. As the industry is further broken down in smaller and smaller sub-sectors, clear leaders prevail in some cases but not all. For example, while Kraft Foods may have the retail market lead in biscuits it only has a 6.2 percent share and the top 13 companies only have 24 percent of the market.
D. Sector Trends
Figure 18. Foreign Funded Food Industry, 2004
Number Sales Revenue (billion RMB) Food Processing 1,776 221.1Manufacture of Foods 1,160 102.8Manufacture of Beverages 526 81.0 Total 3462 404.9Source: China Statistical Yearbook 2005
According to official statistics there are currently 3462 foreign funded ventures with total combined sales revenue of approximately 404.9 billion RMB ($49.37 billion USD) This represents a growing amount of foreign investment in China as the number of state-owned ventures decreases. Foreign-funded ventures typically have more technology and size than Chinese counterparts, process for the domestic market or re-export and are more likely to use foreign ingredients to attain higher quality and consistent input. Big players in the market include, Danone, Cadbury, Cargill, Hormell, Purdue, Nestle, Kraft, Pilsbury, Yum!, Chaeron, Campbell’s, Kellogs, Smithfield, McCormick, and Heinz. Foreign companies have high hopes for China, such as Heinz, which expects 20 percent-30 percent of its ketchup supply to come from China and is the market leader in baby cereal. American companies are not the only one's getting into the market though. Asian companies from Japan and Korea play a dominant role in foreign investment while EU investment continues to increase. For example, Nippon Suisan Kaisha recently built its largest plant in Qingdao to process for export to Japan.
Headaches
As the number of foreign-funded enterprises continues grow there have been, and will continue to be, certain difficulties, especially for production geared toward the domestic market. Many foreign companies are not familiar with the Chinese market or sensitive enough to the importance of price, even among the more affluent and growing middle class. While more and more consumers are looking towards quality and choice, most, probably more than 80 percent, view price as the most important factor in purchasing processed foods, while less than 20 percent view quality as the primary factor. Given that foreign funded companies tend to produce high quality products at higher prices it can be difficult to break into the Chinese market. In 1993, for example, multinational dairy corporations began to break into China's domestic market. Nestle, Kraft, Danone and Parmalat all began to build their own manufacturing and distribution channels. Soon, however, they met repeated setbacks. Kraft withdrew from the Beijing dairy market in 2002. Parmalat Nanjiing, founded in 2001, saw sales of its dairy products on the decline less than two years later in Shanghai and Nanjing. Danone started a partnership with the domestically owned Bright Dairy Co. in 1992 but by 2001 had only a 3.8 percent share in the joint-venture and by 2002 had
UNCLASSIFIED USDA Foreign Agricultural Service

GAIN Report – CH5607 Page 25 of 33
granted Bright the right to use its trademarks and designs for free until September 2011. Danone only recently bounced back to increase its stake in Bright Dairy to 7.7 percent.
Lessons Learned
Dairy companies had difficulties entering the Chinese market for several reasons. First, multinationals had fewer domestic farms owing to sensitivities over land ownership. Second, traditional dairy distribution in China relies on a fragmented network reaching every street and community of a city, and it is not easy for foreign brands to penetrate even with substantial investments. Third, and perhaps most importantly, multinationals knew little about Chinese consumption habits and miscalculated the positioning of their products. Parmalat, for example, focused only on high-end products selling its fruit-flavored yogurt for 2 RMB per cup, double the price of similar local brands, while their milk was sold only in supermarkets in packaged promotions. Lessons have been learned and multinationals are getting over the initial growing pains but there will always be unanticipated setbacks for processors and agricultural exporters especially if they do not conduct research and familiarize themselves with the Chinese industry and market.
Supply Chain improvement
As more foreign retailers set up operations in China, international standards of logistics have been introduced into the country. Central distribution centers are now a common feature of chained supermarkets. In order to keep prices down, suppliers and manufacturers are often required to deliver their goods to the central distribution center of supermarket chains. The chains will subsequently undertake the distribution to their own stores and will levy suppliers and manufacturers a delivery fee of 3-5% on the cost of goods. Many fast-food companies are following the same model of centralized distribution centers. For some premium products such as wine and spirits, the major supermarkets have begun importing them into the country directly to save on the extra margin charged by importers.
WTO
China formally became a member of the WTO at the end of 2001. Upon accession, China is committed to gradually lowering import tariff rates. Tariffs on agricultural imports will be cut to an average of 17 percent by 2004. Average tariffs will be even lower, at 14.5 percent, for US priority products such as wine, cheese, beef, citrus, pork and poultry. Non-tariff measures, such as most of the import licensing arrangements and import quotas, will also be abolished in phases. China has also committed to liberalizing and allowing greater foreign participation in distribution, telecommunication, finance, and professional services. However, local importers have said that as tariffs on certain commodities drop, some Chinese customs officials have found other ways of raising the cost of importing products, sometimes by increasing the estimated value of products entering the country.
China’s entry into the WTO has also changed the status of company’s obligation to have joint venture status. This has allowed foreign companies to have more oversight and control of their operations in China.
UNCLASSIFIED USDA Foreign Agricultural Service

GAIN Report – CH5607 Page 26 of 33
Section IV: Competition
A. Domestic Competition
· Meat production is expanding but not rapidly enough to keep up with demand. · Cereal output is in decline and may continue to be displaced by high-value fruits and vegetables.· Despite skyrocketing production, supply of fruits is not likely to match domestic demand.· Milk production has skyrocketed but still lags behind demand. Technology is helping to improve
domestic output with many feeling that China will be able to satisfy most of its demand through domestic production.
As a matter of national security, the government aims to cap bulk agricultural imports at just 5 percent of all food consumed in China. Given rising incomes, population growth, shrinking arable land and trade liberalization, this target will be hard to meet. In fact, most insiders feel it is an impossible goal without a complete restructuring of the farming industry. In fact, for the first time in many years, China ran an agricultural deficit in 2003. It is expected to maintain a deficit for many years to come.
Figure 19: Domestic Agricultural Output, Yield of Farm Crops (10 000 tons)
1999 2000 2001 2002 2003 2004 Grain 50,838.6 46,217.5 45,263.7 45,705.8 43,069.5 46,946.9
Cereal 45,304.1 40,522.4 39,648.2 39,798.7 37,428.7 41,157.2Rice 19,848.7 18,790.8 17,758.0 17,453.9 16,065.6 17,908.8Wheat 11,388.0 9,963.6 9,387.3 9,029.0 8,648.8 9,195.2Corn 12,808.6 10,600.0 11,408.8 12,130.8 1,1583 13,028.7
Oil-bearing Crops 2,601.2 2,954.8 2,864.9 2,897.2 2,811.0 3,065.9Peanuts 1,263.9 1,443.7 1,441.6 1,481.8 1,342.0 1,434.2Rapeseeds 1,013.2 1,138.1 1,133.1 1,055.2 1,142.0 1,318.2Sesame 74.3 81.1 80.4 89.5 59.3 70.4
Fruits 6,237.6 6,225.1 6,658.0 6,952.0 14,517.4 15,340.9 Apples 2,080.2 2,043.1 2,001.5 1,924.1 2,110.2 2,367.5 Grapes 270.8 328.2 368.0 447.9 517.6 567.5 Citrus 1,078.7 878.3 1,160.7 1,199.0 1,345.4 1,495.8
Meat 5,820.7 6,125.4 6,333.9 6,586.5 6,932.9 7,244.8Pork 3,890.7 4,031.4 4,184.5 4,326.6 4,518.6 4,701.6Beef 505.4 532.8 548.8 584.6 630.4 675.9Mutton 251.3 274.0 292.7 316.7 357.2 399.3
Milk 806.9 919.1 1,122.9 1,400.4 1,848.6 2,368.4Poultry Eggs 2,134.7 2,243.3 2,336.7 2,462.7 2,606.7 2,723.7
Total Aquatic Products 4,122.4 4,278.5 4,381.3 4,564.5 4,704.6 4,901.8 Seawater Products 2,471.9 2,538.7 2,571.7 2,646.3 2,685.8 2,767.8
Freshwater Products 1,650.5 1,739.7 1,09.6 1,918.2 2,018.8 2,134.0
Source: China Statistical Yearbook, 2005
With China’s grain production no longer under heavy government control, many Chinese farmers are switching to production of more profitable high-value commodities, such as fruits and vegetables. Domestic
UNCLASSIFIED USDA Foreign Agricultural Service

GAIN Report – CH5607 Page 27 of 33
grain production is in decline while fruit production is skyrocketing. However, the sudden surge in fruit output is not surprising given that Chinese farmers are known to quickly change their crops in reaction to market prices and demand. Production of oilseeds is also in decline and the gradual rise in meat production is not likely to match demand. Furthermore, China’s domestic fishing industry has been severely strained by over fishing in recent years while aquaculture production continues to increase. China now produces over 70 percent of the world’s aquaculture products.
B. Non-US Competition
Note: The following information is based on Chinese customs data retrieved from the Global Trade Atlas System. Commodities are specified by their HS code.
Beef (0202)· Currently US and Canada are out of the market owing to BSE which has allowed Australia and
New Zealand to capitalize on exports of beef and live cattle· New Zealand is currently exporting maximum capacity of live dairy cattle· BSE situation have caused beef imports to steadily decline and has been a boon to domestic beef
industry · The beef market is expected to open in mid-2006
Total value of imports (USD): $5,613,570
Currently, Australia supplies nearly all of China’s imported beef, with almost 98 percent of the market. Supply sources for imported beef in 2004 were a bit more diversified including Australia, New Zealand and Brazil who have 60, 26 and 13 percent market shares respectively. Prior to BSE, the United States had 71 percent of the market in imported beef. For comparison, note that the value of imported meat in 2002 was $ 11,909,979 USD and that the value of imports from the United States was more than $8.6 million USD
Pork (0203)Total value of imports (USD): $28,968,288Total value of US imports (USD): $4,809,778
· Pork is the main meat consumed by Chinese, accounting for 66% of sales by volume in 2004
The current major suppliers of pork are the Canada, United States, and Denmark who have 67, 16 and 14 percent market shares respectively. Imports of pork have experienced an annual decline of roughly 50 percent per year since 2003 when the total value of pork imports reached a high at $90,638,565. At that time the United States was held the largest market share with 42 percent, while Canada and Denmark each held 25 percent.
Poultry (0207)Total value of imports (USD): $334,818,462Total value of US imports (USD): $178,575,820
The current major suppliers of poultry are the United States, Brazil, and Argentina with 53, 38, and 6 percent market shares respectively. Traditionally, the United States has been the largest importer of poultry to China. However, due to concerns over Avian Influenza in 2003 market restrictions caused imports from the United States dropped nearly 86 percent, allowing Brazil and Argentina to gain larger market shares. Between 2004 and 2005 the United States increased imports from 79,404 to 208,299 tons and was able to regain its larger market share.
Cereals (10)
Total value of imports (USD): $1,394,913,529Total value of US imports (USD): $105,227,602
Corn (1005)Total value of imports (USD): $1,379,753Total value of US imports (USD): $352,918
UNCLASSIFIED USDA Foreign Agricultural Service

GAIN Report – CH5607 Page 28 of 33
Wheat (1007)Total value of imports (USD): $ 3,515,696Total value of US imports (USD): $ 495,857
The current major suppliers of cereals Australia, Canada, and France with 34, 30, and percent market share respectively. It is important to note though that between 2003 and 2004 the total value of cereal imports from the United States went from $39,220,267 to $648,505,294, a 1,522 percent increase, giving them a market share of 29 percent. In 2005, however, imports dropped 82 percent, leaving total US cereal imports valued at $105,227,602. Wheat imports are expected to grow in the coming years to meet the needs of the burgeoning bakery sector and its demand for high quality wheat flour.
Dairy Products (04)
Total value of imports (USD): $462,431,145Total value of US imports (USD): $60,910,813
New Zealand is currently the largest supplier of diary products with 48 percent market share, dominating in both fresh and powdered milk and cheeses. The United States is the second largest with 13 percent and Australia and France follow with each around 11 percent market shares. The United States market share has steadily increased since 2003, this past year rising 47 percent. Also, China is currently introducing new laws that will exclude any pasteurized milk from bearing the label “fresh milk.” This means that regular pasteurized milk will no longer be as distinguished from UHT milk or milk made from milk powder. This will give exporters of milk powder a potential advantage.
Seafood (03)· Chinese typically prefer fresh seafood to frozen, which made up over 63% of sales in 2004· Demand for frozen seafood should increase with the rise in numbers of personal refrigerators and
freezers and cold chain distribution networks extend further into the country.
Frozen Fish (303)Total value of imports (USD): $ 2,199,983,963Total value of US imports (USD): $ 295,038,359
Frozen Fish Fillets and Meat (304)Total value of imports (USD): $43,548,446Total value of US imports (USD): $11,819,416
Crustaceans (306)Total value of imports (USD): $312,035,531Total value of US imports (USD): $11,521,992
Major suppliers of whole frozen fish are Russia and the United States. Russia has 48 percent of the market while the United States holds just over 13 percent. It is worth noting that the United States has made small but steady gains in the market of about a 2 percent increase in market share per year over the past 3 years while Russian imports have been in decline. Other suppliers such as the Canada, Netherlands, Norway, South Korea and Japan have between 2 and 7 percent each. For frozen fish fillets and fish meat, the United States and Vietnam are the market leaders with 27 and 19 percent shares. Both countries have taken increasing market shares over the past few years along with steady growth from Chile, while competition from New Zealand and Thailand has been in decline. Canada is currently the most significant exporter of crustaceans with 32 percent market share. The rest of the market is highly fragmented with countries including Greenland, Russia, Japan, and Australia holding only 5 to 7 percent. The United States currently holds around 4 percent.
Vegetables (07)Total value of imports (USD): $ 523,768,505Total value of US imports (USD): $17,080,782
UNCLASSIFIED USDA Foreign Agricultural Service

GAIN Report – CH5607 Page 29 of 33
Frozen Uncooked Vegetables (709)Total value of imports (USD): $ 17,967,971Total value of US imports (USD): $13,899,057
Frozen Potatoes Including French Fries (200410)Total value of imports (USD): $41,494,555Total value of US imports (USD): $24,945,336
The vegetable market is generally dominated by Thailand with 65 percent market share. Over the past three years Vietnam has seen a steady decline, while Canada’s market share has increased to 8 percent, a 200 percent increase from 2003. Currently the United States has only 3 percent of the overall market share. However, the United States supplies the majority of frozen vegetables. The US supplies over 77 percent of China’s frozen vegetables and 60 percent of frozen potatoes. In the last 3 years Canada has become increasingly competitive raising its market share from 6 percent in 2003 to over 28 percent in 2005 by value.
Oilseeds (12)· Oilseeds has been one of the most dynamic markets due to increased incomes and changes in
consumer preferences in China recording over 24% growth in value sales in 2004.
Total value of imports (USD): $8,159,001,686Total value of US imports (USD): $3,199,387,722
China has become the world’s largest importer of oilseed products. The major suppliers of oilseeds to China are the United States, Brazil and Argentina who each have 39, 29 and 26 percent of the market. Note that over 99 percent of these imports are soybeans. It is also significant that since 2003 the total value of China’s oilseed imports, particularly soybeans, has increased by more than 30 percent.
Total Fruits and Nuts (08) Total value of imports (USD): $656,290,440Total value of US imports (USD): $108,847,211
Citrus (0805)Total value of imports (USD): $44,628,594Total value of US imports (USD): $25,976,136
Dried Fruit (0813)Total value of imports (USD): $27,200,122Total value of US imports (USD): $619,145
Nuts (0802)Total value of imports (USD): $87,841,535Total value of US imports (USD): $19,040,219
In terms of volume, Philippines, Thailand, and Vietnam are the market leaders. Each country has about 25 percent of the market while the United States has 9 percent. In terms of value though, Thailand is the leader with nearly 27 percent of the market and the United States has the next highest share with over 17 percent, indicating that the United States is exporting more high value fruit and nut products.
As mentioned above in the section on the gray channel, a large amount of US fruit is still shipped via Hong Kong into the Pearl River Delta. Chinese customs data show the value of 2004 US fruit imports as $99,367,747 and the value of imports from Hong Kong as $ 2,364. On the other hand, US customs data reports that the value of exports to Hong Kong in 2004 was $191,272,287. The data appear to indicate that a substantial amount of US fruit is trans-shipped through Hong Kong and unrecorded.
Section V: Best Product Prospects
UNCLASSIFIED USDA Foreign Agricultural Service

GAIN Report – CH5607 Page 30 of 33
In the upcoming years the industry will focus on the development of corn and wheat goods, dairy products, food additives and seasoning essentials.
· Developing corn and wheat goods will suit US exporters particularly well. · Dairy products continue to grow in popularity among Chinese consumers, and improving cold
storage capabilities and expansion of supermarket chains will ensure a steady demand.· China’s consumers are demanding more and more fish and seafood. At the same time, domestic
seafood production is limited by new limits on fishing. · China’s entry into the World Trade Organization should provide further support for imports, with
tariffs scheduled to fall to 14 percent or less by the end of 2005 and most non-tariff measures to be eliminated completely by 2007.
· Greater urban affluence altering consumer tastes for varied foods should assure rising demand for nuts and other imported products.
· Sophisticated baked goods are becoming more popular and bakeries need high quality imported ingredients. More and more bakeries are also using innovative ingredients in traditional products such as moon cakes.
· China’s appetite for edible oil and meal continues to rise at impressive rates as the economy expands. Per capita edible oil consumption in the last two years has increased at an annual average rate of over 9 percent and with limited domestic soybean production has led to over 20mmt of soybean imports per year.
Good product prospects include: almonds, beef, cereals, cherries, corn, crustaceans, fish products, frozen potato products, blueberries, hazelnuts, infant formula, juices and concentrates, lobsters, macadamias, mollusks, oranges, pistachios, pollock, pork, poultry, prunes, raisins, salmon, scallops, soybeans, soy flour, thickeners, table grapes, and wine.
Figure 20. Best Products Prospects: Value and Growth
Item Total Value of Imports (USD) 5 Year Growth Factor
1999 2004 (2004 as multiple a of 1999)
Almonds 1,465,875 4,047,718 2.76Beef 5,734,699 7,109,957 1.24Cereals 497,047,510 2,218,542,636 4.46Cherries 19,437 2,333,765 120.07Crustaceans 122,874,032 312,035,531 2.54Blueberries 323,824 1,163,013 3.59Fish - whole (chilled, frozen) 408,383,686 1,516,574,524 3.71Fish - fillets (chilled, frozen) 14,983,029 45,556,256 3.04Frozen Potato/French Fries 3,491,266 51,484,593 14.75Grapes 23,577,944 67,546,114 2.86Hazelnuts 1,021,299 2,296,623 2.25Infant Formula 26,319,528 88,821,019 3.37Juices and Concentrates 13,394,370 61,001,369 4.55Lobsters (uncooked) 1,119 131,185 117.23Mollusks 102,221,765 332,462,177 3.25Oranges 9,460,914 36,994,455 3.91Pistachios 6,477,384 17,432,173 2.69Pollock 1 1,139,638 1,250,250 1.10Pork 2 24,348,589 54,451,507 2.24Poultry 3 409,895,603 153,412,927 0.37
UNCLASSIFIED USDA Foreign Agricultural Service

GAIN Report – CH5607 Page 31 of 33
Item Total Value of Imports (USD) 5 Year Growth FactorPrunes 4 175,396 921,664 5.25Raisins 410,408 14,666,366 35.74Salmon 2,313,383 26,612,317 11.50Scallops 3,908,402 8,022,977 2.05Soybeans 890,303,816 6,956,653,547 7.81Soy Flour 1,319,983 1,758,052 1.33Thickeners 6,350,226 12,603,501 1.98Whey Powder 57,965,310 119,744,400 2.07Wine (containers less than 2L) 6,695,561 25,246,505 3.77Wine (containers more than 2L) 27,044,673 24,435,609 0.901. 2001 high was $ 2,560,8902. 2001 high was $ 81,365,4133. 2002 peak was $ 461,774,5424. 2002 peak was $ 2,573,138Source: Chinese customs data
Section VI: Growing opportunities for Chinese holiday food ingredients
Traditional golden-brown mooncakes.
Mooncakes are traditional treats eaten during the Chinese Mid-Autumn day festival, otherwise known as Moon or Mooncake festival. This ancient Chinese holiday has its roots in a legend about the “lady living on the moon” and Chinese celebrate the holiday by moon gazing and making small, but high calorie cakes about the size of one’s fist called mooncakes. Traditional mooncakes have an outside crust of flour, lard, oil and sugar and various fillings such as egg yolks to symbolize the moon, red and green bean past, and lotus seeds. However, with China’s recent growing affluence and consumers’ exposure to more western tastes, the variety of mooncakes has reached an entire new level, making them prime opportunities for suppliers of various food ingredients including a wide array of fruits, nuts, and different flavoring additives.
In recent years making traditional mooncakes at home has largely been replaced by buying fancier, packaged mooncakes that come in a wide range of new and exotic flavors. A few examples of these new, non-traditional mooncake flavors are chocolate, green tea, ice-cream, and mooncakes with fruit, nuts, and meat fillings. Foreign owned producers are often the ones promoting these new flavors. In fact, even Starbucks and Haagen-Dazs have taken advantage of these new demands by offering coffee-flavored and ice-cream flavored mooncakes. Although these new varieties of mooncakes do not come cheap, sometimes costing as much as 300 yuan or around US $40, they have become very popular among customers in affluent urban areas. Since it is common to give mooncakes as gifts to friends, family, and employers during the holiday, this willingness to spend is not surprising given the strong connection between gift-giving and the Chinese concept of “face”.
Figure 21. Retail Sales of Moon Cakes 2003-2004
Value sales, RMB million
UNCLASSIFIED USDA Foreign Agricultural Service

GAIN Report – CH5607 Page 32 of 33
2003 2004
Moon cakes 7,000 8,400
Source: Trade association (China Food Industry Association), Euromonitor International estimates
Today, the sale of mooncakes is a quickly growing industry with value sales of packaged of mooncakes in 2004 estimated at 8.4 billion RBM (US$ 1.04 billion) representing a 16.6 percent growth from the previous year. Although only around 5,000 mooncake manufactures are officially registered, many hotels and restaurants will produce and sell their own mooncakes to take advantage of the high demand during peak season. The sales season for mooncakes is very short. Even though promotion and pre-sales events sometimes happen as early as June, the peak time for sales of mooncakes only last about 10 days between September and October. Mid-autumn festival falls on October 6th for the year 2006. During this time domestic competition is very high, with lots of aggressive promotions as everyone tries to take advantage of the short season. As of yet, there is not a widely recognized national brand, only leading brands by region. Top brands in the East are Xing Hua Lou and Guan Sheng Yuan. The North and Northeast region is led by Dao Xiang Cun and Hao Li Lai, number one and two respectively. Guangzhou Jiujia and Lian Xiang Lou are the top brands of Southern China.
An estimated 20 percent annual growth of mooncake sales and emphasis on new and innovative flavors will continue the demand for high quality ingredients from US producers. ATO Guangzhou is teaming up with the National Highbush Blueberry Council and several other US producer associations to organize a large USA pavilion at the Interbake Show in Guangzhou from May 12-14, 2006. This is one of the largest food ingredient shows in China where food processors place their ingredient orders for the moon cake season which kicks off in the fall. Please contact the Guangzhou office for further information.
UNCLASSIFIED USDA Foreign Agricultural Service

GAIN Report – CH5607 Page 33 of 33
Section VII: Post Contact and Further Information
For further market information, please contact the appropriate ATO office. FAS/China has ATOs inBeijing, Shanghai and Guangzhou. E-mail and fax numbers are as follows:
ATO Beijing: [email protected], (8610) 8529-9962
ATO Shanghai: [email protected], (8621) 6279-8336
ATO Guangzhou: [email protected], (8620) 8667-0773
For policy issues, please contact the Agricultural Affairs Office in the US Embassy in Beijing at:
AAO Beijing: [email protected], (8610) 6532-2962
Further information is also available on the USDA China website at http://www.usdachina.org.
UNCLASSIFIED USDA Foreign Agricultural Service