2003ltr warren buffet essays
22
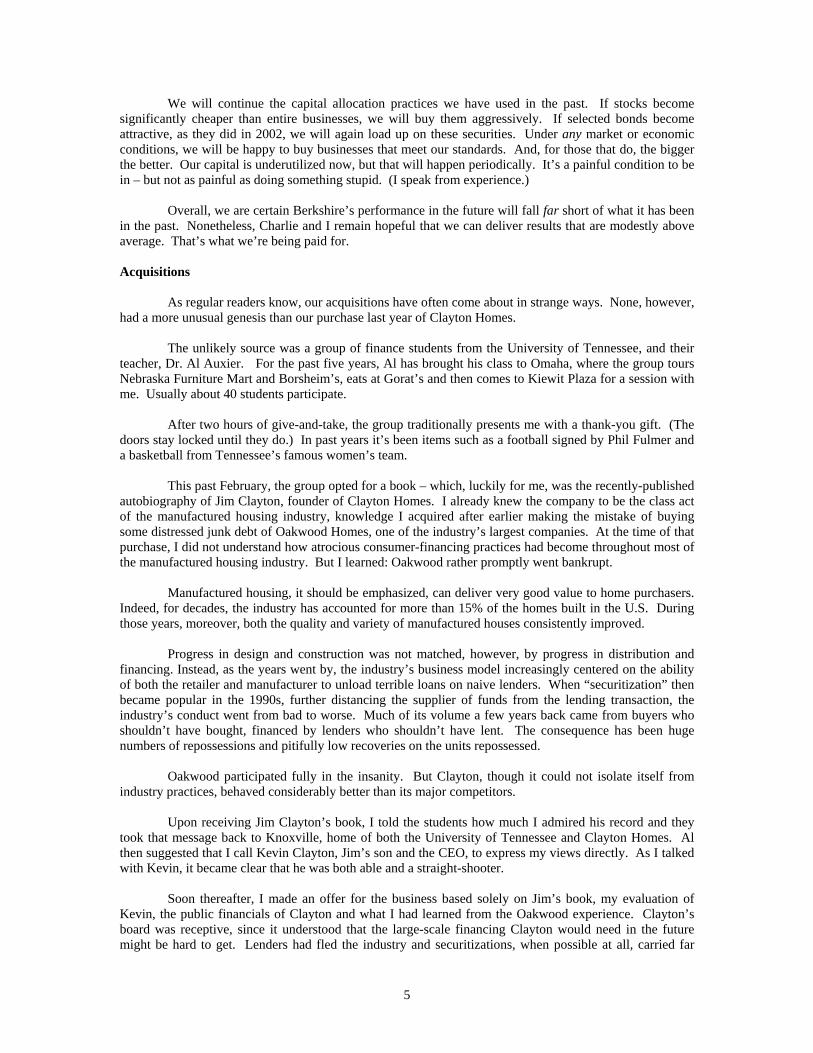
2 Note: The following table appears in the printed Annual Report on the facing page of the Chairman's Letter and is referred to in that letter. Berkshire’s Corporate Performance vs. the S&P 500 Annual Percentage Change in Per-Share in S&P 500 Book Value of with Dividends Relative Berkshire Included Results Year (1) (2) (1)-(2) 1965 .................................................. 23.8 10.0 13.8 1966 .................................................. 20.3 (11.7) 32.0 1967 .................................................. 11.0 30.9 (19.9) 1968 .................................................. 19.0 11.0 8.0 1969 .................................................. 16.2 (8.4) 24.6 1970 .................................................. 12.0 3.9 8.1 1971 .................................................. 16.4 14.6 1.8 1972 .................................................. 21.7 18.9 2.8 1973 .................................................. 4.7 (14.8) 19.5 1974 .................................................. 5.5 (26.4) 31.9 1975 .................................................. 21.9 37.2 (15.3) 1976 .................................................. 59.3 23.6 35.7 1977 .................................................. 31.9 (7.4) 39.3 1978 .................................................. 24.0 6.4 17.6 1979 .................................................. 35.7 18.2 17.5 1980 .................................................. 19.3 32.3 (13.0) 1981 .................................................. 31.4 (5.0) 36.4 1982 .................................................. 40.0 21.4 18.6 1983 .................................................. 32.3 22.4 9.9 1984 .................................................. 13.6 6.1 7.5 1985 .................................................. 48.2 31.6 16.6 1986 .................................................. 26.1 18.6 7.5 1987 .................................................. 19.5 5.1 14.4 1988 .................................................. 20.1 16.6 3.5 1989 .................................................. 44.4 31.7 12.7 1990 .................................................. 7.4 (3.1) 10.5 1991 .................................................. 39.6 30.5 9.1 1992 .................................................. 20.3 7.6 12.7 1993 .................................................. 14.3 10.1 4.2 1994 .................................................. 13.9 1.3 12.6 1995 .................................................. 43.1 37.6 5.5 1996 .................................................. 31.8 23.0 8.8 1997 .................................................. 34.1 33.4 .7 1998 .................................................. 48.3 28.6 19.7 1999 .................................................. .5 21.0 (20.5) 2000 .................................................. 6.5 (9.1) 15.6 2001 .................................................. (6.2) (11.9) 5.7 2002 .................................................. 10.0 (22.1) 32.1 2003 .................................................. 21.0 28.7 (7.7) Average Annual Gain — 1965-2003 22.2 10.4 11.8 Overall Gain — 1964-2003 259,485 4,743 Notes: Data are for calendar years with these exceptions: 1965 and 1966, year ended 9/30; 1967, 15 months ended 12/31. Starting in 1979, accounting rules required insurance companies to value the equity securities they hold at market rather than at the lower of cost or market, which was previously the requirement. In this table, Berkshire's results through 1978 have been restated to conform to the changed rules. In all other respects, the results are calculated using the numbers originally reported. The S&P 500 numbers are pre-tax whereas the Berkshire numbers are after-tax. If a corporation such as Berkshire were simply to have owned the S&P 500 and accrued the appropriate taxes, its results would have lagged the S&P 500 in years when that index showed a positive return, but would have exceeded the S&P in years when the index showed a negative return. Over the years, the tax costs would have caused the aggregate lag to be substantial.
description
annual berkshire hathway letters
Transcript of 2003ltr warren buffet essays
2
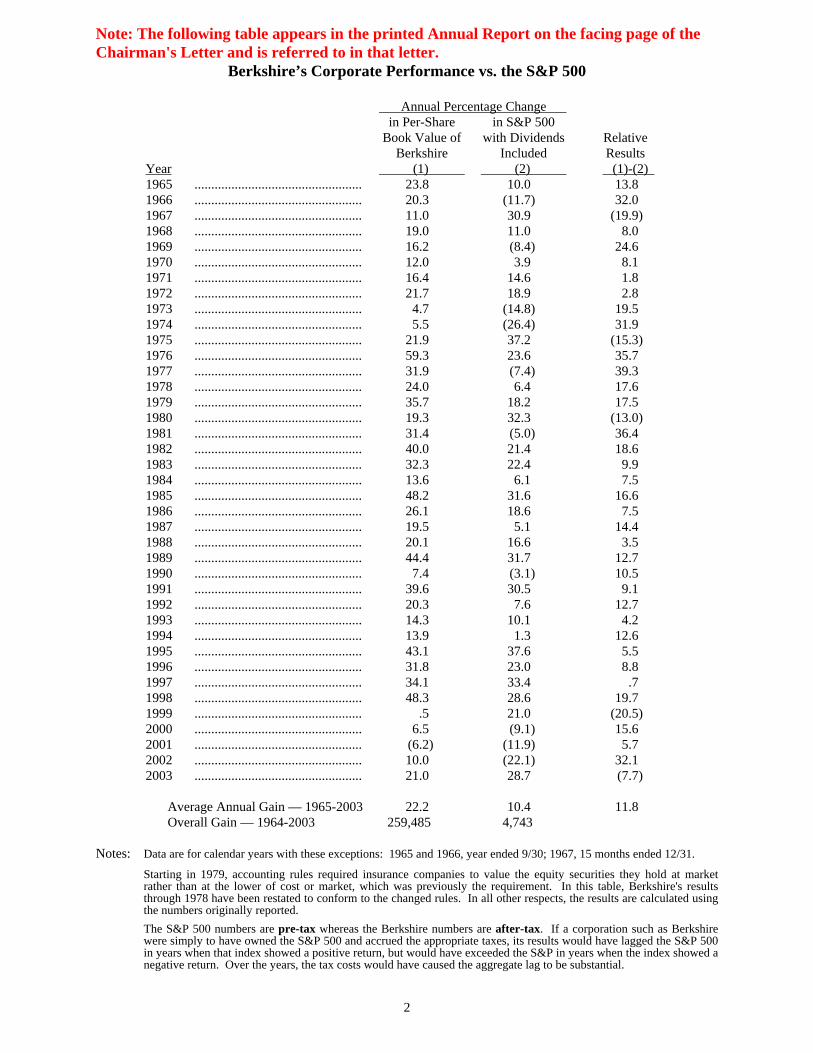
Note: The following table appears in the printed Annual Report on the facing page of theChairman's Letter and is referred to in that letter.
Berkshire’s Corporate Performance vs. the S&P 500
Annual Percentage Change in Per-Share in S&P 500
Book Value of with Dividends RelativeBerkshire Included Results
Year (1) (2) (1)-(2) 1965 .................................................. 23.8 10.0 13.81966 .................................................. 20.3 (11.7) 32.01967 .................................................. 11.0 30.9 (19.9)1968 .................................................. 19.0 11.0 8.01969 .................................................. 16.2 (8.4) 24.61970 .................................................. 12.0 3.9 8.11971 .................................................. 16.4 14.6 1.81972 .................................................. 21.7 18.9 2.81973 .................................................. 4.7 (14.8) 19.51974 .................................................. 5.5 (26.4) 31.91975 .................................................. 21.9 37.2 (15.3)1976 .................................................. 59.3 23.6 35.71977 .................................................. 31.9 (7.4) 39.31978 .................................................. 24.0 6.4 17.61979 .................................................. 35.7 18.2 17.51980 .................................................. 19.3 32.3 (13.0)1981 .................................................. 31.4 (5.0) 36.41982 .................................................. 40.0 21.4 18.61983 .................................................. 32.3 22.4 9.91984 .................................................. 13.6 6.1 7.51985 .................................................. 48.2 31.6 16.61986 .................................................. 26.1 18.6 7.51987 .................................................. 19.5 5.1 14.41988 .................................................. 20.1 16.6 3.51989 .................................................. 44.4 31.7 12.71990 .................................................. 7.4 (3.1) 10.51991 .................................................. 39.6 30.5 9.11992 .................................................. 20.3 7.6 12.71993 .................................................. 14.3 10.1 4.21994 .................................................. 13.9 1.3 12.61995 .................................................. 43.1 37.6 5.51996 .................................................. 31.8 23.0 8.81997 .................................................. 34.1 33.4 .71998 .................................................. 48.3 28.6 19.71999 .................................................. .5 21.0 (20.5)2000 .................................................. 6.5 (9.1) 15.62001 .................................................. (6.2) (11.9) 5.72002 .................................................. 10.0 (22.1) 32.12003 .................................................. 21.0 28.7 (7.7)
Average Annual Gain — 1965-2003 22.2 10.4 11.8Overall Gain — 1964-2003 259,485 4,743
Notes: Data are for calendar years with these exceptions: 1965 and 1966, year ended 9/30; 1967, 15 months ended 12/31.
Starting in 1979, accounting rules required insurance companies to value the equity securities they hold at marketrather than at the lower of cost or market, which was previously the requirement. In this table, Berkshire's resultsthrough 1978 have been restated to conform to the changed rules. In all other respects, the results are calculated usingthe numbers originally reported.The S&P 500 numbers are pre-tax whereas the Berkshire numbers are after-tax. If a corporation such as Berkshirewere simply to have owned the S&P 500 and accrued the appropriate taxes, its results would have lagged the S&P 500in years when that index showed a positive return, but would have exceeded the S&P in years when the index showed anegative return. Over the years, the tax costs would have caused the aggregate lag to be substantial.
3
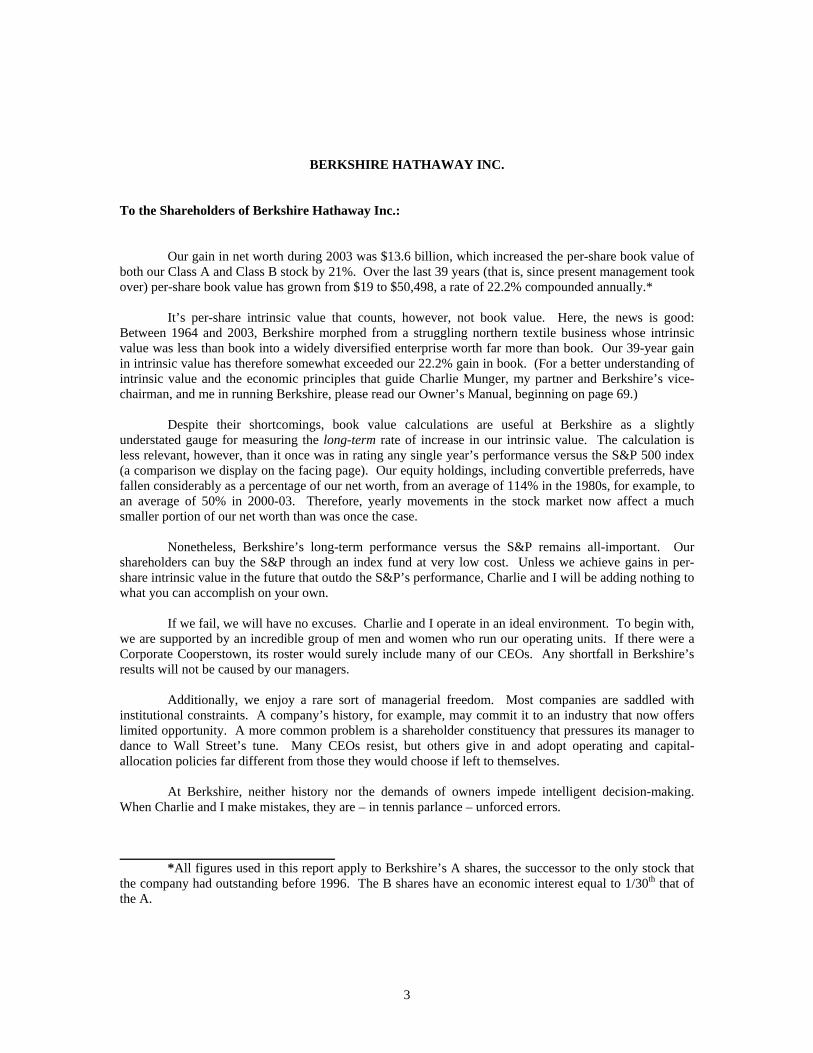
BERKSHIRE HATHAWAY INC.
To the Shareholders of Berkshire Hathaway Inc.:
Our gain in net worth during 2003 was $13.6 billion, which increased the per-share book value ofboth our Class A and Class B stock by 21%. Over the last 39 years (that is, since present management tookover) per-share book value has grown from $19 to $50,498, a rate of 22.2% compounded annually.*
It’s per-share intrinsic value that counts, however, not book value. Here, the news is good:Between 1964 and 2003, Berkshire morphed from a struggling northern textile business whose intrinsicvalue was less than book into a widely diversified enterprise worth far more than book. Our 39-year gainin intrinsic value has therefore somewhat exceeded our 22.2% gain in book. (For a better understanding ofintrinsic value and the economic principles that guide Charlie Munger, my partner and Berkshire’s vice-chairman, and me in running Berkshire, please read our Owner’s Manual, beginning on page 69.)
Despite their shortcomings, book value calculations are useful at Berkshire as a slightlyunderstated gauge for measuring the long-term rate of increase in our intrinsic value. The calculation isless relevant, however, than it once was in rating any single year’s performance versus the S&P 500 index(a comparison we display on the facing page). Our equity holdings, including convertible preferreds, havefallen considerably as a percentage of our net worth, from an average of 114% in the 1980s, for example, toan average of 50% in 2000-03. Therefore, yearly movements in the stock market now affect a muchsmaller portion of our net worth than was once the case.
Nonetheless, Berkshire’s long-term performance versus the S&P remains all-important. Ourshareholders can buy the S&P through an index fund at very low cost. Unless we achieve gains in per-share intrinsic value in the future that outdo the S&P’s performance, Charlie and I will be adding nothing towhat you can accomplish on your own.
If we fail, we will have no excuses. Charlie and I operate in an ideal environment. To begin with,we are supported by an incredible group of men and women who run our operating units. If there were aCorporate Cooperstown, its roster would surely include many of our CEOs. Any shortfall in Berkshire’sresults will not be caused by our managers.
Additionally, we enjoy a rare sort of managerial freedom. Most companies are saddled withinstitutional constraints. A company’s history, for example, may commit it to an industry that now offerslimited opportunity. A more common problem is a shareholder constituency that pressures its manager todance to Wall Street’s tune. Many CEOs resist, but others give in and adopt operating and capital-allocation policies far different from those they would choose if left to themselves.
At Berkshire, neither history nor the demands of owners impede intelligent decision-making.When Charlie and I make mistakes, they are – in tennis parlance – unforced errors.
*All figures used in this report apply to Berkshire’s A shares, the successor to the only stock that
the company had outstanding before 1996. The B shares have an economic interest equal to 1/30th that ofthe A.
4
Operating Earnings
When valuations are similar, we strongly prefer owning businesses to owning stocks. Duringmost of our years of operation, however, stocks were much the cheaper choice. We therefore sharply tiltedour asset allocation in those years toward equities, as illustrated by the percentages cited earlier.
In recent years, however, we’ve found it hard to find significantly undervalued stocks, a difficultygreatly accentuated by the mushrooming of the funds we must deploy. Today, the number of stocks thatcan be purchased in large enough quantities to move the performance needle at Berkshire is a small fractionof the number that existed a decade ago. (Investment managers often profit far more from piling up assetsthan from handling those assets well. So when one tells you that increased funds won’t hurt his investmentperformance, step back: His nose is about to grow.)
The shortage of attractively-priced stocks in which we can put large sums doesn’t bother us,providing we can find companies to purchase that (1) have favorable and enduring economic charac-teristics; (2) are run by talented and honest managers and (3) are available at a sensible price. We havepurchased a number of such businesses in recent years, though not enough to fully employ the gusher ofcash that has come our way. In buying businesses, I’ve made some terrible mistakes, both of commissionand omission. Overall, however, our acquisitions have led to decent gains in per-share earnings.
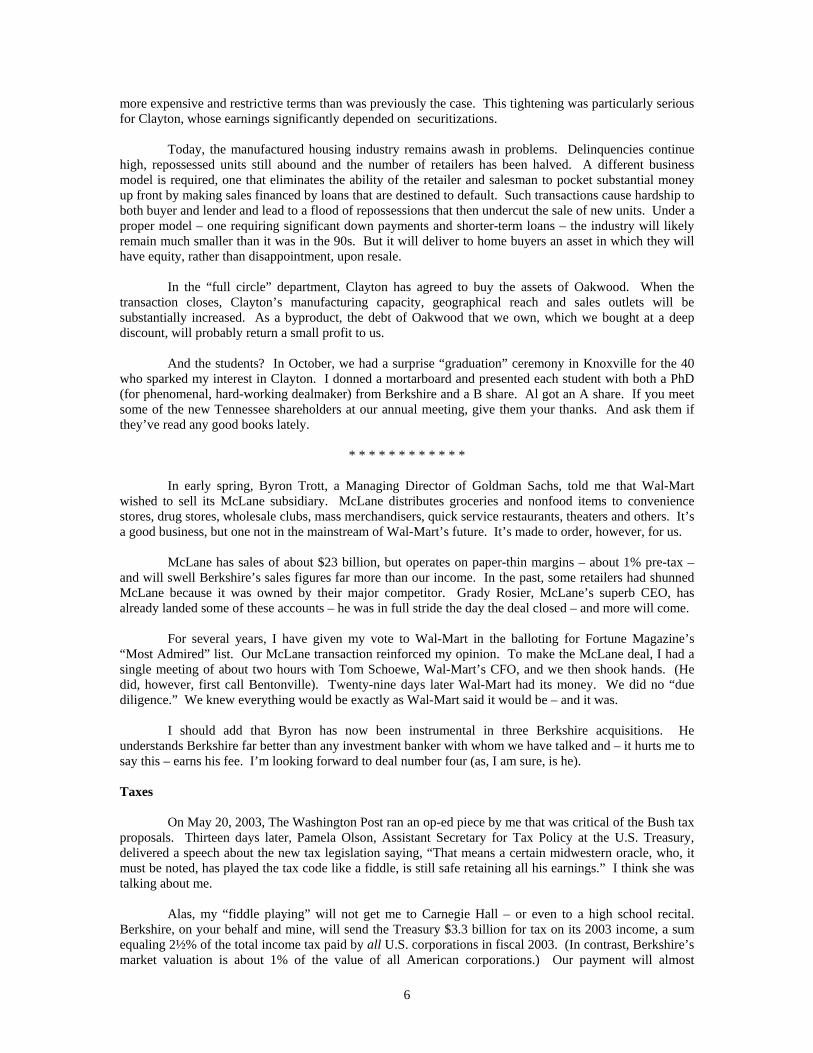
Below is a table that quantifies that point. But first we need to warn you that growth-ratepresentations can be significantly distorted by a calculated selection of either initial or terminal dates. Forexample, if earnings are tiny in a beginning year, a long-term performance that was only mediocre can bemade to appear sensational. That kind of distortion can come about because the company at issue wasminuscule in the base year – which means that only a handful of insiders actually benefited from the toutedperformance – or because a larger company was then operating at just above breakeven. Picking a terminalyear that is particularly buoyant will also favorably bias a calculation of growth.
The Berkshire Hathaway that present management assumed control of in 1965 had long beensizable. But in 1964, it earned only $175,586 or 15 cents per share, so close to breakeven that anycalculation of earnings growth from that base would be meaningless. At the time, however, even thosemeager earnings looked good: Over the decade following the 1955 merger of Berkshire Fine SpinningAssociates and Hathaway Manufacturing, the combined operation had lost $10.1 million and manythousands of employees had been let go. It was not a marriage made in heaven.
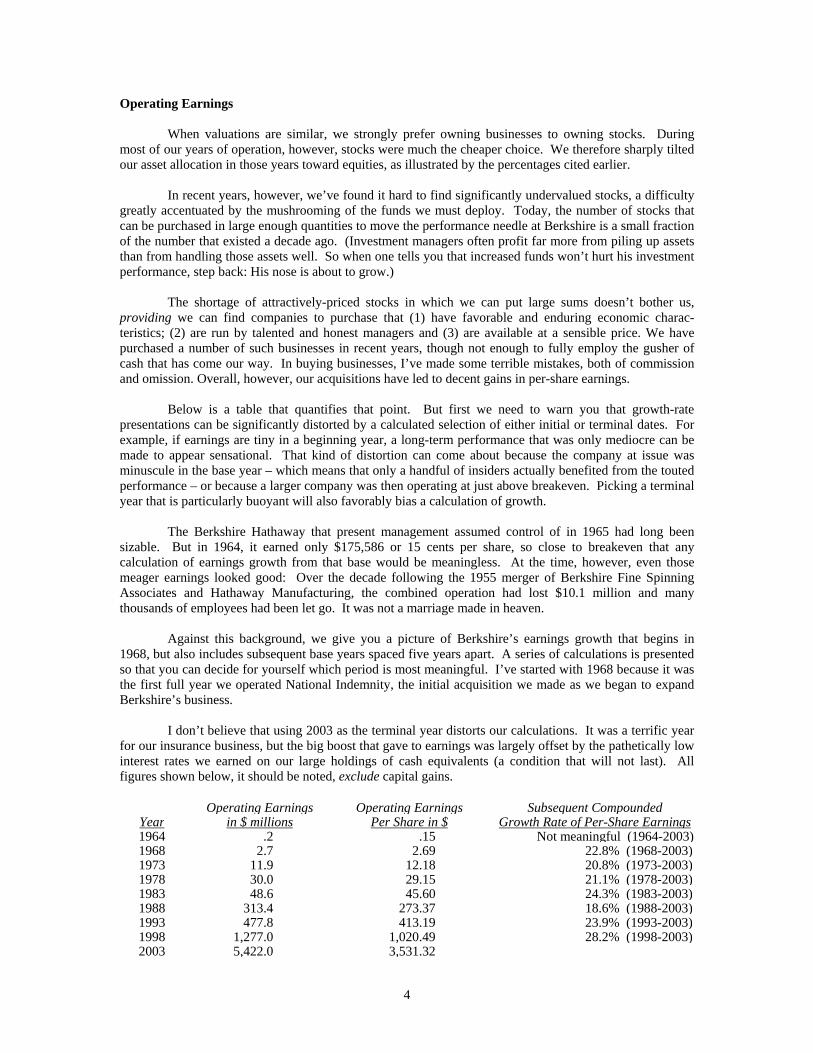
Against this background, we give you a picture of Berkshire’s earnings growth that begins in1968, but also includes subsequent base years spaced five years apart. A series of calculations is presentedso that you can decide for yourself which period is most meaningful. I’ve started with 1968 because it wasthe first full year we operated National Indemnity, the initial acquisition we made as we began to expandBerkshire’s business.
I don’t believe that using 2003 as the terminal year distorts our calculations. It was a terrific yearfor our insurance business, but the big boost that gave to earnings was largely offset by the pathetically lowinterest rates we earned on our large holdings of cash equivalents (a condition that will not last). Allfigures shown below, it should be noted, exclude capital gains.
Operating Earnings Operating Earnings Subsequent CompoundedYear in $ millions Per Share in $ Growth Rate of Per-Share Earnings1964 .2 .15 Not meaningful (1964-2003)1968 2.7 2.69 22.8% (1968-2003)1973 11.9 12.18 20.8% (1973-2003)1978 30.0 29.15 21.1% (1978-2003)1983 48.6 45.60 24.3% (1983-2003)1988 313.4 273.37 18.6% (1988-2003)1993 477.8 413.19 23.9% (1993-2003)1998 1,277.0 1,020.49 28.2% (1998-2003)2003 5,422.0 3,531.32
5
We will continue the capital allocation practices we have used in the past. If stocks becomesignificantly cheaper than entire businesses, we will buy them aggressively. If selected bonds becomeattractive, as they did in 2002, we will again load up on these securities. Under any market or economicconditions, we will be happy to buy businesses that meet our standards. And, for those that do, the biggerthe better. Our capital is underutilized now, but that will happen periodically. It’s a painful condition to bein – but not as painful as doing something stupid. (I speak from experience.)
Overall, we are certain Berkshire’s performance in the future will fall far short of what it has beenin the past. Nonetheless, Charlie and I remain hopeful that we can deliver results that are modestly aboveaverage. That’s what we’re being paid for.
Acquisitions
As regular readers know, our acquisitions have often come about in strange ways. None, however,had a more unusual genesis than our purchase last year of Clayton Homes.
The unlikely source was a group of finance students from the University of Tennessee, and theirteacher, Dr. Al Auxier. For the past five years, Al has brought his class to Omaha, where the group toursNebraska Furniture Mart and Borsheim’s, eats at Gorat’s and then comes to Kiewit Plaza for a session withme. Usually about 40 students participate.
After two hours of give-and-take, the group traditionally presents me with a thank-you gift. (Thedoors stay locked until they do.) In past years it’s been items such as a football signed by Phil Fulmer anda basketball from Tennessee’s famous women’s team.
This past February, the group opted for a book – which, luckily for me, was the recently-publishedautobiography of Jim Clayton, founder of Clayton Homes. I already knew the company to be the class actof the manufactured housing industry, knowledge I acquired after earlier making the mistake of buyingsome distressed junk debt of Oakwood Homes, one of the industry’s largest companies. At the time of thatpurchase, I did not understand how atrocious consumer-financing practices had become throughout most ofthe manufactured housing industry. But I learned: Oakwood rather promptly went bankrupt.
Manufactured housing, it should be emphasized, can deliver very good value to home purchasers.Indeed, for decades, the industry has accounted for more than 15% of the homes built in the U.S. Duringthose years, moreover, both the quality and variety of manufactured houses consistently improved.
Progress in design and construction was not matched, however, by progress in distribution andfinancing. Instead, as the years went by, the industry’s business model increasingly centered on the abilityof both the retailer and manufacturer to unload terrible loans on naive lenders. When “securitization” thenbecame popular in the 1990s, further distancing the supplier of funds from the lending transaction, theindustry’s conduct went from bad to worse. Much of its volume a few years back came from buyers whoshouldn’t have bought, financed by lenders who shouldn’t have lent. The consequence has been hugenumbers of repossessions and pitifully low recoveries on the units repossessed.
Oakwood participated fully in the insanity. But Clayton, though it could not isolate itself fromindustry practices, behaved considerably better than its major competitors.
Upon receiving Jim Clayton’s book, I told the students how much I admired his record and theytook that message back to Knoxville, home of both the University of Tennessee and Clayton Homes. Althen suggested that I call Kevin Clayton, Jim’s son and the CEO, to express my views directly. As I talkedwith Kevin, it became clear that he was both able and a straight-shooter.
Soon thereafter, I made an offer for the business based solely on Jim’s book, my evaluation ofKevin, the public financials of Clayton and what I had learned from the Oakwood experience. Clayton’sboard was receptive, since it understood that the large-scale financing Clayton would need in the futuremight be hard to get. Lenders had fled the industry and securitizations, when possible at all, carried far
6
more expensive and restrictive terms than was previously the case. This tightening was particularly seriousfor Clayton, whose earnings significantly depended on securitizations.
Today, the manufactured housing industry remains awash in problems. Delinquencies continuehigh, repossessed units still abound and the number of retailers has been halved. A different businessmodel is required, one that eliminates the ability of the retailer and salesman to pocket substantial moneyup front by making sales financed by loans that are destined to default. Such transactions cause hardship toboth buyer and lender and lead to a flood of repossessions that then undercut the sale of new units. Under aproper model – one requiring significant down payments and shorter-term loans – the industry will likelyremain much smaller than it was in the 90s. But it will deliver to home buyers an asset in which they willhave equity, rather than disappointment, upon resale.
In the “full circle” department, Clayton has agreed to buy the assets of Oakwood. When thetransaction closes, Clayton’s manufacturing capacity, geographical reach and sales outlets will besubstantially increased. As a byproduct, the debt of Oakwood that we own, which we bought at a deepdiscount, will probably return a small profit to us.
And the students? In October, we had a surprise “graduation” ceremony in Knoxville for the 40who sparked my interest in Clayton. I donned a mortarboard and presented each student with both a PhD(for phenomenal, hard-working dealmaker) from Berkshire and a B share. Al got an A share. If you meetsome of the new Tennessee shareholders at our annual meeting, give them your thanks. And ask them ifthey’ve read any good books lately.
* * * * * * * * * * * *
In early spring, Byron Trott, a Managing Director of Goldman Sachs, told me that Wal-Martwished to sell its McLane subsidiary. McLane distributes groceries and nonfood items to conveniencestores, drug stores, wholesale clubs, mass merchandisers, quick service restaurants, theaters and others. It’sa good business, but one not in the mainstream of Wal-Mart’s future. It’s made to order, however, for us.
McLane has sales of about $23 billion, but operates on paper-thin margins – about 1% pre-tax –and will swell Berkshire’s sales figures far more than our income. In the past, some retailers had shunnedMcLane because it was owned by their major competitor. Grady Rosier, McLane’s superb CEO, hasalready landed some of these accounts – he was in full stride the day the deal closed – and more will come.
For several years, I have given my vote to Wal-Mart in the balloting for Fortune Magazine’s“Most Admired” list. Our McLane transaction reinforced my opinion. To make the McLane deal, I had asingle meeting of about two hours with Tom Schoewe, Wal-Mart’s CFO, and we then shook hands. (Hedid, however, first call Bentonville). Twenty-nine days later Wal-Mart had its money. We did no “duediligence.” We knew everything would be exactly as Wal-Mart said it would be – and it was.
I should add that Byron has now been instrumental in three Berkshire acquisitions. Heunderstands Berkshire far better than any investment banker with whom we have talked and – it hurts me tosay this – earns his fee. I’m looking forward to deal number four (as, I am sure, is he).
Taxes
On May 20, 2003, The Washington Post ran an op-ed piece by me that was critical of the Bush taxproposals. Thirteen days later, Pamela Olson, Assistant Secretary for Tax Policy at the U.S. Treasury,delivered a speech about the new tax legislation saying, “That means a certain midwestern oracle, who, itmust be noted, has played the tax code like a fiddle, is still safe retaining all his earnings.” I think she wastalking about me.
Alas, my “fiddle playing” will not get me to Carnegie Hall – or even to a high school recital.Berkshire, on your behalf and mine, will send the Treasury $3.3 billion for tax on its 2003 income, a sumequaling 2½% of the total income tax paid by all U.S. corporations in fiscal 2003. (In contrast, Berkshire’smarket valuation is about 1% of the value of all American corporations.) Our payment will almost
7
certainly place us among our country’s top ten taxpayers. Indeed, if only 540 taxpayers paid the amountBerkshire will pay, no other individual or corporation would have to pay anything to Uncle Sam. That’sright: 290 million Americans and all other businesses would not have to pay a dime in income, socialsecurity, excise or estate taxes to the federal government. (Here’s the math: Federal tax receipts, includingsocial security receipts, in fiscal 2003 totaled $1.782 trillion and 540 “Berkshires,” each paying $3.3billion, would deliver the same $1.782 trillion.)
Our federal tax return for 2002 (2003 is not finalized), when we paid $1.75 billion, covered a mere8,905 pages. As is required, we dutifully filed two copies of this return, creating a pile of paper seven feettall. At World Headquarters, our small band of 15.8, though exhausted, momentarily flushed with pride:Berkshire, we felt, was surely pulling its share of our country’s fiscal load.
But Ms. Olson sees things otherwise. And if that means Charlie and I need to try harder, we areready to do so.
I do wish, however, that Ms. Olson would give me some credit for the progress I’ve already made.In 1944, I filed my first 1040, reporting my income as a thirteen-year-old newspaper carrier. The returncovered three pages. After I claimed the appropriate business deductions, such as $35 for a bicycle, my taxbill was $7. I sent my check to the Treasury and it – without comment – promptly cashed it. We lived inpeace.
* * * * * * * * * * * *
I can understand why the Treasury is now frustrated with Corporate America and prone tooutbursts. But it should look to Congress and the Administration for redress, not to Berkshire.
Corporate income taxes in fiscal 2003 accounted for 7.4% of all federal tax receipts, down from apost-war peak of 32% in 1952. With one exception (1983), last year’s percentage is the lowest recordedsince data was first published in 1934.
Even so, tax breaks for corporations (and their investors, particularly large ones) were a major partof the Administration’s 2002 and 2003 initiatives. If class warfare is being waged in America, my class isclearly winning. Today, many large corporations – run by CEOs whose fiddle-playing talents make yourChairman look like he is all thumbs – pay nothing close to the stated federal tax rate of 35%.
In 1985, Berkshire paid $132 million in federal income taxes, and all corporations paid $61billion. The comparable amounts in 1995 were $286 million and $157 billion respectively. And, asmentioned, we will pay about $3.3 billion for 2003, a year when all corporations paid $132 billion. Wehope our taxes continue to rise in the future – it will mean we are prospering – but we also hope that therest of Corporate America antes up along with us. This might be a project for Ms. Olson to work on.
Corporate Governance
In judging whether Corporate America is serious about reforming itself, CEO pay remains the acidtest. To date, the results aren’t encouraging. A few CEOs, such as Jeff Immelt of General Electric, haveled the way in initiating programs that are fair to managers and shareholders alike. Generally, however, hisexample has been more admired than followed.
It’s understandable how pay got out of hand. When management hires employees, or whencompanies bargain with a vendor, the intensity of interest is equal on both sides of the table. One party’sgain is the other party’s loss, and the money involved has real meaning to both. The result is an honest-to-God negotiation.
But when CEOs (or their representatives) have met with compensation committees, too often oneside – the CEO’s – has cared far more than the other about what bargain is struck. A CEO, for example,will always regard the difference between receiving options for 100,000 shares or for 500,000 asmonumental. To a comp committee, however, the difference may seem unimportant – particularly if, as
8
has been the case at most companies, neither grant will have any effect on reported earnings. Under theseconditions, the negotiation often has a “play-money” quality.
Overreaching by CEOs greatly accelerated in the 1990s as compensation packages gained by themost avaricious– a title for which there was vigorous competition – were promptly replicated elsewhere.The couriers for this epidemic of greed were usually consultants and human relations departments, whichhad no trouble perceiving who buttered their bread. As one compensation consultant commented: “Thereare two classes of clients you don’t want to offend – actual and potential.”
In proposals for reforming this malfunctioning system, the cry has been for “independent”directors. But the question of what truly motivates independence has largely been neglected.
In last year’s report, I took a look at how “independent” directors – as defined by statute – hadperformed in the mutual fund field. The Investment Company Act of 1940 mandated such directors, andthat means we’ve had an extended test of what statutory standards produce. In our examination last year,we looked at the record of fund directors in respect to the two key tasks board members should perform –whether at a mutual fund business or any other. These two all-important functions are, first, to obtain (orretain) an able and honest manager and then to compensate that manager fairly.
Our survey was not encouraging. Year after year, at literally thousands of funds, directors hadroutinely rehired the incumbent management company, however pathetic its performance had been. Just asroutinely, the directors had mindlessly approved fees that in many cases far exceeded those that could havebeen negotiated. Then, when a management company was sold – invariably at a huge price relative totangible assets – the directors experienced a “counter-revelation” and immediately signed on with the newmanager and accepted its fee schedule. In effect, the directors decided that whoever would pay the mostfor the old management company was the party that should manage the shareholders’ money in the future.
Despite the lapdog behavior of independent fund directors, we did not conclude that they are badpeople. They’re not. But sadly, “boardroom atmosphere” almost invariably sedates their fiduciary genes.
On May 22, 2003, not long after Berkshire’s report appeared, the Chairman of the InvestmentCompany Institute addressed its membership about “The State of our Industry.” Responding to those whohave “weighed in about our perceived failings,” he mused, “It makes me wonder what life would be like ifwe’d actually done something wrong.”
Be careful what you wish for.
Within a few months, the world began to learn that many fund-management companies hadfollowed policies that hurt the owners of the funds they managed, while simultaneously boosting the fees ofthe managers. Prior to their transgressions, it should be noted, these management companies were earningprofit margins and returns on tangible equity that were the envy of Corporate America. Yet to swell profitsfurther, they trampled on the interests of fund shareholders in an appalling manner.
So what are the directors of these looted funds doing? As I write this, I have seen none that haveterminated the contract of the offending management company (though naturally that entity has often firedsome of its employees). Can you imagine directors who had been personally defrauded taking such a boys-will-be-boys attitude?
To top it all off, at least one miscreant management company has put itself up for sale,undoubtedly hoping to receive a huge sum for “delivering” the mutual funds it has managed to the highestbidder among other managers. This is a travesty. Why in the world don’t the directors of those fundssimply select whomever they think is best among the bidding organizations and sign up with that partydirectly? The winner would consequently be spared a huge “payoff” to the former manager who, havingflouted the principles of stewardship, deserves not a dime. Not having to bear that acquisition cost, thewinner could surely manage the funds in question for a far lower ongoing fee than would otherwise havebeen the case. Any truly independent director should insist on this approach to obtaining a new manager.
9
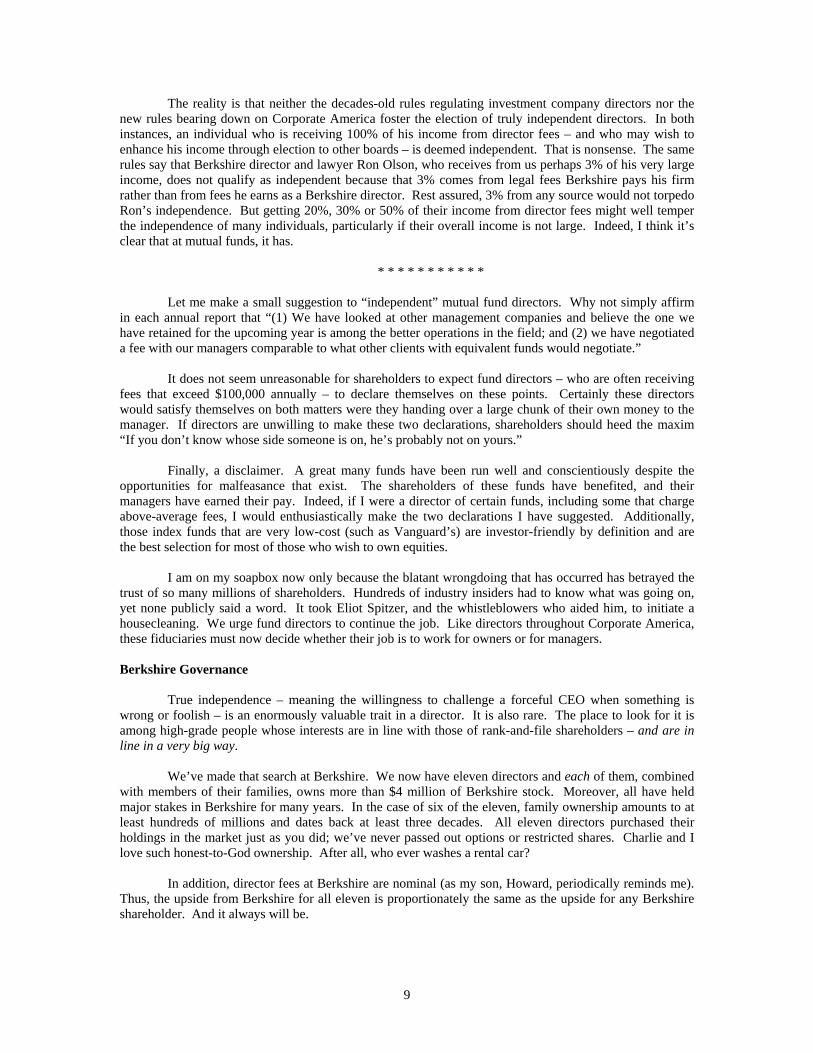
The reality is that neither the decades-old rules regulating investment company directors nor thenew rules bearing down on Corporate America foster the election of truly independent directors. In bothinstances, an individual who is receiving 100% of his income from director fees – and who may wish toenhance his income through election to other boards – is deemed independent. That is nonsense. The samerules say that Berkshire director and lawyer Ron Olson, who receives from us perhaps 3% of his very largeincome, does not qualify as independent because that 3% comes from legal fees Berkshire pays his firmrather than from fees he earns as a Berkshire director. Rest assured, 3% from any source would not torpedoRon’s independence. But getting 20%, 30% or 50% of their income from director fees might well temperthe independence of many individuals, particularly if their overall income is not large. Indeed, I think it’sclear that at mutual funds, it has.
* * * * * * * * * * *
Let me make a small suggestion to “independent” mutual fund directors. Why not simply affirmin each annual report that “(1) We have looked at other management companies and believe the one wehave retained for the upcoming year is among the better operations in the field; and (2) we have negotiateda fee with our managers comparable to what other clients with equivalent funds would negotiate.”
It does not seem unreasonable for shareholders to expect fund directors – who are often receivingfees that exceed $100,000 annually – to declare themselves on these points. Certainly these directorswould satisfy themselves on both matters were they handing over a large chunk of their own money to themanager. If directors are unwilling to make these two declarations, shareholders should heed the maxim“If you don’t know whose side someone is on, he’s probably not on yours.”
Finally, a disclaimer. A great many funds have been run well and conscientiously despite theopportunities for malfeasance that exist. The shareholders of these funds have benefited, and theirmanagers have earned their pay. Indeed, if I were a director of certain funds, including some that chargeabove-average fees, I would enthusiastically make the two declarations I have suggested. Additionally,those index funds that are very low-cost (such as Vanguard’s) are investor-friendly by definition and arethe best selection for most of those who wish to own equities.
I am on my soapbox now only because the blatant wrongdoing that has occurred has betrayed thetrust of so many millions of shareholders. Hundreds of industry insiders had to know what was going on,yet none publicly said a word. It took Eliot Spitzer, and the whistleblowers who aided him, to initiate ahousecleaning. We urge fund directors to continue the job. Like directors throughout Corporate America,these fiduciaries must now decide whether their job is to work for owners or for managers.
Berkshire Governance
True independence – meaning the willingness to challenge a forceful CEO when something iswrong or foolish – is an enormously valuable trait in a director. It is also rare. The place to look for it isamong high-grade people whose interests are in line with those of rank-and-file shareholders – and are inline in a very big way.
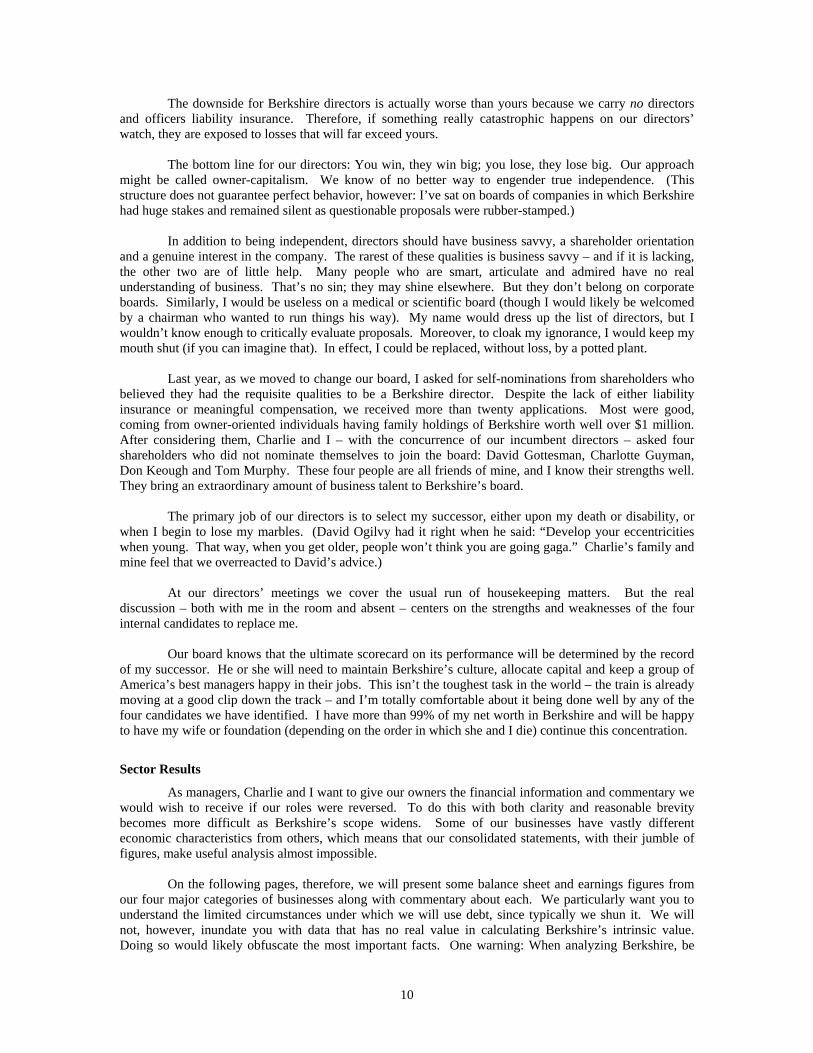
We’ve made that search at Berkshire. We now have eleven directors and each of them, combinedwith members of their families, owns more than $4 million of Berkshire stock. Moreover, all have heldmajor stakes in Berkshire for many years. In the case of six of the eleven, family ownership amounts to atleast hundreds of millions and dates back at least three decades. All eleven directors purchased theirholdings in the market just as you did; we’ve never passed out options or restricted shares. Charlie and Ilove such honest-to-God ownership. After all, who ever washes a rental car?
In addition, director fees at Berkshire are nominal (as my son, Howard, periodically reminds me).Thus, the upside from Berkshire for all eleven is proportionately the same as the upside for any Berkshireshareholder. And it always will be.
10
The downside for Berkshire directors is actually worse than yours because we carry no directorsand officers liability insurance. Therefore, if something really catastrophic happens on our directors’watch, they are exposed to losses that will far exceed yours.
The bottom line for our directors: You win, they win big; you lose, they lose big. Our approachmight be called owner-capitalism. We know of no better way to engender true independence. (Thisstructure does not guarantee perfect behavior, however: I’ve sat on boards of companies in which Berkshirehad huge stakes and remained silent as questionable proposals were rubber-stamped.)
In addition to being independent, directors should have business savvy, a shareholder orientationand a genuine interest in the company. The rarest of these qualities is business savvy – and if it is lacking,the other two are of little help. Many people who are smart, articulate and admired have no realunderstanding of business. That’s no sin; they may shine elsewhere. But they don’t belong on corporateboards. Similarly, I would be useless on a medical or scientific board (though I would likely be welcomedby a chairman who wanted to run things his way). My name would dress up the list of directors, but Iwouldn’t know enough to critically evaluate proposals. Moreover, to cloak my ignorance, I would keep mymouth shut (if you can imagine that). In effect, I could be replaced, without loss, by a potted plant.
Last year, as we moved to change our board, I asked for self-nominations from shareholders whobelieved they had the requisite qualities to be a Berkshire director. Despite the lack of either liabilityinsurance or meaningful compensation, we received more than twenty applications. Most were good,coming from owner-oriented individuals having family holdings of Berkshire worth well over $1 million.After considering them, Charlie and I – with the concurrence of our incumbent directors – asked fourshareholders who did not nominate themselves to join the board: David Gottesman, Charlotte Guyman,Don Keough and Tom Murphy. These four people are all friends of mine, and I know their strengths well.They bring an extraordinary amount of business talent to Berkshire’s board.
The primary job of our directors is to select my successor, either upon my death or disability, orwhen I begin to lose my marbles. (David Ogilvy had it right when he said: “Develop your eccentricitieswhen young. That way, when you get older, people won’t think you are going gaga.” Charlie’s family andmine feel that we overreacted to David’s advice.)
At our directors’ meetings we cover the usual run of housekeeping matters. But the realdiscussion – both with me in the room and absent – centers on the strengths and weaknesses of the fourinternal candidates to replace me.
Our board knows that the ultimate scorecard on its performance will be determined by the recordof my successor. He or she will need to maintain Berkshire’s culture, allocate capital and keep a group ofAmerica’s best managers happy in their jobs. This isn’t the toughest task in the world – the train is alreadymoving at a good clip down the track – and I’m totally comfortable about it being done well by any of thefour candidates we have identified. I have more than 99% of my net worth in Berkshire and will be happyto have my wife or foundation (depending on the order in which she and I die) continue this concentration.
Sector Results
As managers, Charlie and I want to give our owners the financial information and commentary wewould wish to receive if our roles were reversed. To do this with both clarity and reasonable brevitybecomes more difficult as Berkshire’s scope widens. Some of our businesses have vastly differenteconomic characteristics from others, which means that our consolidated statements, with their jumble offigures, make useful analysis almost impossible.
On the following pages, therefore, we will present some balance sheet and earnings figures fromour four major categories of businesses along with commentary about each. We particularly want you tounderstand the limited circumstances under which we will use debt, since typically we shun it. We willnot, however, inundate you with data that has no real value in calculating Berkshire’s intrinsic value.Doing so would likely obfuscate the most important facts. One warning: When analyzing Berkshire, be
11
sure to remember that the company should be viewed as an unfolding movie, not as a still photograph.Those who focused in the past on only the snapshot of the day sometimes reached erroneous conclusions.
Insurance
Let’s start with insurance – since that’s where the money is.
The fountain of funds we enjoy in our insurance operations comes from “float,” which is moneythat doesn’t belong to us but that we temporarily hold. Most of our float arises because (1) premiums arepaid upfront though the service we provide – insurance protection – is delivered over a period that usuallycovers a year and; (2) loss events that occur today do not always result in our immediately paying claims,since it sometimes takes years for losses to be reported (think asbestos), negotiated and settled.
Float is wonderful – if it doesn’t come at a high price. The cost of float is determined byunderwriting results, meaning how losses and expenses paid compare with premiums received. Theproperty-casualty industry as a whole regularly operates at a substantial underwriting loss, and thereforeoften has a cost of float that is unattractive.
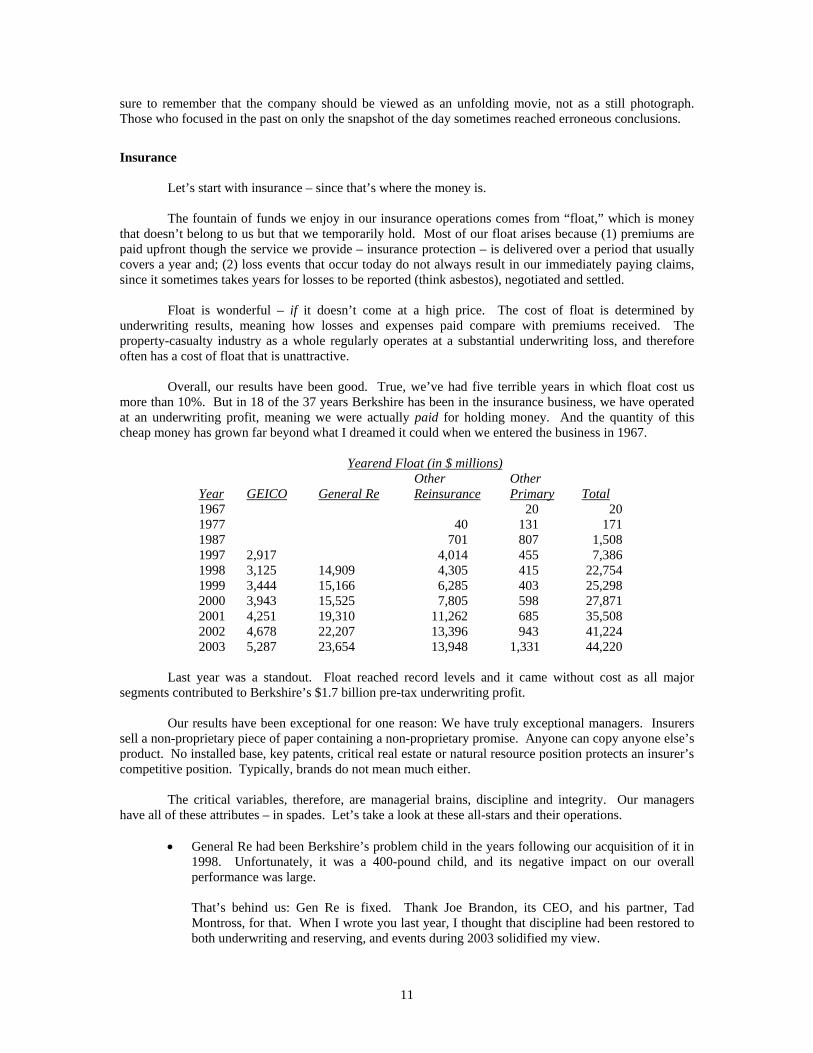
Overall, our results have been good. True, we’ve had five terrible years in which float cost usmore than 10%. But in 18 of the 37 years Berkshire has been in the insurance business, we have operatedat an underwriting profit, meaning we were actually paid for holding money. And the quantity of thischeap money has grown far beyond what I dreamed it could when we entered the business in 1967.
Yearend Float (in $ millions)Other Other
Year GEICO General Re Reinsurance Primary Total1967 20 201977 40 131 1711987 701 807 1,5081997 2,917 4,014 455 7,3861998 3,125 14,909 4,305 415 22,7541999 3,444 15,166 6,285 403 25,2982000 3,943 15,525 7,805 598 27,8712001 4,251 19,310 11,262 685 35,5082002 4,678 22,207 13,396 943 41,2242003 5,287 23,654 13,948 1,331 44,220
Last year was a standout. Float reached record levels and it came without cost as all majorsegments contributed to Berkshire’s $1.7 billion pre-tax underwriting profit.
Our results have been exceptional for one reason: We have truly exceptional managers. Insurerssell a non-proprietary piece of paper containing a non-proprietary promise. Anyone can copy anyone else’sproduct. No installed base, key patents, critical real estate or natural resource position protects an insurer’scompetitive position. Typically, brands do not mean much either.
The critical variables, therefore, are managerial brains, discipline and integrity. Our managershave all of these attributes – in spades. Let’s take a look at these all-stars and their operations.
• General Re had been Berkshire’s problem child in the years following our acquisition of it in1998. Unfortunately, it was a 400-pound child, and its negative impact on our overallperformance was large.
That’s behind us: Gen Re is fixed. Thank Joe Brandon, its CEO, and his partner, TadMontross, for that. When I wrote you last year, I thought that discipline had been restored toboth underwriting and reserving, and events during 2003 solidified my view.
12
That does not mean we will never have setbacks. Reinsurance is a business that is certain todeliver blows from time to time. But, under Joe and Tad, this operation will be a powerfulengine driving Berkshire’s future profitability.
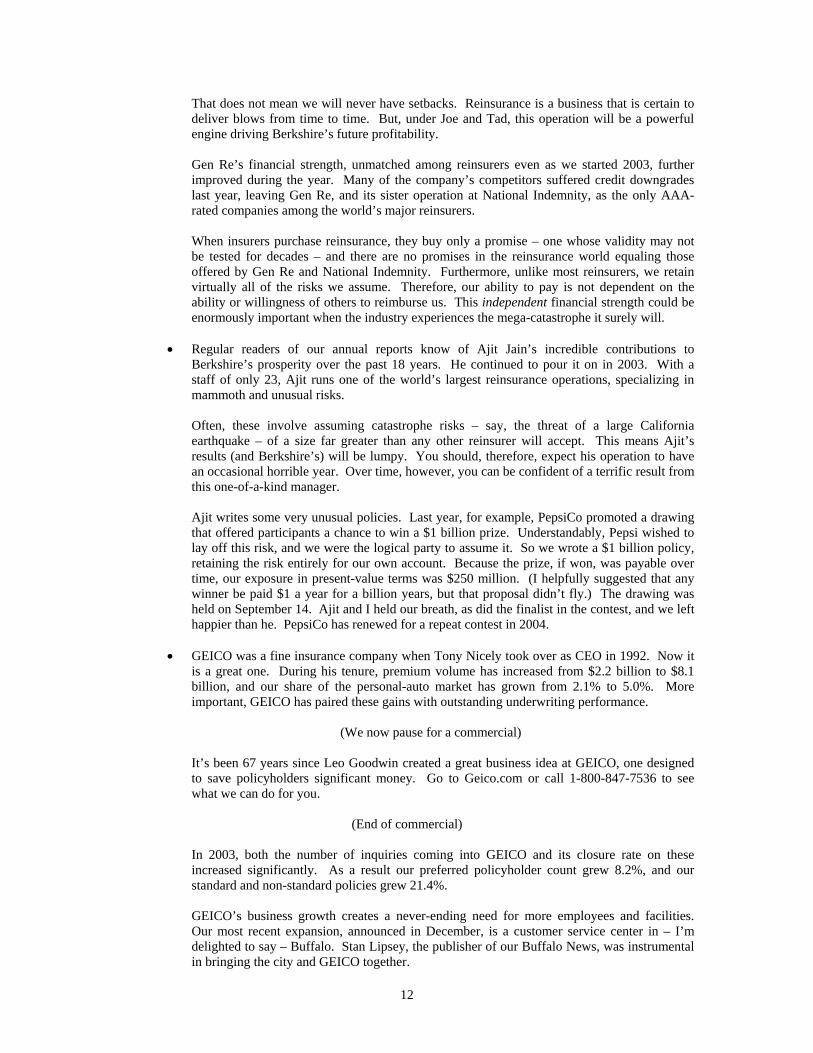
Gen Re’s financial strength, unmatched among reinsurers even as we started 2003, furtherimproved during the year. Many of the company’s competitors suffered credit downgradeslast year, leaving Gen Re, and its sister operation at National Indemnity, as the only AAA-rated companies among the world’s major reinsurers.
When insurers purchase reinsurance, they buy only a promise – one whose validity may notbe tested for decades – and there are no promises in the reinsurance world equaling thoseoffered by Gen Re and National Indemnity. Furthermore, unlike most reinsurers, we retainvirtually all of the risks we assume. Therefore, our ability to pay is not dependent on theability or willingness of others to reimburse us. This independent financial strength could beenormously important when the industry experiences the mega-catastrophe it surely will.
• Regular readers of our annual reports know of Ajit Jain’s incredible contributions toBerkshire’s prosperity over the past 18 years. He continued to pour it on in 2003. With astaff of only 23, Ajit runs one of the world’s largest reinsurance operations, specializing inmammoth and unusual risks.
Often, these involve assuming catastrophe risks – say, the threat of a large Californiaearthquake – of a size far greater than any other reinsurer will accept. This means Ajit’sresults (and Berkshire’s) will be lumpy. You should, therefore, expect his operation to havean occasional horrible year. Over time, however, you can be confident of a terrific result fromthis one-of-a-kind manager.
Ajit writes some very unusual policies. Last year, for example, PepsiCo promoted a drawingthat offered participants a chance to win a $1 billion prize. Understandably, Pepsi wished tolay off this risk, and we were the logical party to assume it. So we wrote a $1 billion policy,retaining the risk entirely for our own account. Because the prize, if won, was payable overtime, our exposure in present-value terms was $250 million. (I helpfully suggested that anywinner be paid $1 a year for a billion years, but that proposal didn’t fly.) The drawing washeld on September 14. Ajit and I held our breath, as did the finalist in the contest, and we lefthappier than he. PepsiCo has renewed for a repeat contest in 2004.
• GEICO was a fine insurance company when Tony Nicely took over as CEO in 1992. Now itis a great one. During his tenure, premium volume has increased from $2.2 billion to $8.1billion, and our share of the personal-auto market has grown from 2.1% to 5.0%. Moreimportant, GEICO has paired these gains with outstanding underwriting performance.
(We now pause for a commercial)
It’s been 67 years since Leo Goodwin created a great business idea at GEICO, one designedto save policyholders significant money. Go to Geico.com or call 1-800-847-7536 to seewhat we can do for you.
(End of commercial)
In 2003, both the number of inquiries coming into GEICO and its closure rate on theseincreased significantly. As a result our preferred policyholder count grew 8.2%, and ourstandard and non-standard policies grew 21.4%.
GEICO’s business growth creates a never-ending need for more employees and facilities.Our most recent expansion, announced in December, is a customer service center in – I’mdelighted to say – Buffalo. Stan Lipsey, the publisher of our Buffalo News, was instrumentalin bringing the city and GEICO together.
13
The key figure in this matter, however, was Governor George Pataki. His leadership andtenacity are why Buffalo will have 2,500 new jobs when our expansion is fully rolled out.Stan, Tony, and I – along with Buffalo – thank him for his help.
• Berkshire’s smaller insurers had another terrific year. This group, run by Rod Eldred, JohnKizer, Tom Nerney, Don Towle and Don Wurster, increased its float by 41%, whiledelivering an excellent underwriting profit. These men, though operating in unexciting ways,produce truly exciting results.
* * * * * * * * * * * *
We should point out again that in any given year a company writing long-tail insurance (coveragesgiving rise to claims that are often settled many years after the loss-causing event takes place) can reportalmost any earnings that the CEO desires. Too often the industry has reported wildly inaccurate figures bymisstating liabilities. Most of the mistakes have been innocent. Sometimes, however, they have beenintentional, their object being to fool investors and regulators. Auditors and actuaries have usually failed toprevent both varieties of misstatement.
I have failed on occasion too, particularly in not spotting Gen Re’s unwitting underreserving a fewyears back. Not only did that mean we reported inaccurate figures to you, but the error also resulted in ourpaying very substantial taxes earlier than was necessary. Aaarrrggghh. I told you last year, however, that Ithought our current reserving was at appropriate levels. So far, that judgment is holding up.
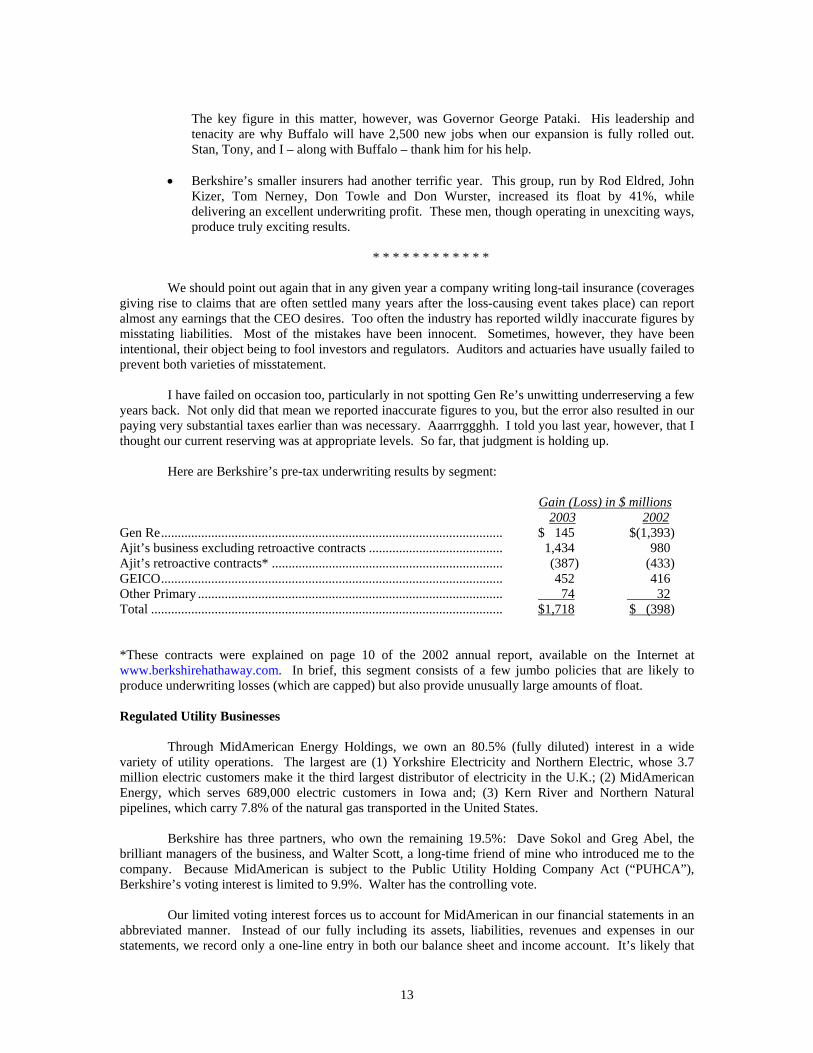
Here are Berkshire’s pre-tax underwriting results by segment:
Gain (Loss) in $ millions2003 2002
Gen Re...................................................................................................... $ 145 $(1,393)Ajit’s business excluding retroactive contracts ........................................ 1,434 980Ajit’s retroactive contracts* ..................................................................... (387) (433)GEICO...................................................................................................... 452 416Other Primary ........................................................................................... 74 32Total ......................................................................................................... $1,718 $ (398)
*These contracts were explained on page 10 of the 2002 annual report, available on the Internet atwww.berkshirehathaway.com. In brief, this segment consists of a few jumbo policies that are likely toproduce underwriting losses (which are capped) but also provide unusually large amounts of float.
Regulated Utility Businesses
Through MidAmerican Energy Holdings, we own an 80.5% (fully diluted) interest in a widevariety of utility operations. The largest are (1) Yorkshire Electricity and Northern Electric, whose 3.7million electric customers make it the third largest distributor of electricity in the U.K.; (2) MidAmericanEnergy, which serves 689,000 electric customers in Iowa and; (3) Kern River and Northern Naturalpipelines, which carry 7.8% of the natural gas transported in the United States.
Berkshire has three partners, who own the remaining 19.5%: Dave Sokol and Greg Abel, thebrilliant managers of the business, and Walter Scott, a long-time friend of mine who introduced me to thecompany. Because MidAmerican is subject to the Public Utility Holding Company Act (“PUHCA”),Berkshire’s voting interest is limited to 9.9%. Walter has the controlling vote.
Our limited voting interest forces us to account for MidAmerican in our financial statements in anabbreviated manner. Instead of our fully including its assets, liabilities, revenues and expenses in ourstatements, we record only a one-line entry in both our balance sheet and income account. It’s likely that
14
some day, perhaps soon, either PUHCA will be repealed or accounting rules will change. Berkshire’sconsolidated figures would then take in all of MidAmerican, including the substantial debt it utilizes.
The size of this debt (which is not now, nor will it be, an obligation of Berkshire) is entirelyappropriate. MidAmerican’s diverse and stable utility operations assure that, even under harsh economicconditions, aggregate earnings will be ample to very comfortably service all debt.
At yearend, $1.578 billion of MidAmerican’s most junior debt was payable to Berkshire. Thisdebt has allowed acquisitions to be financed without our three partners needing to increase their alreadysubstantial investments in MidAmerican. By charging 11% interest, Berkshire is compensated fairly forputting up the funds needed for purchases, while our partners are spared dilution of their equity interests.
MidAmerican also owns a significant non-utility business, Home Services of America, the secondlargest real estate broker in the country. Unlike our utility operations, this business is highly cyclical, butnevertheless one we view enthusiastically. We have an exceptional manager, Ron Peltier, who, throughboth his acquisition and operational skills, is building a brokerage powerhouse.
Last year, Home Services participated in $48.6 billion of transactions, a gain of $11.7 billion from2002. About 23% of the increase came from four acquisitions made during the year. Through our 16brokerage firms – all of which retain their local identities – we employ 16,343 brokers in 16 states. HomeServices is almost certain to grow substantially in the next decade as we continue to acquire leadinglocalized operations.
* * * * * * * * * * * *
Here’s a tidbit for fans of free enterprise. On March 31, 1990, the day electric utilities in the U.K.were denationalized, Northern and Yorkshire had 6,800 employees in functions these companies continuetoday to perform. Now they employ 2,539. Yet the companies are serving about the same number ofcustomers as when they were government owned and are distributing more electricity.
This is not, it should be noted, a triumph of deregulation. Prices and earnings continue to beregulated in a fair manner by the government, just as they should be. It is a victory, however, for those whobelieve that profit-motivated managers, even though they recognize that the benefits will largely flow tocustomers, will find efficiencies that government never will.
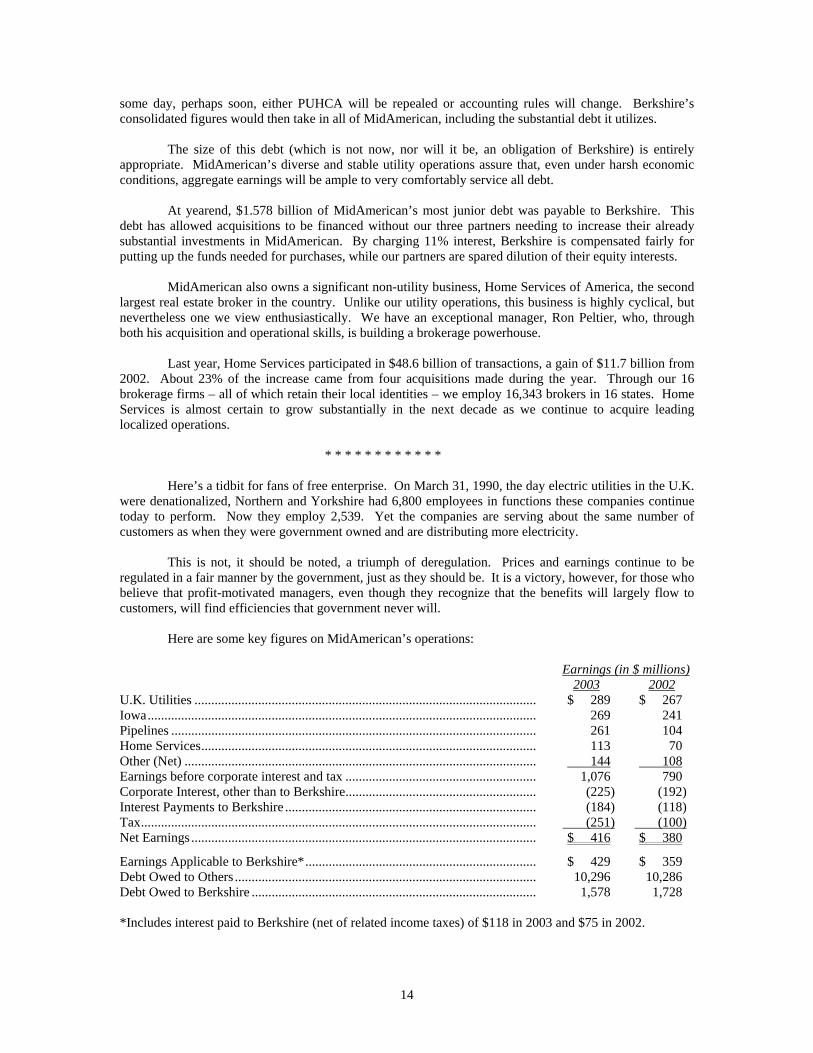
Here are some key figures on MidAmerican’s operations:
Earnings (in $ millions)2003 2002
U.K. Utilities ...................................................................................................... $ 289 $ 267Iowa.................................................................................................................... 269 241Pipelines ............................................................................................................. 261 104Home Services.................................................................................................... 113 70Other (Net) ......................................................................................................... 144 108Earnings before corporate interest and tax ......................................................... 1,076 790Corporate Interest, other than to Berkshire......................................................... (225) (192)Interest Payments to Berkshire ........................................................................... (184) (118)Tax...................................................................................................................... (251) (100)Net Earnings ....................................................................................................... $ 416 $ 380
Earnings Applicable to Berkshire*..................................................................... $ 429 $ 359Debt Owed to Others .......................................................................................... 10,296 10,286Debt Owed to Berkshire ..................................................................................... 1,578 1,728
*Includes interest paid to Berkshire (net of related income taxes) of $118 in 2003 and $75 in 2002.
15
Finance and Financial Products
This sector includes a wide-ranging group of activities. Here’s some commentary on the mostimportant.
• I manage a few opportunistic strategies in AAA fixed-income securities that have been quiteprofitable in the last few years. These opportunities come and go – and at present, they aregoing. We sped their departure somewhat last year, thereby realizing 24% of the capital gainswe show in the table that follows.
Though far from foolproof, these transactions involve no credit risk and are conducted inexceptionally liquid securities. We therefore finance the positions almost entirely withborrowed money. As the assets are reduced, so also are the borrowings. The smallerportfolio we now have means that in the near future our earnings in this category will declinesignificantly. It was fun while it lasted, and at some point we’ll get another turn at bat.
• A far less pleasant unwinding operation is taking place at Gen Re Securities, the trading andderivatives operation we inherited when we purchased General Reinsurance.
When we began to liquidate Gen Re Securities in early 2002, it had 23,218 outstanding ticketswith 884 counterparties (some having names I couldn’t pronounce, much lesscreditworthiness I could evaluate). Since then, the unit’s managers have been skillful anddiligent in unwinding positions. Yet, at yearend – nearly two years later – we still had 7,580tickets outstanding with 453 counterparties. (As the country song laments, “How can I missyou if you won’t go away?”)
The shrinking of this business has been costly. We’ve had pre-tax losses of $173 million in2002 and $99 million in 2003. These losses, it should be noted, came from a portfolio ofcontracts that – in full compliance with GAAP – had been regularly marked-to-market withstandard allowances for future credit-loss and administrative costs. Moreover, our liquidationhas taken place both in a benign market – we’ve had no credit losses of significance – and inan orderly manner. This is just the opposite of what might be expected if a financial crisisforced a number of derivatives dealers to cease operations simultaneously.
If our derivatives experience – and the Freddie Mac shenanigans of mind-blowing size andaudacity that were revealed last year – makes you suspicious of accounting in this arena,consider yourself wised up. No matter how financially sophisticated you are, you can’tpossibly learn from reading the disclosure documents of a derivatives-intensive companywhat risks lurk in its positions. Indeed, the more you know about derivatives, the less youwill feel you can learn from the disclosures normally proffered you. In Darwin’s words,“Ignorance more frequently begets confidence than does knowledge.”
* * * * * * * * * * * *
And now it’s confession time: I’m sure I could have saved you $100 million or so, pre-tax, if Ihad acted more promptly to shut down Gen Re Securities. Both Charlie and I knew at thetime of the General Reinsurance merger that its derivatives business was unattractive.Reported profits struck us as illusory, and we felt that the business carried sizable risks thatcould not effectively be measured or limited. Moreover, we knew that any major problemsthe operation might experience would likely correlate with troubles in the financial orinsurance world that would affect Berkshire elsewhere. In other words, if the derivativesbusiness were ever to need shoring up, it would commandeer the capital and credit ofBerkshire at just the time we could otherwise deploy those resources to huge advantage. (Ahistorical note: We had just such an experience in 1974 when we were the victim of a majorinsurance fraud. We could not determine for some time how much the fraud would ultimatelycost us and therefore kept more funds in cash-equivalents than we normally would have.
16
Absent this precaution, we would have made larger purchases of stocks that were thenextraordinarily cheap.)
Charlie would have moved swiftly to close down Gen Re Securities – no question about that.I, however, dithered. As a consequence, our shareholders are paying a far higher price thanwas necessary to exit this business.
• Though we include Gen Re’s sizable life and health reinsurance business in the “insurance”sector, we show the results for Ajit Jain’s life and annuity business in this section. That’sbecause this business, in large part, involves arbitraging money. Our annuities range from aretail product sold directly on the Internet to structured settlements that require us to makepayments for 70 years or more to people severely injured in accidents.
We’ve realized some extra income in this business because of accelerated principal paymentswe received from certain fixed-income securities we had purchased at discounts. Thisphenomenon has ended, and earnings are therefore likely to be lower in this segment duringthe next few years.
• We have a $604 million investment in Value Capital, a partnership run by Mark Byrne, amember of a family that has helped Berkshire over the years in many ways. Berkshire is alimited partner in, and has no say in the management of, Mark’s enterprise, which specializesin highly-hedged fixed-income opportunities. Mark is smart and honest and, along with hisfamily, has a significant investment in Value.
Because of accounting abuses at Enron and elsewhere, rules will soon be instituted that arelikely to require that Value’s assets and liabilities be consolidated on Berkshire’s balancesheet. We regard this requirement as inappropriate, given that Value’s liabilities – whichusually are above $20 billion – are in no way ours. Over time, other investors will join us aspartners in Value. When enough do, the need for us to consolidate Value will disappear.
• We have told you in the past about Berkadia, the partnership we formed three years ago withLeucadia to finance and manage the wind-down of Finova, a bankrupt lending operation. Theplan was that we would supply most of the capital and Leucadia would supply most of thebrains. And that’s the way it has worked. Indeed, Joe Steinberg and Ian Cumming, whotogether run Leucadia, have done such a fine job in liquidating Finova’s portfolio that the $5.6billion guarantee we took on in connection with the transaction has been extinguished. Theunfortunate byproduct of this fast payoff is that our future income will be much reduced.Overall, Berkadia has made excellent money for us, and Joe and Ian have been terrificpartners.
• Our leasing businesses are XTRA (transportation equipment) and CORT (office furniture).Both operations have had poor earnings during the past two years as the recession causeddemand to drop considerably more than was anticipated. They remain leaders in their fields,and I expect at least a modest improvement in their earnings this year.
• Through our Clayton purchase, we acquired a significant manufactured-housing financeoperation. Clayton, like others in this business, had traditionally securitized the loans itoriginated. The practice relieved stress on Clayton’s balance sheet, but a by-product was the“front-ending” of income (a result dictated by GAAP).
We are in no hurry to record income, have enormous balance-sheet strength, and believe thatover the long-term the economics of holding our consumer paper are superior to what we cannow realize through securitization. So Clayton has begun to retain its loans.
We believe it’s appropriate to finance a soundly-selected book of interest-bearing receivablesalmost entirely with debt (just as a bank would). Therefore, Berkshire will borrow money tofinance Clayton’s portfolio and re-lend these funds to Clayton at our cost plus one percentage
17
point. This markup fairly compensates Berkshire for putting its exceptional creditworthinessto work, but it still delivers money to Clayton at an attractive price.
In 2003, Berkshire did $2 billion of such borrowing and re-lending, with Clayton using muchof this money to fund several large purchases of portfolios from lenders exiting the business.A portion of our loans to Clayton also provided “catch-up” funding for paper it had generatedearlier in the year from its own operation and had found difficult to securitize.
You may wonder why we borrow money while sitting on a mountain of cash. It’s because ofour “every tub on its own bottom” philosophy. We believe that any subsidiary lending moneyshould pay an appropriate rate for the funds needed to carry its receivables and should not besubsidized by its parent. Otherwise, having a rich daddy can lead to sloppy decisions.Meanwhile, the cash we accumulate at Berkshire is destined for business acquisitions or forthe purchase of securities that offer opportunities for significant profit. Clayton’s loanportfolio will likely grow to at least $5 billion in not too many years and, with sensible creditstandards in place, should deliver significant earnings.
For simplicity’s sake, we include all of Clayton’s earnings in this sector, though a sizableportion is derived from areas other than consumer finance.
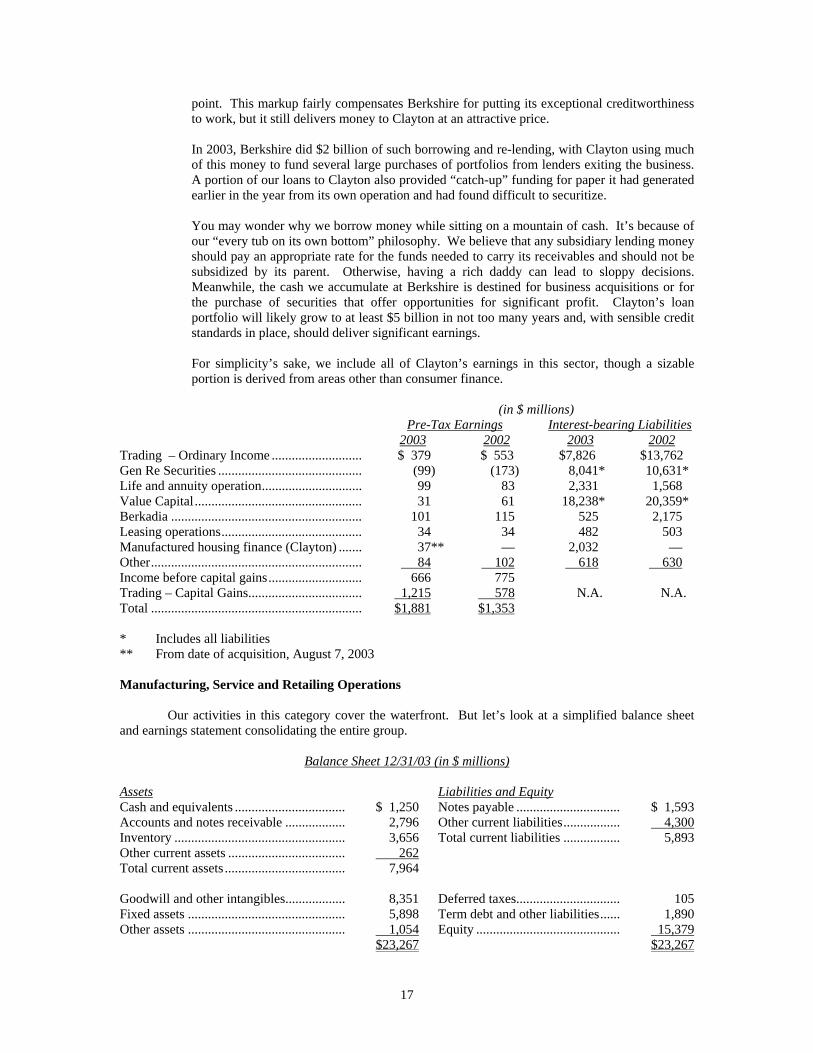
(in $ millions)Pre-Tax Earnings Interest-bearing Liabilities
2003 2002 2003 2002Trading – Ordinary Income ........................... $ 379 $ 553 $7,826 $13,762Gen Re Securities ........................................... (99) (173) 8,041* 10,631*Life and annuity operation.............................. 99 83 2,331 1,568Value Capital .................................................. 31 61 18,238* 20,359*Berkadia ......................................................... 101 115 525 2,175Leasing operations.......................................... 34 34 482 503Manufactured housing finance (Clayton) ....... 37** — 2,032 —Other............................................................... 84 102 618 630Income before capital gains............................ 666 775Trading – Capital Gains.................................. 1,215 578 N.A. N.A.Total ............................................................... $1,881 $1,353
* Includes all liabilities** From date of acquisition, August 7, 2003
Manufacturing, Service and Retailing Operations
Our activities in this category cover the waterfront. But let’s look at a simplified balance sheetand earnings statement consolidating the entire group.
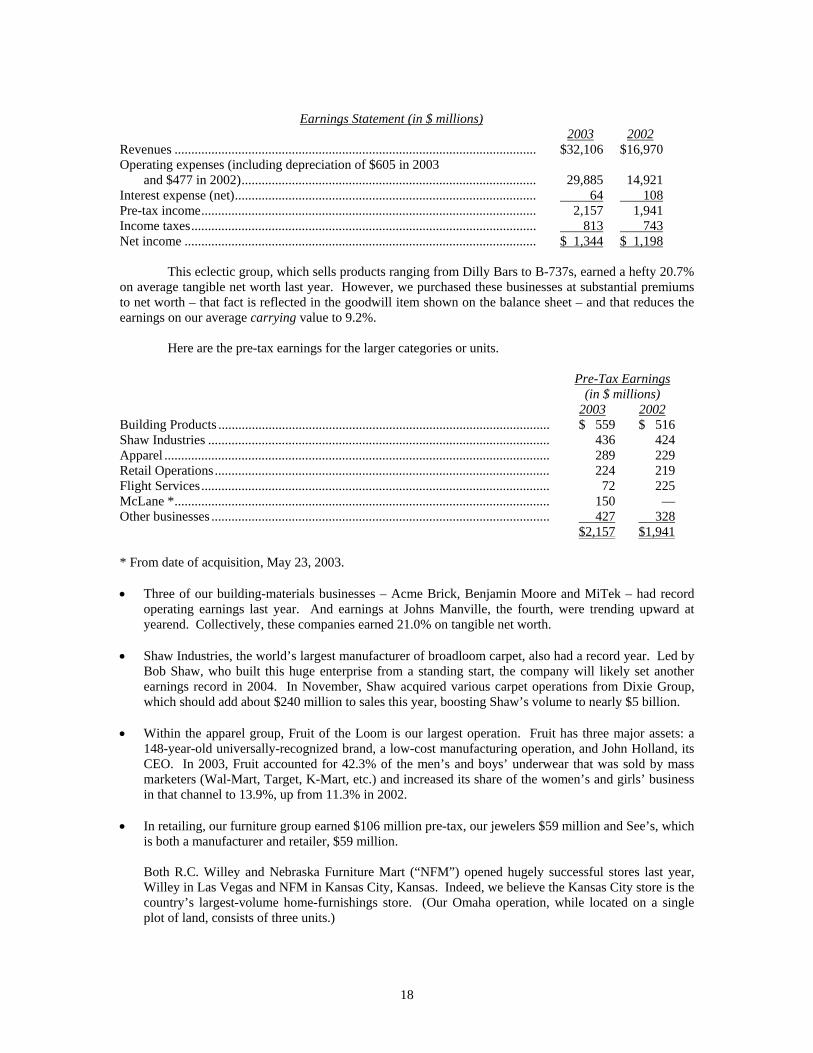
Balance Sheet 12/31/03 (in $ millions)
Assets Liabilities and EquityCash and equivalents ................................. $ 1,250 Notes payable ............................... $ 1,593Accounts and notes receivable .................. 2,796 Other current liabilities................. 4,300Inventory ................................................... 3,656 Total current liabilities ................. 5,893Other current assets ................................... 262Total current assets .................................... 7,964
Goodwill and other intangibles.................. 8,351 Deferred taxes............................... 105Fixed assets ............................................... 5,898 Term debt and other liabilities...... 1,890Other assets ............................................... 1,054 Equity ........................................... 15,379
$23,267 $23,267
18
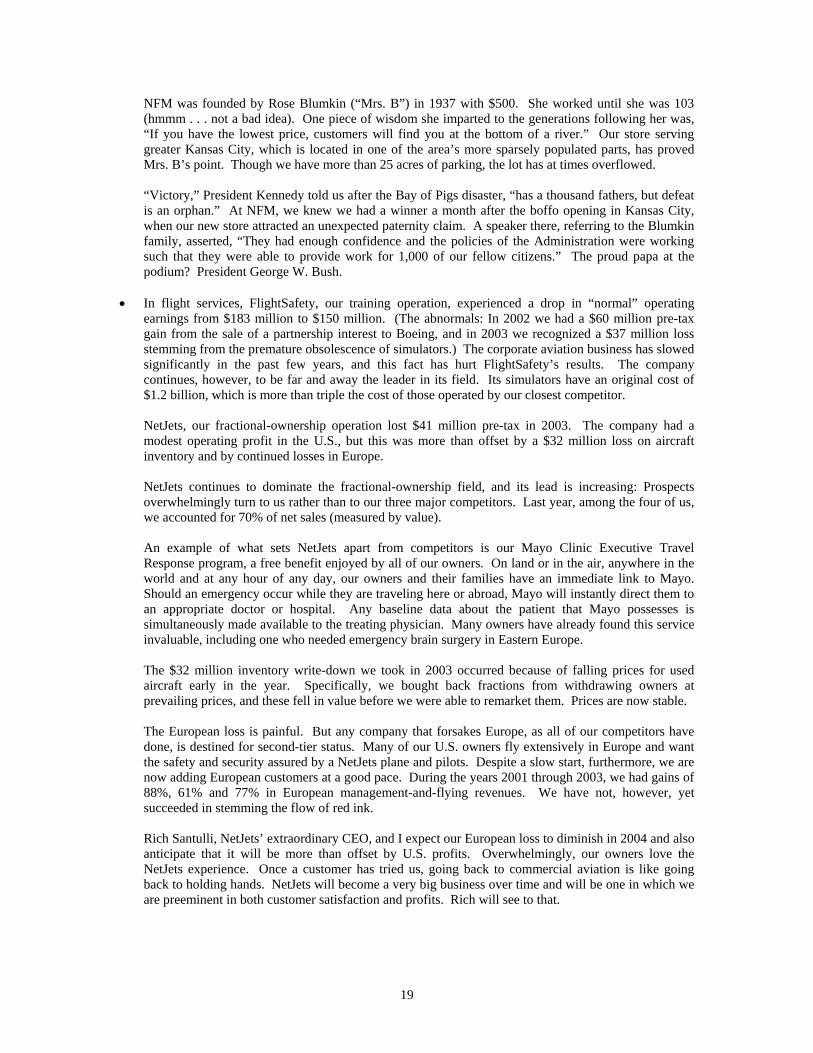
Earnings Statement (in $ millions)2003 2002
Revenues ............................................................................................................ $32,106 $16,970Operating expenses (including depreciation of $605 in 2003
and $477 in 2002)........................................................................................ 29,885 14,921Interest expense (net).......................................................................................... 64 108Pre-tax income.................................................................................................... 2,157 1,941Income taxes....................................................................................................... 813 743Net income ......................................................................................................... $ 1,344 $ 1,198
This eclectic group, which sells products ranging from Dilly Bars to B-737s, earned a hefty 20.7%on average tangible net worth last year. However, we purchased these businesses at substantial premiumsto net worth – that fact is reflected in the goodwill item shown on the balance sheet – and that reduces theearnings on our average carrying value to 9.2%.
Here are the pre-tax earnings for the larger categories or units.
Pre-Tax Earnings(in $ millions)
2003 2002Building Products ................................................................................................... $ 559 $ 516Shaw Industries ...................................................................................................... 436 424Apparel ................................................................................................................... 289 229Retail Operations.................................................................................................... 224 219Flight Services........................................................................................................ 72 225McLane *................................................................................................................ 150 —Other businesses ..................................................................................................... 427 328
$2,157 $1,941
* From date of acquisition, May 23, 2003.
• Three of our building-materials businesses – Acme Brick, Benjamin Moore and MiTek – had recordoperating earnings last year. And earnings at Johns Manville, the fourth, were trending upward atyearend. Collectively, these companies earned 21.0% on tangible net worth.
• Shaw Industries, the world’s largest manufacturer of broadloom carpet, also had a record year. Led byBob Shaw, who built this huge enterprise from a standing start, the company will likely set anotherearnings record in 2004. In November, Shaw acquired various carpet operations from Dixie Group,which should add about $240 million to sales this year, boosting Shaw’s volume to nearly $5 billion.
• Within the apparel group, Fruit of the Loom is our largest operation. Fruit has three major assets: a148-year-old universally-recognized brand, a low-cost manufacturing operation, and John Holland, itsCEO. In 2003, Fruit accounted for 42.3% of the men’s and boys’ underwear that was sold by massmarketers (Wal-Mart, Target, K-Mart, etc.) and increased its share of the women’s and girls’ businessin that channel to 13.9%, up from 11.3% in 2002.
• In retailing, our furniture group earned $106 million pre-tax, our jewelers $59 million and See’s, whichis both a manufacturer and retailer, $59 million.
Both R.C. Willey and Nebraska Furniture Mart (“NFM”) opened hugely successful stores last year,Willey in Las Vegas and NFM in Kansas City, Kansas. Indeed, we believe the Kansas City store is thecountry’s largest-volume home-furnishings store. (Our Omaha operation, while located on a singleplot of land, consists of three units.)
19
NFM was founded by Rose Blumkin (“Mrs. B”) in 1937 with $500. She worked until she was 103(hmmm . . . not a bad idea). One piece of wisdom she imparted to the generations following her was,“If you have the lowest price, customers will find you at the bottom of a river.” Our store servinggreater Kansas City, which is located in one of the area’s more sparsely populated parts, has provedMrs. B’s point. Though we have more than 25 acres of parking, the lot has at times overflowed.
“Victory,” President Kennedy told us after the Bay of Pigs disaster, “has a thousand fathers, but defeatis an orphan.” At NFM, we knew we had a winner a month after the boffo opening in Kansas City,when our new store attracted an unexpected paternity claim. A speaker there, referring to the Blumkinfamily, asserted, “They had enough confidence and the policies of the Administration were workingsuch that they were able to provide work for 1,000 of our fellow citizens.” The proud papa at thepodium? President George W. Bush.
• In flight services, FlightSafety, our training operation, experienced a drop in “normal” operatingearnings from $183 million to $150 million. (The abnormals: In 2002 we had a $60 million pre-taxgain from the sale of a partnership interest to Boeing, and in 2003 we recognized a $37 million lossstemming from the premature obsolescence of simulators.) The corporate aviation business has slowedsignificantly in the past few years, and this fact has hurt FlightSafety’s results. The companycontinues, however, to be far and away the leader in its field. Its simulators have an original cost of$1.2 billion, which is more than triple the cost of those operated by our closest competitor.
NetJets, our fractional-ownership operation lost $41 million pre-tax in 2003. The company had amodest operating profit in the U.S., but this was more than offset by a $32 million loss on aircraftinventory and by continued losses in Europe.
NetJets continues to dominate the fractional-ownership field, and its lead is increasing: Prospectsoverwhelmingly turn to us rather than to our three major competitors. Last year, among the four of us,we accounted for 70% of net sales (measured by value).
An example of what sets NetJets apart from competitors is our Mayo Clinic Executive TravelResponse program, a free benefit enjoyed by all of our owners. On land or in the air, anywhere in theworld and at any hour of any day, our owners and their families have an immediate link to Mayo.Should an emergency occur while they are traveling here or abroad, Mayo will instantly direct them toan appropriate doctor or hospital. Any baseline data about the patient that Mayo possesses issimultaneously made available to the treating physician. Many owners have already found this serviceinvaluable, including one who needed emergency brain surgery in Eastern Europe.
The $32 million inventory write-down we took in 2003 occurred because of falling prices for usedaircraft early in the year. Specifically, we bought back fractions from withdrawing owners atprevailing prices, and these fell in value before we were able to remarket them. Prices are now stable.
The European loss is painful. But any company that forsakes Europe, as all of our competitors havedone, is destined for second-tier status. Many of our U.S. owners fly extensively in Europe and wantthe safety and security assured by a NetJets plane and pilots. Despite a slow start, furthermore, we arenow adding European customers at a good pace. During the years 2001 through 2003, we had gains of88%, 61% and 77% in European management-and-flying revenues. We have not, however, yetsucceeded in stemming the flow of red ink.
Rich Santulli, NetJets’ extraordinary CEO, and I expect our European loss to diminish in 2004 and alsoanticipate that it will be more than offset by U.S. profits. Overwhelmingly, our owners love theNetJets experience. Once a customer has tried us, going back to commercial aviation is like goingback to holding hands. NetJets will become a very big business over time and will be one in which weare preeminent in both customer satisfaction and profits. Rich will see to that.
20
Investments
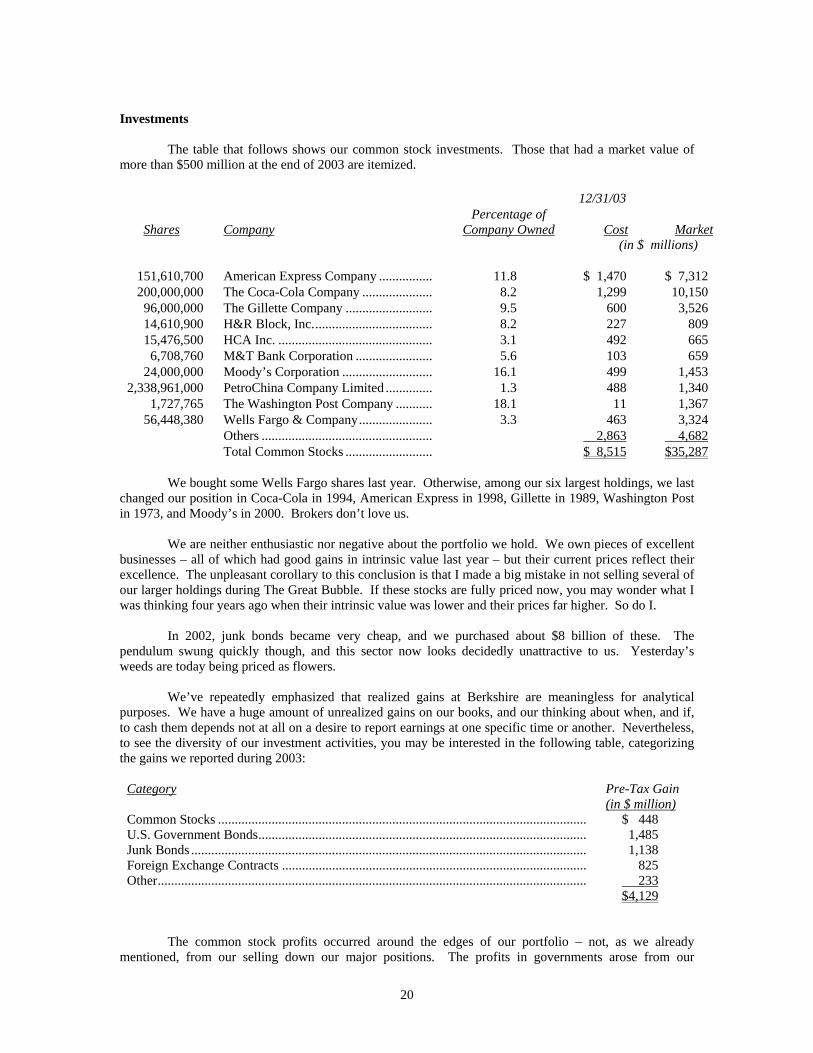
The table that follows shows our common stock investments. Those that had a market value ofmore than $500 million at the end of 2003 are itemized.
12/31/03
Shares CompanyPercentage of
Company Owned Cost Market(in $ millions)
151,610,700 American Express Company ................ 11.8 $ 1,470 $ 7,312200,000,000 The Coca-Cola Company ..................... 8.2 1,299 10,15096,000,000 The Gillette Company .......................... 9.5 600 3,52614,610,900 H&R Block, Inc.................................... 8.2 227 80915,476,500 HCA Inc. .............................................. 3.1 492 6656,708,760 M&T Bank Corporation ....................... 5.6 103 659
24,000,000 Moody’s Corporation ........................... 16.1 499 1,4532,338,961,000 PetroChina Company Limited .............. 1.3 488 1,340
1,727,765 The Washington Post Company ........... 18.1 11 1,36756,448,380 Wells Fargo & Company...................... 3.3 463 3,324
Others ................................................... 2,863 4,682Total Common Stocks .......................... $ 8,515 $35,287
We bought some Wells Fargo shares last year. Otherwise, among our six largest holdings, we lastchanged our position in Coca-Cola in 1994, American Express in 1998, Gillette in 1989, Washington Postin 1973, and Moody’s in 2000. Brokers don’t love us.
We are neither enthusiastic nor negative about the portfolio we hold. We own pieces of excellentbusinesses – all of which had good gains in intrinsic value last year – but their current prices reflect theirexcellence. The unpleasant corollary to this conclusion is that I made a big mistake in not selling several ofour larger holdings during The Great Bubble. If these stocks are fully priced now, you may wonder what Iwas thinking four years ago when their intrinsic value was lower and their prices far higher. So do I.
In 2002, junk bonds became very cheap, and we purchased about $8 billion of these. Thependulum swung quickly though, and this sector now looks decidedly unattractive to us. Yesterday’sweeds are today being priced as flowers.
We’ve repeatedly emphasized that realized gains at Berkshire are meaningless for analyticalpurposes. We have a huge amount of unrealized gains on our books, and our thinking about when, and if,to cash them depends not at all on a desire to report earnings at one specific time or another. Nevertheless,to see the diversity of our investment activities, you may be interested in the following table, categorizingthe gains we reported during 2003:
Category Pre-Tax Gain(in $ million)
Common Stocks .............................................................................................................. $ 448U.S. Government Bonds.................................................................................................. 1,485Junk Bonds ...................................................................................................................... 1,138Foreign Exchange Contracts ........................................................................................... 825Other................................................................................................................................ 233
$4,129
The common stock profits occurred around the edges of our portfolio – not, as we alreadymentioned, from our selling down our major positions. The profits in governments arose from our
21
liquidation of long-term strips (the most volatile of government securities) and from certain strategies Ifollow within our finance and financial products division. We retained most of our junk portfolio, sellingonly a few issues. Calls and maturing bonds accounted for the rest of the gains in the junk category.
During 2002 we entered the foreign currency market for the first time in my life, and in 2003 weenlarged our position, as I became increasingly bearish on the dollar. I should note that the cemetery forseers has a huge section set aside for macro forecasters. We have in fact made few macro forecasts atBerkshire, and we have seldom seen others make them with sustained success.
We have – and will continue to have – the bulk of Berkshire’s net worth in U.S. assets. But inrecent years our country’s trade deficit has been force-feeding huge amounts of claims on, and ownershipin, America to the rest of the world. For a time, foreign appetite for these assets readily absorbed thesupply. Late in 2002, however, the world started choking on this diet, and the dollar’s value began to slideagainst major currencies. Even so, prevailing exchange rates will not lead to a material letup in our tradedeficit. So whether foreign investors like it or not, they will continue to be flooded with dollars. Theconsequences of this are anybody’s guess. They could, however, be troublesome – and reach, in fact, wellbeyond currency markets.
As an American, I hope there is a benign ending to this problem. I myself suggested one possiblesolution – which, incidentally, leaves Charlie cold – in a November 10, 2003 article in Fortune Magazine.Then again, perhaps the alarms I have raised will prove needless: Our country’s dynamism and resiliencyhave repeatedly made fools of naysayers. But Berkshire holds many billions of cash-equivalentsdenominated in dollars. So I feel more comfortable owning foreign-exchange contracts that are at least apartial offset to that position.
These contracts are subject to accounting rules that require changes in their value to becontemporaneously included in capital gains or losses, even though the contracts have not been closed. Weshow these changes each quarter in the Finance and Financial Products segment of our earnings statement.At yearend, our open foreign exchange contracts totaled about $12 billion at market values and were spreadamong five currencies. Also, when we were purchasing junk bonds in 2002, we tried when possible to buyissues denominated in Euros. Today, we own about $1 billion of these.
When we can’t find anything exciting in which to invest, our “default” position is U.S. Treasuries,both bills and repos. No matter how low the yields on these instruments go, we never “reach” for a littlemore income by dropping our credit standards or by extending maturities. Charlie and I detest taking evensmall risks unless we feel we are being adequately compensated for doing so. About as far as we will godown that path is to occasionally eat cottage cheese a day after the expiration date on the carton.
* * * * * * * * * * * *
A 2003 book that investors can learn much from is Bull! by Maggie Mahar. Two other books I’drecommend are The Smartest Guys in the Room by Bethany McLean and Peter Elkind, and In an UncertainWorld by Bob Rubin. All three are well-reported and well-written. Additionally, Jason Zweig last year dida first-class job in revising The Intelligent Investor, my favorite book on investing.
Designated Gifts Program
From 1981 through 2002, Berkshire administered a program whereby shareholders could directBerkshire to make gifts to their favorite charitable organizations. Over the years we disbursed $197 millionpursuant to this program. Churches were the most frequently named designees, and many thousands ofother organizations benefited as well. We were the only major public company that offered such a programto shareholders, and Charlie and I were proud of it.
We reluctantly terminated the program in 2003 because of controversy over the abortion issue.Over the years numerous organizations on both sides of this issue had been designated by our shareholdersto receive contributions. As a result, we regularly received some objections to the gifts designated for pro-choice operations. A few of these came from people and organizations that proceeded to boycott products
22
of our subsidiaries. That did not concern us. We refused all requests to limit the right of our owners tomake whatever gifts they chose (as long as the recipients had 501(c)(3) status).
In 2003, however, many independent associates of The Pampered Chef began to feel the boycotts.This development meant that people who trusted us – but who were neither employees of ours nor had avoice in Berkshire decision-making – suffered serious losses of income.
For our shareholders, there was some modest tax efficiency in Berkshire doing the giving ratherthan their making their gifts directly. Additionally, the program was consistent with our “partnership”approach, the first principle set forth in our Owner’s Manual. But these advantages paled when they weremeasured against damage done loyal associates who had with great personal effort built businesses of theirown. Indeed, Charlie and I see nothing charitable in harming decent, hard-working people just so we andother shareholders can gain some minor tax efficiencies.
Berkshire now makes no contributions at the parent company level. Our various subsidiariesfollow philanthropic policies consistent with their practices prior to their acquisition by Berkshire, exceptthat any personal contributions that former owners had earlier made from their corporate pocketbook arenow funded by them personally.
The Annual Meeting
Last year, I asked you to vote as to whether you wished our annual meeting to be held on Saturdayor Monday. I was hoping for Monday. Saturday won by 2 to 1. It will be a while before shareholderdemocracy resurfaces at Berkshire.
But you have spoken, and we will hold this year’s annual meeting on Saturday, May 1 at the newQwest Center in downtown Omaha. The Qwest offers us 194,000 square feet for exhibition by oursubsidiaries (up from 65,000 square feet last year) and much more seating capacity as well. The Qwest’sdoors will open at 7 a.m., the movie will begin at 8:30, and the meeting itself will commence at 9:30.There will be a short break at noon for food. (Sandwiches will be available at the Qwest’s concessionstands.) That interlude aside, Charlie and I will answer questions until 3:30. We will tell you everythingwe know . . . and, at least in my case, more.
An attachment to the proxy material that is enclosed with this report explains how you can obtainthe credential you will need for admission to the meeting and other events. As for plane, hotel and carreservations, we have again signed up American Express (800-799-6634) to give you special help. They doa terrific job for us each year, and I thank them for it.
In our usual fashion, we will run vans from the larger hotels to the meeting. Afterwards, the vanswill make trips back to the hotels and to Nebraska Furniture Mart, Borsheim’s and the airport. Even so,you are likely to find a car useful.
Our exhibition of Berkshire goods and services will blow you away this year. On the floor, forexample, will be a 1,600 square foot Clayton home (featuring Acme brick, Shaw carpet, Johns-Manvilleinsulation, MiTek fasteners, Carefree awnings, and outfitted with NFM furniture). You’ll find it a far cryfrom the mobile-home stereotype of a few decades ago.
GEICO will have a booth staffed by a number of its top counselors from around the country, all ofthem ready to supply you with auto insurance quotes. In most cases, GEICO will be able to give you aspecial shareholder discount (usually 8%). This special offer is permitted by 41 of the 49 jurisdictions inwhich we operate. Bring the details of your existing insurance and check out whether we can save youmoney.
On Saturday, at the Omaha airport, we will have the usual array of aircraft from NetJets®available for your inspection. Stop by the NetJets booth at the Qwest to learn about viewing these planes.If you buy what we consider an appropriate number of items during the weekend, you may well need yourown plane to take them home.
23
At Nebraska Furniture Mart, located on a 77-acre site on 72nd Street between Dodge and Pacific,we will again be having “Berkshire Weekend” pricing, which means we will be offering our shareholders adiscount that is customarily given only to employees. We initiated this special pricing at NFM seven yearsago, and sales during the “Weekend” grew from $5.3 million in 1997 to $17.3 million in 2003. Every yearhas set a new record.
To get the discount, you must make your purchases between Thursday, April 29 and Monday,May 3 inclusive, and also present your meeting credential. The period’s special pricing will even apply tothe products of several prestigious manufacturers that normally have ironclad rules against discounting butthat, in the spirit of our shareholder weekend, have made an exception for you. We appreciate theircooperation. NFM is open from 10 a.m. to 9 p.m. Monday through Saturday, and 10 a.m. to 6 p.m. onSunday. On Saturday this year, from 5:30 p.m. to 8 p.m., we are having a special affair for shareholdersonly. I’ll be there, eating barbeque and drinking Coke.
Borsheim’s ⎯ the largest jewelry store in the country except for Tiffany’s Manhattan store ⎯ willhave two shareholder-only events. The first will be a cocktail reception from 6 p.m. to 10 p.m. on Friday,April 30. The second, the main gala, will be from 9 a.m. to 4 p.m. on Sunday, May 2. Ask Charlie toautograph your sales ticket.
Shareholder prices will be available Thursday through Monday, so if you wish to avoid the largecrowds that will assemble on Friday evening and Sunday, come at other times and identify yourself as ashareholder. On Saturday, we will be open until 6 p.m. Borsheim’s operates on a gross margin that is fullytwenty percentage points below that of its major rivals, so the more you buy, the more you save – at leastthat’s what my wife and daughter tell me. (Both were impressed early in life by the story of the boy who,after missing a street car, walked home and proudly announced that he had saved 5¢ by doing so. Hisfather was irate: “Why didn’t you miss a cab and save 85¢?”)
In the mall outside of Borsheim’s, we will have Bob Hamman and Sharon Osberg, two of theworld’s top bridge experts, available to play with our shareholders on Sunday afternoon. Additionally,Patrick Wolff, twice U.S. chess champion, will be in the mall, taking on all comers ⎯ blindfolded! I’vewatched, and he doesn’t peek.
Gorat’s ⎯ my favorite steakhouse ⎯ will again be open exclusively for Berkshire shareholders onSunday, May 2, and will be serving from 4 p.m. until 10 p.m. Please remember that to come to Gorat’s onSunday, you must have a reservation. To make one, call 402-551-3733 on April 1 (but not before). IfSunday is sold out, try Gorat’s on one of the other evenings you will be in town. Flaunt your mastery offine dining by ordering, as I do, a rare T-bone with a double order of hash browns.
We will have a special reception on Saturday afternoon from 4:00 to 5:00 for shareholders whocome from outside of North America. Every year our meeting draws many people from around the globe,and Charlie and I want to be sure we personally meet those who have come so far. Any shareholder whocomes from other than the U.S. or Canada will be given special credentials and instructions for attendingthis function.
Charlie and I have a great time at the annual meeting. And you will, too. So join us at the Qwestfor our annual Woodstock for Capitalists.
Warren E. BuffettFebruary 27, 2004 Chairman of the Board