2003 Executive information systems use in organizational ...
255
University of Wollongong Research Online University of Wollongong esis Collection University of Wollongong esis Collections 2003 Executive information systems use in organizational context: an explanatory user behavior testing George Enson Ditsa University of Wollongong Research Online is the open access institutional repository for the University of Wollongong. For further information contact Manager Repository Services: [email protected]. Recommended Citation Ditsa, George Enson, Executive information systems use in organizational context: an explanatory user behavior testing, Doctor of Philosophy thesis, School of Economics and Information Systems, University of Wollongong, 2003. hp://ro.uow.edu.au/theses/ 1936
Transcript of 2003 Executive information systems use in organizational ...

University of WollongongResearch Online
University of Wollongong Thesis Collection University of Wollongong Thesis Collections
2003
Executive information systems use inorganizational context: an explanatory userbehavior testingGeorge Enson DitsaUniversity of Wollongong
Research Online is the open access institutional repository for theUniversity of Wollongong. For further information contact ManagerRepository Services: [email protected].
Recommended CitationDitsa, George Enson, Executive information systems use in organizational context: an explanatory user behavior testing, Doctor ofPhilosophy thesis, School of Economics and Information Systems, University of Wollongong, 2003. http://ro.uow.edu.au/theses/1936

EXECUTIVE INFORMATION SYSTEMS USE IN
ORGANIZATIONAL CONTEXT:
AN EXPLANATORY USER BEHAVIOR TESTING
A Thesis submitted in partial fulfillment of the
requirements for the award of the degree of
DOCTOR OF PHILOSOPHY
from
UNIVERSITY OF W O L L O N G O N G
by
GEORGE ENSON MENSAH DITSA
Dip in Data Processing, BSc(Hons in Comp Sc), MBA(IS)
SCHOOL OF ECONOMICS & INFORMATION SYSTEMS
2003
TABLE OF CONTENTS
DECLARATION I
TABLE OF CONTENTS II
LIST OF TABLES VIII
LIST OF FIGURES XI
LIST OF PUBLICATIONS RELATING TO THIS STUDY XII
ABSTRACT XIV
ACKNOWLEDGEMENTS XVI
CHAPTER 1 INTRODUCTION 1
1.1 Background to the Research Study 1
1.1.1 Factors that contribute to EIS failures 3
1.1.2 Research studies on EIS and the Motivation for this Study 3
1.2 Research Problem and Questions 5
1.3 Conceptual Framework for the Study 6
1.4 Methodology 9
1.4.1 Data Collection Method 9
1.4.2 Data Analysis 10
1.5 Justification and Significance of the Study 10
1.6 Organization of the Thesis 11
ii

1.7 Delimitations of the Scope of the Study 13
1.8 Conclusion 14
CHAPTER 2 LITERATURE REVIEW AND RESEARCH ISSUES15
2.1 Introduction 15
2.2 The Quest for an Information System to meet Executives' needs.... 16
2.3 The Evolution and Popularity of EIS 19
2.4 Definitions of EIS 22
2.5 Benefits and Characteristics of EIS 25
2.5.1 Benefits of EIS 25
2.5.2 Characteristics of EIS 27
2.6 Hardware and Software Requirements of EIS 31
2.7 Future Trends in EIS, 36
2.8 The Nature of Executives' Work and How EIS Fit In 40
2.9 Previous Research Studies On EIS Usage 47
2.10 Conclusion 51
CHAPTER 3 THEORETICAL FRAMEWORK, RESEARCH
MODEL AND HYPOTHESES 53
3.1 Introduction 53
3.2 Theoretical Perspectives in IS Research Studies 53
3.3 Triandis' Theoretical Framework 57
3.3.1 Concepts Underlying Triandis' Theoretical Framework 57
iii
3.3.2 Definitions of Constructs in the Framework 60
3.3.3 Past Research using Triandis' Framework 64
3.4 Research Model and Hypotheses 65
3.4.1 Research Model 65
3.4.2 Research Hypotheses 70
3.4.2.1 Habits and Behavior 70
3.4.2.2 Habits, Affect and Behavior 73
3.4.2.3 Consequences and Behavior 76
3.4.2.4 Social Factors and Behavior 77
3.4.2.5 Facilitating Conditions and Behavior 78
3.5 Conclusion 80
CHAPTER 4 RESEARCH DESIGN AND METHODOLOGY 84
4.1 Introduction 84
4.2 Research Design 84
4.2.1 Nature of Research 85
4.2.2 Unit of Analysis 86
4.2.3 The Time Dimension 87
4.3 Research Methodology 87
4.4 Data Collection Method 88
4.5 Conceptualization and Operationalization of Constructs and Variables... 92
4.5.1 Definition of Terms 93
4.5.2 The Measures 99
iv
4.5.2.1 Habits..... 99
4.5.2.2 Consequences 101
4.5.2.3 Affect 103
4.5.2.4 Social Factors 105
4.5.2.5 Facilitating Conditions 108
4.5.2.6 Behavior 110
4.6 Questionnaire Design 112
4.6.1 The Design of the Survey Questionnaire 114
4.7 The Pilot Study 117
4.8 The Main Survey 118
4.8.1 Administration of Survey Questionnaires 118
4.8.1.1 Survey Questionnaire Distribution and Return 119
4.8.1.2 Monitoring Questionnaire Returns 121
4.8.1.3 Follow-up Mailings to Non-respondents 122
4.8.2 Comparison of Initial and Follow-up Responses 123
4.8.3 Organizations Surveyed 123
4.8.3 Survey Results 125
4.9 Test for Non-response Bias 127
4.10 Conclusion 128
CHAPTER 5 DATA ANALYSIS AND RESULTS 129
5.1 Introduction 129
5.2 Description of Respondents 129
V

5.3 Reliability Test 131
5.4 Dealing with Missing Data 132
5.5 Analysis and Test Results for the Research Model 134
5.5.1 Analysis for the Research Hypotheses 135
5.5.2 Test Results for the Research Hypotheses 138
5.5.3 Multiple Regression Analysis to Identify Important Variables. 142
5.5.3.1 Selecting the Right Multiple Regression Technique 143
5.5.3.2 Selecting the Best Models 144
5.5.3.3 Results of the Stepwise Regression Analysis 145
5.6 Conclusion 148
CHAPTER 6 DISCUSSIONS AND CONCLUSIONS 150
6.1 Overview of the Study 150
6.2 Findings, Implications and Conclusions related to the Hypotheses 157
6.2.1 Findings and Implications related to the Hypotheses 157
6.2.2 Conclusions related to the Research Hypotheses 172
6.3 Findings, Conclusions and Implications related to the Research
Questions 173
6.3.1 Findings related to the Research Questions 173
6.3.2 Conclusions related to the Research Questions 174
6.3.3 Implications related to the Research Questions 175
6.4 Conclusions related to the Research Problem 176
vi

6.5 A Modified Version of the Research Model.. 177
6.6 Contributions of the Study 179
6.7 Implications for Theory and Future Research ...182
6.8 Limitations and Implications for Further Research 183
REFERENCES..... 186
APPENDICES 207
APPENDIX A: Template of Cover letter to Questionnaire 208
APPENDIX B: Survey Questionnaire 211
APPENDIX C: Template of Follow-up Cover letter to Questionnaire 220
APPENDIX D: Industry Codes and Industry Groups in Database 222
APPENDIX E: Table 5.4.1 to Table 5.4.15 225
APPENDIX F: Multiple Regression Assumption Checks 231
vii

LIST OF TABLES
Table 2.1 Sample Definitions of EIS
Table 2.2 Popular EIS Products (Source: Bidgoli, 1997)
Table 2.3 A Comparison of EIS, DSS and MIS (Source: Watson,
Houdeshel & Rainer, 1997)
Table 2.4 How Executive Use an EIS (Source: Senn, 1990)
Table 2.5 Classification of EIS Research Studies by Research Focus
Table 4.1 Summary of Research Design and Methodology
Table 4.2 Reliability Coefficients of Scales (Cronbach' s Alpha) for
scaled Variables used in this Study
Table 4.3 Comparison between Initial and Follow-up Responses
Table 4.4 A Breakdown of Records in the Database used in the Survey
Table 4.5 Summary Responses to Questionnaires
Table 5.1 Description of Respondents
Table 5.2 Summary Statistics for Variables in the Study
Table 5.3 Pearson's Product-moment Correlations Among Variables
in Research Model
Table 5.5 Pearson's Product-moment Correlations between Predictor
variables and Response variables - Frequency of EIS use
and Internalization of EIS use
Page
23-24
29
30
45
49
85
112
123
125
126
130
134
137
139
Table 5.6 Pearson's Product-moment Correlations between Predictor
variables and Response variables - EIS Experience and
Ability to use EIS 139
viii
Page
Table 5.7 Summary of Results of Tests for Research Hypotheses 140-141
Table 5.8 Stepwise Regression Analysis - Frequency of EIS use 147
Table 5.9 Stepwise Regression Analysis - Internalization of EIS use 147
Table 5.4.1 Correlations Matrix Among Perceived Usefulness Sub-
Variables (Beliefs) 226
Table 5.4.2 Correlations Matrix Among Perceived Usefulness Sub-
Variables (Value Attached) 226
Table 5.4.3 Correlations Matrix Among Internalization Sub-Variables 226
Table 5.4.4 Correlations Matrix Among EIS System Satisfaction Sub-
Variables 227
Table 5.4.5 Correlations Matrix Among EIS Information Satisfaction
Sub-Variables 227
Table 5.4.6 Correlations Matrix Among EIS Support Services
Satisfaction Sub-Variables 227
Table 5.4.7 Correlations Matrix Among EIS Development Plan
Satisfaction Sub-Variables 228
Table 5.4.8 Correlations Matrix Among Executive's Subjective Norms
Sub-Variables (Assessment of Work Group Influence) 228
Table 5.4.9 Correlations Matrix Among Executive's Subjective Norms
Sub-Variables (Evaluation of Probability of Work Group
Influence) 228
Table 5.4.10 Correlations Matrix Among Executive' s Subj ective Roles
Sub-Variables 229
ix

Page
Table 5.4.11 Correlations Matrix Among Subjective Values of EIS Sub-
Variables 229
Table 5.4.12 Correlations Matrix Among Social Situations Sub-Variables 229
Table 5.4.13 Correlations Matrix Among Facilitating Conditions
(Organizational Environment) Sub-Variables 230
Table 5.4.14 Correlations Matrix Among Facilitating Conditions (System
Development Processes) Sub-Variables 230
Table 5.4.15 Correlations Matrix Among Facilitating Conditions
(Management Processes) Sub-Variables 6 230
LIST OF FIGURES
Page
Figure 2.1 A n EIS Configuration showing Internal and External
Databases and Executives' workstations. (Source: McLeod
and Schell, 2001) 32
Figure 2.2 A Three Layer EIS Configuration incorporating some of the
latest Technologies - Internet/Intranet, World Wide Web,
O L A P and Data Warehouse (Source: Kirkgoeze et al., 1997) 33
Figure 2.3 General-purpose software and EIS (Source: Watson,
Houdeshel and Rainer, 1997) 35
Figure 3.1 Triandis' Theoretical Framework - showing Relations among
the major variables (Source: Triandis, 1980) 58
Figure 3.2 Research Model for EIS use 67
Figure 6.1 EIS Usage Model (EISUM) 177
Figure 5.1 Normal P-P Plot of Regression Standardized Dependent
Variable: Frequency of EIS use 234
Figure 5.2 Normal P-P Plot of Regression Standardized Dependent
Variable: Internalization of EIS use 234
Figure 5.3 Histogram Dependent Variable: Frequency of EIS use 235
Figure 5.4 Histogram Dependent Variable: Internalization of EIS use 235
Figure 5.5 Scatterplot Dependent Variable: Frequency of EIS use 236
Figure 5.6 Scatterplot Dependent Variable: Internalization of EIS use 23 6
xi
LIST OF PUBLICATIONS RELATING TO THIS STUDY
Ditsa, G.E.M. (2003). Executive Information Systems Use in Organizational
Contexts: An Explanatory User Behavior Testing, in G. Ditsa (edn),
Information Management: Support Systems & Multimedia Technology, (pp.
109 - 155) IRM Press, Hershey • London.
Ditsa, G.E.M. (2002) Executive Information Systems Use in Organizational
Context: - Understanding the User Behavior Proceedings of IACIS 2002
Conference, Fort Lauderdale, Florida, October 2-5, 2002.
Ditsa, G.E.M. (2002) Executive Information Systems Use in Organizational
Context: An Exploratory Study, in M. Khosrow-Pour (edn), Issues &
Trends of Information Technology Management in Contemporary
Organizations, 2002 Information Resources Management Association
International Conference, Seattle, Washington, USA, May 19-22, 2002 (pp.
182-191), Idea Group Publishing, Hershey, PA.
Ditsa, G.E.M. (1999). Individual, Group and Organizational Goals that
Contribute to the Continuous Acceptance and Success of Executive
Information Systems: An Empirical Investigation, Proceedings of 1999
Information Resources Management Association International Conference,
Hershey, PA, USA, pp. 1130 -1132. (Winner of the Best Doctoral
Submission Award. Topic revised to current PhD Topic).
Ditsa, G.E.M. (1999). Executives' Selection and Use of Information Sources for
Decision-making and the Impact of Executive Information Systems: An
xii

Empirical Investigation, ACIS'99 Doctoral Consortium, December 1 - 3 ,
1999, Wellington, New Zealand (Topic revised to current PhD Topic).
Ditsa, G.E.M. and MacGregor R.C. (1995) Models of User Perceptions,
Expectations and Acceptance of Information Systems, Proceedings of the
1995 Information Resource Management Association International
Conference, Atlanta, Georgia, USA, May 1995, pp. 196-204 (Best Paper
Award Winner of the Conference - This paper was produced from my
Masters Project Thesis, the work which spurred on to this PhD project).
xiii

ABSTRACT
Executive Information Systems (EIS) are designed to enhance executives and
senior managers' work performance in their organizations. Despite the
importance and the reported growth in popularity of EIS, there are reports of
underutilization of these systems which, in part, contributes to the failures of
these systems. The majority of prior EIS research has focused on documenting
the features, benefits, development methodologies, and implementations of these
systems. Unfortunately, very few studies addressed the problem of
underutilization of EIS in relation to the user's behavior.
The primary aim of this research study is to investigate the factors that explain
users' behavior towards using EIS in organizational settings. The study also aims
to identify the relative importance of those factors that determine the use of EIS,
with the objective of using the results to suggest ways of improving the usage of
EIS in organizations. The research model is based on Triandis' Theoretical
Framework, a model from social psychology and organizational behavior. The
research model is used to hypothesize that EIS usage (Behavior) is determined
by: EIS experience, ability to use EIS (Habits); subjective norms, subjective roles,
subjective values, social situations (Social Factors); perceived usefulness of EIS
(Consequences); user satisfaction with EIS information, the EIS system, EIS
support, EIS plan (Affect); and EIS development processes, management
processes, organizational environment (Facilitating Conditions).
xiv

Field data obtained by a survey questionnaire from CEOs, C F O s and one other
executive from 200 organizations using EIS in Australia were used to test the
research model and to confirm the appropriateness of the Triandis' behavioral
model for EIS usage through correlation and regression analyses.
The results of the study indicate overall that social, cultural, political and
organizational factors are important variables that explain the behavior of
executives in using EIS. The order of importance of these factors (from most to
least important) in explaining executives' behavior in using EIS is:
organizational, social, cultural and political.
The results have theoretical, methodological and practical/managerial
implications. Theoretically, the study confirmed that Triandis' behavioral model
is an appropriate reference theory for studying EIS usage. Methodologically, the
approach for studying EIS as a behavior using Triandis' Framework has
enhanced understandings from previous studies based on different approaches.
Practically/managerially, the findings of the study have implications for EIS
design, development, implementation and management in organizations.
xv

ACKNOWLEDGEMENTS
Work that consumes much of one's life, like a P h D research does, is never
accomplished alone. It is impossible to mention all those who have made this
dream come true but to sincerely thank everyone who made this possible.
I would like to dedicate this Thesis to my mother, the woman whose loving care
and determination, in the midst of very little started me on a career path through
formal education. I am glad she is alive to see this dream come true. And to the
memory of my father, whose strict but gentle discipline made me to be resilient
in face of all adversities during this process.
I would like to express my heartfelt, sincere and deepest gratitude to Professor
Graham Winley, who was not just my supervisor in this project but was, and still
is, my mentor, father, colleague and friend for the past 13 years. He gave me the
needed encouragement, motivation, advice and care, especially in the last one
and half years of this project when unexpected adversities tested my
determination and perseverance. His excellent supervision has shaped this
research and the report to the highest quality and standard possible. I wish to
sincerely thank him for being a great supervisor, mentor, father, colleague and
friend. He made me experience the warmth of a man instead of imagining it.
I would also like to thank Dr Sim Kim Lau who readily agreed to be my co-
supervisor when the rules for supervision at the University changed during my
candidature. To Associate Professor Joseph Davis for initially supervising/co-
supervising me before departing the University, I offer my sincere thanks.
xvi

M y sincere gratitude also goes to Professor David Griffiths who expertly guided
me through the statistical part of this research, right from the proposal phase to
the writing of the thesis. I enjoyed the many consultations I have had with him
and he made my understanding of the statistical part of this research reflect in the
highest quality and standard possible in this thesis. I would also like to thank Dr
J. Rajendran Pandian for his assistance and guidance during the initial coding
phase of the data.
I would like to thank all my colleagues, especially Dr Sim Kim Lau, Dr Reza
Zamani, Dr Peter Hyland, Mr. Ang Yang Ang and Mr. Rob MacGregor who
participated in the pretest of my survey questionnaire. I would particularly like
to express my appreciation to Mrs Debbie Critcher, our Administrative Assistant,
for being always ready to assist in the procurement of logistics and other
administrative work for this study.
I would also like to thank Mr. Ralph Curcio of BHP for his involvement and
participation in the pilot as well as the main study and all the many participants
in the main survey for this study.
Finally, I would like to thank my family and friends for their support and
encouragement given in this endeavor, especially my brother Kingsley and the
other siblings, and my dear Lydia who from a distance constantly encouraged
and supported me throughout this project.
xvii
CHAPTER 1 INTRODUCTION
1.1 Background to the Research Study
Today, the use of computer-based information systems to improve decision
making and performance prevails in almost every sector of every organization.
While executives preside over and authorize expenditures on information
technology (IT) and its use in their organizations, they have not necessarily
directly benefited from the use of the technology in making strategic decisions
and in performing other executive level managerial duties.
Executives have seen IT introduced into the offices of their clerical staff and
middle managers to a great effect, but their own experiences of the technology
have often been limited to authorizing expenditures on IT, learning why yet
another corporate system has failed or needs replacing, being disappointed by the
quality of information received from management information systems, and/or
being frustrated when trying to operate information systems which were designed
with computer experts in mind rather than the casual user (Pervan and Phua,
1997). As a result, executives have relied on printed reports, subordinates,
meetings, networks of people inside and outside their organizations, telephone
calls, newspapers, government reports, and the like to perform their managerial
duties (Watson and Carte, 2000).
To assist executives to obtain some of the necessary information needed in their
strategic decision-making and other managerial duties from computer-based
1

information systems, a few leading-edge firms in the U S in the late 1970s
developed a computer-based system which we now call executive information
systems (EIS) (Houdeshel and Watson, 1987). These innovative systems are
specifically tailored to meet executives' information needs for decision-making
and other executive level managerial duties (Holsapple and Whinston, 1987;
Harvey and Meiklejohn, 1990; Watson, Rainer and Koh, 1992).
While there are reports of success stories in using EIS, there are comparatively
higher number of reports on the failures of these systems (Millet and
Mawhinney, 1992; Watson and Frolick, 1993). The reported failures of these
systems in organizations, particular at the corporate strategic management levels,
have been extensively documented in the literature (Glover, Watson and Rainer,
1992; Rainer and Watson, 1995; Young and Watson, 1995; Hanzic, 1997;
McBride, 1997; Nandhakumar and Jones, 1997; Vandenbosch and Huff, 1997;
Liang and Miranda, 2001). Rainer and Watson (1995) for instance found the
failure rate in the US market as high as 60%, and a recent study estimated the
failure rate as high as 70% in the US market (Poon and Wagner, 2001).
These reported failures of EIS revealed the "risky and fragile" nature of the
design, development and implementation of these systems (Glover, Watson and
Rainer, 1992; Watson, Houdeshel and Rainer, 1997). The reported failures also
gave way to cynicism and disappointment to replace the euphoria that
accompanied the birth of these systems, and presented a grim outlook for the
2

introduction and use of the systems in the workplace. As a result, some
organizations that are yet to implement EIS are reluctant to do so (Waston and
Frolick, 1993; Byun and Suh, 1994).
1.1.1 Factors that contribute to EIS failures
There are several factors that contribute to EIS failures: some technical, others
managerial and organizational (Watson, Houdeshel and Rainer, 1997). Some of
the EIS failures were inexplicably linked to organizational, management, social,
cultural, behavioral, psychological and technological factors (Kling, 1991;
Davies, 1992; McBride, 1997; Nandhakumar and Jones, 1997; Poon and Wagner,
2001).
Another factor contributing to EIS failures is the non-usage or low usage of the
systems. System usage has generally been identified in the IS literature as one of
the sources of failures of systems, and system usage is often used as a surrogate
of IS success. System usage has also been identified as being user behavior
related (Trice and Treacy, 1988).
1.1.2 Research studies on EIS and the Motivation for this Study
Although EIS have attracted a growing number of research studies, a review of
the EIS literature indicates that few studies have been done on the usage of these
systems. The majority of prior EIS research studies have focused on documenting
the features, benefits, design, development, methodologies, and implementation
3
of these systems (e.g., Rainer and Watson, 1995; Nandhakumar and Jones 1997;
McBride, 1997; Watson, Houdeshel and Rainer, 1997; Bajwa et al. 1998;
Vandenbosch, 1999; Watson & Carte, 2000; Scholz, 2000; El-Kordy, 2000). The
research studies on these aspects of EIS are more thorough and extensive than
studies on the usage of these systems. Of the limited research studies on the
usage of these systems, unfortunately, very few used appropriate reference
theories that addressed system usage as a behavior (Trice and Treacy, 1988).
These very few studies on EIS usage are also mixed, with only a very small
number addressing the problem of underutilization of these systems. In other
words, the research approaches to resolve EIS failures are more technical and
technological than social, cultural, political and organizational in nature.
Although recent studies (Bergeron et al, 1995; Carte, 1999; Watson and Carte,
2000) indicate there is a growing popularity of EIS, and new concepts such as
enterprise resource planning (ERP), data warehousing, data mining, OLAP,
ROLAP, MOLAP, Internet, Intranet, Extranet and the Web are giving rise to a
renewed need to provide executives with a meaningful view of corporate
information, the problem of underutilization or non-usage of EIS still remains.
The motivation for this study therefore is to provide insights into the failure of
EIS in organizations due to underutilization or non-usage of these systems.
4

The remainder of this chapter introduces: the research problem and the research
questions; the conceptual framework upon which this research was built; the
significance of this study; the delimitations of scope and key assumptions of this
study; and the organization of this thesis.
1.2 Research Problem and Questions
Information systems, including EIS, are social systems. Previous studies (e.g.,
Sauer, 1993; Poulymenakou & Holmes, 1996; Nandhakumar, 1996) have
suggested that the success or failure of an IS cannot be explained purely in
technical terms, and that the roots of a successful IS lie in the social and
organizational context. Studies of the Stock Exchange Taurus system (Currie,
1995), the London Ambulance system (Beynon-Davies, 1995), the Confirm
system (Oz, 1994) and other studies (Sauer, 1993; Mitev, 1996; McBride, 1997)
have also indicated that the complex interaction of the social, cultural, political
and organizational elements with technical elements resulted in the failure of a
number of information systems. The success or failure of information systems is
therefore inextricably linked with the dynamics of the organization within which
they exist. McBride (1997), who studied the rise and fall of an EIS in a UK
manufacturing company over nine years, concluded that: "no study that concerns
itself with how to develop a successful IS and how to avoid failures can reach
many reasonable conclusions unless it addresses issues of context and culture"
(p. 277). Also, social, cultural and organizational factors have been linked with
system usage (Bergeron, et al, 1995; Carlson and Davis, 1998; Venkatesh and
5
Morris, 2000).
The research problem that this study sought to provide solutions to is: the failure
of executive information systems (EIS) in organizations due to underutilization
or non-usage of these systems.
Given the preceding considerations, the primary aim of the study is to identify,
examine and provide an understanding of the social, cultural, political and
organizational factors that explain the behavior of executives towards using EIS.
The two main research questions that this study addressed in relation to the
research problem are:
1. What are the important social, cultural, political and organizational
factors that explain the behavior of executives towards using executive
information systems in organizational settings?
2. What is the relative importance of these factors in determining executive
information systems use by executives in organizational settings?
1.3 Conceptual Framework for the Study
A number of researchers have studied different aspects of the phenomenon of
individual reactions to computing technology from a variety of theoretical
perspectives, including: the Technology Acceptance Model (TAM) which is an
adaptation of the Theory of Reasoned Action (TRA) (e.g., Davis, 1989; Davis, et
al, 1989; Adams et al., 1992; Venkatesh & Davis, 1996; Kim, 1996; Venkatesh,
6
1999; Venkatesh and Morris, 2000; Elkordy, 2000; Elkordy and Khalil, 2002);
Diffusion of Innovations (e.g., Moore & Benbasat, 1991; Compeau and Meister,
1997); the Theory of Planned Behavior (TPB) (e.g., Mathieson, 1991; Taylor
and Todd, 1995); Social Cognitive Theory (SCT) (e.g., Compeau & Higgins,
1995a, 1995b; Hill et al, 1986, 1987) and Activity Theory (e.g., Engestrom &
Escalante, 1996; Nardi, 1996; Kuutti, 1996, 1999; Engestrom, 1999; Blackler et
al., 1999; Ditsa, 2003). This body of research has produced useful insights into
the cognitive, affective and behavioral reactions of individuals to technology, and
into the factors that influence these reactions.
According to Compeau et al. (1999), in each of the theories noted above,
behavior (e.g., the use of computers) is viewed as the result of a set of beliefs
about technology and a set of affective responses to behavior. These beliefs are
represented by the perceived characteristics of innovating in Innovation
Diffusion research, by perceived usefulness and perceived ease of use in TAM,
by behavioral beliefs and outcome evaluations in TPB, and by outcome
expectations in SCT. Seddon (1997) refers to these as the net benefits (realized
or expected) accruing from the use of a system. Affective responses are typically
measured by attitudes towards use - an individual's evaluation of behavior as
either positive or negative. The commonalities in these models reflect a belief in
the cognitive basis of behavior.
7
Compeau et al. (1999) however suggest that, while T A M and the Diffusion of
Innovations perspectives focus almost exclusively on beliefs about the
technologies and the outcomes of using them, SCT and the TPB include other
beliefs that might influence behavior, which are independent of perceived
outcomes. The TPB model incorporates the notion of Perceived Behavioral
Control (PBC) as an independent influence on behavior, recognizing that there
are circumstances in which a behavior might be expected to result in positive
consequences (or net benefits), yet not be undertaken due to a perceived lack of
ability to control the execution of the behavior. PBC encompasses perceptions of
resource and technology facilitating conditions, similar to those measured by
Thompson, et al. (1991, 1994), as well as perceptions of ability, or self-efficacy
(Taylor and Todd, 1995).
However, none of the above theoretical frameworks addresses explicitly the
social, cultural, political and organizational factors that may influence/explain the
user's behavior to use information systems.
Triandis' Framework, a theoretical model from social psychology and
organizational behavior, explicitly addressed the net beliefs as well as the social,
cultural and organizational factors that influence/explain behavior. Bergeron et
al. (1995) who used Triandis' Framework as a theoretical foundation for their
study on EIS usage have suggested that 'future investigations should aim for a
cumulative tradition by continuing to employ Triandis' Framework as a
8

theoretical foundation to further understand the phenomenon of EIS use" (p.
142).
Triandis' Framework has some similarity with Fishbein and Ajzen's Theory of
Reasoned Action (TRA) from which the Technology Acceptance Model (TAM)
was derived and commonly used as a theoretical foundation for IS usage studies.
This study uses Triandis' Framework as a theoretical foundation. A detail
description of the framework is presented in Chapter 3.
1.4 Methodology
The nature of this study is both exploratory and explanatory and the unit of
analysis is the individual. A cross-sectional approach, in which the unit of
analysis is observed at only one point in time, is adopted in this study. The study
employs a field study approach because of the nature of the variables involved.
1.4.1 Data Collection Method
The data collection method was by mail survey using ordinary mail. The
questionnaire for the survey was pre-tested and a pilot survey conducted. The
main data for the study was obtained by administering the final questionnaire on
executives and senior managers from 200 organizations using EIS in Australia.
9

1.4.2 Data Analysis
Preliminary evaluations of the research model and the hypotheses associated with
the model were performed by calculating Pearson's product-moment correlation
coefficients (Pearson's r). A further analysis was conducted by using stepwise
regression analysis to determine the relative importance of the predictor
(independent) variables in explaining EIS use. Analyses were also performed to
ensure there were no violations of the assumptions of normality, linearity and
homoscedasticity. SPSS Release 11.0 for Windows was used in the analysis.
1.5 Justification and Significance of the Study
Of all types of information technology, executives information systems are
expected to have the greatest impact on executives' work performance. A survey
of senior IS managers in the 1990s identified 'facilitating and managing decision
and executive support systems" as one of the most critical IS management issues
(Niederman et al, 1991). A review of the literature suggests that these IS
management issues still remain the most critical today. Although the importance
of EIS has been recognized in the IS literature as the key to addressing these
issues and providing the expected technological impact on executives' work
performance, few attempts have been made to systematically investigate key
factors in the successful utilization of these systems. The empirical results from
this study prove useful for both IS researchers and practitioners in identifying the
key factors affecting the utilization of EIS.
10

The significance of this study is threefold: theoretical, methodological and
practical/managerial. Theoretically, this study is significant in suggesting and
providing a framework for research into EIS usage as behavior.
Methodologically, the approach adopted in this study has significance for further
research studies into EIS usage. The study also provides important suggestions
for further research into usage factors for EIS and other information systems /
technologies. Practically/managerially, the results of this study will assist EIS
designers, developers, implementers and managements of organizations to
improve EIS usage in organizations. In particular, the results of this study points
to the following practical/managerial improvements in relation to EIS:
• Improvement in the design, development and implementation of EIS;
• Better education and training of EIS users;
• Improvement in EIS usage leading to the success of these systems;
• Better allocation of resources for EIS;
• Better management of EIS in organizations.
1.6 Organization of the Thesis
This thesis consists of six chapters, titled in this order: Introduction; Literature
Review and Research Issues; Theoretical Framework and Research Model;
Research Design and Methodology; Data Analysis and Results; Conclusions and
Implications.
11

Chapter 2 presents a review of the relevant EIS literature and critically examines
the research focus on EIS usage and presents six classifications of EIS usage by
research focus. An historical review of the evolution of EIS and the popularity of
EIS are also presented in this chapter. Various definitions of EIS are presented to
highlight the complex nature of these systems, and the definition to be used in
this study is presented. The benefits and characteristics of EIS, models of EIS,
and the future trends in EIS are also examined and presented. The nature of
executives' work and how EIS fit into their work are evaluated in this chapter.
Based on the literature review, the research problem and the research questions
for the study are presented.
Chapter 3 presents theoretical perspectives used to study IS usage and argues that
system usage is a behavior which should be studied using appropriate reference
theories. Triandis' Theoretical Framework which this study uses as a reference
theory is described. Based on the theoretical framework and the relevant
literature, the research model and the hypotheses to be tested in the study are
presented. Details of factors depicted in the research model that are considered
to influence/explain behavior in using EIS also are presented. Finally, EIS
research studies based on Triandis' Framework and their advocacy for the use of
this framework as a theoretical foundation for IS usage research are presented.
Chapter 4 describes the research design and the methodology adopted to collect
data to test the hypotheses and the research model. The nature of the research,
the unit of analysis, the dimension, the research methodology, and the data
12
collection attributes and characteristics employed in this study are described.
The conceptualization and operationalization of the constructs and variables
based on the theoretical framework and the research model are presented and this
is followed by a description of issues relating to reliability and validity which are
taken into account in the conceptualization and operationalization. The design of
the questionnaire is discussed. Finally, the pilot survey, the main survey, and the
aatoinistration of the main survey are discussed.
Chapter 5 presents the data analysis and the results of the study. The results of
the bivariate analysis and the multiple regression (stepwise) analysis are
presented in this chapter.
Chapter 6 presents the discussion of the findings, implications and conclusions
related to the research hypotheses. This is followed by discussion of the
findings, conclusions and implications related to the research questions and the
research problem. The updated version of the original research model and the
implications for EIS and IS/technology usage research are presented. This
chapter concludes with the contributions of this study, the implications for theory
and future research, and the limitations of the study.
1.7 Delimitations of the Scope of the Study
This study is aimed at finding solutions to the problem of EIS failures in
organizations due to underutilization or non-usage of these systems. The study
seeks solutions to this problem by investigating the important social, cultural,
13

political and organizational factors that explain the behavior of executives
towards using EIS and the relative importance of these factors in determining
executives' EIS use in organizational settings. All the hypotheses tested in the
study relate to the referenced investigation.
Organizations surveyed are all in Australia. The organizations are from any
industry and any sector and they are either private or public organizations. The
organizations ranged from small to very large organizations employing a
minimum of 1,010 to a maximum of 750,000 people. The number of IT staff in
the organizations ranged from 0 to 4000 and turnover ranged from U S $ 0 to over
US$1 billion. The participants in the study were executives and senior managers
using EIS in the organizations surveyed.
The nature of this study is both exploratory and explanatory and the unit of
analysis is the individual. A cross-sectional approach, in which the unit of
analysis is observed at only one point in time, is adopted in this study. The study
employs a field study approach because of the nature of the variables involved.
The data collection method used a mail survey method using ordinary mail.
1.8 Conclusion
This chapter laid down the foundation for this thesis. It introduced: the
background to the study; the research problem and the research questions; and
the conceptual framework upon which the study was built. It then presented the
justification and significance of the study, followed by a brief description of the
methodology for the study. Finally, the organization of the thesis, and the
delimitations of the scope of the study were presented.
14

CHAPTER 2 LITERATURE REVIEW AND RESEARCH ISSUES
"'Failures' of technology have been quite common throughout history - every major innovation
starts out with a lot of hype and hope. Within a few years the euphoria is replaced with
disappointment and cynicism. If the technology proves itself, however, the cynicism eventually
yields to reality and success. The automobile, the radio, television and personal computers
have all experienced such an acceptance cycle. Now EIS are having their turn of the bat"
(Burkan, 1991, p. vii).
2.1 Introduction
This chapter reviews the relevant literature for this study and presents the
research issues resulting from the literature review. The chapter is organized as
follows.
The quest for an information system (IS) to meet executives' information needs
in their managerial duties which gave rise to the development of executive
information systems (EIS) is first presented. This is followed by consideration of
the evolution and popularity of EIS. Various definitions of EIS and the definition
to be used in this study are presented next, followed by the benefits and
characteristics of EIS, models of EIS, and future trends in EIS. Next, executives'
work and how EIS fit into their work is evaluated. Finally, a critical evaluation
of previous research studies on EIS usage is presented in order to demonstrate
why this study is important. A conclusion to the chapter summarizes the material
presented and the motivation for this study.
15

2.2 T h e Quest for an Information System to meet Executives' needs
Top executives in organizations are charged with the responsibility of making
strategic decisions for their organizations. The strategic decision-making
processes require a myriad of information from within and outside the
organizations. In recent times, the complexity of the business environment has
increased due to market globalization coupled with the growth in the number of
products and services produced in multiplying markets (Matthews 1992). To
complicate matters, competition and pressures from financial markets have
intensified, while more and more government legislation, policies and regulations
are affecting industries (Matthews, 1992; Frolick et al. 1997). All these factors
must be carefully taken into consideration by any visionary executive in making
any strategic decisions for their organization. And due to today's rapidly
changing business environment and fierce competition in the marketplace, there
is also the dire need and the growing challenge for executives to make strategic
decisions promptly, in order to remain competitive and stay ahead in business.
While executives preside over and authorize expenditures on information
technology (IT) and its use in their organizations, they have not necessarily
directly benefited from the use of that technology in making strategic decisions
and in performing other executive level managerial duties. They have relied on
printed reports, subordinates, meetings, networks of people inside and outside
their organizations, telephone calls, newspapers, government reports, and the like
16

p. 17 is missing from original document

However, as indicated in the opening quotation, the euphoria that accompanied
the birth of these systems has been replaced often by cynicism and
disappointment. While there were some reports of success in using these
systems, there was substantial number of reports of EIS failures (Millet and
Mawhinney, 1992; Waston and Frolick, 1993). These failures revealed the "risky
and fragile" nature of the design, development and implementation of these
systems (Rockart and DeLong, 1988; Glover, Watson and Rainer, 1992; Watson,
Houdeshel and Rainer, 1997).
Reports of EIS failures in organizations, particular at the corporate strategic
management levels, have been extensively documented in the literature (Glover,
Watson and Rainer, 1992; Rainer and Watson, 1995; Young and Watson, 1995;
Hanzic, 1997; McBride, 1997; Nandhakumar and Jones, 1997; Vandenbosch and
Huff, 1997; Liang & Miranda, 2001). Rainer and Watson (1995) for instance
found the failure rate in the US market as high as 60%. A recent study estimated
the failure rate as high as 70% in the US market (Poon and Wagner, 2001). EIS
failures were inexplicably linked to organizational, management, culture, social,
behavioral, psychological and technological factors (Poon and Wagner, 2001;
McBride, 1997; Nandhakumar and Jones, 1997; Davies, 1992; Kling, 1991).
As a result of the reported EIS failures some organizations that are yet to
implement these systems are reluctant to do so (Waston and Frolick, 1993; Byun
and Suh, 1994). Earlier studies have revealed that relatively few EIS were fully
18
operational. In Australia, for example, by 1997 there were relatively few EIS
that were fully operational (Pervan and Phua, 1997). These reported EIS failures
presented a grim outlook for the introduction and use of these systems in the
workplace.
The next section presents an historical overview of the evolution of EIS and the
difficulties associated with developing an appropriate name for these systems.
2.3 The Evolution and Popularity of EIS
"What these systems are called does not really matter. What does matter is what they can do "
(Poller and Laska, 1990, p. 2).
The term executive information systems (EIS) was first coined at the
Massachusetts Institute of Technology (MIT) in the late 1970s when a few
leading-edge firms developed computer-based information systems to assist their
executives in their managerial duties (Houdeshel and Watson, 1987). These
systems generally went unnoticed until Rockart and Treacy published their 1982
article, "The CEO Goes On-Line", which described executives such Ben
Heineman at Northwest Industries in the US, who was a daily user of EIS. This
article made many executives aware of the possible benefits of EIS. The book,
Executive Support Systems, by Rockart and DeLong (1988), further fueled
executives' interest in EIS and led to many large and even smaller organizations
developing the systems in the late 1980s (Watson, Rainer and Houdeshel, 1992).
19

It was not surprising that other organizations were skeptical and reluctant to
follow suit. This was because both management information systems (MIS) in
the 1960s and decision support systems (DSS) in the 1970s had failed to deliver
what they promised and above all, EIS were (and still are) very expensive to
build and maintain. MIS became an expanded set of scheduled, summary
reports, while DSS were used by staff and lower level managers to analyze
specific decision-making tasks. Neither of these types of systems made
executives hands-on computer users or became an integral part of how executives
perform their duties (Watson, Rainer and Houdeshel, 1992).
Recent studies (Bergeron et al., 1995; Hoven, 1996; Carte, 1999; Watson and
Carte, 2000; Xu and Kaye, 2002) indicate there is a growing popularity of EIS.
According to Bergeron et al. (1995), as of 1988 approximately 25% of large US
companies had senior executives who directly accessed EIS through
workstations. In 1995 the expenditure on EIS software in the US market was
US$350 million annually (Watson et al., 1995). Annual average expenditure on
a single EIS in the US in 1995 was US$365,000 on development and
US$208,000 on maintenance (Nord and Nord, 1995). In 1995 the US market for
EIS was predicted to grow at 40% annually (Watson et al., 1995).
EIS have also spread into the public and small business sectors and in 1990 the
total software revenue of the three leading EIS providers (Comshare, Execucom
and Pilot) was estimated at US$157 million. According to Hoven (1996), the
20

International Data Corporation estimated that expenditure on EIS rose from
US$339 million in 1994 to as much as US$1 billion in 1997. In Europe, the
British, the French and the German markets for EIS grew by 72 percent in 1989
alone. Recent investments in EIS across all sectors and industries in the US were
predicted to grow to nearly US$5 billion in 2003 (Liang and Miranda, 2001) and
in a recent study, a total of 37.5 percent of large Spanish companies were found
using EIS with 89.6 percent of these companies recently completing the
implementation of EIS (Salmeron, 2002).
New technologies such as data warehousing, data mining, enterprise resource
planning (ERP), on-line analytical processing (OLAP), relational operations for
online analytical processing (ROLAP), multidimensional operations for online
analytical processing (MOLAP), Internet, Intranet, Extranet and the Web
technologies have recently increased the popularity of EIS (Carte, 1999; Bashein
and Markus, 2000, Singh et al., 2002). These technologies have given the
impetus for the widening use of EIS by managers whose decisions must be
timely in an increasingly competitive and uncertain business environment
(Bergeron et al., 1995; Bashein and Markus, 2000, Singh et al., 2002). Data
warehousing, for example, is generally regarded as the prerequisite for effective
decision support or data mining systems, and ROLAP and MOLAP have given
rise to such concepts as "slicing" and "dicing" of data which have added more
flexibility and ease of use to EIS (Bashein and Markus, 2000). Kirkgoeze et al.
21
(1997) have proposed a three-layer EIS model incorporating some of these newer
technologies as shown in Figure 2.2 on page 33.
Recent studies (Wheeler et al., 1993; Frolick & Robichaux, 1995; Bergeron et al.,
1995; Bashein & Markus, 2000) have also shown that the use of EIS is spreading
to other levels in organizations. Consequently, they are referred to in some
organizations as "enterprise-wide information systems" or "everyone's
information systems" which still befits the acronym EIS. In some organizations
they are known by vendor product names such as Enterprise Business
Intelligence Systems, Balanced Scorecard or simply Scorecard. The search for a
single name for these systems is not the issue: "What these systems are called
does not really matter. What does matter is what they can do" (Paller and Laska,
1990, p. 2).
The next section presents various definitions of EIS highlighting the benefits, the
characteristics and the complex nature of these systems.
2.4 Definitions of EIS
Definitions for EIS depend on the perspective through which one sees these
systems. This section presents a sample of these definitions before introducing
the definition to be used in this study.
22

The various definitions for EIS are substantially similar. Essentially, these
definitions vary according to the weight given to the three elements in the name
itself and the characteristics and benefits of the systems. A sample of these
definitions is presented in Table 2.1.
Table 2.1: Sample Definitions of EIS
Definition
"Intensely data oriented systems designed to provide information
for executive use to improve managerial planning, monitoring
and analysis".
"An information system supported with a mainframe computer,
or a personal computer, used for various business functions on a
current basis by the C E O or a member of the senior management
team".
"A computer system that deals with all of the information that
helps an executive make strategic and competitive decisions,
keeps track of the overall business and its functional units, and
cuts down on the time spent on routine tasks performed by an
executive".
"A computerized system that provides executives with easy
access to internal and external information that is relevant to their
critical success factors".
"A structured, automated tracking system that operates
continuously to keep management abreast of what is happening
in all important areas both inside and outside the corporation
[and] is designed to support the complex and multi-dimensional
nature of top-level decision making".
Source
Rockart and Treacy
(1982, p. 84)
Bergeron, Raymond &
Lagorge(1991,p. 7)
Thierauf(1991,p. 10)
Watson, Rainer & Koh
(1992, pp. 82-83)
Turban (1993, p. 404)
23

Table 2.1 (continued)
"A computerized system that is developed for senior executives
to help satisfy their information needs"
" A computer-based information system designed to provide a
senior manager access to information relevant to his or her
management activities".
"Computer-based information systems designed to provide
senior executives with easy access to integrated information from
a variety of internal and external data sources, to support their
analytical, communication and planning needs"
" A set of tools designed to help an organization carefully monitor
its current status, its progress toward achieving its goals, and the
relationship of its mental model of the world to the best available
clues about what's really happening".
" A computer-based information system that provides executives
with easy access to internal and external information with drill-
down capability related to the critical success factors for running
current and future business operations".
Young and Watson
(1995, p. 153)
Elam and Leidner
(1995, p. 89)
Pervan and Phua (1997,
p. 64)
Kelly (1998, p. 3)
Bidgoli (1998, p. 93)
Summarizing the thoughts behind these various definitions gives us an EIS as:
Any information systems that can present critical information timely,
clearly and accurately, and reveal the interrelationships and driving
factors between key performance indicators to enable faster and more
accurate decision-making.
24

W e note that a single definition of these systems is unlikely to emerge since the
functionality and application of these systems are evolving and changing.
Although the use of EIS has spread across the levels of organizations, and may
be engaged by other users in many functional areas, in the context of this study,
an EIS will be defined simply as:
A computer-based information system designed to aid executives in the
performance of their managerial roles.
While definitions are useful, in a complex area such as EIS, a better
understanding is obtained by looking at their benefits, characteristics and how
different they are from traditional information systems.
2.5 Benefits and Characteristics of EIS
This subsection presents the benefits and the characteristics of EIS.
2.5.1 Benefits of EIS
From an economic perspective, an EIS helps to reduce the need for paper reports
(Gelfond, 1988); to eliminate staff levels and administrative tasks in
organizations (Gauthir, 1989) and consequently to decrease the costs associated
with them.
25
From an individual perspective, an EIS supports executive activities by providing
online and fast access to data and information from internal and external sources
(Rockart and DeLong, 1988; Paller and Laska, 1990). As a result, it can lead to a
better understanding of the business (Rockart and DeLong, 1988), remove
guesswork in financial forecasting (McCartney, 1989), keep executives up to date
with operations (Gauthier, 1989), and increase the quality of decision-making,
communication capacity and quality (Bergeron, Raymond and Lagorge, 1991).
From an organizational perspective, an EIS facilitates the attainment of
organizational objectives, provides a competitive advantage within an industry
(Bergeron, Raymond and Lagorge, 1991) and consequently can lead to higher
levels of organizational performance (Paller and Laska, 1990).
Despite these obvious potential benefits, EIS have not been used extensively for
a variety of reasons (Watson and Glover 1989; Watson, Rainer and Koh, 1992;
Bidgoli, 1997; Frolick, 1994; King, 1994). One of the reasons given is the non-
use of the systems by the intended users. Another reason is executives do not
feel the necessity to use a computer because they can always rely on staff
personnel and subordinates who fulfill their information needs. An additional
reason is that executives favor soft information from formal and informal
meetings over information from computer systems (McLeod and Jones, 1992).
Another reason relates to a lack of real understanding of the nature of an
26
executive's work. O f particular interest to this study is the underutilization or
non-usage of EIS.
Having considered some of the benefits of EIS and some reasons why the
benefits may not have been realized, we now consider the important
characteristics of these systems.
2.5.2 Characteristics of EIS
Executive information systems draw on multiple applications and multiple data
sources, both internal and external to an organization, in order to provide
executives with the necessary information to monitor and analyze the
performance of their organizations. EIS are mostly concerned with data and
ways of interacting with data. They are designed as structured reporting systems
that filter, extract, and compress a broad range of relevant current and historical
information which are either internal or external to the organization.
EIS attempt to present data in a form that is relevant for enterprise-wide decision
making. They are used, in part, to monitor and highlight the critical success
factors of an organization as defined by the user. In general, EIS are enterprise-
wide, data-driven DSS that help executives and senior managers analyze,
compare, and highlight trends in important variables so that the user can monitor
performance and identify problems and opportunities. EIS increase the ability of
27
executives and senior managers to monitor many activities and m a y help reduce
the number of management levels in an organization (Power, 2002).
Common characteristics of EIS given in the literature (e.g., Rockart and DeLong,
1988; Millet and Mawhinney, 1990; Watson, Rainer and Koh, 1992, Turban,
1993; Watson, Houdeshel & Rainer, 1997; Bidgoli, 1998; Gordon, 1999) include:
• Specifically tailored to executive's information needs and management style;
• Able to access data on specific issues and problems and aggregate reports;
• Able to provide on-line status access, trend analysis, exception reporting and
"drill-down" capabilities;
• Able to access a broad range of internal and external data;
• Particularly easy-to-use (typically mouse or touch-screen driven);
• Used directly by executives without assistance;
• Able to extract, filter, compress, and track critical data;
• Able to contain superb graphics capabilities such that information can be
presented graphically in several ways;
• Very user-friendly and requires minimal or no training to use, so it can be
used by the executive directly;
• Able to provide instant access to supporting details of any summary displayed
on an EIS screen.
Table 2.2 shows some of the popular EIS products in the marketplace today.
28

Table 2.2: Popular EIS Products (Source: Bidgoli, 1997)
Product N a m e
Acumate Enterprise
Commander EIS
Cross Target
Data Interpretation
EIS Toolkit
Express/EIS
Focus/EIS
Forest & Trees
Hobs
Lightship
PowerPlay
Company Name
Kenan Technologies
Comshare, Inc.
Dimensional Insight, Inc.
Metaphor, Inc.
MicroStrategy, Inc.
IRI Software
Information Builders, Inc.
Trinzic Corps.
Holistic Systems, Inc.
Pilot Software, Inc.
Cognos Corp.
The characteristics of EIS mentioned above differentiate EIS from traditional
information systems such as DSS and MIS. A comparison of EIS, DSS, and MIS
by Watson, Houdeshel and Rainer (1997) is shown in Table 2.3.
In spite of the unique characteristics and the numerous benefits of EIS, many of
which have been presented in the sub-sections 2.5.1 and 2.5.2 above, careful
planning for and use of these systems are required to realize the full benefits of
EIS. The underutilization of EIS will not yield the full benefits of the systems.
29
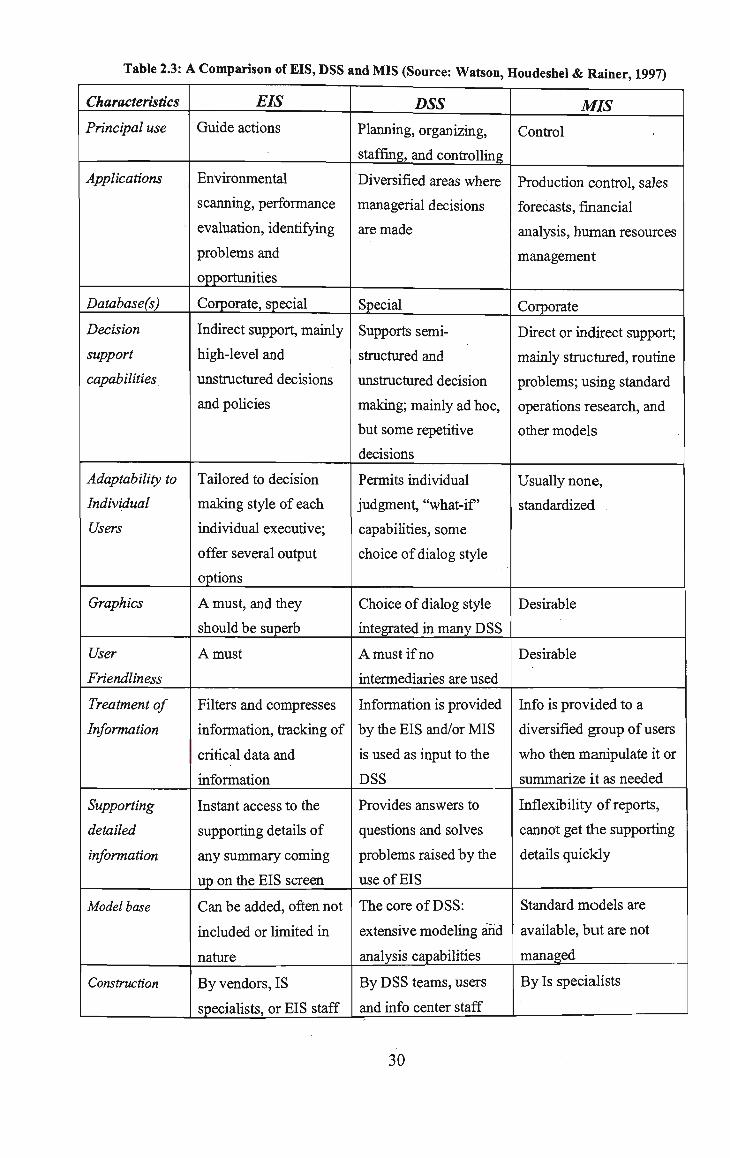
Table 2.3: A Comparison of EIS, DSS and MIS (Source: Watson, Houdeshel & Rainer, 1997)
Characteristics
Principal use
Applications
Databasefs)
Decision
support
capabilities
Adaptability to
Individual
Users
Graphics
User
Friendliness
Treatment of
Information
Supporting
detailed
information
Model base
Construction
EIS
Guide actions
Environmental
scanning, performance
evaluation, identifying
problems and
opportunities
Corporate, special
Indirect support, mainly
high-level and
unstructured decisions
and policies
Tailored to decision
making style of each
individual executive;
offer several output
options
A must, and they
should be superb
A must
Filters and compresses
information, tracking of
critical data and
information
Instant access to the
supporting details of
any summary coming
up on the EIS screen
Can be added, often not
included or limited in
nature
B y vendors, IS
specialists, or EIS staff
DSS
Planning, organizing,
staffing, and controlling
Diversified areas where
managerial decisions
are made
Special
Supports semi-
structured and
unstructured decision
making; mainly ad hoc,
but some repetitive
decisions
Permits individual
judgment, "what-if'
capabilities, some
choice of dialog style
Choice of dialog style
integrated in many D S S
A must if no
intermediaries are used
Information is provided
by the EIS and/or M I S
is used as input to the
DSS
Provides answers to
questions and solves
problems raised by the
use of EIS
The core of DSS:
extensive modeling and
analysis capabilities
B y D S S teams, users
and info center staff
MIS
Control
Production control, sales
forecasts, financial
analysis, human resources
management
Corporate
Direct or indirect support;
mainly structured, routine
problems; using standard
operations research, and
other models
Usually none,
standardized .
Desirable
Desirable
Info is provided to a
diversified group of users
who then manipulate it or
summarize it as needed
Inflexibility of reports,
cannot get the supporting
details quickly
Standard models are
available, but are not
managed
B y Is specialists
30

EIS failures in the early days were attributed to inadequate hardware and
software for developing and maintaining these systems (Watson, Houdeshel and
Rainer, 1997). Today, EIS failures are less likely to be due to inadequate
hardware and software than the underutilization of these systems. More is
known about the hardware and software requirements for developing and
maintaining a successful EIS and workable alternative solutions to tackle
hardware and software problems are available.
The motivation to undertake this study is to identify the important factors that
explain user behavior in using EIS. Knowing these important factors will assist
in the planning, development, implementation and the use of these systems that
will address EIS failures resulting from the underutilization of these systems.
The next subsection presents examples of hardware and software configurations
which are available today to meet the requirements of developing and
maintaining a successful EIS.
2.6 Hardware and Software Requirements of EIS
There are hardware components available in the market today that are configured
to meet the requirements of developing and maintaining a successful EIS. There
are also general-purpose as well as special-purpose software available to meet the
requirements of developing and maintaining a successful EIS.
31
Hardware
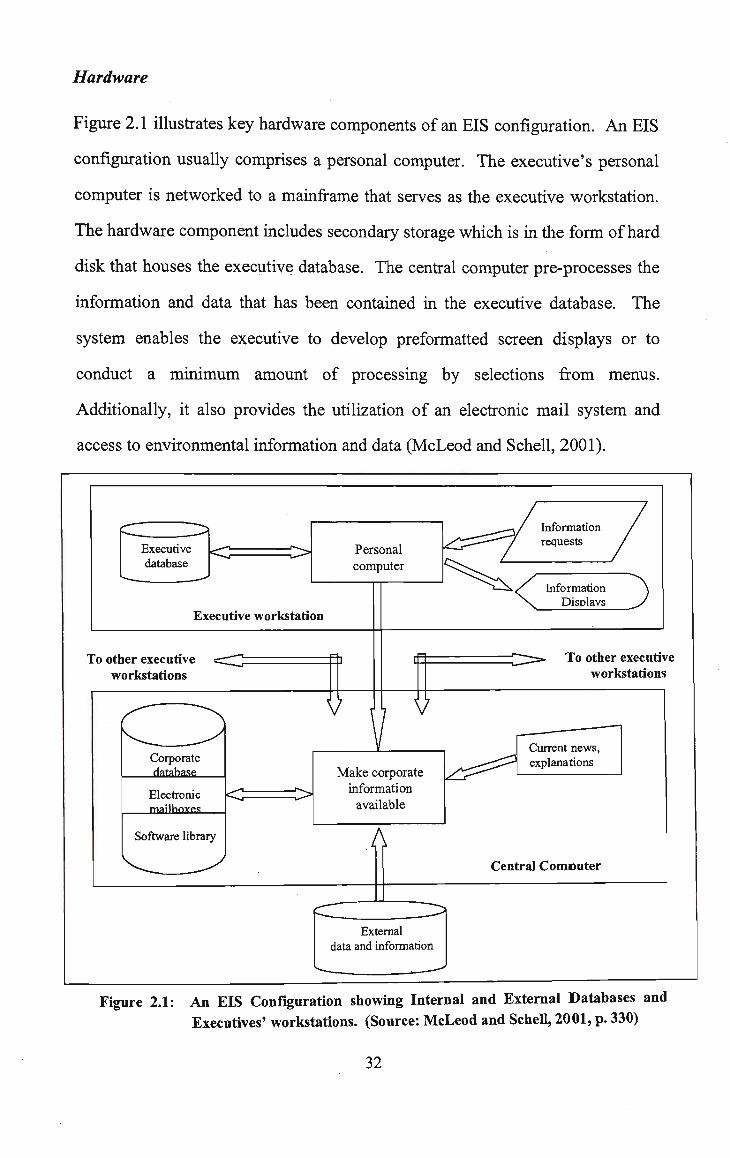
Figure 2.1 illustrates key hardware components of an EIS configuration. An EIS
configuration usually comprises a personal computer. The executive's personal
computer is networked to a mainframe that serves as the executive workstation.
The hardware component includes secondary storage which is in the form of hard
disk that houses the executive database. The central computer pre-processes the
information and data that has been contained in the executive database. The
system enables the executive to develop preformatted screen displays or to
conduct a minimum amount of processing by selections from menus.
Additionally, it also provides the utilization of an electronic mail system and
access to environmental information and data (McLeod and Schell, 2001).
Executive database
< : O Personal computer
Executive workstation
To other executive workstations
V V
Corporate database
Electronic mailboxes
Software library
<? = >
Ma k e corporate information available
A
External data and information
Information requests
Information Disdavs
T o other executive workstations
Current news, explanations
Central C o m o u t e r
Figure 2.1: A n EIS Configuration showing Internal and External Databases and
Executives' workstations. (Source: McLeod and Schell, 2001, p. 330)
32
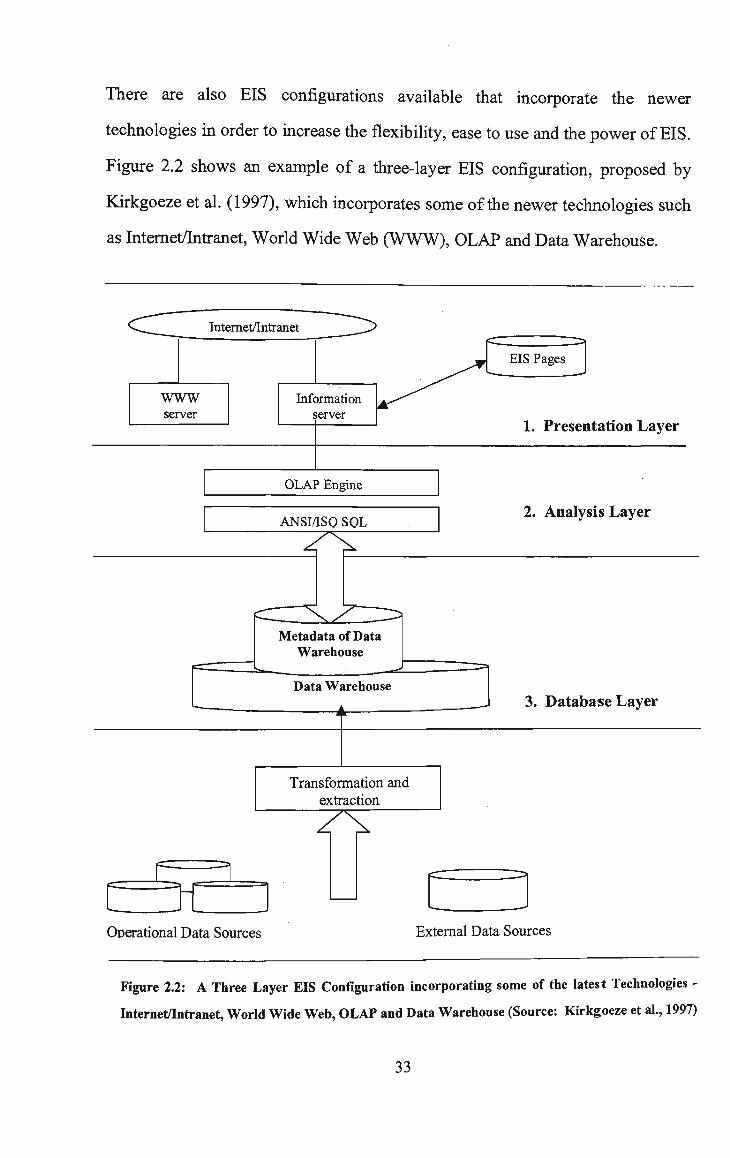
There are also EIS configurations available that incorporate the newer
technologies in order to increase the flexibility, ease to use and the power of EIS.
Figure 2.2 shows an example of a three-layer EIS configuration, proposed by
Kirkgoeze et al. (1997), which incorporates some of the newer technologies such
as Internet/Intranet, World Wide Web (WWW), OLAP and Data Warehouse.
Internet/Intranet
WWW server
Information server
1. Presentation Layer
OLAP Engine
ANSI/ISO SQL
Metadata of Data Warehouse
Data Warehouse
2. Analysis Layer
3. Database Layer
Transformation and
extraction
Z ' 1
- ^y -Operational Data Sources External Data Sources
Figure 2.2: A Three Layer EIS Configuration incorporating some of the latest Technologies -
Internet/Intranet, World Wide Web, OLAP and Data Warehouse (Source: Kirkgoeze et al., 1997)
33

The data warehouse forms the bottom layer. It contains information from
external and internal operational sources and supports easy analyses and
querying. The data warehouse needs to be supported by tools such as Oracle
DBMS to read, process and store data without being taken off-line.
The analysis layer is the connection between the data warehouse and the EIS
applications. It amalgamates data requests, metadata and query building
algorithms to create SQL queries to send to the data warehouse. Before sending
data to the presentation layer, a meta script form of data is generated. The
presentation layer interprets this script and generates appropriate screens for the
end-user.
The presentation layer is the interface between the end-user and the analysis
layer. User input is transformed to meta script language and sent to the analysis
layer. In order to have a common interface, web browsers are used as a
visualization tool for the presentation layer. The information server which lies in
the heart of the presentation layer checks if data is needed from the data
warehouse and if it is, the description of the specific data is sent to the analysis
layer and the received information is integrated into a generated HTML page.
Software
Almost all general-purpose software such as spreadsheet, databases, report
generators or WWW technology provide graphical front end required for an EIS.
34

There are other general-purpose software available which are configured with the
above mentioned to meet the requirements of developing and maintaining a
successful EIS. There are also special-purpose software available today that
meet the requirements of developing and maintaining a successful EIS.
Figure 2.3 shows an example of a variety of general-purpose software that are
configured to build and maintain an EIS (Watson, Houdeshel and Rainer, 1997).
Figure 2.3: General-purpose software and EIS
(Source: Watson, Houdeshel and Rainer, 1997)
The next subsection presents future trends in EIS.
35

2.7 Future Trends in EIS
There are reports of various future trends in EIS as a result of the advances in the
technologies that support these systems. A report of the Illinois Institute of
Technology (TIT) Research Institute, an affiliation of Illinois Institute of
Technology, on the future trends in EIS some few years ago (Dobrzeniecki,
1994) still holds valid today. The HT Research Institute's work on EIS, on which
the report was based, was carried out under a contract awarded by the US
Department of Defense. The report suggests that the future of EIS would lie in
the successful migration away from mainframe computer systems. This trend,
the report adds, would eliminate the need to learn different computer operating
systems and substantially reduce the cost of implementation. This trend also
would utilize existing software applications and minimize the need to learn a new
or special language for the EIS package. The report continues by predicting that
future EIS would be based on super personal computers that organize and
integrate existing software application packages into a useful EIS. The trend
would be not only to provide a system that supports senior executives but to
include the information needs of middle managers also.
The report predicts further that one popular new solution would be visual
information access and analysis (VIAA) systems. These systems are based on
personal computers and make use of Windows, open systems computing, and
object-oriented programming. The systems are easier to build, use and maintain,
as well as less expensive than existing EIS. VIAA systems provide access to
36

company and external information through visual screens that combine text,
numerical data, graphical data and images. The visual screens provide users
quick and easy access to data, improving their decision-making capabilities.
According to the report, the trend to integrate applications and technology makes
the future very promising for EIS. A number of technological and conceptual
advances in information systems as well as in the telecommunications area
provide a glimpse into possible future EIS features and potential new
applications.
Incorporating Artificial Intelligence (Al) into EIS
The amount of data provided to a user is often overwhelming. This is especially
true in the case of an executive. Even with an EIS, there is a potential for
information overload. Artificial Intelligence (Al) could perform some of the data
screening for the executive, reducing the amount of time spent searching for
relevant data.
The inclusion of voice input capabilities also promotes the use of Al. Voice
input would reduce the amount of data entry time and errors committed by the
executive. Voice input and output add flexibility to the system and provide
further understanding and comprehension of the information. The current state
of speech recognition technology has limited the use of voice input as an
interface. Managing the large storage requirements for handling voice input is
also a problem. Physically storing a system that can recognize all the language
37

instruction, accents, and other natural speech phenomena has proven to be
difficult. However, natural language systems are currently being developed to
the to handle the speech recognition problem.
Another branch of Al is expert systems (ES). ES can be used within an EIS to
assist the user with appropriate model selection for analyzing a problem. Based
on rules provided to the ES, the ES can instruct the user on which model would
best fit the problem. An ES is similar to an EIS in that they both contain
components that manipulate data. They differ in the way knowledge is
maintained. An EIS uses predefined models and associated algorithms while an
ES operation is based on heuristics.
Integrating Multimedia Characteristics into an EIS
A database component is necessary within an EIS for retrieving, analyzing,
manipulating, and updating files. A multimedia database management system
(MMDBMS) can increase the ability of an EIS to effectively manipulate text,
voice, and images within an integrated database structure. MMDBMS provide
the traditional benefits of a database management system as well as
concatenation of voice, transformation of information, rotation of images, scaling
of objects, and merging of various data types. The problem with these systems,
especially for the executive user, is the complex interface. As the functionality
of these systems continues to increase, more applications for their use will be
developed. Combining more applications with an easy-to-use system will lead to
38
an opportunity to use the systems for a competitive advantage. Future technical
innovations with optical disks as well as speech recognitions systems must occur
for this integration to be able to take place.
Integrating ISDN Technology with an EIS.
Telecommunications play an important role in building many information
systems. This is also true in building an EIS, especially if much of the data is
located off-site. For an executive to be able to quickly access these data, an
effective telecommunications network must be in place. Future trends are also
leading towards data becoming more voice-related. The goal of ISDN is to
provide the same transmission path for speech, data, text and image contents via
one line using standard communication sockets and only one directory number.
This will be an entirely digital system. ISDN will allow the executive to talk to
the computer (on-site) and have output (e.g., stockholder reports) sent to other
users (e.g., board members) for approval. The benefits of voice and non-voice
data being integrated into one network should tremendously expand the
executive's capabilities and at the same time reduce the time and effort to
perform day-to-day activities. Communication standards and vendor support
must also occur for ISDN and EIS capabilities to merge.
In the next subsection the nature of executives' work and how an EIS fits into
their work is described.
39

2.8 The Nature of Executives' Work and How EIS Fit In
The previous sections reviewed the literature on the historical evolution of EIS,
and the benefits and characteristics of EIS. This section reviews the nature of
executives' work and how an EIS fits into the managerial work of executives.
According to Rockart (1979), "there is no position in the organizational
hierarchy that is less understood than that of the executives" (p. 82).
Furthermore, the functions and the way those functions are performed vary
between organizations and between executives within organizations. Indeed, one
of the reasons for EIS failures reported by many researchers is the lack of
understanding of the nature of executives' work by the system designers.
An executive's role in an organization has, however, traditionally been related to
identifying problems and opportunities and making the decision of what to do
about those problems and opportunities. In addition, executives are expected by
their subordinates to play other leadership roles. Much of the executive's work
evolves around: developing agendas, strategies, goals, priorities and plans (that
may not be documented); establishing networks; developing corporate
relationships between people inside and outside their organizations who may play
a role in developing and implementing future agendas (Hoven, 1996).
Weter (1988) indicates that each executive has a unique way of performing then-
jobs and breaks down their work functions as follows:
• Reviewing reports from their subordinates on the activities of many areas of
their organizations;
• Monitoring news of the outside world;
40
• Meeting with managers in their organizations to discuss operations and
strategies;
• Identifying problems and opportunities and formulate plans to capitalize on
them; and
• Leading the people w h o work with them to carry on the goals set by them.
In relation to levels of management and decision making activities, management
activities in an organization fall into the following three categories, based on
Anthony's framework for planning and control (Anthony 1965):
Strategic planning: The process of deciding on objectives for the organization,
changes in these objectives, the resources used to attain these objectives, and the
policies that are to govern the acquisition, use and disposition of these resources.
Tactical (Management) control: The process by which managers assure the
resources are obtained and used effectively and efficiently in the accomplishment
of the organization's objectives.
Operational control: The process of assuring specific tasks are carried out
effectively and efficiently.
Each activity has different information requirements. The operational control
decision levels are based on highly detailed information generated by or available
within the organization. Operational control decisions require a high information
frequency and the information must be recent as well as accurate. Strategic
planning is at the other end of the continuum, relying on summary or aggregated
41

information as well as data from external sources. Both the scope and the variety
of the information are quite large. The information requirements for
management control fall between these two levels.
The overall picture is that, at the strategic level, executives are concerned with
planning and in the other levels they are concerned with controlling those plans.
Perhaps, Mintzberg's (1973) model is the best known characterization of the
activities of executives. He categorizes executive activities into ten distinct roles,
which are divided into three groups of interpersonal roles, informational roles
and decisional roles. All these three groups involve dealing with information or
acting upon information, and an effective executive information system can assist
an executive in all these roles.
Interpersonal Roles
According to Mintzberg, interpersonal roles cover three managerial roles:
1. Figurehead - the executive represents the organization in all matters of
formality, including duties of legal or social nature.
2. Liaison - the executive develops and maintains a personal network of internal
and external contacts that provide information and favors.
3. Leader - the executive motivates subordinates and is responsible for staffing,
training and promoting.
EIS, particularly through Office Automation capabilities such as voice mail,
electronic mail, facsimile, video and audio conferencing, calendaring and
42
scheduling, and other emerging technologies most commonly referred to as
"groupware", are designed to assist the executive in carrying out the activities in
these roles and allow the sharing of information quickly.
Informational Roles
The informational roles of the executive, according to Mintzberg, are:
1. Monitor - the executive receives and collects a wide variety of information in
order to develop a thorough understanding of his or her organization and the
environment. The executive is a key nerve center of external and internal
information about the organization.
2. Disseminator - the executive transmits information received from outsiders
or subordinates to other members of the organization.
3. Spokesman - the executive communicates information to outsiders on the
organization plans, policies, actions, results, and other relevant areas.
EIS capabilities are designed to assist the executive in fulfilling all of these roles.
EIS capabilities are designed to assist the executive to monitor his/her
organization's environment and to enable the construction of a better mental
model of the organization. EIS provide rapid access to timely and accurate
information in a very user-friendly manner. Office Automation capabilities also
provide the facilities for the timely monitoring and the dissemination of
information.
43

Decisional Roles
According to Mintzberg, decision-making roles are "probably the most crucial
part of the manager's work - the part that justifies his/her great authority and
his/her powerful access to information". Mintzberg describes four decisional
roles as:
1. Entrepreneur - the executive searches the organization and the environment
for threats and opportunities and initiates projects to bring about changes.
2. Disturbance Handler - the executive is responsible for corrective action
when the organization is threatened with unexpected disturbances.
3. Resource Allocator - the executive allocates organizational resources of all
kinds (e.g., money, materials, equipment and personnel).
4. Negotiator - the executive represents his or her organization in major
negotiations with other organizations and individuals.
EIS are designed with the capabilities to assist the executive to quickly search
and scan the organization's environment for any threats and opportunities
enabling prompt and appropriate decisions. They are designed as tools to support
and improve the decision-making process of the executive by providing the basic
usable and relevant information from both internal and external environments of
the organization. In addition, because executives devote significant amounts of
time to acquiring and analyzing information through their interactions with
people and processing of documents, EIS are designed to save considerable
amounts of time by facilitating the collection, storage, retrieval, and analysis of
information. The "what-if' analysis capabilities of an EIS combined with the
decision maker's imagination and judgment is designed to help the executive to
arrive at decisions quickly and accurately.
44
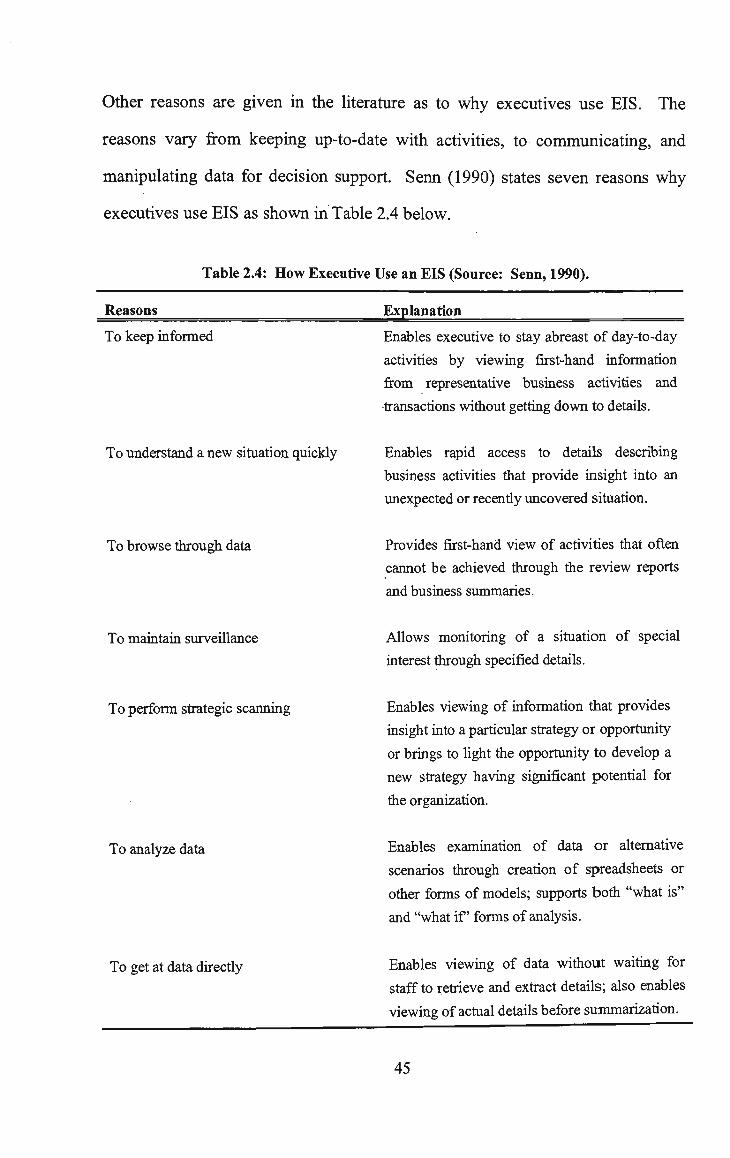
Other reasons are given in the literature as to why executives use EIS. The
reasons vary from keeping up-to-date with activities, to communicating, and
manipulating data for decision support. Senn (1990) states seven reasons why
executives use EIS as shown in Table 2.4 below.
Reasons
Table 2.4: H o w Executive Use an EIS (Source: Senn, 1990).
Explanation
To keep informed Enables executive to stay abreast of day-to-day
activities by viewing first-hand information
from representative business activities and
transactions without getting down to details.
To understand a new situation quickly Enables rapid access to details describing
business activities that provide insight into an
unexpected or recently uncovered situation.
To browse through data Provides first-hand view of activities that often
cannot be achieved through the review reports
and business summaries.
To maintain surveillance Allows monitoring of a situation of special
interest through specified details.
To perform strategic scanning Enables viewing of information that provides
insight into a particular strategy or opportunity
or brings to light the opportunity to develop a
new strategy having significant potential for
the organization.
To analyze data Enables examination of data or alternative
scenarios through creation of spreadsheets or
other forms of models; supports both "what is"
and "what if forms of analysis.
To get at data directly Enables viewing of data without waiting for
staff to retrieve and extract details; also enables
viewing of actual details before summarization.
45

Watson, Rainer and K o h (1992) give further reasons w h y executives use EIS as:
• EIS provides data analysis and graphical presentation functions, allowing
executives to make critical decisions quickly, using reliable, accurate, timely
and relevant information;
• With EIS, executives can share information with others more quickly and
easily;
• Executives can select information to tell them where, when, and towards what
their attention should be directed and help them formulate and define
organizational problems; and
• Depending on functionality and preference, EIS may be used for performance
monitoring, "what-if' analysis, trend spotting, problem identification and
resolution, and generally keeping up to date. All of these can improve and
increase the efficiency and effectiveness of the executive decision making
process by:
* providing improved ways of viewing and solving a problem;
* providing easy access to relevant and accurate information in a timely
manner and increasing the executives productivity;
* facilitating wider coverage of possible information sources;
* providing all critical information to the executive to help see the effect
of certain decisions on the organization; and
* providing faster turnaround on decision opportunities.
46

Having reviewed the nature of executives' work and how EIS fit into the
managerial work of executives, the next section critically examines previous
research studies on EIS usage. The deficiencies found in these previous studies
have motivated the study undertaken and presented in this thesis.
2.9 Previous Research Studies On EIS Usage
There are several factors that contribute to EIS failures: some technical, others
managerial and organizational (Watson, Houdeshel and Rainer, 1997). Some of
these failures may also result from the failure of the intended users, the
executives, to use the systems for one reason or the other. Some users may
initially support and accept the systems but reject them later as a result of several
factors: some of which may be behavior-related.
Early EIS research efforts consisted of descriptions of current implementations in
organizations (Applegate, 1987, 1988; Rockart and DeLong, 1988; Osborn and
Applegate, 1989); studies of why EIS were adopted (Watson, et al., 1991);
studies on benefits of the use of EIS (Bergeron, Raymond and Lagorge, 1991;
Watson, et al., 1991); and studies on design approaches (Carisson and Widmeyer,
1990; Mannheim, 1989; Walls, et al., 1992; Westland and Walls, 1991). Much
of these prior research efforts focused on EIS from the systems' or the users'
perspective.
47
As failures of EIS began to emerge, some research efforts were directed at
isolating factors contributing to these failures. Three categories of factors
relating to EIS failures have been identified: technology-related factors, support-
related factors, and user-related factors (Young and Watson, 1995).
The focus of these prior EIS research studies can be classified broadly into two
groups. One group of studies focuses on EIS development and implementation
while the other group focuses on EIS usage as shown in Table 2.5. The research
studies on the development and implementation side are more thorough and
extensive and form the bulk of the EIS research literature.
The research studies on EIS usage are relatively few and mixed, with only a very
small number addressing the actual use of the systems. Of this small number,
only very few use appropriate reference theories to address system usage. The
focus of these usage research studies seems to be in line with the four
frameworks suggested by Carisson and Widmeyer (1990) for researching EIS
usage based on executives management activities. They are: 1) EIS as a
decision making or problem solving tool; 2) EIS as a scanning and searching
tool; 3) EIS as an internal monitoring tool; and 4) EIS as a communication tool.
There is an almost complete absence of research studies into the actual use of
EIS. The managerial activities in Carisson and Widmeyer's frameworks can only
be realized if the executives are the real users of EIS.
48
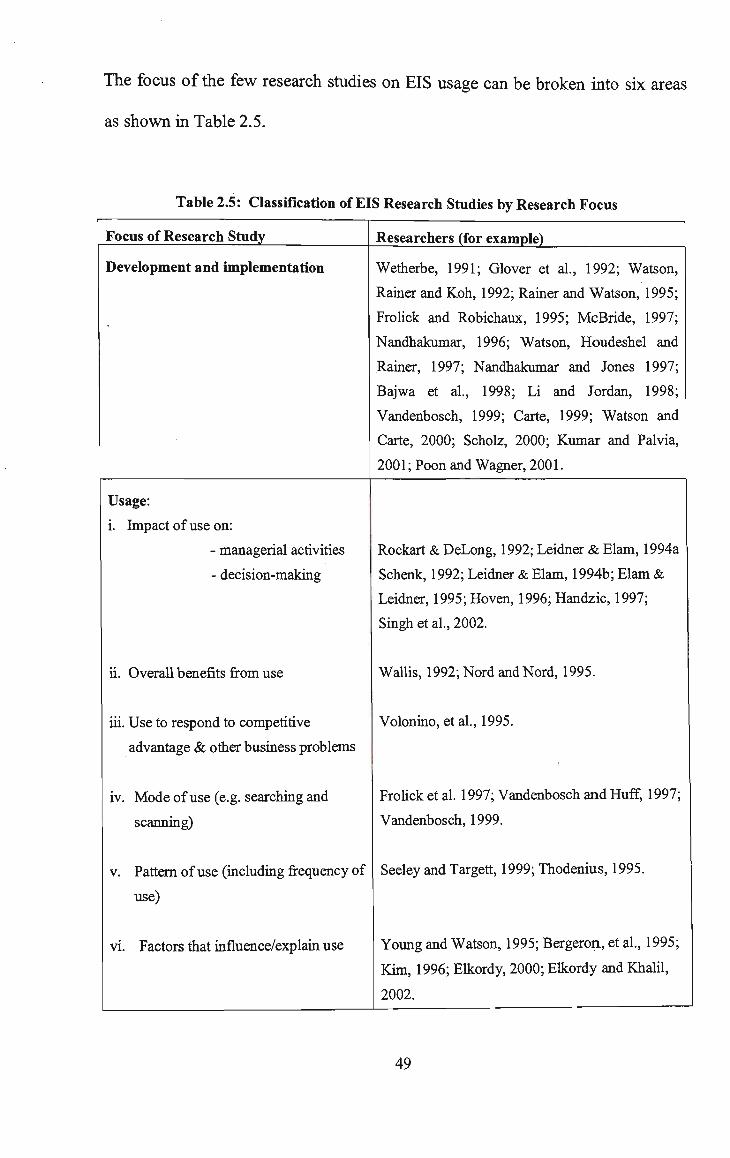
The focus of the few research studies on EIS usage can be broken into six areas
as shown in Table 2.5.
Table 2.5: Classification of EIS Research Studies by Research Focus
Focus of Research Study
Development and implementation
Usage:
i. Impact of use on:
- managerial activities
- decision-making
ii. Overall benefits from use
iii. Use to respond to competitive
advantage & other business problems
iv. Mode of use (e.g. searching and
scanning)
v. Pattern of use (including frequency of
use)
vi. Factors that influence/explain use
Researchers (for example)
Wetherbe, 1991; Glover et al., 1992; Watson,
Rainer and Koh, 1992; Rainer and Watson, 1995;
Frolick and Robichaux, 1995; McBride, 1997;
Nandhakumar, 1996; Watson, Houdeshel and
Rainer, 1997; Nandhakumar and Jones 1997;
Bajwa et al., 1998; Li and Jordan, 1998;
Vandenbosch, 1999; Carte, 1999; Watson and
Carte, 2000; Scholz, 2000; Kumar and Palvia,
2001; Poon and Wagner, 2001.
Rockart & DeLong, 1992; Leidner & Elam, 1994a
Schenk, 1992; Leidner & Elam, 1994b; Elam &
Leidner, 1995; Hoven, 1996; Handzic, 1997;
Singh et al., 2002.
Wallis, 1992; Nord and Nord, 1995.
Volonino, etal., 1995.
Frolick et al. 1997; Vandenbosch and Huff, 1997;
Vandenbosch, 1999.
Seeley and Targett, 1999; Thodenius, 1995.
Young and Watson, 1995; Bergeron, et al., 1995;
Kim, 1996; Elkordy, 2000; Elkordy and Khalil,
2002.
49

Out of the six research focus areas on EIS usage presented in Table 2.5, it is only
the sixth focus area (Factors that influence/explain EIS use) that deals with actual
engagement of the systems. Without actual engagement of these systems the
outcomes of the other five usage areas cannot be realized. However, the research
studies on actual engagement are quite few, and of the few only a small number
used appropriate reference theories to address system use as a behavior (e.g.,
Bergeron, et al., 1995; Kim, 1996; Elkordy, 2000; Elkordy and Khalil, 2002).
As can be seen from Table 2.5, some of the research studies on EIS usage
consider the impact of using the systems on managerial activities in general and
decision-making processes in particular (e.g., Rockart and DeLong, 1992; Singh
et al., 2002). Others are looking at the overall benefits such as, increase in profit,
better communication, increased confidence in decision-making, access to
unavailable information, and reduction in staff and clerical personnel from using
the systems (e.g., Nord and Nord, 1995). Some studies consider the use of the
systems to respond to major business problems that are being intensified by
global recessionary and competitive forces such as adaptability to customer
requirements, quality improvement and cost-containment (e.g., Volonino et al.,
1995). Other studies examine the mode of use of the systems, such as searching
and scanning, and improving the executive's mental model of their organization
(e.g., Vandenbosch, 1999). Some studies consider the patterns of EIS use by
executives (e.g., Seeley and Targett, 1999) while other studies are simply seeking
answers as to how frequently EIS are used by executives (e.g., Thodenius, 1995).
50

A s mentioned previously, it is only the sixth focus area in Table 2.5 that deals
directly with the actual use of the systems. Since system use is a behavior (Trice
and Treacy, 1988) we need appropriate reference theories in order to be able to
study it thoroughly. We address the issues related to appropriate reference
theories in Chapter 3 but at this stage, based on the surveyed literature, we
present the research problem and the two research questions for this study.
The research problem that this study seeks to provide solutions to is: the failure
of executive information systems in organizations due to the underutilization
or non-usage of these systems, and the two main research questions for the study
are:
1. What are the important social, cultural, political and organizational factors
that explain the behavior of executives in using executive information
systems in organizational settings?
2. What is the relative importance of these factors in determining executive
information systems use by executives in organizational settings?
2.10 Conclusion
This chapter reviewed the relevant literature for this study and presented the
research issues arising from the literature review. The historical reviews of the
evolution of EIS and the popularity of EIS have also been presented in this
chapter. Various definitions of EIS have been presented to highlight the complex
nature of these systems, and the simple definition to be used in this study has
51
been presented. The benefits and characteristics of EIS, some models of EIS, and
the future trends in EIS have also been examined and presented. Also, the nature
of executives' work and how EIS fit into their work have been evaluated.
Finally, a critical examination and evaluation of previous research studies on EIS
usage has been presented.
One conclusion that can be drawn from the review of the previous research
studies on EIS is that there is a marked lack of research studies on EIS usage that
examine the factors that influence/explain system usage. System usage as a
behavior has not been well represented with appropriate reference theories in the
few studies that have been done on EIS usage. This deficiency has motivated the
study undertaken and presented in this thesis.
Chapter 3 presents Triandis' Theoretical Framework upon which this study is
based. The research model and the hypotheses to be tested in this study are also
presented in Chapter 3.
52

CHAPTER 3 THEORETICAL FRAMEWORK, RESEARCH
MODEL AND HYPOTHESES
3.1 Introduction
Chapter 2 reviewed the relevant literature for this study and presented the
research issues resulting from the literature review. This chapter presents, first,
the theoretical perspectives in IS research studies and then Triandis' Theoretical
Framework upon which this study is based. The research model, based on the
theoretical framework for this study is presented next, followed by the
hypotheses to be tested. In the conclusion to this chapter w e summarize the key
constructs, the strengths and weaknesses of the theoretical framework.
3.2 Theoretical Perspectives in IS Research Studies
Prior IS researchers (e.g., Goodhue, 1988; Straub, 1989) criticized IS research for
lack of theoretical bases and insufficient attention to methodological and
measurement issues when IS researchers study individual's reaction to
information technology. IS researchers generally did not draw on other
disciplines for their work and some IS researchers have argued that these
shortcomings m a y explain the conflicting results that have been obtained
(Goodhue, 1988; Swanson, 1982).
As a result of these criticisms a variety of theoretical perspectives are used by IS
researchers in studying the individual's reactions to computing technology.
Some of the theoretical frameworks used in those studies include: the
53
Technology Acceptance Model (TAM), which is an adaptation of Fishbein and
Ajzen's Theory of Reasoned Action (TRA); the Theory of Planned Behavior
(TPB); the Social Cognitive Theory (SCT); and Innovations Diffusion. The body
of research based on these theoretical frameworks has produced some useful
insights into the cognitive, affective and behavioral reactions of individuals to
technology, and into the factors that influence these reactions.
However, as Compeau et al. (1999) noted, in each of the above theoretical
frameworks, behavior (e.g., the use of computers) is viewed as the result of a set
of beliefs about technology and a set of affective responses to the behavior. The
beliefs are represented by the perceived characteristics of innovating in
Innovation Diffusion research, by perceived usefulness and perceived ease of use
in the Technology Acceptance Model, by behavioral beliefs and outcome
evaluations in the Theory of Planned Behavior, and by outcome expectations in
the Social Cognitive Theory. Seddon (1997) refers to these as the net benefits
(realized or expected) accruing from the use of a system. Affective responses are
typically measured by attitudes towards use - an individual's evaluation of the
behavior as either positive or negative. The commonalities in these models
reflect a belief in the cognitive basis of behavior.
Compeau et al. (1999) also suggest that, while TAM and the Diffusion of
Innovations perspectives focus almost exclusively on beliefs about a technology
and the outcomes of using the technology, SCT and the TPB include other beliefs
which are independent of perceived outcomes and might influence behavior. The
TPB model incorporates the notion of Perceived Behavioral Control (PBC) as an
54
independent influence on behavior, recognizing that there are circumstances in
which a behavior might be expected to result in positive consequences (or net
benefits), yet not be undertaken due to a perceived lack of ability to control the
execution of the behavior. PBC encompasses perceptions of resource and
technology facilitating conditions, similar to those measured by Thompson, et al.
(1991, 1994), as well as perceptions of ability or self-efficacy (Taylor and Todd,
1995).
The results from the research based on the above theoretical frameworks provide
useful insights into the individual's reaction to computing technology. However,
none of the above theoretical frameworks addresses explicitly the social, cultural,
political and organizational factors which may influence and/or explain the user's
behavior in using an information system.
Earlier studies (Trice and Treacy, 1988) asserted that system use is a behavior
whose determinants are not well understood in IS research and that system use
could best be explained by referring to an appropriate reference theory. This
assertion has guided some system use studies (e.g., Trice and Treacy, 1988;
Davis et al., 1989; Young and Watson, 1995; Kim, 1996; Venkatesh, 1999;
Venkatesh and Morris, 2000). A number of IS researchers (e.g., Trice and
Treacy, 1988; Davis, 1989; Davis, et al., 1989; Venkatesh & Davis, 1996; Kim,
1996; Elkordy, 2000; Venkatesh, 1999; Venkatesh and Morris, 2000; Elkordy
and Khalil, 2002) relied on Fishbein and Ajzen's Theory of Reasoned Action in
their attempts to explain user behaviors. While TRA is very useful, it is
somewhat incomplete. TRA has been tested widely in sociological and
55
psychological research and has been found to be lacking in certain respects
(Thompson et al., 1991, 1994). For example, TRA leaves aside factors that could
also have influence on behavioral intentions and on behavior itself.
Some other researchers (Thompson et al, 1991, 1994; Bergeron et al., 1995)
sought to explain personal computer usage and information systems use by
grounding their research models on a similar, but richer, theoretical framework
developed by Triandis (1971, 1980), which explicitly addresses the social,
cultural, political and organizational factors that may influence and/or explain the
user's behavior in a theoretical framework. In addition to addressing social,
cultural, political and organizational factors, the theory proposed by Triandis
(1971, 1980) incorporates many of the same concepts and constructs as TRA but
also modifies and redefines them. For example, while Fishbein and Ajzen's
theory considers all beliefs that a person has about an act or behavior, Triandis
makes a distinction between beliefs that link emotions to the act (occurring at the
moment of action) and beliefs that link the act to future consequences.
This research study employs Triandis' Framework as a theoretical foundation and
the research model for this study is adapted from this theoretical framework. The
research model incorporates the social, cultural and organizational factors that
explain the behavior of executives in using EIS. The model is used to test
empirically the hypothesized relationships among the factors. A further analysis
is done to determine the relative importance of the independent variables in
explaining EIS use by executives. In the following section, Triandis' Theoretical
Framework and its concepts and constructs are presented.
56
3.3 Triandis'Theoretical F r a m e w o r k
Triandis' Theoretical Framework is a model from social psychology and
organizational behavior. In an attempt to encompass a larger number of relevant
variables, Triandis proposed a theoretical network of interrelated hypotheses
around the constructs of attitude and behavior, placing them in the broadest
possible context. The major constructs of the theoretical framework and the
relations among them leading to their influence/explanation of the behavior of an
individual are shown in Figure 3.1. The theoretical grounding for this present
study is based on Triandis' (1971,1980) work.
3.3.1 Concepts Underlying Triandis' Theoretical Framework
The concepts and constructs of Triandis' (1980) Theoretical Framework are
diagrammatically depicted in Figure 3.1.
Triandis (1980) argues that behavior has "objective consequences, (that occur
'out there' in the real world) which are interpreted (occur inside the person)" (p.
198). H e argues that as a result of these interpretations, the person feels
reinforced Reinforcement, Triandis argues, "affects the perceived consequences
of the behavior in two ways: it changes the perceived probabilities that the
behavior will have particular consequences and it changes the value of these
consequences" (p. 198). These probabilities and values, in rum, constitute one of
the determinants of behavioral intentions to behave, which are one of the
determinants of behavior.
57
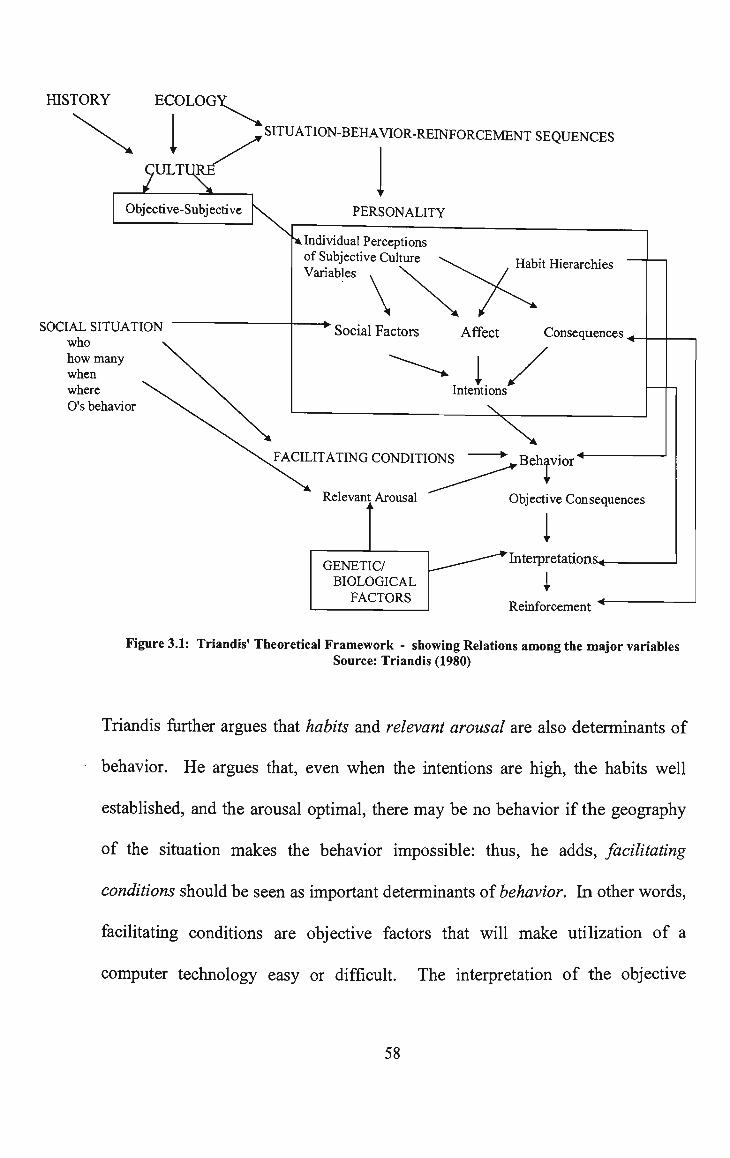
HISTORY ECOLOG
1 ULT Objective-Subjective
SOCIAL SITUATION who how many when where O's behavior
SITUATION-BEHAVIOR-REINFORCEMENT SEQUENCES
PERSONALITY
..Individual Perceptions of Subjective Culture Variables
\
Habit Hierarchies
Social Factors Affect Consequences +.
Intentions
FACILITATING CONDITIONS
Relevant Arousal
GENETIC/ BIOLOGICAL
FACTORS
"*» Behavior *
Objective Consequences
I 'Interpretations^
I Reinforcement "*
Figure 3.1: Triandis' Theoretical Framework - showing Relations among the major variables Source: Triandis (1980)
Triandis further argues that habits and relevant arousal are also determinants of
behavior. He argues that, even when the intentions are high, the habits well
established, and the arousal optimal, there may be no behavior if the geography
of the situation makes the behavior impossible: thus, he adds, facilitating
conditions should be seen as important determinants of behavior. In other words,
facilitating conditions are objective factors that will make utilization of a
computer technology easy or difficult. The interpretation of the objective
58
consequences, Triandis argues, m a y differ because of genetic/biological
influences or because of the previous situation-behavior-reinforcement
sequences that the individual has encountered in his/her history, that is, the
individual's personality. Personality, Triandis argues, internalizes culture's way
of perceiving the social environment, called the subjective culture of a group.
According to Triandis, subjective culture consists of norms (self-instructions to
do what is perceived to be correct and appropriate by members of a culture in
certain situations); roles (which are concerned with behaviors that are considered
correct but related to persons holding a particular position in a group, society, or
social system); and values (the broad tendencies to prefer certain states of affairs
over others, that is, what makes a group or a category of people distinguish
between, for example, good and evil; clean and dirty; beautiful and ugly; natural
and unnatural; normal and abnormal; logical and paradoxical; and rational and
irrational). These internalizations, according to Triandis, correspond with, but
are not identical to, the group's subjective culture, and form the social factors that
influence the intention to behave. In addition, Triandis argues, previous
experiences of the individual with particular behaviors result in affect towards the
behavior, which in torn are among the determinants of intentions. Triandis adds
that, personality is an outcome of situation-behavior-reinforcement sequences
and the subjective culture to which the individual is exposed. This subjective
culture, Triandis explains, reflects the human-made part of the environment,
which is shaped by historical and ecological forces. In turn, personality has an
59

impact on the way people will interpret the objective consequences of the
behavior.
Triandis argues that any behavior occurs in a particular social situation, which
influences the facilitating conditions and the relevant arousal of the person while
simultaneously activating specific levels of the social factors. For interpersonal
behavior, the social situation includes particular individuals, in a behavior
setting, as well the other's previous behavior.
Triandis notes that the arrows in the model in Figure 3.1 show the directions of
probable causalities, although he admits that there are several bi-directional
relationships that are not shown in order to keep the diagram simple.
3.3.2 Definitions of Constructs in the Framework
Triandis (1980) defines habits on one hand as "situation-behavior sequences that
are or have become automatic, so that they occur without self-instruction" (p.
204). According to Triandis, habits are what people usually do and the
individual is usually not conscious of the sequences, for example, driving a car.
They are closely related to an individual's past experience and ability to perform
a given act. His model suggests that the habitual nature of a behavior, in addition
to intentions, will have an influence on the individual's response to a given
situation. Triandis argues that habits are more important than intentions for
many behaviors. Thompson et al. (1991,1994) ignored habits in their studies but
60

acknowledged that habits are clearly an important determinant of behavior and
suggested their inclusion in further studies.
Triandis (1980), on the other hand, defines behavior as "a broad class of
reactions by an organism to any stimuli (internal or external to the organism)
[which] includes acts" (p. 201). Acts he defines as "socially defined partem of
muscle movements" (p. 201). He gave an example of the specific act of hitting
someone. Such acts he said have no meaning in themselves but acquire meaning
from the social context, particularly the perceived causes of the acts. "For
instance, 'to hit' is very different if it is done accidentally, as a joke, to 'correct' a
naughty child, or with the intention to hurt" (p. 201). According to the
framework, behavior consists of the frequency, duration and/or intensity of the
reactions by an organism to stimuli. This view is shared by Homans (1974) who
proposed "frequency" as one of the measures of behavior. Triandis (1980)
defines behavioral intentions, which trigger behavior, as "instructions that people
give to themselves to behave in certain ways" (p. 203). They involve ideas such
as "I must do X", "I will do X", and "I am going to do X" and are influenced by
social factors, affect, and the behavior's consequences (p. 203).
The clear distinction that can be drawn between habits and behaviors from
Triandis' Theoretical Framework is that, whereas habits are automatic and
occurring in the individual without self-instruction and with the individual
usually not conscious of the reactions, behaviors are not. It can be deduced from
61

the framework that habits are behaviors that have become automatic and
acquired through the individual's past experience and ability to perform an act.
In other words, habits lead to continued use of a technology without a conscious
decision to do so.
Relevant arousal is a physiological factor. Triandis (1980) states: "the
physiological arousal of the organism that is relevant to the act facilitates the act,
and increases its probability" (p. 205). The model suggests that relevant arousal
directly influences behavior and is influenced by genetic and biological factors,
as well as by the social situation, that is, the behavior setting.
According to Triandis, it may happen that an individual has the intention to do
something, but is unable to do it because the environment prevents the act from
being performed. Consequently, the level of facilitating conditions is an
important factor in explaining an individual's behavior, and must be taken into
account. In turn, facilitating conditions are dependent on the social situation.
Triandis (1971) argues that behavior is influenced by social norms, which depend
on messages received from others and reflect what individuals think they should
do. In his later work, Triandis (1980) expands the term social norms and called it
social factors which he describes as "the individual's internalization of the
reference group's subjective culture, and specific interpersonal agreements that
the individual has made with others, in specific social situations" (p. 210). Thus,
62
in addition to influencing intentions, social factors are themselves dependent on
the social situation, and on the individual's perception of subjective culture
variables.
According to Triandis, affect refers to an individual's "feelings of joy, elation, or
pleasure, or depression, disgust, displeasure, or hate associated by the individual
with a particular act" (p. 211). Positive feelings will increase the intention
toward a given behavior, while negative feelings will decrease them. Affect is
influenced by the individual's habits and by his/her perceptions of subjective
culture variables.
Triandis considers the consequences factor as a function of the perceived
consequence of the behavior and the value of each consequence. Perceived
consequences, what Davis (1989) called perceived usefulness in TAM, refers to
the probability that a given consequence will follow from performing a behavior.
According to Triandis (1980), the value of the consequence is the "affect attached
to the consequence" (p. 203). The model hypothesized that the higher the
expected value of a behavior, the more likely the person will intend to perform
the behavior. Consequences are influenced by an individual's perception of
subjective culture variables as they are by social factors and affect variables.
According to the model, consequences, in addition to influencing behavior
through intentions, are also influenced by behavior. That is, the individual
interprets the objective consequences of a behavior, and as a result of these
interpretations, the person feels reinforced.
63

3.3.3 Past Research using Triandis' F r a m e w o r k
Triandis' (1980) theory has been well accepted within the psychological
literature, but has been used very little within the IS context. There are very few
research studies in the IS literature which used Triandis' Framework as a
theoretical foundation. The reason for this lack of use of the framework as a
theoretical foundation is two fold. One, there are very few IS research studies
focusing on the use of the IS technology as a behavior, and two, the few that did,
were applying theoretical foundations that are incomplete for such studies. For
example, the theoretical foundations used leave aside factors that also could have
an influence on behavioral intensions and on behavior itself. The theoretical
foundations used in those studies also do not address explicitly the social,
cultural, political and organizational factors that may influence/explain user
behavior towards the use of technology. The only IS studies found explicitly
using Triandis' Framework as a theoretical foundation are those by Thompson et
al., (1991, 1994) and Bergeron et al., (1995).
While Thompson et al.'s studies sought to have better understanding of the
factors that influence the use of PCs, Bergeron et al.'s study sought to better
understand the factors that explain the behavior of EIS users towards the use of
EIS. Both studies advocate the use of Triandis' Framework as a theoretical
foundation in understanding and explaining user's behavior towards technology
use because of the framework's comprehensiveness and appropriateness for such
studies.
64

3.4 Research Model and Hypotheses
In the preceding sections, Triandis' Theoretical Framework, the concepts and
constructs underlying the framework, and some past research based on the
framework have been presented. The following two subsections present the
research model for the present study, which is based on the Triandis' Theoretical
Framework, and identify the hypotheses to be tested in this study.
3.4.1 Research Model
Bergeron et al. (1995), who based their research model on Triandis' Theoretical
Framework, suggested in their conclusion that "future investigations should aim
for a cumulative tradition by continuing to employ Triandis' Framework as a
theoretical foundation to further understand the phenomenon of EIS use" (p.
142). In line with this suggestion, the research model for this study has been
developed using Triandis' Framework as a theoretical foundation.
As the description of the model shows, Triandis' Framework is not only very
complete, but it also very complex. It is therefore appropriate to focus on the
subset of the model that includes variables that are most relevant to
understanding and explaining the utilization of EIS. The research model adopted
from the framework is depicted in Figure 3.2, and it is similar to that used by
Bergeron et al. in 1995 in a study on EIS use.
65
The similarity in this research model and that of Bergeron et al. is the constructs
addressed by model. The constructs are the same in each model. The difference
between this research model and that of Bergeron et al. is in the variables and
sub-variables addressed by the model. There are more variables and sub-
variables in this research model than in that of Bergeron et al. Some of the
variables and sub-variables were included in this research model following the
suggestions made by Bergeron et al. for further studies in the field when using
Triandis' Framework. Others variables and sub-variables were included
following from other studies and the objectives of this study.
The variables for social factors construct in this study are subjective norms,
subjective roles, subjective values and social situations. By including the social
factors construct in the research model, the individual's perceptions of subjective
culture in using EIS could be measured, as well as the social situations' effect on
EIS use. The variables for the affect construct in this study consist of
satisfaction with EIS information, satisfaction with EIS system, satisfaction with
EIS support, and satisfaction with EIS development plans. The variables for the
facilitating conditions construct are EIS development processes, EIS
management processes, and organizational environment. Consistent with the
Triandis' Framework, the variable for the consequences construct is perceived
usefulness (consequences) of EIS use. The variables for the behavior construct
for this study are frequency of EIS use and internalization of EIS use, similar to
66

Bergeron et al.'s (1995) study. The reasons for including these constructs and
variables in the research model are further explained in the next section.
HABITS
1. EIS Experience 2. Ability to use EIS
H3 a>,c,d H4Ab,c,d
SOCIAL FACTORS A P F E C T
1. Subjective norms
2. Subjective roles
3. Subjective values
4. Social situations
1. Satisfaction with information
2. Satisfaction with EIS features
3. Satisfaction with EIS support
4. Satisfaction with EIS plans
FACILITATING CONDITIONS
1. EIS development processes
2. EIS management processes
3. Organizational environment
H5 H6 H7 H8
H14 a,b H15a,b H16a,b
a,b a,b a,b a,b
BEHAVIOR
1. Frequency of EIS use
2. Internalization of EIS use
Figure 3.2: Research Model for EIS use
The variables in the research model have been classified into social,
organizational, political and cultural factors. This classification is made by
taking into account the definitions and concepts of the variables and the survey
questionnaire for this study.
67

Table 3.1 below shows the classification. In classifying the variables, some
variables by definition and concept overlap some of the factors. For example,
norms and roles are social factors while at the same time are part of an
organizational culture. EIS development processes, EIS management processes,
and organizational environment (facilitating conditions) are organizational
factors while at the same time involved the power and politics within an
organization. Because of this potential problem of variables overlapping the
social, organizational, political and cultural factors, the constructs in the research
model are used in the analysis. It is however important to point out that, these
factors need to be taken into account in discussing the findings and implications
of this study.
Table 3.1: Classification of Research Variables into Social, Organizational, Political and
Cultural Factors
Social Factors
Norms
Roles
Values
Social situations
Position*
Organizational Factors
CBIS experience*
EIS experience
Ability to use EIS
EIS development processes
EIS management processes
Organizational environment
Information satisfaction
EIS features satisfaction
EIS support satisfaction
EIS plan satisfaction
Perceived usefulness
Position*
Political Factors
EIS development processes
EIS management processes
Organizational environment
Position*
(Organizational) Cultural Factors
Norms
Roles
Values
* Included in the revised Research Model
68

The measurement of the variables in the research model is based on Triandis
(1980) suggested operationalizations of constructs defined in his framework in
addition to other relevant studies (e.g. Bergeron et al., 1995; Thompson et al.,
1991, 1994).
Habits are operationalized by assessing the number of years of an executive's
experience in using EIS and his/her ability to use the systems. Consequences are
operationalized by assessing executive's perceived consequences (usefulness) of
using EIS in his/her work and assessing the impact of using EIS on his/her
performance. Social factors are operationalized by measuring the subjective
norms, roles and values and the social situations in which the executive uses EIS.
Affect is operationalized by measuring the executive's satisfaction with the
information provided by EIS, with EIS itself, with the support provided in using
the system, and with the system development plans now and into the future.
Facilitating conditions are operationalized by measuring the influences that the
EIS development processes, the EIS management processes and the
organizational environment have on the executive's behavior in using EIS.
Finally, Behavior is operationalized by measuring the frequency and the
internalization of EIS use. Detail operationalization of the constructs is described
in the following section.
69

3.4.2 Research Hypotheses
In this subsection the hypotheses to be tested in this study are presented. The
hypotheses to be tested are embedded in the research model. In addition,
previous studies have been used in formulating the hypotheses.
3.4.2.1 Habits and Behavior
According to Triandis' Framework, habits make a major contribution to the
explanation of behavior. This is supported by a previous study (Sugar, 1967),
which shows that habits are a strong predictor of behavior. Sugar measured the
attitudes, norms and habits of college students concerning cigarette smoking. On
a separate occasion, the same students were offered a cigarette. The strongest
single predictor of behavior was found to be habit, followed by norms and
attitudes. According to Triandis, habits are closely related to an individual's past
experience and ability to perform a given act. In his earlier work in 1972 (in
association with Vassiliou, Vassiliou, Tanaka, and Shanmugam and with the
assistance of Davis, Kilty, McGuire, Saral & Yang) Triandis also acknowledged
experiences as habits.
Previous IS studies also identified computer experience as a determinant of user
attitude towards information technology (e.g., Fazio and Zanna, 1981; Fuerst and
Cheney, 1982; Arndt et al., 1983; Howard, 1986; DeLone, 1988; Rivard & Huff,
1988; Yaverbaum, 1988; Davis et al., 1989; Levin and Gordon, 1989; Thompson
et al., 1991, 1994; Jackson et al., 1997; Al-Gahtani and King, 1999). Successful
70

experience with an information technology may usually reduce or eliminate any
fears and improve a person's perceptions and attitudes towards using
technologies. Rivard and Huff (1988), for example, found that heterogeneity of
users' computer experience was a significant variable in explaining why some
viewed a tool as easy to use while others perceived the same tool as difficult to
use, while Yaverbaum (1988) reported an increase in the internal motivation to
use computers as the number of years of computing experience grew.
In a study of the effect of computer experience on attitudes towards computers,
Loyd et al. (1987) also found that increased computer experience reduced anxiety
and augmented positive perceptions and attitudes. A similar conclusion was
drawn by Arndt et al. (1983) and Howard (1986) who found significant negative
correlation between experience and anxiety. Levin and Gordon (1989) also
reported that subjects with computer experience were more motivated to become
familiar with computers, were more impressed by the computer's capabilities,
and had more favorable perceptions and attitudes towards computers than did
subjects without computer experience.
In a study of critical success factors for computer usage in small business,
DeLone (1988) found that chief executives' knowledge of computers resulted in
IS success, while Fazio and Zanna (1981), in a study of direct experience and
attitude-behavior consistency, found that attitude resulting from direct experience
was a strong predictor of behavior. Recently, Thompson et al. (1994) conducted
71

a study, based on Triandis' Framework, which investigated the influence of prior
experience on personal computer utilization and contended that the relationship
between experience and behavior (IT usage) is not straightforward. They
suggested three different possibilities in which such a relation could exit: 1)
experience exerts a direct influence on behavior; 2) experience exerts an indirect
influence on behavior through intervening variables such as perception and
attitude; and 3) experience moderates the effect of antecedent factors on
intentions and behavior. By testing the above mentioned relationships they found
that: experience influenced utilization directly; indirect effects of experience on
utilization were weakly present; and the moderating effect of experience on
perception and attitude, and utilization was quite strong.
According to Triandis' Framework, habits lead to the derivation of some
satisfaction or dissatisfaction (affect), which in turn explains behavior, while
habits themselves directly explain behavior. The framework asserts that the
frequency of doing or using something constitutes a behavior. The framework
further asserts that the internalization of the probabilities and values of an act
constitutes one of the determinants of behavioral intentions to behave. Thus, the
frequency of doing or using something and the internalization of an act are
determinants of behavior.
Individuals will undertake a behavior if they are convinced they have the ability
to successfully perform such a behavior. Bandura and his colleagues (Bandura,
1977, 1982, 1986; Bandura et al., 1977; Bandura and Schunk, 1981) showed that
72
personal ability has a positive impact on the formation of perceptions and
attitudes. Compeau and Higgins (1995) also emphasized that ability influences
decisions about what behaviors to undertake, the effort and persistence exerted in
the face of difficulties to perform those behaviors, and the attitudes of the
individual performing the behaviors. K i m (1996) further showed that the higher
the level of executives' computer ability the higher their perceived usefulness of
an EIS and the effect of computer ability on EIS utilization would be mediated by
perceived ease of use and perceived usefulness. Recently, Elkordy (2000) and
Elkordy and Khalil's (2002) studies also showed that the higher the level
executives' ability to use EIS the higher the influence on executives' perceived
ease of use of these systems.
Following from the findings on the individual's experience and ability in relation
to information technology presented above, it is hypothesized that:
HI: EIS experience correlates positively with:
a. frequency of EIS use, and
b. internalization of EIS use.
H2: Ability to use EIS correlates positively with:
a. frequency of EIS use, and
b. internalization of EIS use.
3.4.2.2 Habits, Affect and Behavior
Previous research studies indicate that executives who have been using computer
systems for a greater length of time were seen to have better attitudes in terms of
73

user comprehension and participation (Raymond, 1988). Similarly, Sanders and
Courtney (1985) found the length of DSS use to be positively related to user
satisfaction.
Swanson (1974) defines user satisfaction as a set of user beliefs about the relative
value of an information system in terms of providing timely, accurate and easy-
to-understand information to support his/her decision making. This definition,
however, focuses on only one component of user satisfaction, that is, information
satisfaction. Previous studies show that user satisfaction correlates with the
quality of information provided by a system, as well as with the features of the
system and with the support provided by the support group of information
systems. Tafti (1992) synthesized the research in this area into information
satisfaction, system satisfaction, and support group satisfaction. Each of these
consists of unique attributes, which correlate with user satisfaction of information
systems. Previous studies (Amoako-Gyampah and White, 1993) also show that
system development plans correlate with user satisfaction of information
systems. Thompson et al. (1994) who based their study on Triandis' Framework
also found a correlation between technical support and PC use. Bergeron et al.
(1995) who also based their study on Triandis' Framework found correlations
between satisfaction with: EIS technical support and EIS experience; EIS
technical support and internalization of EIS use; EIS information and frequency
of EIS use; EIS information and internalization of EIS use; EIS features and
internalization of EIS use.
74

Consequently, it is hypothesized that:
H3: The longer the experience with EIS, the higher the satisfaction with:
a. EIS information attributes,
b. EIS features,
c. EIS support services, and
d. EIS development plans.
H4: The more the ability to use EIS, the higher the satisfaction with:
a. EIS information attributes,
b. EIS features,
c. EIS support services, and
d. EIS development plans.
H5: Satisfaction with EIS information attributes correlates positively
with:
a. frequency of EIS use, and
b. internalization of EIS use.
H6: Satisfaction with EIS features correlates positively with:
a. frequency of EIS use, and
b. internalization of EIS use.
H7: Satisfaction with EIS support services correlates positively with:
a. frequency of EIS use, and
b. internalization of EIS use.
H8: Satisfaction with EIS development plans correlates positively with:
a. frequency of EIS use, and
b. internalization of EIS use.
75

3.4.2.3 Consequences and Behavior
The perceived consequences construct is consistent with the Expectancy Theory
of motivation proposed by Vroom (1964). The basic premises of the Expectancy
Theory is that, individuals evaluate the consequences of their behavior in terms
of potential rewards and base their choice of behavior on the desirability of the
rewards. Perceived consequences are also what Davis (1989) refers to as
perceived usefulness in the Technology Acceptance Model (TA M ) . Davis
(1989) defines perceived usefulness "as the extent to which a person believes that
using a particular technology will enhance his/her job performance" (p. 320).
Perceived usefulness, which reflects perceptions of the performance-use
contingency, has been closely linked to outcome expectations, instrumentality,
and extrinsic motivation (Davis, 1989, 1993; Davis et al., 1989, 1992). A
significant body of T A M research has shown that perceived usefulness is a strong
determinant of user acceptance, adoption, and usage behavior (e.g., Davis, 1989;
Davis et al., 1989; Mathieson, 1991; Taylor and Todd, 1995; Venkatesh and
Davis, 1996; Venkatesh, 1999; Venkatesh and Morris, 2000; Elkordy, 2000;
Elkordy and Khalil, 2002). Accordingly, it is hypothesized that:
H9: Perceived usefulness correlates positively with:
a. frequency of EIS use, and
b. internalization of EIS use.
76

3.4.2.4 Social Factors and Behavior
As described earlier, subjective culture consists of norms, roles, and values.
Subjective norms are defined by Fishbein and Ajzen (1975) as the degree to
which an individual believes that people who are important to him/her think
he/she should perform a behavior in question. Superior, peer, and subordinate
influences in the workplace have been shown to be strong determinants of
subjective norms in the technology domain (Mathieson, 1991; Taylor and Todd,
1995; Venkatesh & Davis, 1996; Venkatesh, 1999; Venkatesh and Morris, 2000;
Elkordy, 2000; Elkordy and Khalil, 2002). It follows from the above that
subjective roles and values, which are also social factors, will as well have
superior, peers, and subordinate as determinants. Subjective culture constitutes a
work group's influence on the individual in the workplace. Bergeron et al.
(1995) also indicated that social factors determine EIS users behavior.
According to Triandis (1980), subjective culture is the subjective aspect of the
social environment.
According to Triandis' Framework, any behavior occurs in a particular social
situation which triggers specific levels of social factors. Adamopoulos' (1976)
study of the perception of social situations, using an adaptation of the role
differential, reveals two dimensions: formality-informality (reflecting the public-
private character of the situation) and constraining-unconstraining (reflecting the
number of different behaviors that can appropriately occur in the situation).
According to Triandis, social situations include behavior settings. A behavior
77

setting has place-time coordinates, it consists of physical entities and process,
and it evokes particular behaviors. Triandis cites a classroom as a behavior
setting which has a particular location and a particular time when a class meets; it
also has physical entities such as chairs and tables, black/whiteboards, and in it
people act in certain ways, for example, talk, listen, take notes, and so on.
Following the above premises, it is hypothesized that:
H10: Subjective norms correlate positively with:
a. frequency of EIS use, and
b. internalization of EIS use.
Hll: Subjective roles correlate positively with:
a. frequency of EIS use, and
b. internalization of EIS use.
H12: Subjective values correlate positively with:
a. frequency of EIS use, and
b. internalization of EIS use.
H13: Social situations correlate positively with:
a. frequency of EIS use, and
b. internalization of EIS use.
3.4.2.5 Facilitating Conditions and Behavior
As mentioned in the literature review, EIS development attracts much of the EIS
research effort. M u c h of the effort in this area is directed at creating or
suggesting the right conditions for deriving the m a x i m u m benefits from these
78

systems. Critical factors for successful EIS development have been linked to
executive sponsorship, user involvement and participation. Other critical factors
revealed are plan for development and spread, management of data problems,
resistance to the systems, and technical and other resources problems. One of the
main reasons for user involvement and participation, for example, is to facilitate
implementation (that is, to ensure follow-up), overcome resistance, ensure
acceptance, avoid conflicts and ensure continuous resources / support
(Nandhakumar and Jones, 1997). Nandhakumar's (1996) in-depth case study of
EIS in an organization suggests that, in addition to these development success
factors, developers need to have some understanding of the social and
organizational context in which the systems are used. He mentioned contextual
elements such as assumptions, beliefs, shared norms, and perspectives.
Systems development processes are ongoing and therefore create facilitating
conditions for the use of the systems. As well, management processes, such as
company policies and rules with regard to information systems use in
organizations, will create facilitating conditions for their use. Policies regarding
EIS may refer to making the systems accessible to executives anywhere, anytime.
This may require the provision of laptops and connectivity facilities that will
allow executives to dial into the systems from home, on business trips even
overseas. McBride's (1997) nine-year case study of the rise and fall of an EIS in
a UK manufacturing company also suggests the importance of the interactions
between the business environment, the organizational environment and the
79

perceptions and interpretations of events and facts by stakeholders on the success
or failure of an information system.
From the above analysis, it will therefore be appropriate to investigate how these
facilitating conditions relate to EIS users' behavior. Accordingly, and consistent
with Triandis Framework, it is hypothesized that:
H14: EIS development processes correlate positively with:
a. frequency of EIS use, and
b. internalization of EIS use.
H15: EIS management processes correlate positively with:
a. frequency of EIS use, and
b. internalization of EIS use.
H16: Organizational environment correlate positively with:
a. frequency of EIS use, and
b. internalization of EIS use.
3.5 Conclusion
This chapter presented Triandis' Framework which is the theoretical foundation
upon which this research study is based. W e derived and presented the research
model and the hypotheses to be tested in this study. The chapter highlighted that
system usage is a behavior, and therefore there is a need to treat system usage as
a behavior in any research that is concerned with the use of information systems.
Based on the theoretical framework, w e also detailed factors to be considered
that influence/explain behavior in using EIS which w e depicted in the research
80
model in Figure 3.2. Also, other theoretical foundations used in information
system use research and the need for an alternative theoretical model for IS usage
research have been highlighted. Finally, we presented the few EIS research
studies based on Triandis Framework and their advocacy for the use of this
model as a theoretical foundation for IS usage research.
The objectives of this study are to investigate and better understand and explain
the factors that influence users to use EIS. The results of this study, in part, will
enable us to improve the design and the implementation of EIS in the workplace,
which subsequently will increase usage and success in the workplace. The
Triandis' Framework, upon which this research is based, includes constructs that
provide a rich and thorough assessment of the behavior of an IS user towards the
use of the system. The key constructs and the strengths of the framework may be
summarized as:
• Habits, social factors, affect, consequences, and facilitating conditions which
can all influence/explain the behavior of the individual towards using an
information system are well exemplified by the theoretical framework;
• The development of personality through the network of habits, social
factors, subjective culture, affect, consequences, and intentions to behave is
well exemplified by the theoretical model;
• Social, cultural, political and organizational factors which may influence
and/or explain the user's behavior in using an EIS have all been addressed by
the theoretical model; and
81

• Adequate steps and suggestions for operationalizing the variables involved
have been provided. More details on this point are presented in the next
chapter.
Without doubt, Triandis' Framework has its weaknesses, as do most theoretical
models. For one, the model is very complex and it would be difficult to employ
it in its entirety. This is not however a severe limitation since the model was
intended to serve as a framework for research and not as a model of human
behavior. A second limitation is that some of the constructs are related in the
sense that it may be difficult to operationalize the constructs without introducing
some redundancy in the measures.
Although Triandis' Framework has not been as widely accepted as alternative
models such as the Theory of Reasoned Action (TRA) it has been tested and used
in other contexts. With respect to empirical findings, Valois et al. (1988)
conducted a study to compare the Triandis' Framework with TRA in the
prediction of exercise intention and behavior. They found Triandis' Framework
to be at least as powerful as TRA in terms of prediction. However, their study
found that the results obtained from Triandis model demonstrate the importance
of the habit of exercise behavior. Moreover, the results of their study showed
that Triandis model is superior to TRA in explaining behavior intention,
particularly in the salience of affective, social and personal belief components of
Triandis model.
82

Bergeron et al. (1995) used the Triandis' Framework as the base for their
investigation of EIS usage and found it provided a good explanatory model.
In the next chapter the research design, research methodology, conceptualization
and operationalization of constructs and variables, and the data collection method
for this study are presented.
83
CHAPTER 4 RESEARCH DESIGN AND METHODOLOGY
4.1 Introduction
In the previous Chapter 3 the theoretical framework, the research model, and the
hypotheses to be tested in this study have been presented. This chapter presents
the research design, the research methodology, and the operational measures of
the variables in this study required to test the hypotheses presented in the
previous chapter. The chapter also presents the rationale for the selection of the
specific procedures and methods.
4.2 Research Design
A research design is a plan and structure of investigation used to obtain answers
to research questions (Kerlinger, 1986). Research design enables researchers to
answer research questions as validly, objectively, accurately and economically as
possible. The research questions for this study are:
1. What are the important social, cultural, political and organizational
factors that explain the behavior of executives in using executive
information systems in organizational settings?
2. What is the relative importance of these factors in determining executive
information systems use by executives in organizational settings?
The research design for this study is based on the guidelines provided by Babbie
(2001). Table 4.1 describes the important research design and methodology
aspects employed in this study. More specific details are discussed below.
84
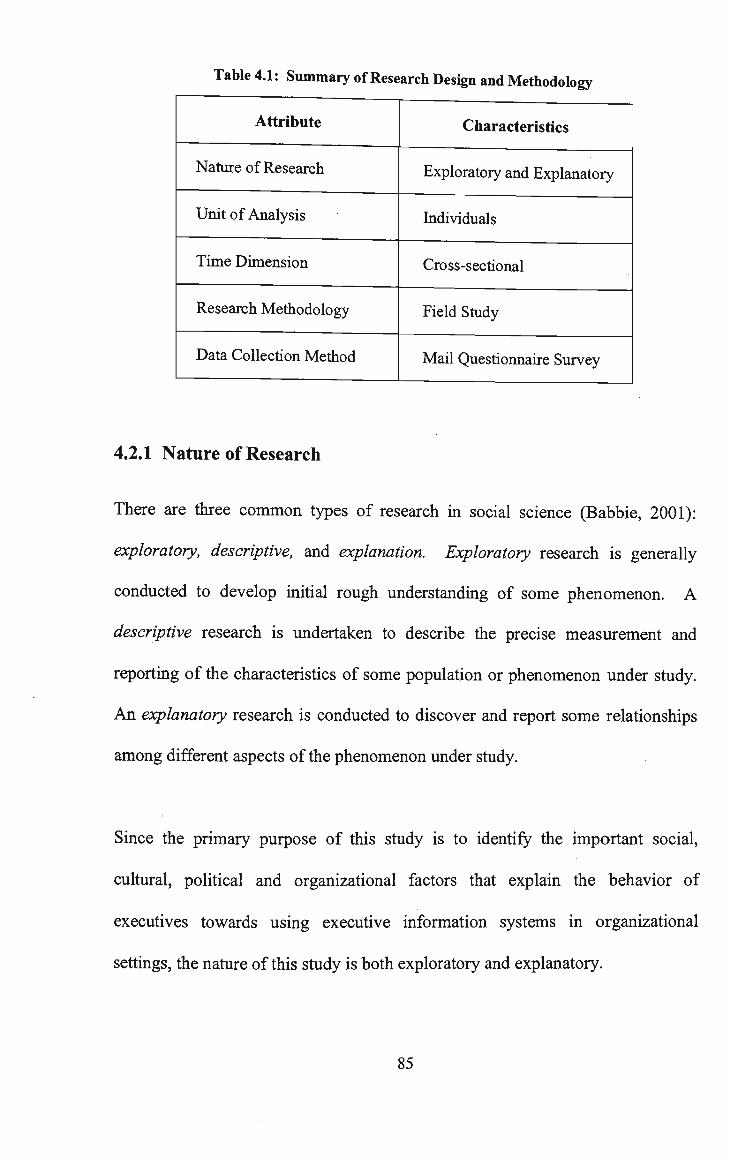
Table 4.1: Summary of Research Design and Methodology
Attribute
Nature of Research
Unit of Analysis
Time Dimension
Research Methodology
Data Collection Method
Characteristics
Exploratory and Explanatory
Individuals
Cross-sectional
Field Study
Mail Questionnaire Survey
4.2.1 Nature of Research
There are three common types of research in social science (Babbie, 2001):
exploratory, descriptive, and explanation. Exploratory research is generally
conducted to develop initial rough understanding of some phenomenon. A
descriptive research is undertaken to describe the precise measurement and
reporting of the characteristics of some population or phenomenon under study.
An explanatory research is conducted to discover and report some relationships
among different aspects of the phenomenon under study.
Since the primary purpose of this study is to identify the important social,
cultural, political and organizational factors that explain the behavior of
executives towards using executive information systems in organizational
settings, the nature of this study is both exploratory and explanatory.
85

4.2.2 Unit of Analysis
A unit of analysis refers to the primary empirical object, individual or group that
a researcher wants to study (Davis, 1996). The unit of analysis should be
accurately described for the conceptual and methodological operationalization of
the research (Huck et al, 1974). An inappropriate unit of analysis may influence
the researcher to choose erroneous tools, distorting the results and confounding
the conclusions of the research. Units of analysis primarily investigated in social
science are individuals, groups, organizations and social artifacts (Babbie, 2001).
In studying human behavior, three facets of behavior should be considered: (1)
the actor or actors engaging; (2) behavior-toward-an-object; and (3) a setting or
context (Runkel and McGrath, 1972). Actors, behaviors and objects exist in
contexts.
Since this study is interested in the factors that may influence an individual's
behavior to use EIS, the unit of analysis is an individual (actor). In this study the
individual is an executive or a senior manager who uses EIS (object) in an
organization (context). The individual's behavior can be influenced by elements,
such as social factors and facilitating conditions, in the organizational context
(Triandis, 1980). Therefore, any results derived from this study will have
important implications for the whole organization.
86
4.2.3 T h e T i m e Dimension
Time plays an important role on the design and execution of a research (Babbie,
2001). Researchers have basically two options in terms of the time dimension:
cross-sectional and longitudinal. In a cross-sectional study, the unit of analysis
is observed at only one point in time. On the other hand, in a longitudinal study
the unit of analysis is investigated over a long period of time. A heavy cost in
both time and money often precludes researchers from conducting a longitudinal
study. In addition, unanticipated changes in the unit of analysis and the research
environment threaten the generalizability of the study.
It is considered that a cross-sectional approach is most appropriate and feasible
for this study. This study seeks to explain behavior towards the use of EIS but
not to predict it and, therefore, a longitudinal study is not necessary (Bergeron et
al., 1995).
4.3 Research Methodology
Four methodologies have been identified for empirical IS research studies,
namely: case studies, field studies, field tests (quasi-experimental), and
laboratory studies (experimental) (Kim, 1996). This study employs the field
study approach because of the nature of the variables involved. That is, given the
individual and the organizational variables in the research model, a field study in
a real setting appears most appropriate. By using a field study, data can be
gathered on a number of ongoing, uncontrolled situations. In addition, field
87

study is usually deemed to be the most feasible and economical method to
examine a complex phenomenon and field study produces relatively strong
effects of independent variables on dependent variables and thus enhances the
statistical conclusion of the results (Cook and Campbell, 1979; Kim, 1996).
4.4 Data Collection Method
There are three main methods of administering survey questionnaires (Babbie,
2001):
1. Self-administered questionnaires, in which respondents are asked to
complete the questionnaire themselves. The most common form of self-
administered questionnaires is mail survey. Traditionally, mail survey is
administered by mailing the questionnaire through the ordinary traditional
"snail" mail, and/or by personal delivery to respondents. However, mail
survey nowadays can be electronic, ranging from email and web to
Interactive Voice Response (IVR) (Dillman, 2000);
2. Telephone survey, in which the survey questionnaire is read over the
telephone by the researcher to the respondent for the respondent's verbal
responses to the questions; and
3. Face-to-face, where the survey questionnaire is administered by interviewing
the respondent in a face-to-face encounter.
Choosing a specific method depends on financial resources and the
circumstances of the research (Kerlinger, 1986; Kim, 1996). Mail survey is
88

probably the best method available to collect original data from a sample
population too large to observe directly (Babbie, 2001).
The mail survey method using ordinary mail was chosen for this study for three
main reasons. First, because there has been no study on user behavior towards
the use of EIS in Australia, this study sought to collect data across a vast country
in order to have a broad picture of user behavior towards EIS use. Second,
following the first reason, and given the required response rate for statistical
analysis, data collection by the face-to-face method was considered economically
infeasible for this study. Also, collecting data by telephone was ruled out due to
the large sample size, the time required to complete the survey, and the high cost
associated with it. Third, the very busy schedule of the survey participants
involved in this study makes scheduling face-to-face or telephone survey very
time consuming and economically infeasible.
The major disadvantages of mail survey are: response rates are typically low;
there is lack of control over the survey administration; and the inability to
examine vague responses (Babbie, 2001; Dillman, 2000). Knowing that response
rates for mail surveys are typically low, the response rate from busy executives
and senior managers is expected to be even much lower than usually. However,
there are many benefits that far outweigh the drawbacks of mail survey. For
example, it is easy for the researcher to administer a mail survey for a large
sample of the population and to provide respondents with anonymity for frank
89
responses. Also, the questionnaires are stable, consistent and uniform, and can
be completed at the respondent's convenience (Sarantakos, 2002; Babbie, 2001;
Dillman, 2000). In addition, studies have shown that executives favor mail
surveys (Babbie, 2001; Broadbent, 2002).
Dillman (1978) views the process of sending questionnaires to prospective
respondents, getting them to complete the questionnaires and return them as a
special case of "social exchange". Applying the theory of social exchange as
developed by Thibaut and Kelly (1959), Homans (1961) and Blau (1964),
Dillman assumes that a person is most likely to answer a questionnaire when the
perceived costs of doing so are minimized, the rewards are maximized, and the
respondent trusts that the expected rewards will be delivered.
According to Dillman, respondents' costs can be reduced in many ways, such as
packaging the questionnaire to look slim and easy to fill out, asking interesting,
clear and concise questions, and including prepaid self-addressed return
envelops. Social rewards can also be provided in various forms, including
explaining how a study will be useful to the respondent, saying "Thank you", and
offering copies of the study results. Trust may be established through
sponsorship by trusted authorities, the use of letterhead from legitimate sponsor,
inclusion of the name(s) of some prominent members of the trusted authorities,
and so on. These views are shared by Wiersma (2000).
90

Exchange theory suggests that the three concepts of costs, rewards, and trust
interact and may offset each other. For example, attempts to reduce costs (e.g.,
an easy to fill out questionnaire) may be offset by failure to offer rewards (e.g.,
not explaining the benefits of the study). Dillman believes that willingness to
respond to a questionnaire is based on an overall evaluation of the survey rather
than an isolated reaction to specific aspects of the survey. In other words, every
aspect of the survey implementation must be planned in detail and integrated in
order to encourage a good response.
Based on exchange theory, Dillman (1978) developed a set of survey procedures
that may be applied to achieve higher response rates. Dillman based his
approach on the premise that, "to maximize both the quantity and the quality of
responses, attention must be given to every detail that might affect response
behaviof (p. viii). Dillman called his approach the Total Design Method (TDM)
and it consists of two parts:
1. identifying and designing each aspect of the survey process that may affect
either the quantity or the quality of response so as to maximize response
rates;
2. organizing the survey efforts in a way that the design intentions are carried
out in complete detail.
The TDM relies on a theoretically based view of why people do not respond to
questionnaires and a well-confirmed belief that attention to administrative details
is essential to conducting successful surveys. In the latest edition of his book,
91

Dillman (2000) goes further to describe additional shaping of procedures and
techniques for particular surveys based on a more precise considerations of costs,
rewards and trust associated with specific populations, sponsorship, and/or
content.
TDM provides specific guidelines for constructing a questionnaire and
implementing a survey. In questionnaire construction, detailed instructions
govern the use of paper, typefaces, sequencing of questions, page layout, and so
on. In survey implementation, comprehensive rules are given on the content and
personalization of the cover letter, signing of the letter, the mailed out package,
and follow-up procedures to non-respondents. These procedures and guidelines
were followed in designing the questionnaire and the administration of the survey
for this study.
The next section presents the conceptualization and operationalization of the
constructs and variables used in this study before the questionnaire and survey
designs are presented.
4.5 Conceptualization and Operationalization of Constructs and Variables
The six constructs involved in this study are habits, consequences, affect, social
factors, facilitating conditions, and behavior, plus the associated variables as
shown in the Research Model in Figure 3.2. A brief definition of terms is given
before the descriptions of the conceptualization of the constructs and the
operationalization of the variables.
92

4.5.1 Definition of Terms
Conceptualization is the process that redefines a concept to give it a conceptual
or theoretical definition. It refers to the process of identifying and clarifying
concepts: ideas we have about the nature of things (Babbie, 2001). It is the
specification of the meaning of the concepts and variables to be studied.
Conceptualization helps in linking theory with research. A concept is a thought,
general notion, or a generalized idea about a class of objects or events expressed
as symbols or words. Concepts are borne out of experience, creative thinking or
observation, and they are the building blocks of a theory. A theory is a logical
construction that explains a natural phenomenon (Kuhn, 1970). Kerlinger (1986)
defines a theory in more detail as:
".... a set of interrelated constructs (concepts), definitions, and propositions
that present a systematic view of phenomena by specifying relations
among variables, with the purpose of explaining and predicting the
phenomena" (p. 9).
Kerlinger's definition qualifies Triandis' Framework as a theory.
The terms concept and construct have similar meanings and are used by scientists
and researchers interchangeably: although there is an important distinction
between the two terms. A concept expresses an abstraction formed by
generalization from particulars (Kerlinger, 1986). For example, "weight" is a
concept that expresses numerous observations of things that are more or less
93

"heavy" or "light". A concept turned into systematically organized ideas is
referred to as a construct (Neuman, 2000).
Concepts in natural science theories are more concrete and are often expressed in
symbolic forms, whereas concepts in social science theories are more complex
and abstract, and are often expressed using words, and can take on several
definitions. Social science theories require well-defined concepts (Neuman,
2000).
Conceptualization results in a working definition of a variable. A variable is a
concept that differs in degree or kind and can be measured. In practice, however,
scientists and researchers use the term variable as a synonym for the construct or
the property being studied (Cooper and Emory, 1995). In this context, a variable
"is a symbol to which numerals or values are assigned" (Kerlinger, 1986, p. 27).
The working definition of a variable establishes the theoretical position from
which the variable is measured.
There are situations where the measure for a variable is determined by a measure
of a number of further variable items. For example, to determine the measure for
user satisfaction of EIS support services variable, one may measure how
adequate, timely and relevant support services are. These variable items that
determine a measure of another variable are referred to as sub-variables in this
94

study. The variables for this study are shown in the research model in Figure 3.2,
while sub-variables can be identified from the survey questionnaire.
Whereas conceptualization is concerned with the intellectual clarification of
concepts for measurement, operationalization is the construction of the actual,
concrete measurement techniques (Babbie, 2001). Operationalization gives an
operational definition of the variable in terms of specific operations, measuring
instruments, and procedures used in measuring the variable. Operationalization
answers the question: " H o w will w e actually measure the variables under study?"
N e u m a n (2000) made five recommendations for developing good measures of
variables. These recommendations were followed in the operationalization of the
variables in this study. Neuman's five recommendations are shown in Box 4.1.
Box 4.1: Neuman (2000)'s Five recommendations for developing good measures of
Variables (Source: Neuman (2000, p. 161)
1. Remembering the conceptual definition: that is, the underlying principle for any
measure to match the specific conceptual definition of the variable;
2. Keeping an open mind: that is, being creative and constantly looking for better
measures;
3. Borrowing from others: that is, using good ideas for measures from other
studies, and with modifications if necessary;
4. Anticipating difficulties: that is, thinking in advance logical and practical
problems that may arise when trying to measure variables of interest and
avoiding these problems with careful forethought and planning; and
5. Not forgetting units of analysis: that is, making sure measures fit the units of
analysis and permitting generalization to the universe of interest.
95
In designing the measuring instruments for the variables in this study, the
reliability and validity of the instruments were taken into account. These are two
essential characteristics of measurement that must be considered in establishing
the appropriateness and usefulness of a measuring instrument (Youngman, 1979;
Sekaran, 1992; Wiersma, 2000).
Reliability indicates the degree to which a measuring instrument performs
consistently. That is, the consistency with which the instrument is measuring
whatever it measures. Will the measure yield the same results on different
occasions assuming no real change in what is to be measured? The reliability of
a scale indicates how free it is from random error.
On the other hand, the validity of an instrument indicates the degree to which a
measuring instrument measures what is it designed to measure. That is, the
degree to which a procedure produces genuine and credible information
(Youngman, 1979; Sommer and Sommer, 1997; Wiersma, 2000).
Both definitions for reliability and validity specify degree rather than perfection.
It is rare to achieve perfect reliability and validity (Neuman, 2000). To obtain
figures ranging from 0.70 to 0.81 for reliability for example is perfectly
acceptable (Youngman, 1979).
96

N e u m a n (2000) classified reliability into three types. The first is stability
reliability, which is reliability across time. It indicates whether a measure or
indicator delivers the same answer when applied in different time periods. The
second is representative reliability, which is reliability across subpopulations or
groups of people. It indicates whether a measure or indicator delivers the same
answer when applied to different subpopulations (e.g., different classes, races,
sexes, age groups). The third is equivalence reliability, which is applied when
researchers use multiple indicators or measures. This occurs when multiple
specific measures are used in the operationalization of a construct (e.g., several
items in a questionnaire all measure the same construct). Equivalence reliability
indicates the consistency of results across different indictors or measures. There
are special statistical measures (e.g., Cronbach's alpha) to determine this type of
rehability. Equivalence reliability was applied in this study.
There are two main aspects of validity - internal validity and external validity.
Internal validity is the degree to which a procedure measures what it is supposed
to measure. That is, whether the operational definition is consistent with other
ways of identifying and measuring a variable. On the other hand, external
validity refers to the generalizability of the findings of a study. That is, can the
results of a study be extended beyond the immediate setting or situation? In
other words, what is the probability that the patterns observed in a sample will
also be present in the wider population from which the sample is drawn? There
is a third aspect of validity, which is statistical validity. Statistical validity
97

requires that the correct statistical procedure is chosen and that its assumptions
are fully satisfied. T h e procedures for statistical validity w e r e applied in this
study, and are described in the Methodology section.
Sekaran (1992) classified validity into eight types. All eight validity types were
considered in the conceptualization and operationalization of the constructs and
variables in this study. Sekaran's eight validity types are s h o w n in B o x 4.2.
Box 4.2: Sekaran's (1992) Eight classifications of Validity (Source: Sekaran (1992)
1. Content validity: which is to ensure that a measure includes an adequate and
representative set of items that would tap the concept. That is, ensuring that a
measurement instrument adequately measures the concept;
2. Face validity: which is to ensure that experts in the field of the study will agree that the
instrument measures what its name suggests it measures;
3. Criterion-related validity: which is to ensure that a measure differentiates individuals
on a criterion it is expected to predict. That is, the measure differentiates in a manner
that helps to predict a criterion variable. This is done by establishing concurrent
validity or predictive validity;
4. Concurrent validity: which is to ensure that a measure differentiates individuals in a
manner that helps predict a criterion variable currently. That is, classifying units of
analysis in manner that ensures that the results of a measure are acceptable for
predicting a present criterion variable;
5. Predictive validity: which is to ensure that a measure differentiates individuals in a
manner mat helps predict a future criterion;
6. Construct validity: which is to ensure that the result obtained from a measure fits well
the theories around which the study is designed. This is assessed through convergent
and discriminant validity;
7. Convergent validity: which establishes that the scores obtained by two different
measurement instruments measuring the same concept are highly correlated; and
8. Discriminant validity: which is established when, based on theory, two variables are
predicted to be uncorrelated, and the scores obtained by measuring them are indeed
empirically found to be so.
98
4.5.2 T h e Measures
The concepts underlying Triandis' Framework and the definitions of some
constructs in the framework have been presented in Chapter 3 sections 3.3.1 and
3.3.2 respectively. These sections define the conceptualization process for the
constructs in this study.
The operationalization of the variables for this study is presented below. The
operationalization follows Triandis (1980) as described in Chapter 3 section
3.3.2. In addition, relevant studies (e.g., Thompson et al., 1991, 1994; Bergeron
et al., 1995) are also referenced in the operationalization. Further, the statistician
consultant on this project has been consulted constantly during the development
of the scales in the questionnaire in order to ensure their reliability and validity.
In the following subsections the various measures used are described. A 5-point
Likert scale is used throughout except where otherwise stated. This was done to
facilitate a good response rate (Wiersma, 2000). The Cronbach's alpha for the
measuring scales is presented in Table 4.2 on page 110.
4.5.2.1 Habits
From Triandis' (1980) Theoretical Framework, habits can be measured by the
past experience an individual has had with an act and the ability of the individual
to perform the given act. A body of research studies on the relationships between
99

computer experience and IT usage was presented in Chapter 3section 3.4.2.1.
Yaverbaum (1988), for example, reported an increase in the internal motivation
to use computers as the number of years of computing experience grew and
DeLone (1988) found that chief executives' knowledge of computers resulted in
IS success, while Fazio and Zanna (1981) found that attitude resulting from
direct experience was a strong predictor of behavior. An earlier IS research also
found that users learn experientially (Martin et al., 1973). Accordingly, habits
are operationalized by assessing the number of years of experience an executive
has had in using EIS, and his/her ability to use the systems. Thus, the question
posed to assess the number of years of an executive's experience in using EIS
was:
How many years have you personally been using EIS? (Please tick one)
O 0 - 4 O 5 - 9 O 10 -14 m 15-19 D 20 or more years
A similar question is posed in the questionnaire to assess executives' experience
in using computer-based information systems (CBIS) in general. This was done
in order to assess an executive's experience in using any CBIS prior to using an
EIS.
Computer system users are classified by computer experience (ability to use the
system) into novice users, knowledgeable intermittent (casual) users, and
frequent or expert users (Shneiderman, 1998). Therefore the ability to use an EIS
was measured by assessing the executive's user class. The question posed was:
100
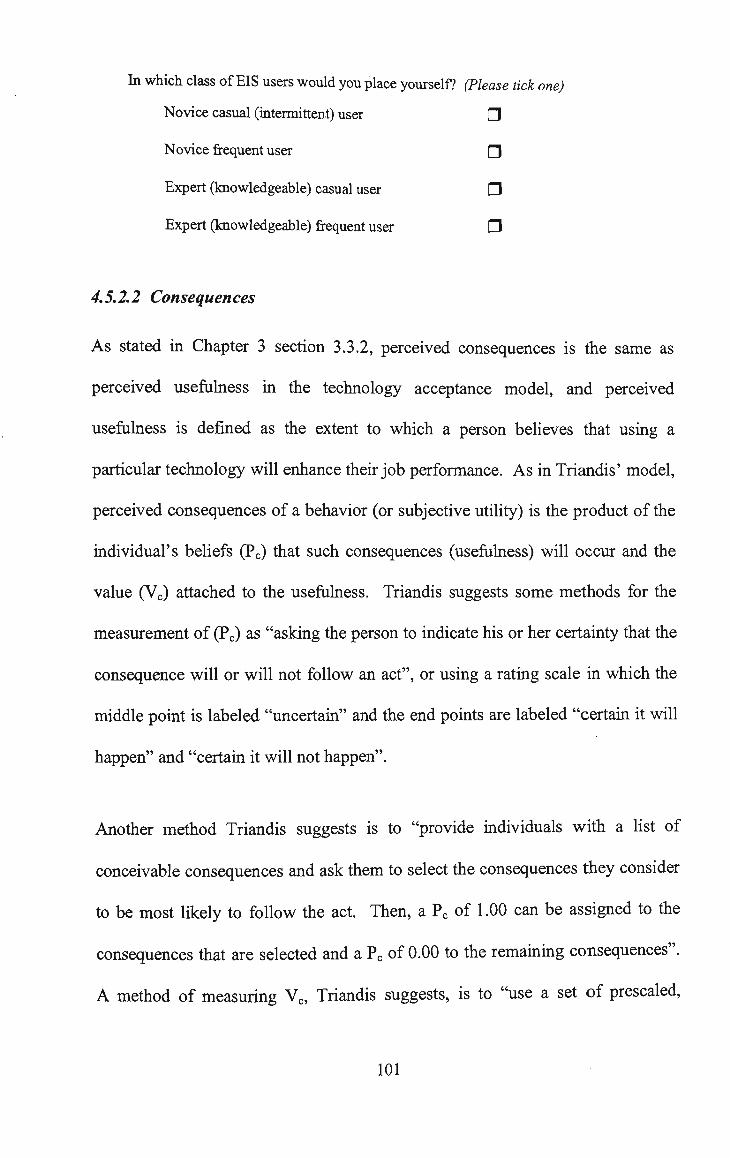
In which class of EIS users would you place yourself? (Please tick one)
Novice casual (intermittent) user G
Novice frequent user £J
Expert (knowledgeable) casual user •
Expert (knowledgeable) frequent user •
4.5.2.2 Consequences
As stated in Chapter 3 section 3.3.2, perceived consequences is the same as
perceived usefulness in the technology acceptance model, and perceived
usefulness is defined as the extent to which a person believes that using a
particular technology will enhance their job performance. As in Triandis' model,
perceived consequences of a behavior (or subjective utility) is the product of the
individual's beliefs (Pc) that such consequences (usefulness) will occur and the
value (Vc) attached to the usefulness. Triandis suggests some methods for the
measurement of (Pc) as "asking the person to indicate his or her certainty that the
consequence will or will not follow an act", or using a rating scale in which the
middle point is labeled "uncertain" and the end points are labeled "certain it will
happen" and "certain it will not happen".
Another method Triandis suggests is to "provide individuals with a list of
conceivable consequences and ask them to select the consequences they consider
to be most likely to follow the act. Then, a Pc of 1.00 can be assigned to the
consequences that are selected and a Pc of 0.00 to the remaining consequences".
A method of measuring Vc, Triandis suggests, is to "use a set of prescaled,
101
affectively positive or negative stimuli (e.g., going to a good movie or being told
by one's boss that one is doing a poor job) and ask the subject to match a
particular consequence on the 'pleasant-unpleasant dimension' with one of these
prescaled stimuli".
This study adopted Triandis' methods together with the steps suggested by Ajzen
and Fishbein (1980, pp. 261-263), which were also used by Bergeron et al.
(1995), to measure the perceived usefulness of EIS. Similar to Bergeron et al.
(1995), perceived usefulness was measured by assessing an executive's beliefs in
using an EIS and values attached to these beliefs in using an EIS. A set of six 5-
point Likert scales was used to assess the executive's beliefs for using EIS. A
second set of six 5-point Likert scales was used to assess the values the executive
attached to the beliefs in the first set. The corresponding scores in each set were
multiplied and then the products summed up. Final measure was obtained by
averaging over the six scales. The scales were adapted from Bergeron et al.
(1995).
The following are the questions together with the scales used to measure the
consequences of EIS use in this study. The scales were found to be reliable, with
Cronbach's alpha equal to 0.85.
102
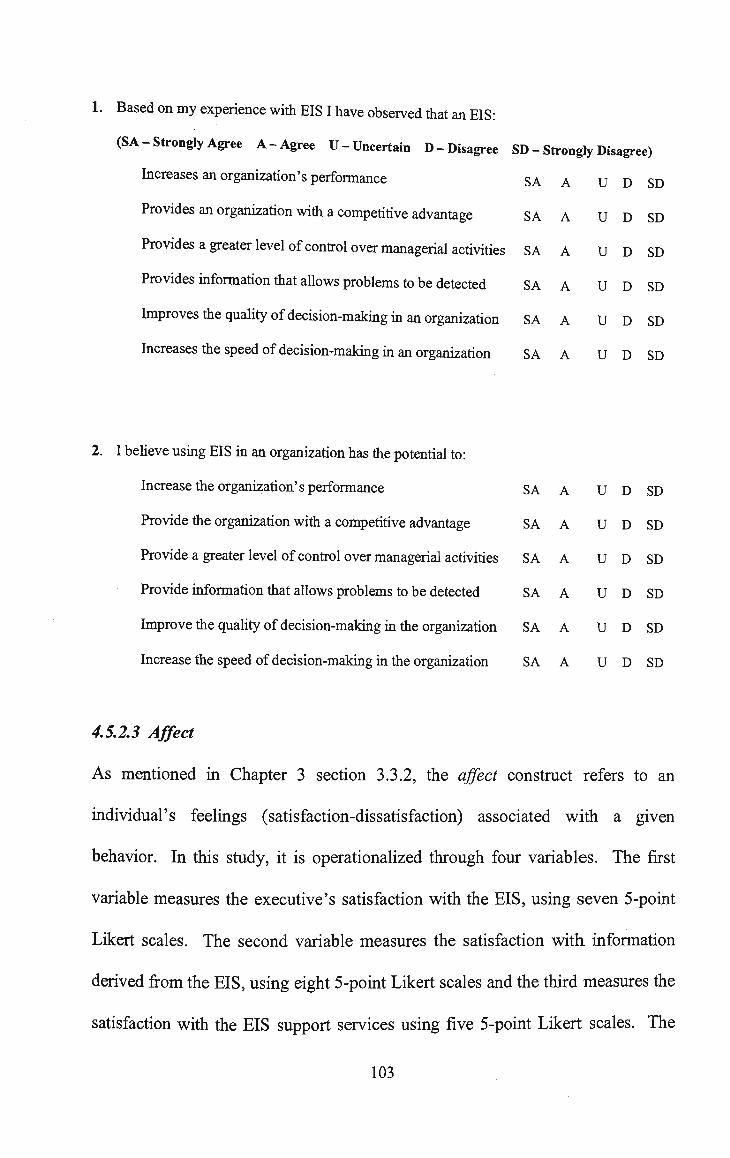
1. Based on m y experience with EIS I have observed that an EIS:
(SA-Strongly Agree A-Agree U-Uncertain D-Disagree SD - Strongly Disagree)
Increases an organization's performance SA A U D SD
Provides an organization with a competitive advantage SA A U D SD
Provides a greater level of control over managerial activities SA A U D SD
Provides information that allows problems to be detected SA A U D SD
Improves me quality of decision-making in an organization SA A U D SD
Increases the speed of decision-making in an organization SA A U D SD
2. I believe using EIS in an organization has the potential to:
Increase me organization's performance SA A U D SD
Provide the organization with a competitive advantage SA A U D SD
Provide a greater level of control over managerial activities SA A U D SD
Provide information that allows problems to be detected SA A U D SD
Improve the quality of decision-making in the organization SA A U D SD
Increase the speed of decision-making in the organization SA A U D SD
4.5.2.3 Affect
As mentioned in Chapter 3 section 3.3.2, the affect construct refers to an
individual's feelings (satisfaction-dissatisfaction) associated with a given
behavior. In this study, it is operationalized through four variables. The first
variable measures the executive's satisfaction with the EIS, using seven 5-point
Likert scales. The second variable measures the satisfaction with information
derived from the EIS, using eight 5-point Likert scales and the third measures the
satisfaction with the EIS support services using five 5-point Likert scales. The
103
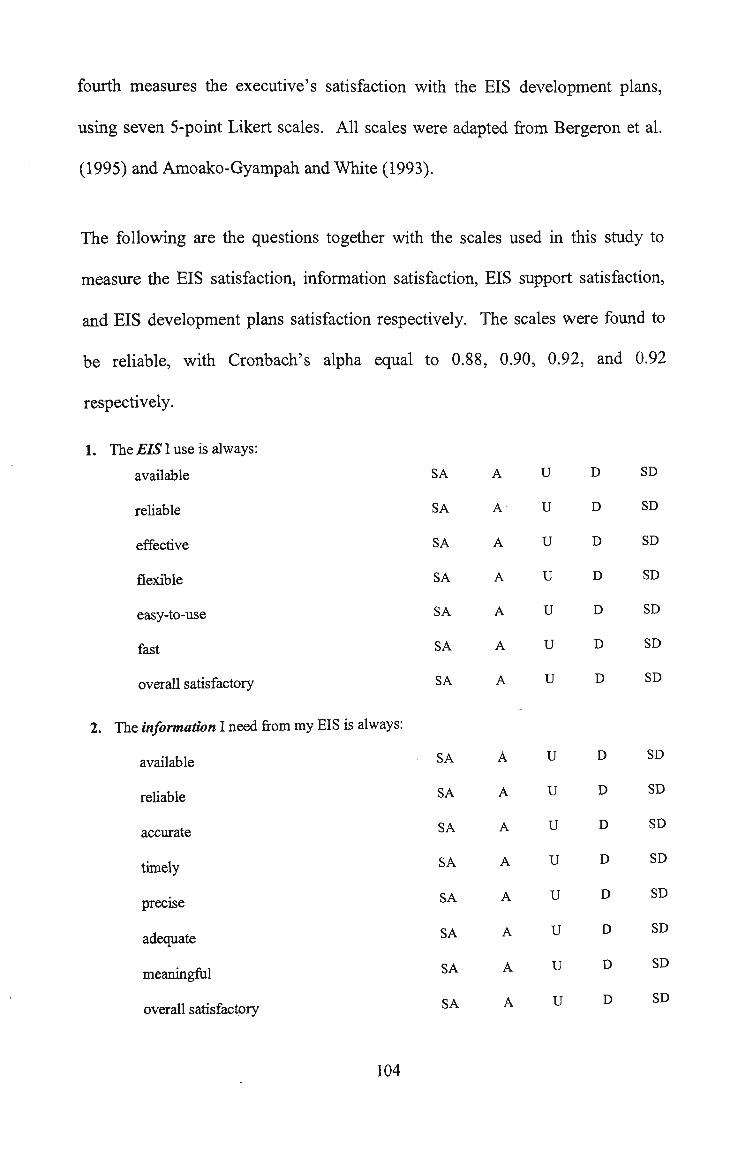
fourth measures the executive's satisfaction with the EIS development plans,
using seven 5-point Likert scales. All scales were adapted from Bergeron et al.
(1995) and Amoako-Gyampah and White (1993).
The following are the questions together with the scales used in this study to
measure the EIS satisfaction, information satisfaction, EIS support satisfaction,
and EIS development plans satisfaction respectively. The scales were found to
be reliable, with Cronbach's alpha equal to 0.88, 0.90, 0.92, and 0.92
respectively.
1. The EIS I use is always:
available
reliable
effective
flexible
easy-to-use
fast
overall satisfactory
2. The information I need from m y EIS is always:
available
reliable
accurate
timely
precise
adequate
meaningful
overall satisfactory
SA
SA
SA
SA
SA
SA
SA
SA
SA
SA
SA
SA
SA
SA
SA
A
A
A
A
A
A
A
A
A
A
A
A
A
A
A
U
u
u
u
u
u
u
u
u
u
u
u
u
u
u
D
D
D
D
D
D
D
D
D
D
D
D
D
D
D
SD
SD
SD
SD
SD
SD
SD
SD
SD
SD
SD
SD
SD
SD
SD
104

ysiems
SA
SA
SA
SA
SA
personr
A
A
A
A
A
lei tor tt
U
U
u
u
u
leblS
D
D
D
D
D
I use are
SD
SD
SD
SD
SD
3. The support services provided by the information systems personnel for the EIS I
always:
adequate
relevant
provided within an acceptable time
provided with a positive attitude
overall satisfactory
4 The development plans for the EIS systems in my organization are always:
available
reliable
complete
flexible
attainable
future-oriented
overall satisfactory
4.5.2.4 Social Factors
As stated in Chapter 3 section 3.3.2, the social factors construct consists of the
reference group's subjective culture which influences an individual group
member's notion of appropriate or desirable behavior. In the present context, this
refers to the influence of the executive's work group (peers, superiors,
subordinates, IS director) on their use of an EIS. Subjective culture consists of
norms, roles, and values. In addition, social situations also evoke particular
behaviors.
SA
SA
SA
SA
SA
SA
SA
A
A
A
A
A
A
A
U
u
u
u
u
u
u
D
D
D
D
D
D
D
SD
SD
SD
SD
SD
SD
SD
105
In this study, this construct was operationalized through four variables. The
scales and procedures for the four variables are adapted from Triandis et al.
(1968), Kohn (1969) and Bergeron et al. (1995).
The first variable measured the subjective norms (self-instructions to do what is
perceived to be correct and appropriate by the work group) by obtaining the
executive's assessment of the influence of the work group upon their behavior in
general, using four 5-point Likert scales (ranging from -2: strongly disagree, to
+2 strongly agree). This score was then multiplied by their evaluation of the
probability that the work group does in fact want them to use an EIS which was
measured using four 5-point Likert scales (ranging from 0: strongly disagree to 4:
strongly agree). The final measure is obtained by averaging over the four scales
similar to Bergeron et al. (1995). The scales were constructed from the steps
suggested by Ajzen and Fishbein (1980, pp. 74-75; pp. 261-263), which were
also used by Bergeron et al. (1995) to measure the subjective norms of EIS users.
The subjective norms variable was measured in this study with the following
questions and scales. The scales were found to be reliable, with Cronbach's
alpha equal to 0.81.
1. The following people think that
My colleagues
My superiors
The IS director
My subordinates
I should use an EIS:
SA A U D SD
SA A U D SD
SA A U D SD
SA A U D SD
2. Generally, I want to do what the following people think I should do:
My colleagues SA A U D SD
My superiors SA A U D SD
The IS director SA A U D SD
My subordinates SA A U D SD
The second variable measured the subjective roles (expected correct behaviors
associated with the executive's role and the use of an EIS), using four 5-point
Likert scales.
The third measured the subjective values (the broad tendencies of the work group
to prefer certain states of affairs over others in relation to the executive's use of
EIS), using four 5-point Likert scales.
The fourth measured the social situations in the workplace settings by obtaining
the executive's assessment of the interpersonal relationships with peers,
superiors, subordinates, the IS director and the EIS support group in using the
EIS. This was measured using five 5-point Likert scales. The scales were
constructed following Bergeron et al. (1995).
The subjective roles, the subjective values, and social situations variables were
measured using the following questions and scales respectively. The scales were
found to be reliable, with Cronbach's alpha equal to 0.82, 0.91 and 0.86
respectively.
107

SA
SA
SA
SA
A
A
A
A
U
U
u
u
D
D
D
D
SD
SD
SD
SD
1. B y virtue of m y roles in the organization, the following people expect that I will use an EIS:
My colleagues
My superiors
The IS director
My subordinates
2. The use of EIS is generally considered in my organization to be:
Productive SA A
Rational SA A
Efficient SA A
Effective SA A
3 The social working relationships between me and the following make it easier for me to use
an EIS:
My colleagues SA A U D SD
My superiors SA A U D SD
The IS director SA A U D SD
My subordinates SA A U D SD
u
u
u
u
D
D
D
D
SD
SD
SD
SD
4.5.2.5 Facilitating Conditions
The facilitating conditions construct was operationalized through three variables.
The first variable measured the degree to which the organizational environment
facilitates executives' use of EIS, using five questions derived from
Nandhakumar (1996), Nandhakumar and Jones (1997), and McBride (1997) with
5-point Likert scales.
108

The second measured the degree to which the EIS development processes
facilitate executives' use of EIS, using five questions derived from Nandhakumar
(1996), and Nandhakumar and Jones (1997) with 5-point Likert scales.
The third measured the degree to which the EIS management processes facilitate
executives' use of EIS using four questions derived from Nandhakumar (1996),
and Nandhakumar and Jones (1997) with 5-point Likert scales. The scaling
followed those used by Bergeron et al. (1995).
The organizational environment, the development processes, and the EIS
management processes variables were measured with the following questions and
scales respectively. The scales were found to be reliable, with Cronbach's alpha
equal to 0.76, 0.74 and 0.70 respectively.
1. The following aspects of my organization encourage me to use an EIS:
The organizational culture SA A U D SD
The pace of changing business environment SA A U D SD
The interactions among the business units SA A U D SD
The power and politics of die organization SA A U D SD
The commitment of the organization to EIS SA A U D SD
109
izau
A
A
A
A
A
on encoura
U
U
u
u
u
D
D
D
D
D
geme
SD
SD
SD
SD
SD
2. The following aspects of the EIS development processes in m y organization
to use an EIS:
Executive sponsorship S A
M y involvement and participation in the development SA
The availability of technical and other resources S A
The use of a development plan S A
Follow-ups made after the implementation of an EIS S A
3. The following aspects of the EIS management processes in my organization encourage me
to use an EIS:
Management policies and rules SA A U D SD
Data management SA A U D SD
Availability of support SA A U D SD
The availability and accessibility of the system SA A U D SD
4.5.2.6 Behavior
The behavior construct is operationalized through two variables.
The first variable measured the frequency with which executives use an EIS.
Similar to Leidner and Elam (1994b), the value for this variable was obtained by
asking executives to indicate the average number of terminal sessions per month
they initiate in using an EIS.
The second variable measured the internalization of EIS use by ascertaining the
executive's probabilities and values associated with the use of the system.
110

According to Bergeron et al. (1995), "one of the fundamental aspects of behavior
which can be measured is its intensity, that is, the degree to which it is
'internalized' by the actor" (p. 138). Three relevant aspects of internalization in
terms of system use are identified by Trice and Treacy (1988). The first relates
to the user's level of dependence upon the system. The second is the extent of
system ownership felt by the user. The third refers to the routinization of system
usage. These suggestions are followed by Bergeron et al. (1995) in their studies.
This present study also followed these suggestions and used a measure which
consists of four 5-point Likert scales, which characterized the extent to which the
system has become an integral part of the executive's work activities.
The following questions were used to measure the frequency of use.
1. On average, how many times do you logon to use an EIS? (Please tick one)
Several times a day •
Once a day LT
1-4 times a month LJ
Once a month LJ
Less than once a month LJ
The following questions and scales were used to measure internalization and the
scales were found to be reliable, with Cronbach's alpha equal to 0.81.
2. Using an EIS helps me personally to:
Accomplish my usual tasks
Identify trends and obtain critical information
Make strategic decisions
Not using EIS any more would disadvantage me
SA
SA
SA
SA
A
A
A
A
U
u
u
u
D
D
D
D
SD
SD
SD
SD
111
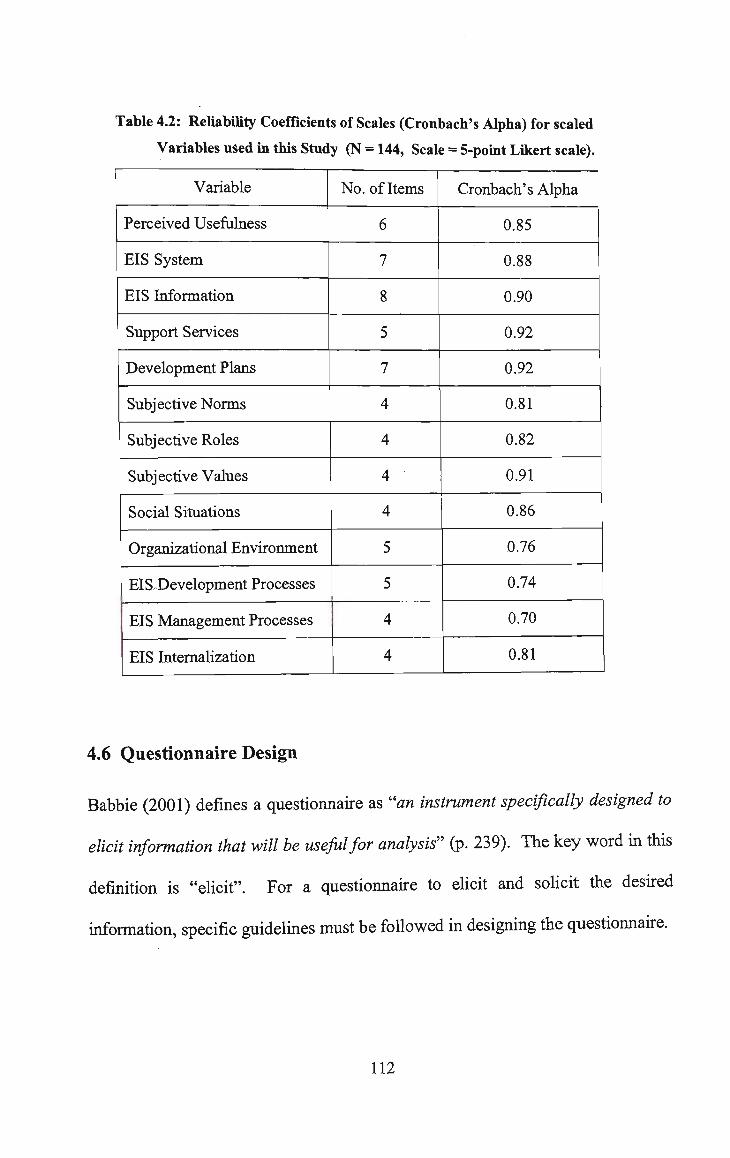
Table 4.2: Reliability Coefficients of Scales (Cronbach's Alpha) for scaled
Variables used in this Study (N = 144, Scale = 5-point Likert scale).
Variable
Perceived Usefulness
EIS System
EIS Information
Support Services
Development Plans
Subjective Norms
Subjective Roles
Subjective Values
Social Situations
Organizational Environment
EISTJevelopment Processes
EIS Management Processes
EIS Internalization
No. of Items
6
7
8
5
7
4
4
4
4
5
5
4
4
Cronbach's Alpha
0.85
0.88
0.90
0.92
0.92
0.81
0.82
0.91
0.86
0.76
0.74
0.70
0.81
4.6 Questionnaire Design
Babbie (2001) defines a questionnaire as "an instrument specifically designed to
elicit information that will be useful for analysis" (p. 239). The key word in this
definition is "elicit". For a questionnaire to elicit and solicit the desired
information, specific guidelines must be followed in designing the questionnaire.
112

There are two options available to researchers in posing questions in a
questionnaire:
1. Open-ended questions, in which case the respondent is asked to provide
their own answers to the questions;
2. Closed-ended questions, in which the respondent is asked to select an
answer from among a list provided by the researcher.
Closed-ended questions are more popular in survey research because they
provide a greater uniformity of responses and are more easily processed (Robson,
1996; Babbie, 2001). Open-ended questions must be coded before computer
analysis can be done. The coding process often requires that the researcher
interprets the meaning of the responses. This can lead to the possibility of
misunderstanding and researcher bias. There is also the danger that some
respondents will give answers that are essentially irrelevant to the researcher's
intent. Closed-ended questions, on the other hand, can often be transferred
directly into a computer format.
The main shortcoming of closed-ended questions lies in the researcher's
structuring of responses. The researcher may overlook some important
responses. Babbie (2001) gives two structural requirements that should guide the
construction of closed-ended questions. First, the response categories provided
should be exhaustive, that is, they should include all the possible responses that
might be expected. Second, the answer categories must be mutually exclusive,
that is, the respondent should not feel compelled to select more than one
113

response. This can be achieved by carefully considering each combination of
response categories and where there is still doubt that the respondent might not
be selecting only one response then an instruction to select one best answer must
be added.
4.6.1 The Design of the Survey Questionnaire
In designing the survey questionnaire for this study, the procedures and
guidelines provided by Sarantakos (2002), Babbie (2001), Dillman, (1978, 2000),
Wiersma (1986, 2000) and Robson (1996) were followed. Some questions in the
questionnaire were also adopted from Bergeron et al. (1995). The questionnaire
was designed in two stages.
In stage 1, the questionnaire was pre-tested in full three times on six colleagues at
their workplace. Each time, the questionnaire was refined with feedback
received and pre-tested again. Each time a pre-test was completed, a statistician
assigned to this project verified the statistical validity and reliability of the
questionnaire. The statistical consultant involved with this research is engaged in
the Statistical Consulting Service at the University where this research was
conducted.
In stage 2, a pilot study was undertaken with the final questionnaire developed in
stage 1. The pilot study was done for two main objectives. 1) To pre-test the
questionnaire on a representative sample and to use the feedback from the pilot
114

study to refine the questionnaire for the main survey. 2) To serve as an
exploratory study in order to develop an initial understanding of which factors
influence the use of EIS in organizations.
A general description of what this research is about was provided in the cover
letter with the mailed out questionnaire, as shown in the cover letter template in
Appendix A. In addition, brief descriptions and definitions were provided at the
beginning of each section of the questionnaire so the respondent would know
exactly what was being asked. Instructions as to how to select responses to
questions were also provided. The sections, statements and questions in the
questionnaire were laid out so that the flow of the statements and questions kept
on reminding the respondent what the research was about (Sarantakos, 2002;
Babbie, 2001; Dillman, 2000;Wiersma, 2000; Robson, 1996).
A five-point Likert scale was used throughout the questionnaire for statements
that required scaling in order to keep the respondent's mind more focused on the
statements. Colored paper was used in printing the questionnaire mailed out to
the respondents. This was done in order to make the questionnaire conspicuous
and to subsequently assist to ensure a good response rate (Babbie, 2001; Dillman,
2000; Wiersma, 2000; Robson, 1996).
The codes for strongly agree (SA), agree (A), uncertain (U), disagree (D), and
strongly disagree (SD) were used throughout the questionnaire where statements
115

required respondents to choose one of these options, instead of any other code or
symbol such as a box. This was done so as to make it easier and faster for the
respondent to know the response they were circling without having to look back
continually to check what the codes stand for (Babbie, 2001; Wiersma, 1986).
The section requiring personal information from the respondent was placed at the
end of the questionnaire. This was done to assist the respondent to move straight
to responding to questions related to the main purpose of the survey after reading
the cover letter (Babbie, 2001; Dillman, 2000; Wiersma, 2000). On the very last
page of the questionnaire the respondent was thanked for their valuable
contribution made and asked to make any further comments they wished to
contribute.
An application was initially made to the Human Research Ethics Committee
(HREC) to approve the conduct of this survey as required by law in Australia.
The cover letter to the questionnaire included a statement guaranteeing the
confidentiality of the respondent and a statement of how the research had been
reviewed and approved by the HREC. The HREC was provided with a copy of
the cover letter in case of any concerns or complaints regarding the conduct of
the research (see Appendix A). The design of the cover letter followed the
suggestions and guidelines provided by Sarantakos (2002), Babbie (2001),
Wiersma (2000) and Robson (1996).
116

4.7 T h e Pilot Study
A pilot study was undertaken using the final questionnaire obtained from the pre
tests. Data for the pilot study was collected from three large organizations in
Australia identified as users of EIS. The respondents were CEOs, CFOs or
equivalent and two other executives in the three selected organizations.
The cover letter to the questionnaire included a statement guaranteeing
confidentiality and a statement that the research had been reviewed by the
Human Research Ethics Committee as required in Australia and their contact for
any concerns or complaints regarding the conduct of the research. The cover
letter was personalized by using the respondent's full name, title and position at
the top of the mailing address.
Twelve (12) questionnaires were mailed out and ten (10) were returned all of
which were suitable for analysis. The questionnaire was further refined using the
feedback received from the pilot survey in order to arrive at the final
questionnaire for the main survey, as shown in Appendix B. The feedback
received include suggestions to number the questions in the questionnaire;
swapping some of the questions to preserve a logical flow; including our e-mail
address for contact and including additional sub-variables in the questionnaire to
address some organizational issues. The last suggestion, for example, led to the
inclusion of "The pace of changing business environment" as a sub-variable for
the Organizational environment variable.
117

The analysis of the data collected from the pilot study was qualitative because of
the size of the sample. Preliminary results suggested that there was a very high
perceived usefulness for EIS in organizations. The results also suggested that
social factors were seen as highly relevant by users in using EIS. The results
suggested that users considered satisfaction with information from EIS, support
for the EIS and the EIS itself as more important than the EIS development plans.
The preliminary results suggested that users considered management processes
associated with EIS more important than the EIS development processes and the
organizational environment.
4.8 The Main Survey
This section presents the administration of the survey questionnaires, the
organizations surveyed and the survey results.
4.8.1 Administration of Survey Questionnaires
This section describes the process undertaken in distributing the questionnaire
packages to the respondents; monitoring of returned questionnaires; and the
follow-up with non-respondents.
The basic method for collecting data through the mail was to send the
questionnaire accompanied by a cover letter explaining the purpose of the survey,
and a pre-paid self-addressed envelope for the return of the questionnaire. One
118

of the common reasons why respondents fail to return questionnaires is the effort
required on their part to complete and return the questionnaires (Babbie, 2001).
This effort was reduced by making it easy for the respondent to put the
completed questionnaire in the pre-paid self-addressed envelope without the
respondent having to fold the questionnaire.
4.8.1.1 Survey Questionnaire Distribution and Return
The survey questionnaire packages were mailed out in batches through the
ordinary "snail" mail to the respondents. The survey questionnaire packages
were batched to facilitate a good administration of the survey. There were seven
batches in all. The first batch was mailed out on November 9, 2001. The second
and the third batches were mailed out on November 12 and 14, 2001
respectively. The fourth, fifth and the sixth batches were mailed out on
November 19, and the last batch was mailed out on November 23, 2001. The
number of questionnaire packages in each batch is as follows:
64
62
128
128
128
100
90
700
Batch 1
Batch 2
Batch 3
Batch 4
Batch 5
Batch 6
Batch 7
Total
119

The survey questionnaire package was contained in a pre-paid A-4 size envelope
with the University's name, emblem and the return address at the left-hand
corner of the envelope. A package consisted of the questionnaire, a cover letter,
and a pre-paid self-addressed A-4 size envelope having the University's name,
emblem and return address at the left-hand corner as well.
The questionnaires were pre-numbered to help provide a record of returns and
facilitate the mailing of follow-ups to non-respondents. A statement to this effect
was provided in the cover letter. The cover letter also included the purpose of the
study, how the name of the respondent was obtained, a guarantee of the
confidentiality of the respondent, what the respondent needed to do, and by what
date the completed questionnaire should be returned. The return dates were
made two weeks from the date of the cover letter.
The review of this research by the University's Human Research Ethics
Committee (HREC) was also included in the cover letter. The cover letter
concluded by thanking the respondent, a promise to inform the respondent of the
findings of the study before any final publication, and an invitation to discuss any
part of the research if they so wished. The cover letter was formatted to fit one
page and was printed on the University letterhead and signed by the main
supervisor of this PhD research project (see Appendix A).
120

4.8.1.2 Monitoring Questionnaire Returns
A table for each batch of questionnaires was prepared with the respondent's
name, the pre-number of the questionnaire sent to the respondent, the date the
questionnaire was dispatched to the respondent, the date the questionnaire was
returned, and the date any follow-up questionnaires were received.
A table was also prepared to record the cumulative totals for the number of
questionnaires completed and satisfactory for analysis, the number of completed
and uncompleted questionnaires not useful for analysis, the number of
questionnaire packages marked "return to sender", number of emails received,
and the number of telephone calls received from respondents regarding the
questionnaires.
As the questionnaires were returned, the date on which each was received was
recorded in the receipt date column against the respondent's name, using the pre-
number on the questionnaire. This was done to facilitate follow-ups to non-
respondents. Some of the questionnaire packages were returned because the
respondents had either changed jobs and left the organizations, or they had
retired from the workforce. In some cases, emails or telephone calls were
received asking whether the current occupants of the positions could complete
the questionnaires. We agreed to these requests. In other cases, some emailed,
telephoned or wrote to inform us of their company policies not to participate in
surveys. We respected these and excluded them from our follow-ups. Some
other respondents emailed and/or telephoned to discuss the research and offered
121

additional valuable comments, while some other respondents emailed, telephoned
or returned the questionnaires with the explanation that they were not using EIS
as indicated by the database which we purposely purchased for this study.
4.8.1.3 Follow-up Mailings to Non-respondents
The follow-up mailings to non-respondents were delayed until February 2002.
This was done for the obvious reason that the months of December and January
would be Christmas and New Year holiday breaks for most organizations we
were surveying. It was observed from the pattern of the returns of the
questionnaires from the first mail out that the timing of our mailing was not
good. The mailings were too close to the end of year when business activities are
usually at their peak, with executives being extra busy.
Each follow-up questionnaire package consisted of all items as in the first mail
out plus a follow-up cover letter reminding the respondent of the first mail out
and the date by which to return the questionnaire. Though the follow-up cover
letter followed the practice of encouraging immediate response, as did the initial
cover letter, the follow-up was firmer than the initial letter. (See Appendix C for
the template of the follow-up cover letter). This was done because studies
(Jackson and Schuyler, 1984) show that fewer responses were received from
respondents who received "cute" reminders than those whose reminders are more
businesslike.
122.
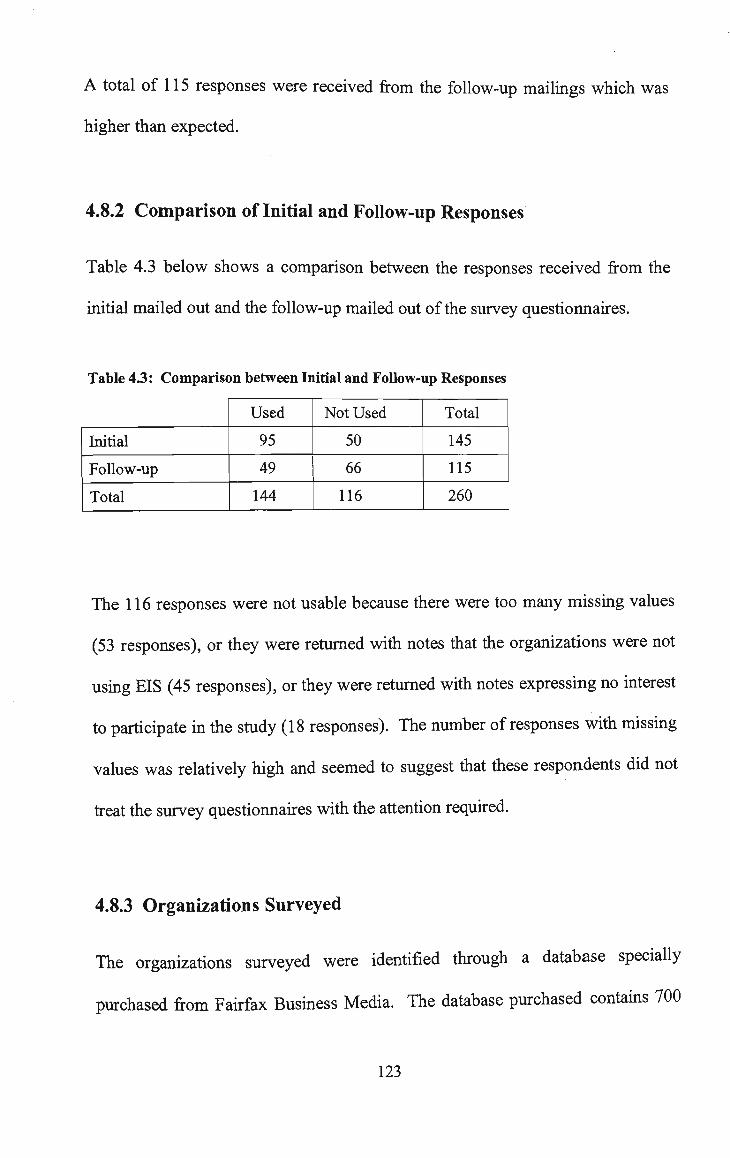
A total of 115 responses were received from the follow-up mailings which was
higher than expected.
4.8.2 Comparison of Initial and Follow-up Responses
Table 4.3 below shows a comparison between the responses received from the
initial mailed out and the follow-up mailed out of the survey questionnaires.
Table 43: Comparison between Initial and Follow-up Responses
Initial
Follow-up
Total
Used
95
49
144
Not Used
50
66
116
Total
145
115
260
The 116 responses were not usable because there were too many missing values
(53 responses), or they were returned with notes that the organizations were not
using EIS (45 responses), or they were returned with notes expressing no interest
to participate in the study (18 responses). The number of responses with missing
values was relatively high and seemed to suggest that these respondents did not
treat the survey questionnaires with the attention required.
4.8.3 Organizations Surveyed
The organizations surveyed were identified through a database specially
purchased from Fairfax Business Media. The database purchased contains 700
123

records from 255 organizations in Australia who are using EIS. The database
provides the following details:
• Respondent's title, first name, last name, position title, position code (that is,
for example, CEO for position title "Chief Executive Officer), address, city,
state, postcode, country, and telephone number.
• The company details including: company ID; legal name; address; city; state;
postcode; country; telephone number; fax number; industry code; email
domain; email convention; and web address.
An industry codes and industry groups table is also included on the database.
This table has a column for the industry code, industry description and industry
group or sector respectively. The table is reproduced and shown in Appendix D.
The organizations surveyed were either private or public, and they ranged from
small to very large organizations employing a minimum of 1,010 to a maximum
of 750,000 people. The number of IT staff ranged from 0 to 4000 and turnover
ranged from US$0 to over US$1000. A breakdown of the database by industry
sector, number of employees, number of IT staff, turnover, number of companies
in a sector and number of respondents surveyed in each industry sector is shown
in Table 4.4. The industry codes and industry groups table in Appendix D was
used to produce Table 4.4.
124
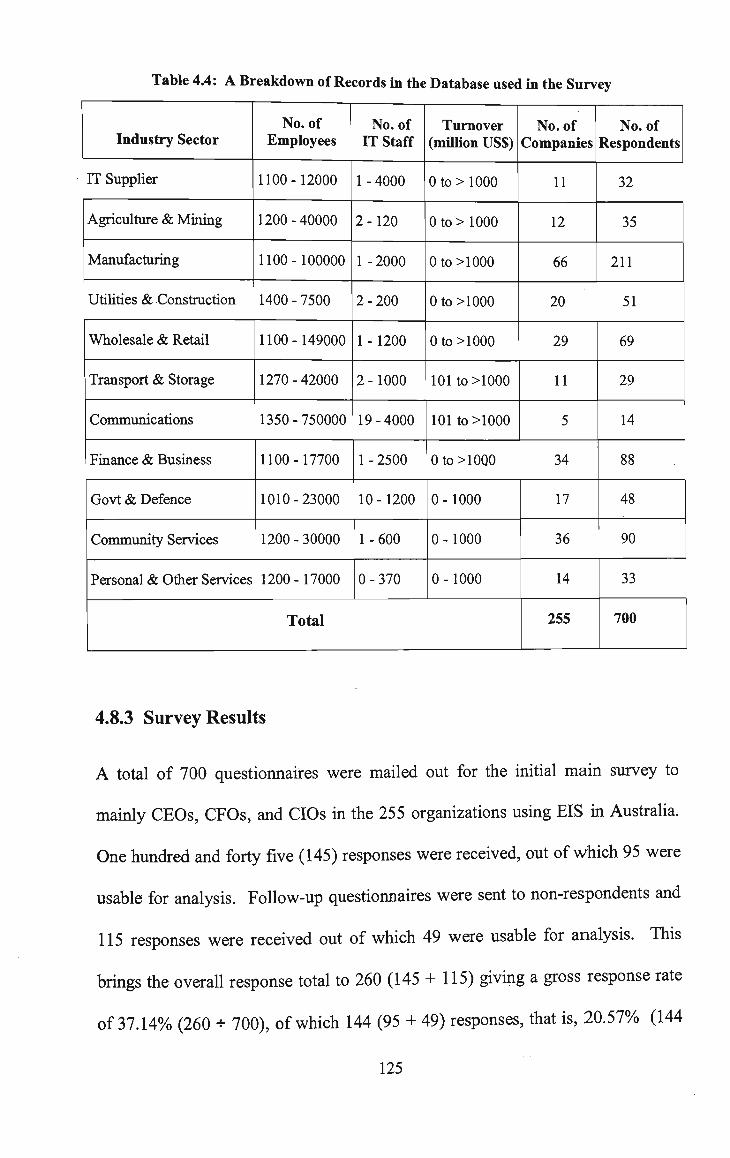
Table 4.4: A Breakdown of Records in the Database used in the Survey
Industry Sector
IT Supplier
Agriculture & Mining
Manufacturing
Utilities & Construction
Wholesale & Retail
Transport & Storage
Communications
Finance & Business
Govt & Defence
Community Services
Personal & Other Services
No. of Employees
1100-12000
1200-40000
1100-100000
1400 - 7500
1100-149000
1270-42000
1350-750000
1100-17700
1010-23000
1200 - 30000
1200 - 17000
No. of IT Staff
1 - 4000
2-120
1 - 2000
2-200
1 - 1200
2 -1000
19-4000
1 - 2500
10 -1200
1-600
0-370
Turnover (million US$)
0 to > 1000
0 to > 1000
0 to >1000
0to>1000
0 to >1000
101to>1000
101to>1000
0 to >10Q0
0 -1000
0 -1000
0 -1000
Total
No. of Companies
11
12
66
20
29
11
5
34
17
36
14
255
No. of Respondents
32
35
211
51
69
29
14
88
48
90
33
700
4.8.3 Survey Results
A total of 700 questionnaires were mailed out for the initial main survey to
mainly CEOs, CFOs, and CIOs in the 255 organizations using EIS in Australia.
One hundred and forty five (145) responses were received, out of which 95 were
usable for analysis. Follow-up questionnaires were sent to non-respondents and
115 responses were received out of which 49 were usable for analysis. This
brings the overall response total to 260 (145 + 115) giving a gross response rate
of 37.14% (260 + 700), of which 144 (95 + 49) responses, that is, 20.57% (144
125

* 700), were suitable for analysis. Table 4.5 shows the summary of the
responses to the questionnaires.
Table 4.5: Summary Responses to Questionnaires
Total Number of Questionnaires Distributed
Total Number of Questionnaires Returned
Total Number of Unusable Questionnaires
Total Number of Usable Questionnaires for Analysis
Gross Response Rate
700
260
116
144
37.14%
The total number of responses and usable questionnaires received in this study is
good compared with similar EIS studies in the US, the UK and Canada. In a
recent study in the US, Singh et al. (2002) reported having received 51 responses
from EIS users giving a response rate of 17%>, while Leidner and Elam (1994)
sent out 303 questionnaires to EIS users and received 97 responses giving a
response rate of 32%. Kim (1996) sent out 400 questionnaires to EIS users in the
US and received 112 giving a response rate of 28%. In the UK, Elkordy and
Khalil (2002) sent out 960 survey questionnaires and received 216 giving a
22.5% response rate, whereas Bergeron et al. (1995) reported obtaining field data
from 38 EIS users in nine organizations in Canada for their study. Based on the
above and considering the comparative size of commerce in Australia, the
number of participants and the total number of responses obtained for this study
is satisfactory.
126

4.9 Test for Non-response Bias
One of the most important questions surrounding any survey is the degree to
which one can generalize results to the population at large. This is because non-
response can bias survey estimates if those who do not participate in the survey
hold substantially different attitudes than those who do participate.
In this study, the population of interest consists of all users of EIS in Australia.
Given both the length of the questionnaire and the targeted population who are
senior managers and above, we expected a relatively low response. Therefore, an
important question to examine is whether or not respondents to the questionnaire
differ in any important ways from the non-respondents.
The most common method used to examine non-response bias is to compare
results between respondents to a first mailing and the respondents to a follow-up
mailing (Anderson and Epstein, 1996). The assumption that respondents to a
follow-up mailing are potential non-respondents and the follow-up procedure is a
way of weakening the resistance (Wallace and Cooke, 1990). If there are no
significant differences between the two samples, our confidence is enhanced that
no important biases have been introduced and that the sample results can be
generalize to population of interest (Anderson and Epstein, 1996).
We compared the results to each of the questions analyzed in this study between
respondents to the first mail out and the respondents to the second mail out using
127

the chi-square statistic, as suggested by Anderson and Epstein (1996). All
questions analyzed include both demographic questions and questions related to
EIS usage. The results indicate that there are almost no statistically significant
differences between the two samples. This suggests that the results of this study
can be generalized to the population of interest.
4.10 Conclusion
This chapter presented the research design and methodology for this study. The
research design and methodology were based on previous studies. The nature of
the research, the unit of analysis, the dimension, the research methodology, and
data collection attributes and characteristics employed in this study were also
presented in this chapter. The data collection method has been elaborated and
justified in this chapter. The conceptualization and operationalization of the
constructs and variables were presented based on the theoretical framework and
the research model presented in the previous chapter. Reliability and validity
were taken into account in the conceptualization and operationalization described
in this chapter.
The survey questionnaire design, based on procedures and guidelines from
previous studies, was presented. The pilot survey, the main survey, and the
administration of the main survey were discussed. A conclusion was drawn that
the timing of a survey is essential to ensure good response rate.
In the next Chapter 5 the data analysis and the results are presented.
128
CHAPTER 5 DATA ANALYSIS AND RESULTS
5.1 Introduction
Chapter 4 described the research design, the research methodology and the
operational measures. The administration of the survey questionnaires and the
results of the survey were also described in Chapter 4. This chapter presents the
data analysis and the results.
PreUminary evaluations of the research model and the hypotheses associated with
the model were performed by calculating Pearson's product-moment correlation
coefficients (Pearson's r). A further analysis was conducted by using stepwise
regression analysis to determine the relative importance of the predictor
(independent) variables in explaining EIS use. Analyses were also performed to
ensure there were no violations of the assumptions of normality, linearity and
homoscedasticity. SPSS Release 11.0 for Windows was used in the analysis.
5.2 Description of Respondents
Of the total 700 questionnaires distributed, 144 out of the 260 responses returned
were suitable for analysis, as described in Chapter 4. Demographics of the 144
respondents are shown in Table 5.1. 122 (84.7%) of the respondents were male
and 22 (15.3%) were female. The modal age group of the respondents was from
36 to 45 (40.3%) followed closely by the age group from 46 to 55 (36.8%). As
expected, the respondents were highly educated with 72 (50%) of them
postgraduate degree holders and 58 (40.3%) bachelor degree holders. The
positions reported indicated that 90 (62.5%) of the respondents occupied top-
129
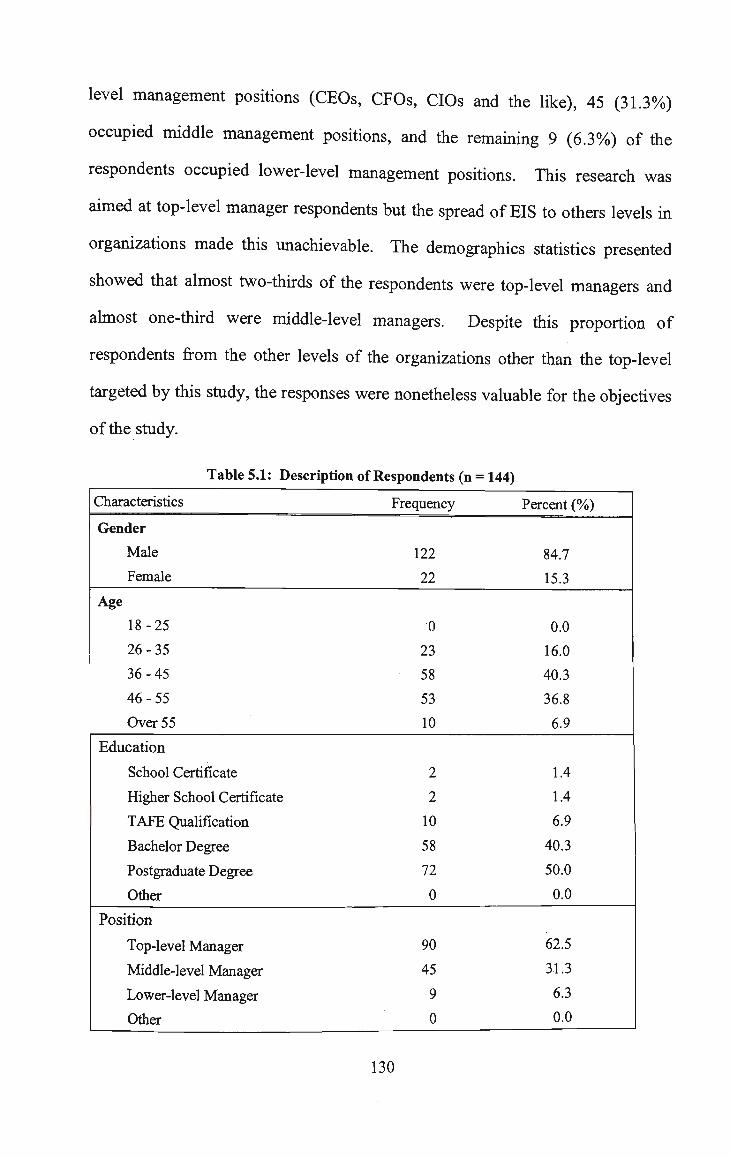
level management positions (CEOs, CFOs, CIOs and the like), 45 (31.3%)
occupied middle management positions, and the remaining 9 (6.3%) of the
respondents occupied lower-level management positions. This research was
aimed at top-level manager respondents but the spread of EIS to others levels in
organizations made this unachievable. The demographics statistics presented
showed that almost two-thirds of the respondents were top-level managers and
almost one-third were middle-level managers. Despite this proportion of
respondents from the other levels of the organizations other than the top-level
targeted by this study, the responses were nonetheless valuable for the objectives
of the study.
Table 5.1: Description of Respondents (n = 144)
Characteristics
Gender
Male
Female
Age
18-25
26-35
36-45
46-55
Over 55
Education
School Certificate
Higher School Certificate
T A F E Qualification
Bachelor Degree
Postgraduate Degree
Other
Position
Top-level Manager
Middle-level Manager
Lower-level Manager
Other
Frequency
122
22
0
23
58
53
10
2
2
10
58
72
0
90
45
9
0
Percent (%)
84.7
15.3
0.0
16.0
40.3
36.8
6.9
1.4
1.4
6.9
40.3
50.0
0.0
62.5
31.3
6.3
0.0
130
5.3 Reliability Test
As presented in Chapter 4, the reliability of a measure refers to its stability over a
variety of conditions (Nunnally and Bernstein, 1994). Reliability is concerned
with the dependability, consistency, accuracy, predictability and stability of the
measuring instruments (Kerlinger, 1986). It was acknowledged that poor
reliability could result from various sources such as contestable instrument items,
research bias, and unreliable subjects.
Cronbach's alpha coefficient was used for estimating the internal consistency
reliability of the measures. Since there are no definite values for evaluating the
reliability of a measure, the suggestion (Youngman, 1979; Nunnally and
Bernstein, 1994; Pedhazur, 1997) that an alpha coefficient greater than or equal
to 0.7 signifies high reliability was used to assess the reliability of the measures.
The results of the reliability testing for the measures, as presented in Table 4.2 in
Chapter 4, suggested that all the measures in this study were reliable. The alpha
coefficients for the measures ranged from 0.70 to 0.92. These results were
expected, as all the constructs and variables used in the study were based on
well-established instruments with high reliability scores from previous studies.
131

5.4 Dealing with Missing Data
Missing value analysis helps address several concerns caused by incomplete
data. Cases with missing values that are systematically different from cases
without missing values can obscure results. Also, missing data may reduce the
precision of calculated statistics because there is less information than originally
planned. Another concern is that the assumptions behind many statistical
procedures are based on complete cases, and missing values can complicate the
theory required.
Missing data procedures perform three primary functions:
• Describes the pattern of missing data: where the missing values are located,
how extensive they are, whether pairs of variables tend to have values
missing in different cases, whether data values are extreme, and whether
values are missing randomly.
• Estimates means, standard deviation, covariances, and correlations using a
listwise, pairwise, regression, or EM (expectation-maximization) method.
The pairwise method also displays counts of pairwise complete cases.
• Fills in (imputes) missing values with estimated values using regression or
EM methods.
In the Pairwise Deletion method, pairs of variables that have values missing in
different cases are omitted from the analysis. This method may result in the
number cases for each variable in the analysis not being the same.
132

In the Replace with mean method, missing values are replaced with the mean of
valid surrounding values. The span of nearby points is the number of valid
values above and below the missing value used to compute the mean. The
number of cases produced by this method for each variable in the analysis will be
the same, and will always be equal to the number of cases for analysis that the
researcher begins with. The main disadvantage of this method is that the mean
values replacing the missing values may not be representative of responses from
participants, and hence may lack credibility.
In the Listwise Deletion method, cases that have missing values for any of the
variables named are omitted from the analysis. This method also results in
complete cases that are actual responses from participants with the number of
cases for each variable the same for the analysis. This method may however
sometimes severely reduce cases for analysis if there is lot of missing data.
All of the above three methods produce complete cases for analysis and remove
any concerns for any statistical procedures that are based on complete cases.
In analyzing the data for this study, all three methods were used and after
consideration of the results from the three methods, the results from the Listwise
Deletion method were found to be most appropriate for the study.
133

5.5 Analysis and Test Results for the Research Model
The research model was tested using correlation and multiple regression
analyses. As a preliminary analysis, Pearson's product-moment correlation
coefficients (r) were computed to assess association. Multiple regression
analysis (stepwise) was performed to identify the important variables that explain
the behavior of users in using EIS. This section presents the analyses and the
identification of the important variables that explain the behavior of users in
using EIS. Summary statistics for the data collected are presented in Table 5.2.
It shows relatively high means for all variables except that of EIS experience.
Table 5.2: Summary Statistics for Variables in the Study (n = 144)
Variable
1. Position of User
2. CBIS Experience
3. EIS Experience
4. Ability to use EIS
5. Satisfaction with EIS information
6. Satisfaction with EIS System
7. Satisfaction with EIS Support Services
8. Satisfaction with EIS Development Plan
9. Perceived Usefulness of EIS
10. Subjective Norms in relation to EIS use
11. Subjective Roles in relation to EIS use
12. Subjective Values of EIS
13. Social Situations in relation to EIS use
14. EIS Development processes
15. EIS Management processes
16. Organizational Environment
17. Frequency of EIS use
18. EIS Internalization
Min
2.00
1.00
1.00
1.00
1.00
1.00
1.00
1.00
-3.00
-1.50
2.00
2.00
2.00
2.00
1.75
2.00
1.00
1.00
Max
4.00
5.00
5.00
4.00
5.00
5.00
5.00
5.00
8.00
8.00
5.00
5.00
5.00
5.00
5.00
5.00
5.00
5.00
Mean
3.56
2.70
2.06
2.65
3.40
3.51
3.46
3.04
3.19
2.35
3.99
3.73
3.52
3.45
3.59
3.65
3.61
3.95
Std. Dev.
0.611
1.32
1.08
1.02
0.73
0.70
0.84
0.70
2.21
1.82
0.60
0.72
0.70
0.67
0.67
0.67
1.21
0.72
134

5.5.1 Analysis for the Research Hypotheses
Pearson's product-moment correlation matrix was used to analyze the degree of
relationship or association among the variables. The correlation matrix provided
an insight into the relationships among predictor (independent) variables as well
as relationships between response (dependent) variables and the predictors. A
high correlation between a predictor variable and a response variable suggested a
strong association between the variables, and therefore the predictor variable was
designated as a potentially good predictor of the response variable.
Table 5.3 presents Pearson's product-moment correlations among the variables
together with their significance levels. Table 5.4.1 to Table 5.4.15 in Appendix E
present the correlations matrix among the sub-variables (as defined in Chapter 4)
for each of the variables in the research model that have sub-variables. The
significance of each correlation was evaluated by a two-tailed test and listwise
deletion option.
As shown in Table 5.3, correlations among the predictor variables (variables
numbered 1 - 14) were overall statistically significant, with the correlations for
any pair of the predictor variables not exceeding the multicollinearity criteria (0.9
and above) as suggested by Hair et al. (1995). The correlations among the
predictor variables ranged from -0.022 to 0.759. Based on this result, it was
concluded that there exists no multicollinearity among the predictor variables.
135

Similarly, Table 5.4.1 to Table 5.4.15 show that, overall, correlations among the
predictor sub-variables were statistically significant. The correlations ranged
from 0.189 in Table 5.4.14 to 0.863 in Table 5.4.5.
136

NO
if)
en
CN
ON
X
VO
If)
o o o r-s *
s * q oo
m
N
O
o
o o o CN
o o o NO
-H' ^ - 2
o o o * * ON
m r-* *
o en CN CN CO
o
B u
I 'S W oo
a
00
u CO
3
o
1 CO 1/3
o o o *
en in
*
in
^r r-H
o
CN CN
q i"
el o
o -s
3
?g
«s m
§ 73 O « 4H CO
•S co
S U H-» CO >N 173
C/l M
w
1 03
C3 CO
s u 1/3
ti o ft & 3 oo
# * < * • • * •
in
* * oo CN in * oo en
NO
en
o
en
o
o • T H
-4->
<a 173
••s co
en o CN
CN
*
o en
# ON
oo r-H
w CM
O co
s
O
o o * * en en * * oo CN CN 00
o o CN ON
o
o en
*
00 CN
C<)
o
•a 3
V)
I Q NO
!U
U
U
PH
o o q •-< * * en VO NO
* * ON oo en * t> oo — H
CN in *"*
* >n r-H
CN
# # ON "* CN
* * en — H
<tf
o ON
q
1 1 o
f oo ON
O
o q rt
* * oo r—<
** # * in T-H
^f
* * in oo en # * 00 • *
"fr * * CN m rn # # r-H m <3-
* * "O o in
* * m •* CN
in CN q
co
o p ccj
> u
.15
I o
o o o — H
* * t> m rn # * CN r—t
*t # CN T-H
CN
# * CN en <N
# * 00
oo CN
# in r-T-H
•
* * ON en CN
* * in en CN
# in ON "*•
CN O q
3 o •»H
13 5 00 13 '3 o oo TH
o o q r-H
# # C-• *
^ * # —H in CN
* * in ON CN
* * O en CN
* * ON O en * * CN Tt" en * # r-H in CN
* * ON en CN
* * NO CN en
t> ON
q
* in
to V co CO U O
2 PH
1 r-H
$
Q CN
O o q >-< * * en r-in # * CN en en * * en en en # # NO 1—1
Tf
* # .—l
NO en * * ON <N en * * NO o CN # * t> CN CN
* * in >n CN
* * in o • *
CN CN r—1
"
>n o r-H
co U CO co O
o PH
I 53 1 S rn
o o q '"H
* * o r-H
in
* * ^ oo en * * ON »tf "sT
# * CN r~-in * * 00 CN m * # r> >n • *
# * NO ON ^f
# * 00 ON
en # * in in CN
# * <* r—(
en # * 00 CN en
o NO r—1
'
CN in q
+->
rt o
o . r-H
1 o • «
o TT
O O
q ^ * # T-H
00 CN
# # in oo CN
* # ON d-CN
# ON t> r-H
* * en 00 CN
* * en T-H
•3-
* * en e'en # * ON in CN
* oo O CN
o NO T-H
* * CN r-H
en * * 0\ CN en
* # o o <* # T-H
en CN
o co 3 00 r-H
w H-H
o 1 53 a-u VH
IT)
O O q . — i
* * NO en * * en in
* * oo oo en * * oo ON CN
* * C~-r~-en * * i> ON • *
* * ON NO in
* * en 00 en * * o o NO * * o in CN
* in o CN
* * ON oo en * # .—* r—<
en
* * en r—I
<*
ON r-H t—1
CO 3 00 r—1
w H-H
o § •iH
CO N • rH
1 B 1 NO
00
en r—1
II
CO
•rH
d in o o V i *
q C3 V -~\ * # H-> Uj +J
o
1 •i-H
CO
(J -4—
o z
<D H rt »~ MH O CO
u ^ 13 > c3
o T3 -* o o 13 CO LH
cS CO
r3 UJ r> 1
, a> r-H
in
1 ti C3
i o «
1 •-H
co
o a u CO
m r-r—1 o' V co 0)
1 >
r~-o en NO C-~ CN
ON in CN
ON TT CN
m en CN
^-t
en CN
OO CN CN
in r-H
CN *
(N T-H
(N
r-H y—i
CN
o CN
in ON r ^
t~-l>
>n c-~ — H
II :<
O o q r~t
o q CN O q en o q m o q NO o q r-o q rH r ^
O '
CN r-H
o en r-H
q NO i — i
q CN CN q
o en
q i — i
q II ^
en T-H

5.5.2 Test Results for the Research Hypotheses
Tables 5.5 and 5.6 present extracts from the correlations matrix showing the
results of testing the hypotheses associated with the research model (Figure 3.2).
Table 5.7 presents a summary of the results of the hypotheses tested.
The majority of correlations were statistically significant. Thus, most variables
considered in these analyses showed a significant positive pairwise association.
No pairs of variables showed significant negative association. The highest
correlations were those between:
1. Perceived usefulness of EIS use and internalization of EIS (H9b, r = 0.600);
2. Organizational environment and internalization of EIS use (HI 6b, r = 0.573);
3. Subjective roles and internalization of EIS use (HI lb, r = 0.569);
4. Subjective values of EIS and internalization of EIS use, (H12b, r - 0.497);
5. Ability to use EIS and internalization of EIS use (H2b, r = 0.413);
6. Subjective roles and frequency of EIS use, (HI la, r = 0.413); and
7. Ability to use EIS and frequency of EIS use (H2a, r = 0.400).
The associations that were not significant were those correlations between:
1. EIS experience and internalization of EIS use (Hla, r = 0.119);
2. Satisfaction with EIS support and Frequency of EIS use (H7a, r = 160);
3. Satisfaction with EIS information and internalization of EIS (H4a, r = 0.164);
4. Satisfaction with EIS support and internalization of EIS (H4c, r = -0.014);
5. Satisfaction with EIS development and internalization of EIS (H4d, r = .036);
6. All the correlations between, affect variables and EIS experience (H3a, r =
0.000; H3b, r = 0.032; H3c, r = -0.022; H3d, r = 0.031).
138

Table 5.5: Pearson's Product-moment Correlations between Predictor variables and Response variables - Frequency of EIS use and Internalization of EIS use (n = 144)
-, ,. x _7 . ,, Frequency Internalization Predictor Variable (Hypothesized) 0f EIS use of EIS use
— I P r p 1. EIS Experience (Hla, Hlb) .231** .006 .119 ns 2. Ability to use EIS (H2a, H2b) .400** .000 .413** .000
3. Satisfaction with EIS Information (H5a, H5b) .329** .000 .311** .000
4. Satisfaction with EIS system (H6a, H6b) .312** .000 .389** .000
5. Satisfaction with EIS Support (H7a,H7b) .160 ns .205* .016
6. Satisfaction with EIS Development PlaB(H8a, _ M , ^ ^ m
7. Perceived Usefulness of EIS (H9a,H9b) .259** .002 .600** .000
.373** .000 .383** .000 8. Subj ective Norms in relation to EIS use
(HlOa, HlOb)
9. SubjectiveRoleSinrelationtoEISuse(Hlla, ^ m ^ m
10. Subjective Values of EIS (H12a,H12b) .283** .001 .497** .000
.179* .036 .377** .000 11. Social Situations in relation to EIS use (HI 3a,
H13b)
12. EIS Development processes (HI4a, HI4b) .249** .003 .298** .000
13. EIS Management processes (H15a,H15b) .285** .001 .388** .000
14. Organizational environment (HI6a, H16b) .281** .001 .573** .000
Note: Significant at **p < 0.01, *p < 0.05 (Listwise, n = 138)
Table 5.6: Pearson's Product-moment Correlations between Predictor variables and Response variables - EIS Experience and Ability to use EIS (n = 144)
EIS Ability to Predictor Variable (Hypothesized) Experience use EIS
r p _ p 1. Satisfaction with EIS Information (H3a, H4a)
2. Satisfaction with EIS Features (H3b, H4b)
3. Satisfaction with EIS Support Services (H3c, H4c)
4. Satisfaction with Development plan (H3d, H4d)
Note: Significant at **p < 0.01, *p < 0.05 (Listwise, n = 138)
.000
.032
-.022
.031
ns
ns
ns
ns
.164 ns
.230** .007
-.014 ns
.036 ns
139

Table 5.7: Summary of Results of Tests for Research Hypotheses
Research Hypotheses
Hla: EIS experience correlates positively with frequency of EIS use.
Hlb: EIS experience correlates positively with internalization of EIS use.
H2a: Ability to use EIS correlates positively with frequency of EIS use.
H2b: Ability to use EIS correlates positively with internalization of EIS use.
H3a: The longer the experience with EIS, the higher the satisfaction with EIS
information attributes.
H3b: The longer the experience with EIS, the higher the satisfaction with EIS
features.
H3c: The longer the experience with EIS, the higher the satisfaction with EIS
support services.
H3d: The longer the experience with EIS, the higher the satisfaction with EIS
development plan.
H4a: The more the ability to use EIS, the higher the satisfaction with EIS
information attributes.
H4b: The more the ability to use EIS, the higher the satisfaction with EIS
features.
H4c: The more the ability to use EIS, the higher the satisfaction with EIS
support services.
H4d: The more the ability to use EIS, the higher the satisfaction with EIS
development plan
H5a: Satisfaction with EIS information attributes correlates positively with frequency of EIS use.
H5b: Satisfaction with EIS information attributes correlates positively with
internalization of EIS use.
H6a: Satisfaction with EIS system features correlates positively with frequency of EIS use.
H6b: Satisfaction with EIS features correlates positively with internalization of
EIS use.
Results
Supported
Not Supported
Supported
Supported
Not Supported
Not Supported
Not Supported
Not Supported
Not Supported
Supported
Not Supported
Not Supported
Supported
Supported
Supported
Supported
140

Table 5.7 (continued)
H7a: Satisfaction with EIS support services correlates positively with
frequency of EIS use.
H7b: Satisfaction with EIS support correlates positively with internalization of
EIS use.
H8a: Satisfaction with EIS development plan correlates positively with
frequency of EIS use.
H8b: Satisfaction with EIS development plan correlates positively with
internalization of EIS use.
H9a: Perceived usefulness positively correlates with frequency of EIS use.
H9b: Perceived usefulness positively correlates with internalization of EIS use.
HlOa: Subjective norms correlate positively with frequency of EIS use.
H I Ob: Subjective norms correlate positively with internalization of EIS use.
H I 1 a: Subjective roles correlate positively with frequency of EIS use.
Hllb: Subjective roles correlate positively with internalization of EIS use.
H12a: Subjective values correlate positively with frequency of EIS use.
H12b: Subjective values correlate positively with internalization of EIS use.
H 1 3 a: Social situations correlate positively with frequency of EIS use.
H13b: Social situations correlate positively with internalization of EIS use.
H14a: EIS development processes correlate positively with frequency of EIS
use.
H14b: EIS development processes correlate positively with internalization of
EIS use.
H15a: EIS management processes correlate positively with frequency of EIS
use.
H15b: EIS management processes correlate positively with internalization of
EIS use.
H16a: Organizational environment correlate positively with frequency of EIS
use.
H16b: Organizational environment correlate positively with internalization of
EIS use.
Not Supported
Supported
Supported
Supported
Supported
Supported
Supported
Supported
Supported
Supported
Supported
Supported
Supported
Supported
Supported
Supported
Supported
Supported
Supported
Supported
141

5.5.3 Multiple Regression Analysis to Identify Important Variables
The bivariate analysis presented above established support or otherwise for the
hypotheses tested in this study. In order to identify the variables that were most
important in explaining EIS user behavior, Multiple Regression analysis was
performed.
Multiple Regression analysis extends the ideas from bivariate regression by
allowing a researcher to include several explanatory factors in the model. As in
simple regression, a regression coefficient measures the impact of changes in
each explanatory variable on the response variable. Multiple Regression
techniques fit the variables to a linear equation of the form:
y = Po + Pl*l + p2*2 + "• + Pn*n + ^
where,
y is the response variable; xltx2,...,xnare the predictor variables; j30, Pi,
Pi, ..., Pn are the coefficients; and € is the error or residual (noise) which
is assumed to be random and normally distributed, with equal variances at
each x point.
In the analyses for this study, y represented either Frequency of EIS use or
Internalization of EIS use in the respective equations, and the xs were the
predictor variables or sub-variables, as defined in Chapter 4.
142
5.5.3.1 Selecting the Right Multiple Regression Technique
The research question which the Multiple Regression technique sought to address
is: What is the relative importance of social, cultural political and
organizational factors in determining executive information systems use by
executives in organizational settings?
Stepwise regression was used as a means of developing simple regression models
by allowing addition and removal of variables at various steps in progressively
building the regression model.
The criteria for adding and removing variables are based on the F-statistic
routinely used in ANOVA. Significance levels for addition and deletion of
variables can be set by the user. Stepwise regression screens all variables
included in the analysis but does not choose those variables which have no
significant predictive value given the other variables already selected.
For the analysis in this study, a variable was not entered into the regression
model unless the^-value for that variable was less than or equal to 0.05. The
same level was set for removal of variables.
143

5.5.3.2 Selecting the Best Models
In order to select the best stepwise regression model for each of the two response
variables (Frequency of EIS use and Internalization of EIS use) in order to
address the research question, analyses were performed separately for:
1. the predictor variables as in the research model, and
2. the predictor sub-variables as in the research questionnaire.
In progressively building the stepwise regression models for each of the two
response variables, no variable was eliminated after it entered a model. The
results of each analysis were checked to ensure there were no violations of the
assumptions of normality, linearity and homoscedasticity. More details on the
checking of the assumptions are presented in Appendix F.
The best models selected for each of the two response variables were the models
using the predictor sub-variables with the listwise deletion option. The best
model for Frequency of EIS use is presented in Table 5.8 and the best model for
Internalization of EIS use is presented in Table 5.9.
144

5.5.3.3 Results of the Stepwise Regression Analysis
The results of the stepwise regression analysis are shown in Tables 5.8 and 5.9
for Frequency of EIS use and Internalization of EIS use respectively.
Table 5.8 shows that about 45 percent of the variance in Frequency of EIS use
was explained by seven (7) variables: -Ability to use EIS, EIS experience, CBIS
experience (Habits), Subjective norms relating to the IS director, Position of
user in the organization (Social Factors), EIS system reliability (Affect), and
Interaction among business units (Facilitating Conditions).
Overall, the results tended to indicate that Habits were most important in
explaining Frequency of EIS use with EIS experience, CBIS experience and
Ability to use EIS variables contributing to this explanation. This was followed
by the contributions of the variables from the Social Factors, Facilitating
Conditions and Affect constructs which also entered the equation.
CBIS experience and Position were not included in the research model but were
included in the survey questionnaire. CBIS experience was included to obtain
^formation about participants' CBIS experience prior to using EIS, while
position was included as part of collecting demographic information about
participants. As the results of the regression analysis shows, these variables
however entered the regression model in explaining Frequency of EIS use.
145

Table 5.9 shows that about 64 percent of the variance in Internalization of EIS
use was explained by five (5) variables - Pace of change of business environment
(Facilitating Conditions), Perceived usefulness (Consequences), Ability to use
EIS (Habits), Subjective productive values of EIS and Subjective norms relating
to colleagues (Social Factor).
Overall, the results tended to indicate that Facilitating Conditions were most
important in explaining Internalization of EIS use with the Pace of change of
business environment variable uniquely contributing to this explanation. This
was followed by the unique contributions of the variables from the Social
Factors, Consequences and Habits constructs which also entered the equation.
In summary, the results tended to indicate that Internalization of EIS use is a
more appropriate measure of user behavior than Frequency of EIS use. However,
the contributions of both variables in explaining user behavior towards EIS use
are quite significant and worth taking into consideration in deciding on the
development, implementation and use of EIS in organizations.
146

Table 5.8: Stepwise Regression Analysis - Frequency of EIS use
R*= 0.447 F = 14.649 : Sig. F = 0.000
Variables Entered (in order)
1. Ability to use EIS
2. Because of m y role, IS director thinks I should use EIS
3. EIS system always reliable
4. Interaction among business units encourages EIS use
5. Position
6. EIS Experience
7. CBIS Experience
From Construct
Habits
Social Factors -Subjective norms
Affect-EIS features
Facilitating conditions
Social Factor -Subjective roles
Habits
Habits
Estimated Coeff. (Beta)
.244
.215
.229
.264
-.166
.379
-.301
t
3.396
3.039
3.334
3.676
-2.284
4.180
-3.276
Sig.
.001
.003
.001
.000
.024
.000
.001
Table 5.9: Stepwise Regression Analysis - Internalization of EIS use
R2= 0.642 F = 38.317 : Sig. F = 0.000
......
Variables Entered (in order)
1. Pace of change of business environment encourages EIS use
2. Perceived usefulness of EIS
3. Ability to use EIS
4. Productive value of EIS
5. Because of m y role, Colleagues think I should use
From Construct
Facilitating conditions
Consequences
Habits
Social Factor -Subjective values
Social Factor -Subjective norms
Estimated Coeff. (Beta)
.362
.264
.214
.161
.152
t
5.633
4.096
3.599
2.638
2.359
Sig.
.000
.000
.000
.009
.020
147
5.6 Conclusion
This chapter presented the data analysis and the results. The results of the
bivariate analysis indicated that 27 of the 36 hypothesized relationships were
supported. Eight of the 9 hypotheses that were not supported were from the
relationships between habits and affect variables with the remaining unsupported
one being the relationship between EIS experience and internalization of EIS use.
The results of the multiple regression analysis indicated that Internalization of
EIS use was a more appropriate measure of user behavior than Frequency of EIS
use. About 64 percent of the variance in Internalization of EIS use was explained
by the variables: Pace of change of business environment; perceived usefulness
of EIS; Ability to use EIS; Subjective productive values of EIS and Subjective
norms relating to colleagues. Overall, the results tended to indicate that
Facilitating Conditions were most important in explaining Internalization of
EIS use with Pace of change of business environment variable uniquely
contributing to this explanation.
About 45 percent of the variance in Frequency of EIS use is explained by the
variables: Ability to use EIS; Subjective norms relating to the IS director; EIS
system reliability; Interaction among business units; Position of user in the
organization; EIS experience and CBIS experience. Overall, the results tended to
indicate that Habits were most important in explaining Frequency of EIS use
148

with EIS experience, CBIS experience and Ability to use EIS variables uniquely
contributing to this explanation.
It was observed that Position and CBIS experience which were not included in
the research model but only in the survey questionnaire entered the regression
model in explaining Frequency of EIS use.
The final chapter, Chapter 6, presents the conclusions and implications of this
research study. The limitations of the study and future directions for research in
this field are also presented.
149

CHAPTER 6 DISCUSSIONS AND CONCLUSIONS
6.1 Overview of the Study
This research study was motivated by reports of executive information systems
(EIS) failures in organizations. The study began on the premise that
underutilization or non-usage of EIS contributes to the failure of these systems.
A further premise was that system usage is a behavior and therefore appropriate
reference theories should be used to study system usage.
The research problem that the study therefore sought to solve was the failure of
executive information systems in organizations due to the underutilization or
non-usage of these systems, and the two main research questions addressed in
the study were:
1. What are the important social, cultural, political and organizational
factors that explain the behavior of executives in using executive
information systems in organizational settings?
2. What is the relative importance of these factors in determining executive
information systems use by executives in organizational settings?
The study was therefore undertaken with the primary aim of identifying,
examining and providing an understanding of the social, cultural, political and
organizational factors that explain the behavior of executives in using EIS in
order to provide solutions to the problem of underutilization or non-usage of EIS
in organizations. Triandis' Framework, a model from social psychology and
150

organizational behavior, was used as a theoretical foundation to address the
issues in the research study.
The main objectives of the study were to use the results to assist EIS designers /
developers, implementers and managers of organizations to improve EIS usage
in organizations. Details of these main objectives include:
• Improving the design, development, implementation and management of EIS;
• Better education and training of EIS users;
• Improving EIS usage leading to the success of EIS in organizations;
• Better allocation of scarce resources for EIS;
• Further research into EIS usage factors;
• Further research into usage factors for other information systems; and
• Further research into usage factors for information technology.
Chapter 1 of this thesis introduced the background to the research study, the
research problem, the research questions, the conceptual framework upon which
the research study was built, the significance of the study, the delimitations of
scope and key assumptions of the study, and the organization of the thesis.
Chapter 2 presented the review of the relevant EIS literature and critically
examined the research focus on EIS usage and presented six classifications of
EIS usage by research focus. A historical review of the evolution of EIS and the
popularity of EIS were also presented in Chapter 2. Various definitions of EIS
151
were presented to highlight the complex nature of these systems, and the simple
definition to be used in this study was presented. The benefits and characteristics
of EIS, some models of EIS, and the future trends in EIS were also examined and
presented. The nature of executives' work and how EIS fit into their work were
evaluated. Based on the literature review, the research problem and research
questions for the study as restated above were presented.
Conclusions drawn from the literature review were that:
• Technologies in the form of hardware and software were available to meet
the requirements of developing and maintaining a successful EIS;
• There is justification in the literature that system usage is a behavior;
• There were more EIS research studies focusing on technology-related factors
of these systems than on user-related factors; and
• Of the six research focus areas on EIS usage, only one area (factors that
influence/explain system usage) focused on actual engagement of these
systems. Also for most of the studies in this area of actual engagement did
not use appropriate reference theories to address system usage as a behavior.
Chapter 3 presented some theoretical perspectives from which information
systems usages were studied and argued that system usage is a behavior and
should be studied using appropriate reference theories. Triandis' Theoretical
Framework which we considered to be an appropriate reference theory for the
study was described. Based on the theoretical framework and the relevant
152

literature, w e derived and presented the research model and the hypotheses to be
tested in the study. We also detailed factors that we considered influence/explain
behavior in using EIS which we identified in the research model in Figure 3.2.
Finally, we presented EIS research studies based on Triandis' Framework and
their advocacy for the use of this framework as a theoretical foundation for IS
usage research.
In concluding Chapter 3, a summary of the key constructs and the strengths of
Triandis' Theoretical Framework, which were relevant to our study, were
presented as follows:
• Habits, social factors, affect, consequences, and facilitating conditions,
which do influence/explain the behavior of the individual in using an
information system, are exemplified in the theoretical framework;
• The development of personality through the network of habits, social
factors, subjective culture, affect, consequences, and intentions to behave is
exemplified by the theoretical framework;
• Social, cultural, political and organizational factors which do influence
and/or explain the user's behavior in using an EIS, are all addressed by the
theoretical framework;
• Adequate steps and suggestions for the operationalization of the variables
involved are provided and details on this point were presented in Chapter 4.
153
It was noted in Chapter 3 that, without doubt, Triandis' Theoretical Framework
has its weaknesses, one of which is its complexity, and as a result we advised
researchers of the need to identify and adapt an appropriate subset of the whole
framework that would suit their research needs.
Chapter 4 described the research design and the methodology used to collect data
to test the hypotheses and the research model. The research design and
methodology were based on previous studies. The nature of the research, the unit
of analysis, the dimension, the research methodology, and the data collection
attributes and characteristics employed in this study were also presented in this
chapter. The data collection method was elaborated and justified.
In Chapter 4 the conceptualization and operationalization of the constructs and
variables based on the theoretical framework and the research model were
presented. Reliability and validity, which were taken into account in the
conceptualization and operationalization, were described. The questionnaire
design, based on procedures and guidelines from previous studies, was presented.
The pilot survey, the main survey, and the administration of the main survey
were discussed. We drew a conclusion in Chapter 4 that the timing of the
administration of a survey is essential to ensure a good response rate.
In Chapter 5 we presented the data analysis and the results of this study. The
results of the bivariate analysis indicated that 27 of the 36 hypothesized
relationships were supported. Eight of the 9 hypotheses that were not supported
154

concerned the relationships between Habits and Affect variables. The remaining
unsupported hypothesis concerned the relationship between EIS experience and
Internalization of EIS use.
The multiple regression (stepwise) analysis results indicated that Internalization
of EIS use was a more appropriate measure of user behavior than Frequency of
EIS use. About 64 percent of the variance in Internalization of EIS use was
explained by the variables: pace of change of business environment; perceived
usefulness of EIS; ability to use EIS; subjective productive values of EIS; and
subjective norms relating to colleagues. Overall, the results tended to indicate
that Facilitating Conditions were most important in explaining Internalization
of EIS use with pace of change of business environment contributing to this
explanation.
About 45 percent of the variance in Frequency of EIS use was explained by the
variables: ability to use EIS; subjective norms relating to the IS director; EIS
system reliability; Interaction among business units; position of user in the
organization; EIS experience and CBIS experience. Overall, the results tended to
indicate that Habits were most important in explaining Frequency of EIS use
with EIS experience, CBIS experience and ability to use EIS variables
contributing to this explanation.
In this chapter, which is the final chapter of this thesis, discussion of the findings,
implications and conclusions related to the research hypotheses are presented.
155

This is followed by a discussion of the findings, conclusions and implications
related to the research questions. Next are conclusions related to the research
problem. We then present updated versions of the original research model based
on the results of the study and their implications for EIS and IS/technology usage
research. We conclude this chapter with the contributions of this study, the
implications for theory and future research, and the limitations of the study.
The next section presents the findings, implications and conclusions related to the
hypotheses.
156

6.2 Findings, Implications and Conclusions related to the Hypotheses
The hypotheses of this study were postulated as a part of the task of providing
solutions to the research questions and the research problem for the study. These
hypotheses were embedded in the research model in Figure 3.2. The analysis and
test results for the hypotheses were presented in Chapter 5 sections 5.5.1 and
5.5.2 respectively.
This section interprets the hypotheses, discusses the findings from test results for
each of the hypotheses tested and the implications of the findings for EIS
designers/developers, EIS implementers and managers of organizations. The
section ends with an overall conclusion for the hypotheses tested in the study.
6.2.1 Findings and Implications related to the Hypotheses
Hypotheses la, lb, 2a and 2b: Habits and Behavior
Hypotheses la, lb and 2a, 2b tested user Habits and their relationships with user
Behavior in using EIS.
Hypotheses la and lb
Interpretations
Hla and Hlb collectively posited that an executive's number of years of
experience with EIS would lead to a positive Behavior in using EIS. Hla posited
that the more years of experience an executive had with EIS the more Frequently
157

the executive would use an EIS, and Hlb postulated that the more years of
experience an executive had with EIS the more the executive would Internalize
EIS use.
Because the research model assumed the effect of EIS experience on usage to be
both direct and indirect, that is, through Affect in the latter case, partial
correlation coefficients were also calculated. While controlling for all four
Affect variables {satisfaction with EIS information, satisfaction with EIS
features, satisfaction with EIS support and satisfaction with EIS plan) the
correlation between EIS experience and Frequency of EIS use is significant (r =
0.235; p = 0.006) and the correlation between EIS experience and Internalization
of EIS use is non-significant (r = 0.104; p = 0.225).
The results for both the direct and indirect effect of EIS experience on EIS usage
in the study indicated that Hla was supported while Hlb was not supported.
Discussions of Findings about Hla
The support of Hla compares favorably with previous IS studies (Fazio and
Zanna, 1981; Rivard and Huff, 1988; Yaverbaum, 1988; Davis et al., 1989; Levin
and Gordon (1989); Kim, 1996; Jackson et al, 1997; Al-Gahtani and King, 1999;
Elkordy, 2000; Elkordy & Khalil, 2002) and suggest the more experience with
EIS an executive has the more Frequently the executive will use an EIS.
158

The result for Hla however is inconsistent with a similar study by Bergeron et al.
(1995). The reason for this inconsistency may be due to any of the following
three reasons: (1) The different environment in which the two studies were
conducted. This study was conducted across Australia while that of Bergeron et
al. (1995) was conducted in the province of Quebec in Canada; (2) The
difference between the sample sizes involved in the analyses of the two studies is
significant. The sample size in this study is 145 from 255 organizations across
Australia while that for Bergeron et al. (1995) is 33 from 9 enterprises located in
the Quebec province in Canada; (3) This result may suggest a shift in user
behavior from 1995, when Bergeron et al. conducted their study, to 2002 when
this study was conducted. This shift in behavior may be due to advances in
technology and the popularity and spread of EIS to other levels in organizations.
This may also suggest that more and more executives are now using EIS and
getting more EIS experience (Habits) which results into automatic Frequency of
using EIS (Behavior) (Triandis, 1980).
Implications of Hla
The implications of this finding are that, organizations need to aim at giving EIS
users more experience needed, for example, through education and training.
Discussions of Findings about Hlb
The non-support of Hlb in the study was surprising and also did not compare
favorably with a similar study by Bergeron et al. (1995). This study suggests that
159

EIS experience (Habits) leads positively to Frequency of EIS use (Behavior).
One would expect that the more frequently users use EIS the more positively
intensified their behavior would become towards EIS as a result of: their level of
dependence upon these systems; the extent of system ownership felt by them; and
the routinalization of EIS usage (Trice and Treacy, 1988). However, our study
results tend to suggest that EIS users felt EIS did not help them to: accomplish
their usual tasks; identify trends and obtain critical information; make strategic
decisions; and that not using EIS would not disadvantage them in their work.
Implications of Hlb
The implications of these findings are that EIS designers/developers need to
address the issue of tailoring these systems to meet the managerial needs of users.
The findings may also suggest that with advances in technology, the expectation
of EIS users has risen to a higher level than these systems actually deliver. The
implications are that, if EIS are not designed, developed and implemented to
close the expectation gap quickly, then the positive frequency of use aspect of
behavior, as supported by Hla, may deteriorate.
It may be necessary for EIS designers/developers to draw on service quality
models from marketing (e.g., the SERQUAL model of Parasuraman et al. (1985)
and Zeithaml et al. (1988, 1993)) to narrow expectation gaps. This model was
used by Pitt et al. (1995) in their study designed to measure the effectiveness of
information systems. It may also be necessary for EIS designers/developers to
160

ensure that EIS are aligned with the strategic processes of organizations (Chan et
al., 1997; Palmer and Markus, 2000; Potter, 2001; Ditsa, 2001; Ditsa and
MacGregor, 2001; Singh et al., 2002; Boahene and Ditsa, 2003).
Hypotheses 2a and 2b
Interpretations
H2a and H2b collectively posited that an executive's ability to use EIS would
lead to a positive Behavior in using these systems. H2a postulated that the
greater an executive's ability to use EIS the more Frequently the executive would
use these systems. H2b posited that the greater an executive's ability to use EIS
the more the executive would Internalize EIS use.
As the research model assumed the effect of ability to use EIS on usage to be
both direct and indirect, that is, through Affect in the latter case, partial
correlation coefficients were also calculated. Controlling for all four Affect
variables (satisfaction with EIS information, satisfaction with EIS features,
satisfaction with EIS support and satisfaction with EIS plan) the correlation
between ability to use EIS and Frequency of EIS use is significant (r = 0.360; p
= 0.000) and the correlation between ability to use EIS and Internalization of EIS
use is significant (r = 0.353; p = 0.000).
161

Discussions of Findings and Implications ofH2a andH2b
The results for both the direct and indirect effect of ability to use EIS on EIS
usage supported H2a and H2b in this study. These results compare favorably
with similar previous studies on EIS usage (Kim, 1996; Elkordy, 2000; Elkordy
and Khalil, 2002). The results suggest that an increase in an executive's ability
to use EIS leads to a positive Behavior to use these systems.
The implications of these results are that organizations need to aim at giving
users the capabilities needed to use these systems, for example, through
education and training on the systems.
Hypotheses 3, 4, 5,6, 7 and 8: Habits, Affect and Behavior
Hypotheses 3a, 3b, 3c, 3d, 4a, 4b, 4c and 4d tested user Habits and their
relationships with Affect, while H5a, H5b, H6a, H6b, H7a, H7b, H8a, and H8b
tested the relationships between Affect and Behavior to find the mediating effect
of Affect on using EIS.
Hypotheses 3 and 4: Habits and Affect
Interpretations ofH3 andH4
Hypotheses 3a, 3b, 3c, and 3d postulated that the more EIS experience an
executive has, the more satisfied the executive will be with information from an
EIS, the EIS features, the EIS support and the EIS plan respectively.
162

Hypotheses 4a, 4b, 4c, and 4d posited that the greater an executive's ability to
use EIS the more satisfied the executive will be with information from an EIS,
the EIS features, the EIS support and the EIS plan respectively.
Discussions of Findings about H3
The results of the study did not support any of the four hypothesized
relationships between EIS experience and Affect. The result for H3a compared
favorably with that of Bergeron et al. (1995) in a similar study. Bergeron et al.
(1995) however found a negative relationship between EIS experience and EIS
support (H3c) which they indicated "may appear counter-intuitive".
The results for H3a, H3b, H3c and H3d also compared favorably with those of
Hla and Hlb above where the results of both the direct and indirect effect of EIS
experience on EIS usage were the same. These results may suggest Affect has no
mediating effect on executives' EIS experience and EIS usage.
Discussions of Findings about H4
Apart from the significant relationship between ability to use EIS and satisfaction
with EIS features, the results overall did not support the hypothesized
relationships between ability to use EIS and Affect. These results compare
favorably with those of H2a and H2b above where the results of both the direct
and indirect effect of ability to use EIS on EIS usage were the same. These
163
results may suggest Affect has no mediating effect on executives' ability to use
EIS and EIS usage.
Overall, the results suggest there is no significant relationship between Habits
and Affect The implications of the findings for H3 and H4 are discussed at the
end of the next sub-section.
Hypotheses 5, 6, 7 and 8: Affect and Behavior
Interpretations and Discussions of Findings about H5, H6, H7 andH8
Hypotheses 5a, 5b, 6a, 6b, 7a, 7b, 8a and 8b posited that executives' satisfaction
with information from EIS, EIS features, EIS support and the EIS plan would
positively impact on an executives' Frequency of using EIS and their
Internalization of using EIS respectively.
H5a, H5b, H6a, H6b, H7a, H8a and H8b were supported in the study. H7b, the
hypothesized relationship between satisfaction with EIS support and
Internalization of EIS use, was not supported. The results overall compare
favorably with previous IS research (Amoako-Gyampah and White, 1993;
Thompson et al. 1994; Bergeron et al; 1995; Elkordy, 2000; Elkordy and Khalil,
2002) and suggest there is a positive relationship between Affect and Behavior.
164
Implications ofH3, H4, H5, H6, H7 andH8
The findings for the relationships between Habits and Affect, and that of Affect
and Behavior suggest that while Affect has no mediating effect on EIS usage, it
has direct effect on EIS usage. The implications of these findings are that while
habitually Affect may not have any effect on EIS usage in short term, in the long
term it may have effect on system usage. Therefore EIS designers/developers
need to aim at getting the Affect for EIS right at the beginning or as soon as
possible in order to avoid the non-usage of these systems in the long run.
Hypotheses 9a and 9b: Consequences and Behavior
Interpretations and Discussions of Findings about H9
H9a and H9b tested the impact of an executive's perceived usefulness of EIS on
the executive's Behavior to use EIS. H9a postulated that the more an executive
perceived the usefulness of an EIS the more Frequently the executive would use
these systems, and for H9b, the more an executive perceived an EIS to be useful
the more die executive would Internalize the use of these systems.
The test results in the study supported both hypotheses. The results compare
favorably with those from previous IS studies (Davis, 1989, 1993; Davis et al.,
1989,1992; Thompson et al, 1991, 1994, Taylor and Todd, 1995; Venkatesh and
Davis, 1996; Venkatesh, 1999; Venkatesh and Morris, 2000; Elkordy, 2000;
Elkordy and Khalil, 2002).
165
These results were expected and suggest that EIS users expect these systems to:
increase their organization's performance; provide their organizations with a
competitive advantage; provide greater level of control over their managerial
activities; provide information that will allow problems to be detected; improve
the quality of decision-making in their organizations; and increase the speed of
decision-making in their organizations.
Implications ofH9
The findings implied that EIS usage might decrease if these user expectations are
not met. EIS designers/developers therefore need to aim at meeting these
expectations. As mentioned previously, drawing on service quality models from
marketing may be necessary to narrow the expectation gaps. It may also be
necessary to ensure that these systems are in alignment with the strategic
objectives of the organizations.
Hypotheses 10,11,12 and 13: Social Factors and Behavior
Interpretations and Discussions of Findings about HI 0, Hll, HI 2 and HI 3
Hypotheses 10a, 10b, 11a, lib, 12a, 12b, 13a and 13b collectively contended that
Social Factors in the workplace will positively impact on an executive's
Behavior to use EIS. Some of the Social Factors in this study are cultural and
political.
166
HlOa postulated that subjective norms in the workplace will positively impact on
an executive to Frequently use EIS, and HI Ob posited that subjective norms in
the workplace will positively impact on an executive to Internalize EIS use.
HI la posited that subjective roles in the workplace will positively impact on an
executive to Frequently use EIS, and HI lb posited that subjective roles in the
workplace will positively impact on an executive to Internalize EIS use.
H12a posited that subjective values associated with EIS will positively impact on
an executive to Frequently use EIS, and HI2b posited that subjective values
associated with EIS will positively impact on an executive to Internalize EIS use.
Finally, HI3a postulated that social situations in the workplace will positively
impact on an executive to Frequently use EIS, and HI 3b posited that social
situations in the workplace will positively impact on an executive to Internalize
EIS use.
The results in the study supported all of these eight hypotheses. The results
compare favorably with previous IS studies (Thompson et al., 1991, 1994; Taylor
and Todd, 1995; Venkatesh and Davis, 1996; Venkatesh, 1999; Venkatesh &
Morris, 2000; Elkordy, 2000; Elkordy and Khalil, 2002) and suggest Social
Factors in the workplace positively impact on the Behavior of executives to use
EIS.
167
Implications ofHIO, Hll, HI2 and HI3
These findings have implications for EIS designers/developers, EIS
implementers, and managers of organizations. EIS designers/developers need to
ensure that user perceived values of EIS, such as the productive, efficient and
effective values of EIS are incorporated into the design, and the development of
these systems through user involvement and participation. Other reasons for user
involvement and participation are to facilitate implementation and to ensure
follow-ups, overcome resistance, ensure acceptance, avoid conflicts and ensure
continuous resources/support (Nandhakumar and Jones, 1997). Top management
involvement and participation will also be necessary in order for designers /
developers to see the big picture envisaged by managers for these systems.
EIS implementers should understand the social working relationships between
users and others in the organization as these relationships may influence/explain
their subjective norms, subjective roles and subjective values. With these
understandings, EIS implementers will be able to ensure that these systems will
be accepted and used. Top management involvement and participation may also
assist in identifying these social working relationships. In addition, the formation
of user groups in the functional areas and the identification of powerful users
may also be helpful.
168

Finally, managers of organizations need to be proactively involved and
participate in designing, developing, implementing and managing EIS in order to
ensure positive user behavior towards using these systems, which will eventually
lead to the success of the systems in their organizations.
Hypotheses 14,15 and 16: Facilitating Conditions and Behavior
Interpretations and Discussions of Findings about HI 4, HI 5, and HI 6
Hypotheses 14a, 14b, 15a, 15b, 16a and 16b collectively postulated that
Facilitating Conditions in the workplace will positively impact on an
executive's Behavior to use EIS.
H14a posited that EIS development processes will positively impact on an
executive to Frequently use EIS, and HI4b posited that EIS development
processes will positively impact on an executive to Internalize EIS use. HI 5a
posited that EIS management processes will positively impact on an executive to
Frequently use EIS, and HI 5b contended that EIS management processes will
positively impact on an executive to Internalize EIS use. HI6a postulated that
the organizational environment will positively impact on an executive to
Frequently use EIS, while HI6b posited that the organizational environment will
positively impact on an executive to Internalize EIS use.
The test results in the study supported all the six hypotheses. The results
compare favorably with previous IS studies (Volonino et al., 1995; McBride,
169

1997; Nandhakumar and Jones, 1997; Elkordy, 2000; Elkordy and Khalil, 2002)
and suggest Facilitating Conditions in the workplace positively impact on the
Behavior of executives to use EIS.
These results were expected and suggest that aspects of an organization such as
culture, pace of changing business environment, interactions among business
units, power and politics, and the commitment of the organization to EIS will
encourage EIS users to use these systems. Aspects of the EIS development
processes such as executive sponsorship of EIS, user involvement and
participation, availability of technical support and other resources, the use of an
EIS development plan, and follow-ups made after EIS implementation will
encourage EIS users to use these systems. As well, aspects of EIS management
processes such as EIS management policies rules, data management, availability
of support, and the availability and accessibility of these systems will encourage
the users to use the systems.
Implications ofH14, H15, andH16
These findings have implications for EIS designers / developers, EIS
implementers, and managers of organizations. EIS designers/developers need to
ensure user involvement and participation in the development processes. They
also need to ensure an organization's commitment and executive sponsorship.
EIS designers/developers need to understand the culture of the organizations, the
170

changing pace of the business environment, the interactions among business units
and the power and politics within the organizations.
Political resistance to EIS, for example, is one of the most common causes of
development failures. Because an EIS can alter the information flow in an
organization and shift the power relationships within a company, there may be
resistance to the introduction and operation of the systems. Anticipating and
managing the political ramifications of an EIS will remain a potential problem
throughout the life of the systems, however, overcoming the political resistance
is critical not only to the successful EIS development, but also to the EIS
utilization after deployment.
EIS implementers need to ensure that: they use development plans which are
futuristic and available to users; there are adequate data management processes in
place; the systems are available and accessible most of the time; adequate
technical support and other resources are available to guarantee the ongoing use
of these systems. EIS implementers also need to understand the culture of the
organizations, the changing pace of the business environment, the interactions
among business units and the power and politics within the organizations. They
need to ensure user involvement and participation, and the organization's
commitment and executive sponsorship in the implementation processes. EIS
implementers need to ensure that follow-ups are made after the implementation
of these systems.
171
Finally, managers of organizations need to be proactively involved and
participate in the designing, development, implementation and management of
these systems in their organizations by providing the needed human and material
resources which EIS designers/developers and implementers need in order to
ensure positive user behavior towards using these systems.
6.2.2 Conclusions related to the Research Hypotheses
In summary, the results and the findings concerning the research hypotheses
indicate that overall all the hypotheses were supported except the hypothesized
relationships between Habits and Affect. The findings and their implications for
EIS designers/developers, EIS implementers and managers of organizations to
improve EIS usage have been presented in this section.
The results and findings also have implications for EIS researchers in particular
and IS researchers in general. EIS researchers can apply the research model used
for this study by modifying constructs and variables in order to study other
relationships that may impact on behavior to use EIS and other information
systems.
The next section presents the findings, conclusions and implications about the
research questions.
172

6.3 Findings, Conclusions and Implications related to the Research
Questions
The analyses and results addressing the research questions were presented in
Chapter 5 section 5.5.3. This section presents the findings and conclusions from
the test results and their implications for EIS designers/developers, EIS
implementers and managers of organizations to improve EIS usage in
organizations.
6.3.1 Findings related to the Research Questions
Stepwise regression analyses were performed on the data collected for the study
in order to provide answers to the research questions. The best stepwise
regression models selected to address the research questions were presented in
Table 5.8 and Table 5.9 in Chapter 5 for Frequency of EIS use and
Internalization of EIS use respectively.
The results of the multiple regression analysis indicate that Internalization of EIS
use is a more appropriate measure of user Behavior than Frequency of EIS use.
About 64 percent of the variance in Internalization of EIS use is explained by the
variables: pace of change of business environment; perceived usefulness of EIS;
ability to use EIS; subjective productive values of EIS and subjective norms
relating to colleagues. Overall, the results indicate that Facilitating Conditions
are the most important in explaining Internalization of EIS use with pace of
change of business environment contributing to this explanation. Consequences,
173

Habits and Social Factors follow Facilitating Conditions in decreasing order of
importance in explaining the Internalization of EIS use.
About 45 percent of the variance in Frequency of EIS use is explained by the
variables: ability to use EIS; subjective norms relating to the IS director; EIS
system reliability; interaction among business units; position of user in the
organization; EIS experience and CBIS experience. Overall, the results indicate
that Habits are the most important in explaining Frequency of EIS use with EIS
experience, CBIS experience and ability to use EIS variables contributing to this
explanation. Social Factors, Affect and Facilitating Conditions follow Habits
in decreasing order of importance in explaining Frequency of EIS use.
The results indicate position of EIS user and CBIS experience, which were not
included in the research model but only in the survey questionnaire, entered the
regression model for explaining Frequency of EIS use.
6.3.2 Conclusions related to the Research Questions
In summary, the results suggest that Internalization of EIS use was a more
important measure of user Behavior in using EIS than Frequency of EIS use.
The contributions from both Internalization of EIS use and Frequency of EIS use
in explaining user Behavior in using EIS were however quite significant. Both
Internalization of EIS use and Frequency of EIS use aspects of behavior therefore
174

need to be considered when deciding on the design, development,
implementation and use of EIS in organizations.
Based on the analysis of the results of the study, organizational factors
constitute the most important factors in explaining executives' Behavior in using
EIS. This is followed in decreasing order of importance by social, cultural and
political factors.
6.3.3 Implications related to the Research Questions
The implications of these findings and conclusions are that, organizations need to
play a leading role in influencing the behavior of EIS users towards an increased
usage of EIS. Organizations can achieve this by their managers being
proactively involved and participatory in the design, development,
implementation and management of these systems. Managers need to provide
the necessary material and human resources which designers/developers and
implementers need in order to ensure positive user behavior towards using these
systems.
The next section presents conclusions related to the research problem.
175
6.4 Conclusions related to the Research Problem
The research problem to be solved by this study is the failure of executive
information systems in organizations due to the underutilization or non-usage
of these systems. The findings, conclusions and implications about the research
hypotheses and the research questions which provided part of the solution to the
research problem were discussed in sections 6.2 and 6.3.
Based on the findings presented in those sections, the overall conclusion that can
be drawn from this study is that:
• Social, cultural, political and organizational factors represent important
variables that explain the Behavior of executives in using EIS and therefore
can influence failures of EIS in organizations due to underutilization or
non-usage of these systems. Their importance from most influential to least
influential is: organizational, social, cultural and political factors.
The next section presents a modified version of the research model based on the
results of the study.
176

6.5 A Modified Version of the Research Model
Based on the results and the findings, the research model in Figure 3.2 is
modified to include CBIS experience and Position of user as shown in Figure 6.1.
Figure 6.1 could be used as a research model for further study on EIS usage.
Figure 6.1 is therefore accordingly labeled as the EIS Usage Model (EISUM).
HABITS
SOCIAL F A C T O R S
Subjective norms
Subjective roles
Subjective values
Social situations
Position of user
FACILITATING CONDITIONS
EIS development processes
EIS management processes
Organizational environment
CBIS Experience
EIS Experience
Ability to use EIS
APFECT CONSEQUENCES
Satisfaction with information
Satisfaction with EIS system
Satisfaction with EIS support
Satisfaction with EIS plan
Perceived usefulness of EIS
B E H A V I O R
Frequency of EIS use
Internalization of EIS use
Figure 6.1: EIS Usage Model (EISUM)
E I S U M could be adapted to represent a research model for the study of other
information systems/technology usage.
177
The remaining sections of this chapter summarize the contributions of this study,
the limitations of the study and their implications for further research, and the
implications of the study for theory.
178

6.6 Contributions of the Study
The contributions of this study are threefold, namely: theoretical, methodological
and practical/managerial.
Theoretically, the study confirmed Triandis' Framework is an appropriate
reference theory to study EIS usage. The study confirmed the framework
explicitly addresses the social, cultural, political and organizational factors that
influence/explain user Behavior to use EIS.
Methodologically, the approach for studying EIS usage as a behavior using
Triandis' Framework has been enhanced from previous studies. The theoretical
framework and the methodology used in this study can also be applied to
investigate factors explaining user behavior in using other information
systems/technologies. A model for further studies in EIS usage as well as other
information systems/technology usage was derived from the research model and
presented in Figure 6.1.
Practically/managerially, the findings of the study have implications for the
design, development, implementation and management of EIS in organizations.
EIS designers/developers and EIS implementers need to be aware of the Social,
Affect, Consequences and Facilitating Conditions factors that affect the
behavior of EIS users. The results of the study indicated that, theoretically, both
Internalization of EIS use and Frequency of EIS use significantly influence to
179

Behavior towards using EIS. The results indicate Internalization of EIS use is a
more appropriate measure of user behavior than Frequency of EIS use. This
suggests that organizations can improve EIS usage by providing the appropriate
user education and training aimed at increasing Internalization and Frequency of
EIS usage and by appropriately allocating the organizations' resources.
In summary, the results and findings of this study suggest reduction EIS failures
in organizations could be achieved by addressing the users' behavior towards
using the systems. From the results of this study, the following actions could be
taken to improve users' behavior (internalization and frequency of use) towards
the systems:
• Increasing the experience and ability of the users. This could be achieved,
for example, through education and training, and user involvement and
participation in the development and implementation of the systems.
• Increasing the perceived usefulness of EIS. This could be achieved through
the development of an EIS that aims at:
• Increasing organization's performance
• Providing an organization with a competitive advantage
• Allowing users to accomplish their usual tasks
• Helping users to identify trends and obtain critical information
• Providing information that allows problems to be detected
• Improving the quality of decision-making in an organization
• Increasing the speed of decision-making in an organization
• Providing greater level of control of managerial activities.
180
• Improving the social conditions under which the systems are used. This
could be achieved through education and training to provide the norms that
urge users to use the systems, system policies relating to the values of the
systems and the expectations from users, formation of user groups in
functional areas to foster social working relationship among the users, and a
positive top management involvement of.
• Improving the following aspects of organizations for positive user behavior:
• Organizational culture that encourages users to use the systems
• Education on the pace of changing business environment
• Awareness of interaction among business units
• Power and politics of organizations should be favorably to EIS use
• Total commitment of organizations to the systems.
• Improving the following aspects of EIS development process:
• Executive sponsorship of the EIS development process
• Involvement and participation of users in the process
• Availability of technical and other resources
• The use of development plans
• Regular follow-ups after implementation of the systems.
• Improving the following aspects of EIS management process:
• Management policies and rules relating to the systems
• The management of data for the systems
• Availability of support for the systems
• Availability and accessibility of the systems.
181

• Improving user affect for EIS through developing an EIS that:
• Available, reliable, effective, flexible, easy-to-use and fast
• Provides information that is available, reliable, accurate, timely,
precise, adequate and meaningful
• Has support services that are adequate, relevant, provided within an
acceptable time and provided with a positive attitude
• Has development plan that is available, reliable, complete, flexible,
attainable and futurist.
Overall, the above suggestions and actions suggested would lead to:
• Improving the design, development and implementation of EIS;
• Better education and training for EIS users;
• EIS usage leading to the success of the systems in organizations;
• Better allocation of resources for EIS; and
• Better management of EIS in organizations.
6.7 Implications for Theory and Future Research
IS research studies have been criticized for a lack of theoretical bases and
insufficient attention to methodological and measurement issues when IS
researchers study individual's reaction to information systems/technology. IS
researchers have been criticized for generally not drawing on other disciplines in
their work and these shortcomings have been argued as explanations for the
conflicting results that have been obtained in many studies (Swanson, 1982;
182

Goodhue, 1988; Straub, 1989). In view of these criticisms and a careful review
of the theoretical perspectives used in previous IS studies, this study considered
and used Triandis' Theoretical Framework to study EIS usage in organizations.
The results of this study indicate that Triandis' Theoretical Framework is an
appropriate reference theory for studying system usage as a behavior.
For IS researchers, the opportunity exists to adapt the model tested in this study
by adding or deleting constructs proposed by Triandis (1980), for example,
adding intentions and relevant arousal (motivation). Another way to build on this
research would be to adapt the model and the approach to different actors,
contexts and objects. For example, it would be useful to adapt the measures in
the context of IS developers using CASE tools.
Finally, this study presented a model, EISUM (see Figure 6.1), which can be
applied by researchers to further investigate EIS and other IS/technology usage in
organizations.
6.8 Limitations and Implications for Further Research
This research study was motivated by reports of EIS failures in organizations.
The study has produced results and findings that have implications for practice
and research. The practical implications may lead to an improvement in the
usage of EIS in organizations and reduce the failure rate of these systems. The
research implications provide a way forward for further studies into EIS usage
183

and other IS/technology usage in organizations. There are, however, certain
limitations and weaknesses of this study.
First, the database purchased purposely for the study could not highlight the level
of sophistication and types of EIS in the organizations surveyed. This might
mean that some of the respondents might not have been using systems at the level
of the EIS expected in the study. Despite this, the findings have implications for
EIS and other information systems/technologies in the workplace. Future
research should therefore include questions about the level of sophistication and
types of EIS in the organizations.
Second, although necessary steps were taken in designing the survey
questionnaire to ensure accurate responses, it is difficult to guarantee that all
responses were as accurate as hoped. In addition, in an attempt to get a good
response rate, all the questions in the survey questionnaire were closed-ended.
Although the gross response rate for the study was 37.14 percent, only a net
response of 20.57 percent was usable. Despite the 20.57 percent response rate
being respectable compared with other studies, it indicates some respondents did
not treat the questionnaires with the attention we sought. This is a general
problem for any research of this kind. However, future research studies should
take steps in the design and administration of survey questionnaires to minimize
unusable responses.
184

Third, due to time and resource constraints, the study adopted a cross-sectional
study approach. Since cross-sectional studies address issues at only one point in
time, they do not capture the complex interrelationships between variables that
come into effect over time. Although this study sought to explain behavior but
not to predict it, a longitudinal study may be more appropriate to capture such
complex details. Future research should therefore adopt a longitudinal study
approach and include open-ended questions in the data collections.
Fourth, the results of this study indicate that Position of user and CBIS
experience, which were not included in the research model but only in the survey
questionnaire, turned out to be among the variables that explained the Frequency
of EIS use. Future studies should therefore aim at including more variables in the
research model that may assist in explaining the variance in the user behavior.
Fifth, this research was carried out in an Australian context. Future researchers
should consider cross-cultural investigations in order to improve the
external/international validity of the findings of this study.
185

REFERENCES
Adamopoulos, J. (1976). Perceptual dimensions of the social environment.
Unpublished M.A. Thesis, University of Illinois.
Adams, D. A., Nelson, R. R. and Todd, P. A. (1992) Perceived Usefulness, Ease
of Use, and Usage of Information Technology: A Replication MIS
Quarterly, 16(2), 227-247.
Anderson, R.H. and Epstein, M.J. (1996). The Usefulness of Corporate Annual
Reports to Shareholders in Australia, New Zealand, and the United States:
An International Comparison, JAI Press Inc.
Ajzen, I. andFishbein, M. (1980). Understanding Attitudes and Predicting Social
Behavior, Prentice-Hall.
Al-Gahtani, S.S. and King, M. (1999). Attitudes, satisfaction and usage: factors
contributing to each in the acceptance of information technology, Behavior
& Information Technology, Vol. 18, No. 4, pp. 277-297.
Amoako-Gyampah, K. and White, K.B. (1993). User involvement and user
satisfaction, Information & Management, 25,1-10.
Anthony, R.N. (1965). Planning and Control System: A framework of Analysis,
Harvard University Press.
Arndt, S., Feltes, J. and Hanak, J. (1983). Secretarial Attitudes towards Word
Processors as a Function of Familarity and Locus Control, Behaviour and
Information Technology, Vol. 2, No. 1, pp. 17-22.
Babbie, E. (2001). The Practice of Social Research, 9th edn, Wadsworth.
186

Bajwa, D.S., Rai, A. and Brennan, I. (1998). Key antecedents of Executive
Information System success: a path analytic approach. Decision Support
Systems, 22 31-43.
Bandura, A. (1977). Self-Efficacy: Toward a Unifying Theory of Behavioral
Change, Psychological Review, Vol. 84, No. 2, pp. 191-215.
Bandura, A. (1982). Self-Efficacy Mechanism in Human Agency, American
Psychologist, Vol. 37, No. 2, pp. 122-147.
Bandura, A. (1986). Social Foundations of Thought and Action, Prentice-Hall.
Bandura, A., Adams, N.E. and Beyer, J.C. (1977). Cognitive Processes
Mediating Behavioral Change, Journal of Personality and Social
Psychology, Vol. 35, No. 3, pp. 125-139.
Bandura, A. and Schunk, D. (1981). Cultivating Competence, Self-Efficacy, and
Intrinsic Interest through Proximal self-Motivation, Journal of Personality
and Social Psychology, Vol. 41, No. 3, pp. 586-598.
Bashein, B.J. and Markus, M.L. (2000). Data Warehouses: More than just
mining, Financial Executives Research Foundations, Inc.
Bergeron, F., Raymond, L. and Lagorge, M. (1991). Top Managers Evaluate the
Attributes of EIS, DSS-91 Transactions, (Ilze Zigur edition), 6-14.
Bergeron, F., Raymond, L., Rivard, S. and Gara, M (1995). Determinants of EIS
use: Testing a behavioral model, Decision Support Systems, 14 131-146.
Beynon-Davies, P. (1995) Information systems 'failure': The case of the London
Ambulance Service's Computer Aided Dispatch Project, European Journal
of Information Systems, 4, 171-184.
187

Bidgoli, H. (1997). Modern Information Systems for Managers. Academic Press,
Harcourt Brace and Co.
Bidgoli, H. (1998). Intelligent management support systems, Quorum Books.
Bladder, F., Crump, N., and McDonald, S. (1999). Managing experts and
competing through innovation: an activity theoretical analysis,
Organization, 6, 1, 5-31.
Blau, P.M. (1964). Exchange and Power in Social Life, John Wiley and Sons.
Boahene, M. and Ditsa, G. (2003) "Information Systems Strategy: Principles and
Practice". In M. Khosrow-Pour (edn), Information Technology and
Organizations: Trends, Issues, Challenges and Solutions, 2003 Information
Resources Management Association International Conference, Philadelphia,
PA, USA, May 18-21, 2003. Hershey, PA: Idea Group Publishing.
Broadbent, M. (2002). Creating Effective IT Governance, Keynote Address at
the 2002 Australasian Conference on Information Systems (ACIS),
Melbourne, Dec. 3-6, 2002.
Byun, D-H. and Suh, E-H. (1994). A Builder's Introduction to Executive
Information Systems, International Journal of Information Management,
Vol. 14, pp. 357-368.
Carisson, S.A. and Widmeyer, G.A. (1990). Towards a Theory of Executive
Information Systems, HICSS-23 Proceedings, Kailua-Kona, Hawaii, USA,
January 2-5, 1990.
Carlson, P.J. and Davis, G.B. (1998). An investigation of media selection among
director and managers: From "self to "other" orientation, MIS Quarterly,
22(3), 335-362.
188

Carmines, E.G. and Zellers, R.A. (1979). Reliability and Validity Assessment,
Sage Publications.
Carte, T.A. (1999). The Impact of "Publicness" on Executive Information
Systems Development (Organizational Theory, Systems Development).
Doctoral Dissertation, University of Georgia, Georgia.
Chan, Y.E, Huff, S.L, Barclay, D.W. and Copeland, D.G. (1997). Business
Strategic Orientation, Information Systems Strategic Orientation, and
Strategic Alignment, Information Systems Research, Vol. 8, No. 2, pp. 125-
150.
Choo, C.H. (1998). The Knowing Organization: How Organizations Use
Information to Construct Meaning, Create Knowledge, and Make
Decisions, Oxford University Press.
Compeau, D.R. & Higgins, CA. (1995a). Computer self-efficacy: Development
of a measure and initial test. MIS Quarterly, 19(2), 189-211.
Compeau, D.R. & Higgins, CA. (1995b). Application of social cognitive theory
to training for computer skills. Information Systems Research, 6(2), 118-
143.
Compeau, D.R. and Meister, D.B. (1997). Measurement of perceived
characteristics of innovating: A reconsideration based on three empirical
studies. Presented at a workshop of the Diffusion Interest Group on
Information Technology, Atlanta, GA, December 13,1997.
189

Compeau, D., Higgins, C A . and Huff, S. (1999). Social cognitive theory and
individual reactions to computing technology: A longitudinal study, MIS
Quarterly, 23(2), 145-158.
Cook, T.D. and Campbell, D.T. (1979). Quasi-Experimentation: Design and
Analysis Issues for Field Settings, Houghton Mifflin Co., Boston MA.
Cooper, D.R. and Emory, C.W. (1995). Business Research Methods, 5th edn,
Irwin.
Currie, W. (1995) Management Strategies for IT. An International Perspective,
Pitman, London.
Daft, R. and Lengel, R. (1986). Organizational information requirements, media
richness, and structural design, Management Science, 32, 554-571.
Davis, D. (1996). Business Research for Decision Making, 4th edn, Duxbury
Press.
Davis, F.D. (1989). Perceived usefulness, perceived ease of use, and user
acceptance of information technology. MIS Quarterly, 13(3), 319-340.
Davis, F.D., Bagozzi, R.P., and Warshaw, P.R. (1989). User acceptance of
Computer Technology: A Comparison of two theoretical models.
Management Science, 35(8), 982-1003.
Davis, G.B., Lee, A.S., Nickles, K.R., Chatterjee, S., Hartung, R. and Wu, Y.
(1992). Diagnosis of an Information System Failure: A Framework and
Interpretive Process, Information & Management, 23(5), 293-318.
DeLone, W.H. (1988). Determinants of Success for Computer Usage in Small
Business, MIS Quarterly, Vol. 12, No. l,pp. 51-61.
190

Dillman, D.A. (1978). Mail and Telephone Surveys - The Total Design Method,
John Wiley and Sons.
Dillman, D.A. (2000). Mail and Internet Surveys - The Tailored Design Method,
2nd edn, John Wiley and Sons.
Ditsa, G.E.M. (2001). Tailoring Software Development Processes Along TQM
Concepts: A Way to Narrow User Perceived Expectations Gap for
Information Systems In N. G. Shaw (Ed.), Strategies for Managing
Computer Software Upgrades (pp. 136-146), Hershey, PA: Idea Group
Publishing.
Ditsa, G.E.M. (2003). Activity Theory: A Potential for Information Systems
Research Framework, in G. Ditsa (edn), Information Management: Support
Systems & Multimedia Technology, Hershey, PA: IRM Press.
Ditsa, G.E.M. and MacGregor R.C. (2001) Our Mousetrap's Fine: So Why
Aren't The Punters Beating A Path To Our Door? In N. G. Shaw (edn),
Strategies for Managing Computer Software Upgrades (pp. 78-94),
Hershey, PA: Idea Group Publishing.
Dobrzeniecki, A. (1994). HT Research Institute, Executive Information Systems,
January 1994, http://mtiac. iitri. org/pubs/eis/eis. htm
Elam, J.J. and Leidner, D.G. (1995). EIS adoption, use, and impact: the executive
perspective. Decision Support Systems, 14(2) 89-103.
Elkordy, M.M. (2000). An Integrated Model of EIS Use, in Proceedings of 2000
Information Resources Management Association International Conference,
Anchorage, Alaska, USA, 624-627.
191

Elkordy, M.M. and Khalil, O.E.M. (2002). EIS Information: Use and Quality
Determinants, in Proceedings of 2002 IRMA International Conference,
Seattle, USA, 1156-1157.
Engestrom, Y. (1999) Activity theory and individual and social transformation
in Y. Engestrom, R. Miettinen, and R.-L. Punamaki-Gitai (edn),
Perspectives on activity theory, Cambridge University Press, New York,
19-38.
Engestrom, Y., and Escalante, V. (1996) Mundane tool or object of affection?
The Rise and Fall of the Postal Buddy, in B.A. Nardi (edn), Context and
consciousness: activity theory and human-computer interaction, The MIT
Press, Cambridge, MA, 325-37'4.
Fazio, R.H. and Zanna, M.P. (1981). Direct Experience and Attitude-Behavior
Consistency, Advances in Experimental Social Psychology, Vol. 14, pp.
161-202.
Fishbein, M., and Ajzen, I. (1975). Belief Attitude, Intention and Behavior: An
introduction to Theory and Research, Addison-Wesley.
Frolick, M. & Robichaux, B.P. (1995). EIS information requirements
determination: Using a group support system to enhance the strategic
business objectives method, Decision Support Systems, 14, 157-170.
Frolick, M. N., Parzinger, M. J., Rainer, R. K., Jr., and Ramarapu, N. K. (1997).
Using EISs for Environmental Scanning, Information Systems in
Management, 14(1), 35-40.
192

Fuerst, W.L. and Cheney, P.H. (1982). Factors Affecting the Perceived
Utilization of Computer-Based Decision Support Systems in the Oil
Industry, Decision Science, Vol. 13, No. 4, pp. 554-569.
Glover, H. Watson, H.J. and Rainer, K. (1992). 20 Ways to waste an EIS
investment. Information Strategy: The Executive's Journal, Vol. 8 Part 2,
Winter 11-17.
Goodhue, D. (1988). IS attitudes: toward theoretical and definition clarity. Data
Base, 19, 3/4, pp. 6-15.
Hair, J.F., Jr., Anderson, R.E., Tatham, R.L., and Black, W.C (1995).
Multivariate Data Analysis with Readings, 4 edn, Prentice Hall.
Handzic, M. (1997). The impact of information reliability on utilization and
effectiveness of executive information systems, in the Proceedings of the 8*
Australasian Conference on Information Systems.
Hill, T., Smith, N.D., & Mann, M.F. (1986). Communicating innovations:
Convincing computer phobics to adopt innovative technologies, in RJ. Lutz
(edn), Advances in Consumer Research, 13, 419-422. Provo, UT:
Association for Consumer Research.
Hill, T., Smith, N.D., & Mann, M.F. (1987). Role of efficacy expectations in
predicting the decision to use advanced technologies: The case of
computers. Journal of Applied Psychology, 72(2) 307-313.
Homans, G.C. (1961). Social Behavior: Its Elementary Forms, Harcourt, Brace
and World.
193
Homans, G.C (1974). Social Behavior: Its Elementary Forms, Revised Edition,
Harcourt, Brace and World.
Houdeshel, G. and Watson, H.J. (1987). The management information and
decision support (MIDS) system at Lockheed-Georgia, MIS Quarterly, 10,
127-140.
Hoven, J. (1996). Executive Support Systems, Journal of Systems Management,
March/April 1996, 48-55.
Howard, G.S. (1986). Computer Anxiety and the Use of Microcomputers in
Management, UMI Research Press.
Huck, S.W., Cormier, W.H., and Bounds, W.G., Jr. (1974). Reading Statistics
and Research, Harper & Row.
Jackson, CM., Chow, S. and Leitch, R.A. (1997). Toward an understanding of
the behavioral intention to use an information system, Decision Science,
Vol. 28, Iss. 2, pp. 357-389.
Jackson, E.E. and Schuyler, N.B. (1984). Practice makes perfect? Skills gained
in seven years of questionnaires. Paper presented at the annual meeting of
the American Education Research Association, San Francisco.
Johansen, R. and Swigart, R. (1996). Upsizing the individual in the downsized
organization: managing the wake of reengineering, globalization, and
overwhelming technological change, Addison-Wesley.
Kelly, J.N. (1998). Executive Information Systems, Patricia Seybold's Office
Computing Report, 11(2).
194

Kerlinger, F.N. (1986). Foundations of Behavioral Research, 3rd edn, Holt
Rinehart & Winston.
Kim, J. (1996). An Empirical Investigation of Factors Influencing the Utilization
of Executive Information Systems, Doctoral Dissertation, University of
Nebraska.
Kirkgoeze R., Kurz A., Reiterer, H. and Tjoa, A.M. (1997) The Relevance of
Meta Modelling and Data Warehaouse for Executive Information Systems,
Proceedings of Information and Communication Technologies in Tourism
1997, Springer Verlag, Edinburgh, Scotland.
Kohn, M.L. (1969). Class and Conformity: A Study in Values, The Dorsey Press.
Kuhn, T.S. (1970). The Structure of Scientific Revolutions, 2nd edn, The
University of Chicago Press.
Kumar, A. and Palvia, P. (2001). Key data management issues in a global
executive information system, Industrial Management and Data Systems,
101(4), 153 -164.
Kuutti, K. (1996). "Activity Theory as a Potential Framework for Human-
Computer Interaction Research" in Bonnie Nardi (edn) Context and
Consciousness: Activity Theory and Human-Computer Interaction, The
MIT Press, 17-44.
Kuutti, K. (1999) Activity theory, transformation of work, and information
systems design in Y. Engestrom, R. Miettinen, and R. Miettinen and R.L.
Punamaki-Gitai (edn), Perspectives on activity theory, Cambridge
University Press, 360-376.
195
Leidner, D.G. and Elam, J.J. (1994a). Executive Information Systems: Their
Impact on Executive Decision making. Journal of MIS, Winter 1993 - 94,
139-155.
Leidner, D.G. and Elam, J.J. (1994b). Senior and Middle Management Use of
EIS: A Descriptive Study, in the Proceedings of the 27th Annual Hawaii
International Conference on System Sciences, 135-144.
Levin, T. and Gordon, C. (1989). Effect of Gender and Computer Experiences on
Attitudes Towards Computers, Journal of Educational Computing
Research, Vol. 5, No. 1, pp. 69-88.
Li, G.K.H. and Jordan, E. (1998). Executive Information Systems (EIS)
Development: The Role of Management Accountants, in the Proceedings of
1998 Information Resources Management Association International
Conference, Boston, MA, USA, 390-398.
Liang, L.Y. and Miranda, R. (2001). Dashboards and Scorecards: Executive
Information Systems for the Public Sector, Government Finance Review,
vl7 i6 pp. 14-26.
Loyd, B.H., Loyd, D.E., and Gressard, C (1987). Gender and Computer
Experience as Factors in the Computer Attitudes of Middle School
Students, Journal of Early Adolescence, Vol. 7, No. 1, pp. 13-19.
Martin, J.H., Carlisle, H.H. and Tren, S. (1973). The user interface for interactive
bibliographic searching and analysis of the attitudes of nineteen information
scientists. Journal of the American Society for Information Science, 24(2),
47-66.
196
Mathieson, K. (1991). Predicting user intentions: Comparing the technology
acceptance model with the theory of planned behavior. Information Systems
Research, 2(3), 173-191.
McBride, N. (1997). The rise and fall of an executive information system: a case
study. Information Systems Journal, 7,277-287.
McLeod, Jr. R. and Schell, G. (2001) Management Information Systems, 8 edn,
Prentice Hall.
Millet, I. and Mawhinney, CH. (1992). Executive Information Systems, a critical
perspective, Information & Management, 23,2 pp. 83-92.
Mintzberg, H. (1973). The Nature of Managerial Work, Harper & Row
Publishers.
Mitev, N. (1996) Social, organizational and political aspects of information
systems failure: the Computerised Reservation System at French Railways.
Proceedings of the 4th European Conference on Information Systems,
Lisbon, Portugal,
Moore, G.C and Benbasat, I. (1991). Development of an Instrument to Measure
the Perceptions of Adopting an IT Innovation. Information Systems
Research, 2(3), 192-222.
Nandhakumar, J. (1996). Design for success?: critical success factors in
executive information systems development. European Journal of
Information Systems, 5, 62-72.
Nandhakumar, J. and Jones, M. (1997). Designing in the dark: the changing user-
development relationship in information systems development, in
197
Proceedings of the Eighteenth International Conference on Information
Systems, Dec. 15-17, Atlanta, Georgia, USA, 75-87.
Nardi, B.A. (1996b) Some reflections on the application of activity theory, in
B.A. Nardi (ed.), Context and Consciousness: Activity Theory and Human-
Computer Interaction, The MIT Press, 235-245.
Neuman, W. L. (2000). Social Research Methods: Qualitative and Quantitative
Approaches, 4th edn, Allyn and Bacon.
Niederman, F., Brancheau, J.C, and Wetherbe, J.C (1991). Information Systems
Management Issues for the 1990s. MIS Quarterly, Vol. 15, No. 4, pp. 475-
500
Nord, J.H. and Nord, G.D. (1995). Executive information systems: A study and
comparative analysis, Information & Management, 29, 95-106.
Nunnally, J.C. and Bernstein, I.H. (1994). Psychometric Theory, 3r Ed.
McGraw-Hill.
Oz, E. (1994). When professional standards are lax: the Confirm failure and its
lessons, Communications of the Association of Computing Machines, 37,
29-36.
Pallant, J. (2001). SPSS Survival Manual: A Step by Step Guide to Data Analysis
Using SPSS, Allen & Unwin.
Paller, A. and Laska, R. (1990). The EIS Book: Information Systems for Top
Managers, Irwin.
198
Palmer, J.W. and Markus, M X . (2000). The Performance Impacts of Quick
Response and Strategic Alignment in Specialty Retailing, Information
Systems Research, Vol. 11, No. 3, pp. 241-259.
Parasuraman, A. Zeithaml, V.A. and Berry, L.L. (1985). A Conceptual Model of
Service Quality and its Implications for Future Research, Journal of
Marketing, Vol. 49, Fall 1985, pp. 41-50.
Pedhazur, E.J. (1997). Multiple Regression in Behavioral Research, 3rd edn,
Harcourt Brace College Publishers.
Pervan, G. and Phua, R. (1997). A Survey of the State of Executive Information
Systems in Large Australian Organizations. Information Technology, 29(2)
65-73.
Pitt, L.F., Watson, R.T. and Kavan, C B . (1995). Service Quality: A Measure of
Information Systems Effectiveness, MIS Quarterly, June 1995, pp. 173-185.
Poulymenakou, A. and Holmes, A. (1996). A contingency framework for the
investigation of information systems failure, European Journal of
Information Systems, 37,34-46.
Poon, P.P. and Wagner, C. (2001). Critical Success Factors Revisited: Success
and Failure Cases of Information Systems for Senior Executives, Decision
Support Systems, 30 (2001) 393-418.
Potter, M.E. (2001). Strategy and the Internet, Harvard Business Review, March
2001, pp. 63-78.
Power, D.J. (2002). Decision Support Systems: Concepts and Resources for
Managers, Quorum Books.
199
Rainer, R.K. Jr. and Watson, H.J. (1995). What it does it take for successful
executive information systems? Decision Support Systems 14, 147-156.
Raymond, L. (1988). The impact of computer training on the attitudes and usage
behavior of small business managers, Journal of Small Business
Management, 26(3), 8-13.
Raymond, L. and Bergeron, F. (1992). Personal DSS success in Small
Enterprises, Information and Management, 22, 301-308.
Rivard, S. and Huff, S.L. (1988). Factors of success for end-user computing,
Communications of the ACM, 31(5), 552-561.
Robson, C (1996). Real World Research: A Resource for Social Scientists and
Practitioner-Researchers, Blackwell.
Rockart, J.F. (1979). Chief Executives Define Their Own Needs, Harvard
Business Review, 5(1), 81-93.
Rockart, J. F. and DeLong, D. (1992). Moments of Executive Enlightenment, in
Watson, H.J., Rainer, R. K., & Houdeshel, G. (edn) Executive Information
Systems: Emergence, Development, Impact. John Wiley & Sons, 315-335.
Rockart, J.F., & Treacy, M.E. (1980) Executive Information Support Systems
Working Paper No.65, Centre for Information Systems Research, Sloan of
Management, MIT, in The Rise of Managerial Computing, (edn) J.F.
Rockart and CV. Bullen, (1986), Dow Jones-Irwin.
Rockart, J.F., and Treacy, M.E. (1982) The CEO Goes On-Line, Harvard
Business Review, January-February, 60(1): pp.81-93.
200
Runkel, P.J. and McGrath, J.E. (1972). Research on Human Behavior: A
Systematic Guide to Method, Holt, Rinehart and Winston, Inc.
Salmeron, J.L. (2002). EIS Evolution in Large Spanish Businesses, Information
& Management, 40 (2002) 41-50.
Sanders, G.L. and Courtney, J.F. (1985). A field study of organizational factors
influencing DSS success. MIS Quarterly, 9(1), 77-93.
Sarantakos, S. (2002). Social Research, 2nd edn, MacMillan Publishers Australia
Pty Ltd.
Sauer, C. (1993). Why Information Systems Fail: A Case Study Approach. Alfred
Waller, UK.
Schenk, K.D. (1992). Executive Use of Information Sources and the Impact of
Executive Information Systems. Doctoral Dissertation. University of
California, Irvine.
Scholz, A. (2000). Problems and Conflicts While Developing an Executive
Information System, in the Proceedings of 2000 Information Resources
Management Association International Conference, Anchorage, Alaska,
USA, 1002-1003.
Seddon, P.B. (1997). A respecification and extension of the Delone and McLean
model of IS success. Information Systems Research, 8(3), 240-253.
Seeley, M. and Targett, D. (1999). Patterns of senior executives' personal use of
computers, Information & Management, 35, 315-330.
Sekaran, U. (1992). Research Methods for Business: A Skill-Building Approach,
2nd edn, John Wiley & Sons Inc.
201
Shneiderman B. (1998) Designing the User Interface: Strategies for Effective
Human-Computer Interaction, 3rd edn, Addison-Wesley.
Singh, S.K., Watson, H.J. and Watson, R.T. (2002). EIS support for the strategic
management process, Decision Support Systems, 33, 71-85.
Sommer, B. and Sommer, R. (1997). A Practical Guide to Behavioral Research:
Tools and Techniques, 4th edn, Oxford University Press.
Straub, D.W. (1989). Validating instruments in MIS research, MIS Quarterly,
Vol. 13, No. 2, pp. 147-169.
Swanson, E.B. (1982). Measuring user attitudes in MIS research: a review,
Omega International Journal of Management Science, Vol. 10, No. 2, pp.
151-165.
Swanson, E.B. (1974). Management Information Systems: Appreciation and
Involvement, Management Science, 20, 178-188.
Tafti, M.H. (1992). A Three-dimensional Model of User Satisfaction with
Information Systems, International Journal of Information Resource
Management, 3(2), 4-10.
Taylor, S. & Todd, P.A. (1995). Understanding information technology usage: A
test of competing models. Information Systems Research, 6(2), 144-176.
Thibaut, J.W. and Kelley, H.H. (1959). The Social Psychology Groups, John
Wiley and Sons.
Thierauf, RJ. (1991). Executive Information Systems: A Guide for Senior
Management and MIS Professional, Quorum.
202
Thodenius, B. (1995). The Use of Executive Information Systems in Sweden, in
the Proceedings of CEMS Academic Conference - Recent Developments in
Economics and Business Administration, Wien, Austria, April 20-22,1995.
Thompson, R.L., Higgins, C.A., and Howell, J.M. (1991). Personal Computing:
Toward a Conceptual Model of Utilization, MIS Quarterly, Vol. 15,No. 1,
pp. 125-143.
Thompson, R.L., Higgins, C.A., and Howell, J.M. (1994). Influence of
Experience on Personal Computer Utilization: Testing a Conceptual Model,
Journal of MISNoX. 11, No. l,pp. 167-187
Triandis, H.C (1971). Attitudes, and Attitude Change, Wiley & Sons Inc.
Triandis, H.C. (1980). Values, Attitudes, and Interpersonal Behavior, in 1979
Nebraska Symposium on Motivation: Beliefs, Attitudes, and Values,
University of Nebraska Press, 195-259.
Triandis, H.C, Vassiliou, V. and Nassiakou, M. (1968). Three Cross-cultural
Studies of Subjective Culture. Journal of Personality and Social
Psychology Monograph Supplement, 8(4), part 2, 1-42.
Trice, A.W. and Treacy, M.E. (1988). Utilization As a Dependent Variable in
MIS Research, Database, Fall-Winter, 33-41.
Turban, E. (1993). Decision Support and Expert Systems: Management Support
Systems, 3rd edn, MacMillan Publishing Company.
Valois, P.; Desharnais, R.; and Godin, G. (1988). A comparison of the Fishbein
and Ajzen and the Triandis attitudinal models for the prediction of exercise
203
intention and behavior, Journal of Behavioral Medicine, Vol. 11, No. 5, pp.
459-472.
Vandenbosch, B. (1999). An empirical analysis of the association between the
use of executive support systems and perceived organizational
competitiveness, Accounting, Organization and Society, 24, 77-92.
Vandenbosch, B. and Huff, S.L. (1999). Searching and Scanning: How
Executives obtain information from Executive Information Systems, MIS
Quarterly, March 1997, 81-107.
Venkatesh,V. (1999). Creation of favorable user perceptions: Exploring the role
of intrinsic motivation, MIS Quarterly, 23(2), 239-260.
Venkatesh, V. and Davis, F.D. (1996). A model of the antecedents of perceived
ease of use: Development and test. Decision Sciences, 27(3), 451-482.
Venkatesh, V. and Morris, M.G. (2000). Why don't men ever stop to ask for
directions? Gender, social influence, and their role in technology
acceptance and usage behavior. MIS Quarterly, 24(1) 115-130.
Volonino, L., Watson, H.J. and Robinson, S. (1995). Using EIS to respond to
dynamic business conditions, Decision Support Systems, 14, 105-116.
Vroom, V. (1964). Work and Motivation, Wiley and Sons Inc.
Wallace, R.S.O. and Cooke, T.E. (1990). Non response bias in mail accounting
surveys: A pedagogical note, British Accounting Review (September), pp.
283 -288.
204

Wallis, L. (1992). Power Computing at the Top, in Watson, H.J., Rainer, R. K.,
& Houdeshel, G. (edn) Executive Information Systems: Emergence,
Development, Impact, John Wiley & Sons, 81-105.
Watson, H.J. and Carte, T.A. (2000). Executive Information Systems in
Government Organizations. Public Productivity & Management Review,
23(3), 371-382.
Watson, HJ. and Frolick, M.N. (1993). Determining Information Requirements
for an EIS. MIS Quarterly, 17(3) 255-269.
Watson, HJ., Houdeshel, G. and Rainer, R. K. (1997). Building Executive
Information Systems and other Decision Support Applications. John Wiley
& Sons Inc.
Watson, H.J., Rainer, R. K., and Houdeshel, G. (edn) (1992). Executive
Information Systems: Emergence, Development, Impact, John Wiley &
Sons, New York.
Watson, H J., Rainer, R. K., and Koh, C. (1992). Executive Information Systems:
A Framework for Development and a Survey of Current Practices, in
Watson, H.J., Rainer, R. K., & Houdeshel, G. (edn) Executive Information
Systems: Emergence, Development, Impact, John Wiley & Sons, 81-105.
Weiner, L.R. (1993). Digital woes: Why we should not depend on software,
Addison-Wesley, Reading, MA.
Weter, T.R. (1988) Tools at the Top, Industry Week, November 21 pp.41-44.
Wetherbe, J.C. (1991). Executive Information Requirements: Getting It Right,
MIS Quarterly, March 51-61.
205

Wheeler, F.P., Chang, S.H. and Thomas, RJ. (1993). Moving from an executive
information system to everyone's information system: lessons from a case
study, Journal of Info Technology, 8(3), 177-183.
Wiersma, W. (1986). Research Methods in Education: An Introduction, 4th edn,
Allyn and Bacon.
Wiersma, W. (2000). Research Methods in Education: An Introduction, 7th edn,
Allyn and Bacon.
Xu, X.M. and Kaye, G.R. (2002). Knowledge workers for information support:
Executives' perceptions and problems, Information Systems Management,
19(1), Winter, pp. 81-88.
Yaverbaum, G.J. (1988). Critical Factors in the User Environment: An
Experimental Study of Users, Organizations, and Tasks, MIS Quarterly,
Vol. 12, No. 1, pp. 75-88.
Young, D. & Watson, J.W. (1995). Determinates of EIS acceptance. Information
& Management, 29, 153-164.
Youngman, M.B. (1979). Analysing Social and Educational Research Data,
McGraw-Hill Book Company (UK) Ltd.
Zeithaml, V.A., Berry, L.L. and Parasuraman, A. (1993). Nature and
Determinants of Customer Expectations of Service, Journal of Academy of
Marketing Science, Vol. 21 No. 1, pp. 1-12.
Zeithaml, V.A., Berry, L.L. and Parasuraman, A. (1988). Communication and
Control Processes in the Delivery of Service Quality, Journal of
Marketing, No. 52 April 1988.
206

APPENDICES
207

APPENDIX A: Template of Cover letter to Questionnaire
208

14th November, 2001
«Tirtle» «FirstName» «LastName»
«Role», «Company»
«Addressl» «Address2»
«City» «State» «PostCode»
Dear «Title» «LastName»,
Project Title: Executive Information Systems Use in Organizational Context
Researchers: M r George Ditsa and Professor Graham W m l e y
You are invited to participate in this study which is about "Executive Information
Systems use in Organizational Context". This research is being conducted as part of a
PhD degree by M r George Ditsa.
Purpose of the Study
In the past decade, the use of Computer-based Information Systems (CBIS) in
organizations has skyrocketed. Today, the use of CBIS has cut across every functional
area and level of management in organizations. The use of a CBIS generally provides
the means by which organizations work more efficiently and effectively.
A CBIS is generally designed for collecting data, processing them into information and
using the information to support decision making, coordination, planning and control.
There are specific CBISs designed for the specific levels of management in
organizations to serve managerial purposes. Executive Information Systems (EIS) are
CBISs specifically designed to aid top-level managers in their managerial roles. They
may go by other names in your organization but their primary purpose m a y remain the
same.
Despite the potential that EIS hold in improving managerial roles, research indicates a
number of these systems are not meeting the needs and expectations of the users. W e ,
as a team of researchers, from the Department of Information Systems at the University
of Wollongong, have embarked on a research effort to better understand EIS users'
needs and expectations, and suggest ways of improving these systems from the
209

viewpoints of users. This study is aimed at a PhD degree and further publications. It is
our belief that the findings of this study will be of significant benefit to EIS user
community.
Confidentiality
Y o u have been selected to participate in this study because you use an EIS. Your name
was obtained, with a signed agreement, from Fairfax Business Media. Your reply will
be anonymous and no attempt will be made to identify any response with any
participant. W e are also asking some personal information from you at the end of the
questionnaire which will not identify you, but which will be used in the analysis. The
questionnaire has been pre-numbered solely to help provide a record of returns and
facilitate the mailing of follow-up questionnaires to achieve a maximum return rate.
As a policy, this research has been reviewed by the Human Research Ethics Committee
of the University. If you have any concerns or complaints regarding the way the
research is or has been conducted, you can contact the Complaints Officer, Human
Research Ethics Committee, University of Wollongong on (02) 4221 4457.
What You Need To Do
If you are willing to participate in this research, please complete the enclosed
questionnaire and return it in the enclosed self-addressed stamped envelope. W e
estimate an average time of 30 minutes in completing the questionnaire. Please return
your completed questionnaire to us by 28 November, 2001.
Thank you for your time and effort in participating in this study. We will inform you of
our findings before any final publication. If you would like to discuss any part of this
research, contact us on (02) 4221 4034 or email georee [email protected].
Yours sincerely,
Professor Graham Winley
encl.
210
APPENDIX B: Survey Questionnaire
211

University of Wollongong
Department of Information Systems
Executive Information Systems Use Survey This questionnaire is part of a study of Executive Information Systems (EIS) use in
organizations. EIS are Computer-based Information Systems (CBIS) specifically designed to
provide the necessary and critical information managers need to perform their managerial
roles. They may go by other names in your organization such as, Enterprise-wide Information
Systems, Enterprise Business Intelligence Systems, Balanced Scorecard or simply Scorecard:
but their primary purpose may remain the same - to provide the necessary and critical
information for managerial roles.
!3____H__H_B_H_^_H_j_H_j_H_|r
The following questions are about your experiences with CBIS and EIS, your ability to use
EIS, and how frequent you use EIS.
1 Your Experience with CBIS
H o w many years have you personally been using CBIS? (Please tick one)
• 0-4 £ 1 5 - 9 • 10-14 Ll 15-19 • 20 or more years
2 Your Experience with EIS
H o w many years have you personally been using EIS? (Please tick one)
• o-4 • 5-9 CD" 10-14 L7J 15 -19 • 20 or more years
3 Your Ability to use EIS
In which class of EIS users would you place yourself? (Please tick one)
Novice casual (intermittent) user LJ
Novice frequent user LJ
Expert (knowledgeable) casual user LJ
Expert (knowledgeable) frequent user LJ
4 Your Frequency of using EIS
O n average, how many times do you logon to use an EIS? (Please tick one)
Several times a day LJ
Once a day •—*
1-4 times a month LJ
Once a month •—'
Less than once a month *—*
212

MMIIIIW • »*m . •
B. Perceived Usefulness and Inclination to Use EIS
Below are some statements about your personal opinion about the usefulness of EIS to an
organization and your inclination to use EIS. Please circle your response to each of these
statements.
1. Based on my experience with EIS I have observed that an EIS:
(SA-Strongly Agree A-Agree U - Uncertain D-Disagree SD - Strongly Disagree)
Increases an organization's performance SA A
Provides an organization with a competitive advantage SA A
Provides a greater level of control over managerial activities S A A
Provides information that allows problems to be detected SA A
Improves the quality of decision-making in an organization S A A
Increases the speed of decision-making in an organization SA A
2. I believe using EIS in an organization has the potential to:
Increase the organization's performance
Provide the organization with a competitive advantage
Provide a greater level of control over managerial activities
Provide information that allows problems to be detected
Improve the quality of decision-making in the organization
Increase the speed of decision-making in the organization
U D SD
U D SD
U D SD
U D SD
U D SD
U D SD
SA
SA
SA
SA
SA
SA
A
A
A
A
A
A
U
u
u
u
u
u
D
D
D
D
D
D
SD
SD
SD
SD
SD
SD
3. Using an EIS helps m e personally to:
Accomplish my usual tasks
Identify trends and obtain critical information
Make strategic decisions
Not using EIS any more would disadvantage me
SA
SA
SA
SA
A
A
A
A
U
U
U
U
D
D
D
D
SD
SD
SD
SD
213
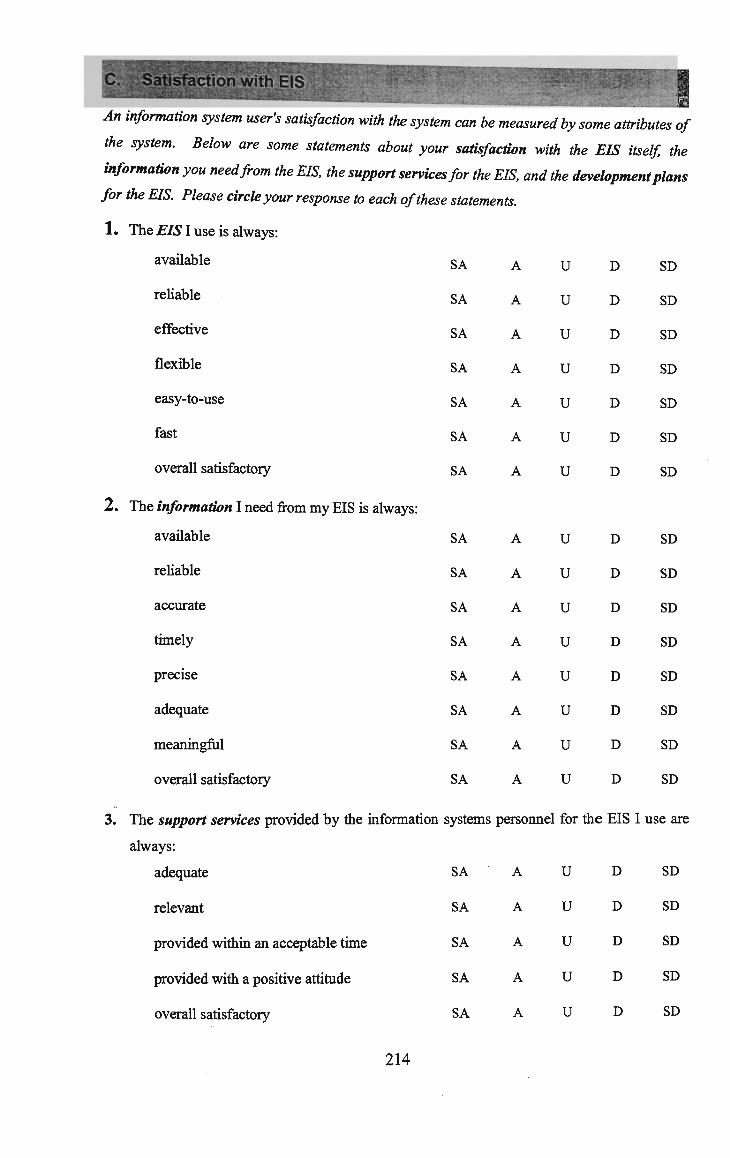
Satisfaction with EIS iMHHMHHBBHBHHHIH
An information system user's satisfaction with the system can be measured by some attributes of
the system. Below are some statements about your satisfaction with the EIS itself, the
information you need from the EIS, the support services for the EIS, and the development plans
for the EIS. Please circle your response to each of these statements.
1. The EIS I use is always:
avauaoie
reliable
effective
flexible
easy-to-use
fast
overall satisfactory
2. The information I need from m y EIS is always:
available
reliable
accurate
timely
precise
adequate
meaningful
overall satisfactory
SA
SA
SA
SA
SA
SA
SA
SA
SA
SA
SA
SA
SA
SA
SA
A
A
A
A
A
A
A
A
A
A
A
A
A
A
A
U
U
U
U
U
U
U
u
u
u
u
u
u
u
u
D
D
D
D
D
D
D
D
D
D
D
D
D
D
D
SD
SD
SD
SD
SD
SD
SD
SD
SD
SD
SD
SD
SD
SD
SD
3. The support services provided by the information systems personnel for the EIS I use are
always:
adequate
relevant
provided within an acceptable time
provided with a positive attitude
overall satisfactory
SA
SA
SA
SA
SA
A
A
A
A
A
U
U
U
U
U
D
D
D
D
D
SD
SD
SD
SD
SD
214
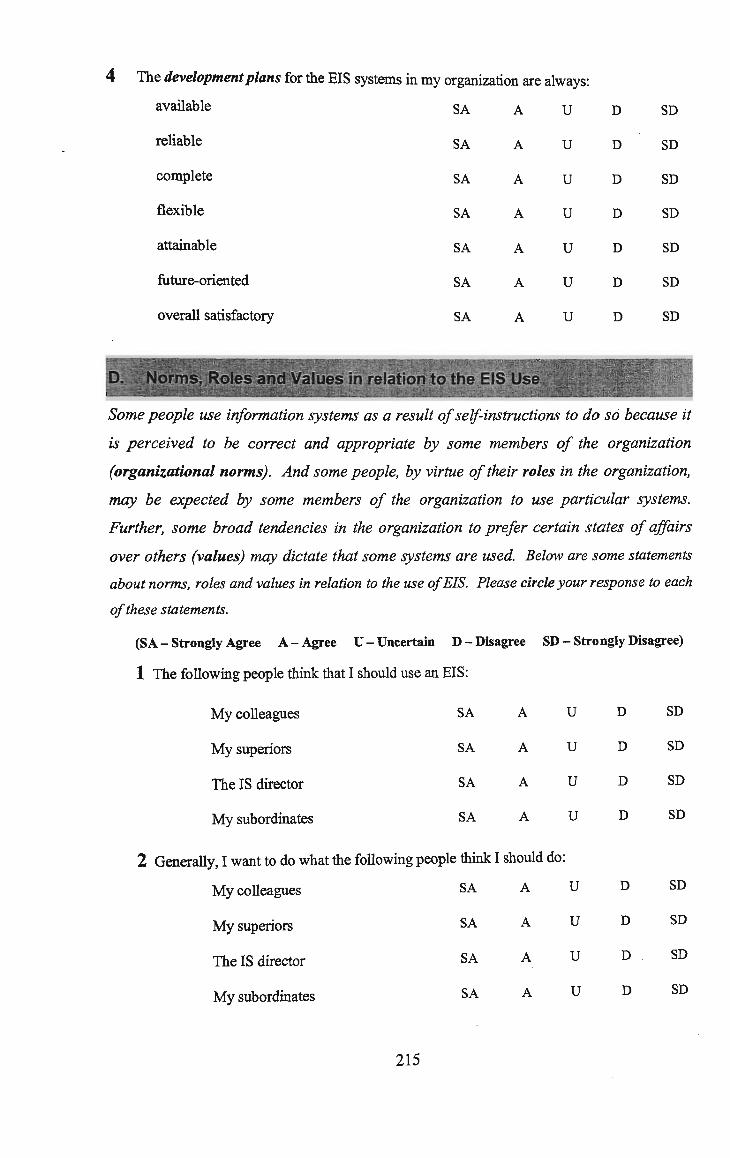
SA
SA
SA
SA
SA
SA
SA
A
A
A
A
A
A
A
U
U
u
u
u
u
u
D
D
D
D
D
D
D
SD
SD
SD
SD
SD
SD
SD
4 The development plans for the EIS systems in m y organization are always:
available
reliable
complete
flexible
attainable
future-oriented
overall satisfactory
_M_J_J__M__M_M_W_M__M___M«_|_M_M_m_M_u_M
es in relation to the EIS Use
Some people use information systems as a result of self-instructions to do so because it
is perceived to be correct and appropriate by some members of the organization
(organizational norms). And some people, by virtue of their roles in the organization,
may be expected by some members of the organization to use particular systems.
Further, some broad tendencies in the organization to prefer certain states of affairs
over others (values) may dictate that some systems are used. Below are some statements
about norms, roles and values in relation to the use of EIS. Please circle your response to each
of these statements.
(SA-Strongly Agree A-Agree U - Uncertain D-Disagree SD - Strongly Disagree)
1 The following people think that I should use an EIS:
M y colleagues
M y superiors
The IS director
M y subordinates
2 Generally, I want to do what the following people think I should do:
M y colleagues SA A U
M y superiors SA A U
The IS director SA A U
M y subordinates SA A U
SA
SA
SA
SA
A
A
A
A
U
u
u
u
D
D
D
D
SD
SD
SD
SD
D
D
D
D
SD
SD
SD
SD
215

SA
SA
SA
zatioi
SA
SA
SA
SA
A
A
A
ti to be:
A
A
A
A
U
U
u
u
u
u
u
D
D
D
D
D
D
D
SD
SD
SD
SD
SD
SD
SD
3 B y virtue of m y roles in the organization, the following people expect that I will use an EIS:
M y colleagues SA A U D SD
M y superiors
The IS director
M y subordinates
4 The use of EIS is generally considered in my organization to be
Productive
Rational
Efficient
Effective
E. Social Working Relationship and Organizational Environment in relation EIS use
The social working relationships among workers in an organization may make it easier to use
information systems. The organizational environment may also encourage people in the
organization to use information systems. Below are some statements about the social working
relationships and the organizational environment in relation to EIS use. Please circle your
response to each of these statements.
(SA - Strongly Agree A-Agree U-Uncertain D-Disagree SD - Strongly Disagree)
1 The social working relationships between m e and the following make it easier for m e to use
an EIS:
M y colleagues SA
M y superiors SA
The IS director SA
M y subordinates SA
2 The following aspects of m y organization encourage m e to use an EIS
The organizational culture
The pace of changing business environment
The interactions among the business units
The power and politics of the organization
The commitment of the organization to EIS
216
A
A
A
A
U
u
U
u
D
D
D
D
SD
SD
SD
SD
SA
SA
SA
SA
SA
A
A
A
A
A
U
U
U
U
U
D
D
D
D
D
SD
SD
SD
SD
SD
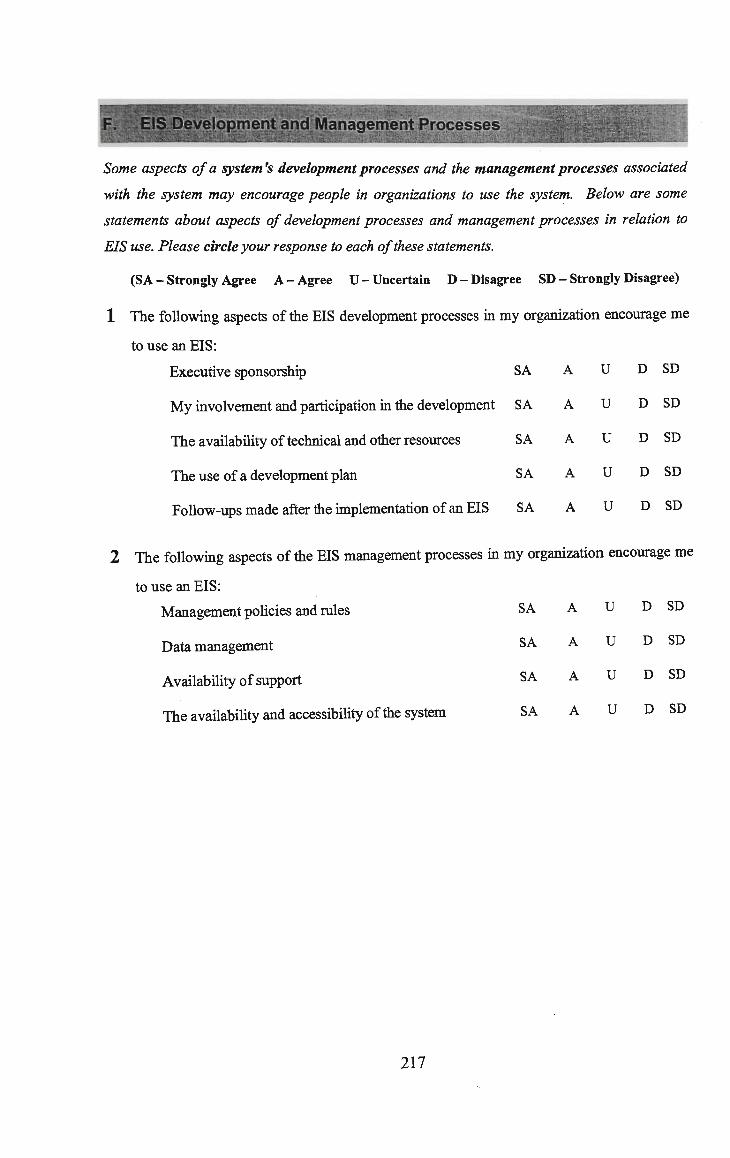
F. EIS Development and Management Processes
Some aspects of a system's development processes and the management processes associated
with the system may encourage people in organizations to use the system. Below are some
statements about aspects of development processes and management processes in relation to
EIS use. Please circle your response to each of these statements.
(SA - Strongly Agree A-Agree U-Uncertain D-Disagree SD - Strongly Disagree)
1 The following aspects of the EIS development processes in m y organization encourage m e
to use an EIS:
Executive sponsorship SA
M y involvement and participation in the development SA
The availability of technical and other resources S A
The use of a development plan S A
Follow-ups made after the implementation of an EIS SA
2 The following aspects of the EIS management processes in my organization encourage me
to use an EIS:
Management policies and rules SA A U D SD
Data management SA A U D SD
Availability of support SA A U D SD
The availability and accessibility of the system SA A U D SD
A
A
A
A
A
U
U
U
u
u
D
D
D
D
D
SD
SD
SD
SD
SD
217
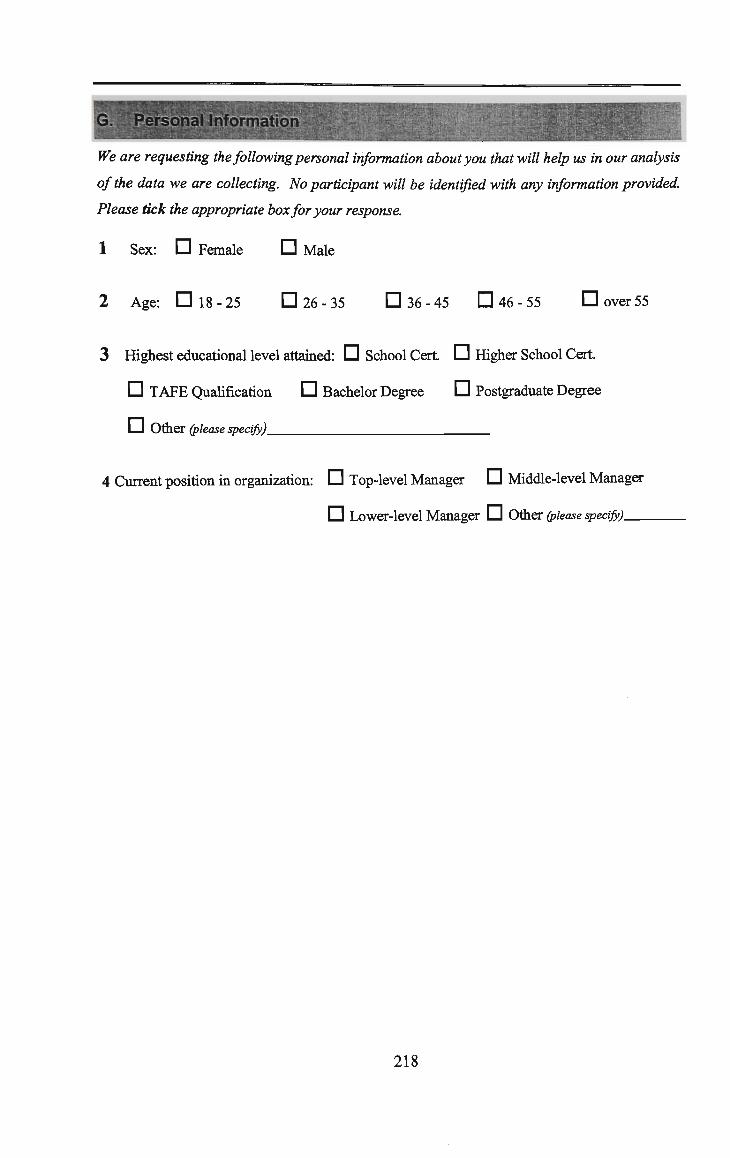
We are requesting the following personal information about you that will help us in our analysis
of the data we are collecting. No participant will be identified with any information provided.
Please tick the appropriate box for your response.
1 Sex: • Female • Male
2 Age: • 18-25 D26-35 D36-45 • 46 - 55 Dover 55
3 Highest educational level attained: D School Cert. D Higher School Cert.
• TAFE Qualification • Bachelor Degree D Postgraduate Degree
L J Other (please specify)
4 Current position in organization: D Top-level Manager D Middle-level Manager
Q Lower-level Manager LJ Other (please specify)
218
Thank you once again for your time and effort in responding to this questionnaire. W e
appreciate very much your valuable contribution to this study. W e will also appreciate
it very much if you could provide us with any further comments about your use
information systems for managerial work and about this survey. Please provide your
comments below or e-mail us on [email protected]. Thank you.
219

APPENDIX C: Template of Follow-up Cover letter to Questionnaire
220
27th February, 2002
«Title» «FirstName» «LastName»
«Role», «Company»
«Addressl»
«City» «State» «PostCode»
Dear «Title» «LastName»,
Project Title: Executive Information Systems Use in Organizational Context
Researchers: M r George Ditsa and Professor Graham Winley
About two and half months ago, you received a questionnaire designed to investigate
"Executive Information Systems use in Organizational Context" as part of a PhD degree
by M r George Ditsa.
From the responses received to date, our records show that we have not received your
completed questionnaire. In case your letter and questionnaire were misplaced or lost,
we have enclosed a new questionnaire with a copy of the original letter for your
completion. Your responses will be kept confidential.
Please return the completed questionnaire in the enclosed self-addressed stamped
envelope to us by 18th March, 2002.
Your consideration and prompt return will be appreciated. Thank you for your valuable
contribution. If you would like any further information, please contact us on (02) 4221
4034 or email [email protected].
Yours sincerely,
Professor Graham Winley
encl.
221

APPENDIX D: Industry Codes and Industry Groups in Database
222

Industry Codes & Groups
Code: Description:
00 IT Supplier
01 Agriculture
02 Services to Agriculture; Hunting and Trapping
03 Forestry and Logging
04 Commercial Fishing
11 Coal Mining
12 Oil and Gas Extraction
13 Metal Ore Mining
14 Other Mining
15 Services to Mining
21 Mfg: Food, Beverage & Tobacco
22 Mfg: Textiles, Clothing, Footware and Leather
23 Mfg: W o o d and Paper Products
24 Mfg: Printing, Publishing and Recorded Media
25 Mfg: Petrol, Coal and Chemical Products
26 Mfg: Non-Metallic Mineral Products
27 Mfg: Metal Products
28 Mfg: Machinery and Equipment
29 Other Manufacturing
36 Electricity and Gas
37 Water, Sewerage and Drainage
41 General Construction
42 Construction and Engineering Services
45 Wholesale Trade: Basic Materials
46 Wholesale Trade: Machinery and Motor Vehicles
47 Wholesale Trade: Personal and Household Goods
51 Retail Trade: Food
52 Retail Trade: Personal and Household Goods
Industry Group
IT Supplier
Agriculture & Mining
Agriculture & Mining
Agriculture & Mining
Agriculture & Mining
Agriculture & Mining
Agriculture & Mining
Agriculture & Mining
Agriculture & Mining
Agriculture & Mining
Manufacturing
Manufacturing
Manufacturing
Manufacturing
Manufacturing
Manufacturing
Manufacturing
Manufacturing
Manufacturing
Utilities & Construction
Utilities & Construction
Utilities & Construction
Utilities & Construction
Wholesale & Retail
Wholesale & Retail
Wholesale & Retail
Wholesale & Retail
Wholesale & Retail
223

Appendix D (continued)
53 Retail Trade: Motor Vehicles Wholesale & Retail
57 i
61 ]
62
63
64
65
66
67
71
73
74
75
77
78
80
81
82
83
84
86
87
91
92
93
95
96
\ccommodation and Restaurant Trade Wholesale & Retail
£.oad Transport
R.ail Transport
Water Transport and Port Authority
Air and Space Transport
Other Transport
Services to Transport
Storage and Marketing Boards
Communications
Banking and Finance
Insurance
Services to Finance and Insurance
Property Services
Marketing & Business Management Services
Federal Government
State Government
Defence
Local Government
Education and Research
Health Services
Community Services and Welfare
Film, Radio and TV
Libraries, Museums and Arts
Sport and Recreation
Personal Services, Tourism and Entertainment
Other Services
rransport & Storage
Transport & Storage
Transport & Storage
Transport & Storage
Transport & Storage
Transport & Storage
Transport & Storage
Communications
Finance & Business
Finance & Business
Finance & Business
Finance & Business
Finance & Business
Govt & Defence
Govt & Defence
Govt & Defence
Govt & Defence
Community Services
Community Services
Community Services
Personal & Other Services
Personal & Other Services
Personal & Other Services
Personal & Other Services
Personal & Other Services
224

APPENDIX E: Table 5.4.1 to Table 5.4.15
225

Table 5.4.1: Correlations Matrix Among Perceived Usefulness Sub-Variables (Beliefs)
(n = 144)
Sub-Variables
427**
487**
349**
.460**
583**
1. EIS increases org performance 1.000 .621** .481** .307** .447**
2. EIS provides competitive advantage .621** 1.000 .453** .290** .467**
3. EIS provides better control of activities .481** .453** 1.000 .312** .390**
4. EIS helps detect problems .307** .290** .312** 1.000 .567**
5. EIS improves decision quality .447** .467** .390** .567** 1.000
6. EIS increases decision making speed .427** .487** .349** .460** .583** 1.000
** Correlation is significant at 0.01 level (2-tailed). (Listwise, n = 143)
Table 5.4.2: Correlations Matrix Among Perceived Usefulness Sub-Variables
(Value Attached) (n = 144)
Sub-Variables 1 2 3 4 5 6
1. EIS has potential to increase 1.000 .592** .368** .429** .473** .407** organization performance
2. EIS has potential to provide .592** 1.000 .428** .392** .463** .424** competitive advantage
3. EIS has potential to provide better .368** .428** 1.000 .376** .438** .360** control of activities
4. EIS has potential to help detect .429** .392** .376** 1.000 .498** .449** problems
5. EIS has potential to improve decision .473** .463** .438** .498** 1.000 .618**
quality
6. EIS has potential to increase decision .407** .424** .360** .449** .618** 1.000
making speed .
** Correlation is significant at 0.01 level (2-tailed). (Listwise, n = 143)
Table 5.4.3: Correlations Matrix Among Internalization Sub-Variables (n = 144)
Sub-Variables
1. EIS helps in usual tasks 1.000 .485** .430** .566
2. EIS helps to identify trend .485** 1.000 .532** .595
3. EIS helps in strategic decisions .430** .532** 1.000 .500
4. Not using EIS disadvantages .566** .595** .500** 1-000
** Correlation is significant at 0.01 level (2-tailed). (Listwise, n = 142)
**
**
**
226

Table 5.4.4: Correlations Matrix Among EIS System Satisfaction Sub-Variables (n = 144)
1.
2.
3.
4.
5.
6.
7.
Sub-Variables
Always available
Always reliable
Always effective
Always flexible
Always easy to use
Always fast
Overall satisfactory
1
1.000
.744**
.530**
.392**
414**
.433**
.583**
2
,744**
1.000
.629**
.448**
.436**
.385**
.612**
3
.530**
.629**
1.000
.483**
.408**
459**
.671**
4
.392**
.448**
.483**
1.000
.547**
.406**
.602**
5 4^4**
.436**
.408**
.547**
1.000
.569**
.514**
6
.433**
.385**
.459**
.406**
.569**
1.000
.562**
7
.583**
.612**
.671**
.602**
.514**
.562**
1.000
** Correlation is significant at 0.01 level (2-tailed). (Listwise, n = 142)
Table 5.4.5: Correlations Matrix Among EIS Information Satisfaction Sub-Variables
(n = 144)
Sub-Variables 8 1. Always available
2. Always reliable
3. Always accurate
4. Always timely
5. Always precise
6. Always adequate
1.000 .425** .353** .534** .395** 483** .392** .529**
.425** 1.000 .863** .574** .584** .498** .503** .645**
.353** .863** 1.000 .535** .651** .419** .482** .618**
.534** .574** .535** 1.000 .494** .583** .537** .704**
.395** .584** .651** .494** 1.000 .401** .454** .499**
.483** .498** .419** .583** .401** 1.000 .655** .721**
7. Always meaningful .392** .503** .482** .537** .454** .655** 1.000 .732**
8. Overall satisfactory .529** .645** .618** .704** .499** .721** .732** 1.000
** Correlation is significant at 0.01 level (2-tailed). (Listwise, n = 142)
Table 5.4.6: Correlations Matrix Among EIS Support Services Satisfaction
Sub-Variables (n = 144)
Sub-Variables 1 2 3 4 5
1. Always adequate
2. Always relevant
3. Always timely
1.000 .764** .704** .604** .771**
.764** 1.000 .701** .640** .739**
.704** .701** 1.000 .730** .760**
4. Always provided with positive attitude .604** .640** .730** 1.000 .727
5. Overall satisfactory .771** .739** .760** .727** 1.000
** Correlation is significant at 0.01 level (2-tailed). (Listwise, n = 142)
**
227
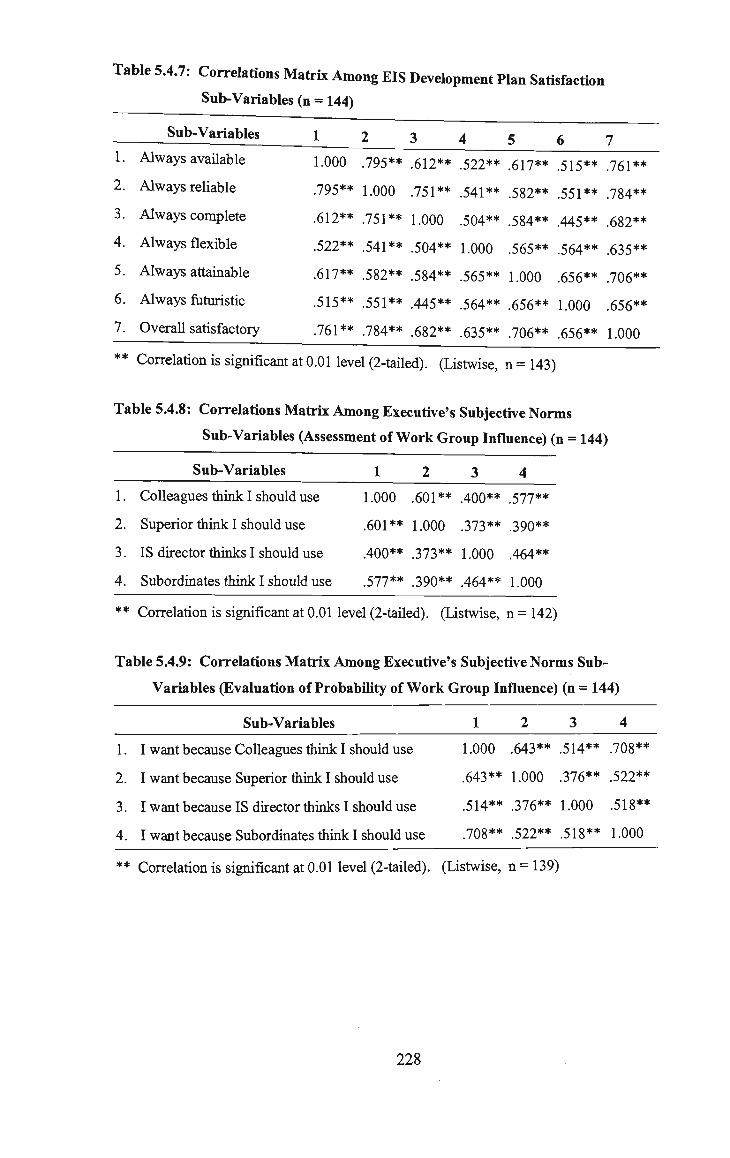
Table 5.4.7: Correlations Matrix Among EIS Development Plan Satisfaction
Sub-Variables (n = 144)
Sub-Variables
1. Always available 1.000 .795** .612** .522** .617** .515** .761**
2. Always reliable .795** 1.000 .751** .541** .582** .551** .784**
3. Always complete .612** .751** 1.000 .504** .584** .445** .682**
4. Always flexible .522** .541** .504** 1.000 .565** .564** .635**
5. Always attainable .617** .582** .584** .565** 1.000 .656** .706**
6. Always futuristic .515** .551** .445** .564** .656** 1.000 .656**
7. Overall satisfactory .761** .784** .682** .635** .706** .656** 1.000
** Correlation is significant at 0.01 level (2-tailed). (Listwise, n = 143)
Table 5.4.8: Correlations Matrix Among Executive's Subjective Norms
Sub-Variables (Assessment of W ork Group Influence) (n = 144)
Sub-Variables 1 2 3 4
1. Colleagues think I should use 1.000 .601** .400** .577**
2. Superior think I should use .601** 1.000 .373** .390**
3. IS director minks I should use .400** .373** 1.000 .464**
4. Subordinates think I should use .577** .390** .464** 1.000
** Correlation is significant at 0.01 level (2-tailed). (Listwise, n = 142)
Table 5.4.9: Correlations Matrix Among Executive's Subjective Norms Sub-
Variables (Evaluation of Probability of W o r k Group Influence) (n = 144)
Sub-Variables 1 2 3 4
1. I want because Colleagues think I should use 1.000 .643** .514** .708**
2. I want because Superior think I should use .643** 1.000 .376** .522**
3. I want because IS director thinks I should use .514** .376** 1.000 .518**
4. I want because Subordinates think I should use .708** .522** .518** 1.000
** Correlation is significant at 0.01 level (2-tailed). (Listwise, n = 139)
228

Table 5.4.10: Correlations Matrix Among Executive's Subjective Roles Sub-Variables
(n = 144)
Sub-Variables
1. Because of m y role, Colleagues think I should use 1.000 .652** .588** .635**
2. Because of m y role, Superior think I should use .652** 1.000 .513** .368**
3. Because ofmy role, IS director thinks I should use .588** .513** 1.000 .465**
4. Because of m y role, Subordinates think I should use .635** .368** .465** 1.000
** Correlation is significant at 0.01 level (2-tailed). (Listwise, n = 141
Table 5.4.11: Correlations Matrix Among Subjective Values of EIS Sub-Variables
(n = 144)
Sub-Variables 1
1. General opinion is EIS productive 1.000 .699** .666** .740**
2. General opinion is EIS rational .699** 1.000 .694** .716**
3. General opinion is EIS efficient .666** .694** 1.000 .794**
4. General opinion is EIS effective .740** .716** .794** 1.000
** Correlation is significant at 0.01 level (2-tailed). (Listwise, n = 144)
Table 5.4.12: Correlations Matrix Among Social Situations Sub-Variables (n = 144)
Sub-Variables 1 2 3 4
1. Relationship with Colleagues make EIS 1.000 .694** .562** .605** use easy
2. Relationship with Superior make EIS .694** 1.000 .623** .545** use easy
3. Relationship with IS director make EIS .562** .623** 1.000 .607** use easy
4. Relationship with Subordinates make EIS .605** .545** .607** 1.000
use easy
** Correlation is significant at the 0.01 level (2-tailed). (Listwise, n = 140)
229

Table 5.4.13: Correlations Matrix Among Facilitating Conditions (Organizational
Environment) Sub-Variables (n = 144)
Sub-Variables
1. Organizational culture encourages 1.000 .559** .383** 447** 501** EIS use
2. Pace of change of business environment .559** 1.000 .547** .286** .225** encourages EIS use
3. Interaction among business units .383** .547** 1.000 .373** .319** encourages EIS use
4. Organizational Power and Politics .447** .286** .373** 1.000 .212* encourages EIS use
5. Organization commitment encourages .501** .225** .319** .212* 1.000 EIS use
** Correlation significant at 0.01 * significant at 0.05 (2-tailed). (Listwise, n = 144)
Table 5.4.14: Correlations Matrix Among Facilitating Conditions (System
Development Processes) Sub-Variables (n = 144)
Sub-Variables
1. Executive sponsorship encourages EIS use 1.000 .220** .213* .260** .189*
2. M y involvement encourages EIS use .220** 1.000 .483** .484** .477**
3. Technical availability encourages EIS use .213* .483** 1.000 .460** .415**
4. Development plan encourages EIS use .260** .484** .460** 1.000 .471**
5. Follow ups encourages EIS use .189* .477** .415** .471** 1.000
** Correlation significant at 0.01 * significant at 0.05 (2-tailed). (Listwise, n=143)
Table 5.4.15: Correlations Matrix Among Facilitating Conditions (Management
Processes) Sub-Variables (n = 144)
Sub-Variables 1 2 3 4
1. Management policies encourages EIS use 1.000 .388** .343** .261**
2. Data management encourages EIS use .388** 1.000 .369** .384**
3. Support availability encourages EIS use .343** .369** 1.000 .494**
4. Accessibility encourages EIS use .261** .384** .494** 1.000
** Correlation is significant at 0.01 level (2-tailed). (Listwise, n = 143)
230

APPENDIX F: Multiple Regression Assumption Checks
231

Multiple Regression Assumption Checks
Multiple regression analysis techniques are very sensitive to assumptions and
have been described as among one of the fussiest statistical techniques (Pallant,
2001). Multiple regression analysis techniques make a number of assumptions
about the data for analysis and any violation of these assumptions may impair the
results of the analysis. A number of the assumptions relate to the residuals, that
is, the differences between the observed and the predicted dependent variables
calculated by the regression method. Consequently, the regression analysis must
be carried out before all the assumptions could be checked.
Hair et al. (1995) listed four assumptions underlying multiple regression analysis
techniques, which are important to check for any violation when using multiple
regression techniques. The assumptions are: normality, linearity, constant
variance (homoscedasticity) and independence of residuals. The assumptions
can be checked from residuals plots which are generated as part of the multiple
regression procedure in most statistical packages, including SPSS.
The analyses below focus on normality and heteroscedasticity. The nature of the
data indicates no reason to assume dependency among residuals. Assessing
normality requires comparison of residuals with individual predictors.
232

In Normal Probability Plots of standardized residuals, the residual points lying in
"a reasonably straight diagonal line from bottom left to top right" would suggest
that there were no major deviations from normality.
Figures 5.1 and 5.2 are the Normality Plots and Figures 5.3 and 5.4 are the
Histogram Plots generated in this analysis. An examination of these plots
suggested that there were no major violations of the assumptions for normality
for both Frequency of EIS use and Internalization of EIS use.
In the scatterplots of the standardized residuals, a pattern showing no trend up or
down, an no non-linearity, with most of the scores concentrated in the center
around the 0 point would suggest there were no major deviations from normality
and the other assumptions. Figures 5.5 and 5.6 are copies of the scatterplots
generated in this study. An examination of these plots also suggested that there
were no major violations of assumptions for normality and the other
assumptions. These residual scatterplots are also useful in assessing
heterostedasticity.
Note that the linear "subpatterns" in Figures 5.5 and 5.6 are due to the discrete
(integer values only) nature of the response variables. Although, obviously, this
is evidence of non-normality, it is not important issue in this context.
233
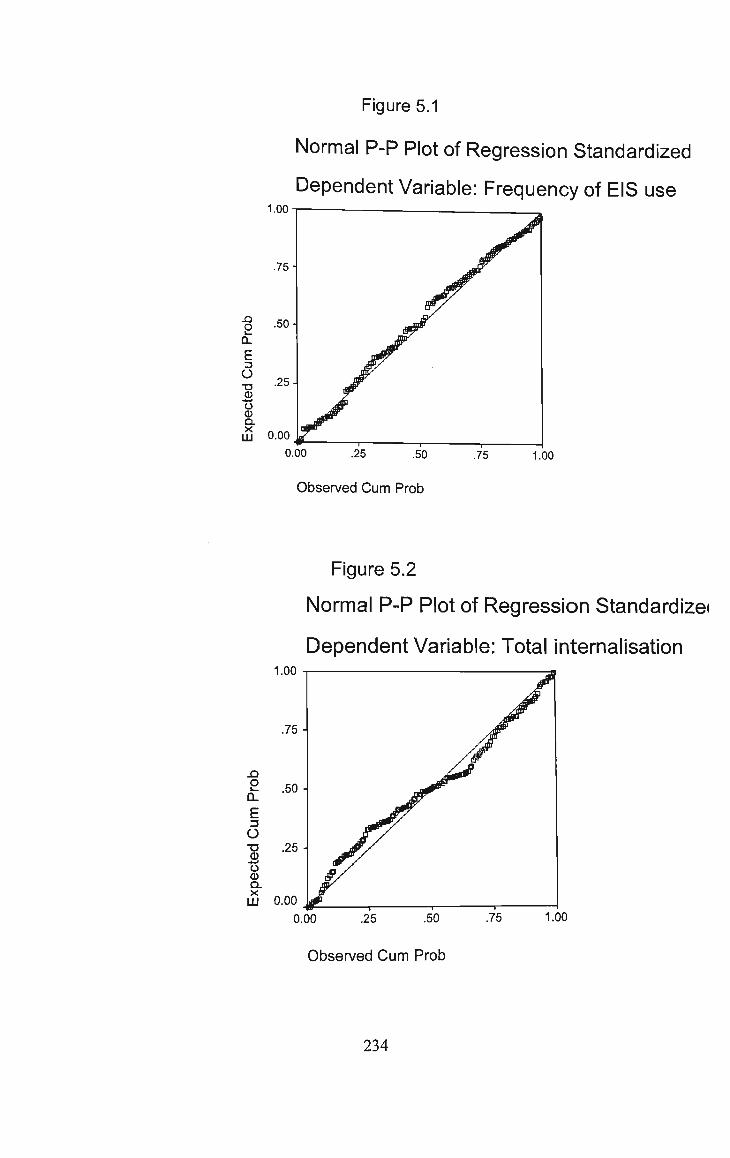
Figure 5.1
Normal P-P Plot of Regression Standardized
Dependent Variable: Frequency of EIS use 1.00
1.00
Observed Cum Prob
Figure 5.2
Normal P-P Plot of Regression Standardize!
Dependent Variable: Total internalisation 1.00
1.00
Observed Cum Prob
234

Figure 5.3
Histogram
Dependent Variable: Frequency of EIS use
-3.00 -2.00 -1.00
-2.50 -1.50
Std. Dev = .98
Mean = .02
N = 138.00
0.00 1.00 2.00
50 .50 1.50
Regression Standardized Residual
Figure 5.4
Histogram
Dependent Variable: Total internalisation
Std. Dev = .97
Mean = -.00
N = 140.00
Y, V. v \? v? v. •* -^ '^ •-*« <_. -r> *?_. * ^ -3- *b
Regression Standardized Residual
235
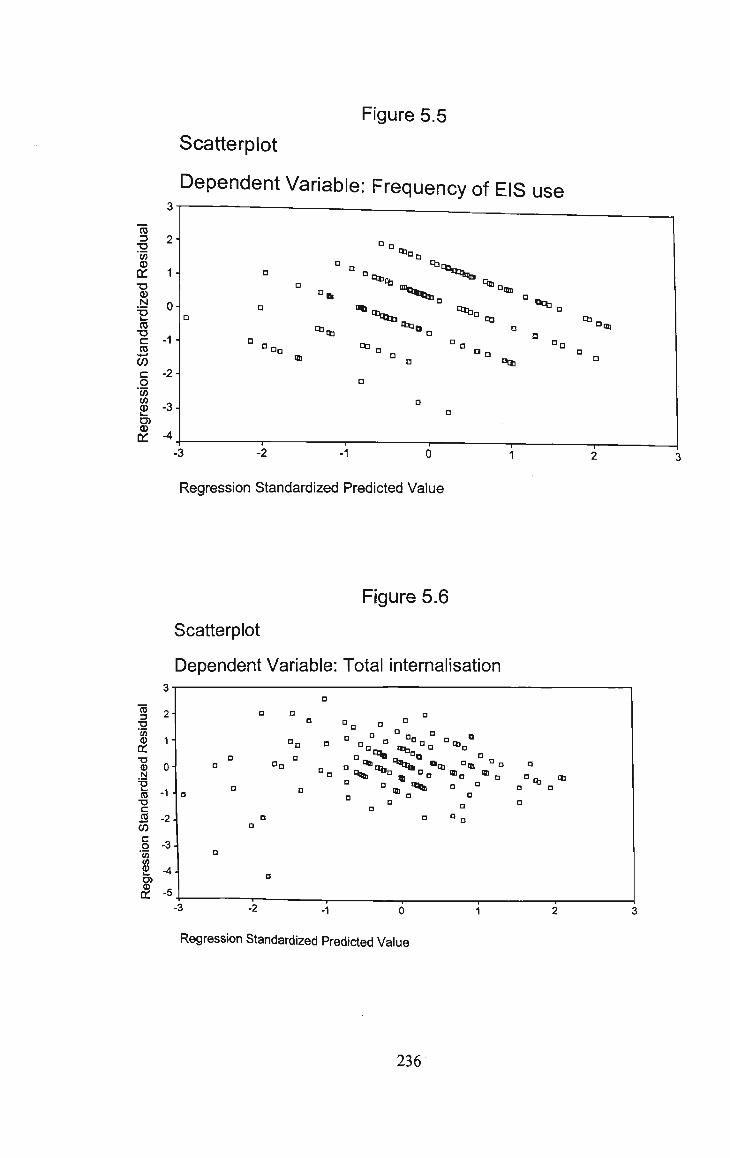
CO
_ •o "to CD
c_ T3 <D N CO •o
c ro CO g 'to co
£ en 0-
Figure 5.5
Scatterplot
Dependent Variable: Frequency of EIS use
-3 -2 -1 0
Regression Standardized Predicted Value
Figure 5.6
Scatterplot
Dependent Variable: Total internalisation
-3 -2 -1 0
Regression Standardized Predicted Value
236


![[12/19/78] Executive Residence Organizational Procedural ...](https://static.fdocuments.net/doc/165x107/618d94b8c1c85a0c293f2dfa/121978-executive-residence-organizational-procedural-.jpg)