2003 AMCHAM HR Seminar Building a High Performance Culture and the Business Performance Management...
38
2003 AMCHAM HR Seminar Building a High Performance Culture and the Business Performance Management (BPM) Michael Keppler Managing Principal, Asia May 23, 2003
-
Upload
nora-allen -
Category
Documents
-
view
214 -
download
0
Transcript of 2003 AMCHAM HR Seminar Building a High Performance Culture and the Business Performance Management...

2003 AMCHAM HR Seminar
Building a High Performance Culture and
the Business Performance Management (BPM)
Michael KepplerManaging Principal, Asia
May 23, 2003

Private & ConfidentialCopyright © Towers Perrin
High performers
“Of all the things I’ve done, the most vital is coordinating the
talents of those who work for us and pointing them toward a certain
goal.”Walter Elias Disney, Founder, Walt Disney
Company, 1954
Source: Collins and Porras, “Built to Last”.

Private & ConfidentialCopyright © Towers Perrin
What Differentiates High Performing Companies?
Private & ConfidentialCopyright © Towers Perrin
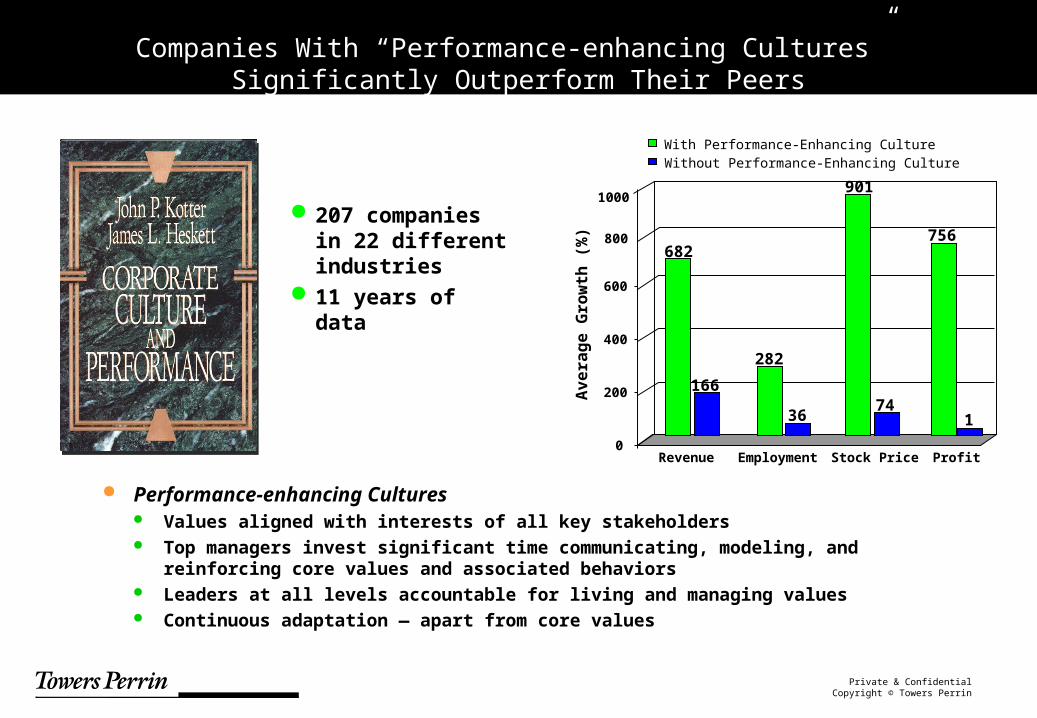
207 companies in 22 different industries
11 years of data
Avera
ge G
row
th (
%)
0
200
400
600
800
1000
682
166
282
36
901
74
756
1
Revenue Employment Stock Price Profit
With Performance-Enhancing CultureWithout Performance-Enhancing Culture
Companies With “Performance-enhancing Cultures” Significantly Outperform Their Peers
Performance-enhancing Cultures Values aligned with interests of all key stakeholders Top managers invest significant time communicating, modeling, and
reinforcing core values and associated behaviors Leaders at all levels accountable for living and managing values Continuous adaptation — apart from core values
Private & ConfidentialCopyright © Towers Perrin
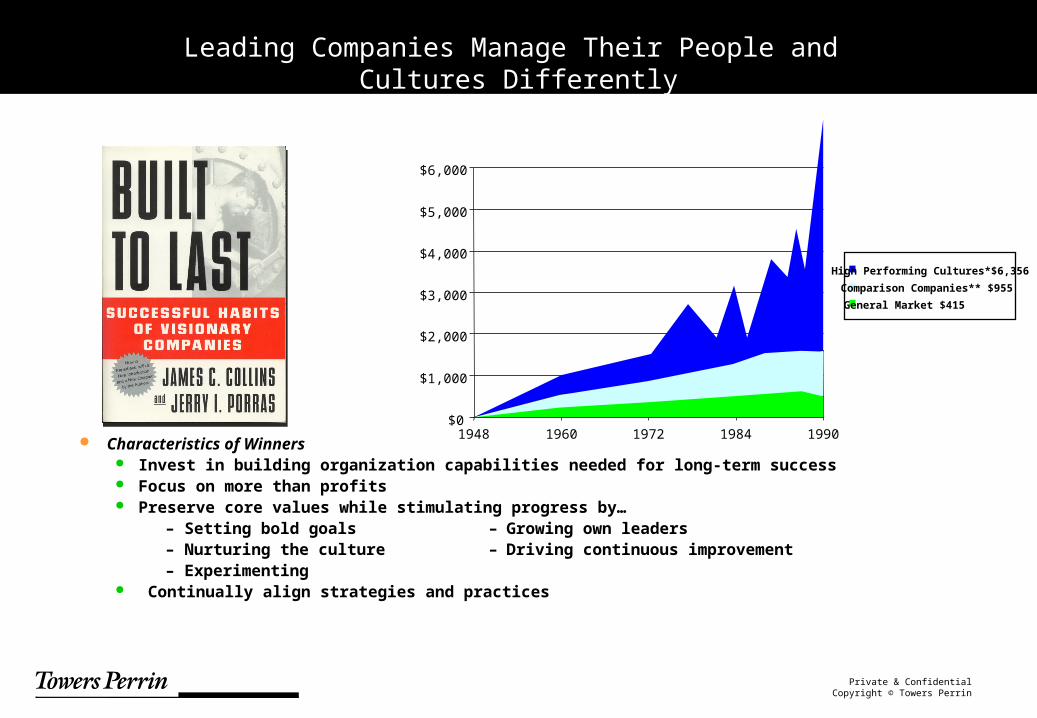
Characteristics of Winners Invest in building organization capabilities needed for long-term success Focus on more than profits Preserve core values while stimulating progress by…
– Setting bold goals – Growing own leaders – Nurturing the culture – Driving continuous improvement – Experimenting
Continually align strategies and practices
High Performing Cultures*$6,356
Comparison Companies** $955
General Market $415
$0
$1,000
$2,000
$3,000
$4,000
$5,000
$6,000
1948 1960 1972 1984 1990
Leading Companies Manage Their People and Cultures Differently
Private & ConfidentialCopyright © Towers Perrin
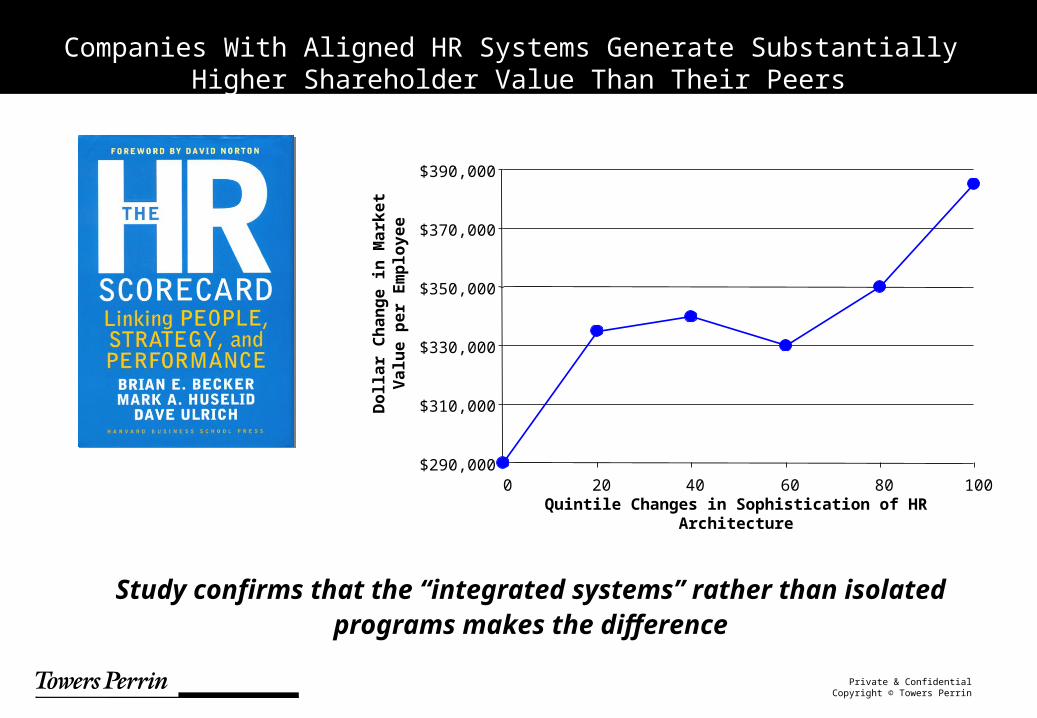
Study confirms that the “integrated systems” rather than isolated programs makes the difference
$290,000
$310,000
$330,000
$350,000
$370,000
$390,000
0 20 40 60 80 100Quintile Changes in Sophistication of HR
Architecture
Dollar
Ch
an
ge in
Mark
et
Valu
e p
er
Em
plo
yee
Companies With Aligned HR Systems Generate Substantially Higher Shareholder Value Than Their Peers
Private & ConfidentialCopyright © Towers Perrin
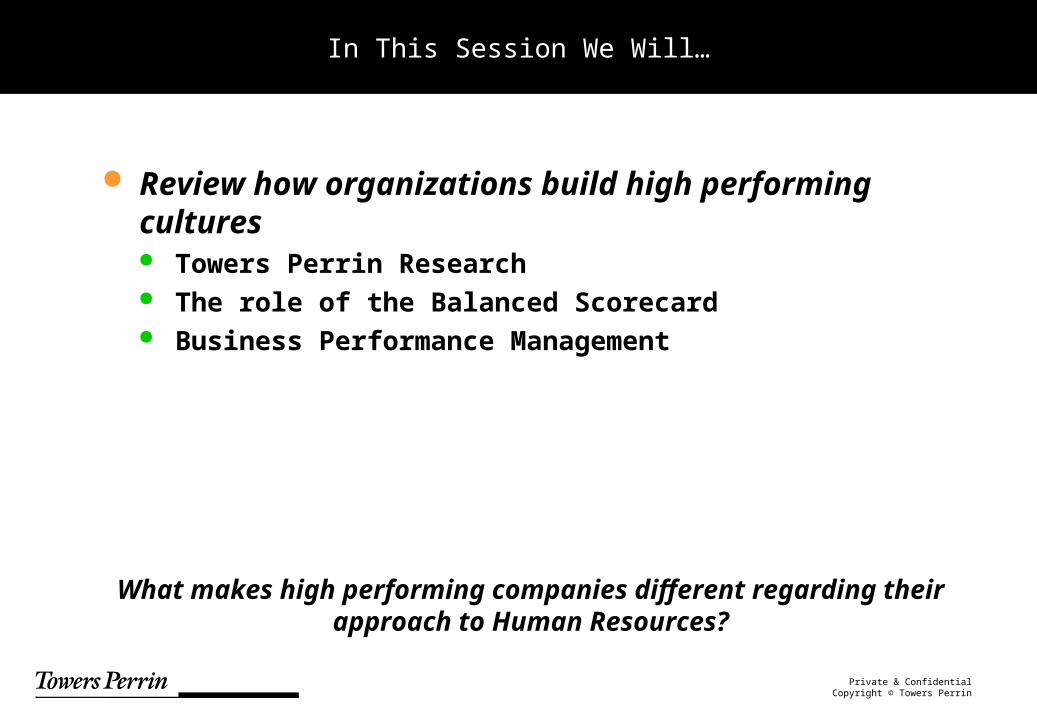
In This Session We Will…
Review how organizations build high performing cultures Towers Perrin Research The role of the Balanced Scorecard Business Performance Management
What makes high performing companies different regarding their approach to Human Resources?

Private & ConfidentialCopyright © Towers Perrin
The Balanced Scorecard
Private & ConfidentialCopyright © Towers Perrin
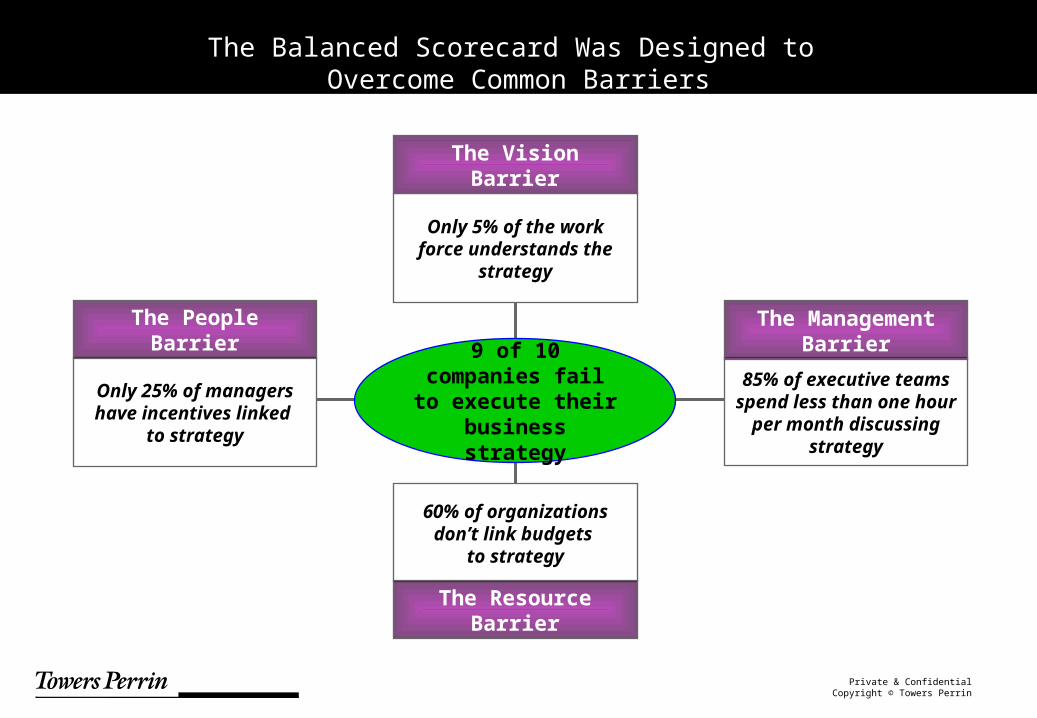
Only 5% of the work force understands
the strategy
60% of organizations don’t link budgets
to strategy
Only 25% of managers have
incentives linked to strategy
85% of executive teams spend less than one hour per month discussing
strategy
9 of 10 companies fail to
execute their business strategy
The People Barrier
The Vision Barrier
The Management Barrier
The Resource Barrier
©1999 The Balanced Scorecard Collaborative, Inc. All rights reserved.
The Balanced Scorecard, Dr. Bob Kaplan
The Balanced Scorecard Was Designed to Overcome Common Barriers

Private & ConfidentialCopyright © Towers Perrin
Balanced Balanced ScorecardScorecard
Clarifying and Translation Vision and Strategy
Planning andTarget Setting
CommunicatingAnd Linking
Strategic Feedback and
Learning
Set stretch targets Identify and rationalize
strategic initiatives Invest to support strategy Annual budgets are linked as
milestones to long term strategy
Feedback process to test strategy
Strategy development is continuous and adapts to environment
Shares strategic framework
Facilitate strategy review and learnings
Strategy informs entire management process
Shared vision is foundation for strategic learning
Education and open communication Top to bottom goal alignment Reward system linkage Performance leadership
behaviors
It Provides a Performance Management Framework for Effective Strategy Implementation

Private & ConfidentialCopyright © Towers Perrin
Vision andStrategy
Financial PerspectiveGoal Key Performance Indicator Target
Employee Perspective
Customer PerspectiveGoal Key Performance Indicator Target Goal Key Performance Indicator
Target
Goal Key Performance Indicator Target
A statement of intent that supports the organisation strategy and objectives
A specific measure of performance that is quantifiable
Specific, definable outcome for the KPI
The Scorecard Approach Ensures a “Balanced” Perspective on What Is Measured
The interests of all stakeholders are represented:shareholders, customers, management, and employees
Internal Business Process

Private & ConfidentialCopyright © Towers Perrin
Key Learnings for Successful Implementation of Balanced Scorecards
The measures used must reflect the key performance drivers and employee influence
The selection and deployment of scorecard measures need to be performed in a rigorous and analytical manner that reflects the economics of the business
The design should involve the explicit consideration of such factors as the organization’s structure, strategy, external environment, and the scorecard objectives
The scorecard design and implementation processes must incorporate a change management framework and leadership involvement
Towers Perrin’s Business Performance Management (BPM) was specifically designed to address these issues
Private & ConfidentialCopyright © Towers Perrin
Business Performance Management (BPM)
Private & ConfidentialCopyright © Towers Perrin
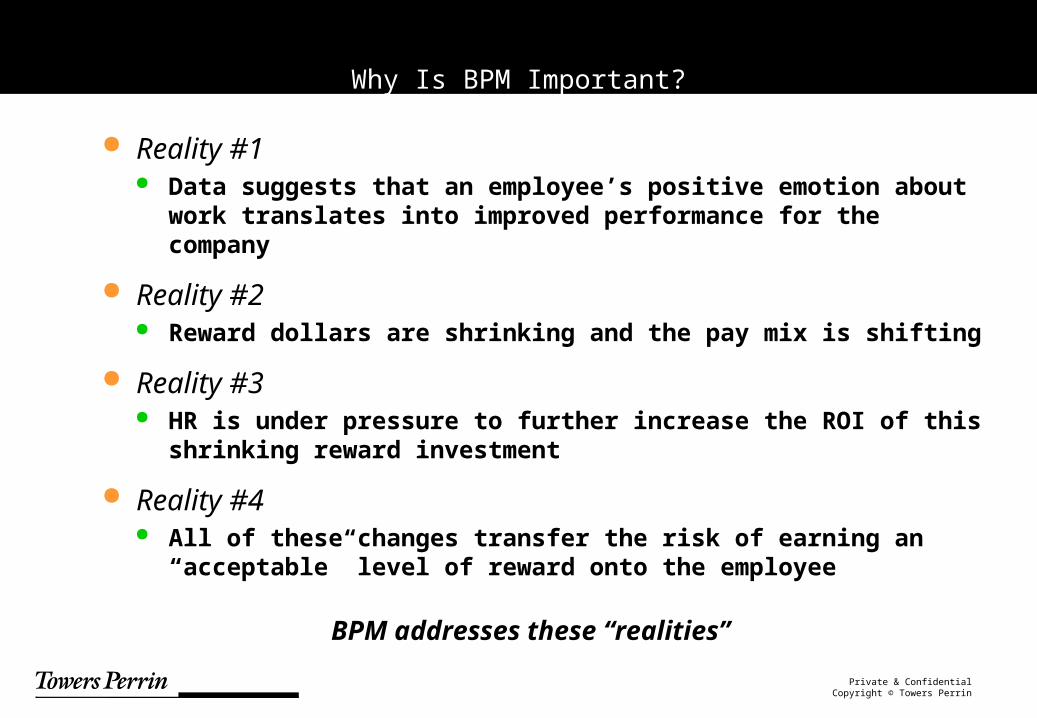
Why Is BPM Important?
Reality #1 Data suggests that an employee’s positive emotion
about work translates into improved performance for the company
Reality #2 Reward dollars are shrinking and the pay mix is shifting
Reality #3 HR is under pressure to further increase the ROI of this
shrinking reward investment
Reality #4 All of these changes transfer the risk of earning an
“acceptable” level of reward onto the employee
BPM addresses these “realities”
Private & ConfidentialCopyright © Towers Perrin
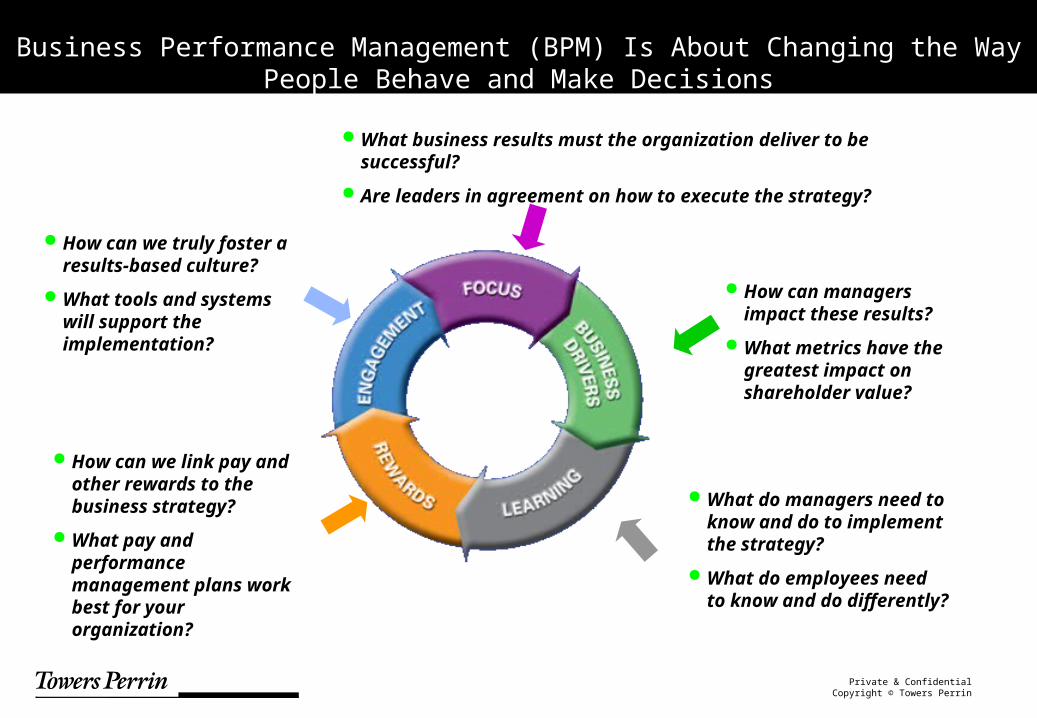
What business results must the organization deliver to be successful?
Are leaders in agreement on how to execute the strategy?
How can managers impact these results?
What metrics have the greatest impact on shareholder value?
What do managers need to know and do to implement the strategy?
What do employees need to know and do differently?
How can we link pay and other rewards to the business strategy?
What pay and performance management plans work best for your organization?
How can we truly foster a results-based culture?
What tools and systems will support the implementation?
Business Performance Management (BPM) Is About Changing the Way People Behave and Make Decisions
Private & ConfidentialCopyright © Towers Perrin
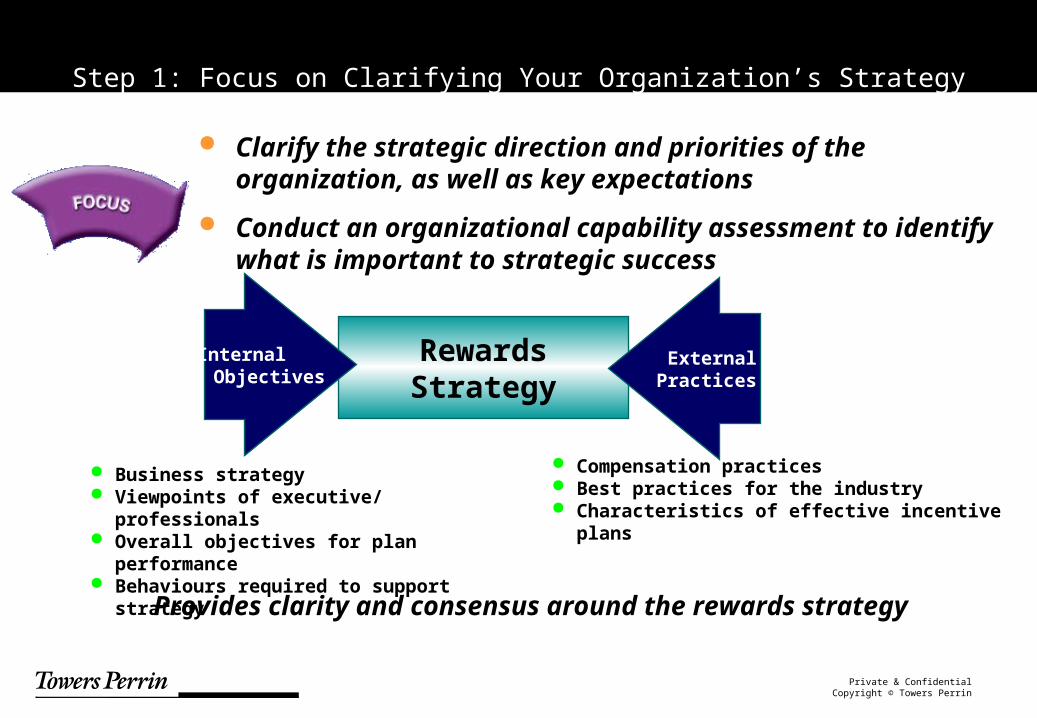
RewardsStrategy
Internal Objectives
External Practices
Business strategy Viewpoints of executive/ professionals Overall objectives for plan performance Behaviours required to support
strategy
Compensation practices Best practices for the industry Characteristics of effective incentive
plans
Step 1: Focus on Clarifying Your Organization’s Strategy
Clarify the strategic direction and priorities of the organization, as well as key expectations
Conduct an organizational capability assessment to identify what is important to strategic success
Provides clarity and consensus around the rewards strategy

Private & ConfidentialCopyright © Towers Perrin
Business DriverDrives our success as
an organization
First Level MetricsMost relevant components
of the business driver
Sub-metricsFurther breakups of the
first level metrics
Customer SatisfactionCustomer Satisfaction
Product InnovationProduct Innovation Customer ValueCustomer Value
ReturnsReturns
QualityQuality
Failure RatesFailure Rates
Cost ofTransactionto Customer
Cost ofTransactionto Customer
BrandImageBrandImage
DeliveryTime
DeliveryTime
Number of Innovative Features
Implemented
Number of Innovative Features
Implemented
# of CustomerSuggestionsIncorporatedinto Design
# of CustomerSuggestionsIncorporatedinto Design
PricePrice
CustomerSupport
CustomerSupport
Relationshipwith
Customer
Relationshipwith
Customer
CycleTimeCycleTime
Number ofCall BacksNumber ofCall Backs
Step 2: Identify What Drives Value
Value Trees identify the financial and operational drivers of shareholder value, along with the underlying activities which impact these drivers. As such, they demonstrate the quantitative linkage between metrics and identify where value can be added in the organization
Identifies the most important business drivers and metrics. Provides the analytical proof necessary to improve reward
program effectiveness

Private & ConfidentialCopyright © Towers Perrin
Step 3: Improve Business Literacy to Build Employee Awareness and Commitment
Provides a tangible tool for employees to make better informed decisions that will increase business
performance

Private & ConfidentialCopyright © Towers Perrin
Job title &Description
Global Account Manager: Being overall responsible for the client relationship, its development and its profitability. Developing, pursuing and closing sales opportunities…..
Individual Measures Team Measures
Total revenue of own accounts
Account profitability
Number of accounts won/ lost
Customer satisfaction: Speed, quality of solutions, and relationship
Customer penetration
Team Revenue
Team profitability
Team customer satisfaction
Pers
onal
Perf
orm
ance
Fact
or
10%
20%
30%
40%
50%
Team Measure
80% 100% 120%90% 110%
10%
20%
30%
40%
50%
Individual Measure
Few MostSome All
Com
pany
Perf
orm
ance
Fact
or
Step 4: Ensure That Employees Are Focused on Doing the Right Things and Then Design and Develop the Right Links to Rewards
Determines the appropriate program, measures and share of performance to drive value creating behaviour

Private & ConfidentialCopyright © Towers Perrin
Process for
Sustained Change
Measurement and
Alignment
Involvement
Performance
Management System
Business Driver
Linkage
Pay for Performanc
e
Development
Engagement tools provide the feedback and support tools to sustain the performance management process
Step 5: Develop a Performance Management System that Ensures Employee Engagement
Successful engagement must:1. Link Strategy to Actions2. Assign accountability3. Provide visual, timely and
accurate feedback
Our research and experience also suggest that there are six key factors to highly effective management systems performance

Private & ConfidentialCopyright © Towers Perrin
Performance Management (feedback and support)Performance Management (feedback and support)
Incentives for nonexecutive managers and employees (including mission-critical functions/roles)
Merit and recognition programs
Manager tools: Performance evaluation, ranking and
calibration Communicating performance, providing
feedback Pay Applications (Kadiri)
HR tools Pay/performance modeling tools Process guidelines High-performer management:
identification, reward analysis,turnover analysis
Employee performance feedback tools
Simulation application (with Root Learning)
Web-based education module
Line-of-sight training
Rewards DesignRewards Design
Performance Management (defining individual performance)Performance Management
(defining individual performance)
Reward/Performance Reward/Performance Management Strategy Strategy
BusinesSightTM Suite of ServicesBusinesSightTM Suite of Services
Goal setting
Competency development
Business Driver AnalysisBusiness Driver Analysis
Financial, customer, operational and employee drivers
Reward strategy clarification sessions and workbooks
Leadership interviews and focus groups
Services and Tools Exist to Ensure an Effective BPM Process
Private & ConfidentialCopyright © Towers Perrin
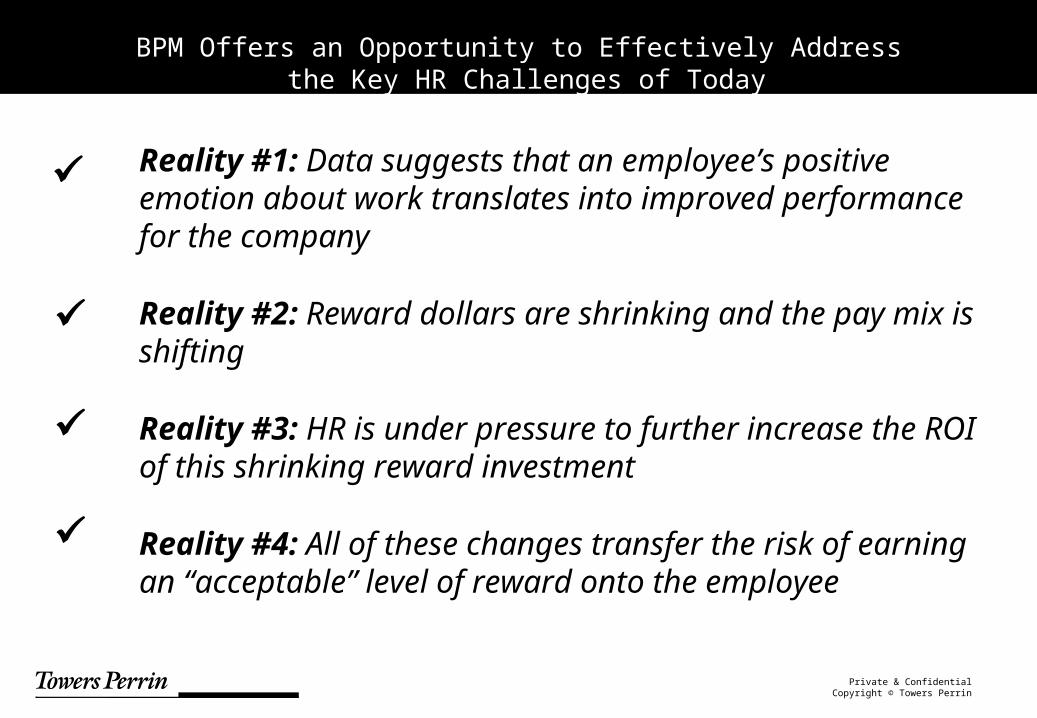
BPM Offers an Opportunity to Effectively Address the Key HR Challenges of Today
Reality #1: Data suggests that an employee’s positive emotion about work translates into improved performance for the company
Reality #2: Reward dollars are shrinking and the pay mix is shifting
Reality #3: HR is under pressure to further increase the ROI of this shrinking reward investment
Reality #4: All of these changes transfer the risk of earning an “acceptable” level of reward onto the employee

Private & ConfidentialCopyright © Towers Perrin
Case Study
Orion Frito-Lay
Private & ConfidentialCopyright © Towers Perrin
Company Overview
Orion Frito-Lay Founded in 1987 as a joint venture of Tong
Yang Corp. and Pepsico.
One of the favorite snack companies in Korea
Headquarter in Seoul and 2 Factories in Cheongjoo and Icheon
Financial Performance (2001) Revenue 122,988 Mil. Won Net Income 5,049 Mil. won

Private & ConfidentialCopyright © Towers Perrin
Business Performance Management was designed and implemented as one component of total HR innovation for Orion Frito-Lay
HR Innovation includes… Business Performance Management
Balanced Scorecard KPIs for each Department and Job Performance Management Process Strategic Incentive System
Job Redesign based on Business Process Innovation Job Grade Structure Compensation Strategy and Program Change Management
Private & ConfidentialCopyright © Towers Perrin
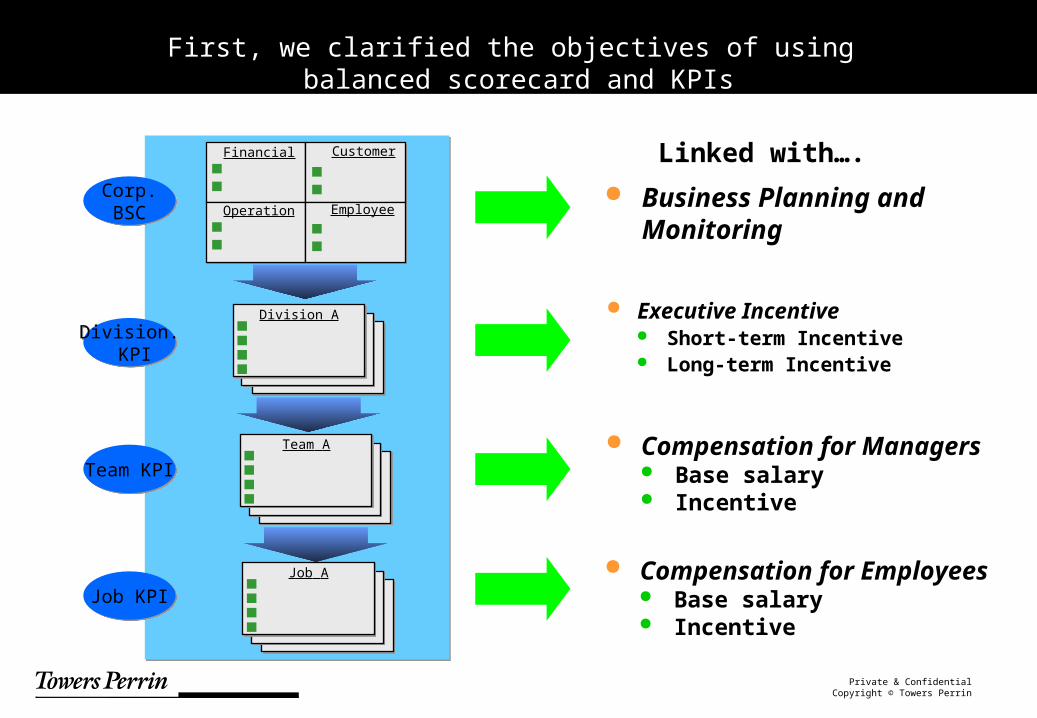
First, we clarified the objectives of using balanced scorecard and KPIs
Corp.BSC
Corp.BSC
Division. KPI
Division. KPI
Team KPITeam KPI
Job KPIJob KPI
Financial Customer
EmployeeOperation
Division A
Team A
Job A
Linked with….
Business Planning and Monitoring
Executive Incentive Short-term Incentive Long-term Incentive
Compensation for Managers Base salary Incentive
Compensation for Employees Base salary Incentive

Private & ConfidentialCopyright © Towers Perrin
BSC development was the result of sequential interactive work session from top management team to line managers
Development process itself was an organizational learning and consensus-building process -Take out “shading”
Corp. BSCCorp. BSC
Division KPI
Division KPI
TeamKPI
TeamKPI
JobKPIJobKPI
Financial Customer
EmployeeOperation
Division A
Team A
Job A
1. Executive Work Session CEO + Division Heads
2. Division Work Session Division Head + Team Managers
3. Manager Work Session All Team Managers

Private & ConfidentialCopyright © Towers Perrin
Balanced scorecard was developed as a result of executive work session based on insights from strategy clarification
FinancialValue TreeFinancial
Value TreeStrategyThemesStrategyThemes
Orion Frito-Lay Strategy Clarification
Organizational
Capabilities
Organizational
Capabilities
OFL BSC Model
EmployeeEmployeeFinancial Customer Operational
Maximize Profitabili
ty
Maximize Profitabili
ty
NOPBTNOPBT
Sales GrowthSales
Growth
RevenueRevenue
Customer
Satisfaction
Customer
SatisfactionM/SM/S
FreshnessFreshness
…..….. …….…….
………………..………………..
…….…….
…….…….
…...…...
……...……...
…….…….
……….……….
Employee SatisfactionEmployee Satisfaction
……..……..
Brand EquityBrand Equity
CRS IndexCRS Index
…….…….
…...…...
OPEX(Operational Excellence)
OPEX(Operational Excellence)
……….……….

Private & ConfidentialCopyright © Towers Perrin
Balanced scorecard map was used as a platform to link strategy with each KPIs
KSFKSF
KPIKPI
EmployeeEmployeeFinancial Customer Operational
Maximize ProfitabilityMaximize
Profitability
NOPBTNOPBT
Sales GrowthSales
GrowthRevenueRevenue
Customer SatisfactionCustomer
Satisfaction
M/SM/S
FreshnessFreshness
…..….. …….…….
………………..………………..
…….…….
…….…….
…...…...
……...……...
…….…….
……….……….
Employee SatisfactionEmployee Satisfaction
……..……..
Brand EquityBrand Equity
CRS IndexCRS Index
…….…….
…...…...
OPEX(Operational Excellence)
OPEX(Operational Excellence)
……….……….

Private & ConfidentialCopyright © Towers Perrin
Four guiding principles were used to identify KPIs for each organizational unit
1Clear Linkage with Business Strategy
1Clear Linkage with Business Strategy
3Measurability
3Measurability
4Practical
Usefulness
4Practical
Usefulness
2Accountability(Link with EachUnit’s Mission)
2Accountability(Link with EachUnit’s Mission)

Private & ConfidentialCopyright © Towers Perrin
Accountability Map was developed to link strategy, process, KSF/KPI, and organizational unit
KSF ………..
………..
Sub-KSF KPI Measurement Detail AccountabilityMain Support
고객니즈 부합
적시성 ( 기획기간 , 적시출시 )/ 정보공유원가절감
신제품 매출액 히트상품출시율
MarketingDivision
R&DDivision
ProductPlanningProductPlanning …..…..
….….
SourcingSourcingProductionProduction
Advertising/ Promotion PlanningAdvertising/ Promotion Planning
MainMainProcessProcess
MainMainProcessProcess
사원 관점사원 관점재무적 관점 고객 관점 운영 관점
….….
StrategyStrategyMapMap
StrategyStrategyMapMap

Private & ConfidentialCopyright © Towers Perrin
KPI allocation to each organizational unit was finalized following the validation and prioritization process
Team A
Draft KPI ImportanceAccount-
ability
H
M
H
L
H
M
H
H
L
M
H
H
Team CTeam B
KSF KPI Team A Team B Team C
-------- -------
----- -----
------- -------
-----
----- -----
---- ----
----- -----
---

Private & ConfidentialCopyright © Towers Perrin
Job KPI was developed to link team KPI and each job’s mission
Step 2UnderstandTeam KPI
Step 2UnderstandTeam KPI
Step 1Define Job
Step 1Define Job
Step 3Draft Job KPI
Step 3Draft Job KPI
Step 4Set Performance
Standard
Step 4Set Performance
Standard
Step 5Validation
Step 5Validation
Team Mission
Team KSF/Sub-KSF
Team KPI
Job Title
Job Mission
Main Tasks
Brainstorm
Benchmark
Quantitative: Measurement Detail
Qualitative :Clear Definition of Performance Standard
Check consistency with Guiding Principles
Private & ConfidentialCopyright © Towers Perrin
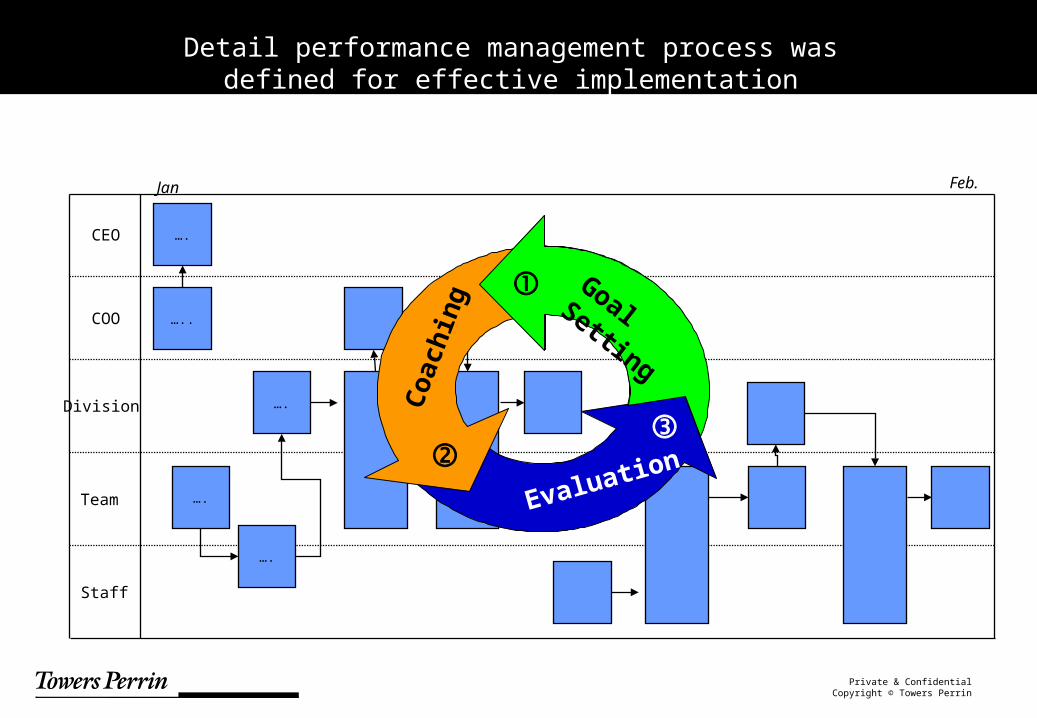
Detail performance management process was defined for effective implementation
CEO
COO
Division
Team
Staff
…..
Jan Feb.
….
….
….
….
Goal Setting
Evaluation
Coach
ing

Private & ConfidentialCopyright © Towers Perrin
…and Created a broad-based incentive plan aligned with the value drivers
0P r i v a t e & C o n fi d e n t i a l
C o p y r i g h t © T o w e r s P e r r i n
B r o a d - b a s e d I n c e n t i v e P l a n : B a s i c S t r u c t u r e
5 . 5 6 - 1 2 %
1 . T a r g e tI n c e n t i v e
P a y - o u t R a t e
2 . C o r p o r a t eP e r f o r m a n c e
M u l t i p l i e r
3 . D i v i s i o n / T e a mP e r f o r m a n c e
M u l t i p l i e r
I n d i v i d u a lI n c e n t i v e
P a y - o u t R a t e =
K P I : N O P B T
P e r f o r m a n c eS p e c t r u m : 7 0 - 1 3 0 %
M u l t i p l i e r : 7 0 - 1 3 0 %
M u l t i p l i e r : 7 0 - 1 6 0 %
3Private & Confidential
Copyright Towers Perrin
Division/Team Performance Multiplier Matrix
Multiplier를 적용하여 산정된
0% 100% 150%N B M E O
0% N 0% 0% 0% 0% 0%0% 0% 0% 0% 0%
70% B 0% 70%0% 75% 85%
100% M 70% 100% 120%105%
130% E 130%
160% O130% 160
부문 평가 등급팀평가 등급
(70%)
1Private & Confidential
Copyright Towers Perrin
Cost Impact Analysis
80% 100% 120%
CorporatePerformanceMultiplier
150%
Achievement
50%
80% 100% 120%
150%
50%
80% 100% 120%
150%
50%
필요 재원 규모
필요 재원 규모
필요 재원 규모
Total Cost for Each CaseTotal Cost for Each Case
Illustration
* Data presented are hypothetical numbers.
Private & ConfidentialCopyright © Towers Perrin
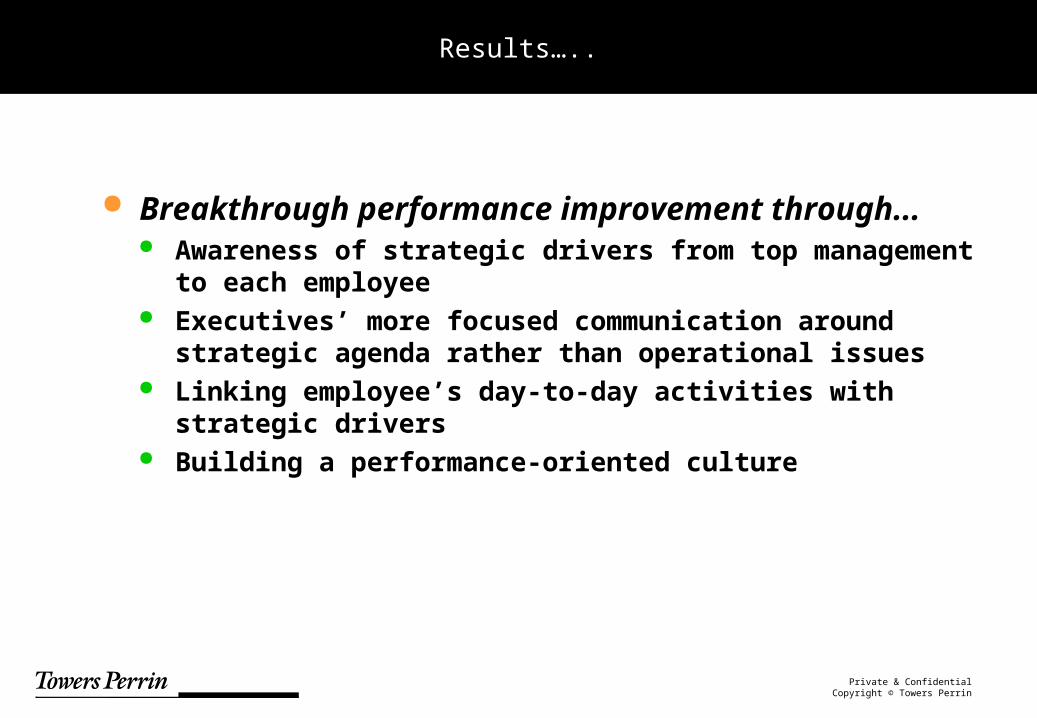
Results…..
Breakthrough performance improvement through... Awareness of strategic drivers from top management
to each employee Executives’ more focused communication around
strategic agenda rather than operational issues Linking employee’s day-to-day activities with
strategic drivers Building a performance-oriented culture

Private & ConfidentialCopyright © Towers Perrin
In Conclusion, BPM….
Aligns execution of the business strategy with the creation of shareholder value
Applies a rigorous measurement methodology to focus and align the business measures that define success for the company
Enables measures and weightings to be customized to reflect the cause and effect
Integrates measures across organizational functions, processes, and levels in support of value drivers and key company measures
Creates line-of-sight for employees by linking activities and processes to benchmark measures which are then linked to the financial drivers of success
Supports modeling of impact of changes in behaviors on company performance
The imperative to build a performance based culture has never been stronger

Private & ConfidentialCopyright © Towers Perrin
Questions?


![[Sxsw] Amcham](https://static.fdocuments.net/doc/165x107/547f55f3b4af9fbe788b46ba/sxsw-amcham.jpg)