2002 STATEWIDE NONRESIDENTIAL STANDARD PERFORMANCE ... · 2002 STATEWIDE NONRESIDENTIAL STANDARD...
216
2002 STATEWIDE NONRESIDENTIAL STANDARD PERFORMANCE CONTRACT PROGRAM MEASUREMENT AND EVALUATION STUDY PROCESS EVALUATION AND MARKET ASSESSMENT REPORT FINAL Prepared for Pierre Landry Southern California Edison Company 2131 Walnut Grove Ave. Rosemead, CA 91770 Prepared by QUANTUM CONSULTING INC. 2001 Addison Street, Suite 300 Berkeley, CA 94704 P1974 March 25, 2004
Transcript of 2002 STATEWIDE NONRESIDENTIAL STANDARD PERFORMANCE ... · 2002 STATEWIDE NONRESIDENTIAL STANDARD...

2002 STATEWIDE NONRESIDENTIAL STANDARD PERFORMANCE CONTRACT PROGRAM MEASUREMENT AND EVALUATION STUDY
PROCESS EVALUATION AND MARKET ASSESSMENT REPORT
FINAL
Prepared for Pierre Landry Southern California Edison Company 2131 Walnut Grove Ave. Rosemead, CA 91770 Prepared by
QUANTUM CONSULTING INC. 2001 Addison Street, Suite 300 Berkeley, CA 94704 P1974 March 25, 2004

Quantum Consulting Inc. i Table of Contents
TABLE OF CONTENTS
Section Page
EXECUTIVE SUMMARY ES-1
1 INTRODUCTION
1.1 Evaluation Content, Objectives, Scope 1-1
1.2 Summary of Approach and Study Timeline 1-2
1.3 Summary of the 2002 NSPC Program Requirements 1-4
1.4 Guide to this Report 1-6
2 KEY FINDINGS
2.1 Overall Summary of Key Findings, Implications and Recommendations
2-1
2.2 Summary of 2002 Program Tracking Data 2-11
2.3 Summary of 2002 Customer Participant Results 2-13
2.4 Summary of Multi-Year Customer Market Survey Results 2-21
2.5 Summary of 2002 EESP Results 2-29
2.6 Summary of Customer “Dropout” Interview Results 2-32
3 SUMMARY OF 2002 SPC PROGRAM TRACKING DATA
3.1 Summary of Program Activity 3-1
3.2 Composition of Applicants: Customer Self-Sponsors vs. EESP-Sponsored Customers
3-2
3.3 Statewide Participation by End-User Segments 3-4
4 CUSTOMER PARTICIPANT RESULTS
4.1 General Characteristics of the 2002 Participant Customer Sample 4-1
4.2 Program-Related Decisions 4-5
4.3 Process-Related Issues 4-10
4.4 Program Effect on Future Energy-Efficiency Actions 4-16
4.5 Program Participant Experience with EESPs 4-17

Quantum Consulting Inc. ii Table of Contents
5 EESP RESULTS
5.1 Key Findings 5-1
5.2 Overview and Approach 5-5
5.3 Firmographics of EESP Sample 5-5
5.4 Status of Past Applications 5-6
5.5 Process-Related Issues 5-7
5.6 Potential Market Effects 5-15
6 CUSTOMER MARKET SURVEY RESULTS
6.1 Summary of Sampling Process 6-1
6.2 Establishment Characteristics 6-3
6.3 Energy Price Perceptions 6-6
6.4 Conservation, Demand Response, and Efficiency Actions 6-8
6.5 Energy-Related Decision Making 6-16
6.6 Program Awareness and Participation 6-19
6.7 Familiarity With and Use of Performance Contracting 6-24
6.8 Awareness and Assessment of Specific Types of Energy Service Providers and Service Offers
6-26
6.9 Comments and Suggestions Regarding Energy-Efficient Product, Practices, or Programs
6-28
Appendix
APPENDIX A: PROGRAM MANAGER INTERVIEWS A-1
APPENDIX B: CUSTOMER DROPOUT ANALYSIS B-1
APPENDIX C: SURVEY INSTRUMENTS C-1

Quantum Consulting Inc. ES-1 Executive Summary
EXECUTIVE SUMMARY
In this report, we present results from a set of evaluation activities focused on California’s Nonresidential Standard Performance Contract Program for program year 2002 (PY2002). The PY2002 evaluation scope includes process, market, and impact evaluation components. This report covers only the process and market evaluation. The impact evaluation report is in progress and will be published separately as its own volume. These evaluation activities were preceded and informed by evaluations of the nonresidential SPC program conducted for each of the program years from PY1998 through PY2001.
EVALUATION CONTEXT, OBJECTIVES, AND SCOPE
Program Evaluation Context
The public policy objectives and strategies associated with intervening in energy-efficiency markets have been in a state of dynamic change over the past 8 years. The NSPC Program (also known from PY1999 through PY2001 as the Large NSPC Program) was developed in late 1997, and originally contained elements associated with both resource acquisition and market transformation program strategies. The current focus of the NSPC program is on resource acquisition.
Objectives and Scope
The PY2002 evaluation focuses on process evaluation, market assessment, and impact evaluation. The primary goal is to provide feedback to program planners and policy makers to help improve the program, as necessary. This process evaluation and market evaluation includes: (a) characterizing how the program actually worked; (b) reviewing and integrating the results of utility tracking, monitoring, and measurement activities; and (c) assessing energy-efficiency related market conditions. The subsequent impact evaluation volume will provide results of an assessment of verification, energy savings, and the net-to-gross ratio.
SUMMARY OF KEY FINDINGS, IMPLICATIONS, AND RECOMMENDATIONS
Summary of Key Program-Related Findings
Program related findings are drawn from interviews with customer participants, EESPs, program managers, and analysis of program tracking data. Key findings include the following:
• Demand for the 2002 NSPC was extremely strong, with program funds subscribed very quickly, generally within two months or less of program opening.
• Projected savings are significant at 240 GWh and 5 million therms; however, final savings may be somewhat lower because some projects dropped out after the end of the 2002 program year and additional projects, particularly larger ones, are not yet installed.
• Industrial customers and process type measures continue to account for a majority of impacts.

Quantum Consulting Inc. ES-2 Executive Summary
• Customer and EESP satisfaction with program features and administration are very high, continuing the positive trend of the 2000 and 2001 program years.
• Most applications are now paid based on calculated not measured savings.
• EESPs generally reported positive effects of the program on their businesses, but noted funding shortages limit the program’s ability to move the market.
• A net-to-gross ratio will be estimated for the 2002 program year as part of the impact evaluation, which will be published later in 2004 in a separate report. However, preliminary analysis of free ridership levels point to a somewhat higher level than in several previous years. Nonetheless, we believe that the current net-to-gross value in the Energy Efficiency Policy Manual remains appropriate.
Market Findings
Key trends in the overall market for energy-efficiency related services among large customers (> 500 kW) are drawn from a quantitative customer baseline survey conducted in the fall of 2003. These findings include the following:
• Many large non-residential customers believe the energy crisis-induced rate increases will last over ten years.
• Sixty percent of the large nonresidential market reports that the energy crisis spawned increased interest in energy efficiency in their organizations.
• Eighty percent of the market reported taking conservation and energy efficiency actions in the past year, resulting in a reported 7 percent average reduction in electricity usage.
• Roughly half of large customers report they still take or are willing to take demand reduction actions to reduce peak demand on power alert days if supplies are short.
• The percentage of customers with formal policies requiring purchase of energy efficiency equipment increased from 30 percent in 1999 to 43 percent in 2003.
• Seventy four percent of the market, as compared with 55 percent in 1999, said they had been approached by firms offering services to improve their facility’s energy efficiency in the past year.
• Customers’ credibility ratings decreased across the board for all types of energy efficiency service providers; however, IOUs remained the highest rated private sector source of energy efficiency information.
• The market for performance contracting remains extremely stable, showing virtually no change in customer familiarity, contracts offered, and contracts per year since 1999.
• Half of the market reported being aware of the SPC program. SPC awareness levels were very similar across utility service territories. Impressions of the SPC program were generally favorable.

Quantum Consulting Inc. ES-3 Executive Summary
• Customers, though positive about existing efficiency programs, provided a number of general recommendations including improving the customer focus of programs, more information and better showcasing of successful efficiency projects, more flexibility, and increased incentive levels.
Recommendations
A brief summary of our recommendations is provided below. Readers are strongly encouraged to read the entire recommendations subsection in Section 2 of this report to appreciate the range of issues associated with these suggestions.
Continue Successful Program Characteristics – High Levels of Customer and EESP Satisfaction
Program administrators received consistent praise from participants for their handling of the overall implementation process, which testifies to program administrators’ efforts to streamline the application and M&V processes over the five-year history of the program. Focus on participant support and a satisfactory program experience should continue to drive program implementation processes. Some of this increase in satisfaction over the history of the program may be associated with the dramatic shift from measured to what are now mostly calculated project savings.
Continue Successful Program Characteristics – Focus on Industrial Process and HVAC Projects
Based on this and previous evaluations of the NSPC, we believe that the NSPC continues to fulfill a critically important role in the portfolio of nonresidential energy-efficiency programs by supporting complex and comprehensive energy-efficiency projects that offer significant potential but do not lend themselves to prescriptive approaches. The focus on end-use incentives allows participants flexibility in developing projects that are specific to the unique processes of individual customers. Program requirements that result in the majority of incentives being used for non-lighting projects should be continued. Since the NSPC is the only program well suited to capturing the wide variety of savings opportunities in the industrial sector, and since there is evidence that for a significant amount of untapped industrial potential, industrial participation should continue to be encouraged and promoted.
Consider Increasing the Amount of NSPC Incentives Available
Committed NSPC incentive funds have ranged from a high of $28 million in PY2000 to lows of roughly $18 million in PY2001 and PY2002. Program funds have been fully subscribed with extensive waiting lists ever since 1998. Given this strong market demand for the program, the high cost-effectiveness of efficiency projects in the large nonresidential market, and the significant remaining potential in the industrial sector, increasing available funds for this program could make a strong contribution to the CPUC’s and utilities’ goals of expanding the acquisition of energy efficiency resources.
Consider Either Expanding and Integrating the Impact Evaluation Function or Increasing the Percentage of Projects for Which Savings Measurement is Required in the Program Process
Over the five-year history of the NSPC program, whether and to what extent savings are measured versus calculated savings has been an ongoing issue. In the first two years of the
Quantum Consulting Inc. ES-4 Executive Summary
program, M&V was required on virtually all projects. As a result, traditional impact evaluation was unnecessary as measurement was built into the program process. In PY2000, the utility program administrators introduced the calculated savings path. Under the calculated path, on-site verification of project installation remained a requirement but direct measurement of savings was replaced with engineering calculations approved by the administrators. In PY2002, the calculated path became the default application path with the administrators retaining the right to require the M&V path for projects they deemed too complex.
As part of this PY2002 NSPC evaluation, an impact evaluation is being conducted. The impact evaluation will be published later in 2004 in a separate report. Initial review of the project applications and detailed investigation of almost half of the impact evaluation sample indicates that there may be a need for impact evaluation for a higher fraction of projects than are currently under the M&V path. This is because there appear to be a number of projects with savings that are very difficult to estimate without pre- and/or post-installation measurements, for example, compressed air, variable-speed drives, and other industrial process improvements.
Our preliminary view is that either the program impact evaluation should be expanded and integrated into the program implementation process or a larger percentage of projects should be required to follow the M&V path. Based on feedback from the NSPC program managers and experience from the previous NSPC evaluations, we recommend that savings measurement be addressed in the future through an expanded impact evaluation function. The primary difference in these two approaches is whether the measurement process financially impacts the individual applicants. Note that if an impact evaluation approach is pursued, it will be important for the evaluation to be integrated into the program implementation process so that pre-installation measurements can be taken for complex projects.
It should be noted, however, that if the impact evaluation function is relied completely on instead of in-program savings measurement, the program should perhaps be viewed more as a custom rebate program than a standard performance contract program.
Consider Additional Programmatic Efforts to Reduce Free Ridership
As noted under our Summary of Findings above, preliminary estimates of free ridership for the NSPC program for PY2002 are moderately high, as were free ridership estimates for most of the previous program years. The suggestions to consider below are not offered as panaceas or without recognition that there are practical difficulties associated with each of them.
One approach to consider for the NSPC program is increasing incentive levels for higher payback measures or emerging technologies. There is a philosophy held by some in the efficiency field that decreasing incentive levels over time is appropriate as a market transformation or exit strategy from a market. This approach was part of the policy environment for the NSPC in its early years when the focus of the program was on market transformation. For a specific efficiency technology, such as a first-generation T8 lamp, this approach can be effective if carried out with good market intelligence. For a program focused on comprehensive efficiency improvements that pays a single price for savings by end use, such as the NSPC, this approach is more problematic and can actually exacerbate free ridership problems, particularly if the intent is not to exit the market. There is a point at which lowering incentive levels creates a token-level incentive that has limited effect on the financial decision

Quantum Consulting Inc. ES-5 Executive Summary
making of end users. We believe that certain higher payback measures and emerging technologies may justify higher incentive levels than the NSPC currently offers.
Project-specific investigation of free ridership for the NSPC program also indicates that projects with extremely short payback periods (under 6 months) are more likely to be free riders, all else being equal. Although it is certainly true that many customers do not adopt attractive efficiency projects with very low paybacks, a payback floor can still be helpful, particularly if it is not set too high. Several program administrators in other parts of the country have used payback floors effectively, although they can present project cost verification challenges. If a payback floor is used it should be set quite low, for example, at 6 months, and certainly at no more than one year.
The approaches discussed above are focused on trying to minimize free ridership through indirect programmatic rules and requirements. The advantages of such approaches are that the rules and requirements are codified and apply equally to all customers. Disadvantages of these approaches are that they are indirect attempts to minimize free ridership that are based on correlations between project characteristics and free ridership for which there are always exceptions.
Another approach is to allow the program administrators the flexibility to simply exclude projects from the program that they believe are very high probability free riders. Administrators in several other jurisdictions have used this; however, these are generally smaller service territories than those in California. In these cases, the administrator has the flexibility to determine total incentive amounts on a case-by-case basis, including zero incentives. While we do not recommend going to case-by-case incentive determination, we do believe consideration should be given to development of a process by which projects considered to be very high likelihood free riders could be excluded from participation. Such a process could require the involvement of an advisory group that includes staff from the CPUC. This would offer protection from claims that such exclusions were unfounded or unfair. Alternatively, or in conjunction with this type of approach, rules could be developed that exclude incentive payments for projects that are driven exclusively by non-energy factors that produce energy savings as a by-product, such as some naturally-occurring improvements in certain industrial processes.
It should be noted that under current and recent CPUC policies, program implementers (whether utility or non-utility) have no direct financial incentive to minimize free ridership (or maximize spillover). There are many other programs besides the NSPC for which estimation of free ridership is likely an issue, however, most programs, particularly non-utility programs, do not currently include an ex post free ridership analysis in their evaluations. This issue is discussed further in Section 2 of this report.
Finally, readers should keep in mind that some free ridership is inevitable in energy efficiency programs. The presence of possible free riders should not be considered a reason, in and of itself, to reduce or eliminate program efforts but rather should be seen as something to be managed and minimized as best as possible.

Quantum Consulting Inc. 1-1 Introduction
1. INTRODUCTION
In this report, we present results from a set of evaluation activities focused on California’s Nonresidential Standard Performance Contract Program for program year 2002 (PY2002). The PY2002 evaluation scope includes process, market, and impact evaluation components. This report covers only the process and market evaluation. The impact evaluation report is in progress and will be published separately as its own volume. These evaluation activities were preceded by evaluations of the nonresidential SPC program conducted for the each of the program years from PY1998 through PY2001.1 This section provides a brief introduction to the content of the current report.
1.1 EVALUATION CONTEXT, OBJECTIVES, AND SCOPE
1.1.1 Program Evaluation Context
The public policy objectives and strategies associated with intervening in energy-efficiency markets have been in a state of dynamic change over the past 8 years. The NSPC Program (also known for PY1999 through PY2001 as the Large NSPC Program)2 was developed in late 1997, and originally contained elements associated with both resource acquisition and market transformation program strategies. The current focus of the NSPC program is on resource acquisition. The utility 2002 program proposals include the following strategic objectives:
• achieve long-term energy savings and demand reduction by influencing commercial, industrial and agricultural businesses to implement long lasting energy efficiency retrofits at their existing facilities;
• help business customers obtain permanent and significant energy bill reductions via installation of energy efficient equipment and facility retrofits; and
• introduce innovative energy efficient technology into the nonresidential market sector.
1 Please see past program evaluations: Evaluation of the 1998 Nonresidential Standard Performance Contract Program, Volume I Final Report. XENERGY, Inc., June 1999; 1999 Nonresidential Large SPC Evaluation Study, Volume I Final Report, XENERGY, Inc., January 2001; 2000 and 2001 Nonresidential Large SPC Evaluation Study, XENERGY, Inc., December, 2001; and Nonresidential SPC M&V Case Study, XENERGY, Inc. April, 2002. For more information on the Small Business SPC Program refer to Appendix A or XENERGY, Inc., 1999 State-Level Small/Medium Nonresidential MA&E Study, Final Report, December 2000. All of these reports are available at www.calmac.org.
2 The original (1998 NSPC) program had no explicit customer size requirements. In 1999, the program was split into separate programs (the LNSPC Program and the SBSPC Program) for large and small customers respectively. In PY2002, the large and small program elements were recombined into one program.

Quantum Consulting Inc. 1-2 Introduction
1.1.2 Objectives and Scope
The PY2002 evaluation focuses on process evaluation, market assessment, and impact evaluation. The primary goal is to provide feedback to program planners and policy makers to help improve the program, as necessary. Work-in-progress results were presented to program managers in September 2003 to support development of the PY2004 program plans.
This process evaluation and market evaluation includes: (a) characterizing how the program actually worked; (b) reviewing and integrating the results of utility tracking, monitoring, and measurement activities; and (c) assessing energy-efficiency related market conditions. In addition, the subsequent impact evaluation volume will provide results of our independent assessment of verification, energy savings, and the net-to-gross ratio.3
1.2 SUMMARY OF APPROACH AND STUDY TIMELINE
Six major areas of primary research were conducted for this study:
• In-depth interviews with customer participants in the 2002 NSPC Program, including customers that applied and later dropped out of the program
• A quantitative survey of the entire large nonresidential end user market
• In-depth interviews with energy-efficiency survey provider (EESP) participants and non-participant
• Interviews with utility NSPC program managers
• Integration and analysis of utility program tracking data
• Integration of results into key project findings
Exhibit 1-1 presents more detail on the types of interviews completed for this evaluation.
3 Improving the Standard Performance Contracting Program: An Examination of the Historical Evidence and Directions for the Future, prepared for Southern California Edison, December 2001.

Quantum Consulting Inc. 1-3 Introduction
Exhibit 1-1 Summary of Data Collection Activities for the 2002 NSPC Study
Market Actor Survey Approach Sampling Approach Number of Interviews /
Rationale
Customer Participants- Verification and Impact (to be published subsequently as a separate volume)
Verification and ex post measurement of savings for sample of program participants. Review of program files and development of site-specific ex post measurement plans.
Stratify by program savings, sample with certainty from stratum with largest savings per customer, randomly sample within other strata. Seek to obtain representative balance among size strata, utility service territory, self-sponsor vs. EESP sponsor and measure group.
40 Seek to measure program savings at high confidence and precision, finite population of customers is small (~300); stratified sample of 50 customers will cover 50% of the energy savings.
Customer Participants- Process
All in-depth, telephone. Same population and sample as Impact evaluation.
36 Same as impact sample.
Non-Participant Customers (Comparison and Longitudinal Analysis Group)
Telephone (CATI) surveys.
Same as the 1999 baseline, i.e., by seven major business segments and by size (three size categories).
350 in-state Seek to measure key efficiency indicators and changes in these indicators since 1999.
Unsuccessful Projects
All in-depth via telephone (professional staff conducted).
Qualitatively seek representative distribution by size, business type, EESP sponsorship, and project type.
24 Representative of small population (~70).
EESP Participants All in-depth via telephone (professional staff conducted).
Stratify by accepted incentives, utility service territory, first-time versus previous participation.
24 Number of unique EESPs is 48.
EESP Comparison Group
All in-depth, telephone (professional staff conducted).
Segment non-participant EESPs by EESP type, prior versus no previous program participation, and utility service territory.
24 Enough to assess key issues, focus on contractors, engineers, and ESCOs.
Utility Staff All in-depth (professional staff conducted).
Conduct interviews with key staff at each utility.
Interviews with each utility.
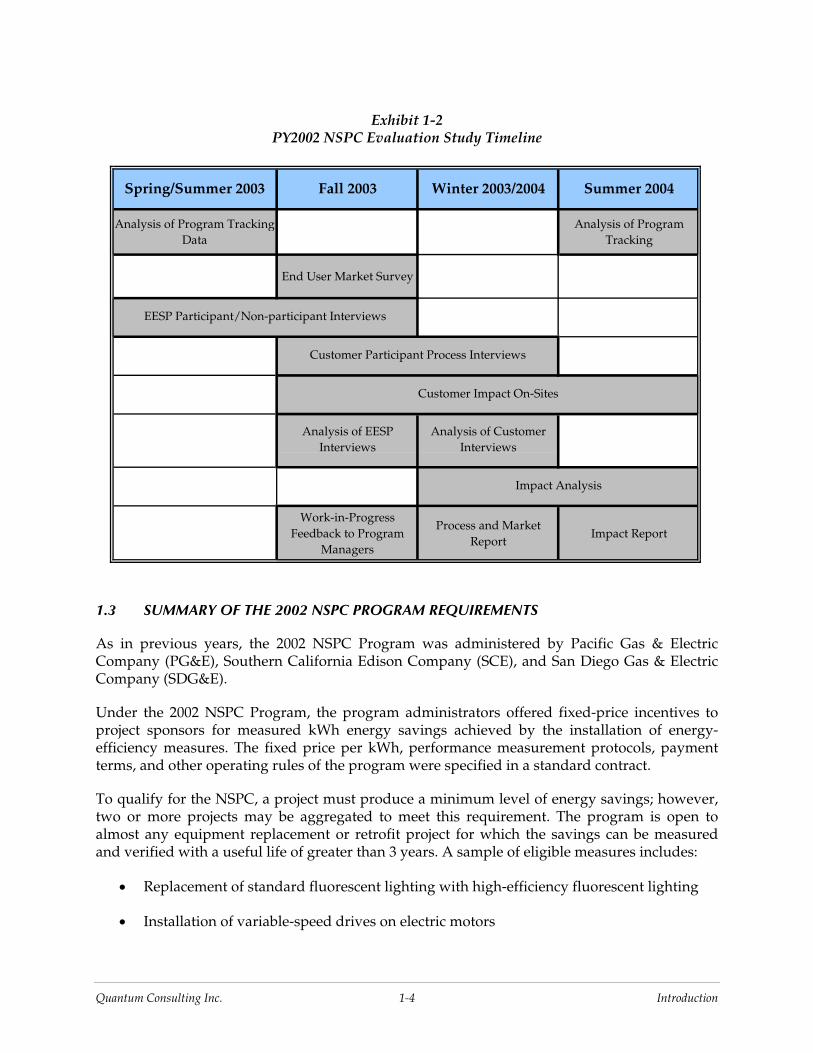
A summary timeline showing when key elements of the project occurred over the course of the study is shown in Exhibit 1-2.
Quantum Consulting Inc. 1-4 Introduction
Exhibit 1-2 PY2002 NSPC Evaluation Study Timeline
Spring/Summer 2003 Fall 2003 Winter 2003/2004 Summer 2004
Analysis of Program Tracking Data
Analysis of Program Tracking
End User Market Survey
Work-in-Progress Feedback to Program
Managers
Process and Market Report
Impact Report
Impact Analysis
EESP Participant/Non-participant Interviews
Customer Participant Process Interviews
Customer Impact On-Sites
Analysis of EESP Interviews
Analysis of Customer Interviews
1.3 SUMMARY OF THE 2002 NSPC PROGRAM REQUIREMENTS
As in previous years, the 2002 NSPC Program was administered by Pacific Gas & Electric Company (PG&E), Southern California Edison Company (SCE), and San Diego Gas & Electric Company (SDG&E).
Under the 2002 NSPC Program, the program administrators offered fixed-price incentives to project sponsors for measured kWh energy savings achieved by the installation of energy-efficiency measures. The fixed price per kWh, performance measurement protocols, payment terms, and other operating rules of the program were specified in a standard contract.
To qualify for the NSPC, a project must produce a minimum level of energy savings; however, two or more projects may be aggregated to meet this requirement. The program is open to almost any equipment replacement or retrofit project for which the savings can be measured and verified with a useful life of greater than 3 years. A sample of eligible measures includes:
• Replacement of standard fluorescent lighting with high-efficiency fluorescent lighting
• Installation of variable-speed drives on electric motors

Quantum Consulting Inc. 1-5 Introduction
• Installation of lighting controls to reduce lighting operating hours
• Replacement of standard-efficiency air conditioning with high-efficiency equipment.
Projects that are not eligible include, but are not limited to:
• Any power generation or co-generation project
• Fuel substitution or fuel-switching projects
• New construction projects
• Any repair or maintenance project.
A number of important milestones must be completed as part of the project approval process. Readers unfamiliar with these milestones and other implementation details should review the program procedure manuals or program web sites for more information.4
1.3.1 Differences between 2001 and 2002 Programs
Some changes from the 2001 program were implemented in 2002, including:
• 2002 incentive rates are the same for all customers.
• No peak demand or small customer bonuses were offered in 2002.
• All projects use the calculated savings approach except when the utility determines a need for M&V. A one-time supplemental payment was provided for measured projects to defray the M&V costs.
• Calculated savings projects receive the full incentive after the approval of the installation report. No Operating Report is required.
• Lighting measures accounted for no more than 30% of a utility’s total incentive budget.
• Lighting measures were eligible only as part of a Comprehensive Retrofit (defined as having 20% of energy savings from non-lighting replacement measures).
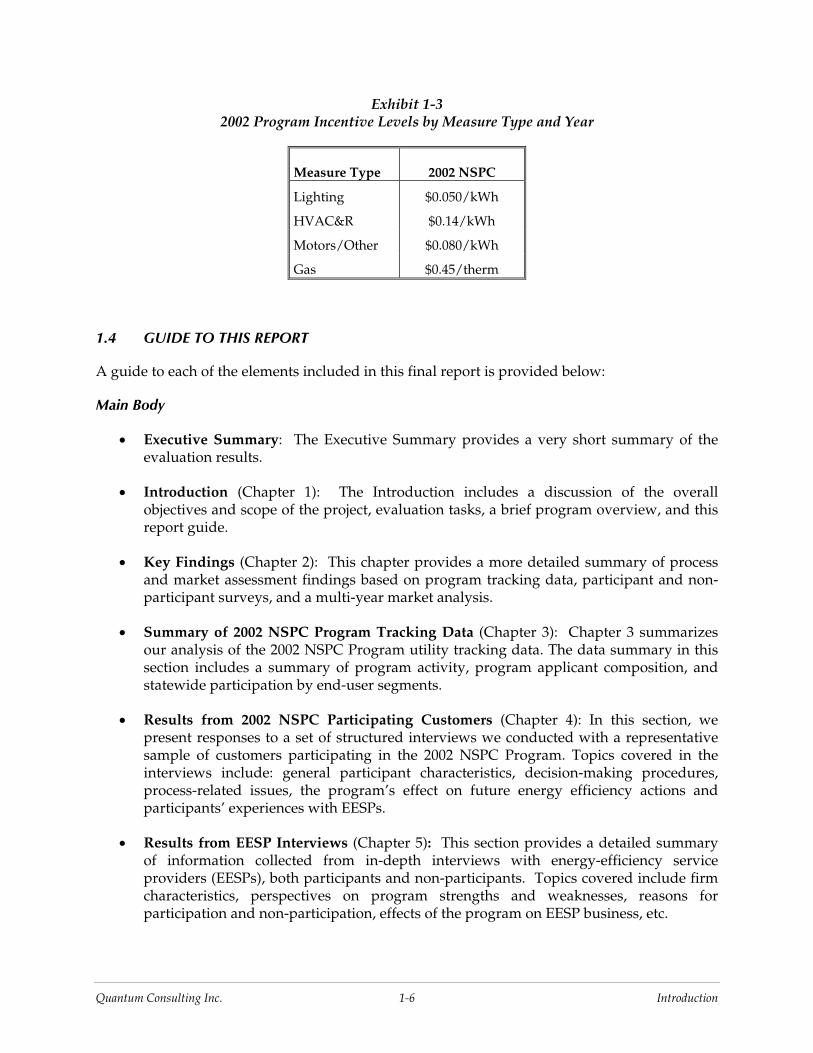
1.3.2 2002 NSPC Incentive Structure
With the exception of gas, retrofit incentives were essentially the same in PY2002. The per-unit incentive levels for the 2002 program are shown in Exhibit 1-3. Incentives for gas measures increased from $0.27/therm in 2000 to $1.00/therm in 2001, then dropped to $0.45/therm in PY2002.
4 Additional programmatic details on the California nonresidential SPC Programs can be found at each utility’s web site; PG&E: http://www.pge.com/biz/rebates/spc_contracts/, SCE: http://www.sce.com/spc, SDG&E: http://www.sdge.com/business/specializedincentives.shtml.
Quantum Consulting Inc. 1-6 Introduction
Exhibit 1-3 2002 Program Incentive Levels by Measure Type and Year
Measure Type 2002 NSPC
Lighting $0.050/kWh
HVAC&R $0.14/kWh
Motors/Other $0.080/kWh
Gas $0.45/therm
1.4 GUIDE TO THIS REPORT
A guide to each of the elements included in this final report is provided below:
Main Body
• Executive Summary: The Executive Summary provides a very short summary of the evaluation results.
• Introduction (Chapter 1): The Introduction includes a discussion of the overall objectives and scope of the project, evaluation tasks, a brief program overview, and this report guide.
• Key Findings (Chapter 2): This chapter provides a more detailed summary of process and market assessment findings based on program tracking data, participant and non-participant surveys, and a multi-year market analysis.
• Summary of 2002 NSPC Program Tracking Data (Chapter 3): Chapter 3 summarizes our analysis of the 2002 NSPC Program utility tracking data. The data summary in this section includes a summary of program activity, program applicant composition, and statewide participation by end-user segments.
• Results from 2002 NSPC Participating Customers (Chapter 4): In this section, we present responses to a set of structured interviews we conducted with a representative sample of customers participating in the 2002 NSPC Program. Topics covered in the interviews include: general participant characteristics, decision-making procedures, process-related issues, the program’s effect on future energy efficiency actions and participants’ experiences with EESPs.
• Results from EESP Interviews (Chapter 5): This section provides a detailed summary of information collected from in-depth interviews with energy-efficiency service providers (EESPs), both participants and non-participants. Topics covered include firm characteristics, perspectives on program strengths and weaknesses, reasons for participation and non-participation, effects of the program on EESP business, etc.

Quantum Consulting Inc. 1-7 Introduction
• Customer Market Survey Results (Chapter 6): In this chapter, we use customer survey results to update baseline information on topics relating to a variety of establishment and energy efficiency characteristics, behaviors and attitudes. We characterize the current market and re-assess market indicators (measured in the 1998 and 1999 SPC Program evaluations) in order to determine whether any changes have occurred in the marketplace that may be attributable to the energy crisis, SPC, or related programs.
Appendices
• Program Manager Interviews (Appendix A): This appendix provides a brief summary of the results obtained from the interviews conducted with the utility program managers.
• Customer Dropout Analysis (Appendix B): This appendix summarizes analysis of interviews conducted with customers that applied for but subsequently dropped out of the PY2002 program.
• Survey Instruments (Appendix C): This appendix contains full text versions of customer and participant survey instruments used in this study.

Quantum Consulting Inc. 2-1 Key Findings
2. KEY FINDINGS
This section summarizes key findings and results from the 2002 Nonresidential Standard Performance Contract Program Evaluation for the process evaluation and market assessment components of the study. An impact evaluation is also in progress and will be published as a separate volume. This section integrates and summarizes key findings based on our analyses of program tracking data and interviews conducted with 2002 customer and EESP participants and non-participants and NSPC program managers. This section is organized along the following subsections:
• Overall Summary of Key Findings, Implications, and Recommendations (2.1)
• Summary of 2002 Program Tracking Data Results (2.2)
• Summary of Customer Participant Results (2.3)
• Summary of Customer Multi-Year Market Analysis Results (2.4)
• Summary of Energy Efficiency Service Provider (EESP) Results (2.5)
• Summary of Customer “Dropout” Results (2.6)
Detailed results on each of the topics above are provided in Sections 3 through 6 of this report and Appendixes A and B.
2.1 OVERALL SUMMARY OF KEY FINDINGS, IMPLICATIONS, AND RECOMMENDATIONS
2.1.1 Summary of Key Program-Related Findings
Program related findings are drawn from interviews with customer participants, EESPs, program managers, and analysis of program tracking data. Key findings include the following:
• Demand for the 2002 NSPC was extremely strong, with program funds subscribed very quickly, generally within two months or less of program opening. All IOUs showed waiting lists throughout the year.
• Projected savings are significant at 240 GWh and 5 million therms; however, final savings may be lower because some projects dropped out after the end of the 2002 program year. In addition, some projects, particularly larger ones, are not yet installed. The due date for project installations was originally set for June 1, 2003.
• Industrial customers and process type measures continue to account for a majority of impacts. This successfully reflects the policy goal that the program not be dominated by lighting efficiency equipment.

Quantum Consulting Inc. 2-2 Key Findings
• Customer and EESP satisfaction with program features and administration are very high, continuing the positive trend of the 2000 and 2001 program years.
• Most applications are now paid based on calculated not measured savings. Program administrators report that only 10 percent of 2002 projects use the measurement and verification path for incentive payment for PG&E and SCE, while the figure was roughly 50 percent for SDG&E.
• EESPs generally reported positive effects of the program on their businesses, but noted funding shortages limit its ability to move the market:
− Most EESPs said the program had improved their business by enabling them to incorporate program incentives into their marketing.
− However, many EESPs say funding limits hamper consistent marketing of SPC-funded projects and encourage them to offer incentives as “icing on the cake” instead of using them to sell projects that wouldn’t otherwise occur.
− As a result, some EESPs don’t use the program as a primary sale closer, and a few said that they had stopped using the program as a marketing tool altogether.
• Non-participant EESPs, who had participated in the SPC Program in previous years but not in 2002, generally failed to participate in 2002 for two primary reasons:5
− A lack of opportunities or changes in their business unrelated to the SPC program.
− Perceptions of program characteristics (complexity, paperwork, inadequate funding) that they believed made participation not worth their while.
• A net-to-gross ratio will be estimated for the 2002 program year as part of the impact evaluation, which will be published later in 2004 in a separate report. However, preliminary analysis of free ridership levels point to a somewhat higher level than in several previous years. Nonetheless, we believe that the current net-to-gross value in the Energy Efficiency Policy Manual remains appropriate.
• The speed with which the funding was fully subscribed in 2002 was the major systematic cause for program related application cancellations. Other program-related reasons were either project specific or do not imply the need for revisions to the program. Fully half of the cancelled projects proceeded anyway, which is consistent with net-to-gross findings from other program years. It is also important to note that no clear profile of dropouts emerged that would imply any type of systematic bias toward cancellation of particular customer applications or project types.
5 However, most of these previous EESP participants reported they were likely to try to participate again in the 2003 program year. Of those third party firms interviewed that never participated as a sponsor over the life of the program, most reported they did not do so because they did not provide the appropriate scope of services in their core business.

Quantum Consulting Inc. 2-3 Key Findings
2.1.2 Market Findings
Key trends in the overall market for energy-efficiency related services among large customers (> 500 kW) are drawn from a quantitative customer baseline survey conducted in the fall of 2003. These findings include the following:
• Many large non-residential customers believe the energy crisis-induced rate increases will last over ten years.
• Sixty percent of the large nonresidential market reports that the energy crisis spawned increased interest in energy efficiency in their organizations, but only half of these report that this increased interest carried over into increased capital investment for energy efficiency projects.
• Conservation, demand response, and energy efficiency activities were all widely reported:
− Eighty percent of the market reported taking conservation and energy efficiency actions in past years, resulting in 7 percent average reduction in electricity usage (self-reported).
− Roughly half of large customers report they still take or are willing to take demand reduction actions to reduce peak demand on power alert days if supplies are short.
• Most indicators of energy efficiency proclivity and perceptions were virtually the same as when they were measured in the 1998 and 1999 NSPC baseline surveys, with several notable exceptions:
− The percentage of customers with formal policies requiring purchase of energy efficiency equipment increased from 30 percent in 1999 to 43 percent in 2003.
− The self-reported importance of market barriers such as uncertainty over the performance and savings of efficient equipment decreased somewhat from 1999.
− Seventy four percent of the market, as compared with 55 percent in 1999, said they had been approached by firms offering services to improve their facility’s energy efficiency in the past year.
− Customers’ credibility ratings decreased across the board for all types of energy efficiency service providers; however, IOUs remained the highest rated in this group for energy efficiency information.
• The market for performance contracting remains extremely stable, showing virtually no change in customer familiarity, contracts offered, and contracts signed per year since 1999.
• Half of the market reported being aware of the SPC program. SPC awareness levels were very similar across utility service territories. Impressions of the SPC program were generally favorable.
• Customers, though generally positive about existing efficiency programs, provided a number of general recommendations including improving the customer focus of

Quantum Consulting Inc. 2-4 Key Findings
programs, more information and better showcasing about successful efficiency projects, more flexibility, and increased incentive levels.
2.1.3 Implications and Recommendations
Continue Successful Program Characteristics - High Levels of Customer and EESP Satisfaction
Program administrators received consistent praise from participants for their handling of the overall implementation process, which testifies to program administrators’ efforts to streamline the application and M&V processes over the five-year history of the program. Focus on participant support and a satisfactory program experience should continue to drive program implementation processes. Some of this increase in satisfaction over the history of the program may be associated with the dramatic shift from measured to what are now mostly calculated project savings.
Continue Successful Program Characteristics - Focus on Industrial Process and HVAC Projects
Based on this and previous evaluations of the NSPC, we believe that the NSPC fulfills a critically important role in the portfolio of nonresidential energy-efficiency programs by supporting complex and comprehensive energy-efficiency projects that offer significant potential but do not lend themselves to prescriptive approaches. The focus on end-use incentives allows participants flexibility in developing projects that are specific to the unique processes of individual customers. In addition, the requirements that individual projects can contain a maximum of 20 percent lighting replacement savings and that a maximum of 30 percent of each administrator’s total incentive budget can be spent on lighting (including both controls and equipment replacement) have successfully encouraged a wide variety of non-lighting projects. Program requirements that result in the majority of incentives being used for non-lighting projects should be continued. Since the NSPC is the only program well suited to capturing the wide variety of savings opportunities in the industrial sector, and since there may be a significant amount of untapped potential in this sector,6 industrial participation should continue to be encouraged and promoted.
Consider Increasing the Amount of NSPC Incentives Available
Committed NSPC incentive funds have ranged from a high of $28 million in PY2000 to lows of roughly $18 million in PY2001 and PY2002. Program funds have been fully subscribed with extensive waiting lists almost every year since 1998. However, quick subscription of program incentives may be producing counter-productive results. When funds are subscribed within a couple of months of program opening, funds are then unavailable for the remainder of the year. This has at least two major negative outcomes. First, EESPs appear to either stop using the incentives in their marketing efforts or use the incentives as “icing on the cake” for sales that are likely to occur with or without the incentives. This may lead EESPs to focus on measures with lower payback levels that already meet customers’ thresholds rather than trying to convince customers to pursue higher payback measures that can be brought below their threshold through the use of program incentives.
6 Rufo, M., Rafael Friedmann, and Fred Coito, 2003. “Integrating Market Assessment, Evaluation and Planning Studies to Understand and Capture Industrial Program Potential.” Proceedings of the International Energy Program Evaluation Conference, Seattle, WA.

Quantum Consulting Inc. 2-5 Key Findings
A second problem is that quick, early subscription of funds leads all market players, including end users, to apply immediately for funds at the beginning of a program year because they are afraid they will lose access to these funds to others. This may also be related to the problem of projects dropping out of the program later or having their installations performed long after the program year ends (because funds were applied for before the projects were very far along in the end users’ decision making process). 7
Demand for the NSPC continues to be strong - increasing available funds could help to mitigate problems associated with early subscription and make a strong contribution to the CPUC’s and utilities’ goals of expanding the acquisition of cost-effective energy efficiency resources.
Try to Accelerate Pace of Project Installations
Some PY2002 projects, particularly larger ones, are not yet installed. The due date for project installations was originally set for June 1, 2003. In some cases these delays may be due to the complex nature of the projects and the need to coordinate installation with scheduled plant shutdowns. Such situations are sometimes an immutable aspect of large, complex process improvements. However, the number of large projects still not installed may indicate the need for a firmer or revised process of allotting program year funds. Originally, the NSPC program employed a two-staged application process that included a Basic Project Application (BPA) and Detailed Project Application (DPA). One of the purposes of this approach was to reduce the likelihood that potential participants would try to lock up incentive funds for projects that were highly speculative. However, participants generally objected to the additional application requirements associated with the two-stage process and it was made optional in PY2000 and then eliminated in PY2001. While we do not recommend returning to a formal two-stage process, the administrators should consider, and be given the flexibility to implement, as appropriate, other methods of ensuring that projects submitted in a program year will be implemented by the sixth month following the close of the program year (as is currently required).
Consider Either Expanding and Integrating the Impact Evaluation Function or Increasing the Percentage of Projects for Which Savings Measurement is Required in the Program Process
Over the five-year history of the NSPC program, whether and to what extent savings are measured versus calculated savings has been an ongoing issue. In the first two years of the program, M&V was required on virtually all projects. As a result, traditional impact evaluation was unnecessary as measurement was built into the program process. However, the time, effort, and cost associated with measuring savings on every project became an issue in the 1998 and 1999 program year evaluations because of concern that an M&V census was a conservative but possibly not optimal approach. In addition, many participants objected to the early year M&V requirements. As a result, in PY2000, the utility program administrators introduced the calculated savings path. Under the calculated path, on-site verification of project installation remained a requirement but direct measurement of savings was replaced with engineering calculations made by or approved by the administrators.
7 Conversely, program managers report that some project stay on the program waiting list for long periods and end up rolling over to be the first projects of the next program year – such projects wait extensive periods for program incentives, indicating a potentially strong program effect on project installation.

Quantum Consulting Inc. 2-6 Key Findings
In PY2000 and PY2001, customers were offered the choice of whether to apply under the calculated or M&V path. Even though the M&V path paid a 10 percent incentive premium, most customers chose the calculated path. In PY2002, the calculated path became the default application path with the administrators retaining the right to require the M&V path for projects they deemed too complex. As noted in the Key Findings section, for PG&E and SCE, program administrators estimated that roughly 90 percent of 2002 projects were on the calculated path, while for SDG&E the reported figure was roughly 50 percent.
As part of this PY2002 NSPC evaluation, an impact evaluation is being conducted. The impact evaluation is being conducted on a representative sample of 50 customer participants and will be published later in 2004 in a separate report. The impact evaluation involves detailed review of project files, review of savings estimates, on-site verification of measure installations, and assessment of savings estimation and measurement options. The impact evaluation task is not adequately funded to include significant ex post measurement and does not include any pre-installation measurement. Initial review of the project applications and detailed investigation of almost half of the sample indicates that there may be a need for increased impact evaluation to produce reliable ex post estimates of program savings. This is because there appear to be a number of projects with savings that are very difficult to estimate without pre- and/or post-installation measurements, for example, compressed air, some variable-speed drives applications, and other industrial process improvements.
The PY2002 impact evaluation is still in progress and it is not yet possible to empirically assess whether the calculated savings are systematically high or low.8 Nonetheless, our preliminary view is that either a larger percentage of projects should be required to follow the M&V path or program impact evaluation should be expanded and integrated into the program implementation process. The primary difference in these two approaches is whether the measurement process financially impacts the individual applicants. Another difference has to do with reporting. Although program administrators update initial program savings estimates based on M&V results as they become available, to our knowledge no systematic reporting of realization rates has been compiled since program inception.9 Compiling and analyzing realization rates from measured projects (by measure or project type) would be extremely valuable to improving and calibrating calculated savings estimates.
Our preliminary view is that either the program impact evaluation should be expanded and integrated into the program implementation process or a larger percentage of projects should be required to follow the M&V path. Based on feedback from the NSPC program managers and participant feedback from this and previous NSPC evaluations,10 we recommend that savings measurement be addressed in the future through an expanded impact evaluation function. This is also consistent with the utilities’ filed plan for the 2004-2005 Statewide NSPC Measurement
8 Note that administrators report that the calculated savings are intended to be conservative and that several EESPs independently stated that they believed this was the case. Since there is some risk associated with calculating rather than measuring the savings, it is appropriate that the calculated savings be purposefully conservative.
9 An evaluation study was conducted in 2002 that looked at detailed M&V results for 10 cases from the 1998 and 1999 program years (XENERGY, 2002).
10 The majority of participants have expressed a preference for the calculated rather than measured savings approach, even under the operating assumption that calculated savings estimates will be purposefully conservative.

Quantum Consulting Inc. 2-7 Key Findings
and Evaluation Study. If an expanded impact evaluation approach is pursued, it will be important for the evaluation to be integrated into the program implementation process so that pre-installation measurements can be taken for complex projects.11 It should be noted, however, that if the impact evaluation function is relied completely on instead of in-program savings measurement, the program should perhaps be viewed more as a custom rebate program than a standard performance contract program.
Consider Additional NSPC-Specific Programmatic Efforts to Reduce Free Ridership as well as Incentives for Reducing Free Ridership (for all PGC efficiency programs)
As noted under our Summary of Findings above, preliminary estimates of free ridership for the NSPC program for PY2002 are moderately high, as were free ridership estimates for most of the previous program years. Of course, it is important to remember that both measuring and trying to reduce free ridership are two of the toughest issues in the energy efficiency public goods field. Readers should recognize that we discuss this topic with the understanding that measuring free ridership is extremely difficult and that results can be highly uncertain. In addition, we recognize that it may be somewhat artificial and misleading to try to measure and isolate free ridership within the context of a single program year. This is because end users are affected not just by an individual program year in which they participate, but also by the effect of previous years or in California’s case, decades, of program intervention effects. Simply put, today’s free rider may be yesterday’s program-induced market effect.
Despite these uncertainties and difficulties, when public goods funds are limited, as they always will be, it remains important to try to maximize the net rather than the gross effects of program participation using the best available information to do so.
It is important that the free ridership issue be understood in context, not just for the NSPC program, but also for all PGC efficiency programs. To appreciate this, we need to consider how free ridership has been addressed historically with respect to CPUC-regulated efficiency programs. Prior to 1998, utility administrators faced incentives and disincentives related to free ridership (and program spillover). Specifically, utility shareholder earnings in this period were tied to net not gross savings. In addition, programs were required to have net not just gross ex post impact evaluations. As a result, administrators saw direct financial consequences from ex post measurements of free ridership and spillover. Although this was a far from perfect system,12 it did provide some direct financial motivation for trying to reduce free ridership.
Since 1998, however, net-to-gross ratios have been used for PGC programs on only an ex ante basis. In addition, neither impact evaluations nor ex post net-to-gross estimation have been required. The post-1998 process has certainly been a simpler one, and one that may have been
11 The incorporation of evaluation measurement needs during program implementation is being successfully carried in the Self-Generation Program Evaluation. Such an approach would select projects for pre-installation measurement as a function of the probable contribution of each project to the statistical variance associated with the overall estimate of program savings.
12 Due partly to the difficulties of tying significant financial payments to metrics with the intrinsic measurement difficulties associated with free ridership and spillover.

Quantum Consulting Inc. 2-8 Key Findings
suited to the context of rapidly changing and uncertain regulatory and market environments.13 However, the post-1998 approach does not provide program implementers (utility or non-utility) with any direct financial motivation to minimize free ridership during a particular program year. Although this may have been the only pragmatic and fair approach during a period of joint utility and non-utility program implementation,14 we believe that the CPUC should now investigate approaches to providing all program implementers with more direct financial incentives to minimize free ridership and maximize net program effects (e.g., including spillover).15
The foregoing discussion is provided partly to remind readers that difficult issues associated with free ridership and program market effects (such as spillover) are not limited to the NSPC program. Free ridership and market effects have been important issues associated with the NSPC program because these issues were designed into each of the evaluations conducted for this program for the entire history of the program to date (Program Years 1998 through 2002). Free ridership, in particular, was estimated in these evaluations not because it was required from a regulatory perspective, but because the evaluation administrators and consultants believed it provided valuable insight that could be helpful to improving the program.16 This proactive approach, although challenging, proved worthwhile in the long run. 17
With this background, we can now conclude with some specific considerations for ways in which free ridership might be reduced for the NSPC program itself. These suggestions are not
13 For example, since 1998, public goods efficiency policy has been characterized by uncertainty over goals (e.g., market transformation, resource acquisition, equity, etc.), oversight (e.g., the brief role of the California Board for Energy Efficiency), market conditions (i.e., the energy crisis of 2000/2001), and administration itself (i.e., utility, non-utility, and combinations thereof).
14 It appears that ex post measurement of impacts and free ridership were never considered for the 2002 and 2003 program years for non-utility program implementers, perhaps because it was considered impractical given the small size of these programs and their associated evaluation budgets (which were often disproportionately smaller than the programs themselves, e.g., many such programs had evaluation budgets of less than 5 percent).
15 It is beyond the scope of this evaluation to discuss the variety of possible approaches to this and their associated pros and cons. Issues associated with program evaluation are at the center of the 2002 Evaluation Framework Study, being conducted for the California IOUs and CPUC.
16 Note that over this same time period, very few program evaluations, to our knowledge, included formal estimation of free ridership across program years (Savings by Design being one of the exceptions).
17 For example, the free ridership only net-to-gross ratio of 0.53 from the first evaluation of the NSPC in 1998 was adopted by the CPUC as the ex ante net-to-gross ratio for the program, despite caveats in that evaluation that the self-reported method used to estimate free ridership may be biased and that potential spillover benefits were not estimated. An attempt was made to rectify this situation by conducting a multi-year analysis of free ridership that included assessment of the estimation method itself and spillover (see, Improving the Standard Performance Contracting Program: An Examination of the Historical Evidence and Directions for the Future, prepared by Ridge Associates and XENERGY Inc. for Southern California Edison, December 2001). As a result of this expanded effort, the CPUC adopted a revised net-to-gross of 0.70 in the CPUC Energy Efficiency Policy Manual, Version 2, August 2003. Interestingly, most of the net-to-gross ratios in the current Energy Efficiency Policy Manual have not been updated for five or more years because of the lack of new ex post studies.

Quantum Consulting Inc. 2-9 Key Findings
offered as panaceas or without recognition that there are practical difficulties associated with each of them. With that in mind, some approaches to consider are discussed below.18
One approach to consider is increasing incentives for higher payback measures, particularly for emerging technologies. There is a philosophy held by some in the efficiency field that decreasing incentive levels over time is appropriate as a market transformation or exit strategy from a market. This approach was part of the policy environment for the NSPC in its early years when the focus of the program was on market transformation.19 For a specific efficiency technology, such as a T8 lamp, this approach can be effective if carried out with good market intelligence. For a program focused on comprehensive efficiency improvements, such as the NSPC, this approach is more problematic and can actually exacerbate free ridership problems, particularly if the intent is not to exit the market. There is a point at which lowering incentive levels creates a token-level incentive that, although it may provide a halo effect, has limited effect on the financial decision making of end users. We have not concluded that the NSPC incentive levels are necessarily at that low a level, however, particularly with lighting, one must consider that the incentives result in a payback reduction of only 1/2 to 1/3 of year given the fully loaded retail rates end users currently face.
Like most of the free ridership issues discussed herein, this approach poses a dilemma: one does not want to pay too much for measures that have some risk of otherwise being adopted on their own, but neither should one pay so little that mostly free riders are attracted. For some measures in some market segments, it may be better to pay nothing than to pay a low incentive.20 On the other hand, there may be some specific types of measures for which a higher incentive is well justified. In particular, we believe that certain emerging technologies, in the early stages of commercialization and with high impact and cost-effectiveness promise, may justify higher incentive levels than the NSPC currently offers.21
Project-specific investigation of free ridership for the NSPC program also indicates that projects with extremely short payback periods are more likely to be free riders, all else being equal.22
18 Note that a number of these suggestions were provided in previous program year evaluations, some going back to the 1998 NSPC evaluation.
19 End Use incentives in 1998, in cents per kWh saved, were: Lighting 7.5; HVAC – 21; and Other – 11. In 2002, the values were: Lighting 5; HVAC – 14; and Other – 8.
20 The NSPC does the, for example, with first generation T8 lighting systems, which are not qualified for incentives.
21 Automated perimeter dimming systems may be an example of such a case. In addition, there was some discussion and interest expressed in the CPUC’s recent workshop on energy efficiency potential on approaches to improving and expanding the relationship between the CPUC’s PIER program, the PGC-funded Emerging Technologies program, and other program efforts, such as the NSPC.
22 Consider, for example, the following hypothetical case, similar to actual cases we have observed. A large end user has a $200,000 process improvement project that will save 500 kW 8,760 hours per year (i.e., 4.38 GWh). At a fully loaded retail rate of 12 cents per kWh consumed, the first year savings would be $525,600, resulting in a payback of 0.4 years before any incentives are applied. NSPC incentives at 10 cents per kWh saved would be $438,000, except that incentives are capped at 50 percent of project costs, so incentives are $100,000. The payback is thus reduced from 0.4 years to 0.2 years. Although the 50 percent cap helped to reduce an overpayment in this situation, it is unlikely that the program made a significant difference on the adoption decision considering how short the payback was without incentives.

Quantum Consulting Inc. 2-10 Key Findings
Although it is certainly true that many customers do not adopt attractive efficiency projects with very low paybacks,23 a payback floor can still be helpful, particularly if it is not set too high and if the administrator is allowed some flexibility in its application (see below). Several program administrators in other parts of the country have used payback floors effectively,24 although they can present project cost verification challenges.
Another possibility is to provide an increased incentive or bonus to end users (not EESPs) that are first time participants in the NSPC program. This may help to attract customers that tend to be laggards rather than leaders in their energy efficiency-related investment decisions.
The approaches discussed above are focused on trying to minimize free ridership through indirect programmatic rules and requirements. The advantages of such approaches are that the rules and requirements are codified and apply equally to all customers. Disadvantages of all of the approaches above are that they are all indirect attempts to minimize free ridership that are based on correlations between project characteristics and free ridership for which there are always exceptions.
Another approach is to allow the program administrators the flexibility to simply exclude projects from the program that they believe have a high probability of being free riders. Administrators in several other jurisdictions have used this; however, these are generally smaller service territories than those found in California.25 In these cases, the administrator has the flexibility to determine total incentive amounts on a case-by-case basis, including zero incentives. While we do not recommend going to case-by-case incentive determination, we do believe consideration should be given to development of a process by which projects considered to be very high likelihood free riders could be excluded from participation. Such a process could require the involvement of an advisory group that includes staff from the CPUC. This would offer protection from claims that such exclusions were unfounded or unfair. Alternatively, or in conjunction with this type of approach, rules could be developed that exclude incentive payments for projects that are driven exclusively by non-energy factors that produce energy savings as a by-product, such as some naturally-occurring improvements in certain industrial processes.26
Readers should keep in mind that some free ridership is inevitable in energy efficiency programs. The presence of possible free riders should not be considered a reason, in and of
23 Compressed air projects are a notable exception. It is well established that industrial end users often do not invest in compressed air projects with paybacks as low as one year or less.
24 For example, National Grid has a 1-year payback floor, while United Illuminating pays less for projects with paybacks of less than 1 year (5 cents per kWh saved) than for those with paybacks over 1 year (10 cents per kWh saved). Wisconsin Power & Light finances projects with bundled paybacks that average 4 or 5 years.
25 Based on work-in-progress findings from the National Energy Efficiency Best Practices Study being conducted by Quantum Consulting, Inc. for Pacific Gas & Electric Company on behalf of the CPUC, other IOUs, and CEC.
26 A related example is that of an oil pipeline that is expanded to increase revenue-generating throughput but which also results in per unit pumping savings due to reduced friction losses. The revenue-generating benefits of the project completely drive the decision, the energy savings are an unintended and naturally occurring by product of the decision.

Quantum Consulting Inc. 2-11 Key Findings
itself, to reduce or eliminate program efforts but rather should be seen as something to be managed and minimized as best as possible.
2.2 SUMMARY OF 2002 PROGRAM TRACKING DATA
In this section, we summarize the 2002 program tracking data. These data were collected from each utility in May 2003 and integrated into statewide results. Key program data characteristics of the 2002 NSPC population include the following:
• All program incentive funds, totaling $18 million, were subscribed early in 2002; projected savings as of March 2003 were 240 GWh.
• Almost 300 unique customers participated; over 40 EESPs sponsored applications.
− Both customers and EESP participation was broad and diverse:
.. Industrial participants represented almost 50 percent of all participants, commercial and institutional were also represented.
.. EESP types included contractors, engineering firms, and small efficiency specialists, as well as larger traditional ESCOs.
− EESP-sponsored projects accounted for less than one-quarter of applications and savings (PG&E had the lowest share of EESP projects, SDG&E the highest).
• NSPC projects were also very diverse, with the process end use representing the largest share of program savings, followed by HVAC and lighting; compressed air and VSD projects were significant on their own, representing over 10 percent of savings each.

Quantum Consulting Inc. 2-12 Key Findings
Exhibit 2-1 Summary of Program Activity for 2002 SPC as of May 2003
Activity Level Statewide PG&E SCE SDG&ETotal unique customers 299 118 144 39Total number of applications 355 146 165 44Total unique third-party sponsors 48 14 25 16Total incentive funds committed ($ million) 17.87 6.84 8.72 2.31 Incentive funds committed to electric measures ($ million) 15.85 5.01 8.72 2.12 Incentive funds committed to gas measures ($ million) 2.01 1.83 0.00 0.19Total savings from active applications (Btu, trillions)* 2.94 1.06 1.56 0.32 Electric savings from active applications (GWh) 238.53 58.54 152.24 27.76 Gas savings from active applications (therms, millions) 4.94 4.56 0.00 0.38Average incentives per kWh $0.066 $0.086 $0.057 $0.076Average incentives per therm $0.408 $0.401 - $0.495
* Conversion rates obtained from 2001 Energy Efficiency Standards for Residential and Non-residential Buildings , California Energy Commission, June 2001: 1 kWh = 10,239 Btu source energy 1 therm = 100,000 Btu source energy

Quantum Consulting Inc. 2-13 Key Findings
Exhibit 2-2 kWh Savings and Incentives by Project Type
0% 5% 10% 15% 20%
Refrigeration - VSD
Process - Controls
Lighting - Other
Lighting - HID
Space cooling - Packaged units
Other - Controls
Space cooling - VSD
Refrigeration - Controls
Space cooling - Chillers
Refrigeration - Other
Process - Motors
Other - Equipment
Space cooling - Controls
Space cooling - Other
Lighting - Controls
Process - VSD
Process - Compressors
Lighting - Fluorescent
Process - Other
Incentives %
kWh %
2.3 SUMMARY OF 2002 CUSTOMER PARTICIPANT RESULTS
Structured interviews were conducted with a representative sample of customers participating in the 2002 NSPC Program. Interviews were conducted in the October, November and December 2003. During this time, interviews were conducted with 36 separate organizations, representing a total of 42 projects.
General Characteristics of the 2002 Participant Customer Sample
The customer participant sample was stratified into three roughly equal-sized strata based on the kWh savings associated with each unique customer for each utility, resulting in one sample list per utility. Exhibit 2-3 shows the interviews completed by strata and utility. This sampling approach captured 36 percent of the kWh savings and 25 percent of the accepted incentives with a sample size of 36 interviewees. The participant sample reflects well the characteristics of the participant population in terms of percentages of self-sponsorship, market segment distribution, and project types.

Quantum Consulting Inc. 2-14 Key Findings
Exhibit 2-3 Completed Interviews by Utility and Strata
Savings Strata PG&E SCE SDG&E Statewide
Large 2 3 0 5
Medium 4 12 1 17
Small 7 6 1 14
Total 13 21 2 36
Origin of Decisions and Role and Significance of Third-Party Firms
Customers were asked a variety of questions about the origin of their SPC project decisions including their reasons for pursuing the projects, condition of equipment replaced, how they learned about the efficiency measures implemented, how and when they learned about the SPC program, and the role and significance of third-party firms in their decision-making processes.
By far the most common reasons cited for pursuing NSPC projects, were the need to reduce energy costs and the need to replace older equipment. The most common way participants learned about the energy-efficient equipment they installed, at 68 percent, was from a previous installation in which they or their firm was involved. The fraction of respondents that stated they first learned about the equipment installed through a previous installation was higher for 2002 than reported for several previous program years.
Exhibit 2-4 How Customers Learned about Equipment Installed
Previous Installation
68%
SCE Representative
8%
Contractor8%
Equipment Vendor
5%
Self-Knowledge5%
Colleague, Trade Show
3%
Architect/ Engineer
3%
n=37

Quantum Consulting Inc. 2-15 Key Findings
While utility representatives played only a minor role in bringing energy-efficient equipment to the attention of customers, they were customers’ main source of initial information about the NSPC program itself. This result is consistent with that obtained in previous years’ NSPC evaluations. Prior knowledge or hearing about the program from a vendor or contractor were less frequent responses.
Customers were also asked about the role third-party firms played in their decision to install the energy efficiency equipment. Well over half (58 percent) reported having developed the project ideas and decided upon installation entirely on their own; indicating no direct influence of an EESP. The remainder indicated that an EESP had played at least a partial role in influencing their decision to pursue their efficiency project.
Participants generally indicated that both EESPs and the NSPC incentives contributed to their decision to install their energy efficiency measures; however, the majority also indicated they would have probably or definitely installed the efficiency measures anyway, even without the program. Most customers who used third-party firms found the third-party services to be valuable, with 75 percent rating the contribution of third-party firms as either very significant or somewhat significant. About two-thirds of the participants interviewed also reported that the program incentives had a very significant or somewhat significant influence on their decision to implement their efficiency project.27
Exhibit 2-5 Significance of Third-Party Firm Services and Program Incentives in Decision
to Participate in NSPC and Install Measures
0%
5%
10%
15%
20%
25%
30%
35%
40%
45%
Very significant SomewhatSignificant
SomewhatInsignificant
Very Insignificant
EESP Services n=28Incentive n=36
27 The issue of program influence will be addressed further in the impact evaluation report, which will include estimation of the program net-to-gross ratio.

Quantum Consulting Inc. 2-16 Key Findings
Exhibit 2-6 Customer Self-Report of Likelihood of Installing Measures in Absence of Program
Definitely Would NOT Have Installed
14%
Probably Would NOT Have Installed
17%
Probably Would Have Installed
44%
Definitely Would Have Installed
25%
n=36
Respondents were asked if they planned any additional measures as a result of participating in the program. One quarter said they planned to implement additional measures as a result of their participation. Another 48 percent said that they were planning additional measures but not as a result of the program, and 28 percent were not planning any new measures at all.28
Process-Related Issues
A number of process-related issues were addressed in the customer participant research, these included overall customer satisfaction, program strengths and weaknesses, incentive structure and payment processing, usefulness of program tools and supporting materials, M&V requirements, and opinions on program management. Key results are summarized below.
Customer Satisfaction, Strengths and Weaknesses, Incentives Structure and Payment, and Usefulness of Program Tools
In general, participants were highly satisfied with the 2002 NSPC program and gave it very positive overall satisfaction ratings. With respect to customers’ perceived strengths of the program, by far the most common aspect mentioned was the direct financial value of the incentives (66 percent). The next most cited benefit was the simplicity of the program (12 percent). Only a minority of respondents offered opinions on the program’s weaknesses, the majority indicated there were no problems with participation. For the minority, the most
28 This information also will be used to estimate participant spillover as part of the net-to-gross estimation in the impact evaluation report.

Quantum Consulting Inc. 2-17 Key Findings
common area of complaint concerned the difficulty in satisfying the application requirements of the program.
Exhibit 2-7 Overall Satisfaction with 2002 NSPC
0%
10%
20%
30%
40%
50%
60%
70%
Very Satisfied SomewhatSatisfied
Neither Satisfiednor Dissatisfied
SomewhatDissatisfied
VeryDissatisfied
n=29
With respect to the structure and levels of the program incentives, the majority of customer participants believed the incentive structure was fair, while a small fraction felt the incentive levels could be higher. Over 80 percent reported that the payment process and timing of receiving payments was reasonable.
Customer participants were also asked about their use of specific tools offered by the program – the savings calculator and the program website. The program website was widely used by customers (63%), while the savings calculator was not (21%). The majority of those who used the website and calculator reported these tools were either very or somewhat helpful.
Calculated Savings and Measurement and Verification (M&V) Requirements
Customers reported that the measured and calculated savings options were equally used. Twenty percent of respondents reported using a combination of calculated and measured savings. These self-reports are apparently inaccurate as the utility program managers reported that very few applications used the formal M&V path, with almost all of those cases occurring in the SDG&E territory.29 Instead, these responses probably reflect cases in which the program administrators required limited measurement as part of establishing the calculated savings upon which savings would be based. Several customers (20 percent) did not know which option was used for their project.
29 The formal M&V path ties incentive payments to M&V that must be conducted one-year after installation. Incentive payments are 10 percent higher under the M&V option to compensate for the extra work involved.

Quantum Consulting Inc. 2-18 Key Findings
Respondents were asked how certain or uncertain they were about the estimated energy savings when they first decided to implement their projects. An overwhelming majority (80 percent) claimed to be somewhat or extremely certain. This result is consistent with those obtained in the previous years’ evaluations.
Two-thirds of customers that used EESPs as part of their applications reported that their confidence in their project savings increased “greatly” or “somewhat” as a result of the utility’s independent review of savings. This result is also consistent with prior years.
Exhibit 2-8 Customer Self-Report of Calculated Versus M&V Path
Calculated30%
Measured30%
Combination20%
Don't Know20%
n=30
Exhibit 2-9 Reported Level of Certainty in Project Savings
0%
10%
20%
30%
40%
50%
60%
Extremely Certain Somewhat Certain Somewhat Uncertain Extremely Uncertain
n=30

Quantum Consulting Inc. 2-19 Key Findings
Opinions on Administration
When asked about their experiences working with the program administrators, customers reported a very good experience overall. As illustrated in Exhibit 2-10, over roughly three-fourths indicated that their experience was excellent or good, while none reported an experience that was somewhat or very poor. This result is even more positive than those generally positive results observed in previous NSPC evaluations.
Exhibit 2-10 Overall Program Experience with Utility
0%
10%
20%
30%
40%
50%
60%
Excellent Good Acceptable SomewhatPoor
Very Poor No contactwith utility /Don't know
n=34
Program Participant Experience with EESPs
Participating customers were asked a series of questions about their experiences with third-party firms, either the sponsoring EESP in the case of EESP-sponsored customers or a contractor hired by a self-sponsoring customer to help with significant aspects of the application process. Results include:
• Energy performance contracts with no fee-for-service component accounted for 40 percent of the customer contracts with EESPs for NSPC-related work. Fee-for-service contracts accounted for over one-half (52 percent) of contracts.
• Customers were more likely than the EESP to initiate contact. The portion of contacts initiated by EESPs was somewhat lower than reported for previous program years.
• As was the case in previous years, less than half of all customers found some aspect of the products or services provided by third-party firms as part of the NSPC application to be new to them.

Quantum Consulting Inc. 2-20 Key Findings
• For those who reported that some aspect of their project was new, over one-half mentioned the specific equipment installed was new to them; 22 percent mentioned that either the energy savings estimates or whole service was new to them.
Exhibit 2-11 Type of Contractual Arrangement with EESP*
Guaranteed Savings
40%
Fee-For-Service52%
Combination PC and fee-for-
service4%
Other4%
n=25
* “PC” = Performance contract; “Guaranteed Savings” is a form of performance contracting.
Exhibit 2-12 Initiator of First Contact for Services
EESP Intitiated Contact
21%
Other4%
Customer Initiated Contact
71%
Don't Know / Refused
4%
n=28

Quantum Consulting Inc. 2-21 Key Findings
Exhibit 2-13 Participant Customer Opinion on Whether Efficiency Products and Services New to Them
Yes38%
No59%
Don't Know3%
n=29
2.4 SUMMARY OF MULTI-YEAR CUSTOMER MARKET SURVEY RESULTS
Key trends in the overall market for energy-efficiency related services among large customers (> 500 kW) are developed from a quantitative customer baseline survey conducted in the fall of 2003 as part of this evaluation. The purpose of conducting the interviews was to obtain updated baseline information on topics relating to a variety of establishment and energy efficiency characteristics, behaviors and attitudes. The objective of this survey was not only to characterize the current market, but also to re-assess market indicators that were measured in the 1998 and 1999 SPC Program evaluations in order to determine whether any changes have occurred in the marketplace that may be attributable to the SPC or related programs. Findings from the customer market analysis are presented below. More detailed data are presented in Section 6 of this report.
2.4.1 Price Perceptions and Energy Conservation, Demand Response, and Efficiency Actions
Because of the unprecedented events associated with the recent California energy crisis, a series of questions was added to our market survey to assess customer reactions to the crisis, including price perceptions and conservation and demand response actions. When asked about trends in the price of electricity for their facility as compared to before the energy crisis, the vast majority of respondents, 67 percent, said that the price of electricity has increased. Moreover, many large non-residential customers believe the energy crisis-induced rate increases will last over ten years.

Quantum Consulting Inc. 2-22 Key Findings
Exhibit 2-14 Customer Opinion on Duration of Energy Crisis-Related Rate Increases
Less than 1 year16%
1 to 2 years8%
3 to 5 years18%
6 to 10 years9%
Over 10 years (or
permanently)39%
Don't Know10%
n=234
End users were then asked how, if at all, the increase in electricity prices had affected their firm’s interest or plans to make capital investments in energy efficiency-related projects. Sixty percent of the large nonresidential market reports that the energy crisis spawned increased interest in energy efficiency in their organizations, but only half of these report that this increased interest carried over into increased capital investment for energy efficiency projects.. Smaller firms (<1,000 kW) reported higher increased interest in efficiency-related projects than larger firms.
Exhibit 2-15 Effect of Energy Crisis on Interest and Investment in Energy Efficiency Projects
0%
5%
10%
15%
20%
25%
30%
35%
40%
Increase in Interestand Increase in
Planned Investment
Increase in Interestbut no Increase in
Planned Investment
No Major Change inInterest or Planned
Investment

Quantum Consulting Inc. 2-23 Key Findings
In the original 1998 and 1999 large nonresidential NSPC market surveys, questions were focused around energy-efficiency actions that involved equipment modifications. Because we know that the recent energy crisis engendered a significant amount of energy conservation, we asked customers about their conservation as well as efficiency actions in the 2003 survey. The respondents were asked a series of questions regarding conservation actions undertaken to manage the use of energy at their facility (in contrast to physical replacements of equipment). Eighty percent of the market reported taking conservation and energy efficiency actions in past years. Respondents estimated that their actions resulted in a 7 percent average reduction in electricity usage.
Exhibit 2-16 Energy Efficiency or Conservation Actions Taken in Past Year*
Installed Energy Eff icient Equipment
Only26%
Installed Eff icient Equipment and Conservation
35%
Conservation Only16%
No Actions22%
Don't Know1%
*Asked in fall 2003
Regarding the actions taken to conserve energy, switching off lights in unused rooms was the most cited, followed by lowering thermostat setpoints and switching off office equipment. Specific business types often cited other actions: dimming lights that are in use, and reprogramming the EMS, fine-tuning existing equipment, educating employees to save energy.

Quantum Consulting Inc. 2-24 Key Findings
Exhibit 2-17 Energy Conservation Actions Taken by Customer Size
Size in Peak kWResponse >500 >1000 >2000 Total Turn Off Office Equipment 29% 20% 41% 34% Lower Thermostat Setpoints 50% 57% 62% 58% Shift High Energy Processes to Off-peak 14% 19% 26% 22% Turn Off Lights in Unused Rooms 73% 67% 81% 76% Dim Remaining Lights (That Are In Use) 13% 15% 15% 14% Pre-Cool Spaces with AC 2% 2% 2% 2% Employee Alert System 0% 2% 3% 2% Reprogram EMS 3% 9% 8% 7% Use Backup Generator 2% 0% 4% 3% Decrease Industrial Production or Consolidate Shifts 9% 15% 4% 8% Fine-tune Existing Equipment 15% 7% 10% 11% Educate Employees to Save Energy 2% 4% 10% 7% Other 3% 5% 1% 3% Don't Know 0% 0% <1% <1%# Respondents 130 89 71 290
Energy efficiency actions were reported by 61% of the market, virtually the same as in 1999; however, these figures do not represent the level of actions taken at each facility only whether action was taken at all. The largest firms were more likely to have installed energy efficient equipment. Among the respondents who said they had installed new energy efficiency equipment, the most common actions taken were installing efficient motors or variable speed drives (59 percent), installing efficient lighting (50 percent) and installing efficient HVAC/refrigeration equipment (40 percent). About 33 percent of firms reported that they had identified, but not undertaken, energy-efficiency actions within the same time period. The corresponding percentage in the 1999 survey was 26 percent. The main reasons cited for identifying, but not undertaking energy efficiency actions were lack of funds available for investment (39 percent), the need for more time to complete the decision-making process (14 percent), other priorities for capital investment (11 percent), and the belief that the level of potential savings did not justify the investment or activity required for implementation (10 percent).
Respondents also were asked about peak reduction actions specifically on power alert days. A majority of respondents, 52 percent, said that they had taken or would be willing to take additional actions during power alert days. Among business types, petroleum (68 percent) and mining (61 percent) were most likely to say they had taken additional actions during power alerts. The electronic industry was most likely to say they did not or would not take additional actions (57 percent).
2.4.2 Energy-Efficiency Related Decision-making
Most indicators of energy efficiency proclivity and perceptions were virtually the same as when they were measured in the 1998 and 1999 NSPC baseline surveys. There were, however, a few notable exceptions. First, The percentage of customers with formal policies requiring purchase of energy efficiency equipment increased from 30 percent in 1999 to 43 percent in 2003. This is a

Quantum Consulting Inc. 2-25 Key Findings
significant and important change which, if sustained, could represent an important effect of the energy crisis that could result in increased levels of energy efficiency adoption. Second, the self-reported importance of market barriers such as uncertainty over the performance and savings of efficient equipment decreased somewhat from 1999. This also could be an effect of the energy crisis. Third, seventy four percent of the market, as compared with 55 percent in 1999, said they were approached by firms offering services to improve their facility’s energy efficiency in the past year. Fourth, customers’ credibility ratings decreased across the board for all types of energy efficiency service providers; however, the IOUs remained the highest rated private sector entity as a source for energy efficiency information.
Whether these changes in key energy efficiency market indicators are temporary or permanent reactions to the energy crisis or other market factors remains to be seen.
Key market indicators associated with the NSPC program in the earlier evaluation years were associated with energy performance contracting. Based on our comparison of survey results from 1998/1999 and 2003, we conclude that the market for performance contracting has remained extremely stable, showing virtually no change in customer familiarity, contracts offered, and contracts signed per year since 1999.
Exhibit 2-18 Presence of Formal Policy to Select Energy Efficient Equipment
0%
10%
20%
30%
40%
50%
60%
70%
80%
Yes No Don't Know
1999 2003

Quantum Consulting Inc. 2-26 Key Findings
Exhibit 2-19 Customer Approached by Firm Offering Energy Efficiency Services in Past Year*
0%
10%
20%
30%
40%
50%
60%
70%
80%
Yes No Don't Know
2003 1999
*Asked in fall 2003
Exhibit 2-20
Mean Credibility Rating as Source of Efficiency Information*
0.01.02.03.04.05.06.07.08.09.0
Eng
ineeri
ng/A
rchite
ctural
Des
ign Firm
s
Ene
rgy E
quipm
ent C
ontra
ctors/
Instal
lers
Ene
rgy S
ervice
Com
panie
s (ESCOs)
Loc
al Elec
tric D
istrib
ution
Com
panie
s
Othe
r Ene
rgy S
ervice
Prov
iders
(ESPs)
1999n=280
2003n=347
*0 to 10 scale, with 10 being completely credible and 0 not credible at all.

Quantum Consulting Inc. 2-27 Key Findings
Exhibit 2-21 Familiarity with Energy Performance Contracting
0%
5%
10%
15%
20%
25%
30%
35%
40%
45%
50%
Very familiar Somewhat Familiar Unfamiliar Don't Know/Refused
1999n=349
2003 n=350
Exhibit 2-22 Customer Solicited with Performance Contract Offer in Past Year
0%
10%
20%
30%
40%
50%
60%
70%
Yes No Don't Know/Refused
1999 2003
2.4.3 Program Awareness and Suggestions
Respondents were asked about their familiarity with utility programs or resources designed to promote energy efficiency. Seventy percent of the total market reported they were aware of one

Quantum Consulting Inc. 2-28 Key Findings
or more programs or resources, as compared to 57 percent in 1999. When asked which energy-efficiency programs provided by their utility they were aware of, 66 percent mentioned rebates or incentives, including the SPC program. Only 20 percent mentioned seminars/classes, and only 10 percent mentioned energy audits.30 Awareness of the SPC program was probed in a separate, aided question. Half of respondents said that they were specifically aware of the SPC program. SPC awareness levels were very similar across utility service territories.31
Impressions of the SPC program were generally favorable (66 percent), the reasons offered being that it promoted energy efficiency, offered rebates, and offered information. Only six percent of respondents had an unfavorable impression, mostly due to reported difficulties when applying for the program (too complicated, too bureaucratic, no time for filling out forms), or because they saw no benefit or savings from applying. Twenty-seven percent had neither a favorable nor an unfavorable impression of the program.
Large nonresidential customers were also asked whether they were aware of the Flex Your Power advertising campaign that has been ongoing since the energy crisis, though at a much lower funding level in 2002 and 2003 than in 2001. When asked whether they were aware of the Flex Your Power campaign, 58 percent of the large nonresidential market responded affirmatively. For those that initially said there were unfamiliar or were not sure, a follow-up question reminded interviewers that Flex Your Power is an energy conservation campaign that began during the energy crisis. An additional 8 percent responded that they were familiar after this probe for a total of 66% when both aided and unaided responses are included. Awareness levels were higher in the commercial than industrial segments.
Finally, interviewees were asked whether they had any comments or suggestions regarding products, services, or programs that support energy efficiency or peak load reduction. Thirty-nine percent of those interviewed offered one or more comments. As would be expected, respondents provided a wide range of input, as presented in Section 6 of this report. The most common suggestions were to improve the customer focus of programs, improve advertising and showcasing efficiency successes, to expand the breadth of programs, and to increase incentives. A number of respondents indicated they were already very pleased with programs and didn’t see much room for improvements. Many customers also took the opportunity to raise concerns over issues such as electricity prices and deregulation that were outside the scope of our question but are clearly areas of strong perceptions.
30 It is important to note that this question was asked on an unaided basis, that is, respondents were asked what types of program efforts they were aware of, they were not prompted with each of the program types and asked if they were familiar with them. Aided awareness levels are typically significantly higher than unaided levels.
31 When asked about how they first learned about the program, 59 percent of respondents said they were contacted by their utility representative, 10 percent heard about it at a seminar, and 9 percent had received by mail utility brochures promoting the program. Somewhat surprisingly, less than 5 percent of respondents said they first heard about the program from a contractor or non-utility efficiency service provider.

Quantum Consulting Inc. 2-29 Key Findings
2.5 SUMMARY OF 2002 EESP RESULTS
Interviews were conducted with 52 EESPs: 24 firms that participated in the 2002 SPC Program, 16 firms that had participated in previous years but did not participate in 2002, and 12 potential participants that have never participated.
Demographics
Participating EESPs ranged in size from 1- and 2-person operations to large ESCOs and the local sales offices of multinational HVAC and refrigeration equipment manufacturers. On average, the participating EESPs interviewed had 52 employees in California.
• About half said they do business nationally or internationally, although several emphasized that most of their business was in-state.
• 43 percent do business statewide, including several who also do business in other western states; only 12 percent said they do business locally or in only part of the state.
Among non-participants, fewer respondents reported a national scope to their business:
• Half the non-participants said they do business in a region within California, while 16 percent do business statewide.
• A single multinational equipment vendor reported that its scope was global, while 11 percent of non-participants said they do business in California and part of an adjoining state or states, and 15 percent said their business is national in scope.
Both 2002 participants and those who had participated in previous years encompassed a variety of business types.
• The 24 participants interviewed included 6 equipment vendors, 5 EESPs, 4 traditional ESCOs, and 6 design/engineering firms. Participants said they had been providing energy efficiency services for anywhere from 2 to 100 years, with an average of 22 years.
• The 16 non-participants who participated previously included 2 ESCOs; 5 EESPs and 5 equipment vendors or distributors. In addition, 3 firms were primarily consulting or engineering firms, and 1 specialized in building operations and maintenance. On average, these firms had been providing efficiency services for 15 years.
Finally, all of the “pure’ nonparticipants interviewed described themselves either as contractors (both electrical and mechanical) or engineering firms, with several noting that they often act as subcontractors and therefore have limited direct customer contact.
Status of Past Applications
About half of the EESPs interviewed had projects in 2002 that were put on hold or cancelled – sometimes due to funding being unavailable, but somewhat more often because of customer-specific issues unrelated to the program.

Quantum Consulting Inc. 2-30 Key Findings
• Six of the 11 were related to corporate decision making or other business issues such as the economic downturn.
• The EESPs who reported previous applications that had been delayed attributed those delays primarily to funding availability, with several noting that there had been communications with the utility and that funds had been exhausted by the time issues had been resolved.
Program Strengths and Weaknesses
The most often cited strength of the SPC program was simply that the availability of funding allows customers to implement projects that otherwise would not meet payback criteria. Several other strengths were mentioned.
• The program is flexible in that it covers a variety of measure and technologies.
• The participation process is straightforward, especially if calculated savings are used
• Implementation staff are generally helpful and responsive
The most often cited weakness was the limited and unpredictable availability of funding. EESPs say funding limits hamper consistent marketing of SPC-funded projects and encourage EESPs to offer rebates as “icing on the cake” instead of using the rebates to sell projects that otherwise would not meet payback criteria. Where such projects ultimately receive funding, this would clearly lead to higher levels of free ridership. Other weakness mentioned included:
• It takes too long to apply, to receive approval, or to receive rebate money
• The application process is too complicated
• Some requirements and calculations were perceived to be arbitrary
Several respondents said they saw no weaknesses with the program. Similarly, when asked to describe their experiences with the 2002 program rules and requirements, most respondents said they were “reasonable,” “clear” or “straightforward.” The few negative perceptions related to the complexity of the process and the length of time involved.
About two-thirds of respondents thought 2002 incentive levels were reasonable or fair; about 15 percent said they were somewhat low. Some EESPs commented on delays in payment or said they found the different levels of rebates for different end uses confusing or unfair.
EESP Satisfaction
When asked about their overall satisfaction with the program, over two-thirds of participating EESPs were very or somewhat satisfied with the program overall. Several respondents noted that their rating would have been higher if funding had not run out so quickly. In addition, over 80 percent said their experience with the utilities administering the program had been good or excellent. Of those who had experience with technical assistance contractors, more than three-fourths rated that experience good or excellent.

Quantum Consulting Inc. 2-31 Key Findings
Use of Calculator and Website
Participating EESPs were asked both whether they had used the savings calculator and whether they had used the SPC website. About half of 2002 participants said they had used the calculator, and 70 percent had used the website. Two thirds of those who used these tools found them very helpful.
Use of Incentive Funds
Almost 80 percent of respondents passed the incentive through to the customer completely. The remaining 20 percent shared it with the customer, typically noting that they kept a small amount to cover their own costs. In almost all cases, EESPs believe that customers simply use the incentive funds to reduce project cost.
EESP vs. Customer Sponsorship
Two-thirds of participating EESPs prefer to sponsor the applications, noting that it gives them greater control over the process and frees the customer from the paperwork. The remaining respondents were evenly split between those who had no preference and those who preferred to let the customer handle the application process as a way to minimize their own paperwork.
Calculated vs. Measured Savings
Most participating EESPs preferred the calculated savings approach over measured savings.
• Benefits cited for the calculated savings approach included ease of application, prompt and complete payment, and reduced costs attributable to EM&V (which one respondent said sometimes amounted to 15 percent of the incentive amount).
• The primary drawback mentioned was that calculated savings values are somewhat conservative and may understate actual energy savings.
Potential Market Effects
Most respondents said the SPC program had improved their business by enabling them to incorporate the program incentives into their marketing approach. A few said that project delays and the level of uncertainty surrounding the availability of funding had caused them to stop using the SPC program as a marketing tool.
• About 90 percent of respondents said the SPC program was very important to their business; the remainder said it was somewhat important, generally because the availability of incentives encourages projects that otherwise would not be implemented.
• Despite the importance of the SPC program to their business, EESPs do not always use it in their marketing efforts, but decide whether or not to market the program based on the customer’s needs, the suitability of the technology they offer, and the availability of funding. On average, EESPs said they use the SPC in about half their sales efforts.

Quantum Consulting Inc. 2-32 Key Findings
• A few EESPs offered a specific example of a technology encouraged by the program, including injection molding and industrial refrigeration control.
Participating EESPs say most of the projects they did through the SPC program in 2002 would not have happened without the program. On average, about 24 percent of projects would have gone ahead without the program.
About 75 percent of 2002 participants said they were already participating or planned to participate in the 2003 program. Only 3 said they were definitely not planning to participate.
Non-Participant Perspectives
Non-participant EESPs who had participated in the SPC Program in previous years generally failed to participate in 2002 for two primary reasons:
1. A lack of opportunities or changes in their business unrelated to the SPC program.
2. Perceptions of program characteristics (complexity, paperwork, inadequate funding) that they believed made participation not worth their while.
Despite misgivings about program characteristics, about two thirds of EESPs who did not participate in 2002 planned to participate or were already participating in the 2003 program.
Most of the “pure” nonparticipant EESPs32 interviewed were either contractors or engineering firms. Some said they really do not provide or focus on energy efficiency services; others said they had been doing so for many years. Several firms said that they often act as subcontractors and have minimal customer contact, which limits their ability to participate directly in the program.
Of these non-participants, only two were familiar with the program. Both email and direct mail were seen by non-participants as potentially useful for keeping them informed about programs like SPC. Only one pure non-participant firm said they would be likely to participate in the 2003 program.
2.6 SUMMARY OF CUSTOMER “DROPOUT” INTERVIEW RESULTS
One out of five applications submitted for the 2002 Nonresidential Standard Performance Contract (NSPC) Program were discontinued. This subsection summarizes results of interviews conducted customers who were either in the program or on the wait list that subsequently dropped out of the program. This analysis explored why customers cancel projects, or “drop out”, how much energy savings are “lost”, and what can be done to improve the program’s project completion rate.
The speed with which the funding was fully subscribed in 2002 was the major systematic cause for program-related cancellations as some customers got incentives from other programs or otherwise installed their projects while on the wait list. Other program-related reasons for
32 “Pure” non-participant EESPs were defined as firms that have never participated in the nonresidential SPC program, i.e., going back to the program inception in 1998.
Quantum Consulting Inc. 2-33 Key Findings
cancellation were either project specific or do not imply the need for revisions to the program. Fully half of the projects proceeded with their installations anyway (i.e., without participating), which is consistent with net-to-gross findings from other program years. It is also important to note that no clear profile of dropouts emerged that would imply any type of systematic bias toward cancellation of particular customer applications or project types. Complete results are presented in Appendix B.

Quantum Consulting Inc. 3-1 Summary of 2002 Program Tracking Data
3. SUMMARY OF 2002 SPC PROGRAM TRACKING DATA
This section contains a program activity summary for the 2002 SPC Program. The data presented below includes information on savings, expenditures, and participation characteristics as tracked in the utility program databases.
The information in this section is based on extracts from the program tracking databases maintained by PG&E, SCE and SDG&E that were obtained in March 2003. These utility-specific extracts were then aggregated to create a summary of program activity at statewide level. The reader should be aware that this report will likely change as the projects in the 2002 program years are finalized. This is because individual project savings may change somewhat after actual installation (savings may be more or less than planned) and some projects may have dropped out of the program after March 2003. An update of program savings and installations will be provided as part of the separate impact evaluation report.
The section contains the following subsections: Summary of Program Activity; Composition of Applicants; and Statewide Participation Details.
3.1 SUMMARY OF PROGRAM ACTIVITY
Exhibit 3-1 summarizes program activity for PY2002, as reflected in the current database extracts. There were 299 unique customers with 355 applications, representing $17.8 million in incentives statewide. A total of 238 GWh and 4.9 million annual therms were saved, which combined represent 2.9 trillion Btu of energy savings. Approximately 11 percent of the incentives were awarded for gas measures. The incentive structure paid on average $0.066/kWh and $0.41/therm.
Exhibit 3-1 Summary of PY2002 Program Activity
Activity Level Statewide PG&E SCE SDG&ETotal unique customers 299 118 144 39Total number of applications 355 146 165 44Total unique third-party sponsors 48 14 25 16Total incentive funds committed ($ million) 17.87 6.84 8.72 2.31 Incentive funds committed to electric measures ($ million) 15.85 5.01 8.72 2.12 Incentive funds committed to gas measures ($ million) 2.01 1.83 0.00 0.19Total savings from active applications (Btu, trillions)* 2.94 1.06 1.56 0.32 Electric savings from active applications (GWh) 238.53 58.54 152.24 27.76 Gas savings from active applications (therms, millions) 4.94 4.56 0.00 0.38Average incentives per kWh $0.066 $0.086 $0.057 $0.076Average incentives per therm $0.408 $0.401 - $0.495
* Conversion rates obtained from 2001 Energy Efficiency Standards for Residential and Non-residential Buildings , California Energy Commission, June 2001: 1 kWh = 10,239 Btu source energy 1 therm = 100,000 Btu source energy

Quantum Consulting Inc. 3-2 Summary of 2002 Program Tracking Data
3.2 COMPOSITION OF APPLICANTS: CUSTOMER SELF-SPONSORS VS. EESP-SPONSORED CUSTOMERS
Exhibit 3-2 summarizes program activity and a variety of key indicators for self-sponsored and EESP-sponsored customers.
Exhibit 3-2 PY2002 Program Activity Summary
Self-Sponsored Applications
EESP-Sponsored Applications Total
StatewideActivities Number of unique customers 226 76 299 Number of applications 270 85 355 Number of sites 323 124 446 Total incentive funds committed ($ 000's) $13,813 $4,057 $17,869 Total Btu (trillions) 2.30 0.63 2.94 Total GWh 185 53 239 Total therms (millions) 4.06 0.87 4.94Comparative Indicators Applications per customer 1.19 1.12 1.19 Sites per application 1.20 1.46 1.26 Incentive $ per customer (000's) $61.12 $53.38 $59.76 Incentive $ per application (000's) $51.16 $47.73 $50.34PG&EActivities Number of unique customers 100 19 118 Number of applications 127 19 146 Number of sites 164 19 183 Total incentive funds committed ($ 000's) $6,396 $440 $6,836 Total Btu (trillions) 0.96 0.10 1.06 Total GWh 56 3 59 Total therms (millions) 3.85 0.71 4.56Comparative Indicators Applications per customer 1.27 1.00 1.24 Sites per application 1.29 1.00 1.25 Incentive $ per customer (000's) $63.96 $23.17 $57.94 Incentive $ per application (000's) $50.36 $23.17 $46.82SCEActivities Number of unique customers 109 37 144 Number of applications 122 43 165 Number of sites 139 83 221 Total incentive funds committed ($ 000's) $6,340 $2,383 $8,723 Total Btu (trillions) 1.20 0.36 1.56 Total GWh 117 35 152 Total therms (millions) 0.00 0.00 0.00Comparative Indicators Applications per customer 1.12 1.16 1.15 Sites per application 1.14 1.93 1.34 Incentive $ per customer (000's) $58.16 $64.40 $60.57 Incentive $ per application (000's) $51.97 $55.41 $52.87SDG&EActivities Number of unique customers 19 20 39 Number of applications 21 23 44 Number of sites 20 22 42 Total incentive funds committed ($ 000's) $1,076 $1,234 $2,310 Total Btu (trillions) 0.15 0.18 0.32 Total GWh 12 16 28 Total therms (millions) 0.21 0.17 0.38Comparative Indicators Applications per customer 1.11 1.15 1.13 Sites per application 0.95 0.96 0.95 Incentive $ per customer (000's) $56.65 $61.68 $59.23 Incentive $ per application (000's) $51.26 $53.64 $52.50
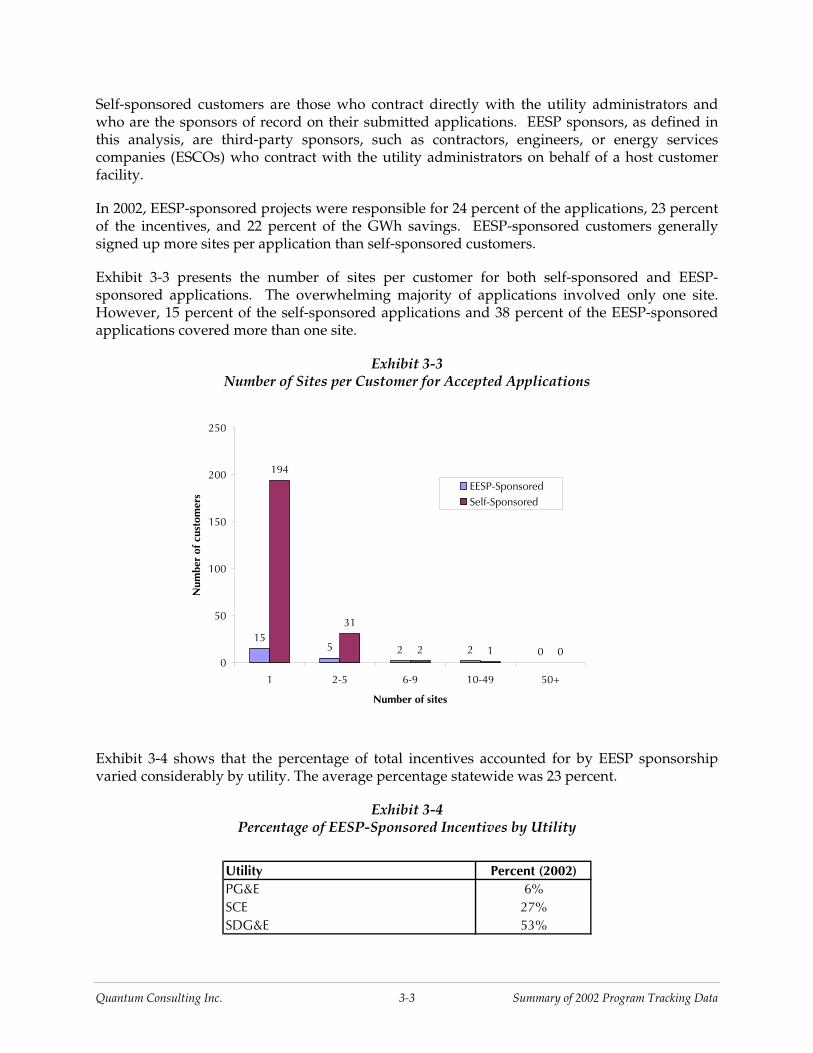
Quantum Consulting Inc. 3-3 Summary of 2002 Program Tracking Data
Self-sponsored customers are those who contract directly with the utility administrators and who are the sponsors of record on their submitted applications. EESP sponsors, as defined in this analysis, are third-party sponsors, such as contractors, engineers, or energy services companies (ESCOs) who contract with the utility administrators on behalf of a host customer facility.
In 2002, EESP-sponsored projects were responsible for 24 percent of the applications, 23 percent of the incentives, and 22 percent of the GWh savings. EESP-sponsored customers generally signed up more sites per application than self-sponsored customers.
Exhibit 3-3 presents the number of sites per customer for both self-sponsored and EESP-sponsored applications. The overwhelming majority of applications involved only one site. However, 15 percent of the self-sponsored applications and 38 percent of the EESP-sponsored applications covered more than one site.
Exhibit 3-3 Number of Sites per Customer for Accepted Applications
155 2 2 0
194
31
2 1 00
50
100
150
200
250
1 2-5 6-9 10-49 50+
Number of sites
Num
ber
of c
usto
mer
s
EESP-SponsoredSelf-Sponsored
Exhibit 3-4 shows that the percentage of total incentives accounted for by EESP sponsorship varied considerably by utility. The average percentage statewide was 23 percent.
Exhibit 3-4 Percentage of EESP-Sponsored Incentives by Utility
Utility Percent (2002)PG&E 6%SCE 27%SDG&E 53%

Quantum Consulting Inc. 3-4 Summary of 2002 Program Tracking Data
3.3 STATEWIDE PARTICIPATION BY END-USER SEGMENTS
Exhibit 3-5 compares customer participants by end-user segment for the 2002 SPC Program. Industrial customers form the largest percentage, with 48 percent of the total. Commercial customers account for the next largest segment, with approximately 35 percent.
Exhibit 3-5 Breakdown of Customer Participants by End-User Segment
0%
10%
20%
30%
40%
50%
Commercial Industrial Institutional Other
Exhibit 3-6 shows the end-user segments and percent of incentives for active applications for the top 10 end-user participants (including both self-sponsors and EESP-sponsored customers) in 2002. The top 10 end users were all self-sponsored, and accounted for 21 percent of total incentives. The top 5 end users accounted for 13 percent of total incentives.
Exhibit 3-6 Percent of Program Incentives for Top 10 End Users
Rank Sponsorship Segment % of Incentives Cumulative %1 SELF Commercial 4% 4%2 SELF Industrial 3% 8%3 SELF Industrial 2% 9%4 SELF Other 2% 11%5 SELF Institutional 2% 13%6 SELF Institutional 2% 15%7 SELF Institutional 2% 16%8 SELF Industrial 2% 18%9 SELF Industrial 2% 20%10 SELF Institutional 2% 21%

Quantum Consulting Inc. 3-5 Summary of 2002 Program Tracking Data
Exhibit 3-7 shows the end uses included in active applications in 2002. It shows that Process accounts for the largest number of applications and amount of incentives, even without counting the Process measures included in applications with multiple measures. Please note that the data supplied by one utility did not detail the incentives paid by measure. For this utility, the breakdown of incentives by measure type is our best estimate.
Exhibit 3-7 End Uses Included for Accepted Applications
SponsorshipEnd-use category
Number of applications
Total incentives ($
000's)
Average incentives ($
000's)% of
incentives Total GWh % of GWhSelf-sponsored L 16 $434 $27.14 3% 8 4%
H 62 $2,825 $45.56 20% 29 16%O 18 $893 $49.62 6% 11 6%P 128 $5,679 $44.37 41% 87 47%Multiple 46 $3,981 $86.55 29% 50 27%Total 270 $13,813 $51.16 100% 185 100%
EESP-sponsored L 9 $587 $65.18 14% 12 22%H 16 $488 $30.51 12% 4 8%O 8 $421 $52.61 10% 4 8%P 28 $892 $31.85 22% 9 16%Multiple 24 $1,669 $69.55 41% 25 47%Total 85 $4,057 $47.72 100% 53 100%
All L 25 $1,021 $40.83 6% 20 8%H 78 $3,313 $42.47 19% 33 14%O 26 $1,314 $50.54 7% 15 6%P 156 $6,571 $42.12 37% 96 40%Multiple 70 $5,651 $80.72 32% 75 31%Total 355 $17,869 $50.34 100% 239 100%
In the data for Exhibit 3-8 and 3-9, the multiple-end-use applications were disaggregated into their component end uses. Exhibit 3-8 shows that in 2002, Process measures received three times the incentives going to lighting, and 1.5 times the incentives going to HVAC/R.
Exhibit 3-9 presents estimated savings in GWh by end use category. Therm savings are excluded from these figures, because they occur only in a restricted range of end uses. Note, however, that incentives for therm savings totaled approximately $2 million, or 11 percent of all incentives awarded.

Quantum Consulting Inc. 3-6 Summary of 2002 Program Tracking Data
Exhibit 3-8 End-Use Category Breakdown of Incentives
0
1,000
2,000
3,000
4,000
5,000
6,000
7,000
8,000
HVAC/R Lighting Process Other
Ince
ntiv
es (
$ 00
0's)
Exhibit 3-9 End-Use Category Breakdown of GWh
0
20
40
60
80
100
120
HVAC/R Lighting Process Other
GW
h

Quantum Consulting Inc. 3-7 Summary of 2002 Program Tracking Data
Exhibit 3-10 presents the incentives and kWh savings by end use. The ratios between the two are affected both by the level of incentives per kWh awarded under the program and by the fact that incentives were capped to 50 percent of total project cost. “Process – Other” (including a high-efficiency furnace, process boilers, hot water measures, etc.) and fluorescent lighting account for the highest percentages of kWh savings. “Process – Compressors” and “Process – VSD” account for the highest percentages of incentives awarded.
Exhibit 3-10 kWh and Incentives by Project Type
0% 5% 10% 15% 20%
Refrigeration - VSD
Process - Controls
Lighting - Other
Lighting - HID
Space cooling - Packaged units
Other - Controls
Space cooling - VSD
Refrigeration - Controls
Space cooling - Chillers
Refrigeration - Other
Process - Motors
Other - Equipment
Space cooling - Controls
Space cooling - Other
Lighting - Controls
Process - VSD
Process - Compressors
Lighting - Fluorescent
Process - Other
Incentives %
kWh %
* Incentive figures relating to therm savings are excluded.

Quantum Consulting Inc. 4-1 Customer Participant Results
4. CUSTOMER PARTICIPANT RESULTS
This section presents responses to a set of structured interviews we conducted with a representative sample of customers participating in the 2002 NSPC Program. Interviews were conducted in the third Quarter of 2003. During this time, we interviewed 36 separate organizations, representing a total of 42 projects. Our goal in conducting these interviews was to obtain evaluation-related feedback on the 2002 program. This section presents the process evaluation-related results from the participant customer interviews. An impact evaluation is also being conducted as part of the overall evaluation of the 2002 NSPC. The impact evaluation will be published as a separate volume after this process and market evaluation because the impact site visits must be conducted after all of the customers in the sample have installed their projects. As of this writing, a number of customers in the sample had not completed project installation. The impact evaluation volume will also include estimates of the net-to-gross savings ratio for PY2002. This section contains the following subsections:
• General Characteristics of the 2002 Participant Customer Sample (4.1)
• Program-Related Decisions (4.2)
• Process-Related Issues (4.3)
• Program Effect on Future Energy Efficiency Actions (4.4)
• Program Participant Experience with EESPs (4.5)
4.1 GENERAL CHARACTERISTICS OF THE 2002 PARTICIPANT CUSTOMER SAMPLE
This subsection presents characteristics of the sample of 2002 NSPC customer participants with whom in-depth interviews were conducted in October, November and December 2003. To the extent possible, we interviewed customers whose projects will also be evaluated as part of the impact evaluation. The sample was stratified into three roughly equal-sized strata based on the kWh savings associated with each unique customer for each utility, resulting in one sample list per utility. Exhibit 4-1 shows the interviews completed by strata and utility.
Our approach was to try to complete as many interviews as possible with the customers included in the impact sample. A comparison of the sample obtained aggregated across utilities versus the statewide population of NSPC participants is shown in Exhibits 4-2 and 4-3.

Quantum Consulting Inc. 4-2 Customer Participant Results
Exhibit 4-1 Completed Interviews by Utility and Strata
Savings Strata PG&E SCE SDG&E Statewide
Large 2 3 0 5
Medium 4 12 1 17
Small 7 6 1 14
Total 13 21 2 36
We stratified the sample based on a weighted sum of the kWh savings for each customer. As shown in Exhibit 4-1, each stratum represents roughly one-third of these kWh in the sample. This sampling approach resulted in our capturing 36 percent of the kWh savings. The sampling approach resulted in our capturing 25 percent of the accepted incentives with a sample size of 36, or 14 percent of the 261 unique customers in the program at that time. In addition, the interviews represent a diversity of project types and sizes.
Exhibit 4-2 Comparison of Customer Stratification by Energy Savings
kWh Strata Definition n Sample kWh
N Population kWh
Stratum 1 Customers--top third of combined kWh figure
5 46,826,554 11 77,662,302
Stratum 2 Customers--middle third of combined kWh figure
17 36,346,190 35 80,533,396
Stratum 3 Customers—bottom third of combined kWh figure
14 4,325,936 215 80,337,526
Total All 36 87,498,680 261 238,533,224
Exhibit 4-3
Comparison of Customer Stratification by Accepted Incentives
Stratum Definition n Sample Incentives
N Population Incentives
Stratum 1 Customers from top third of incentives awarded 5 $1,522,762 11 3,698,559
Stratum 2 Customers from middle third of incentives awarded 17 $2,661,091 35 5,826,680
Stratum 3 Customers from bottom third of incentives awarded 14 $330,223 215 8,343,944
Total All 36 $4,514,076 261 $17,869,183.00

Quantum Consulting Inc. 4-3 Customer Participant Results
As shown in Exhibit 4-4, 81 percent of respondents self-sponsored their applications. This broadly reflects the proportion found in the program population and is consistent with the trend toward self-sponsorship found in the overall 2002 NSPC program-tracking data discussed in Chapter 3. Customers who self-sponsored their applications were also asked if they used any third-party firms for assistance with the project. Approximately 72 percent of the self-sponsors sampled reported having hired third parties for assistance. These firms were hired most frequently for moderate assistance, such as to install the equipment or to provide energy audits and calculations of savings.
Exhibit 4-4 Breakdown of Customer Participant Sample by Sponsorship
Sponsored? Percent (2002)EESP 19%SELF 81%TOTAL 36
Exhibit 4-5 presents the distribution of the customer sample by the utility for which applications were submitted. Consistent with the sample provided, SCE represented the largest share of the customers interviewed, with 58 percent of those surveyed. SDG&E participants are somewhat underrepresented in the sample.
Exhibit 4-5 Breakdown of Customer Participant Sample by Utility
Utility Percent (2002)PG&E 36%SCE 58%SDG&E 6%TOTAL 36
Exhibit 4-6 presents reported statistics on the square footage at the sites for which project applications were submitted. The mean size of the facilities is about 396,000 square feet, with a range from 36,000 to 2.5 million square feet.
Exhibit 4-6 Square Footage of Participating Sites
Square footage Percent (2002)Average 395,728
Median 220,000
Minimum 36,000
Maximum 2,500,000

Quantum Consulting Inc. 4-4 Customer Participant Results
The average number of employees for the participating sites was 613, with a range from 16 to 4,000. The average number of employees in the companies overall was 75,026, ranging from 27 to 1 million.
Exhibit 4-7 illustrates the distribution of reported average monthly electric usage. The median electricity bill was between $100,000 and $500,000 per month.33
Exhibit 4-7 Self-Reported Electric Bills of Sampled Participating Sites
Average Monthly Electric Bill Percent (2002)Up to $10,000 0%$10,000 - $99,999 25%$100,000 - $499,999 36%$500,000 - $999,999 3%$1,000,000 or more 14%Don't know 6%Refused 17%TOTAL 36
As shown in Exhibit 4-8, the sample of customers also includes respondents from each of the four major market segments, commercial, industrial, institutional, and agricultural. The industrial sector represented the highest proportion, at almost half of the sample, consistent with the program population, and maintaining the trend of significant industrial participation that has been observed since PY2000.
Exhibit 4-8 Breakdown of Sampled Customer Participants by Market Segment
Industrial45%
Commercial23%
Agricultural6%
Institutional20%
Other6%
n=36
33 Figures are based on customer self-reports, not utility billing records.

Quantum Consulting Inc. 4-5 Customer Participant Results
Another characteristic of the sample can be seen in Exhibit 4-9, which shows that most participating customers are also customers who are part of multi-site organizations (53 percent).
Exhibit 4-9 Breakdown of Sample by Single versus Multi-Site
Single Vs. Multiple Sites Percent (2002)Only Location 22%Part of Multiple-Site Organization 53%Don't know 22%Refused 3%TOTAL 36
Exhibit 4-10 shows the percentage breakdown of facility ownership versus lease arrangement. Most of the facilities in the sample (75 percent) are owned by the customer. A total of 17 percent of our sample leased their facility space, and in all cases paid at least a portion of their electric bill.
Exhibit 4-10 Breakdown of Sample by Facility Ownership or Lease Arrangement
Occupant type Percent (2002)Owner-occupier 75%Lessee 17%Other 8%TOTAL 36
4.2 PROGRAM-RELATED DECISIONS
In this subsection, we present responses to a variety of questions customers were asked about how they made decisions related to NSPC projects.
Origin of Decisions and Role and Significance of Third-Party Firms
Customers were asked a variety of questions about the origin of their SPC project decisions including their reasons for pursuing the projects, condition of equipment replaced, how they learned about the efficiency measures implemented, how and when they learned about the SPC program, and the role and significance of third-party firms in their decision-making processes.
As shown in Exhibit 4-11, customers in the 2002 program were asked to describe what led to their decision to install the measures in the NSPC applications. By far the most common response, cited by 94 percent of those surveyed, was the need to reduce energy costs. The need to replace older equipment was the next most common reason, at 28 percent.

Quantum Consulting Inc. 4-6 Customer Participant Results
Exhibit 4-11 Reason for Decision to Pursue Installation
Reason to Install Percent (2002)Replace Older Equipment 28%Improve Measure Performance 14%Reduce Energy Costs 94%Acquire Latest Technology 3%TOTAL (multiple responses permitted) 36
As Exhibit 4-12 illustrates, 33 percent of the measures installed by the 2002 program respondents consisted of replacing fully functional existing equipment. Another 28 percent of the equipment had failed or was experiencing significant problems. This disposition is similar to that reported in the 2001 evaluation.
Exhibit 4-12 Condition of Equipment Replaced through Program
Condition of Existing Equipment Percent (2002)Did Not Replace Existing Equipment 8%Fully Functional 33%Functioning with Problems 25%Failed/Did Not Function 3%N/A, Ancillary Equipment (VSD, Controls, etc.) 31%TOTAL 36
The most common way the respondents learned about the energy-efficient equipment they installed, at 68 percent, was that they learned about it from a previous installation in which they or their firm was involved. As shown in Exhibit 4-13, another 8 percent heard about it from a contractor or vendor. The fraction of respondents stated that they first learned about the equipment installed through a previous installation was significantly higher for 2002 than reported for previous program years.
Exhibit 4-13 How Customers Learned about Equipment Installed
Where Heard About Equipment Percent (2002)Previous Installation 68%Utility Representative 8%Contractor 8%Equipment Vendor 5%Self-Knowledge 5%Colleague, Trade Show 3%TOTAL 42

Quantum Consulting Inc. 4-7 Customer Participant Results
While utility representatives played only a minor role in bringing energy-efficient equipment to the attention of customers, they were customers’ main source of initial information about the NSPC program itself (see Exhibit 4-14). This result is consistent with that obtained in previous years’ NSPC evaluations. Prior knowledge or hearing about the program from a vendor or contractor were also frequent responses.
Exhibit 4-14 How Customers Learned about Program
Where Heard About LNSPC Program Percent (2002)Utility Representative 59%Contractor \ Vendor 17%Previous Installation 16%Self Knowledge 5%Unregulated Company 3%TOTAL 37
As shown in Exhibit 4-15, 81 percent of the 2002 respondents heard about the program before or at the same time as they first thought about installing the energy-efficient equipment installed. Only 11 percent heard about the program after they had decided to install the equipment, seeking to then take advantage of the money or install sooner.
Exhibit 4-15 When Customers Decided to Install
When Heard About LNSPC Program Percent (2002)Before 64%Same Time 17%After Began Researching 11%After Decision to Install 3%Don't Know / Refused 6%TOTAL 36
Customers were also asked to select an option that reflected the role third-party firms played in their decision to install the energy efficiency equipment. Responses to this question are shown in Exhibit 4-16, both overall and by sponsorship type. Well over half (58 percent) reported having developed the project ideas and pursued installation themselves. (This percentage is higher than in all previous program years’ evaluations except 1998.) Among self-sponsors, this figure rises to 62 percent. Another 14 percent said that a third party was responsible for developing the idea, but that they decided on their own to pursue installation. Another 19 percent said that a third party was responsible for actually convincing them to pursue implementation of the projects. As would be expected, all answers differ considerably when segmented by sponsorship.

Quantum Consulting Inc. 4-8 Customer Participant Results
Exhibit 4-16 How Customer Decided to Install Energy Efficiency Equipment (2002 NSPC)
Process Which Led To Installation
Self-Sponsored
Applications
EESP-Sponsored
Applications Percent (2002)
Developed and Pursued on Own 62% 43% 58%Developed Idea, Convinced by 3rd Party 7% 0% 6%3rd Party Developed Idea and Convinced to Pursued 14% 43% 19%3rd Party Idea, Decided on Own to Pursue 14% 14% 14%Other 3% 0% 3%TOTAL 29 7 36
We also asked customers who used third-party firms to rate the significance of the overall value of the services provided by the firm for their decision to install the NSPC-related measures. The results are presented in Exhibit 4-17. Overall, they found the third-party services to be valuable, with 75 percent of customers rating the contribution of third-party firms as either very significant or somewhat significant. Only 25 percent of those surveyed believed the third-party firm’s role was not significant. Note that only EESP sponsored customers and self sponsoring customers who reported substantial assistance from an EESP were asked the question regarding the significance of the third-party in their decision-making process.
Exhibit 4-17 Significance of Third-Party Firm Services in Decision to Participate
Significance of EESP Services Percent (2002)Very significant 39%Somewhat Significant 36%Somewhat Insignificant 21%Very Insignificant 4%TOTAL 28
Reported Importance of Program to Implementation Decision
Customers were asked two key questions centering on the role of NSPC incentives in their decision to implement the projects included in their program applications. The first question phrases the influence of the incentives in terms of their significance, while the other question is phrased in terms of what they would have done had the incentives not been available. These questions are part of the series of questions used to calculate the net-to-gross ratios as part of the impact evaluation, which will be published subsequently as a separate volume from this report.
As shown in Exhibits 4-18 and 4-19, about one-third of the respondents reported that the incentives had an extremely significant influence on their decision to implement their efficiency project, but at the same time only 14 percent reported that they would definitely not have installed the project without the program. Sixty-seven percent report they probably or definitely would have installed the projects anyway, though the project schedule or efficiency level may

Quantum Consulting Inc. 4-9 Customer Participant Results
have been affected by non-participation. We may surmise that for most customers, incentives had a partial effect on their decision to participate and that incentives were vital to a smaller number of them. This issue is addressed further in the impact evaluation report.
When asked what type of equipment they would have installed in the absence of the program, most said that they would have installed equally efficient equipment anyway (92 percent); some said that they would rather install no equipment at all than install less-efficient equipment. (See Exhibit 4-19)
Exhibit 4-18 Significance of Incentives
Significance of Incentive Percent (2002)Very significant 31%Somewhat significant 33%Somewhat insignificant 22%Very insignificant 14%TOTAL 36
Exhibit 4-19 Likelihood of Installing in Absence of Program
Likelihood of Installing Without Program Percent (2002)Definitely Would NOT Have Installed 14%Probably Would NOT Have Installed 17%Probably Would Have Installed 44%Definitely Would Have Installed 25%TOTAL 36
Exhibit 4-20 Type of Equipment Would Have Installed in Absence of Program
Efficiency Level Without Program Percent (2002)Probably NOT As Efficient 4%Probably As Efficient 92%Not Applicable for Measure 4%TOTAL 25
Respondents were also asked when they would have installed the equipment in the absence of the program. Exhibit 4-21 illustrates that none of those who report that they would probably or definitely have installed without the program would have waited more than 4 years to install the equipment. Sixty-seven percent of respondents who reported that they would definitely or probably have installed equipment anyway would have installed it within a year. Forty-three percent of those who would probably or definitely not have installed without the program would have installed the equipment within a year if they had gone ahead with the project.

Quantum Consulting Inc. 4-10 Customer Participant Results
Exhibit 4-21 Timing of Installation Without Program
Years
Those who would have installed
Those who would not have installed
Same Time, or Within 6 Months 54% 43%Six Months to One Year Later 13%One to Two Years Later 21%Two to Three Years Later 8% 29%Three to Four Years LaterFour or More Years LaterNever 4% 29%TOTAL 24 7
4.3 PROCESS-RELATED ISSUES
In this subsection, we present responses to questions concerning the implementation of the 2002 NSPC Program. These questions were generally asked on an open-ended basis. They are also broadly similar to the implementation questions asked of EESPs, presented in Section 5. The topics covered include:
• Overall satisfaction with the program
• Program strengths and weaknesses
• Incentive structure and payment processing
• Usefulness of program tools and supporting materials
• M&V requirements
• Opinions on program management.
Overall Satisfaction with the Program
We asked participants to rate their overall satisfaction with the program on a scale of 1 to 5, where 1 meant they were very dissatisfied with the program or process, and 5 meant they were completely satisfied. In general, participants were highly satisfied with the program and gave it very positive overall satisfaction ratings. Only 41 percent of participants were less than completely satisfied with the program and the overwhelming majority of those still rated their satisfaction with the program highly, rating it a 4 on the 1–5 scale. Exhibit 4-22 below reports our findings regarding overall participant satisfaction with the program.

Quantum Consulting Inc. 4-11 Customer Participant Results
Exhibit 4-22 Overall Satisfaction with 2002 NSPC
Overall Satisfaction Percent (2002)Very Satisfied 59%Somewhat Satisfied 38%Neither Satisfied no Dissatisfied 3%Somewhat Dissatisfied 0%Very Dissatisfied 0%Don't know / not applicable 0%TOTAL 29
Program Strengths and Weaknesses
We asked customers to express what they thought were the strengths and weaknesses of the program. The ranges of responses were categorized and are shown in Exhibit 4-23 and Exhibit 4-24. As would be expected, by far the most common strength mentioned was the direct financial value of the incentives (66 percent). The next most cited benefit was the simplicity of the program (12 percent), which testifies to program administrators’ efforts to streamline the application and M&V processes over the five year history of the program.
Only a minority of respondents offered opinions on the program’s weaknesses. The most common area of complaints concerned the difficulty in satisfying the paperwork required by the program. The most common complaint was that the paperwork was too difficult. The next most common reported weakness was that the M&V process was too onerous. A few miscellaneous areas of complaints were also offered.
Exhibit 4-23 Strengths of 2002 NSPC Program
(multiple responses allowed)
Strengths Percent (2002)Program gives you money 66%Program is simple 12%Program saves energy / rewards energy efficiency 12%Excellent service provided by utility representative 2%Forced increased analysis of project/energy use 7%TOTAL 41

Quantum Consulting Inc. 4-12 Customer Participant Results
Exhibit 4-24 Weaknesses of 2002 NSPC Program
(multiple responses allowed)
Weaknesses Percent (2002)No drawbacks 61%Paperwork too difficult 19%M&V onerous 6%Whole application took too long 3%Money late 3%Software problems 3%Approval criteria ambiguous 3%Too little time to qualify for SPI 3%TOTAL 36
Incentive structure and payment processing
We asked respondents what they thought about the structure of the incentive offered by the program. The majority believed the incentive structure was fair, while a small fraction felt the incentive levels could be higher. Exhibit 4-25 below reports their feedback.
Exhibit 4-25 Feedback on Incentive Structure
Comments on incentive structure of program Percent (2002)Good or fair incentive levels 80%Incentives could be higher 17%Great or generous incentive levels 3%TOTAL 30
We also queried participants on the reasonableness of the incentive payment process, including both the procedures involved and the amount of time it took for them to get paid. Over 80 percent reported that the payment process was reasonable, while 13 percent said that it was not. Some mentioned that they experienced problems with satisfying paperwork requirements, while others complained that the wait time to receive payment was too long. Exhibit 4-26 presents our findings on participants’ perception of the incentive payment process.
Exhibit 4-26 Reasonableness of Procedures and Timing of Incentive Payments
Incentive Process Reasonable? Percent (2002)Yes 81%No 13%Don't know 6%TOTAL 32

Quantum Consulting Inc. 4-13 Customer Participant Results
Respondents also were asked to report payback periods with and without program incentives. As indicated in Exhibit 4-27, the 23 participants who provided both payback estimates reported that the project incentives reduced the payback by approximately one year. This self-reported average reduction in payback is consistent with the fact that the average program incentive payments are roughly equivalent to the average rate of 10 to 15 cents per kWh.
Exhibit 4-27 Self-Reported Payback Estimates with and without Program Incentives
Payback Estimates Years (2002)
Mean payback with incentives (n=23) 2.2 Mean payback without incentives (n=23) 3.2
Usefulness of program tools and materials
We asked participants a battery of questions about their use of specific tools offered by the program – the savings calculator and the program website. We found that the program website was widely used, while the savings calculator was not. Exhibits 4-28 and 4-29 below report our findings for both the savings calculator and program website, respectively.
Exhibit 4-28 Use of Savings Calculator Offered by NSPC Program
Used Savings Calculator? Percent (2002)Yes 21%No 70%Don't know 9%TOTAL 33
Exhibit 4-29 Use of NSPC Website
Used Website? Percent (2002)Yes 63%No 28%Don't know 9%TOTAL 32
We also asked whether participants found these tools to be helpful. The majority (60%) reported these tools were either very or somewhat helpful. Participants’ specific feedback on the helpfulness of these tools is reported in Exhibit 4-30 below.

Quantum Consulting Inc. 4-14 Customer Participant Results
Exhibit 4-30 Helpfulness of Savings Calculator and NSPC Website
Were they helpful? Percent (2002)Yes, very 38%Yes, somewhat 22%No, did not help me 9%No, did not use 19%Don't know / Refused 13%TOTAL 32
M&V Requirements
Customer respondents were asked whether they used the calculated savings or the measured savings option in their application(s). Exhibit 4-31 shows that the measured and calculated savings option were equally popular, with 30 percent of the respondents using them exclusively. Another 20 percent reported using a combination of calculated and measured savings in their applications. These self-reports are somewhat inaccurate, as the utility program managers reported that very few applications use the formal M&V path, with almost all of those cases occurring in the SDG&E territory.34 Instead, these responses probably reflect cases in which the program administrators required limited measurement as part of establishing the calculated savings upon which savings would be based. Several customers (20 percent) did not know which option was used for their project.
Exhibit 4-31 Customer Self-Report of Calculated Versus M&V Path
M&V Option Percent (2002)Calculated 30%Measured 30%Combination 20%Don't Know 20%TOTAL 30
Exhibit 4-31 presents respondents’ reasons for choosing their preferred M&V option stratified according to the responses in Exhibit 4-32. Most of those reporting the calculated savings option (86 percent) say they chose it because it was the easiest option or because they felt that the measured savings option was not worth the hassle or cost. Those who reported the measured savings option believed they did so for several different reasonsbecause they wanted savings measured for their own purposes, because the EESP recommended it, or because it was the only option available for the measure they were installing. The only respondents who gave the reason for their choice as being a recommendation from the utilities were respondents who combined both savings options.
34 The formal M&V path ties payments to M&V conducted one-year after installation but also provides a higher payment per kWh saved than the calculated path.
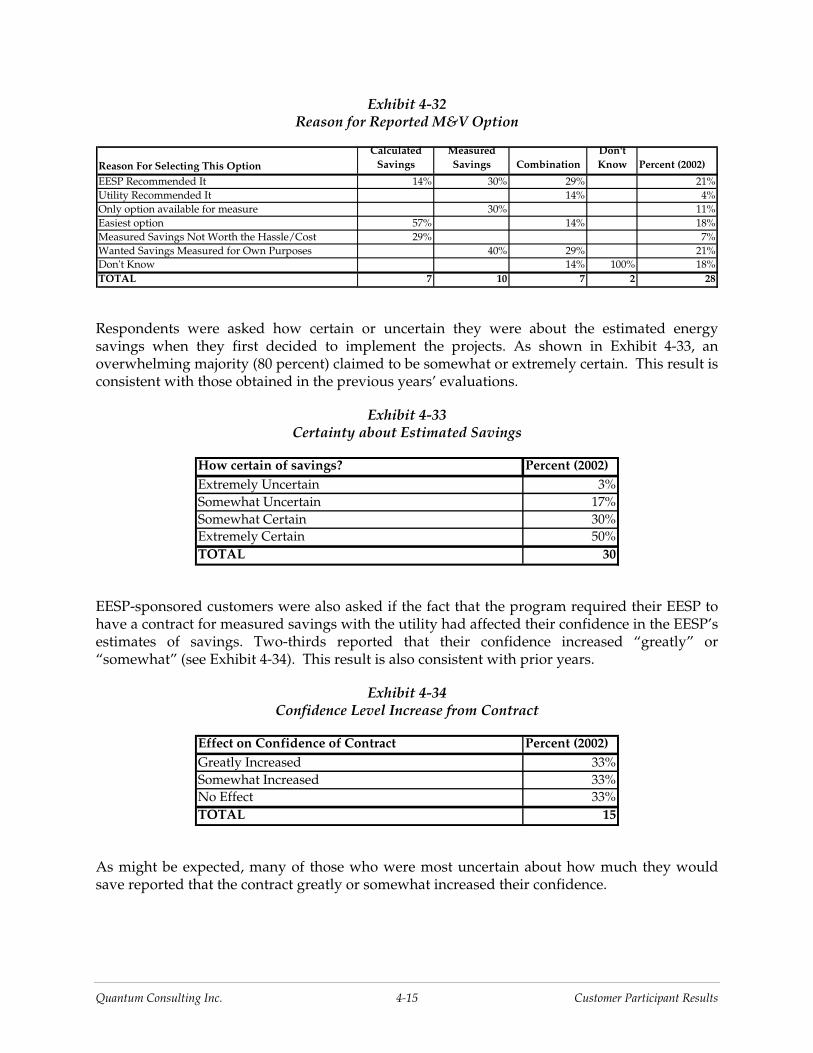
Quantum Consulting Inc. 4-15 Customer Participant Results
Exhibit 4-32 Reason for Reported M&V Option
Reason For Selecting This OptionCalculated
SavingsMeasured Savings Combination
Don't Know Percent (2002)
EESP Recommended It 14% 30% 29% 21%Utility Recommended It 14% 4%Only option available for measure 30% 11%Easiest option 57% 14% 18%Measured Savings Not Worth the Hassle/Cost 29% 7%Wanted Savings Measured for Own Purposes 40% 29% 21%Don't Know 14% 100% 18%TOTAL 7 10 7 2 28
Respondents were asked how certain or uncertain they were about the estimated energy savings when they first decided to implement the projects. As shown in Exhibit 4-33, an overwhelming majority (80 percent) claimed to be somewhat or extremely certain. This result is consistent with those obtained in the previous years’ evaluations.
Exhibit 4-33 Certainty about Estimated Savings
How certain of savings? Percent (2002)Extremely Uncertain 3%Somewhat Uncertain 17%Somewhat Certain 30%Extremely Certain 50%TOTAL 30
EESP-sponsored customers were also asked if the fact that the program required their EESP to have a contract for measured savings with the utility had affected their confidence in the EESP’s estimates of savings. Two-thirds reported that their confidence increased “greatly” or “somewhat” (see Exhibit 4-34). This result is also consistent with prior years.
Exhibit 4-34 Confidence Level Increase from Contract
Effect on Confidence of Contract Percent (2002)Greatly Increased 33%Somewhat Increased 33%No Effect 33%TOTAL 15
As might be expected, many of those who were most uncertain about how much they would save reported that the contract greatly or somewhat increased their confidence.
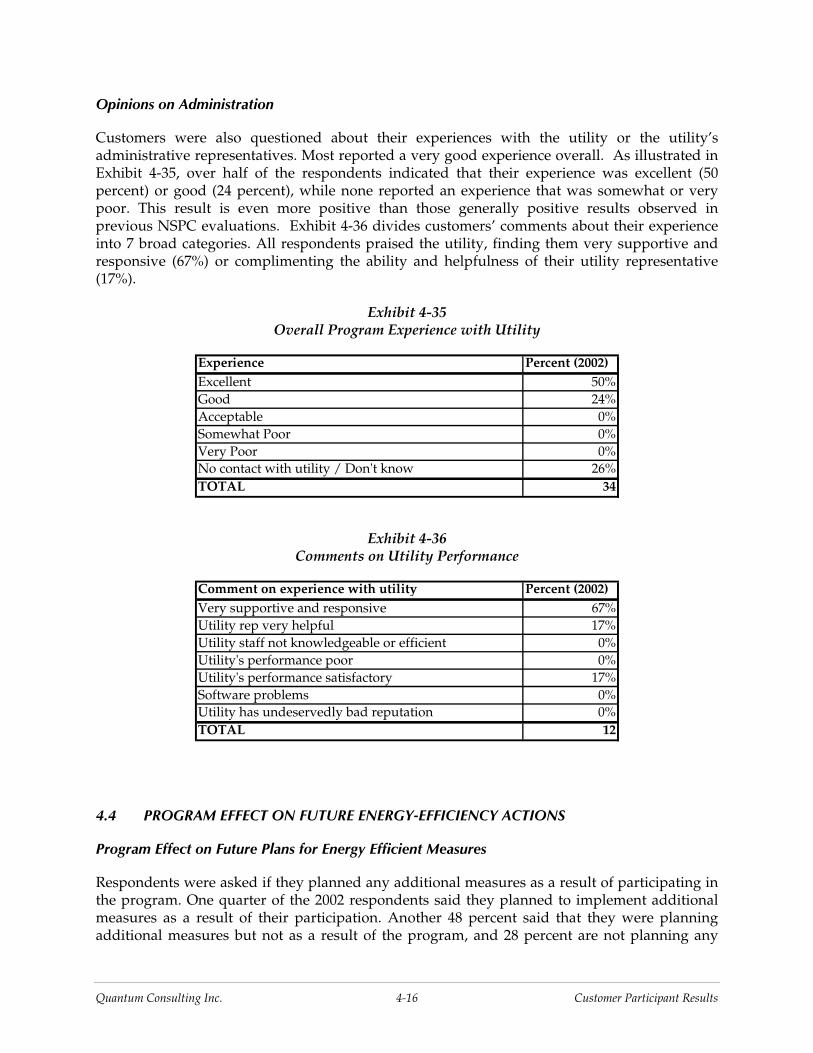
Quantum Consulting Inc. 4-16 Customer Participant Results
Opinions on Administration
Customers were also questioned about their experiences with the utility or the utility’s administrative representatives. Most reported a very good experience overall. As illustrated in Exhibit 4-35, over half of the respondents indicated that their experience was excellent (50 percent) or good (24 percent), while none reported an experience that was somewhat or very poor. This result is even more positive than those generally positive results observed in previous NSPC evaluations. Exhibit 4-36 divides customers’ comments about their experience into 7 broad categories. All respondents praised the utility, finding them very supportive and responsive (67%) or complimenting the ability and helpfulness of their utility representative (17%).
Exhibit 4-35 Overall Program Experience with Utility
Experience Percent (2002)Excellent 50%Good 24%Acceptable 0%Somewhat Poor 0%Very Poor 0%No contact with utility / Don't know 26%TOTAL 34
Exhibit 4-36 Comments on Utility Performance
Comment on experience with utility Percent (2002)Very supportive and responsive 67%Utility rep very helpful 17%Utility staff not knowledgeable or efficient 0%Utility's performance poor 0%Utility's performance satisfactory 17%Software problems 0%Utility has undeservedly bad reputation 0%TOTAL 12
4.4 PROGRAM EFFECT ON FUTURE ENERGY-EFFICIENCY ACTIONS
Program Effect on Future Plans for Energy Efficient Measures
Respondents were asked if they planned any additional measures as a result of participating in the program. One quarter of the 2002 respondents said they planned to implement additional measures as a result of their participation. Another 48 percent said that they were planning additional measures but not as a result of the program, and 28 percent are not planning any

Quantum Consulting Inc. 4-17 Customer Participant Results
new measures at all. The fraction of customers reporting they would implement additional measures in the future as a result of participation is less than half of the fraction reported for 2000 and 2001. Thirty eight percent of the measures being planned are HVAC measures, while 25 percent each are process and lighting measures, respectively.
Respondents who would install additional measures also rated the significance of the program on their decision to install those measures (Exhibit 4-37). Over 60 percent of them responded that program participation was “extremely” or “somewhat significant.”
This information will be used to estimate participant spillover in the impact evaluation report.
Exhibit 4-37 Significance of Program on Decision for More Measures
Significance of Program Percent (2002)Extremely Significant 27%Somewhat Significant 35%Somewhat Insignificant 15%Extremely Insignificant 23%TOTAL 26
Program Effect on Organizational Decision-Making Processes
The survey also included a question addressing the issue of whether the program had changed the customer’s internal decision-making processes relating to energy-efficient equipment. Overall, 43 percent of the respondents said that participation in the program had affected their decision-making policies in some way. This result is similar to that obtained for PY2000 and higher than that reported for PY2001. Most said that their positive experience in this program will make it easier for them to sell management on implementing similar energy efficiency projects in the future.
4.5 PROGRAM PARTICIPANT EXPERIENCE WITH EESPS
Participating customers were asked a series of questions concerning their experiences with third-party firms, either the sponsoring EESP in the case of EESP-sponsored customers or a contractor hired by a self-sponsoring customer to help with significant aspects of the application process.
Customers who were working with third-party firms were asked to identify from a list the type of contract they had with the firm in question. The breakdown of the different types of contracts is shown in Exhibit 4-38. Energy performance contracts with no fee-for-service component accounted for 40 percent of the total. Fee-for-service contracts accounted for over one-half (52 percent) of contracts.

Quantum Consulting Inc. 4-18 Customer Participant Results
Exhibit 4-38 Type of Contractual Arrangement with Third-Party Firm
Contractual Arrangement with Sponsor Percent (2002)Guaranteed Savings 40%Fee-For-Service 52%Combination PC and fee-for-service 4%Other 4%TOTAL 25
As shown in Exhibit 4-39, to a greater extent than in prior program years the majority of customers report using the program incentives wholly themselves, rather than arranging to share them with EESPs or allowing EESPs to retain all of the incentives.
Exhibit 4-39 Customer-EESP Incentive Arrangement
Incentive Arrangement Percent (2002)Incentives Used by Customer 88%Incentives Used by EESP 0%Split Incentives/Reduced Fee 8%Don't Know 4%TOTAL 24
Respondents were also asked who initiated the contact that led to the contract for services through the NSPC Program. As shown in Exhibit 4-40, customers were more likely than the EESP to initiate contact. The portion of contacts initiated by EESPs was somewhat lower than reported for previous program years. Some respondents (21 percent) reported that they already had an ongoing relationship with the EESP.
Exhibit 4-40 Initiator of First Contact for Services
Sponsor/Client Contact Initiation Percent (2002)Customer Initiated Contact 71%EESP Intitiated Contact 21%Other 4%Don't Know / Refused 4%TOTAL 28
Customers were asked whether any of the energy-efficiency products, services, opportunities, or M&V approaches provided by third-party firms were new to them at the time they were offered. Exhibit 4-41 shows that, as was the case in previous years, less than half of all customers found some aspect of the products or services provided by third-party firms as part of the NSPC application to be new to them.

Quantum Consulting Inc. 4-19 Customer Participant Results
Exhibit 4-41 Customer Opinion on Whether Products and Services New
Anything New to You? Percent (2002)Yes 38%No 59%DK 3%TOTAL 29
The 38 percent of customers who reported that something was new were then asked what products or services were new. As reported in Exhibit 4-42, over one-half mentioned the specific equipment installed was new to them, followed by 22 percent who mentioned that either the energy savings estimates or whole service was new to them.
Exhibit 4-42 Products and Services New to Customer
What was new? Percent (2002)Design process new 22%Specific equipment new 56%Energy savings estimates new 22%Calculated savings option new 0%M&V process new 0%TOTAL 9

Quantum Consulting Inc. 5-1 EESP Results
5. EESP RESULTS
This section provides a detailed summary of information collected from in-depth interviews with energy-efficiency service providers (EESPs) regarding the PY2002 Nonresidential Standard Performance Contract (NSPC) program. EESPs sponsor NSPC projects for customers and play a central role in marketing, developing, and implementing energy-efficiency projects. This section contains the following subsections:
• Key Findings
• Overview and Approach
• Firmographics of EESP Sample
• Status of Past Applications
• Process-related Issues
• Potential Market Effects of the Program
5.1 KEY FINDINGS
Interviews were conducted with 52 EESPs: 24 firms that participated in the 2002 SPC Program, 16 firms that had participated in previous year but did not participate in 2002, and 12 potential participants that have never participated.
5.1.1 Demographics
Participating EESPs ranged in size from 1- and 2-person operations to large ESCOs and the local sales offices of multinational HVAC and refrigeration equipment manufacturers. On average, the participating EESPs interviewed had 52 employees in California.
• About half said they do business nationally or internationally, although several emphasized that most of their business was in-state.
• 43 percent do business statewide, including several who also do business in other western states; only 12 percent said they do business locally or in only part of the state.
Among non-participants, fewer respondents reported a national scope to their business:
• Half the non-participants said they do business in a region within California, while 16 percent do business statewide.
• A single multinational equipment vendor reported that its scope was global, while 11 percent of non-participants said they do business in California and part of an adjoining state or states, and 15 percent said their business is national in scope.

Quantum Consulting Inc. 5-2 EESP Results
Both 2002 participants and those who had participated in previous years encompassed a variety of business types.
• The 24 participants interviewed included 6 equipment vendors, 5 EESPs, 4 traditional ESCOs, and 6 design/engineering firms. Participants said they had been providing energy efficiency services for anywhere from 2 to 100 years, with an average of 22 years.
• The 16 non-participants who participated previously included 2 ESCOs; 5 s EESPs and 5 equipment vendors or distributors. In addition, 3 firms were primarily consulting or engineering firms, and 1 specialized in building operations and maintenance. On average, these firms had been providing efficiency services for 15 years.
Finally, all of the “pure’ nonparticipants interviewed described themselves either as contractors (both electrical and mechanical) or engineering firms, with several noting that they often act as subcontractors and therefore have limited direct customer contact.
5.1.2 Status of Past Applications
About half of the EESPs interviewed had projects in 2002 that were put on hold or cancelled – sometimes due to funding being unavailable, but somewhat more often because of customer-specific issues unrelated to the program.
• Six of the 11 were related to corporate decision making or other business issues such as the economic downturn.
• The EESPs who reported previous applications that had been delayed attributed those delays primarily to funding availability, with several noting that there had been communications with the utility and that funds had been exhausted by the time issues had been resolved.
5.1.3 Program Strengths and Weaknesses
The most often cited strength of the SPC program was simply that the availability of funding allows customers to implement projects that otherwise would not meet payback criteria. Several other strengths were mentioned.
• The program is flexible in that it covers a variety of measure and technologies.
• The participation process is straightforward, especially if calculated savings are used
• Implementation staff are generally helpful and responsive
The most often cited weakness was the limited and unpredictable availability of funding. EESPs say funding limits hamper consistent marketing of SPC-funded projects and encourage EESPs to offer rebates as “icing on the cake” instead of using the rebates to sell projects that otherwise would not meet payback criteria. Where such projects ultimately receive funding, this would clearly lead to higher levels of free ridership. Other weakness mentioned included:
• It takes too long to apply, to receive approval, or to receive rebate money

Quantum Consulting Inc. 5-3 EESP Results
• The application process is too complicated
• Some requirements and calculations appear to be arbitrary
Several respondents said they saw no weaknesses with the program. Similarly, when asked to describe their experiences with the 2002 program rules and requirements, most respondents said they were “reasonable,” “clear” or “straightforward.” The few negative perceptions related to the complexity of the process and the length of time involved.
About two-thirds of respondents thought 2002 incentive levels were reasonable or fair; about 15 percent said they were somewhat low. Some EESPs commented on delays in payment or said they found the different levels of rebates for different end uses confusing or unfair.
5.1.4 EESP Satisfaction
When asked about their overall satisfaction with the program, over two-thirds of participating EESPs were very or somewhat satisfied with the program overall. Several respondents noted that their rating would have been higher if funding had not run out so quickly. In addition, over 80 percent said their experience with the utilities administering the program had been good or excellent. Of those who had experience with technical assistance contractors, more than three-fourths rated that experience good or excellent.
5.1.5 Use of Calculator and Website
Participating EESPs were asked both whether they had used the savings calculator and whether they had used the SPC website. About half of 2002 participants said they had used the calculator, and 70 percent had used the website. Two thirds of those who used these tools found them very helpful.
5.1.6 Use of Incentive Funds
Almost 80 percent of respondents passed the incentive through to the customer completely. The remaining 20 percent shared it with the customer, typically noting that they kept a small amount to cover their own costs. In almost all cases, EESPs believe that customers simply use the incentive funds to reduce project cost.
5.1.7 EESP vs. Customer Sponsorship
Two-thirds of participating EESPs prefer to sponsor the applications, noting that it gives them greater control over the process and frees the customer from the paperwork. The remaining respondents were evenly split between those who had no preference and those who preferred to let the customer handle the application process as a way to minimize their own paperwork.
5.1.8 Calculated vs. Measured Savings
Most participating EESPs preferred the calculated savings approach over measured savings.
• Benefits cited for the calculated savings approach included ease of application, prompt and complete payment, and reduced costs attributable to EM&V (which one respondent said sometimes amounted to 15 percent of the incentive amount.)

Quantum Consulting Inc. 5-4 EESP Results
• The primary drawback mentioned was that calculated savings values are somewhat conservative and may understate actual energy savings.
5.1.9 Potential Market Effects
Most respondents said the SPC program had improved their business by enabling them to incorporate the program incentives into their marketing approach. A few said that project delays and the level of uncertainty surrounding the availability of funding had caused them to stop using the SPC program as a marketing tool.
• About 90 percent of respondents said the SPC program was very important to their business; the remainder said it was somewhat important, generally because the availability of incentives encourages projects that otherwise would not be implemented.
• Despite the importance of the SPC program to their business, EESPs do not always use it in their marketing efforts, but decide whether or not to market the program based on the customer’s needs, the suitability of the technology they offer, and the availability of funding. On average, EESPs said they use the SPC in about half their sales efforts.
• A few EESPs offered a specific example of a technology encouraged by the program, including injection molding and industrial refrigeration control.
Participating EESPs say most of the projects they did through the SPC program in 2002 would not have happened without the program. On average, about 24 percent of projects would have gone ahead without the program; individual responses ranged from 0 to 100 percent.
About 75 percent of 2002 participants said they were already participating or planned to participate in the 2003 program. Only 3 r said they were definitely not planning to participate.
5.1.10 Non-Participant Perspectives
Non-participant EESPs who had participated in the SPC Program in previous years generally failed to participate in 2002 for two primary reasons:
1. A lack of opportunities or changes in their business unrelated to the SPC program.
2. Program characteristics (complexity, paperwork, inadequate funding) that made
participation not worth their while.
Despite misgivings about program characteristics, about two thirds of EESPs who did not participate in 2002 planned to participate or were already participating in the 2003 program.
Most of the “pure” nonparticipants EESPs interviewed were either contractors or engineering firms. Some said they really do not provide energy efficiency services; others said they had been providing doing so for up to 80 years. Several firms said that they often act as subcontractors and have minimal customer contact, which limits their ability to participate.
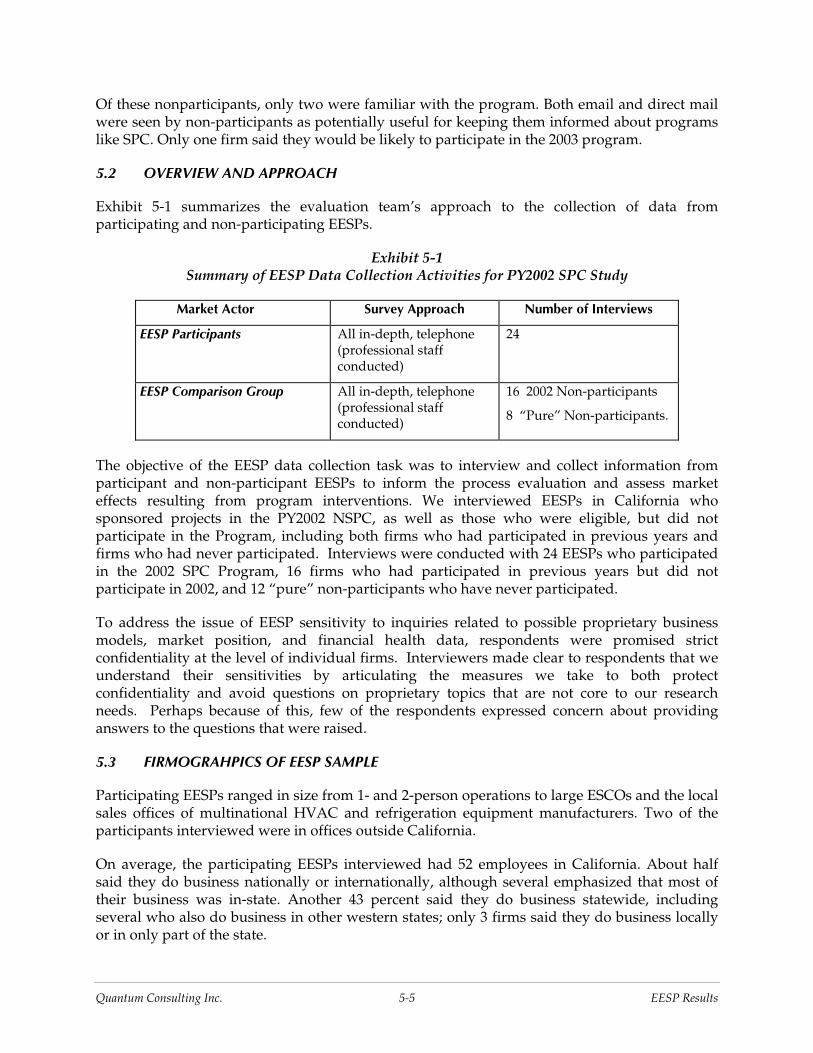
Quantum Consulting Inc. 5-5 EESP Results
Of these nonparticipants, only two were familiar with the program. Both email and direct mail were seen by non-participants as potentially useful for keeping them informed about programs like SPC. Only one firm said they would be likely to participate in the 2003 program.
5.2 OVERVIEW AND APPROACH
Exhibit 5-1 summarizes the evaluation team’s approach to the collection of data from participating and non-participating EESPs.
Exhibit 5-1 Summary of EESP Data Collection Activities for PY2002 SPC Study
Market Actor Survey Approach Number of Interviews
EESP Participants All in-depth, telephone (professional staff conducted)
24
EESP Comparison Group All in-depth, telephone (professional staff conducted)
16 2002 Non-participants
8 “Pure” Non-participants.
The objective of the EESP data collection task was to interview and collect information from participant and non-participant EESPs to inform the process evaluation and assess market effects resulting from program interventions. We interviewed EESPs in California who sponsored projects in the PY2002 NSPC, as well as those who were eligible, but did not participate in the Program, including both firms who had participated in previous years and firms who had never participated. Interviews were conducted with 24 EESPs who participated in the 2002 SPC Program, 16 firms who had participated in previous years but did not participate in 2002, and 12 “pure” non-participants who have never participated.
To address the issue of EESP sensitivity to inquiries related to possible proprietary business models, market position, and financial health data, respondents were promised strict confidentiality at the level of individual firms. Interviewers made clear to respondents that we understand their sensitivities by articulating the measures we take to both protect confidentiality and avoid questions on proprietary topics that are not core to our research needs. Perhaps because of this, few of the respondents expressed concern about providing answers to the questions that were raised.
5.3 FIRMOGRAHPICS OF EESP SAMPLE
Participating EESPs ranged in size from 1- and 2-person operations to large ESCOs and the local sales offices of multinational HVAC and refrigeration equipment manufacturers. Two of the participants interviewed were in offices outside California.
On average, the participating EESPs interviewed had 52 employees in California. About half said they do business nationally or internationally, although several emphasized that most of their business was in-state. Another 43 percent said they do business statewide, including several who also do business in other western states; only 3 firms said they do business locally or in only part of the state.

Quantum Consulting Inc. 5-6 EESP Results
Among non-participants, half the respondents said they do business in a region within California (for example, Southern California, the Bay Area, five counties), while 3 do business statewide. Two said they did business in California and part of an adjoining state or states, and 3 said their business is national in scope. A single multinational equipment vendor reported that its scope was global.
The 23 participants interviewed included 6 equipment vendors, 5 EESPs, 4 traditional ESCOs, and 5 design/engineering firms. There were also several firms who say their sole function is to handle project paperwork; that is, they act like general contractors for these projects, even though they have no engineering or installation expertise.
Participants said they had been providing energy efficiency services for anywhere from 2 to 100 years (in the case of York International), with an average of 22 years.
Among the 16 non-participants who had participated previously, only two described themselves as traditional ESCOs; 5 said they were EESPs and 5 characterized themselves as equipment vendors or distributors. Several said they were both equipment vendors and EESPs, characterizing their business as, for example, “an electrical contractor specializing in energy saving lighting jobs.” In addition, three firms said they were primarily consulting or engineering firms, and one specialized in building operations and maintenance. On average, these firms said they had been providing efficiency services for 15 years.
Finally, all of the “pure’ nonparticipants interviewed described themselves either as contractors (both electrical and mechanical) or engineering firms, with several noting that they often act as subcontractors and therefore have limited direct customer contact.
5.4 STATUS OF PAST APPLICATIONS
About half of the EESPs interviewed had projects in 2002 that were put on hold or cancelled – sometimes due to funding being unavailable, but somewhat more often because of customer-specific issues unrelated to the program.
Six of the 11 were related to corporate decision making or other business issues such as the economic downturn. For example, one supermarket decided to do a major store remodel rather than a refrigeration upgrade; in other cases, “corporate just couldn’t get its act together” or “they could not get corporate funding approval, with (the parent company) having some pretty severe financial problems.”
The remaining five EESPs who reported previous applications that had been delayed attributed those delays primarily to funding availability, with several noting that there had been back and forth communications with the utility and that funds had been exhausted by the time issues had been resolved. “There was in essence 8 million dollars gone within a couple week window,” one respondent noted, “and then I had to go back to the guy and say ‘I'm sorry, no rebates available’ and a deal that was looking solid fell apart.” Another respondent claimed that “it was quite difficult to get the rebate money, so the client went with BOMA instead.”

Quantum Consulting Inc. 5-7 EESP Results
5.5 PROCESS-RELATED ISSUES
5.5.1 Program Strengths and Weaknesses
The most often cited strength of the SPC program was simply that the availability of funding allows customers to implement projects that otherwise would not meet payback criteria. Typical EESP comments include:
• It takes that extra to make it more cost effective so that customers want to participate. To some extent, it also gives them motivation to actually act on it; it spurs them on.
• The funds are there to get projects going that otherwise the customer wouldn't pay for because the payback isn't there.
• The strength is they're giving money away. And everybody likes that.
• The fact that the program does offer cash incentives for businesses to consider investing in new products.
• The strength of the program is, well, the fact that the state's providing money.
Several other strengths were mentioned. These, along with supporting verbatim comments from respondents, included:
• The program is flexible in that it covers a variety of measure and technologies.
− They had a wide variety of equipment available under the program that you could apply for.
− What I like about it is it's more custom to what we're doing - refrigeration with variable speed.
• The participation process is fairly straightforward, especially when calculated savings are used
− The strengths I'd say would be the ease of doing lighting projects.
− Well I guess the strengths are, I think it's fairly efficiently run. The application process and how that whole thing works. It seems to work pretty good for a bureaucracy.
− The SPC software I thought was relatively simple to use. The energy calculations made it easy where you didn't get into debates with the engineers on what the savings would be.
− I would say probably the support and the detail that has been provided in this program.
• Implementation staff are generally helpful and responsive
− The PG&E area representative was very helpful, the engineers were very helpful putting the application together.

Quantum Consulting Inc. 5-8 EESP Results
− It seemed like PG&E did a pretty good job on promoting the rebate at the customer level.
− The program is easy to work with. The people that administer it are very helpful.
− There's a bunch of people that are really good people that are working on the program - that are administrators of it.
Consistent with EESP comments regarding delays on previous years’ projects, the most often cited weakness, mentioned by 40 percent of participants, was the limited availability of funding – particularly the unpredictability of when funding would run out. Comments from respondents included:
• If you go talk to somebody else they’re not going to want to do anything because they’ll say ‘let’s wait around for the reloading of the SPC program.’
• I’ve had a couple of these where we did one and went through the whole process and then they ran out of funds.
• There’s a short window for applications leading to concerns on the part of customers and concerns on our part as to how much time we should invest.
• It’s here today, gone tomorrow.
• It (the funding) seemed to have been allocated before the program started.
As indicated by the above responses and the comments below, EESPs believe that funding limits affect their ability to market both program and non-program projects.
• It becomes a bit of a panic and it's not consistent with how we'd like to approach customers. We like to go to customers and say energy efficiency is a long-term, deliberate, steady, progressive effort. And this is more of a knee-jerk, opportunistic deal.
• A school board may vote on doing a project eight months in the future and they don't know whether there will be rebates there. That inconsistency somewhat inhibits the ability of the program to incent large projects, because the contractors (don’t want to go out and say) ‘you're going to get these rebates’ when the money might be used up or it just might not happen next year.
• Anytime that someone says to me that they want to go for rebates it's almost better not to include that in your construction incentive. If I had a project that was going to cost $500,000 and I thought that there was $50,000 worth of incentives, I would definitely try to make the project work without taking into consideration the rebates, because they are quite difficult to get.
In addition to hampering consistent marketing of SPC-funded projects, the shortages encourage EESPs to offer SPC rebates as “icing on the cake” instead of using the rebates to sell projects that otherwise would not meet payback criteria. Where such projects ultimately receive funding, this would clearly lead to higher levels of free ridership.

Quantum Consulting Inc. 5-9 EESP Results
Other weakness mentioned, along with supporting comments from respondents, included:
• It takes too long to apply, to receive approval, or to receive rebate money
− I guess the only weakness is it takes quite a while to get the approval.
− I think the weaknesses are that it seems like it’s taking forever to get an application through…. We've sent in multiple applications - they lose them or they have incorrect data. And with the back and forth...either there's not enough staff to support this or it's just not well organized.
− Sometimes the response of the review of the program has taken a long time.
• The application process is too complicated
− The weakness is the calculations are a little difficult.
− It's a long process you have to go through to get the money - a lot of paperwork.
− Here recently in the last 2 or 3 different proposals we've done, they've been real sticklers on coming down with all the line items. We're used to providing ceiling lighting, elevated ceiling lighting plants…. But when you start getting over 100 line items, it's totally ridiculous; there’s way too much labor involved in trying to put that together. And right now we've got some that are more than 200 line items.
• Some requirements and calculations appear to be arbitrary
− It's complicated. Most people do not think in the same terms as Edison thinks. And so the, the customer and myself have to conform to the Edison way of thinking and their forms to be able to handle the application.
− They've only got a limited number of switches and contactors and relays that are available that are approved, so that it slows the process down to a crawl in the reviewing and approval process. Because there's 50 companies that make a switch, but Beckwith is the only one that's approved. It just slows the process down and it also increases the cost because Beckwith now has the corner on the market. Just look. Those switches have doubled in price in the last year.
− They put an asterisk on the 2002 program saying that any dairy that's considered small - under 500 kW - will not be considered in the SPC, but would be referred to the Express Efficiency.… Two identical dairies - identical - same dairy barn, same vacuum pump. One has 500 kW plus because he has irrigation in the fields and one doesn't. They both change out the vacuum pump system. One gets a $6,000 rebate and the other gets $600. (It should be noted that the “asterisk” was removed for 2003 so that under 500 kW dairies are again eligible for the SPC program.)
Finally, it is worth pointing out that a few respondents said they really saw no weaknesses with the program, with comments such as the following:
• Nothing really comes to mind. It was a fairly painless process.
Quantum Consulting Inc. 5-10 EESP Results
• I didn't really find any weaknesses, to be honest. I didn't have any issues whatsoever. The test went pretty quick, the calculations were all really understandable. I had no issues.
Similarly, when asked to describe their experiences with the 2002 program rules and requirements, most respondents said they were “reasonable,” “clear” or “straightforward.” Illustrative comments included:
• They kind of stepped us through the application process. It was much better than it had been in previous years.
• I followed the rules and everything happened like it was supposed to happen.
• It's kind of nice. They don't change it a lot, so that you get familiar with the process.
The relatively few negative perceptions regarding 2002 rules and requirements related to the complexity of the process and the length of time involved”
• The software's tedious…. Those pull down menus are a nuisance. It was better when we had the little tables that we could type numbers in instead of using all those pull-down things. So they made it easier for some, but in that process made it harder.
• I agree with amount of documents they require because they should control the installation. I understand that. I am just not happy with the response time.
• No disrespect, but there's a huge amount of bureaucracy involved and just a lot of wait and a lot of boiler plate paperwork that's required to do what we all want to do, save kW and get an owner some incentive back for doing that.
About two-thirds of respondents said they thought incentive levels were reasonable or fair, while about 15 percent of respondents said incentive levels were somewhat low, either in comparison to those offered elsewhere in the country or because the incentive levels were inadequate to bring enough projects down to the 18 month payback that customers are said to require. The remaining EESPs either commented on delays in receiving payment or said that they found the different levels of rebates for different end uses confusing or unfair, in one case because controls for HVAC systems were eligible only for the “other” incentive level rather than the higher HVAC level.
Most respondents did not mention any other aspects of the Program that they thought were better or worse in 2002 than in prior years. About one-fourth of EESPs mentioned the shift to calculated savings as an improvement, and one said that program staff appeared to be more responsive in 2002. One respondent noted a decline in some incentive levels as a change for the worse.
5.5.2 EESP Satisfaction
Exhibit 5-2 presents the responses when EESPs were asked about their overall satisfaction with the program.

Quantum Consulting Inc. 5-11 EESP Results
Exhibit 5-2 Overall EESP Satisfaction with 2002 SPC Program
Level of Satisfaction % of Respondents
Very Satisfied 33.3%Somewhat Satisfied 37.5%Neither Satisfied nor Dissatisfied 20.8%Somewhat Dissatisfied 4.2%Very Dissatisfied 4.2%
Over two-thirds of participating EESPs said they were very or somewhat satisfied with the program overall. Typical comments offered by satisfied respondents were:
• Yeah, you can make it better, but it's the best in the country (from a firm working nationwide).
• I think the whole process worked efficiently.
• I didn't have any problems.
• I think it met our expectations. It got customers to move ahead with projects that would not have been stalled otherwise.
• It went pretty easy as far as following the bouncing ball and filling out the application, going through submitting my calculations, answering questions.
• I was pleased with the response of SCE. I was pleased with dealing with their subcontractors that were validating the field measurements. The paperwork was straightforward - it was handled well.
Several respondents noted that their rating would have been higher if funding had not run out so quickly.
• On the projects where there's actually funding available, we were extremely satisfied. However, the fact that the money disappeared within a couple week period, for the large projects, would obviously fall to very dissatisfied.
• I was very satisfied until the program ran out of money.
• I would give it a five except that the funding runs out so quickly.
Responses regarding EESPs’ experience with the utilities administering the program and technical assistance contractors are presented in Exhibit 5-3.

Quantum Consulting Inc. 5-12 EESP Results
Exhibit 5-3 Experience with Utilities and Technical Assistance Contractors
Quality of Experience Utilities
Technical Assistance Contractors
Excellent 31.8% 20.8%good 50.0% 14.7%Acceptable, about what expected 18.2% 16.7%Somewhat poor 0.0% 0.0%Very Poor 0.0% 0.0%Don't know/No contact 0.0% 20.8%
As shown in the exhibit, over 80 percent said their experience with the utilities administering the program had been good or excellent. None said it had been somewhat or very poor. A few respondents complained, however, about delays in having checks sent and difficulty in finding the appropriate person to answer questions.
Of those who had experience with the technical assistance contractors, more than three-fourths rated that experience good or excellent, and none rated it somewhat or very poor. Several respondents commented on the high quality of the engineers they worked with, but one noted that “the field people that do the pre-verifications, a couple of those folks were pretty embarrassing to us and would be embarrassing to Edison if they knew what they looked like and how they acted when they went out and visited the customers: unprepared, poorly dressed, unshaven, dirty, unprofessional.”
5.5.3 Use of Calculator and Website
Participating EESPs were asked both whether they had used the savings calculator and whether they had used the SPC website. About half of 2002 participants said they had used the calculator, and 70 percent had used the website. Two thirds of those who used these tools found them very helpful. Regarding the calculator, for example, respondents commented that:
• It was easy to put your numbers in and get numbers out for savings which are acceptable to the utility.
• It allowed us all to get on the same page with calculating the incentives.
• The calculator provided the energy savings calculations - you just had fill it in…. and they provided excellent energy savings. They weren't awfully conservative in limiting the energy savings.
EESPs said they used the website primarily to download forms and obtain program information, including funding availability. Comments included:

Quantum Consulting Inc. 5-13 EESP Results
• The website was excellent for disseminating information as far as knowing how much funding was still available, although I would have liked to see that updated a little bit more frequently.
• I remember having to go on the website and reading the various program rules, that sort of thing. And that went well.
• All of the SPC application forms and program manuals were available on the website which is, of course, very helpful.
• (The website) was just the place where I downloaded the application the instructions. That was much easier than going in and asking for forms or asking for mailings.
Despite the generally favorable view of these program tools, some participating EESPs had trouble with them. One respondent said that “I tried, and I could not get that calculator to work for the applications I tried. And that was from the disk that I received. That disk also had several other bugs on it.”
5.5.4 Use of Incentive Funds
Almost 80 percent of respondents passed the incentive through to the customer completely. The remaining 20 percent shared it with the customer, typically noting that they kept a small amount to cover their own costs. Among the comments offered by respondents were the following:
• We probably take only around 10 to 15 percent tops - it's just to cover our engineering and time that we have to put into it to get the program initiated and finalized. But the rest of it goes to the customer.
• They're shared. We take a small portion to cover our costs but the majority of the incentive goes back to the customer to pay for the project.
• What we have done on that was in essence just hacked it out of the sale price to the customer.
In almost all cases, EESPs believe that customers simply use the incentive funds to reduce project cost. One respondent, noted, however, that “in some instances they are used for the local facility budget as opposed to the project being paid from allocated corporate funds. So there is a, some value in creating some funds for special projects at a local facility level as opposed to just reducing the project cost.”
5.5.5 EESP vs. Customer Sponsorship
Two-thirds of participating EESPs prefer to sponsor the applications, noting that it gives them greater control over the process and also frees the customer from the paperwork. Explanatory comments included:
• Because it keeps the customer out of the loop and it's less work for them. A little more work for us, but we have more control over it that way.

Quantum Consulting Inc. 5-14 EESP Results
• I like to be the sponsor because then all the Edison people will call me directly and they won't get the customer lost.
• I think it makes it easier. You don't have to go to the customer for every little thing to get approvals on, so it speeds up the process.
• You have control that way. You know that the application is going to be completed, filled out. You know that any questions or technical answers you can direct them yourself. And they don't have in house personnel that would be able to address those issues.
• It's just a little insurance that there's some money in my name involved with the project. If the, client is on shaky economic grounds, I like to have that come to me and then I pass it on to them - as a little bit of hostage to making sure I get paid.
The remaining respondents were evenly split between those who had no preference and those who preferred to let the customer handle the application process as a way to minimize their own paperwork. Illustrative comments from these respondents include:
• It really doesn't make any difference to me. We just do it as a service so we can leverage ourselves with the customer.
• They're the ones that are going to have a long-term relationship with the utility company for that job -- not us.
• If it's a new customer, a prospect or somebody that we haven't worked with as long, I'd rather them do it on their own.
• Well we used to sponsor them ourselves. But because of the difficulty and the reliability of being able to get through it we found that it presented more problems for us. So now we merely inform the customer about it and encourage them to sponsor themselves.
5.5.6 Calculated vs. Measured Savings
One of the features that participating EESPs appear to value particularly about the 2002 program is the ability to use calculated savings in lieu of measured savings. Most participating EESPs preferred the calculated savings approach over measured savings. All but one of the participants said they used calculated savings, 22 percent used both the calculated and measured savings approaches, and one used only measured savings.
Benefits cited for the calculated savings approach included ease of application, prompt and complete payment, and reduced costs attributable to EM&V (which one respondent said sometimes amounted to 15 percent of the incentive amount.) Favorable comments on the calculated relative to the measured savings approach included the following:
• I think the advantages are it expedites the process; it doesn't introduce delays, which would occur to implement the actual measured variables.

Quantum Consulting Inc. 5-15 EESP Results
• When you do the calculated, then everybody knows what you're dealing with; that means the customer knows what you're dealing with and you can define what the amount of the money's going to be.
• If the goal is to incentivize business to save kW, the quickest and best way to do it is on the calculated basis. It’s a straight up way of saying here's what we anticipate you saving based upon horsepower, amps and what this piece of equipment is. I prefer it to the M&V way even with the 10 percent kicker that they've passed on this last year to try to offset those costs. Just because the M&V has time associated with it to go back over 12 months and verify it.
• One of the problems with the M&V side was always that there was a problem with that 110% cap, so when you went in with your preliminary it always behooved you to estimate high, because if you estimate low you get penalized. If you estimate high you get your savings reduced but it's not penalized in the sense that you get what you really did. But if you estimated too low, you didn't get what you really did. You got 110 percent of what you said you would do. So it was a skewed thing.
The primary drawback mentioned was that calculated savings values are somewhat conservative and may understate actual energy savings, as illustrated by comments even from EESPs who prefer the calculated approach.
• The disadvantage is it doesn't really give a good picture of what the energy savings are because it's only using the Title 24 energy codes as the base line, not what they're really using.
• Most of the time your application will have more energy savings than the calculated approach will grant us.
• Well, the calculated approach is simpler, but the drawback is that it pays less.
In addition, one EESP felt that the measured approach was preferable because they used a patented technology that was more difficult to calculate and required a new explanation to a different technical consultant for each of 10-15 installations. With the measured savings approach, on the other hand, “We built in the system a modem that can collect data remotely, and we also have special software to evaluate that. So our experiences with the measured, measured systems or projects is better because this is the job, the numbers.”
5.6 POTENTIAL MARKET EFFECTS
Most respondents said that the SPC program had improved their business by enabling them to incorporate the program incentives into their marketing approach. Comments from this majority of EESPs included the following:
• We're integrating the, the, program's potential into our discussion with the customers.
• It has helped in marketing in that when you're talking to the customer, the fact that there are rebates available and you can show a letter from the utility company saying that they project this much savings, it's credibility to what you're trying to promote.

Quantum Consulting Inc. 5-16 EESP Results
• It's benefited by allowing us to improve our analytical tools and to more clearly define our energy efficiency product and services offerings.
• There's no doubt about - it increases your business by 20 – 25 percent. Listen, they don't call us - very seldom. We have to go initiate. If you're going to initiate you have to have a solid program for them. It's all about payback.
• I deal with a lot of clients who are loathe to spend money on anything unless the payback is very good, the return on investment is very good. And this program has really helped to make projects they might not have done happen.
A few EESPs, however, said that project delays and the level of uncertainty surrounding the availability of funding had caused them to stop using the SPC program as a marketing tool. Comments from this group included the following:
• In the 2002 program, the majority of the time we were unable to get an approved application before the start of installation. The time period from the time you put in an application to its approval was much longer…. It comes to the point where the wait is so long that the customers are losing more money in potential savings than they would gain by waiting for the incentive.
• The net result was we decided not to market energy efficient products through this program. The problems that hurt us from a business point of view were the delays in getting an approval; to write up the project and get it approved by both the customer and Edison took so long that the customer either lost interest or got disappointed.
About 90 percent of respondents said the SPC program was very important to their business; the remainder said it was somewhat important. Consistent with previously reported results, reasons for the program’s importance focused on the availability of incentives to encourage projects that otherwise would not be implemented. The following comments were offered:
• It often can be the element which makes the difference on their budgetary considerations in whether or not they able to implement an energy improvement strategy.
• It reduces the price of my product by 50 percent.
• At least with the people I deal with, they would tend not to do projects that aren't rebated.
• We're selling energy efficient top end equipment, so if we can get an incentive to help cover the extra costs, we are then somewhat comparative to a standardized system.
• It is a primary means of encouraging customers to make decisions and make investments in energy efficiency as opposed to spending the money on something else.
Despite the importance of the SPC program to their business, EESPs do not always use it in their marketing efforts, but decide whether or not to market the program based on the customer’s needs, the suitability of the technology they offer, and the availability of funding. On

Quantum Consulting Inc. 5-17 EESP Results
average, EESPs said they use the SPC in about half their sales efforts, with individual responses ranging from less than 4 percent to 100 percent. One respondent said his firm was not planning to market the program in the future, and another said that they market SPC as the program of last resort “after the Express Efficiency and Savings by Design programs.” One respondent made a distinction between their marketing to small and large customers, noting that “over 500 kW, all the funds were gone the first month of the program, so it would have been ludicrous to mention it. But on the small customers where it was available, we mentioned it 100 percent of the time.”
Regarding SPC support for new technologies, several EESPs offered a specific example of a technology encouraged by the program.
• There's a specific area there that deals with injection molding. We have made all the injection molding manufacturers aware of that - of the incentive, of replacement of old antiquated machines with new machines. And now they are well aware that California supports their marketing efforts of new machines, especially all electric machines which are very energy efficient.
• I believe that the ______ project is a pretty significant and dramatic step forward in industrial refrigeration control. Specifically, we implemented variable volume, variable temperature control in low temperature spaces, where that has not been common in the past. And we went through a process of sequentially improving subsystems and demonstrating that to the customer that really made them believers with respect to energy efficiency. People that previously were very negative about energy efficiency and thought it would impact their ability to run their facility became champions after that.
Another EESP discussed dimmable T5 and T8 fluorescents for manufacturing facilities as an emerging technology, but did not indicate that such systems had been installed through the SPC program.
According to participating EESPs, most of the projects they did through the SPC program in 2002 would not have happened without the program. On average, respondents said only about 24 percent of projects would have gone ahead without the program, although individual responses ranged from 0 to 100 percent. Most EESPs said that the availability of the rebate was what made most of these projects possible, as indicated by the following comments.
• They wouldn't have done it. Because the program bought the install down so much that it basically made it so they had a positive cash flow.
• It becomes a factor and it keeps the cost down to the point it's in that attractive zone.
• I think it still would have been a viable project without the rebate. Whether they would have done it or not is another question.
• In one case it brought his price down by approximately a third. And again it lent the same credibility.
• It's just the hurdle - meeting the economic criteria that's set for an investment.

Quantum Consulting Inc. 5-18 EESP Results
Respondents who said some or all of their projects would have proceeded anyway offered the following explanations.
• A couple of years back it was a little easier to obtain, so we were able to utilize the incentive program as a sales tool. Now because of the availability of it and the chances of actually getting it, it's something that we normally will tell the customer that it's available, encourage them on their own to apply for it, but explain to them that because of circumstances the chances are pretty slim.
• The rates in California are so high that some of them would make sense even without the incentive dollars.
• (The customer) was planning and budgeting for some of these capital improvements for the last couple of years. We just added on a couple of extras for some incentive savings from the SPC thing that was thrown into it.
• I'm looking at history. We have basically done the projects without SPC.
About 75 percent of 2002 participants said they were already participating or planned to participate in the 2003 program. Only 3 respondents said they were definitely not planning to participate; one because their projects were better suited to the Express Efficiency program, the second because their business focus had changed, and the third because there are now more energy service companies who have this as their core business.
5.6.1 Non-Participant Perspectives
Non-participant EESPs who had participated in the SPC Program in previous years generally failed to participate in 2002 for two primary reasons:
1. A slight majority of EESPs said they did not participate because of a lack of
opportunities or changes in their business that had nothing to do with the SPC program. Among the comments offered by this group were the following:
• Just didn't get any bids. I didn't win any bids.
• I haven't sought the opportunities.
• Well we didn't have a lot of business in 2002 for one thing.
• We just didn't have a chance to partner with anyone doing the project. We always have to partner, because we don't have the products ourselves.
• Since there are limited applications for our process, we would have a pretty small market niche to apply this system in other venues.
2. Most others attributed their failure to participate to the fact that program characteristics
(complexity, paperwork, inadequate funding) made participation not worth their while,

Quantum Consulting Inc. 5-19 EESP Results
in part based upon their previous program experience. Comments from this group included:
• There were a couple of other programs that had a better rebate than the SCE program and with fewer strings attached.
• A lot of it had to do with the fact that it took so long, that we really didn't have the loop closed on the rebate so we couldn't tell them for sure when they asked "are you really going to get the rebate?" So we couldn't say for sure whether or not we were going to get it until the end.
• I think the program was too complicated for the level of incentive.
• Because they are a waste of my time. There were a number of companies that we could have done it with, but it is so encumbering, so time consuming to me, the hell with it. It's that simple. As much as I'd like to do it for the customer, I lose - and I'm not going to lose.
• I think size of the customer didn't qualify.…That and the 1999 program was a pain in the ass.
Because of their previous program involvement, these non-participants were generally somewhat familiar with the 2002 SPC program, as indicated by their mean responses on a 1 to 5 scale, where 1 means not at all familiar and 5 means very familiar.
Program Objectives 3.2
Program Rules & Requirements 2.9
Application Process 3.1
"Measured" vs. "Calculated" savings requirements 3.3
Incentive Levels and Payment Process 3.1
Despite the misgivings some reported about program characteristics, about two thirds of EESPs who did not participate in 2002 either planned to participate or were already participating in the 2003 program.
Most of the “pure” nonparticipants EESPs interviewed were either contractors or engineering firms. Some said they really do not provide energy efficiency services, while others said they had been providing them for as much as 80 years, with one noting that “Energy efficiency is always on our minds and we've been in business forever. We've been in business for 50 years.” Several other firms said that they often act as subcontractors and therefore have limited direct customer contact, which limits their ability to participate.
Of these “pure” nonparticipants, only two were familiar with the program. One of these said they had tried to participate, but were unable to do so because of the kinds of facilities they design and build. “The problem is when you go into areas that we do most of our work in, which are process, clean rooms, manufacturing facilities -- those just do not match up. Because if we do not have economizers because we have a clean room, we don't qualify. If we have to have 100 foot-candles on the floor because of manufacturing, we don't qualify. We may be

Quantum Consulting Inc. 5-20 EESP Results
designing to the best standard we have available and we are meeting the Title 24 requirements of California, but we're not qualifying for the program because we're outside of their scope.”
Both email and direct mail were seen by these non-participants as potentially useful media for keeping them informed about programs like SPC. Only one of these firms said they would be likely to participate in the 2003 program.

Quantum Consulting Inc. 6-1 Customer Market Survey Results
6. CUSTOMER MARKET SURVEY RESULTS
This section contains results from interviews conducted with a representative sample of large (> 500 kW) nonresidential firms in California. The purpose of conducting the interviews was to obtain updated baseline information on topics relating to a variety of establishment and energy efficiency characteristics, behaviors and attitudes. The objective of this survey was not only to characterize the current market, but also to re-assess market indicators that were measured in the 1998 and 1999 SPC Program evaluations in order to determine whether any changes have occurred in the marketplace that may be attributable to the SPC or related programs.
This chapter is organized into the following subsections:
• Summary of Sampling Process (Section 6.1)
• Establishment Characteristics (Section 6.2)
• Energy Price Perceptions (6.3)
• Energy Conservation, Demand Response, and Efficiency Actions (Section 6.4)
• Energy-Related Decision Making (Section 6.5)
• Energy Program Awareness and Participation (Section 6.6)
• Familiarity With and Use of Energy Performance Contracting (Section 6.7)
• Awareness and Assessment of Specific Types of Energy Service Providers and Service Offers (Section 6.8)
• Customer Efficiency-Related Suggestions (6.9)
The baseline survey instrument is provided in Appendix C. To facilitate cross-referencing of the results with the survey instrument, the survey question number is included in parentheses in each of the Exhibits and figures presented in this section.
6.1 SUMMARY OF SAMPLING PROCESS
As was the 1999 SPC Program Evaluation, the sample for the baseline survey was designed to characterize the large customer market (over 500 kW). The customers in the population that were included in the sample were mapped by primary SIC code into seven major business type sectors. These business types were selected based on segments that comprised the majority of the large customer load among the three IOUs. The business types included in the sample are as follows:
• Office

Quantum Consulting Inc. 6-2 Customer Market Survey Results
• Institutional
• Other Commercial
• Industrial: Electronics/Machinery
• Industrial: Petroleum/Plastics
• Industrial: Mining/Metal/Stone/Glass
• Industrial: Other
Each business type was divided into three size strata: (1) small (500 to 1,000 kW), (2) medium (1,000 to 2,000 kW) and (3) large (over 2,000 kW).
The population frame of interest for this analysis comprises the SCE, SDG&E and PG&E service territories. Exhibit 6-1 presents the energy consumption levels for the population of commercial and industrial accounts in the three utility service territories in California with greater than 500 kW demand by sector. Exhibit 6-2 presents the number of accounts in each cell.
Exhibit 6-1 Energy Consumption by Business Type and Size (GWh)
Size in Peak kW 1999Business Type >500 >1000 >2000 Total % of Total Total Office 1,768 1,454 1,511 4,732 9% 11% Institutional 1,784 1,807 7,556 11,147 22% 12% Other Commercial 4,475 2,514 5,184 12,173 24% 29% Electronic, Machinery, and Fabricated Metals 1,179 1,097 3,790 6,066 12% 10% Mining, Metals, Stone, Glass, Concrete 344 556 4,847 5,747 11% 12% Petroleum, Plastic, Rubber and Chemicals 540 777 3,517 4,835 9% 9% Other Industrial and Agriculture 1,670 1,943 3,453 7,066 14% 19%Total: 11,759 10,147 29,860 51,766 100% 100%
Exhibit 6-2 Number of Accounts by Business Type and Size
Size in Peak kW 1999Business Type >500 >1000 >2000 Total Total Office 710 271 106 1,087 1,091 Institutional 806 330 234 1,370 1,131 Other Commercial 1,732 524 349 2,605 3,143 Electronic, Machinery, and Fabricated Metals 448 181 127 756 547 Mining, Metals, Stone, Glass, Concrete 159 114 128 401 386 Petroleum, Plastic, Rubber and Chemicals 198 116 101 415 432 Other Industrial and Agriculture 760 424 230 1,414 1,339Total: 4,813 1,960 1,275 8,048 8,069

Quantum Consulting Inc. 6-3 Customer Market Survey Results
To ensure that we collected data from a representative distribution of customers, the sample design allocated customer interviews uniformly to cells defined by customer size and type. This design sought to distribute 350 interviews roughly evenly among 21 strata (3 size categories by 7 customer types). A total of 350 surveys were completed; the distribution of completed surveys by utility and business type is shown in Exhibit 6-3. Overall, the baseline survey reached 4.3 percent of the population of accounts with over 500 kW in demand. Exhibit 6-4 shows the number of completed interviews by business type and customer size.
Exhibit 6-3 Distribution of Completed Surveys by Utility/Region and Business Type
1999Busines Type PG&E SCE SDG&E Total Total Office 26 16 8 50 55 Institutional 19 21 9 49 53 Other Commercial 43 28 16 87 57 Electronic, Machinery, and Fabricated Metals 18 17 3 38 51 Mining, Metals, Stone, Glass, Concrete 17 15 1 33 36 Petroleum, Plastic, Rubber and Chemicals 12 19 1 32 39 Other Industrial and Agriculture 38 22 1 61 58# Respondents 173 138 39 350 349
Exhibit 6-4 Distribution of Completed Surveys by Business Type and Size
Size in Peak kW 1999Busines Type >500 >1000 >2000 Total Total Office 26 15 9 50 55 Institutional 22 13 14 49 53 Other Commercial 32 25 30 87 57 Electronic, Machinery, and Fabricated Metals 23 12 3 38 51 Mining, Metals, Stone, Glass, Concrete 13 10 10 33 36 Petroleum, Plastic, Rubber and Chemicals 17 9 6 32 39 Other Industrial and Agriculture 21 22 18 61 58# Respondents 154 106 90 350 349
The results reported in the remainder of this chapter are weighted based on energy consumption. Weights were constructed such that the sum of the weights for all interviewed customers within a stratum equal the total energy consumption for that stratum.
6.2 ESTABLISHMENT CHARACTERISTICS
As shown in Exhibits 6-5 and 6-6, the facilities that were interviewed in 2003 and 1999 were similar in size and with respect to number of employees. The size by business indicated that office and institutional facilities averaged the largest square footage, while industrial facilities were more likely to be less than 500,000 square feet, reflecting their higher energy intensity.

Quantum Consulting Inc. 6-4 Customer Market Survey Results
Exhibit 6-5 Square Footage of Facility (EC2) (weighted)
Size in Peak kW 1999Response >500 >1000 >2000 Total Total Less than 10,000 square feet 7% 5% 8% 7% 10,000-19,999 square feet 5% 5% 2% 3% 20,000-49,999 square feet 10% 11% 6% 8% 50,000-99,999 square feet 22% 16% 10% 14% 100,000-199,999 square feet 29% 24% 24% 25% 23% 200,000-299,999 square feet 9% 14% 6% 8% 300,000-399,999 square feet 2% 7% 6% 5% 400,000-499,999 square feet 2% 7% 2% 3% Over 500,000 square feet 7% 4% 24% 16% 18% Ag/Nonfacility - Outdoors 4% 4% 6% 5% 0% Don't Know 2% 3% 6% 5% 12%# Respondents 154 106 90 350 349
27%
19%
About 83 percent of the facilities interviewed in 2003 have less than 1,000 employees. As would be expected, energy demand is correlated with number of employees. While 90 percent of facilities with 500-1,000 kW demand had less than 1,000 employees, only 79 percent of those over 2,000 kW in demand had less than 1,000 employees (see Exhibit 6-6.) Consistent with facility size trends, office and institutional facilities were most likely to employ over 1,000 employees, while industrial facilities were most likely to have less than 500.
Exhibit 6-6 Number of Employees at Location (EC7) (weighted)
Size in Peak kW 1999Response >500 >1000 >2000 Total Total 1 to 10 17% 9% 7% 10% 11 to 50 19% 19% 14% 16% 51 to 100 14% 14% 18% 16% 101 to 250 23% 22% 25% 24% 27% 251 to 500 11% 14% 13% 12% 16% 501 to 1,000 6% 9% 3% 5% 8% Over 1,000 7% 11% 19% 15% 13% Refused 1% 0% 0% 0% 0% Don't Know 2% 2% 1% 2% 1%# Respondents 154 106 90 350 349
34%
Exhibit 6-7 presents some additional firmographic data comparing the 2003 and 1999 samples on an energy-weighted basis. As the Exhibit indicates, the responses for 2003 and 1999 were similar in terms of key firm characteristics.
Job title. Respondents were most likely to be facilities or production managers or their assistants, although a significant fraction also held administrative positions.

Quantum Consulting Inc. 6-5 Customer Market Survey Results
Exhibit 6-7 Characteristics of Surveyed Establishments (weighted)
Size in Peak kW 1999Characteristic >500 >1000 >2000 Total TotalJob Title of Respondent (SC1) Facilities Manager 41% 51% 27% 35% 55% Energy Manager 4% 4% 12% 9% 8% Other facilities management/maintenance 26% 28% 31% 29% 24% Chief Financial Officer 2% 1% 0% 1% <1% Other financial/administrative position 20% 11% 19% 18% 7% Proprietor/Owner 2% 1% 0% 1% <1% President/CEO 7% 4% 10% 8% 3% Other 0% 0% 0% 0% 2%Own or Lease Facility (EC3) Own 72% 79% 88% 82% 69% Lease/Rent 21% 17% 7% 12% 20% Both Own and Lease 5% 1% 4% 3% 9% Refused 2% 1% 0% 1% 1% Don't know 1% 2% 1% 1% 2%Type of Payment Arrangement, Leased Space (EC4) Pay All of Electric Bill 90% 89% 92% 98% 92% Pay None of Electric Bill 10% 11% 8% 2% 4% Refused 0% 0% 0% 0% 1% Don't know 0% 0% 0% 0% 3%Average Monthly Electric Bill (EC5) $1-$10,000 15% 4% 7% 8% 15% $10,001-$25,000 22% 10% 6% 10% 14% $25,001-$50,000 39% 20% 9% 18% 15% $50,001-$100,000 9% 33% 26% 23% 16% $100,001-$250,000 4% 21% 36% 26% 5% >$250,000 5% 4% 13% 9% 9% Don't know/Refused 7% 8% 4% 5% 24%Type of Facility Location (EC6) Only Site 22% 33% 31% 29% 25% Multiple Sites 76% 66% 67% 69% 75% Don't know/Refused 2% 1% 2% 2% 0%Max # Respondents 154 106 90 350 345
Facility Ownership. The establishments interviewed were likely to own their facilities. However, firms with over 2,000 kW in demand were most likely to own at least a portion of their facilities (92 percent). Even customers with less than 1,000 kW in demand were very likely to own at least a portion of their facilities (79%). This result is different from the 1999 survey, where only 69 percent of the larger customers (over 2,000 kW) and 50 percent of the smaller customers (500 to 1,000 kW) owned their facilities.
Mining (89 percent) and Institutional (87 percent) facilities were most likely to own all of their facilities, while only 67 percent of Office and 78 percent of Electronics/Machinery plants owned their facilities. These two business segments lead in leasing, with 18 percent of Offices and 19 percent of Electronics plants leasing their facilities.

Quantum Consulting Inc. 6-6 Customer Market Survey Results
Payment Arrangements for Leased Space. On average, 12 percent of interviewed firms leased all of their space, and 3 percent owned some of their space and leased the rest. Of the firms that lease at least a portion of their space, 92 percent pay their own electric bill.
Average Monthly Electric Bill. Overall, the larger a firm’s energy demand, the larger the size of the reported bill. Note that the firms interviewed in 2003 reported significantly higher energy bills than in 1999. Only 37 percent said they had bills of less than $50,000, as compared to 44 percent in 1999; 23 percent had bills between $50,000-$100,000, as compared to 16 percent in 1999; and 26 percent had bills between $100,000-$200,000, as compared to 5 percent in 1999. However, note that in 1999 about one-fourth of the interviewed firms were unable to provide an estimate of their bill.
As in the 1999 evaluation, there are inconsistencies between reported energy bills and demand. A small percentage of the smallest firms in terms of energy demand reported bills over $250,000, and some of the over 2,000 kW firms reported bills less than $10,000 per month. This phenomenon has been seen in other baseline studies and is not the basis for undue concern, as the majority of respondents seem to have estimated their electricity costs appropriately. It is unclear whether these discrepancies are due to misunderstanding the question, such as month versus year reporting, or reporting by site breakdown different than how our sample was created (e.g. a respondent giving the energy cost for a single building, when our sample reflects demand for an entire complex, would underestimate the bill.) It is also possible that respondents who overestimated their bills are actually reporting total utility costs, rather than electricity only.
6.3 ENERGY PRICE PERCEPTIONS
Because of the unprecedented events associated with the recent California energy crisis, a series of questions was added to our baseline survey to assess customer reactions to the crisis, including price perceptions and conservation and demand response actions.
When asked about trends in the price of electricity for their facility as compared to before the energy crisis, the vast majority of respondents, 67 percent, said that the price of electricity has increased, 9 percent said that it stayed the same, and 15 percent said that it has decreased as compared to prices just prior to the California energy crisis (Exhibit 6-8). While many of the respondents who said their prices have stayed the same or decreased are small customers (<1,000 kW), 18 percent of the large customers (>2,000 kW) also said that their electricity price has decreased. Among business types, petroleum and mining were most likely to say that the electricity price had increased (85 and 80 percent respectively).

Quantum Consulting Inc. 6-7 Customer Market Survey Results
Exhibit 6-8 Perceived Change in Electricity Prices Since Energy Crisis (EP1) (weighted)
Size in Peak kWResponse >500 >1000 >2000 Total Increased 63% 71% 67% 67% Decreased 15% 8% 7% 9% Stayed the Same 12% 8% 18% 15% Refused 0% 0% 1% 0% Don't Know 11% 12% 7% 9%# Respondents 154 106 90 350
The respondents who said that their electricity price had increased were asked by how much the average annual price of electricity had increased as compared to the price before the California energy crisis. Half of the respondents said that their prices had increased by up to 40 percent, and 15 percent said that they had increased by over 100 percent (doubled) since the California energy crisis (Exhibit 6-9). By business type, petroleum (49 percent) and electronics (31 percent) were most likely to say that their electricity prices had doubled.
Exhibit 6-9 Perceived Percent Increase in Electricity Price Due to Energy Crisis (EP2) (weighted)
Size in Peak kWResponse >500 >1000 >2000 Total 0 to 5% 6% 6% 2% 4% 6-10% 13% 9% 8% 9% 11-20% 21% 14% 21% 20% 21-30% 17% 15% 6% 10% 31-40% 5% 10% 7% 7% 41-50% 8% 17% 5% 8% 51-60% 3% 6% 1% 2% 61-70% 1% 2% 9% 6% 71-80% 1% 1% 4% 3% 81-90% 0% 2% 4% 3% 91-100% 5% 5% 4% 4% More than 100% 6% 4% 22% 15% Don't Know 13% 10% 7% 9%# Respondents 96 77 61 234
The respondents were then asked how long they thought the energy price increases would stay in effect. While 24 percent answered less than two years and 27 percent answered less than 10 years, 39 percent said that they thought current energy prices would be in effect for 10 years or more, or that they would be permanent (Exhibit 6-10). Among business types, mining (65 percent, institutional (51 percent) and office (42 percent) were most likely to give the longer

Quantum Consulting Inc. 6-8 Customer Market Survey Results
time period. 35 percent of respondents from the electronic industry thought that the energy prices would decrease again after one year.
Exhibit 6-10 Perceived Future Duration of Electricity Price Increase (EP3) (weighted)
Size in Peak kWResponse >500 >1000 >2000 Total Less than 1 year 18% 9% 17% 16% 1 to 2 years 10% 7% 8% 8% 3 to 5 years 18% 9% 21% 18% 6 to 10 years 5% 11% 10% 9% Over 10 years (or permanently) 36% 48% 37% 39% Don't Know 12% 15% 7% 10%# Respondents 96 77 61 234
Finally, the respondents were asked how, if at all, had the increase in electricity prices affected their firm’s interest or plans to make capital investments in energy efficiency-related projects. Sixty percent of the market reported that interest in efficiency-related projects had increased, and 32 percent said that they were planning to increase their capital investments in such projects as well. However, 38 percent reported no major changes in interest or planned investment in efficiency-related projects (Exhibit 6-11). The smaller firms (<1,000 kW) reported higher increased interest in efficiency-related projects than the larger firms. Among business types, 74 percent of the “other commercial” firms reported increased interest in efficiency-related projects. Fifty percent of mining facilities reported increased interest and increased planned investments in efficiency-related projects. An overwhelming 73 percent of the electronic industry respondents reported no increased interest or planned investments in energy-related projects.
Exhibit 6-11 Electricity Price Increase Effect on Capital Investment Plans for EE (EP4) (weighted)
Size in Peak kWResponse >500 >1000 >2000 Total Increase in Interest and Increase in Planned Investment 32% 39% 30% 32% Increase in Interest but no Increase in Planned Investment 38% 25% 26% 28% No Major Change in Interest or Planned Investment 28% 36% 42% 38% Refused 1% 0% 0% 0% Don't Know 1% 0% 2% 1%# Respondents 96 77 61 234
6.4 CONSERVATION, DEMAND RESPONSE, AND EFFICIENCY ACTIONS
This section presents results of customers self-report energy conservation, demand response, and energy efficiency related actions taken over the year preceding our survey (roughly Summer 2002 through Summer 2003).

Quantum Consulting Inc. 6-9 Customer Market Survey Results
6.4.1 Energy Conservation Actions
In the original 1998 and 1999 large nonresidential baseline surveys, we focused our questions around energy-efficiency actions that involved equipment modifications. Because we know that the recent energy crisis engendered a significant amount of energy conservation, we asked customers about their conservation as well as efficiency actions in the 2003 survey. The respondents were asked a series of questions regarding conservation actions undertaken to manage the use of energy at their facility (in contrast to physical replacements of equipment). When asked whether or not they had undertaken any energy conservation actions to reduce overall energy use, 71 percent of respondents said that they had (Exhibit 6-12). By size, more of the smaller customers (85 percent) took energy conservation actions than the largest customers (74 percent). By business type, institutional facilities and offices (87 and 86 percent respectively) were most likely to have undertaken energy conservation actions. Sixty-three percent of the petroleum industry respondents said that they had not undertaken any energy conservation actions.
Exhibit 6-12 Took Energy Conservation Actions (CON1) (weighted)
Size in Peak kWResponse >500 >1000 >2000 Total Yes 85% 85% 74% 79% No 15% 13% 25% 20% Don't Know 0% 2% 0% 1%# Respondents 154 106 90 350
Regarding the actions taken to conserve energy, switching off lights in unused rooms was the most cited (76 percent), followed by lowering thermostat setpoints (58 percent) and switching off office equipment (34 percent). Specific business types often cited other actions: dimming lights that are in use, and reprogramming the EMS (30 percent of electronic industry respondents), fine-tuning existing equipment (23 percent of respondents in the mining industry), educating employees to save energy (21 percent of institutional respondents).

Quantum Consulting Inc. 6-10 Customer Market Survey Results
Exhibit 6-13 Energy Conservation Actions Taken (CON5) (weighted)
Size in Peak kWResponse >500 >1000 >2000 Total Turn Off Office Equipment 29% 20% 41% 34% Lower Thermostat Setpoints 50% 57% 62% 58% Shift High Energy Processes to Off-peak 14% 19% 26% 22% Turn Off Lights in Unused Rooms 73% 67% 81% 76% Dim Remaining Lights (That Are In Use) 13% 15% 15% 14% Pre-Cool Spaces with AC 2% 2% 2% 2% Employee Alert System 0% 2% 3% 2% Reprogram EMS 3% 9% 8% 7% Use Backup Generator 2% 0% 4% 3% Decrease Industrial Production or Consolidate Shifts 9% 15% 4% 8% Fine-tune Existing Equipment 15% 7% 10% 11% Educate Employees to Save Energy 2% 4% 10% 7% Other 3% 5% 1% 3% Don't Know 0% 0% <1% <1%# Respondents 130 89 71 290
When asked when these energy conservation actions had started, 57 percent of the respondents said that they had always tried to conserve energy in these ways, and 41 percent said they started a year or two ago (Exhibit 6-14). Institutional facilities were the most likely to report they had always tried to conserve energy (78 percent), while electronic facilities were the most likely to report having started to conserve energy a year or two ago (78 percent).
Exhibit 6-14 When Did Energy Conservation Actions Start (CON7) (weighted)
Size in Peak kWResponse >500 >1000 >2000 Total Always Tried to Conserve Energy In These Ways 53% 46% 64% 57% A Year or Two Ago 45% 52% 35% 41% Started Conserving In the Past Few Months 2% 1% 2% 1% Refused <1% 0% 0% <1% Don't Know 0% 1% 0% <1%# Respondents 130 89 71 290
On average, respondents estimated they were achieving 7 percent energy savings from conservation actions, as compared to their energy usage prior to the California energy crisis (Exhibit 6-15). This self reported average level of savings is consistent with the overall level of energy use reduction estimated by the California Energy Commission to have resulted from the
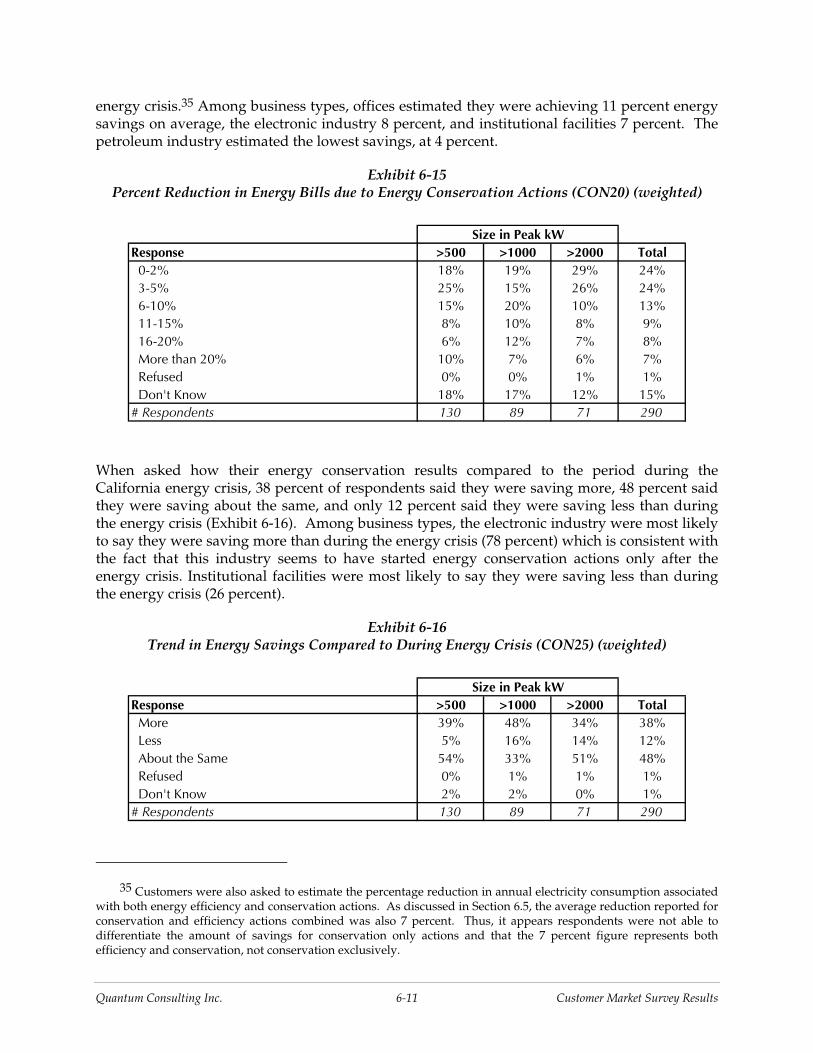
Quantum Consulting Inc. 6-11 Customer Market Survey Results
energy crisis.35 Among business types, offices estimated they were achieving 11 percent energy savings on average, the electronic industry 8 percent, and institutional facilities 7 percent. The petroleum industry estimated the lowest savings, at 4 percent.
Exhibit 6-15 Percent Reduction in Energy Bills due to Energy Conservation Actions (CON20) (weighted)
Size in Peak kWResponse >500 >1000 >2000 Total 0-2% 18% 19% 29% 24% 3-5% 25% 15% 26% 24% 6-10% 15% 20% 10% 13% 11-15% 8% 10% 8% 9% 16-20% 6% 12% 7% 8% More than 20% 10% 7% 6% 7% Refused 0% 0% 1% 1% Don't Know 18% 17% 12% 15%# Respondents 130 89 71 290
When asked how their energy conservation results compared to the period during the California energy crisis, 38 percent of respondents said they were saving more, 48 percent said they were saving about the same, and only 12 percent said they were saving less than during the energy crisis (Exhibit 6-16). Among business types, the electronic industry were most likely to say they were saving more than during the energy crisis (78 percent) which is consistent with the fact that this industry seems to have started energy conservation actions only after the energy crisis. Institutional facilities were most likely to say they were saving less than during the energy crisis (26 percent).
Exhibit 6-16 Trend in Energy Savings Compared to During Energy Crisis (CON25) (weighted)
Size in Peak kWResponse >500 >1000 >2000 Total More 39% 48% 34% 38% Less 5% 16% 14% 12% About the Same 54% 33% 51% 48% Refused 0% 1% 1% 1% Don't Know 2% 2% 0% 1%# Respondents 130 89 71 290
35 Customers were also asked to estimate the percentage reduction in annual electricity consumption associated with both energy efficiency and conservation actions. As discussed in Section 6.5, the average reduction reported for conservation and efficiency actions combined was also 7 percent. Thus, it appears respondents were not able to differentiate the amount of savings for conservation only actions and that the 7 percent figure represents both efficiency and conservation, not conservation exclusively.

Quantum Consulting Inc. 6-12 Customer Market Survey Results
Finally, when asked about the main reasons for taking energy conservation actions, 87 percent of respondents cited energy bill reductions, and 21 percent cited civic duty. Among business types, petroleum (100 percent) and electronics (98 percent) were most likely to cite energy bill reductions as the main reasons for taking energy conservation actions. Institutional facilities were least likely to cite energy bill reductions (66 percent) but were most likely to cite civic duty (42 percent) as one of the main reasons for taking energy conservation actions.
Exhibit 6-17 Reasons for Taking Energy Conservation Actions (CON30) (weighted)
Size in Peak kWResponse >500 >1000 >2000 Total Lower Energy Bill 93% 89% 83% 87% Reduce Stress on the Grid 5% 9% 4% 5% Be Less Vulnerable to Outages/Risk Management 1% 4% 2% 2% Avoid Blackouts 2% 4% 3% 3% Civic Duty 19% 18% 23% 21% Help Solve Energy Crisis 7% 5% 3% 4% Environmental Concerns 2% 1% 0% 1% Contractual Agreement within IOU Program 1% 1% 6% 4% Educate Staff 0% 1% 0% <1% Increase Equipment Life 0% 3% 0% 1% Other 0% 1% 0% 1% Don't Know <1% 0% 0% <1%# Respondents 130 89 71 290
6.4.2 Demand Response Behavior
Respondents also were asked about peak reduction actions specifically on power alert days. A majority of respondents, 52 percent, said that they had taken or would be willing to take additional actions during power alert days (Exhibit 6-18). Among business types, petroleum (68 percent) and mining (61 percent) were most likely to say they had taken additional actions during power alerts. The electronic industry was most likely to say they did not or would not take additional actions (57 percent).
Exhibit 6-18 Have Taken/Would Take Additional Actions During Power Alert Days (DR20) (weighted)
Size in Peak kWResponse >500 >1000 >2000 Total Yes 56% 60% 47% 52% No 44% 38% 50% 46% Refused 0% 1% 1% 1% Don't Know 0% 2% 2% 1%# Respondents 154 106 90 350

Quantum Consulting Inc. 6-13 Customer Market Survey Results
The most cited demand response actions were switching off lights in unused rooms (28 percent), shifting high-energy processes to off-peak periods (26 percent) and lowering thermostat setpoints (21 percent). In addition to these, the petroleum industry cited decreasing production and consolidating shifts (51 percent) as the main actions taken. The mining industry cited the use of backup generators (31 percent) or shutting down the entire plant (29 percent) among the main actions taken. Institutional facilities cited dimming the existing lights (30 percent) switching down non-critical equipment (24 percent), and using an employee alert system (21 percent).
Exhibit 6-19 Additional Actions Taken During Power Alert Days (DR30) (weighted)
Size in Peak kWResponse >500 >1000 >2000 Total Turn Off Office Equipment 28% 16% 6% 14% Lower Thermostat Setpoints 32% 31% 13% 21% Shift High Energy Processes to Off-peak 13% 16% 35% 26% Turn Off Lights in Unused Rooms 56% 34% 12% 28% Dim Remaining Lights (That Are In Use) 18% 8% 10% 11% Pre-Cool Spaces with AC 6% 0% 0% 2% Employee Alert System 9% 5% 8% 8% Reprogram EMS 4% 0% 1% 2% Use Backup Generator 7% 11% 20% 15% Decrease Industrial Production or Consolidate Shifts 5% 7% 13% 10% Shut Down Entire Plant 7% 11% 7% 8% Shut Down Noncritical Equipment 6% 2% 12% 8% Participate in IOU DR/Curtailment Program 3% 5% 3% 4% Other 6% 4% 2% 3%# Respondents 85 64 42 191
Lowering the energy bill was again the main reason for taking additional actions during power alert days (31 percent), followed by avoiding blackouts (21 percent) and civic duty (17 percent). Responses varied significantly by business type, while the main reason for the petroleum industry was to lower the energy bill (86 percent), the electronics industry cited avoiding blackouts (65 percent), and institutional facilities cited civic duty (38 percent).

Quantum Consulting Inc. 6-14 Customer Market Survey Results
Exhibit 6-20 Primary Reason for Taking Additional Actions During Power Alert Days (DR35) (weighted)
Size in Peak kWResponse >500 >1000 >2000 Total Lower Energy Bill 20% 33% 34% 31% Reduce Stress on the Grid 17% 19% 8% 13% Be Less Vulnerable to Outages/Risk Management 9% 4% 10% 8% Avoid Blackouts 14% 24% 23% 21% Civic Duty 26% 11% 16% 17% Help Solve Energy Crisis 4% 3% 0% 2% Contractual Agreement within IOU Program 9% 4% 9% 8% Don't Know 0% 2% 0% 0%# Respondents 85 64 42 191
6.4.3 Energy Efficiency Actions
The following subsection discusses results regarding actions taken by firms to improve energy efficiency. The questions asked in our 2003 survey are compared to identical or related questions asked in the 1999 and 1998 baseline surveys.
Approximately 76% of the firms reported that they had taken actions to improve energy efficiency or conservation in the past year. This is considerably higher than the 60 percent of customers who said they took such actions in 1999. Most of this difference is probably associated with conservation actions taken by customers in the wake of the energy crisis. In the 1999 survey, there was no explicit differentiation of efficiency and conservation actions; however, based on the types of actions described (see Exhibit 6-22), the vast majority of actions reported in the 1999 results appear to have been efficiency oriented, not conservation. If we compare 1999 and 2003 results excluding the portion of customers who reported they only took actions involving changes in the use or operation of equipment, the percentages are identical at 60 percent. As Exhibit 6-21 shows, the largest firms were more likely to have installed energy efficient equipment than middle- or small-size firms. At the business type level, institutional facilities (88 percent), industrial petroleum and plastics (85%) and offices (82 percent) were most likely to have taken recent energy efficiency actions. The Other Commercial segment were least likely, at 74 percent, which is still higher than the highest percentage reported in the 1999 evaluation (institutional facilities at 72 percent).
Exhibit 6-21 Any Actions to Improve Energy Efficiency in Past Year (IM3-IM3a) (weighted)
Size in Peak kW 1999Response >500 >1000 >2000 Total Total Yes, Installed Energy Efficient Equipment 26% 33% 24% 26% Yes, Changed Use and Operation 21% 22% 13% 16% Yes, Installed Equipment and Changed Operation 25% 27% 41% 34% No 26% 18% 21% 22% 40% Don't Know 1% 0% 2% 1% <1%# Respondents 154 106 90 350 349
60%

Quantum Consulting Inc. 6-15 Customer Market Survey Results
As shown in Exhibit 6-22, among the respondents who said they had installed new energy efficiency equipment, the most common actions taken were installing efficient motors or variable speed drives (59 percent), installing efficient lighting (50 percent) and installing efficient HVAC/refrigeration equipment (40 percent).
Exhibit 6-22 Type of Energy Saving Action(s) Taken (IM4) (weighted)
Size in Peak kW 1999Response >500 >1000 >2000 Total Total Efficient Lighting Equipment 66% 54% 44% 50% 64% Efficient HVAC/Refrigeration Equipment 46% 51% 34% 40% 48% Efficient Motors or VSDs 39% 60% 65% 59% 60% Reengineer Manufacturing or Processing 18% 24% 38% 31% 33% Controls or EMS 33% 42% 32% 34% 32% Cogeneration Plant 2% 7% 12% 9% Boilers 0% 4% 1% 1% Electric Generator 0% 2% 0% 0% Shifted Production to Off-Peak Time 0% 1% 1% 1% Other 13% 2% 0% 3% Don't Know 0% 0% 0% 0% <1%# Respondents 77 63 51 191 208
16%
Firms in all size categories installed a significant percentage of each type of measure. As expected, larger firms were more likely to install a larger percentage of variable speed drives (VSD), and smaller firms to install efficient lighting. When examined by business type, industrial electronics were most likely to have installed multiple measures, followed by institutional facilities. The highest likelihood of any one action was seen with the petroleum/plastics firms, 90 percent of which had installed more efficient motors or VSDs within the time period.
Respondents were asked to estimate the amount by which they estimated their actions had reduced their electricity consumption. The average reported reduction in electricity savings due to the equipment installations was 7 percent. As noted in Section 6.4.1., this self reported average level of savings is consistent with the overall level of energy use reduction estimated by the California Energy Commission to have resulted from the energy crisis
About 33 percent of firms reported that they had identified, but not undertaken, energy-efficiency actions within the same time period. The corresponding percentage in the 1999 survey was 26 percent. The main reasons cited for identifying, but not undertaking energy efficiency actions were lack of funds available for investment (39 percent), the need for more time to complete the decision-making process (14 percent), other priorities for capital investment (11 percent), and the belief that the level of potential savings did not justify the investment or activity required for implementation (10 percent).

Quantum Consulting Inc. 6-16 Customer Market Survey Results
6.5 ENERGY-RELATED DECISION MAKING
The baseline survey included questions regarding energy related decision making, the approval process, staff responsibility for controlling energy costs, and specific energy efficiency policies. These questions were included in the 1999 survey as well and results are compared below.
6.5.1 Getting Approval for Energy Efficiency Projects
Interviewees were first asked about the ease or difficulty of their organization’s internal process for approving efficiency-related investments. The results in Exhibit 6-23 indicate that the perceived complexity of the process of approving energy efficiency investments has not changed significantly since 1999. The most common response continues to be that the process is somewhat complex, but manageable.
Exhibit 6-23 Complexity of Process to Approve Energy Efficiency Investments (DM2A) (weighted)
Size in Peak kW 1999Response >500 >1000 >2000 Total Total Relatively Simple and Straightforward 31% 34% 33% 33% 33% Somewhat Complex, but Manageable 43% 45% 52% 49% 48% Complex and Difficult to Get Through 24% 21% 15% 18% 18% Refused 2% 0% 0% <1% 1% Don't know 0% 0% 1% <1% 0%# Respondents 154 106 90 350 349
6.5.2 Assigned Responsibility for Controlling Energy Costs
As was the case in the 1999 survey and shown in Exhibit 6-24, three-fourths of large firms have a person or group of staff assigned to manage energy costs. As shown in previous related research, the smallest firms are less likely than the largest firms to have assigned a particular person or group to manage energy costs, but most likely to have hired an outside contractor for the task (especially offices and institutional facilities). Mining facilities were least likely to have someone assigned (55 percent).
Exhibit 6-24 Person in Charge of Energy Usage/Costs (DM6) (weighted)
Size in Peak kW 1999Response >500 >1000 >2000 Total Total An In-House Staff Person 37% 48% 41% 42% 50% A Group of Staff 28% 25% 36% 32% 22% An Outside Contractor 15% 3% 7% 8% 2% Not Assigned to Anyone 24% 26% 26% 26% 23% Refused 0% 0% 0% 0% <1% Don't know 0% 1% 0% <1% 2%# Respondents 154 106 90 350 349

Quantum Consulting Inc. 6-17 Customer Market Survey Results
When asked if the person or group in charge was rewarded or compensated for energy savings, only 13 percent of facilities answered affirmatively. This is lower than the 30 percent that reported using rewards in 1999. Smaller firms were more likely (18 percent) to offer rewards than large firms (10 percent). Among business types, mining firms were most likely to offer rewards (22 percent) and institutional facilities least likely (4 percent). Of the firms that did recognize energy savings as an achievement, the rewards ranged from no special rewards (it is part of the person’s responsibilities), to public recognition, offering raises/bonuses, to offering a percentage of the savings.
6.5.3 Organization’s Energy Efficiency Policies
Over 40 percent of firms reported formalized specification policies for the selection of energy efficiency equipment, up from 30 percent in 1999. As indicated in Exhibit 6-25, the larger the firm, the more likely they were to have developed formal policies. Institutional facilities were most likely to have developed policies (56 percent), while other industrial, electronics, office, and mining firms ranged from 33 to 39 percent.
Exhibit 6-25 Any Policy for Selection of Energy Efficiency Equipment? (DM9) (weighted)
Size in Peak kW 1999Response >500 >1000 >2000 Total Total Yes 34% 41% 47% 43% 30% No 58% 58% 52% 54% 67% Refused 1% 0% 0% <1% 0% Don't Know 8% 1% 2% 3% 3%# Respondents 154 106 90 350 349
6.5.4 Investment Criteria for Energy Efficiency Projects
Forty-six percent of the firms reported using payback periods as the primary economic criterion for energy efficiency investments, while 34 percent reported using internal rate of return or life-cycle cost analysis, only 8 percent reported using no economic criteria, while 9 percent reported they did not know what criteria were used.
The mean payback period reported, weighted by energy usage, was 3.3 years for the 289 respondents who were able to provide estimates. This answer is higher than the 2.5 years reported in 1999. As Exhibit 6-26 indicates, the most likely response was 2-2.5 years, and over 50 percent of firms in all categories accepted paybacks of 3.5 years or less. However, 13 percent report accepting a 5-year payback period, and 12 percent of the largest size facilities (mostly institutional) say they accept even a 6 to 10-year payback period. It should be noted that these self-reported results are somewhat inconsistent with anecdotal reports from energy-efficiency service providers that the majority of customers routinely ignore efficiency opportunities with paybacks of less than two years.

Quantum Consulting Inc. 6-18 Customer Market Survey Results
Exhibit 6-26 Payback Period for Energy Efficiency Investments (DM12A) (weighted)
Size in Peak kW 1999Response >500 >1000 >2000 Total Total Less than 1 Year 5% 3% 3% 3% 1 to 1.5 Years 8% 7% 12% 10% 1.5 to 2 Years 2% 4% 12% 8% 2 to 2.5 Years 26% 27% 19% 22% 2.5 to 3 Years 2% 1% 0% 1% 3 to 3.5 Years 10% 14% 16% 14% 3.5 to 4 Years 0% 1% 2% 1% 4 Years 5% 4% 2% 3% 4% 5 Years 16% 17% 11% 13% 12% 6 to 10 Years 4% 4% 12% 9% 4% Over 10 Years 0% 0% 0% 0% <1% Refused 3% 3% 1% 2% 0% Don't Know 20% 14% 10% 13% 22%# Respondents 154 106 90 350 349
30%
13%
14%
Interviewees were also asked about the major obstacles to obtaining approval for energy efficient investments. Twenty-three percent of respondents each cited lack of funds and uncertainty regarding energy savings, and 20 percent cited other priorities for capital spending. Twenty-two percent of respondents, mostly from office, other commercial and mining facilities, perceived no major obstacles.
6.5.5 Concerns Regarding Energy-Efficiency Improvements
The survey included a series of questions to measure uncertainty regarding purchasing energy efficient equipment and related services. Respondents were asked to rank uncertainty as a barrier to potential energy-efficiency investments on a 0-to-10 point scale. As shown in Exhibit 6-27 and 6-28, respondents reported that uncertainty regarding the performance of energy efficient equipment, estimates of savings, and trustworthiness of third-party firms were all significant barriers to potential energy efficiency measures. Uncertainty of firm trustworthiness was consistently rated as the most significant barrier of the three, in each size and business type category. However, these uncertainties were lower than those reported in 1999.
Exhibit 6-27 Mean Rating of Uncertainty Regarding Energy Efficiency Equipment
And Services by Size (BR1A) (weighted)
Size in Peak kW 1999Response >500 >1000 >2000 Total Total Uncertainty of Performance of EE Equipment 6.2 5.7 6.1 6.0 7.0 Uncertainty of Actual vs. Estimated Savings 6.6 6.0 6.6 6.5 7.3 Uncertainty of Firm Trustworthiness 6.9 6.5 6.8 6.8 7.8 Uncertainty about the Firm Providing Services 7.1 6.5 6.8 6.8 --Max # Respondents 151 104 89 343 342

Quantum Consulting Inc. 6-19 Customer Market Survey Results
Exhibit 6-28 Mean Rating of Uncertainty Regarding Energy Efficiency Equipment
And Services by Business Type (BR1A) (weighted)
Business Type 1999Response Office Institut. Other C Electronic Mining Petroleum Other Ind Total Total Uncertainty of Performance of EE Equipment 6.0 5.8 5.9 7.2 5.4 6.2 5.9 6.0 7.0 Uncertainty of Actual vs. Estimated Savings 6.0 6.6 6.5 7.4 6.5 6.5 6.1 6.5 7.3 Uncertainty of Firm Trustworthiness 6.8 6.5 6.8 8.3 6.3 6.7 6.2 6.8 7.8 Uncertainty about the Firm Providing Services 6.7 6.6 7.2 7.7 6.5 6.4 6.3 6.8 --Max # Respondents 49 48 86 37 32 32 60 343 342
Respondents also were asked to rate their organizations’ level of knowledge with respect to energy saving opportunities in lighting, HVAC and all other end uses (Exhibit 6-29). The ratings were requested on a 0-to-10 scale. As the results show, there are only slight differences between markets and between measures. Similar to the same set of answers in 1998, the respondents scored themselves most knowledgeable about lighting and least knowledgeable about HVAC.36
Exhibit 6-29 Mean Rating of Energy Efficiency Knowledge Levels (KN2) (weighted)
Size in Peak kW 1998Response >500 >1000 >2000 Total Total Lighting Opportunities 7.2 7.5 7.1 7.2 7.3 HVAC Opportunities 6.9 7.0 6.4 6.7 7.0 Other Opportunities 6.8 7.2 6.9 6.9 6.8Max # Respondents 151 105 89 345 --
6.6 PROGRAM AWARENESS AND PARTICIPATION
6.6.1 Efficiency Program Awareness
Respondents were asked about their familiarity with utility programs or resources designed to promote energy efficiency. Seventy percent of the total market reported they were aware of one or more programs or resources, as compared to 57 percent in 1999 (see Exhibit 6-30.) Industrial electronics/ machinery (95 percent), petroleum/plastics (85 percent) and office (76%) were most likely to be familiar with utility programs or resources.
36 Due to different size segmentation, the responses from the 2002 and 1998 surveys are not directly comparable. The results reported in the 1998 column represent responses from the 1998 large and very large customers only.

Quantum Consulting Inc. 6-20 Customer Market Survey Results
Exhibit 6-30 Aware of Any Utility Energy Efficiency Program or Resource in 2002 (PR1) (weighted)
Size in Peak kW 1999Response >500 >1000 >2000 Total Total Yes 64% 69% 72% 70% 57% No 30% 26% 22% 25% 41% Refused 0% 0% 0% 0% <1% Don't Know 5% 5% 6% 5% 2%# Respondents 154 106 90 350 349
When asked which energy-efficiency programs provided by their utility they were aware of, 66 percent mentioned rebates or incentives, including the SPC program. Only 20 percent mentioned seminars/classes, and only 10 percent mentioned energy audits.37 As shown in Exhibit 6-31, unprompted awareness of individual programs or resources varied by size category, with the larger firms generally more aware of all existing resources than the smaller firms.
Exhibit 6-31 Unprompted Mentions of 2002 Utility Programs or Resources by Size (PR1) (weighted)
Size in Peak kWResponse >500 >1000 >2000 Total Business Energy Audits 11% 12% 9% 10% Rebates/Incentives 61% 70% 67% 66% Energy Centers (PEC, CTAC) 5% 10% 6% 7% Seminars, Classes, Workshops 12% 17% 23% 20% Other 15% 9% 21% 17% Don't Know/Refused 7% 6% 7% 7%# Respondents 124 90 73 287
It is also interesting to look at the difference in program awareness by business type, as indicated in Exhibit 6-32. Overall, institutional facilities reported the highest awareness of all programs, with the exception of rebates and energy audits. The electronic/machinery facilities were most likely to be aware of rebate/incentive programs and business energy audits.
37 It is important to note that this question was asked on an unaided basis, that is, respondents were asked what types of program efforts they were aware of, they were not prompted with each of the program types and asked if they were familiar with them. Respondents may have provided one of more examples of programs with which they are familiar. Aided awareness levels are typically significantly higher than unaided levels.

Quantum Consulting Inc. 6-21 Customer Market Survey Results
Exhibit 6-32 Unprompted Mention of 2002 Utility Programs or Resources by Business Type (PR1)
(weighted)
Business TypeResponse Office Institut. Other C Electronic Mining Petroleum Other Ind Total Business Energy Audits 8% 9% 12% 26% 0% 3% 7% 10% Rebates/Incentives 64% 55% 59% 92% 61% 70% 71% 66% Energy Centers (PEC, CTAC) 1% 15% 9% 3% 0% 2% 4% 7% Seminars, Classes, Workshops 13% 30% 17% 28% 9% 14% 18% 20% Other 15% 28% 16% 5% 38% 14% 7% 17% Don't Know/Refused 7% 18% 4% 0% 0% 3% 7% 7%# Respondents 45 40 65 34 22 30 51 287
Firms in the SCE territory were somewhat more likely (74 percent versus 68 percent) than firms in other utility territories to say that they were aware of utility programs or resources.
Awareness of the SPC program was probed in a separate, aided question. Half of respondents said that they were specifically aware of the SPC program (Exhibit 6-33). SPC awareness levels were very similar across utility service territories. When asked about how they first learned about the program, 59 percent of respondents said they were contacted by their utility representative, 10 percent heard about it at a seminar, and 9 percent had received by mail utility brochures promoting the program. Somewhat surprisingly, less than 5 percent of respondents said they first heard about the program from a contractor or non-utility efficiency service provider.
Exhibit 6-33 Awareness of 2002 SPC Program (PR2) (weighted)
Size in Peak kWResponse >500 >1000 >2000 Total Yes 46% 52% 50% 50% No 53% 48% 48% 49% Don't Know 2% 0% 1% 1%# Respondents 154 106 90 350
Impressions of the SPC program were generally favorable (66 percent), the reasons offered being that it promoted energy efficiency, offered rebates, and offered information. Only six percent of respondents had an unfavorable impression, mostly due to reported difficulties when applying for the program (too complicated, too bureaucratic, no time for filling out forms), or because they saw no benefit or savings from applying. Twenty-seven percent had neither a favorable nor an unfavorable impression of the program.
6.6.2 Flex Your Power Awareness
Large nonresidential customers were also asked whether they were aware of the Flex Your Power advertising campaign that has been ongoing since the energy crisis, though at a lower funding level in 2002 and 2003 than in 2001. When asked simply whether they were aware of
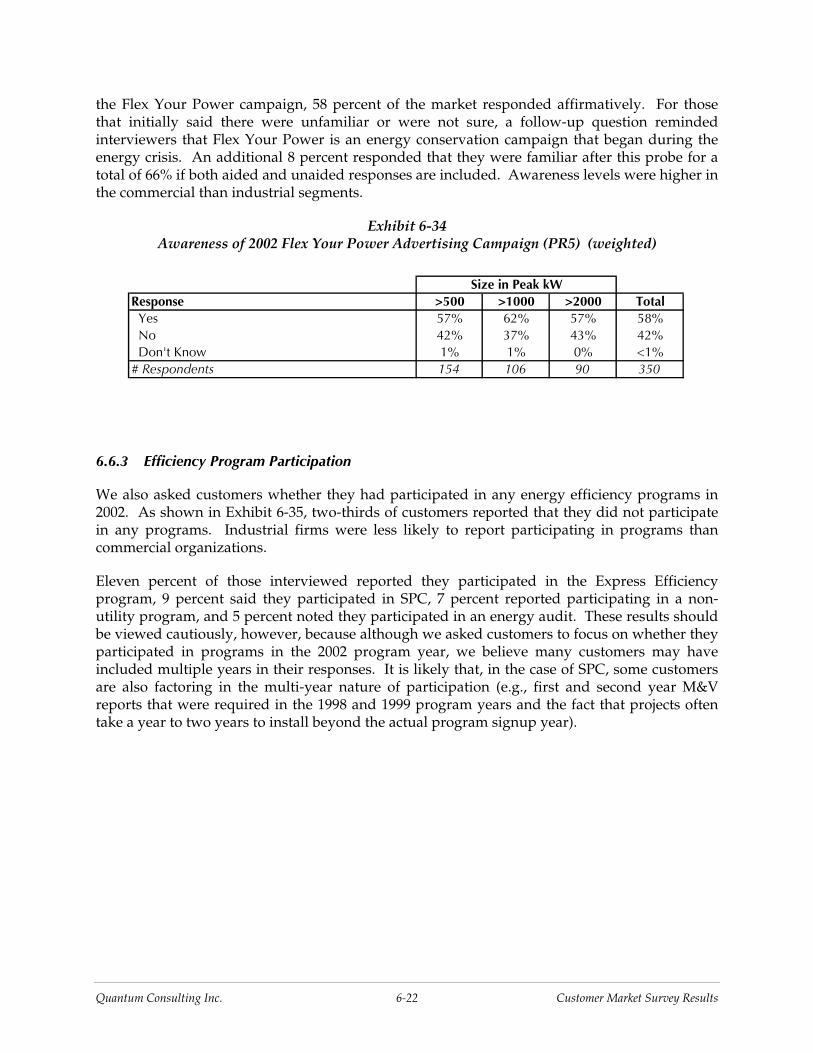
Quantum Consulting Inc. 6-22 Customer Market Survey Results
the Flex Your Power campaign, 58 percent of the market responded affirmatively. For those that initially said there were unfamiliar or were not sure, a follow-up question reminded interviewers that Flex Your Power is an energy conservation campaign that began during the energy crisis. An additional 8 percent responded that they were familiar after this probe for a total of 66% if both aided and unaided responses are included. Awareness levels were higher in the commercial than industrial segments.
Exhibit 6-34 Awareness of 2002 Flex Your Power Advertising Campaign (PR5) (weighted)
Size in Peak kWResponse >500 >1000 >2000 Total Yes 57% 62% 57% 58% No 42% 37% 43% 42% Don't Know 1% 1% 0% <1%# Respondents 154 106 90 350
6.6.3 Efficiency Program Participation
We also asked customers whether they had participated in any energy efficiency programs in 2002. As shown in Exhibit 6-35, two-thirds of customers reported that they did not participate in any programs. Industrial firms were less likely to report participating in programs than commercial organizations.
Eleven percent of those interviewed reported they participated in the Express Efficiency program, 9 percent said they participated in SPC, 7 percent reported participating in a non-utility program, and 5 percent noted they participated in an energy audit. These results should be viewed cautiously, however, because although we asked customers to focus on whether they participated in programs in the 2002 program year, we believe many customers may have included multiple years in their responses. It is likely that, in the case of SPC, some customers are also factoring in the multi-year nature of participation (e.g., first and second year M&V reports that were required in the 1998 and 1999 program years and the fact that projects often take a year to two years to install beyond the actual program signup year).
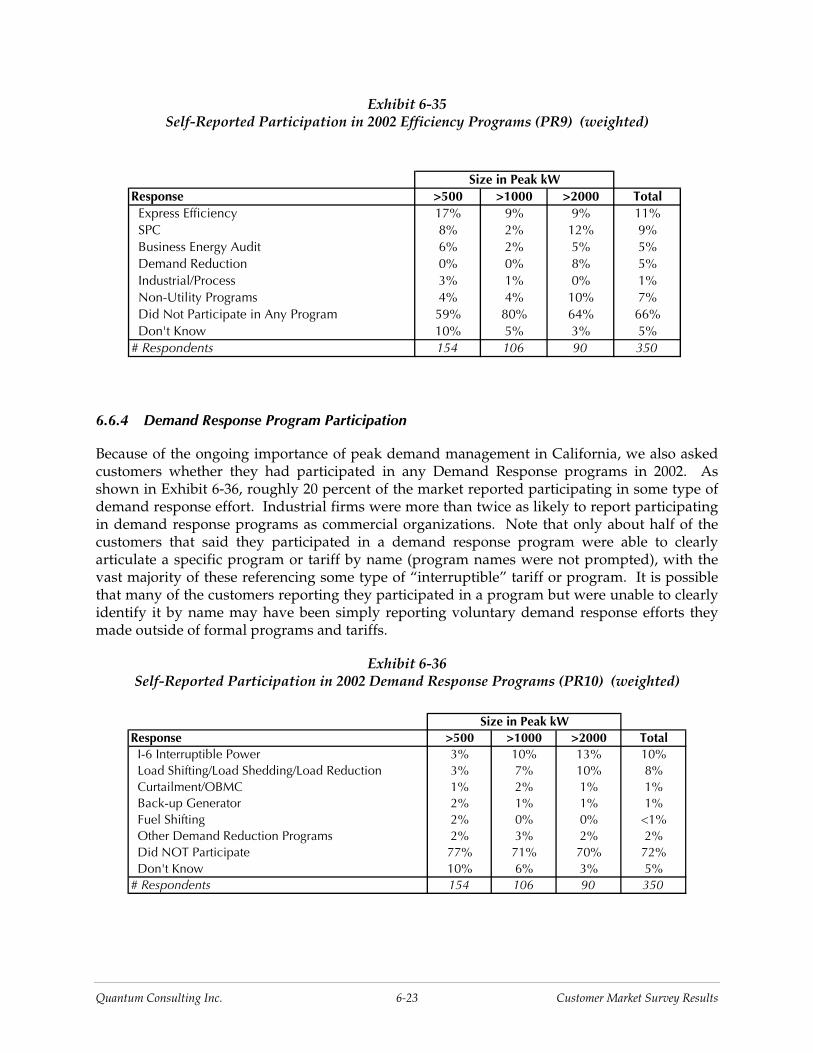
Quantum Consulting Inc. 6-23 Customer Market Survey Results
Exhibit 6-35 Self-Reported Participation in 2002 Efficiency Programs (PR9) (weighted)
Size in Peak kWResponse >500 >1000 >2000 Total Express Efficiency 17% 9% 9% 11% SPC 8% 2% 12% 9% Business Energy Audit 6% 2% 5% 5% Demand Reduction 0% 0% 8% 5% Industrial/Process 3% 1% 0% 1% Non-Utility Programs 4% 4% 10% 7% Did Not Participate in Any Program 59% 80% 64% 66% Don't Know 10% 5% 3% 5%# Respondents 154 106 90 350
6.6.4 Demand Response Program Participation
Because of the ongoing importance of peak demand management in California, we also asked customers whether they had participated in any Demand Response programs in 2002. As shown in Exhibit 6-36, roughly 20 percent of the market reported participating in some type of demand response effort. Industrial firms were more than twice as likely to report participating in demand response programs as commercial organizations. Note that only about half of the customers that said they participated in a demand response program were able to clearly articulate a specific program or tariff by name (program names were not prompted), with the vast majority of these referencing some type of “interruptible” tariff or program. It is possible that many of the customers reporting they participated in a program but were unable to clearly identify it by name may have been simply reporting voluntary demand response efforts they made outside of formal programs and tariffs.
Exhibit 6-36 Self-Reported Participation in 2002 Demand Response Programs (PR10) (weighted)
Size in Peak kWResponse >500 >1000 >2000 Total I-6 Interruptible Power 3% 10% 13% 10% Load Shifting/Load Shedding/Load Reduction 3% 7% 10% 8% Curtailment/OBMC 1% 2% 1% 1% Back-up Generator 2% 1% 1% 1% Fuel Shifting 2% 0% 0% <1% Other Demand Reduction Programs 2% 3% 2% 2% Did NOT Participate 77% 71% 70% 72% Don't Know 10% 6% 3% 5%# Respondents 154 106 90 350
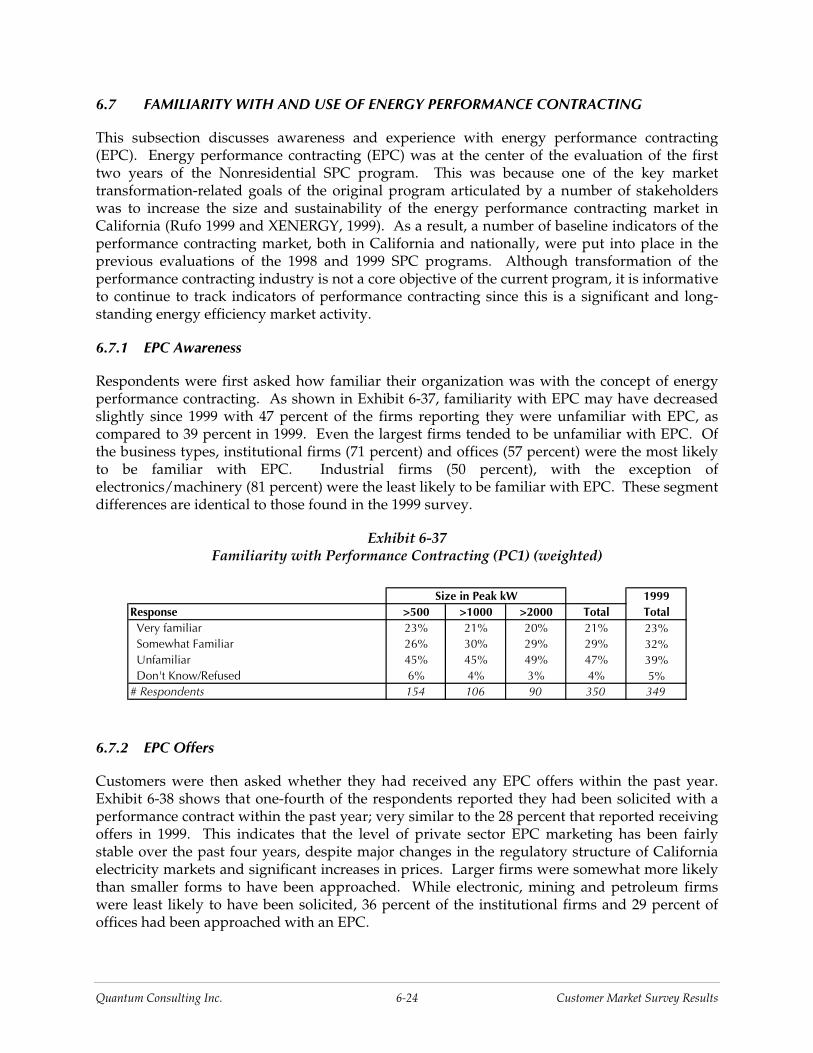
Quantum Consulting Inc. 6-24 Customer Market Survey Results
6.7 FAMILIARITY WITH AND USE OF ENERGY PERFORMANCE CONTRACTING
This subsection discusses awareness and experience with energy performance contracting (EPC). Energy performance contracting (EPC) was at the center of the evaluation of the first two years of the Nonresidential SPC program. This was because one of the key market transformation-related goals of the original program articulated by a number of stakeholders was to increase the size and sustainability of the energy performance contracting market in California (Rufo 1999 and XENERGY, 1999). As a result, a number of baseline indicators of the performance contracting market, both in California and nationally, were put into place in the previous evaluations of the 1998 and 1999 SPC programs. Although transformation of the performance contracting industry is not a core objective of the current program, it is informative to continue to track indicators of performance contracting since this is a significant and long-standing energy efficiency market activity.
6.7.1 EPC Awareness
Respondents were first asked how familiar their organization was with the concept of energy performance contracting. As shown in Exhibit 6-37, familiarity with EPC may have decreased slightly since 1999 with 47 percent of the firms reporting they were unfamiliar with EPC, as compared to 39 percent in 1999. Even the largest firms tended to be unfamiliar with EPC. Of the business types, institutional firms (71 percent) and offices (57 percent) were the most likely to be familiar with EPC. Industrial firms (50 percent), with the exception of electronics/machinery (81 percent) were the least likely to be familiar with EPC. These segment differences are identical to those found in the 1999 survey.
Exhibit 6-37 Familiarity with Performance Contracting (PC1) (weighted)
Size in Peak kW 1999Response >500 >1000 >2000 Total Total Very familiar 23% 21% 20% 21% 23% Somewhat Familiar 26% 30% 29% 29% 32% Unfamiliar 45% 45% 49% 47% 39% Don't Know/Refused 6% 4% 3% 4% 5%# Respondents 154 106 90 350 349
6.7.2 EPC Offers
Customers were then asked whether they had received any EPC offers within the past year. Exhibit 6-38 shows that one-fourth of the respondents reported they had been solicited with a performance contract within the past year; very similar to the 28 percent that reported receiving offers in 1999. This indicates that the level of private sector EPC marketing has been fairly stable over the past four years, despite major changes in the regulatory structure of California electricity markets and significant increases in prices. Larger firms were somewhat more likely than smaller forms to have been approached. While electronic, mining and petroleum firms were least likely to have been solicited, 36 percent of the institutional firms and 29 percent of offices had been approached with an EPC.

Quantum Consulting Inc. 6-25 Customer Market Survey Results
Exhibit 6-38 Firm Solicited with Performance Contract in Past Year (PC3) (weighted)
Size in Peak kW 1999Response >500 >1000 >2000 Total Total Yes 19% 29% 26% 25% 28% No 68% 61% 68% 66% 65% Don't Know/Refused 13% 10% 6% 8% 7%# Respondents 154 106 90 350 349
6.7.3 EPC Accepted
In almost half of the cases in which firms were offered an EPC, no formal proposal was requested by the customer. This percentage is higher than in 1999, when 38 percent of customers declined formal proposals. Of the firms who had been solicited with an EPC, 11 percent negotiated and signed a contract, most of whom were in the 1,000 to 2,000 kW category (see Exhibit 6-39). Thus, a net total of 2.9 percent of customers reported signing a performance contract (25 percent approached x 11 of those offered signed.) The net market penetration of EPC is slightly lower than the 3.6 percent estimated for 1999.
Exhibit 6-39 Outcome of Performance Contract Solicitation (PC4B) (weighted)
Size in Peak kW 1999Response >500 >1000 >2000 Total Total Heard Presentation - No Proposal Requested 57% 40% 51% 49% 38% Asked for and Received Formal Proposal 13% 21% 39% 30% 35% Tried, but Failed to Negotiate Contract 10% 0% 6% 5% 6% Negotiated and Signed Contract 9% 32% 4% 11% 13% Don't Know/Refused 11% 7% 0% 3% 8%# Respondents 32 28 30 90 98
6.7.4 Reasons for Entering and Not Entering an EPC
Of the 13 firms that selected an EPC and provided reasons they did so, 5 cited the value of the energy savings provided, two each cited zero or very low first cost, internal approval criteria met, or a utility incentive offered. One respondent mentioned that they needed third-party assistance, and another that they liked the flexibility of an EPC.
Firms who decided not to enter an EPC gave two major reasons, either stating that the proposal did not meet their internal criteria (an overwhelming 44%), or that they did, but lacked the up-front funds to implement the project (26%). Nineteen percent of firms reported that they were not convinced by the third party of the estimated savings, while 12 percent said that they could do the project more cheaply in-house.

Quantum Consulting Inc. 6-26 Customer Market Survey Results
Exhibit 6-40 Reasons Customers Did Not Sign Performance Contract (PC5A) (weighted)
Size in Peak kW 1999Response >500 >1000 >2000 Total Total Not Convinced by Third Party 15% 33% 17% 19% 7% Did Not Meet Internal Criteria 30% 24% 53% 44% 16% Not Yet Decided 5% 0% 1% 2% 10% Lack of Funds 14% 11% 33% 26% 5% Not Necessary, Insignificant Savings 10% 0% 4% 4% 8% Inappropriate Timing 6% 0% 1% 2% 6% Can Do In-house or With Firm Without SPC 8% 24% 9% 12% 14% Other 24% 0% 5% 7% 31% Don't Know/Refused 0% 8% 0% 1% 4%# Respondents 26 17 29 72 81
Approximately 92 percent of the industrial mining firms, 48 percent of offices, 46 percent of institutional firms and 42 percent of other commercial firms reported that the proposal did not meet their internal criteria. Institutional and petroleum/plastics firms (56 and 54 percent respectively) were least likely to have the funds necessary to implement the proposed project. In the electronics industry, 55 percent of respondents said they were not convinced by the third party. Twenty-six percent of the Other Commercial facilities said they could implement the project in-house, without the help of a third party.
6.8 AWARENESS AND ASSESSMENT OF SPECIFIC TYPES OF ENERGY SERVICE PROVIDERS AND SERVICE OFFERS
The following subsection presents results of the respondents’ awareness and opinions of third-party providers and service offers. These efficiency market indicators were also benchmarked in the 1999 survey.
6.8.1 Energy Efficiency Services Offers
In the previous section we presented results of customers experience with a specific form of energy efficiency project (an EPC). We also asked customers whether they had received any kind of offer to improve energy efficiency. Almost three-quarters of the firms interviewed reported that they were solicited by a third-party to improve energy efficiency in 2002. This figure is significantly higher than the 55 percent efficiency solicitation rate reported in 1999. When examined by business type, petroleum (97 percent) and electronic/machinery (92 percent) were most likely, and other commercial were least likely (59 percent) to have been solicited.

Quantum Consulting Inc. 6-27 Customer Market Survey Results
Exhibit 6-41 Firm Solicited to Improve Energy Efficiency in Past Year (EO1) (weighted)
Size in Peak kW 1999Response >500 >1000 >2000 Total Total Yes 66% 74% 75% 73% 55% No 31% 23% 23% 25% 40% Don't Know 3% 3% 2% 2% 5%# Respondents 154 106 90 350 349
6.8.2 Credibility of Companies Providing Energy Efficiency Services
Electric utility distribution companies continue to be considered the most credible source of energy efficiency related information, as they were in the 1998 and 1999 surveys. When asked to rate the credibility of different sources of energy efficiency related information on a 0-to-10 point scale, the mean score for the local electric distribution utility was significantly higher at 7.6 than any of the other market actors’ scores. All of the scores, however, were lower than they were in 1999, perhaps reflecting customers’ concerns following the energy crisis and the Enron scandal.
Exhibit 6-42 Mean Rating of Credibility of Firms as a Source of Energy Efficiency Related Information
by Size (SP4A) (weighted)
Size in Peak kW 1999Response >500 >1000 >2000 Total Total Engineering/Architectural Design Firms 6.7 6.8 6.2 6.4 6.9 Energy Equipment Contractors/Installers 6.3 6.1 5.5 5.8 6.7 Energy Service Companies (ESCOs) 5.6 5.5 5.2 5.3 6.4 Local Electric Distribution Companies 7.5 7.6 7.6 7.6 8.4 Other Energy Service Providers (ESPs) 5.2 5.7 5.5 5.5 --Max # Respondents 153 105 89 347 280
Exhibit 6-43 reports the credibility rankings by business type. The pattern of scores is extremely stable across business types. Electronics firms appear to be particularly skeptical of the credibility of ESCOs and ESPs.

Quantum Consulting Inc. 6-28 Customer Market Survey Results
Exhibit 6-43 Mean Rating of Credibility of Firms as a Source of Energy Efficiency Related Information
by Business Type (SP4A) (weighted)
Business Type 1999Response Office Institut. Other C Electronic Mining PetroleumOther Ind Total Total Engineering/Architectural Design Firms 6.6 6.1 6.8 5.9 6.0 6.3 6.8 6.4 6.9 Energy Equipment Contractors/Installers 5.9 6.1 5.9 5.2 6.0 5.2 5.6 5.8 6.7 Energy Service Companies (ESCOs) 5.4 5.6 5.6 3.5 5.6 5.7 5.1 5.3 6.4 Local Electric Distribution Companies 7.5 7.9 7.6 7.0 8.0 8.1 7.1 7.6 8.4 Other Energy Service Providers (ESPs) 5.7 6.0 5.4 3.7 5.9 5.8 5.5 5.5 --Max # Respondents 50 49 87 38 31 32 60 347 280
6.9 COMMENTS AND SUGGESTIONS REGARDING ENERGY-EFFICIENT PRODUCT, PRACTICES, OR PROGRAMS
Finally, interviewees were asked whether they had any comments or suggestions regarding products, services, or programs that support energy efficiency or peak load reduction. Thirty-nine percent of those interviewed offered one or more comments. As would be expected, respondents provided a wide range of input, as shown in Exhibit 6-44. The most common suggestions were to improve the customer focus of programs, improve advertising and showcasing efficiency successes, to expand the breadth of programs, and to increase incentives. A number of respondents indicated they were already very pleased with programs and didn’t see much room for improvements. Many customers also took the opportunity to raise concerns over issues such as electricity prices and deregulation that were outside the scope of our question but are clearly areas of strong perceptions.
Exhibit 6-44 Large Customer Comments and Suggestions
(PR11) (Unweighted, multiples accepted)
SuggestionsPercent of
Sample
Percent of Those
Offering Comment
Better customer focus 6% 15%More/better information/advertising/showcasing 5% 14%Widen pool of programs/more flexible participation requirements 5% 14%Increase incentives 5% 12%None - Satisfied with programs 4% 10%Reduce electricity prices 4% 10%General criticisms of deregulation 2% 6%Better funding decisions/more funding 2% 6%Streamline participation processes 2% 5%Improve credibility of providers 2% 5%More third-party/gov't involvement 2% 4%Other general comments 7% 17%# of Respondents 138

Quantum Consulting Inc. A-1 Program Manager Interview Results
APPENDIX A PROGRAM MANAGER INTERVIEW RESULTS
Interviews were conducted with SPC program managers at Pacific Gas & Electric, San Diego Gas & Electric and Southern California Edison. This section summarizes topics covered in the interviews, including PY2002 program design and objectives, tracking data, promotion of the NSPC, market effects, and program administration.
PY02 PROGRAM DESIGN AND OBJECTIVES
Program managers mentioned only one significant change to program design, relating to measurement. PY02 was a transition period because SPC’s measurement approach was shifting from hybrid M&V/calculated to mainly calculated.
PY02 TRACKING DATA
No significant issues related to the tracking data.
PY02 PROMOTION OF THE NSPC
Program managers mentioned a variety of marketing methods: major Account Representatives, CD-ROMs, cut-sheets, utility website, mail, workshops (e.g. Industrial Strength seminars, broader-based energy efficiency workshops), participant mailings, kickoff meetings, expos and conferences, and the audit program. One program manager noted that extensive outreach was not necessary, as the PY02 program was fully subscribed very quickly. For this utility, the program was primarily marketed through account representatives.
PY02 MARKET EFFECTS
One program manager observed a positive effect in terms of energy and kW reduction. He noted that there was greater interest in PY02. The program was subscribed weeks after its launch, faster than PY01. In addition, there was a larger waiting list in 2002. One program manager noted that those wait listed in 2002 usually got into the program in 2003.
Program design changes resulted in two effects. First, there was significant movement toward self-sponsorship due to reduced program application requirements. Second, customized projects eclipsed lighting replacements as a result of the PY02 moratorium on lighting-only retrofits.
PY02 ADMINISTRATION
Organization. Administration, marketing and processing are typically handled in-house by the utilities. Technical support – application review and verification – is typically outsourced to contractors. SDG&E conducts its own engineering review. One IOU plans to streamline its tracking system with more form letters and automated interim milestones.
Project Application and Installation. The quality of applications has improved because the application process is more user-friendly. Applications from new applicants are often incomplete. One program manager estimated that half of applications come from new

Quantum Consulting Inc. A-2 Program Manager Interview Results
sponsors. The biggest omission on applications is typically the FAX ID and incomplete signatures in required places. Reviewers made more effort to resolve applications directly with the applicant before involving the IOU, which made approval logistics easier, according to one program manager. Program staff estimated that 85-95% of applications were approved. About 60% of projects are installed, according to one program manager. In some cases, customers haven’t notified the IOU that a project was installed. Projects were rejected for three primary reasons: measures were already installed, no energy savings resulted from the proposed projects, or the measure was ineligible.
June 1 installation requirement: Program managers offered several reasons as to why projects were not installed by the June 1, 2003 deadline. Delays result from delivery problems (deliveries that are late or wrong), funding problems (especially State of California projects), avoiding production shutdowns to install large specialized equipment, large companies that set project schedules independent of program deadlines and reservations for projects in the developmental phase that do not come to fruition. When projects drop out past the end of the program year, the money reverts to the 2002 waiting list. When projects drop out after the end of the PY2002 program year, funds revert to a general energy efficiency carryover account. Program staff did not see issues that arose from the installation lag beyond June 1, aside from the need to encourage customers to complete projects. Program staff did not support extending the required installation date past June 1.
Free ridership. One program manager estimated that half of applications come from repeat customers. Program staff try to screen as much as possible. One program manager questioned the method and results for the PY02 adopted net-to-gross ratio of 0.53 (the current adopted NTG is 0.70, from August 2003 CPUC Energy Efficiency Policy Manual).
Measurement and Verification. The current mix of calculated/measured varies across the IOUs. One estimates 90% calculated, 10% measured, justifying its emphasis on calculated savings by using conservative algorithms. In 2003, this IOU plans to expand the models to take into account more factors, resulting in greater savings. Likewise, another IOU was very satisfied with only 5% M&V, noting customers’ appreciation. It wants to keep impact evaluation after the fact. One IOU reported that M&V accounted for half its 2002 projects. This IOU leans toward M&V as it weighs risk against convenience, believing that vendors tend to oversell savings. This IOU would prefer a return to ex post impact evaluations and sampling, what they believe is a proven approach that worked pre-1998. Two IOUs noted the burdens of the PY1998/1999 1st and 2nd year M&V reports. Few of these projects went through the process smoothly. Some applicants deliberately changed M&V, while others overlooked the M&V requirement. As a result, the utility administrator was forced to police M&V between customers and troublesome ESCOs.
Measures. One program manager opposes limitations on participation with regard to measures or caps. Another suggests that it would be more fair to tie the incentive cap of $300,000 to size. Big projects are not getting needed funding due to the cap. One program manager noted that SPC provides more incentives than Express, and suggested remedying that inequity by adding a prescriptive element that is identical to Express. One program manager noted participation is sometimes hindered by incentive levels that are too low, such as at 10-15% of the capital cost.

Quantum Consulting Inc. B-1 Customer Dropout Results
APPENDIX B CUSTOMER DROPOUT RESULTS
One out of five applications submitted for California’s 2002 Nonresidential Standard Performance Contract (NSPC) Program were discontinued. This appendix provides results of interviews conducted for the analysis of projects under the 2002 California NSPC. This analysis explores why customers cancel projects, or “drop out”, how much energy savings are “lost”, and what can be done to improve the program’s project completion rate.
B.1 GENERAL CHARACTERISTICS OF UNSUCCESSFUL PROJECTS
This analysis was based on the 2002 NSPC tracking data available as of March 2003. The utilities provided information on all projects they had classified as cancelled, either due to the withdrawal of the application by the customer, or the inability to satisfy program requirements. Exhibit B-1 displays summary statistics for the unsuccessful projects.
Exhibit B-1 Summary Statistics for NR Cancelled Applications as of March 2003
PGE SCE SDGE Total
Number of cancelled applications 24 45 8 77
Number of unique customers represented 22 42 7 71
Number cancelled applications sponsored by EESP 2 9 6 17
Percent cancelled/accepted applications 16% 27% 18% 22%
Percent applications withdrawn by customer/sponsor 75% 76% 50% 73%
Percent applications rejected by utility 25% 24% 50% 27%
B.2 SAMPLE AND APPROACH
The initial target was to complete 20 interviews with customers who had dropped out of the 2002 NSPC by March 2003. However, we were able to complete interviews with 24 of the 71 customers (34 percent) whose applications had been cancelled. The surveys were completed in June of 2003. The survey length averaged 9 minutes via telephone.
B.2.1 Survey Disposition
As shown in Exhibit B-2, we achieved a relatively high response rate, at 50 percent, which allowed us to only contact a portion of the sample.

Quantum Consulting Inc. B-2 Customer Dropout Results
Exhibit B-2 Survey Disposition Statistics
PG&E SCE SDG&E Total
Total Sample (unique customers) 22 42 7 72
Percent sample contacted 86% 55% 100% 68%
Percent of contacts resulting in completes 47% 46% 57% 49%
Other Outcomes
Key contact out or did not return calls 32% 24% 43% 28%
Refusal 5% - - 1%
Bad number 5% 2% - 3%
B.2.2 Summary Statistics for Completed Surveys
Exhibit B-3 provides a summary of completed interviews by utility. As shown in Exhibit B-4, the average incentive for the cancelled projects was $46,603, with roughly 560,000 kWh savings. Only 7 respondents knew whether they had used calculated (6) or measured (1) savings.
Exhibit B-3 Tally of Completed Interviews
Utility Customers Interviewed
Cancelled Applications
EESP-sponsored applications
PG&E 9 13 2
SCE 11 11 2
SDG&E 4 5 3
Total 24 29 7
Exhibit B-4 Incentives and Savings for Completed Dropout Interviews
Total Average Number of
Projects
Incentives $932,054 $46,603 23
kWh savings 11,842,554 563,931 21
kW savings 1,559 130 12
Therm savings 834,180 417,090 2

Quantum Consulting Inc. B-3 Customer Dropout Results
In the application with no savings listed, the company chose to install a hydraulic injection molder instead of an electric injection molder as originally planned in the NSPC application. Note that these do not necessarily represent efficiency savings lost entirely, as some projects were completed anyway, with or without other funding. For more information, refer to the subsection on lost savings estimates below.
Exhibit B-5 shows that the majority of applications covered only a single project type. HVAC/R was more common than process or lighting projects. In all but one case, all submitted applications by a customer were discontinued. In the remaining case, one of three chiller applications proceeded.
Exhibit B-5 Project Type for Completed Dropout Interviews
Project Type Percent
Lighting only 21%
HVAC/Refrigeration only 33%
Process/Motors Only 25%
Lighting & HVAC/R 8%
Lighting & Process 4%
HVAC/R & Process 4%
Other 4%
Total 24
Exhibit B-6 categorizes the business type of the customers interviewed. Industrial sites were the most common, at 29 percent, followed by commercial and agricultural customers, each with 21 percent.
Exhibit B-6 Business Type of Customers Interviewed
Business Type Percent
Industrial 29%
Commercial 21%
Agricultural 21%
Institutional 17%
Other 13%
Total 24
Approximately 70 percent of respondents were able to estimate the size of their organization’s facility. In cases where they had multiple participating sites, Exhibit B-7 reports the average size of all of the participating sites.

Quantum Consulting Inc. B-4 Customer Dropout Results
Exhibit B-7 Square Footage of Interviewed Customer Facilities
Square Footage Percent
50,000 or less 0%
50,000 to 99,000 33%
100,000 to 249, 000 22%
250,000 to 499,000 17%
500,000 to 1 million 17%
Over 1 million 11%
Don’t know/refused 25%
Total 24
B.2.3 Comparison with Successful NSPC Program Participants
Unfortunately, the limited data available on the cancelled projects limits our ability for comparisons with the tracking data for the 2002 NSPC population as a whole. However, the results show that the cancelled projects are generally a representative mix of the successful projects. There appears to be no systematic bias toward project or customer type that leads to project cancellation.
B.3 SURVEY RESULTS
B.3.1 Reasons for Project Cancellation
Exhibits B-8 and B-9, on the next page, illustrate that customers where somewhat more likely to give NSPC program related factors than internal non-program reasons for discontinuing their NSPC applications (54 versus 46 percent, respectively).
The most common non-program factor was lack of capital budget or insufficient cash flow. The most common program factor was being waitlisted, which lead customers to pursue other incentives or install anyway. Dissatisfaction with the Program was not a factor for dropouts.

Quantum Consulting Inc. B-5 Customer Dropout Results
Exhibit B-8 Reasons for NSPC-Program Related Cancellations (n=24)
0%
5%
10%
15%
20%
25%
Waitlisted, gotother incentives
Measure declaredineligible
Waitlisted, installedanyway
Excessive M&Vrequirements
Utility couldn’tcalculate baseline
Installed early-miscommunication
Reasons for Programmatic Cancellations
Perc
ent o
f Can
celle
d Pr
ojec
ts
Exhibit B-9 Reasons for Non-Program Related Cancellations (n=24)
0%
5%
10%
15%
20%
25%
Lack of capitalbudget
Part of delayedlarger project
Changed projectscope
Insufficientpayback
w/incentives
Contractorproblems
Reasons for Non-Programmatic Cancellations
Perc
ent o
f Can
celle
d Pr
ojec
ts

Quantum Consulting Inc. B-6 Customer Dropout Results
B.3.2 Project Decision-Making
In order to assess the motivations of customers and related net-to-gross issues, we asked customers a series of questions regarding their decision making process. Exhibit B-10 reports the reasons given for initially pursuing installation of the measures included in the project. While customers sighted a variety of reasons for deciding to install the project, all said they did it to reduce their energy costs.
Exhibit B-10 Reason for Initiating Project Installation
Reason for installation (multiple responses accepted) Percent
To reduce energy costs 100%
To gain more control over how the equipment was used 17%
To improve measure performance 17%
To replace old or outdated equipment 13%
To protect the environment/reduce emissions 13%
To reduce operating costs 8%
To get a rebate from the program 4%
To allow remodeling, build-out, or expansion 4%
Other 13%
Total 24
Exhibit B-11 shows the significance of the NSPC Program incentives in the original decision to pursue the project.
Exhibit B-11 Significance of NSPC in Original Decision to Install
PD3 Percent
Very significant 33%
Somewhat significant 33%
Somewhat insignificant 13%
Very insignificant 17%
Don't Know 4
Total 24
As shown in Exhibit B-12, half of the customers have already installed the project, or the portion they plan to install. Another 13 percent reported that they may install within a year, while the remaining 38 percent have no plans to install the project in the foreseeable future.

Quantum Consulting Inc. B-7 Customer Dropout Results
Exhibit B-12 What Customers Did Instead
Did part of project
May do project
w/in year
Will not do project
Did entire project
N=24
B.4 ESTIMATES OF LOST SAVINGS
To calculate estimates of lost savings, we adjusted the original savings estimates with the information provided on whether the project proceeded anyway, without NSPC incentives. As shown in Exhibit B-13, the impact of savings lost due to cancelled applications is mitigated by the finding that half of the customers interviewed pursued all or part of the project without the NSPC incentives. This is consistent with net-to-gross findings from evaluations of the NSPC Program since its inception in 1998.
Exhibit B-13 Estimates of Savings Lost to the NSPC Due to Cancelled Applications
Total 2002 NSPC Savings
Estimates
Cancelled Project Savings
Estimates
% Savings Cancelled/Active
Applications
% Cancelled Projects pursued
Estimated NSPC Savings
Lost
GWh savings 239 56 23% 50% 28
Therm Savings (millions) 4.9 1.1 21% 50% 0.5
Exhibits B-14 and B-15 show graphical representations of the GWh and therm savings lost due to project cancellations.

Quantum Consulting Inc. B-8 Customer Dropout Results
Exhibit B-14 GWh Savings Lost
Lost9%
Savings91%
Exhibit B-15 Therm Savings Lost
(0.5 of 4.9 Mtherms lost)
Lost10%
Savings90%

Quantum Consulting Inc. B-9 Customer Dropout Results
B.4.1 Process-Related Issues
As presented in Exhibit B-16, the over-whelming majority of the customers say they are very likely to participate in the NSPC Program in the future. This supports the hypothesis that the Program processes as a whole are not a major factor in cancelled applications.
Exhibit B-16 Likelihood of Participating in the NSPC Program in the Future
Very likely75%
Very unlikely
4%
Don't know 8%
Somewhat likely13%
N=24
B.4.2 Additional Comments from Respondents
This subsection provides some additional background regarding the perceived strengths and weaknesses of the NSPC Program from respondents. Exhibit B-17 summarizes open-ended responses by interviewees concerning the strengths and weaknesses of the NSPC program that were post-coded.
While most of the comments are based on experiences with the 2002 program, it is the belief of evaluators that some of the comments -- especially those concerning the NSPC program's M & V requirements being too onerous – may be based on pre-2002 program experiences. However, the fact that these outdated impressions of the NSPC program still exist indicates that program managers may need to continue to emphasize the simplified M & V requirements and streamlined application forms of the current NSPC program."

Quantum Consulting Inc. B-10 Customer Dropout Results
Exhibit B-17 Respondent Comments on Program Strengths and Weaknesses
Strengths (multiple responses accepted) Percent
Positive experiences with utility staff 21%
Incentives important to reduce payback 25%
Easier process than in other years 8%
Weakness (multiple responses accepted) Percent
Not enough incentives available / ran out of funding 33%
Communication problems, insufficient support 17%
Excessive paperwork 17%
Incentive levels need to be changed 13%
Onerous M&V requirements 13%
Unjustified denial of project 4%
More marketing of program needed 4%
No additional comments provided 21%
Total 24
B.5 SECTION SUMMARY AND CONCLUSIONS
The NSPC program was well received by customers, overall. However, the speed with which the funding was fully subscribed in 2002 was the major systematic cause for program related cancellations as some customers got incentives from other programs or otherwise installed their projects while on the wait list. Other program-related reasons were either project specific or do not imply the need for revisions to the program. Fully half of the projects proceeded anyway, which is consistent with net-to-gross findings from other program years. It is also important to note that no clear profile of dropouts emerged that would imply any type of systematic bias toward cancellation of particular customer applications or project types.
Recommendations for future program years include:
�� No fundamental program design issues need to be addressed
�� Increase NR SPC funding
�� Update status of funding levels frequently
�� Continue communicating requirements clearly on streamlined M&V & paperwork.

APPENDIX C.1 CUSTOMER PARTICIPANT SURVEY

Appendix C.1.doc: Final
2002 Nonresidential SPC Study
FINAL End-User Participant Survey
Prepared for SCE by
Quantum Consulting and KEMA-XENERGY September25, 2003
Interview Tracking Information Survey Number Completion Date Interviewer Survey Length (min.)
Customer Information Company Name Street Address City, State, Zip
Contact Name Contact Title Phone Alt info (email, cell)
Database Application Information # of Appl. by Utility PGE SCE SDGE
Calculation Type � Calculated � M&V Unspecified in Database:
Status of Applications � All completed � M&V stage Other:
Sponsor Status � EESP � SELF � BOTH Name of EESP:
Site information � Single Site � Multi Site Notes:
Past Participant in SPC � 1998 � 1999 � 2000 � 2001
Interviewed previously � 1998 � 1999 � 2000 � 2001
Impact Data Collection Information Onsite Tracking # Onsite Surveyor Date of Onsite Onsite Interviewee Projects/Measures reviewed:
Installation status

2002 NRSPC End User Survey, Page 2 Survey ID ___ ___ ___
END-USER PARTICIPANT INTERVIEW GUIDE – POSSIBLE LEAD IN MATERIAL
May I please speak with [CONTACT__________________]? [Confirm this person is responsible for participation decision.] Hello, my name is ______ and I am calling about your participation in [UTILITY’s] Large Standard Performance Contract Program. I am with XENERGY, we are an energy research firm hired to conduct a interviews on behalf of the California Public Utilities Commission and with the cooperation of [your local utility]. We are interviewing firms that participated in the 2002 Large Standard Performance Contract program to discuss a number of topics about the program. We have already visited your site to get information on the measures installed and following up to gain information on the decision making process. [We spoke to [Onsite Interviewee Name] on [date of onsite].] Your input to this research is extremely important. The interview will take approximately 20 minutes [or longer] and any information that is provided will remain strictly confidential. We will not identify or attribute any of your comments or organization information. Is this a good time, or can we schedule a convenient time in the next couple of days to talk? IF HESITANT: It is important that we speak with the same customers who participated in the first phase of the evaluation to be able to match the data collected onsite with the information we will request today. Your input to this survey is very important for ensuring the long-term success of these programs. Without input from the participants, we will have difficulty conducting a fair and complete evaluation of the program. Thank you for taking part in this survey. The major purposes of this study are
(1) to obtain feedback on the design and administrative aspects of the program, and (2) to understand the characteristics of participants in the program and the types of activity the program has generated. This interview is focused on experiences with the program to date.
[If they request a contact at their local utility, the following are the appropriate MAE representatives, not the program managers] PGE Betsy Krieg 415-973-0580 SCE Pierre Landry 626-302-8288 SDGE Henry De Jesus 858-654-1723 CPUC Eli Kollman 415-703-5649

2002 NRSPC End User Survey, Page 3 Survey ID ___ ___ ___
RESPONDENT INFORMATION [ONLY ASK IF HAVE NOT ALREADY BEEN ANSWERED AT ONSITE INTERVIEW.] RI1. First, I’d like to confirm the following information regarding your application. RI1m. Could you please describe your role (regarding your firm’s participation in the
NRSPC Program)? ________________________________________________________________
[BASED ON DATABASE DETERMINE IF SINGLE OR MULTI-SITE NRSPC APPLICATION] RI2. How many applications did you submit under the 2002 NRSPC Program? a._________ b. Are any still active (in M&V stage, or waiting for final payments)? Yes ............................................................................................... 1 No................................................................................................. 2 Don’t Know/Refused [CONFIRM RIGHT CONTACT] ............... 99 c. If so, what stage are they at?________________________________ RI3. Were any cancelled? Yes ............................................................................................... 1 No................................................................................................. 2 Don’t Know/Refused [CONFIRM RIGHT CONTACT] ............... 99 b. **If any cancelled probe reason(s)** _____________________________________________________________________
__________________________________________________________________________________________________________________________________________
RI3c. Are any of the 2002 NRSPC measures still waiting to be installed? Yes ............................................................................................... 1 No................................................................................................. 2 Don’t Know/Refused 99 d. If any not yet installed probe reason(s) [original deadline was 6/1/03] _____________________________________________________________________
__________________________________________________________________________________________________________________________________________
**IF SELF-SPONSOR ASK RI4, IF EESP SPONSOR ASK RI5, IF COMBO ASK BOTH** RI4. According to our records, you are your own sponsor for your 2002 NRSPC project(s) :
Is this information correct? Yes ............................................................................................... 1 SKIP TO EC1 No, information appears incorrect ............................................... 2 ASK RI5 Don’t Know / Refused [CONFIRM RIGHT CONTACT] ............. 99

2002 NRSPC End User Survey, Page 4 Survey ID ___ ___ ___
RI5. According to our records, the energy services firm that sponsored your NRSPC
program application is: STATE SPONSOR NAME [FROM DATABASE] Is this information correct?
Yes ............................................................................................... 1 No................................................................................................. 2 Don’t Know / Refused [END, CONFIRM RIGHT CONTACT].... 99 IF NO, ENTER CORRECT EESP NAME:_______________ ____
ESTABLISHMENT CHARACTERISTICS
[ONLY ASK IF HAVE NOT ALREADY BEEN ANSWERED IN AN ONSITE INTERVIEW.] I’d like to ask you a few questions about your organization . EC1. What is the primary business of the company/organization? [CHECK APPROPRIATE CODE] __ Comm __ Ind __Inst __ Agric __ Other
[ENTER VERBATIM]____________________________________________________
EC2. [IF SINGLE-SITE PARTICIPANT ASK] Approximately how large is your
organization’s space in this facility? [ELSE IF MULTI-SITE ASK] What is the average size of your organization’s space among participating facilities? ___________sq. ft.
CODE 98 FOR DON’T KNOW; 99 FOR REFUSED, ROUGH ESTIMATE IS OK EC3. Does your organization..... Own and occupy........................................................................... 1 SKIP TO EC5 Lease from others ........................................................................ 2 Other ............................................................................................ 3
Don’t Know ................................................................................ 98 SKIP TO EC5 Refused ...................................................................................... 99 SKIP TO EC5
EC4 (For these participating facilities,) does your organization pay its own electric bill
directly to [PG&E/ SCE / SDG&E] or is electricity provided by the owner under your lease arrangement?
Pay own electric bill ...................................................................... 1 Part of the lease arrangement...................................................... 2 Some sites pay own bill, other sites part of lease......................... 3 [ACCEPT EC4=3 ABOVE ONLY IF RI2=2] EC5 [IF SINGLE-SITE PARTICIPANT (RI2=1) ASK] What is your best estimate of your average monthly electric bill at this facility? [ELSE IF MULTI-SITE (RI2=2), ASK] What is your best estimate of your average monthly total electric bill across all
participating sites? Would you say it is...

2002 NRSPC End User Survey, Page 5 Survey ID ___ ___ ___
EC5b [If there are gas measures, ask for average monthly total gas bill] ........................................................................................ electricity gas < $10,000........................................................................................... 1 1 $10,000 - $99,999.............................................................................. 2 2 $100,000 - $499,999.......................................................................... 3 3 $500,000 - $999,999.......................................................................... 4 4 > $1,000,000...................................................................................... 5 5 Don’t know.................................................................................. 98 98 Refused ...................................................................................... 99 99 EC6. On how many sites does the organization operate?
Number of sites ............................................................................ # Don’t Know ................................................................................ 98 Refused ...................................................................................... 99
EC7a. How many employees are in your organization, overall?
Number of employees .................................................................. # Don’t Know ................................................................................ 98 Refused ...................................................................................... 99
EC7b. How many employees are at the location/participating site(s)?
Number of employees .................................................................. # Don’t Know ................................................................................ 98 Refused ...................................................................................... 99
THIRD-PARTY FIRMS
[ONLY ASK IF HAVE NOT ALREADY BEEN ANSWERED IN AN ONSITE INTERVIEW.] **IF SELF-SPONSOR ASK PE1, EESP SPONSORS SKIP TO NEXT SECTION ** PE1a. Are you receiving assistance third party firms to implement the 2002 NRSPC project? Yes ............................................................................................... 1 No................................................................................................. 2
Don’t Know/Refused................................................................... 99
PE1b. Could you please specify the Name of the firm(s) Primary Firm 1_____________________ Secondary Firm 2_____________________
PE1c. And what was their role? (how significant were they in your decision to do the project?) Did they provide…. [select one] � Sponsorship of project application � Significant decision-making assistance (e.g. advice on design, specification) � Limited assistance (e.g. only installation of equipment)

2002 NRSPC End User Survey, Page 6 Survey ID ___ ___ ___
Notes: _____________________________________________________________________ _____________________________________________________________________
_____________________________________________________________________
FOR SELF-SPONSORS, DECIDE HERE IF THEY ARE SELF-SPONSORS DOING ALL WORK THEMSELVES OR SELF-SPONSORS WITH SIGNIFICANT HELP IN THE DECISION MAKING PROCESS.

2002 NRSPC End User Survey, Page 7 Survey ID ___ ___ ___
NRSPC PARTICIPATION - ID/CONFIRM MEASURES
DISCUSS WITH INTERVIEWEE THE MEASURES YOU ARE GOING TO ASK QUESTIONS ABOUT AS PER THE MEASURES INVESTIGATED AT THE ONSITE VISIT. FIRST PRIORITY IS TO CONDUCT THE NET-TO-GROSS BATTERY FOCUSED ON THE END USE PROJECTS SELECTED AS “PRIMARY” FOR THE ON-SITE IMPACT EVALUATION. [DETERMINE WHETHER THEY OR SOMEONE ELSE IS THE MORE APPROPRIATE PERSON TO ANSWER THE QUESTIONS. IF NECESSARY, CONDUCT ADDITIONAL INTERVIEWS WITH OTHERS TO ACCURATELY ANSWER THE QUESTIONS ON THE FOLLOWING PAGES.] WHEN MULTIPLE END USES ARE PRESENT FIND OUT IF DECISION MAKING PROCESS DIFFERED BY MEASURE. – IF DIFFERS, FIRST ADDRESS “PRIMARY” END USE FROM SAMPLE PLAN. IF POSSIBLE, OPTAIN RESPONSES FOR OTHER SECONDARY OR TERTIARY END USE PROJECTS, BUT NOT AT EXPENSE OF REMAINDER OF INTERVIEW . Sample Text: My understanding that you are doing [End Use/Measure X] and [End Use/Measure Y], is that correct? Ok, for the next series of questions we are going to focus on [Measure X] which has the larger incentives.]
List Measures by type, Describe as Necessary. Or attach and reference sheet with measures currently tracked in program database. [MEASURE DETAIL TO BE PROVIDED BY ON-SITE TEAM] 1. 2. 3. 4.

2002 NRSPC End User Survey, Page 8 Survey ID ___ ___ ___
PROGRAM-RELATED DECISION MAKING SECTION - NET-TO-GROSS
[INFORM THE INTERVIEWEE THAT THE FOLLOWING QUESTIONS PERTAIN TO THE PARTICULAR ENERGY EFFICIENCY EQUIPMENT INSTALLED AS PART OF THE 2002 NRSPC PROGRAM. REMIND AS NEEDED WHICH MEASURE(S) YOU ARE ADDRESSING. ASK THEM TO LET YOU KNOW IF THE RESPONSES VARY BY EQUIPMENT TYPE. USE MULTIPLE COLUMNS FOR ANSWERS IF ANSWERS VARY BY EQUIPMENT TYPE FOR THIS SECTION.]
PD1a Why did you decide to install Program-Related Equipment? [DO NOT READ]
To replace old or outdated equipment.......................................... 1 To allow remodeling, build-out, or expansion ............................... 2 To gain more control over how the equipment was used. ............ 3 To improve measure performance ............................................... 4 To get a rebate from the program ................................................ 5 To protect the environment .......................................................... 6 To reduce energy costs ................................................................ 7 To reduce energy demand/likelihood of blackouts ....................... 8 To respond to the energy crisis .................................................... 9 To acquire the latest technology................................................. 10 Don’t Know/Refused................................................................... 99 Other .......................................................................................... 77 PD1a1. Describe________________________ ....................................
PD1b Which of the following statements best describes the performance and operating condition of the equipment you replaced as part of the 2002 program?
New equipment installed, did NOT replace pre-existing equipment 1 Existing equipment was fully functional .......................................... 2 Existing equipment was fully functioning, but with significant problems 3 Or, existing equipment had failed or did not function. .................... 4 Not applicable, ancillary equipment (VSD, EMS, controls, etc.)….. 5 Don’t Know/Refused....................................................................... 9 Other_________ PD1b1. Describe________________________ 7

2002 NRSPC End User Survey, Page 9 Survey ID ___ ___ ___
PD2 If this is the first time you’re installing Energy Efficiency Equipment, where did you first hear about it (or have you installed it before)? [READ ONLY AS NEEDED]
1 Contractor 2 Architect / Engineer 3 Equipment Vendor 4a PG&E representative or program literature (confirm, regulated distribution co.) 4b SCE representative or program literature (confirm, regulated distribution co.) 4c SDG&E representative or program literature (confirm, regulated distribution co.) 5 Other non-utility literature, including trade publications 6 Self-knowledge / Education 7 Business colleague / Professional association / Trade show 8 From parent company 9 Previous installation 10 Energy Services Company, often referred to as ESCOs (performance contract) 11 An unregulated company that provides electricity supply 12 Energy Efficiency Program (non-utility) 11 OTHER [SPECIFY, OK TO PUT NAME OF COMPANY]
_____________________________________________________________ 12 DON’T KNOW / REFUSED
PD3 How did you first learn of the NRSPC Program? [DONT READ CHOICES; PROBE IF SAME SOURCE AS PD2] CIRCLE CLOSEST CATEGORY
Specify name of company/source:_______________________________________ 1 Contractor 2 Architect / Engineer 3 Equipment Vendor 4a PG&E representative or program literature (confirm, regulated distribution co.) 4b SCE representative or program literature (confirm, regulated distribution co.) 4c SDG&E representative or program literature (confirm, regulated distribution co.) 5 Other non-utility literature, including trade publications 6 Self knowledge/Education 7 Business colleague / Professional association / Tradeshow 8 From parent company 9 Previous participation in NRSPC 10 Energy Services Company, often referred to as ESCOs 11 An unregulated company that provides electricity supply 12 Energy Efficiency Program (non-utility) 11 OTHER [SPECIFY, OK TO PUT NAME OF COMPANY]
_____________________________________________________________ 12 DON’T KNOW / REFUSED

2002 NRSPC End User Survey, Page 10 Survey ID ___ ___ ___
[FOR THE FOLLOWING QUESTIONS, FOCUS ON THE SPECIFIC EQUIPMENT WITH THE EFFICIENCY LEVEL INSTALLED THROUGH THE PROGRAM]
R1x Did you hear about the financial assistance available from the NRSPC program BEFORE
or AFTER you began to actually look at or collect information about the Energy Efficient Equipment)? Was it …
1 BEFORE you first looked at installing the equipment 2 SAME TIME 3 AFTER had begun researching the equipment, but before final decision 4 AFTER had decided to install the equipment 5 DON’T KNOW / REFUSED TO ANSWER
PD4c Which of the following best describes the process by which you decided to install the Energy Efficiency Equipment?
1 Developed the idea ourselves and decided solely on our own to pursue installation
2 Developed the idea ourselves but were convinced by a third-party to pursue installation 3 Received the idea from a third-party and were also convinced by this party to pursue installation 4 Received the idea from a third-party but decided on our own to pursue installation
5 Other ➨ PD4c1. Describe__________________________________ 9 DON’T KNOW / REFUSED
[RECORD ANY EXPLANATORY COMMENTS] __________________________
__________________________________ ______________________________
REMIND AS NEEDED WHICH MEASURE(S) YOU ARE ADDRESSING.

2002 NRSPC End User Survey, Page 11 Survey ID ___ ___ ___
**IF SELF-SPONSOR DOING ALL WORK THEMSELVES, SKIP TO PD6c, IF SELF SPONSOR WITH EESP HELP, SKIP TO PD6a, ELSE CONTINUE**
PD4d. Who initiated contact? Did SPONSOR approach you or did you approach them to discuss installing the Energy Efficiency Equipment?
1 Customer initiated contact 2 EESP initiated contact 3 Other ➨ PD4d1. Describe _____________________________________ 9 DON’T KNOW / REFUSED
PD5b. Which of the following statements best describes the arrangement you have with SPONSOR with respect to allocation of the financial incentives from the NRSPC program? [READ LIST AND SELECT ONLY ONE]
Program incentives will be used by your organization .................... 1 Program incentives will be used by your NRSPC Project Sponsor 2 Program incentives will be split between your organization and your NRSPC Project Sponsor, or you are receiving a reduced fee? ...... 3 Other ______________________________ ................................. 4 Don’t know...................................................................................... 98 Refused .......................................................................................... 99
PD6a. How significant was the overall value of the services provided by SPONSOR/FIRM in
influencing your decision to install the Energy Efficiency Equipment? Would you say the value of their services was very significant, somewhat significant, somewhat insignificant or very insignificant? [RECORD PD6a and PD6b BY MEASURE OR END USE IF NEEDED]
Very significant ............................................................................... 1 Somewhat significant...................................................................... 2 Somewhat insignificant................................................................... 3 Very insignificant ............................................................................ 4 Don’t know...................................................................................... 98 Refused .......................................................................................... 99
PD6b. Please describe the specific ways in which SPONSOR/FIRM contributed, if at all, to
your decision to install the Energy Efficient Equipment? _____________________________________________________________________
_____________________________________________________________________
_____________________________________________________________________
REMIND AS NEEDED WHICH MEASURE(S) YOU ARE ADDRESSING.

2002 NRSPC End User Survey, Page 12 Survey ID ___ ___ ___
PD6c. How significant was the NRSPC program financial incentive in influencing your decision to install the Energy Efficiency Equipment? Would you say the program’s financial incentive was very significant, somewhat significant, somewhat insignificant or very insignificant?
Very significant ...................................................................................... 1 Somewhat significant............................................................................. 2 Somewhat insignificant.......................................................................... 3 Very insignificant ................................................................................. 4 Don’t know........................................................................................... 98 Refused ................................................................................................. 99
PD6d. [Please explain]
_____________________________________________________________________
_____________________________________________________________________
_____________________________________________________________________ R3 Was your organization considering any other (competing) energy efficiency investments
at the same time as you were considering the Energy Efficiency Equipment, that was not pursued? (Did you have to decide between multiple measures?)
Yes R3a SPECIFY 1 No 2 SKIP TO PD7a DON’T KNOW / REFUSED TO ANSWER 9 SKIP TO PD7a R4 Why was the Energy Efficiency Equipment chosen over these other investments? ___________________________________________________________________________________ ___________________________________________________________________________________ PD7a. Without the NRSPC program, [READ NEXT CLAUSE FOR CUSTS WORKING WITH 3rd PARTY FIRMS:] including both the incentive and the contribution from SPONSOR/FIRM, how likely is it you would have installed the Energy Efficient Equipment? Would you say that you…
1 Definitely would NOT have installed SKIP TO PD 9a 2 Probably would NOT have installed SKIP TO PD 9a 3 Probably would have installed 4 Definitely would have installed 9 DON’T KNOW / REFUSED

2002 NRSPC End User Survey, Page 13 Survey ID ___ ___ ___
PD8 Without the NRSPC program, how likely is it that the equipment you purchased would have been as energy efficient as the equipment you did install? Would you say . . .
1 Probably NOT as efficient 2 Probably as efficient 3 Not applicable for measure (e.g. VSD) 4 Less energy efficient equipment would have been installed (e.g. fewer sites) of
the same efficiency 9 DON’T KNOW / REFUSED
PD8b Without the NRSPC program, would you have installed the Energy Efficient Equipment at about the same time as currently planned or over a year later?
1 within 6 months of when it actually was installed?
2 6 months to one year later?
3 one to two years later?
4 two to three years later? SKIP TO PD10a
5 three to four years later? After any response 6 four or more years later?
7 Never 9 DON’T KNOW / REFUSED TO ANSWER
PD9a Without the NRSPC program, [READ NEXT CLAUSE FOR CUSTS WORKING WITH 3rd PARTY FIRMS:] including both the incentive and the contribution from SPONSOR, what type of equipment would you have most likely installed? Would you say. . .
1 Standard efficiency equipment 2 Equipment with above-standard efficiency but with lower efficiency than the
equipment that was actually installed 3 Would not have installed anything 9 DON’T KNOW / REFUSED
PD9b Would you have installed the Energy Efficient Equipment at a later date? (How many years later?) [If over 1 year later, probe for best estimate of how many years later.]
1 within 6 months of when it actually was installed?
2 6 months to one year later?
3 one to two years later?
4 two to three years later?
5 three to four years later?
6 four or more years later?
8 Never
9 DON’T KNOW / REFUSED TO ANSWER

2002 NRSPC End User Survey, Page 14 Survey ID ___ ___ ___
PD10a. Does your organization apply long-term investment analysis to energy equipment
selection such as estimates of payback periods, life cycle costs (LCC) or internal rate of return (IRR)?
Yes ............................................................................................... 1 No................................................................................................. 2 SKIP TO PD12a Don’t Know/Refused................................................................... 99 SKIP TO PD12a PD10b. And, typically, how many years or less must the project payback be? _______ [TRY TO FORCE ANSWER IN PAYBACK TERMS EVEN IF IRR OR LCC USED]
PD12a. Have you calculated the payback(s) or used other ‘financials’ for these projects? Yes..................................................................................................... 1 No ..................................................................................................... 2 SKIP TO P1 Don’t Know/Refused ........................................................................ 99 SKIP TO P1
PD 12b And what do you estimate the payback(s) would have been with OR without the incentives?
ADD MORE LINES IF NEEDED BY MEASURE OR END USE 12.b.1 Payback with Incentives ______ 12.b.2 Payback without Incentives ______ Don’t Know/Refused_______
[CODE AS DON’T KNOW IF CANT GIVE WITHOUT CALCULATING]
ENERGY CRISIS EFFECTS
Now I would like to ask you a few questions about the State’s energy crisis in 2001.
P6a Did California’s 2001 energy crisis affect your decision to install this equipment? If so, how?
___________________________________________________________________________________ ___________________________________________________________________________________
P6b What, if any, other energy efficiency OR demand reduction actions have you taken in the past year in response to the energy crisis?
___________________________________________________________________________________ ___________________________________________________________________________________

2002 NRSPC End User Survey, Page 15 Survey ID ___ ___ ___
SPILLOVER
Now I would like to ask you a few questions about other energy efficiency measures you may have installed since deciding to particiate in the 2002 SPC Program for the [Measures]. R1 Have you installed any other high efficiency equipment since you participated in the
2002 SPC Program that was not part of the 2002 program or any other utility or government energy efficiency incentive program?
Yes.................................................................... 1 Yes, we submitted for 2003 NRSPC ................. 2 SKIP TO NS1 No ..................................................................... 3 SKIP TO NS1 DON’T KNOW/REFUSED................................. 9 SKIP TO NS1
R2 What type(s) of measures were added, and how many?
_____________________________________________________________________ _____________________________________________________________________
R3 [If unclear, ask.] Was this additional equipment high efficiency? (Probe as necessary to
ensure equipment was high efficiency?)
Yes, high efficiency ........................................... 1 No, standard efficiency...................................... 2 SKIP TO NS1 DON’T KNOW/REFUSED................................. 9 SKIP TO NS1
R4 How significant was your experience in the 2002 NRSPC program in your decision to install the additional energy efficiency equipment (that was not part of the program)? [CLARIFY PROGRAM EXPERIENCE REFERS TO ALL FEATURES INCLUDING INCENTIVES, M&V, EXPERIENCE WITH ESCOs THAT WOULD NOT HAVE OCCURRED OTHERWISE, ETC.]
Extremely significant..................................................................... 1 Somewhat significant.................................................................... 2 Somewhat insignificant................................................................. 3 Extremely insignificant.................................................................. 4 Don’t Know/Refused................................................................... 99
And why is that? (Point here is to try to establish whether there is any causal relationship between experience in the program and installation of additional measures outside of programs.)
_____________________________________________________________________ R5 Why didn’t your organization purchase this equipment through a retrofit or incentive
program? _________________________________________________________________________

2002 NRSPC End User Survey, Page 16 Survey ID ___ ___ ___
NS1 Do you plan to implement any additional energy efficiency measures elsewhere at this
facility or at other facilities of your organization in the future as a result of your participation in the PY2002 NRSPC program?
Yes, plans more measures as result of participation.................... 1 Yes, plans more measures, NOT as a result of participation ....... 2 No, no plans for more measures .................................................. 3 SKIP TO MV1 Don’t Know/Refused................................................................... 99 SKIP TO MV1
NS2 PROBE: How has program participation affected your plans? Please describe which
measures, how many, and why?
_____________________________________________________________________
_____________________________________________________________________
_____________________________________________________________________ NS3 And how significant was your 2002 NRSPC program experience in your plans to
pursue additional energy efficiency measures? [CLARIFY PROGRAM EXPERIENCE REFERS TO ALL FEATURES INCLUDING INCENTIVES, M&V, EXPERIENCE WITH ESCOs THAT WOULD NOT HAVE OCCURRED OTHERWISE, ETC.]
Extremely significant..................................................................... 1 Somewhat significant.................................................................... 2 Somewhat insignificant................................................................. 3 Extremely insignificant.................................................................. 4 Don’t Know/Refused................................................................... 99
NS4 Do you plan to apply for program incentives (SPC or Express or other) for assistance in installing this additional energy efficient equipment?
Yes, Already have ....................................................................... 1 Yes, Probably ............................................................................... 2 Undecided .................................................................................... 3 SKIP TO MV1a
No................................................................................................. 4 SKIP TO MV1a

2002 NRSPC End User Survey, Page 17 Survey ID ___ ___ ___
NRSPC PROCESS-RELATED EXPERIENCE
P2 What do you like about the 2002 NRSPC program? (what do you view as the primary
strengths?)
_____________________________________________________________________
_____________________________________________________________________
_____________________________________________________________________
P3 What don’t you like about the program? (what do you view as the primary features that
need to be improved?)
_____________________________________________________________________
_____________________________________________________________________
_____________________________________________________________________
P4 What do you think about the current incentive structure of the program? (Such as the
payout schedule, end use incentive levels, cap on percent of project costs paid by incentives, incentive levels for measured vs. calculated savings)
_____________________________________________________________________
______________________________________________________________________________
______________________________________________________________________________
P5a Please describe your experiences with the payment process for your NRSPC projects.
Are payment procedures and timing of payments reasonable? Yes .............................................................................................. 1 No ................................................................................................ 2 Don’t Know/Refused 99
P5b. Please explain. _____________________________________________________________________
______________________________________________________________________________
______________________________________________________________________________
P6 Did you use any of the program tools and supporting materials, such as the savings
calculator or the website?
P6a. Used calculator? Yes .............................................................................................. 1 No ................................................................................................ 2 Don’t Know/Refused................................................................... 99
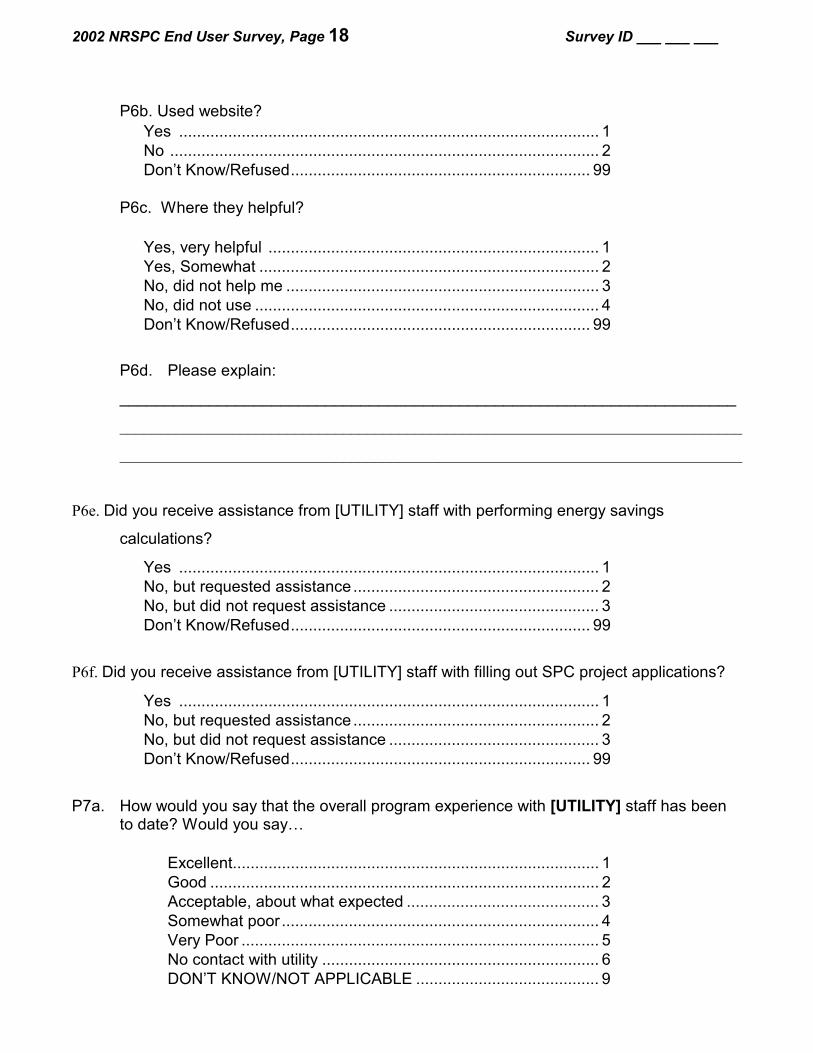
2002 NRSPC End User Survey, Page 18 Survey ID ___ ___ ___
P6b. Used website? Yes .............................................................................................. 1 No ................................................................................................ 2 Don’t Know/Refused................................................................... 99
P6c. Where they helpful?
Yes, very helpful .......................................................................... 1 Yes, Somewhat ............................................................................ 2 No, did not help me ...................................................................... 3 No, did not use ............................................................................. 4 Don’t Know/Refused................................................................... 99
P6d. Please explain:
_____________________________________________________________________
______________________________________________________________________________
______________________________________________________________________________
P6e. Did you receive assistance from [UTILITY] staff with performing energy savings
calculations?
Yes .............................................................................................. 1 No, but requested assistance ....................................................... 2 No, but did not request assistance ............................................... 3 Don’t Know/Refused................................................................... 99
P6f. Did you receive assistance from [UTILITY] staff with filling out SPC project applications?
Yes .............................................................................................. 1 No, but requested assistance ....................................................... 2 No, but did not request assistance ............................................... 3 Don’t Know/Refused................................................................... 99
P7a. How would you say that the overall program experience with [UTILITY] staff has been to date? Would you say…
Excellent.................................................................................. 1 Good ....................................................................................... 2 Acceptable, about what expected ........................................... 3 Somewhat poor ....................................................................... 4 Very Poor ................................................................................ 5 No contact with utility .............................................................. 6 DON’T KNOW/NOT APPLICABLE ......................................... 9

2002 NRSPC End User Survey, Page 19 Survey ID ___ ___ ___
P7b. Why do you say that? [RECORD VERBATIM]
P7c. What, if any other types of assistance that the [UTILITY] staff could provide that would
be useful to you? [What else could they have done?] _____________________________________________________________________
______________________________________________________________________________
______________________________________________________________________________
P8. Did you work directly with one of the utilities’ technical support contractors during your
project? (Clarify if necessary, the firms contracted with the utility to review applications, estimate savings, assist with M&V planning, and perform site visits. Nexant SBW Engineering or ASW Engineering; SDG&E used internal staff only)
Yes .............................................................................................. 1 No ................................................................................................ 2 Don’t Know/Refused................................................................... 99
P9a. How would you say that your experience with the [UTILITY] technical assistance
contractor has been to date? Would you say…
Excellent.................................................................................. 1 Good ....................................................................................... 2 Acceptable, about what expected ........................................... 3 Somewhat poor ....................................................................... 4 Very Poor ................................................................................ 5 No contact with technical support contracotr........................... 6 DON’T KNOW/NOT APPLICABLE ......................................... 9
P9b. Why do you say that? [RECORD VERBATIM]
P10Aa. If you have participated in the NRSPC program with more than one utility, did you
notice any differences in how the program was designed or administered by those utilities?
P10b. Please elaborate [make sure to specify what utilities are discussed and assign the comments correspondingly.] _____________________________________________________________________
______________________________________________________________________________
______________________________________________________________________________

2002 NRSPC End User Survey, Page 20 Survey ID ___ ___ ___
P11. How would you rate your OVERALL satisfaction with the 2002 NRSPC program? Would you say that you are:
Very Satisfied.......................................................................... 1 Somewhat Satisfied ................................................................ 2 Neither Satisfied nor Dissatisfied ............................................ 3 Somewhat Dissatisfied............................................................ 4 Very Dissatisfied ..................................................................... 5 No contact with technical support contractor........................... 6 Don’t Know/Not Applicable...................................................... 9
P12 Has your company participated in an SPC program in prior years? (If yes,) in what
year(s)?
1998__ 1999___ 2000___ 2001___
Yes (check years above)......................................................... 1 No, did not participate in SPC previously ............................... 2 SKIP TO NS3 DON’T KNOW/NOT APPLICABLE ......................................... 9
P13 How has your experience this year differed from past experiences with the program?
what features or aspects of the program do you think are better or worse from previous years, if any?
PROGRAM NON-SPONSORS EXPERIENCE WITH 3RD PARTY FIRMS
THIS SECTION FOR CUSTOMERS WORKING WITH 3rd PARTY FIRMS ON 2002 NRSPC **SELF-SPONSORS DOING ALL WORK THEMSELVES SKIP TO NS6 ON NEXT PAGE** NS3 Had you worked with SPONSOR/FIRM before you participated in the Program?
Yes .............................................................................................. 1 No ................................................................................................ 2 Don’t Know/Refused................................................................... 99

2002 NRSPC End User Survey, Page 21 Survey ID ___ ___ ___
NS4a [For the purposes of this survey, we are defining Energy Performance Contracting as follows: a retrofit or new construction project in which energy savings are measured and verified (based on assumptions regarding the level of operations and the cost of energy being saved) and the company performing the work is paid only from total dollar savings actually produced by the project.]
Would you describe your contractual arrangement with SPONSOR/FIRM as an energy
performance contract, fee for service contract or something else? [DO NOT READ]
Energy performance contract ....................................................... 1 Shared savings (cust has some risk) ...................................... 2 Guaranteed savings (EESP has all risk) ................................. 3 Fee-for-service/equipment contract.............................................. 4 Combination: performance contract & fee-for service .................. 5 EESP paid from incentives........................................................... 6 Part of larger service contract....................................................... 7 Other (please describe below) .................................................. 8 Don’t Know/Refused................................................................... 99
NS4b [If not clear, ask them to describe Contract]:
___________________________________________________________
___________________________________________________________
NS4c. And why did you choose a contract with a performance element for this project(s)? [DON’T READ LIST]
Uncertainty over estimates of savings......................................... 1 Didn’t trust EESP ........................................................................ 2 EESP only offered to do work under performance contract ........ 3 Lack of access to capital, needed EESP to finance.................... 4 Wanted to share risk with third-party........................................... 5 Able to use energy-efficiency savings to make equipment/ facility upgrades that wouldn’t be possible otherwise.................. 6 Other SPECIFY BELOW............................................................. 7
NS4d. [DESCRIBE VERBATIM AS NECESSARY]:
_____________________________________________________________________
NS6a. Were any of the energy-efficiency products, services, opportunities or M&V approaches
[provided by the FIRM(s)] you worked with on your 2002 NRSPC project(s) new to you at the time they were offered? (Were there any you had not been aware of?)
Yes .............................................................................................. 1 No ................................................................................................ 2 Don’t Know/Refused................................................................... 99

2002 NRSPC End User Survey, Page 22 Survey ID ___ ___ ___
NS6b. Please elaborate. [CLARIFY IF UNDER PROGRAM OR NOT]
_____________________________________________________________________
_____________________________________________________________________
NS7. Do you plan to do future work with FIRM(s) as a result of your experience with them as part of the PY2002 NRSPC?
Yes .............................................................................................. 1 No ................................................................................................ 2 Don’t Know/Refused................................................................... 99
. Please elaborate.
_____________________________________________________________________
_____________________________________________________________________
2002 CALCULATED VS. M&V RELATED EXPERIENCE
Now I’d like to go into some more detail about your organization’s experience with the Calculated Savings or Measurement and Verification requirements and results. MV1a Does your application use the calculated, or measured savings option for M&V?
Calculated savings ....................................................................... 1 Measured savings ........................................................................ 2 Combination, Specify_________________________ ................. 3 Has not yet been determined ....................................................... 4 Don’t Know / Refused................................................................. 99
MV1b Why was this option used? (Select all that apply)
EESP recommended it ................................................................. 1 Utility recommended it .................................................................. 2 Utility required it, (Only option available for measure(s)) .............. 3 Easiest option............................................................................... 4 Measured savings not worth the hassle/cost................................ 5 Wanted savings measured anyway for own purposes ................. 6 Don’t Know / Refused................................................................. 99 Other_________________________________________________

2002 NRSPC End User Survey, Page 23 Survey ID ___ ___ ___
MV1b1 What has been your experience (with the savings estimation process)?
__ None, EESP handling it __None, used calculated _____________________________________________________________________
_____________________________________________________________________
_____________________________________________________________________ MV2 When you first decided to implement the projects included in the 2002 NRSPC, how
uncertain, if at all, would you say you were about the estimated energy savings for these projects? Would you say: [CAPTURE DIFFERENCE BY MEASURE]
Extremely uncertain...................................................................... 1 Somewhat uncertain..................................................................... 2 Somewhat certain......................................................................... 3 Extremely certain.......................................................................... 4 Don’t Know/Refused................................................................... 99
Comments: _______________________________________________________________
_______________________________________________________________
ASK ONLY IF EESP SPONSORED, ELSE SKIP TO DM3a MV3 And did the fact that the NRSPC Program required your UTILITY to approve the EESP
application increase your confidence in the EESP’s estimates of savings?
Yes, greatly increased confidence................................................ 1 Yes, somewhat increased confidence .......................................... 2 No, no effect on confidence.......................................................... 3 Don’t Know / Refused................................................................. 99
ENERGY-RELATED DECISION MAKING Now I’d like to ask a question about how your organization generally makes energy-related decisions. DM3a As a result of your participation in the 2002 NRSPC, have you made any changes in the
ways in which your organization makes decisions about whether to implement energy-efficiency projects? [PROVIDE EXAMPLES such as mandatory EE specification policy, internal reward system for reducing energy costs, increased payback threshold, etc.]
Yes ............................................................................................... 1 No................................................................................................. 2 Don’t Know/Refused................................................................... 99 DM3b Please Describe. [RECORD VERBATIM]
_____________________________________________________________________

2002 NRSPC End User Survey, Page 24 Survey ID ___ ___ ___
CLOSING
DM4 Are there any other positive or negative effects of your participation in the 2002 NRSPC
that you would like to mention that we have not asked about?
_____________________________________________________________________ _____________________________________________________________________
THANK YOU FOR YOUR PARTICIPATION IN THIS STUDY.
OTHER INTERVIEWER NOTES :
(Please briefly describe your overall impression of the customer’s decision-making process.
Include any comments on the net-to-gross story, program effects, other input, not clear
in the structured questions):
___________________________________________________________________________
___________________________________________________________________________
___________________________________________________________________________
___________________________________________________________________________

APPENDIX C.2 CUSTOMER MARKET SURVEY

FINAL (DRAFT VERSION 6): SEPTEMBER 3, 2003
Telephone Survey 2002 SPC Study
Baseline End-Users, CA
Prepared for SCE
Prepared by Quantum Consulting Inc.
Interviewer ID ___ ___ ___ Survey Number ___ ___ ___ ___ CREATE VARIABLE UTILITY SET VARIABLE UTILITY TO: PACIFIC GAS AND ELECTRIC COMPANY, SOUTHERN CALIFORNIA EDISON COMPANY, AND SAN DIEGO GAS AND ELECTRIC COMPANY, AS APPROPRIATE REMINDER: CHECK SAMPLE PULL AGAINST LIST OF SPC PROGRAM PARTICIPANTS,
EXCLUDE PROGRAM PARTICIPANTS FROM SAMPLE

2002 SPC Customer Baseline Page 2
INTRODUCTION
SCREEN1 [WHEN RECEPTIONIST ANSWERS]: [LARGE COMPANY]: May I have Plant Engineering, please? [SMALL COMPANY]: May I speak with the Facilities Manager, please? [OTHER DEPARTMENTS TO ASK FOR]: Maintenance General Services Operations (Manager) Public Relations Plant Services Purchasing Building Manager Planning Department LEAD IN INTRO1
Hello, this is _______________________, calling from Quantum Consulting on behalf of the California Public Utilities Commission and [UTILITY]. We are conducting a study on issues related to energy services in California. May I speak with the person in your organization who is responsible for energy-related decisions for your facilities?
[NOTE: INTERVIEWER SHOULD BE LOOKING FOR THE PERSON RESPONSIBLE FOR EQUIPMENT PURCHASES, ENERGY EFFICIENCY AND ENERGY SUPPLY AT THIS LOCATION. DO NOT RECORD INFORMATION FOR INDIVIDUAL AT SOME OTHER BUILDING OR LOCATION, EVEN IF BUILDING IS OWNED BY OFF-SITE MANAGER]
[IF NEEDED:] This is a fact-finding survey only – we are NOT interested in selling anything, and
responses will not be connected with your firm in any way. The California Public Utilities Commission wants to better understand how businesses think about and manage their energy consumption. Your input is very important to the Commission.
1 Yes INTRO2_2 2 Respondent not available now CALL BACK 3 Respondent coming to phone INTRO2_1 4 No such person INTRO1A 88 Refused INTRO1A INTRO1A
[IF NO SUCH PERSON]: May I speak with the person in your organization who is responsible for decisions regarding construction, renovation, or operation of your physical facilities?
INTRO1B NAME OF CONTACT: ______________________________________ INTRO1C TITLE: ______________________________________

2002 SPC Customer Baseline Page 3
IF RESPONDENT IS NOT AVAILABLE, GET HIS/HER NAME AND TITLE; MAKE ARRANGEMENTS TO CALL LATER
INTRO2_1 WHEN RESPONDENT GETS ON THE LINE: Hello, this is _______________________, calling from Quantum Consulting on behalf of the California Public Utilities Commission and [UTILITY]. We are conducting a study on issues related to energy services in California. Are you familiar with your organization’s recent energy-related decisions such as those concerning equipment purchases, energy efficiency and energy supply?
1 Yes INTRO3 2 No INTRO2A
INTRO2_2
WHEN RESPONDENT GETS ON THE LINE: We are conducting a study on issues related to energy services in California. Are you familiar with your organization’s recent energy-related decisions such as those concerning equipment purchases, energy efficiency and energy supply?
1 Yes INTRO3 2 No INTRO2A
INTRO2A Who would be the best person in your organization to speak with about energy-related decisions for this facility? ____________________________________ ASK TO BE CONNECTED WITH THIS INDIVIDUAL.
INTRO2B May I please speak with ___(insert from Intro2A)___________________ (IF CONTACT COMES TO PHONE, ASK INTRO2_1) (IF CONTACT NOT AVAILABLE, SCHEDULE CALLBACK) INTRO3
We are speaking with selected businesses and organizations to learn about their current energy practices and preferences. A group of energy policy makers will use information from this study to improve energy policies and programs for nonresidential customers. This interview should take about 15 minutes. Is this a good time for you or is there a better time I can call you back?
1 Yes SC1 2 No, schedule callback Call back 88 Refused T&T

2002 SPC Customer Baseline Page 4
SC1. First, what is your job title? [DON’T READ] {1999} 1 Facilities Manager SC2 2 Energy Manager SC2 3 Other facilities management/maintenance position SC2 4 Chief Financial Officer SC2 5 Other financial/administrative position SC2 6 Proprietor/Owner SC2 7 President/CEO SC2 SC1_8 Other (Specify) SC2 88 Refused SC2
FIRMOGRAPHIC CHARACTERISTICS
Now I’d like to ask a few quick questions about this facility. Unless otherwise stated, all questions pertain to THIS FACILITY [RESTATE FACILITY LOCATION IF NECESSARY].
EC1. What is the main activity performed at this location? {1999} [FOCUS RESPONDENT ON SUCCINCT ANSWERS, E.G., MANUFACTURING,
ADMINISTRATION, WAREHOUSING, RETAIL SALES, INDUSTRIAL PRODUCTION OF CHEMICALS, ETC.] [IF NECESSARY REFER TO ADDRESS OF FACILITY IN SAMPLE DATABASE]
1 Office EC2 2 Retail (non-food) EC2 3 College/university EC2 4 School EC2 5 Grocery store EC2 6 Convenience store EC2 7 Restaurant EC2 8 Health care/hospital EC2 9 Hotel or motel EC2 10 Warehouse EC2 11 Personal Service EC2 12 Community Service/Church/Temple/Municipality EC2 13 Industrial Electronic & Machinery EC2 14 Industrial Mining, Metals, Stone, Glass, Concrete EC2 15 Industrial Petroleum, Plastic, Rubber and Chemicals EC2 16 Other Industrial EC2

2002 SPC Customer Baseline Page 5
17 Agricultural EC2 18 Condo Assoc/Apartment Mgmt EC2 77 Other (SPECIFY) EC2 88 Refused EC2 99 Don’t know EC2 EC2. Approximately how many square feet does your organization occupy in this facility? {1999} 1 Less than 10,000 square feet EC3 2 10,000 but less than 20,000 square feet EC3 3 20,000 but less than 50,000 square feet EC3 4 50,000 but less than 100,000 square feet EC3 5 100,000 but less than 200,000 square feet EC3 6 200,000 but less than 300,000 square feet EC3 7 300,000 but less than 400,000 square feet EC3 8 400,000 but less than 500,000 square feet EC3 9 Over 500,000 square feet EC3 10 Ag/Non-facility – Outdoors EC3 88 Refused EC3 99 Don’t know EC3 EC3. Does your organization..... {1999} 1 Own this space EC5 2 Lease this space EC4 3 Own a portion and lease the remainder EC4 88 Refused EC5 99 Don’t know EC5 EC4 Does your organization pay its own electric bill directly to [UTILITY] or is electricity provided under
your lease arrangement? {1999}
1 Pay own electric bill EC5 2 Part of the lease arrangement EC6 88 Refused EC6 99 Don’t know EC6 EC5 What is your best estimate of your AVERAGE MONTHLY electric bill? {1999}

2002 SPC Customer Baseline Page 6
1 Less than 10,000 dollars EC6 2 10,000 but less than 25,000 dollars EC6 3 25,000 but less than 50,000 dollars EC6 4 50,000 but less than 100,000 dollars EC6 5 100,000 but less than 250,000 dollars EC6 6 Over 250,000 dollars EC6 88 Refused EC6 99 Don’t know EC6 EC6. How many locations does your organization have? {1999} 1 1 EC7 2 2 to 4 EC7 3 5 to 10 EC7 4 11 to 25 EC7 5 Over 25 EC7 88 Refused EC7 99 Don’t know EC7 EC7. What is the approximate number of full-time equivalent workers of all types employed by your
organization at this facility? {1999} 1 1 to 10 IM3 2 11 to 50 IM3 3 51 to 100 IM3 4 100 to 250 IM3 5 251 to 500 IM3 7 501 to 1000 IM3 7 Or, over 1000 IM3 88 [Don’t read] Refused IM3 99 [Don’t read] Don’t know IM3
EFFICIENCY-RELATED IMPROVEMENTS
Now I’d like to ask you a few questions about any energy-efficiency actions you may have taken recently.
IM3. In the past year, has your organization taken any specific actions to improve its energy
efficiency or otherwise reduce energy consumption? {1999}

2002 SPC Customer Baseline Page 7
1 Yes IM3a 2 No IM8 88 Refused IM8 99 Don’t know IM8 IM3a. Did these actions involve the installation of new equipment, or only changes in how you
operate or use existing systems? 1 Installation of new efficient equipment IM4 2 Changes in use and operation only IM8 3 Both IM4 88 Refused IM8 99 Don’t know IM8 IM4. And in which of the following areas have installed efficient equipment? [ACCEPT MULTIPLES, READ LIST.] {1999} 1 Installed efficient lighting equipment IM4_1 2 Installed efficient HVAC or refrigeration equipment IM4_1 3 Installed efficient motors or variable speed controls IM4_1 4 Reengineered manufacturing or process systems to save energy IM4_1 5 Installed energy management control systems or other controls IM4_1 IM4_7 [Don’t read] Other (specify) IM4_1 88 [Don’t read] Refused IM4B 99 [Don’t read] Don’t know IM4B [TEXT FOR EACH OF SIX CATEGORIES ABOVE THAT WERE SELECTED: CATEGORY FROM IM4 ABOVE, e.g., “LIGHTING”] {1999} ASK IM4_1 FOR EACH CATEGORY MENTIONED IN IM4: IM4_1. Let’s take the [ANSWER FROM IM4].
Could you tell me what specific actions your organization took? Record actions verbatim:______________________________ IM4b. And as a percentage of this facility’s annual electricity consumption, by how much do you
estimate these energy savings actions will reduce your annual consumption? {1999} 1 0 to 2 percent IM8 2 3 to 5 percent IM8 3 6 to 10 percent IM8 4 10 to 15 percent IM8 5 16 to 20 percent IM8

2002 SPC Customer Baseline Page 8
6 More than 20 percent IM8 88 Refused IM8 99 Don’t know IM8 IM8. In the last year, were there any actions to improve energy efficiency or otherwise reduce energy consumption that were identified but not undertaken? {1999} 1 Yes IM8A 2 No CON1 88 Refused CON1 99 Don’t know CON1 IM8a. And, overall, what were the most important reasons that you did not take these energy saving
actions? [DO NOT READ. ACCEPT MULTIPLES. ALLOW VERBATIM RECORDING.] {1999} IM8A CON1
1 Other priorities for capital spending CON1 2 Amount of savings did not justify added investment costs CON1 3 No funds available for investment CON1 4 Energy savings were too uncertain CON1 5 Could not obtain financing for investment CON1 6 Needed more information to make decision or convince
management CON1
7 Not enough management time to oversee project CON1 8 Would have took too much time to get a convincing analysis CON1 9 Uncertainty created by deregulation CON1 10 Expectation that energy prices would decrease CON1 11 Other (Specify)___IM8A_OTH CON1 12 NONE CON1 88 Refused CON1 99 Don’t Know CON1
CONSERVATION ACTIONS TAKEN IN RESPONSE TO ENERGY CRISIS
Next, I’m going to ask you about conservation actions that your organization may have taken to reduce or manage its energy use. In contrast to the previous question, I want to focus now only on changes in how your organization uses its equipment, rather than any physical replacement of equipment. CON1. Other than installing new equipment, is your organization taking any energy conservation
actions to reduce your overall energy use, such as routinely turning off lights or adjusting air

2002 SPC Customer Baseline Page 9
conditioning setpoints higher? {Express/Audit Nonpart}
1 Yes CON5 2 No DR20 88 Refused DR20 99 Don’t know DR20
CON5. What energy conservation actions are you taking? [SELECT ALL THAT APPLY]
{Express/Audit Nonpart} 1 Turn off office equipment such as PCs, monitors, printers and copiers when not
in use, at night and during the weekend CON7
2 Set thermostats lower when heating and higher when using the air conditioning
CON7
3 Schedule high electrical energy-use processes during off-peak periods where feasible.
CON7
4 Turn off any lights that are not being used, for example, unused offices and conference rooms
CON7
5 Turn down/dim the remaining lighting levels if you can CON7
6 Set air conditioning thermostats to pre-cool spaces at off-peak times CON7 7 Establish a system to alert employees of expected high demand days
including, but not limited to E-mail, voice mail, or public address announcement to all employees
CON7
8 Reprogram EMS schedule CON7 9 Run backup generator at times of peak demand CON7 10 Decrease industrial production or consolidate shifts CON7 11 Other (SPECIFY) CON7 CON7. When did your organization start conserving energy in these ways? Would you say: {Express/Audit Nonpart} 1 We’ve always tried to conserve energy in these ways CON10 2 We started conserving a year or two ago CON10 3 We Just recently started conserving in the past few months CON10 CON20. By roughly how much do you think the conservation actions you’ve taken have reduced your
overall annual energy usage at this facility as compared to the usage of this facility prior to the California energy crisis? {Express/Audit Nonpart}
1 0 to 2 percent CON25

2002 SPC Customer Baseline Page 10
2 3 to 5 percent CON25 3 6 to 10 percent CON25 4 10 to 15 percent CON25 5 16 to 20 percent CON25 6 More than 20 percent CON25 88 Refused CON25 99 Don’t know CON25 CON25. Of the things that you mentioned your organization is doing to conserve, do you think you are
conserving more/less/or about the same as your organization did during the California energy crisis in the Summer of 2001? {Express/Audit Nonpart}
1 More CON30 2 Less CON30 3 About the same CON30 88 Refused CON30 99 Don’t know CON30 CON30. What are the most important reasons that your organization continues to take energy
conservation actions to reduce its energy use? [ACCEPT MULTIPLES] {Express/Audit Nonpart}
1 Lower energy bill DR20 2 Reduce strain on grid/increase reliability DR20 3 Be less vulnerable to outages / risk management DR20 4 Avoid Blackouts DR20 5 Civic Duty DR20 6 Help solve energy crisis DR20 7 Other (specify) DR20 88 Refused DR20 99 Don’t Know DR20
DR20. Next, I would like to ask you about actions that you would take or have taken this summer, specifically on power alert days when emergency warnings are issued because of extremely low electricity supplies. Are there additional actions you would take or have taken this summer on power alert days, such as shutting off non-critical equipment at midday, turning off more lights than usual, and setting the thermostat even higher than you normally would.
1 Yes DR30 2 No EP1

2002 SPC Customer Baseline Page 11
88 Refused EP1 99 Don’t know EP1
IF DR20 = 1 DR30. What actions would you take or have you taken on days when power alerts are announced? 1 Turn off office equipment such as PCs, monitors, printers and copier
when not in not in use, at night and during the weekend DR35
2 Set thermostats lower when heating and higher when using the air conditioning
DR35
3 Schedule high electrical energy-use processes during off-peak periowhere feasible.
DR35
4 Turn off any lights that are not being used, for example, unused officconference rooms
DR35
5 Turn down/dim the remaining lighting levels if you can DR35
6 Set air conditioning thermostats to pre-cool spaces at off-peak times
DR35
7 Establish a system to alert employees of expected high demand days including, but not limited to E-mail, voice mail, or public address announcement to all employees
DR35
8 Reprogram EMS schedule DR35 9 Run backup generator at times of peak demand DR35 10 Decrease industrial production or consolidate shifts DR35 11 Other (SPECIFY) DR35
88 Refused EP1 99 Don’t know EP1
IF DR30 NE 88 or 99
DR35. What is the primary reason you took or would take these actions?
1 Lower energy bill EP1 2 Reduce strain on grid/increase reliability EP1 3 Be less vulnerable to outages / risk management EP1 4 Avoid Blackouts EP1 5 Civic Duty EP1 6 Help solve energy crisis 7 Other (specify) EP1 88 Refused EP1 99 Don’t know EP1

2002 SPC Customer Baseline Page 12
PERCEPTION OF ENERGY PRICES, PRICE CHANGES, DURATION, EFFECTS
Now I’d like to ask you a few questions about your energy bill at this facility. EP1. As compared to prices just prior to the California energy crisis, has the average price of electricity
for this facility increased, decreased, or stayed about the same?
1 Increased EP2 2 Decreased DM2a 3 Stayed about the same DM2a 88 Refused DM2a 99 Don’t know DM2a
EP2. By approximately how much has the average annual price of electricity increased for this facility
as compared to the price before the California energy crisis? 1 0 to 5 percent EP3 2 6 to 10 percent EP3 3 11 to 20 percent EP3 4 21 to 30 percent EP3 25 31 to 40 percent EP3 6 41 to 50 percent EP3 7 51 to 60 percent EP3 8 61 to 70 percent EP3 9 71 to 80 percent EP3 10 81 to 90 percent EP3 11 91 to 100 percent EP3 12 More than 100 percent EP3 88 Refused EP3 99 Don’t know EP3 EP3. And for how long does your organization believe these electricity price increases will stay in
effect? 1 Less than 1 year EP4 2 1 to 2 years EP4 3 3 to 5 years EP4 4 6 to 10 years EP4 5 Over 10 years (or price increases are believed to be permanent) EP4 88 Refused EP4 99 Don’t know EP4

2002 SPC Customer Baseline Page 13
EP4. How, if at all, has this increase in electricity prices affected your organization’s interest or plans to
make capital investments in energy efficiency-related projects? Would you say:
1 Increase in interest and increase in planned capital investment DM2a 2 Increase in interest but no increase in planned capital investment DM2a 3 No major change in interest or planned capital investment DM2a 88 Refused DM2a 99 Don’t know DM2a
ELECTRIC SUPPLY CHOICES
ES1. Some customers purchase the energy portion of their electricity service from a firm other than their
local electric distribution company. Does this facility purchase electricity from a company other than [UTILITY]?
1 Yes ES2 2 No DM2a 88 Refused DM2a 99 Don’t know DM2a
ES2. From what company does this firm purchase its electric energy? RECORD VERBATIM
Record name (ES2_OPN)_______________________________________ Don’t know........................................................................................................ 88 Refused ............................................................................................................ 99
ENERGY-RELATED DECISION MAKING
Now I’d like to ask some questions about how your organization makes its energy-related decisions. DM2a. Would you best characterize the PROCESS to approve major investments in energy efficiency
projects in your organization as….[READ LIST] {1999} 1 Relatively simple and straightforward DM2B 2 Somewhat complex, but manageable DM2B 3 Complex and difficult to get through DM2B

2002 SPC Customer Baseline Page 14
99 Don’t know DM2B DM3A. Does your organization have any internal incentive or reward policies for business units or staff
responsible for managing energy costs? {1999}
1 Yes DM3B 2 No DM4A 88 Refused DM4A 99 Don’t know DM4A DM3B. How do these incentive/reward structures work? {1999} RECORD VERBATIM DM4A. And, what would you say are the main obstacles, if any, to approval of major energy efficiency
investments at your organization? [DO NOT READ. ACCEPT MULTIPLES. ALLOW VERBATIM RECORDING] {1999}
DM4A
1 Other priorities for capital spending DM7 2 Amount of savings often do not justify added investment costs DM7 3 No funds available for investment DM7 4 Energy savings are usually too uncertain DM7 5 Can not obtain financing for investments DM7 7 Usually need more information than is available to make decision DM7 7 Not enough management time to oversee project DM7 8 Takes too much time to get a convincing analysis DM7 9 Other (Specify) DM4A_OTH DM7 10 No major obstacles to approval of efficiency projects DM7 11 Internal conflicts between departments or decision makers DM7 88 Refused DM7 99 Don’t Know DM7 12 Proceed to next question DM7
DM7. Has your organization assigned responsibility for controlling energy usage and costs to any of the
following? [READ LIST] {1999}
1 An in-house staff person DM9 2 A group of staff DM9 3 An outside contractor DM9 4 No DM9

2002 SPC Customer Baseline Page 15
88 [Don’t read] Refused DM9 99 [Don’t read] Don’t know DM9 DM9. Has your organization developed a specification policy for the selection of energy-efficient
equipment? (EXAMPLES: REQUIREMENT THAT ALL NEW FLUORESCENT LIGHTING SYSTEMS USE ELECTRONIC BALLASTS, OR THAT ALL NEW MOTORS BE PREMIUM EFFICIENCY.) {1999}
1 Yes DM12 2 No DM12 88 Refused DM12 99 Don’t know DM12 DM12. What investment criterion, if any, does your firm use when applying investment analysis to energy
equipment selection? [ACCEPT ONLY ONE. PROMPT IF NECESSARY] {1999}
1 Payback period DM12A 2 Internal rate of return DM12A 3 Life-cycle cost analysis DM12A DM12_4 Other (specify) DM12A 5 No criteria used DM12A 88 [Don’t read] Refused DM12A 99 [Don’t read] Don’t know DM12A DM12A. Thinking in terms of project payback, what is the payback period that your organization
typically requires to approve energy efficiency investments? {1999} DM12A_1 Enter number of years (if less than 1 yr then enter 77) EO1 88 Refused EO1 99 Don’t know EO1
EFFICIENCY OFFERS
Now I’d like to ask you a question about energy efficiency service offers you may have received. EO1. In the past year, has your organization been approached by any companies offering to provide
services to improve the efficiency of your facility’s energy usage? {1999}

2002 SPC Customer Baseline Page 16
1 Yes EO2 2 No PC1 88 Refused PC1 99 Don’t know PC1 EO2. And what specific types of services to improve the efficiency of your facility’s energy usage were
offered? RECORD VERBATIM
FAMILIARITY WITH AND USE OF PERFORMANCE CONTRACTING
Now I’d like to ask some questions about any experience your organization may have with
a specific type of energy efficiency related contract. PC1. How familiar is your organization with the concept of Energy Performance Contracting? Would
you say: {1999}
1 Very familiar PC3 2 Somewhat familiar PC3 3 Unfamiliar PC3 88 Refused PC3 99 Don’t know PC3 PC3. And in the past year, has your organization been approached by any companies offering an
Energy Performance Contract? {1999}
1 Yes PC4B 2 No SPO 88 Refused SPO 99 Don’t know SPO PC4B. Which of the following statements best describes how far you went in the decision making or
project development process? [READ LIST] {1999}
1 Heard presentation but did not request proposal(s) PC5 2 Asked for and received formal proposal(s) but did not enter contract
negotiations PC5

2002 SPC Customer Baseline Page 17
3 Tried to negotiate contract but failed to come to agreement PC5 4 Negotiated and signed contract PC7B 88 [Don’t read] Refused SPO 99 [Don’t read] Don’t know SPO PC5. What were the main reasons you did not enter into an Energy Performance Contract? [RECORD REASONS VERBATIM] {1999} SKIP TO SP0 PC7B. What are the main reasons that you chose an Energy Performance Contract over other forms of
project development? {1999} [RECORD REASONS VERBATIM]
AWARENESS AND ASSESSMENT OF SPECIFIC SERVICE PROVIDERS AND PROVIDER TYPES
SP0. Now I’d like to ask you a question about different types of energy services providers. SP4a_0. On a scale from 0 to 10 where 0 is not credible at all credible and 10 is extremely credible,
please rate each of the following types of companies with respect to how credible you think they are as a source of energy-efficiency related information. {1999}
SP4A. ROTATE (1 – 5)
SP4A_1. Engineering / Architectural Design Firms SP4A_2. Energy Equipment Contractors and Installers (e.g., lighting, HVAC) SP4A_3. Energy Service Companies, often referred to as ESCOs SP4A_4. [UTILITY], that is, your electric distribution company SP4A_5. Companies, besides your electric distribution company, that provide electricity supply, sometimes referred to as Energy Service Providers (ESPs)
KNOWLEDGE
Now I’d like to ask you a few questions about your organization knowledge of energy savings opportunities.
KN1. First, what do you estimate is the maximum percentage by which your facility’s total annual electricity consumption could be reduced by implementing all cost-effective energy-efficiency

2002 SPC Customer Baseline Page 18
opportunities? [NOTE THAT THIS PERCENTAGE IS OF SAVINGS THAT COULD BE REALIZED BY DOING ALL POSSIBLE COST-EFFECTIVE ENERGY-RELATED PROJECTS BEYOND THOSE PREVIOUSLY IMPLEMENTED.] {1998}
KN1_1. Enter Percent........................................................................................ 1 Don’t know........................................................................................................ 98 Refused ............................................................................................................ 99 KN2a. On a scale from 0 to 10, where 0 is completely uninformed and 10 is very well informed, how
would you rate your organization’s knowledge of energy savings opportunities for lighting? {1998}
0 1 2 3 4 5 6 7 8 9 10
Don’t know........................................................................................................ 98 Refused ............................................................................................................ 99 KN2b. And using the same scale, how would you rate your organization’s knowledge of energy savings
opportunities for HVAC systems?
0 1 2 3 4 5 6 7 8 9 10
Don’t know........................................................................................................ 98 Refused ............................................................................................................ 99 KN2c. And how about for all of the other major energy-using systems in your facility? {1998}
0 1 2 3 4 5 6 7 8 9 10
Don’t know........................................................................................................ 98 Refused ............................................................................................................ 99
BARRIERS
And now I have a few quick questions on two issues that may be barriers that your organization faces with respect to implementing cost-effective energy-efficiency opportunities. BR1. A barrier to implementing energy efficiency projects often cited by organizations is uncertainty
over the performance and savings of energy efficiency measures. There are a number of factors contributing to this uncertainty. On a scale from 0 to 10, where 0 is completely insignificant and 10 is very significant, how significant are each of the following two factors regarding potential energy efficiency measures?
BR1a. Uncertainty over whether new energy efficient equipment will perform as well as your existing
equipment or new standard efficiency equipment {1999} 0 1 2 3 4 5 7 7 8 9 10

2002 SPC Customer Baseline Page 19
Refused................................................................................................................... 88 Don’t know............................................................................................................... 99 BR1b. Uncertainty over whether actual energy savings will be equal to or greater than estimated
savings {1999} 0 1 2 3 4 5 7 7 8 9 10
Refused................................................................................................................... 88 Don’t know............................................................................................................... 99 WARENESS AND KNOWLEDGE OF ENERGY-EFFICIENCY RESTRUCTURING IN CA BR3. Another barrier to implementing energy efficiency projects often cited by organizations is
uncertainty about the firms providing the energy efficiency services. Again, on a scale from 0 to 10, where 0 is completely insignificant and 10 is very significant, how significant are each of the following factors regarding potential energy efficiency providers
BR3A. Uncertainty over the integrity or trustworthiness of the firm {1999}
0 1 2 3 4 5 7 7 8 9 10 Refused................................................................................................................... 88 Don’t know............................................................................................................... 99 BR3C. Uncertainty over the long-term viability of the firm and their ability to provide ongoing support or
guarantees for the project. {1999} 0 1 2 3 4 5 7 7 8 9 10
Refused................................................................................................................... 88 Don’t know............................................................................................................... 99
PROGRAMS
PR1. Are you aware of any programs or resources provided by [UTILITY] in 2002 that were designed to promote energy efficiency for businesses like yours? [IF YES:] What types of programs can you recall? [RECORD ALL MENTIONS.] {Express/Audit Nonpart}
1 Rebates/incentives (include mentions of SPC and Express) PR2 2 Business energy audits and feasibility studies PR2 3 Energy Centers (Pacific Energy Center, SCE CTAC) PR2 4 Seminars, classes, and workshops PR2 77 Other programs [SPECIFY:]_________________ PR2

2002 SPC Customer Baseline Page 20
98 No, not aware of any programs PR2 99 Don’t Know PR2 PR2. Are you aware of the [UTILITY] Standard Performance Contract incentive program?
1 Yes PR32 No PR588 Refused PR599 Don’t know PR5
IF PR2 = 1 PR3. How did you first learn about the Standard Performance Contract program? [ACCEPT MULTIPLES]
1 Business energy audits PR4 2 Respondent approached contractor/ESCO/A&E firm/other 3rd party PR4 3 Respondent approached utility concerning another matter and learned about t
program PR4
4 Contacted by utility rep PR4 5 Contacted by contractor/ESCO/A&E firm/other 3rd party PR4 6 Utility brochure in mail PR4 7 Bill insert PR4 8 Word-of-mouth from friend or co-workers within the company PR4 9 Word-of-mouth from friends or other business associates outside the compan PR4 10 Television, radio, newspaper ad PR4 11 Magazine or trade journal PR4 12 Participation in previous years PR4 13 Manufacturer information/suggestion PR4 14 Community organization such as Chamber of Commerce PR4 15 Church PR4 16 Trade association PR4 17 Utility website PR4 77 Other (SPECIFY) ________ PR4 88 Refused PR4 99 Don’t know PR4 PR4. And do you have a generally favorable or unfavorable impression of the current SPC program?
1 Favorable PR4a2 Unfavorable PR4a3 Neither favorable nor unfavorable (neutral) PR4a

2002 SPC Customer Baseline Page 21
88 Refused PR599 Don’t know PR5 PC4a. And why is that? [RECORD REASONS VERBATIM] PR5. Are you aware of the Flex Your Power advertising campaign? {Express/Audit Nonpart}
1 Yes PR7 2 No PR6 88 Refused PR6 99 Don’t know PR6
PR6. Flex Your Power is an energy conservation campaign conducted by the state of California during and after the energy crisis. Before this survey, had you ever heard of Flex Your Power? {Express/Audit Nonpart}
1 Yes PR7 2 No PR9 88 Refused PR9 99 Don’t know PR9
(IF PR4 = 1 or PR5 = 1) AND IF IM3 = 1 THEN PR6, OTHERWISE PR7
PR7. On a scale of 1 to 10, where 1 means NOT INFLUENTIAL and 10 means VERY INFLUENTIAL, what influence did Flex Your Power have in your organization’s decision to purchase new efficient equipment? {Express/Audit Nonpart}
1 2 3 4 5 7 7 8 9 10 Refused................................................................................................................... 88 Don’t know............................................................................................................... 99
(IF PR4 = 1 or PR5 = 1) AND CON1 = 1 THEN PR7, OTHERWISE PR8
PR8. On a scale of 1 to 10, where 1 is NOT INFLUENTIAL, and 10 is VERY INFLUENTIAL, what influence did Flex Your Power have on reducing your facility’s energy use through the conservation actions you mentioned? {Express/Audit Nonpart}
1 2 3 4 5 7 7 8 9 10 Refused................................................................................................................... 88 Don’t know............................................................................................................... 99

2002 SPC Customer Baseline Page 22
PR9. Did your firm participate in any energy efficiency programs offered by [UTILITY] or any
government or third-party programs in 2002? [RECORD ALL MENTIONS] {Express/Audit Nonpart}
1 Yes, [UTILITY] Express Efficiency PR9 2 Yes, [UTILITY] SPC/Standard Performance Contracting PR9 3 Yes, [UTILITY] Business Energy Audits PR9 4 Yes, other [UTILITY] [SPECIFY:] _______________________ PR9 5 Yes, other, Non-utility [SPECIFY:]_________________________ PR9 6 No, did NOT participate in other 2002 programs PR9 88 Refused PR9 99 Don’t Know PR9 PR10. Did your firm participate in any demand reduction programs offered by [UTILITY] or any
government, Independent System Operator, or third-party programs in 2002? [RECORD ALL MENTIONS]
1 Yes, [SPECIFY:] _______________________ PR9 2 No, did NOT participate in any DR programs PR9 88 Refused PR9 99 Don’t Know PR9 PR11. And finally, do you have any other comments or suggestions regarding energy-efficient products
and practices, or programs that support energy efficiency or peak load reduction? [RECORD VERBATIM] May I please record your name, simply for verification purposes – a supervisor will confirm a small percentage of the interviews I’ve done. Thank you very much for your participation in this very important survey, you’ve been extremely helpful. I hope you found the process interesting and enjoyable. Thanks again, and have a great day.

APPENDIX C.3 CUSTOMER DROPOUT SURVEY

Appendix C.3.doc: Final
2002 Nonresidential SPC Study
DRAFT End-User DROPOUT Survey
Prepared for SCE by Quantum Consulting and KEMA-XENERGY
May 28, 2003
Interview Tracking Information Survey Number Completion Date Interviewer Survey Length (min.)
Customer Information Company Name Street Address City, State, Zip Contact Name Contact Title Phone Alt info (email, cell)
Database Application Information # of Appl. by Utility PGE SCE SDGE
Status of Applications � All were cancelled � Some continued Other:
Sponsor Status � EESP � SELF � BOTH Name of EESP:
Site information � Single Site � Multi Site Notes:
Measures per database
Savings per database
Incentives per
database

2002 NRSPC Drop Out Survey, Page 2 Survey ID ___ ___ ___
END-USER PARTICIPANT INTERVIEW GUIDE – POSSIBLE LEAD IN MATERIAL
May I please speak with [CONTACT__________________]? [Confirm this person is responsible for participation decision.] Hello, my name is ______ and I am calling about your participation in [UTILITY’s] 2002 Large Standard Performance Contract Program. I am with XENERGY, we are an energy research firm hired to conduct a interviews on behalf of the California Public Utilities Commission and with the cooperation of [your local utility]. We are interviewing firms that submitted applications for the 2002 Large Standard Performance Contract program, that were subsequently cancelled. It is our understanding that you submitted at least one application that was subsequently cancelled. Your input to this research is extremely important. The interview will take approximately 5 minutes [or longer] and any information that is provided will remain strictly confidential. We will not identify or attribute any of your comments or organization information. Is this a good time, or can we schedule a convenient time in the next couple of days to talk? IF HESITANT: It is important that we speak with the customers who decided not to pursue applications under the program to assess whether there are improvements that can be made to the program to increase participation and customer satisfaction. With out input from customers such as yourself, we will have difficulty conducting a fair and complete evaluation of the program. Thank you for taking part in this survey. The major purposes of this study are
(1) to obtain feedback on the design and administrative aspects of the program, and (2) to understand the characteristics of participants in the program and the types of activity the program has generated. This interview is focused on experiences with the program to date.
[If they request a contact at their local utility, the following are the appropriate MAE representatives, not the program managers] PGE Betsy Krieg 415-973-0580 SCE Pierre Landry 626-302-8288 SDGE Henry De Jesus 858-654-1723

2002 NRSPC Drop Out Survey, Page 3 Survey ID ___ ___ ___
RESPONDENT INFORMATION [CONFIRM THE FOLLOWING ONLY IF NOT CLEAR FROM THE DATABASE]
First, I’d like to confirm the following information regarding your application(s) to
the 2002 NR SPC Program. AP1. How many applications did you submit under the 2002 NRSPC Program? a._________ AP2. a. Were all your 2002 NRSPC applications cancelled? Yes ............................................................................................... 1 No................................................................................................ 2 SKIP TO AP3 Don’t Know/Refused [CONFIRM RIGHT CONTACT] 99 b. Are any still active (in M&V stage, or waiting for final payments)? Yes ............................................................................................... 1 No................................................................................................. 2 Don’t Know/Refused [CONFIRM RIGHT CONTACT] ............... 99 AP3. Did you self sponsor your application(s) or use an EESP sponsor? SELF SPONSOR.......................................................................... 1 EESP SPONSOR......................................................................... 2 BOTH ........................................................................................... 3 Don’t Know/Refused [CONFIRM RIGHT CONTACT] ............... 99 AP4. Did you plan to use the measured or calculated savings option? SELF SPONSOR.......................................................................... 1 EESP SPONSOR......................................................................... 2 BOTH ........................................................................................... 3 Don’t Know/Refused [CONFIRM RIGHT CONTACT] ............... 99 AP5. What projects did you propose in the [cancelled] applications? ________________________________________________________________________
________________________________________________________________________
________________________________________________________________________

2002 NRSPC Drop Out Survey, Page 4 Survey ID ___ ___ ___
REASONS FOR CANCELLATION
CA1 Why were your 2002 NRSPC Applications cancelled? (what other reasons) ________________________________________________________________________
________________________________________________________________________
________________________________________________________________________
CA2 a. Did you proceed with the project(s) anyway? or will you in the next year?
Yes, have already done entire project(s) .................... 1
Have implemented part of the project(s) and do not plan to implement any more of it ..................... 2
Have implemented part of the project(s) and plan to implement more of it within the next year ....... 3
Have not implemented any of the project(s) but plan to implement some or all within the next year..... 4 SKIP to CA2e
Have not implemented any of the project(s) and do not plan to in the next year .................................... 5 SKIP to CA3
CA2b. What specific parts of the project(s) have you already implemented? [Record verbatim what they did anyway; get information on equipment type]:
________________________________________________________________________
________________________________________________________________________
________________________________________________________________________ CA2c. Did you participate in other incentive programs (excluding PY2002 NRSPC, such as Express Efficiency or the CEC Peakload Reduction Program) for (the portion of) the project(s) you already have installed?
Yes.......................................................................................... 1 No ........................................................................................... 2 DON’T KNOW/NOT APPLICABLE ....................................... 99
IF CA2c=1, ASK CA2d, ELSE GO TO INSTRUCTIONS FOLLOWING CA2d
CA2d. Which program did you participate in and in what year (e.g., 2002 or 2003):
please describe: ________________________________________________________________________ ________________________________________________________________________

2002 NRSPC Drop Out Survey, Page 5 Survey ID ___ ___ ___
IF CA2=3 OR 4 (Plans to do/finish project in future) ASK CA2e. ELSE GO TO CA3. CA2e. Do you plan to apply for NRSPC funding to complete some or all this project within the next year?
Yes.......................................................................................... 1 No ........................................................................................... 2 DON’T KNOW/NOT APPLICABLE ....................................... 99
CA3. [IF AVAILABLE FROM DATABASE, CONFIRM SAVINGS AND INCENTIVES, OTHERWISE ASK:] Do have a (rough) estimate of the expected savings or amount of incentives you were applying for (for the cancelled applications)? ________________________________________________________________________
________________________________________________________________________
________________________________________________________________________
PROGRAM-RELATED DECISION MAKING SECTION
PD1 a. Why did you decide to install Program-Related Equipment originally? [DO NOT READ]
To replace old or outdated equipment.......................................... 1 To allow remodeling, build-out, or expansion ............................... 2 To gain more control over how the equipment was used. ............ 3 To improve measure performance ............................................... 4 To get a rebate from the program ................................................ 5 To protect the environment .......................................................... 6 To reduce energy costs ................................................................ 7 To reduce energy demand/likelihood of blackouts ....................... 8 To respond to the energy crisis .................................................... 9 To acquire the latest technology................................................. 10 To add new equipment/capability (e.g. VSD) ............................. 11 Don’t Know/Refused................................................................... 99 Other .......................................................................................... 77 PD1b. Describe________________________ ......................................
PD2 When did you hear about the NRSPC in your decision making process? [ONLY READ
CHOICES FOR CLARIFICATION] Before thinking about installing the equipment............................. 1 In the middle of the decision making process............................... 2 After deciding to install the equipment.......................................... 3 Other:________________________________________ .......... 4

2002 NRSPC Drop Out Survey, Page 6 Survey ID ___ ___ ___
PD3 And how significant was the PY2002 NRSPC Program to your original decision to install the project proposed? Would you say the NRSPC program’s financial incentive was very significant, somewhat significant, somewhat insignificant or very insignificant?
Very significant ...................................................................................... 1 Somewhat significant............................................................................. 2 Somewhat insignificant.......................................................................... 3 Very insignificant ................................................................................. 4 Don’t know........................................................................................... 98 Refused ................................................................................................. 99
PD3a. [Please explain]
_____________________________________________________________________
_____________________________________________________________________
NRSPC PROCESS-RELATED EXPERIENCE
P1 Overall, what are your opinions on the 2002 NRSPC program? (what do you view as the primary strengths/weaknesses?)
_____________________________________________________________________
_____________________________________________________________________
_____________________________________________________________________
P4 How likely would you say your organization is to participate in the NRSPC program in the
future, would you say: Very likely .............................................................................................. 1 Somewhat likely..................................................................................... 2 Somewhat unlikely................................................................................. 3 Very unlikely ........................................................................................ 4 Don’t know........................................................................................... 98 Refused ................................................................................................. 99
P4b [record any comments regarding future participation (e.g. only if they changed X…)]

2002 NRSPC Drop Out Survey, Page 7 Survey ID ___ ___ ___
FIRMOGRAPHICS
[CONFIRM THE FOLLOWING ONLY IF NOT CLEAR FROM THE DATABASE] AP6. What is the primary business of the company/organization? [CHECK APPROPRIATE CODE] __ Comm __ Ind __Inst __ Agric __ Other
[ENTER VERBATIM]____________________________________________________
AP7. [IF SINGLE-SITE PARTICIPANT ASK] Approximately how large is your
organization’s space in this facility? [ELSE IF MULTI-SITE ASK] What is the average size of your organization’s space among participating facilities (facilities included in the cancelled application(s)? ___________sq. ft.
CODE 98 FOR DON’T KNOW; 99 FOR REFUSED, ROUGH ESTIMATE IS OK
CLOSING
CL1 Are there any other issues relating to the 2002 NRSPC that you would like to mention
that we have not asked about?
_____________________________________________________________________ _____________________________________________________________________
THANK YOU FOR YOUR PARTICIPATION IN THIS STUDY.
OTHER INTERVIEWER NOTES :
(Include any other relevant comments not covered in the structured questions):
___________________________________________________________________________
___________________________________________________________________________
___________________________________________________________________________
___________________________________________________________________________

APPENDIX C.4 EESP PARTICIPANT SURVEY

Page 1 of 11
PY2002 SPC Participant EESP Interview Guide
NAME PHONE:
TITLE FAX
COMPANY E-MAIL
STREET ADDRESS
CITY INTERVIEWER
STATE CALL DATES
ZIP COMPLETE DATE
D&B SALES D&B EMPLOYEES
Hello, my name is ________, with Quantum Consulting, an energy research firm, and I am calling on behalf of the California Public Utilities Commission and the program evaluation staff at the California Investor-owned Utilities. May I please speak with ______________? [AFTER REACHING CORRECT CONTACT] We are conducting an evaluation study on behalf of the California Public Utilities Commission. We are contacting energy service companies who participated in California's Non-Residential Standard Performance Contract (SPC) program in the 2002 program year. Your input to this research would be very valuable and, if possible, we would like to interview you. The interview will provide you with an opportunity to provide feedback on your experience with the 2002 SPC program. The interview will take about 20 minutes, and any information that is provided during the interview will remain strictly confidential. We will not identify or attribute any of your comments or company information. Is this a good time, or can we schedule a convenient time in the next couple of days to talk? [IF HESITANT:] Your input to this survey is very important for ensuring the long-term success of these programs. Without input from industry representatives such as you, we cannot guarantee that the program will receive a fair and complete evaluation. [IF RELUCTANT BECAUSE THEY WERE A SURVEY RESPONDENT IN PREVIOUS YEARS]: Thank you we very much appreciate your prior participation in an SPC evaluation interview. However, the program has changed significantly over the past few years, as has the market environment in California, and it is critical that we obtain up-to-date information from participating firms on the program as implemented in 2002. Your input is critical to this process. [IF SCHEDULED:] Callback date/time: Thank you for taking part in this survey. The major purposes of this study are to provide feedback to the utilities and CPUC on the design and administrative aspects of the program. This interview is focused on experiences with the program to date.

Page 2 of 11
Utility Reference Numbers for Interviewees Wanting to Confirm PGE Betsy Krieg 415-973-0016
SCE Pierre Landry 626-302-8288 SDGE Henry De Jesus 858-654-1723
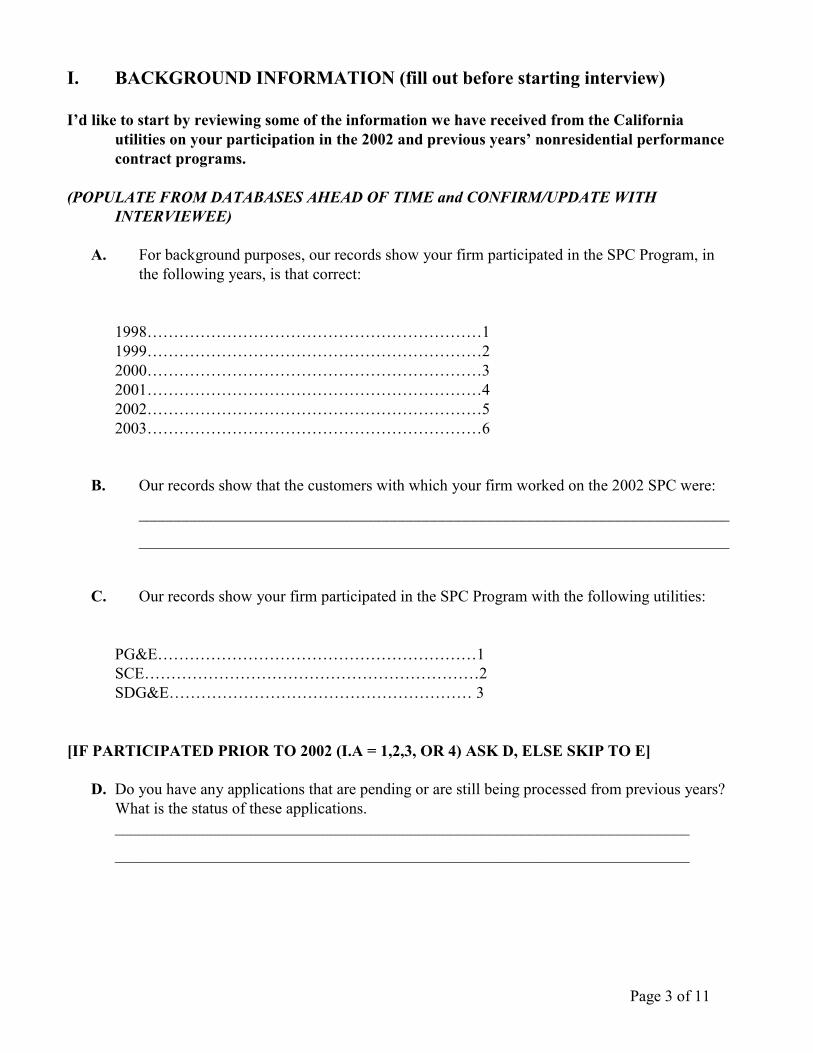
Page 3 of 11
I. BACKGROUND INFORMATION (fill out before starting interview) I’d like to start by reviewing some of the information we have received from the California
utilities on your participation in the 2002 and previous years’ nonresidential performance contract programs.
(POPULATE FROM DATABASES AHEAD OF TIME and CONFIRM/UPDATE WITH
INTERVIEWEE)
A. For background purposes, our records show your firm participated in the SPC Program, in the following years, is that correct:
1998………………………………………………………1 1999………………………………………………………2
2000………………………………………………………3 2001………………………………………………………4 2002………………………………………………………5
2003………………………………………………………6
B. Our records show that the customers with which your firm worked on the 2002 SPC were:
__________________________________________________________________________
__________________________________________________________________________
C. Our records show your firm participated in the SPC Program with the following utilities:
PG&E……………………………………………………1 SCE………………………………………………………2
SDG&E………………………………………………… 3
[IF PARTICIPATED PRIOR TO 2002 (I.A = 1,2,3, OR 4) ASK D, ELSE SKIP TO E]
D. Do you have any applications that are pending or are still being processed from previous years? What is the status of these applications. ________________________________________________________________________
________________________________________________________________________

Page 4 of 11
E. Have you had any 2002 SPC projects that were cancelled, or put on hold? Yes………………………………………………………1 No……………………………………………………….2
F. If Yes, What happened with these projects? ________________________________________________________________________
II. FIRMOGRAPHICS Now I have a few questions on the general characteristics of your company.
A. What type of energy services firm is your firm? Would you say: [IMPORTANT: NOTE ANY UNIQUE "SELF-CLASSIFICATION" TERMS.]
1. "Traditional" ESCO (predominantly performance based contracts) 2. Energy Efficiency Services Company (EESP, mostly efficiency services) 3. Retail Energy Service Co. (RESCO) (selling both energy commodity and efficiency
services) 4. Architecture / Engineering / Design Engineering 5. Building Maintenance and Operations 6. Equipment Vendor/Distributor 7. Other (please describe)
What are the primary products and service provided by your firm: ________________________________________________________________________
________________________________________________________________________
B. Which of the following best describes the geographic focus of your operations?
1. Local – What area? ______________________________ 2. Regional – What area? ___________________________ 3. Statewide (California) 4. National 5. International
C. How many years has your company been providing energy efficiency services in California?
________________
D. Approximately how many full-time equivalent employees (FTEs) do you employ, including all in-house contractors?
___ # FTEs in California?

Page 5 of 11
___ # FTEs nationally?
III. SPC PROCESS-RELATED INFORMATION Now I am going to ask you a few questions about your firm’s experience with the 2002 Nonresidential SPC program, including your perspective on the program, opinions on how savings and incentives are determined, and your overall satisfaction with the program experience.
A. Based upon your experiences, what do you view as the primary objectives of the 2002 SPC program? ______________________________________________________________________________
______________________________________________________________________________
Has your perspective on the program objectives changed over time?_______________________
______________________________________________________________________________
B. Based upon your experiences, what do you view as the primary strengths and weaknesses of the 2002 program in meeting its objectives? Strengths:_____________________________________________________________________
______________________________________________________________________________
______________________________________________________________________________
Weaknesses:___________________________________________________________________
______________________________________________________________________________
______________________________________________________________________________
C. Please describe your experiences with the 2002 program rules and requirements, including the
application process and the program milestones. [CLARIFY WHICH PART OF THE PARTICIPATION PROCESS IS BEING DISCUSSED, I.E. APPLICATION, PARTICIPATION, MEASURED SAVINGS, PAYMENT] _____________________________________________________________________________
_____________________________________________________________________________
D. Did your 2002 projects use the "calculated savings" vs. "measured savings" approach for program payment? Calculated Savings…………………………………………1
Measured……………………………………………………2 [SKIP TO Question G] Both………………………………………………………. 3

Page 6 of 11
E. Please describe your perspective on the use of the "calculated savings" approach. What are the
advantages and/or drawbacks to that approach based on your experience? _____________________________________________________________________________
_____________________________________________________________________________
[IF PARTICIPATING WITH MULTIPLE UTILITIES ASK F (SEE I.C); ELSE
SKIP TO G]
F. If applicable, please compare how the "calculated savings" approach was used by different utilities. Did you notice any differences in approach, types of projects allowed to use the "calculated savings" approach or any other differences? Please explain. _____________________________________________________________________________
_____________________________________________________________________________
[IF USING MEASURED SAVINGS METHOD ASK G; ELSE SKIP TO I IF
CALCULATED SAVINGS METHOD ONLY (III.D=1)]
G. If applicable, please describe your experiences with the “measured savings” process for your SPC projects. ______________________________________________________________________________
______________________________________________________________________________
[ASK H IF PARTICIPATING WITH MORE THAN 1 UTILITY, SEE I.C;
ELSE SKIP TO I]
H. If applicable, please compare how the "measured" approach was used by different utilities. Did you notice any differences in approach, types of projects required to use the "measured" approach or any other differences? Please explain. _____________________________________________________________________________
_____________________________________________________________________________
I. How, if at all, do program savings calculations or measured savings requirements differ from
your firm's standard practice for energy-efficiency related projects? _____________________________________________________________________________
_____________________________________________________________________________
[IF PARTICIPANT USED CALCULATED SAVINGS AND IS A 2002-ONLY
PARTICIPANT, SKIP TO INSTRUCTIONS FOR K]

Page 7 of 11
J. If applicable, please compare projects where the "calculated savings" approach was used to projects where the "measured savings" approach was used, either in this program year or past program years. Where there any differences in your overall satisfaction, your customers' satisfaction, or the payment process in the two approaches? _____________________________________________________________________________
_____________________________________________________________________________
[IF PARTICIPATED BEFORE 2002 (BETWEEN 1998 & 2001) ASK K; ELSE SKIP TO L] K. If applicable, please describe your experience with any measured savings reports associated with
projects your firm was associated with for program years 1998 to 2001. _____________________________________________________________________________
_____________________________________________________________________________
L. Please describe your experiences with the installation requirements and payment process for
your 2002 SPC projects. Are installation requirements and payment processes reasonable? Please explain. _____________________________________________________________________________
_____________________________________________________________________________
M. What do you think about the incentive structure of the 2002 SPC Program, specifically, end use
incentive levels, the payout schedule, payments for calculated vs. measured savings, and the incentive caps? _____________________________________________________________________________
_____________________________________________________________________________
[IF PARTICIPATED PRIOR TO 2002 (I.A = 1,2,3, OR 4) ASK N, ELSE SKIP TO O]
N. Please describe any other aspects of the Program that you think were better or worse than in prior years? _____________________________________________________________________________
_____________________________________________________________________________
O. How would you rate your OVERALL satisfaction with the 2002 SPC program? Would you say that you are:
1. Very Satisfied 2. Somewhat Satisfied 3. Neither Satisfied nor Dissatisfied 4. Somewhat Dissatisfied 5. Very Dissatisfied 6. Don't Know / Not Applicable

Page 8 of 11
And why is that?_______________________________________________________________
_____________________________________________________________________________
P. How would you say that your experience with the UTILITIES administering the program has been to date? Would you say…
Excellent............................................................................................. 1 Good................................................................................................... 2 Acceptable, about what expected....................................................... 3 Somewhat poor .................................................................................. 4 Very Poor ........................................................................................... 5 DON’T KNOW/NOT APPLICABLE ............................................. 99
Why do you say that? [RECORD VERBATIM]
Q. Did you work directly with one of the utilities’ technical support contractors during your
project? (Clarify if necessary, they firms contracted with the utility to review applications, estimate savings, assist with measured savings plans, and perform site visits.)
Yes .......................................................................................................... 1 No ............................................................................................................ 2 Don’t Know/Refused ............................................................................. 99
[IF Q=1, ASK R, ELSE SKIP TO S]
R. How would you say that your experience with the TECHNICAL ASSISTANCE CONTRACTORS has been to date? Would you say…
Excellent............................................................................................. 1 Good................................................................................................... 2 Acceptable, about what expected....................................................... 3 Somewhat poor .................................................................................. 4 Very Poor ........................................................................................... 5 No contact with technical support contractor..................................... 6 DON’T KNOW/NOT APPLICABLE ............................................. 99
Why do you say that? [RECORD VERBATIM]
S. Did you use any of the SPC program tools and supporting materials, such as the savings calculator or the website?

Page 9 of 11
Used calculator? Yes .......................................................................................................... 1 No ............................................................................................................ 2 Don’t Know/Refused ............................................................................. 99
Used website?
Yes .......................................................................................................... 1 No ............................................................................................................ 2 Don’t Know/Refused ............................................................................. 99
Where they helpful?
Yes, very helpful ..................................................................................... 1 Yes, Somewhat......................................................................................... 2 No, did not help me.................................................................................. 3 No, did not use ......................................................................................... 4 Don’t Know/Refused ............................................................................. 99
Please explain:
_____________________________________________________________________ _____________________________________________________________________________
[ASK T IF PARTICIPATING WITH MORE THAN 1 UTILITY, SEE I.C; ELSE
SKIP TO IV]
T. If you have participated in the SPC program with more than one utility in 2002, did you notice any differences in how the program was implemented or administered by those utilities? Please elaborate [MAKE SURE TO SPECIFY WHICH UTILITIES ARE DISCUSSED AND ASSIGN THE COMMENTS CORRESPONDINGLY.] _____________________________________________________________________________
_____________________________________________________________________________
IV. SPC-RELATED MARKET AND PROGRAM EFFECTS Now I have a couple of questions about how the SPC program has affected your firms’ business, if at all.
A. Please describe how you use the incentive funds you've received from the 2002 SPC program. Are the funds passed through to the customer, retained completely, or shared between your firm and the customer?
Passed through to completely to customer............................................... 1 Retained completely................................................................................. 2 Shared....................................................................................................... 3
Page 10 of 11
A.1 What are the primary uses for those funds, for example, do they generally get applied to
reducing project installation costs, project development and auditing costs, etc.?
_____________________________________________________________________________
_____________________________________________________________________________
B. What effect, if any, has your participation in the 2002 SPC had on your business? For example, has it lead to any improvements in your firms’ efficiency-related business development, marketing approaches, costs of serving customers, or product and service offerings? _____________________________________________________________________________
____________________________________________________________________________
C. How important is the SPC program to the energy efficiency portion of your California business? Would you say…
1. Very Important 2. Somewhat Important 3. Not very important 4. Don't Know / Not Applicable
And why is that?
_____________________________________________________________________________
_____________________________________________________________________________
D. Do you have any examples of particularly innovative, comprehensive, or emerging technologies or projects that the 2002 SPC program made possible? (TRY TO GET CUSTOMER NAME) _____________________________________________________________________________
_____________________________________________________________________________
V. OTHER ISSUES
Now I have just a few more questions before we wrap up.
A. Thinking about your sales efforts with customers in California, in what percentage of your sales efforts with them do you promote participation in the SPC?
__________%
B. [IF >0% and <100%] What criteria do you use to decide whether to promote participation in the SPC program?
____________________________________________________________________

Page 11 of 11
C. Of your SPC projects [discussed on page 2], what percentage do you think you would have been
able to sell without the SPC incentive payments?____________ (# or %) And why is that? (Note if project size would have been reduced or if changes by year)
______________________________________________________________________
D. With regards to who sponsors the SPC application with the utility, does your firm prefer to:
Sponsor SPC applications itself .............................................................. 1 Have the customer sponsor the application.............................................. 2 No preference 99
And why is that?
_____________________________________________________________________________
E. Does your firm intend to participate in, or are you already participating in, the 2003 SPC program?
1. Yes, plan to participate 2. Yes, already participating 3. No, don't plan to participate 4. Unsure / undecided / don't know
IF “No” or “Unsure” please elaborate on why you do not plan to participate: _____________________________________________________________________________
F. Thinking about some of the kinds of things we’ve been discussing about the 2002 SPC program, are there any major differences in your experience with or opinion about the 2003 SPC program? _____________________________________________________________________________
VI. WRAP-UP
A. Finally, do you have any other comments or suggestions regarding your experience with the
SPC Program? _____________________________________________________________________________
That concludes the interview, thank you very, very much for your participation in
this evaluation effort.
THE END

APPENDIX C.5 EESP NON-PARTICIPANT SURVEY

Page 1 of 9
PY2002 SPC Non-Participant EESP Interview Guide
NAME PHONE
TITLE FAX
COMPANY E-MAIL
STREET ADDRESS
CITY INTERVIEWER
STATE CALL DATES
ZIP COMPLETE DATE
D&B SALES D&B EMPLOYEES
Hello, my name is ________, with Quantum Consulting, an energy research firm, and I am calling on behalf of the California Public Utilities Commission and the program evaluation staff at the California Investor-owned Utilities. May I please speak with ______________? [FOR FIRMS THAT PARTICIPATED BEFORE 2002 BUT NOT IN 2002] We are conducting a study on behalf of the California Public Utilities Commission. We are contacting energy service companies who did not participate in California's Non-Residential Standard Performance Contract (SPC) program in 2002. Your input to this research would be very valuable and, if possible, we would like to interview you. The interview will take about 15 minutes, and any information that is provided during the interview will remain strictly confidential. We will not identify or attribute any of your comments or company information. Is this a good time, or can we schedule a convenient time in the next couple of days to talk? [FOR FIRMS THAT NEVER PARTICIPATED IN SPC] We are conducting a study on behalf of the California Public Utilities Commission. We are contacting energy equipment contractors, designers, and efficiency specialists to obtain input and feedback on [UTILITY’s] Nonresidential Standard Performance Contract Program. Your input to this research would be very valuable and, if possible, we would like to interview you. The interview will take about 5 minutes, and any information that is provided during the interview will remain strictly confidential. We will not identify or attribute any of your comments or company information. Is this a good time, or can we schedule a convenient time in the next couple of days to talk? [IF HESITANT:] Your input to this survey is very important for ensuring the long-term success of these programs. Without input from industry representatives such as you, we cannot guarantee that the program will receive a fair and complete evaluation. [IF SCHEDULED:] Callback date/time:

Page 2 of 9
Thank you for taking part in this survey. The major purposes of this study are to provide feedback to the utilities and CPUC on the program. This interview is focused on experiences with the program to date.
Utility Reference Numbers for Interviewees Wanting to Confirm PGE Betsy Krieg 415-973-0016
SCE Pierre Landry 626-302-8288 SDGE Henry De Jesus 858-654-1723

Page 3 of 9
I. BACKGROUND INFORMATION
[POPULATE FROM DATABASES AHEAD OF TIME AND CONFIRM]
A. According to our records your firm DID NOT PARTICIPATE IN THE SPC PROGRAM IN 2002. Did you or your firm participate in the SPC program in 2002? 1. Yes, our firm played a significant role on one or more 2002 SPC projects 2. No, our firm had no significant role on 2002 SPC projects
[IF “YES” PARTICIPATING IN 2002, ASK I.A.1; OTHERWISE PROCEED TO I.B]
1. Our records do not indicate that your firm is participating as an application sponsor in the 2002 SPC. Did you sponsor accepted applications in 2002 or are you working on projects in which the customer is their own sponsor of the application? 1. Submitted our own accepted applications on behalf of our customers 2. Working on projects in which the customer is the sponsor of record
THANK YOU FOR YOUR TIME, THIS INTERVIEW IS TARGETED AT FIRMS THAT DID NOT PARTICIPATE IN THE 2002 SPC PROGRAM. IF YOU ARE INTERESTED, WE COULD INCLUDE YOU IN OUR INTERVIEWS OF FIRMS THAT DID PARTICIPATE IN THE 2002 PROGRAM
1. Request to be included in Participant interview – SWITCH TO PART SURVEY 2. Does not request to be included in Participant interviews – THANK AND TERMINATE.
[FOR PURE NON-PARTICIPANTS ASK I.B, FOR PREVIOUS PARTICIPANTS GO TO I.C]
B. [FOR PURE NON-PARTICIPANTS] According to our records your firm HAS NEVER PARTICIPATED in the nonresidential SPC program. Did you or your firm ever participate in the SPC program? 1. FIRM PARTICIPATED (SKIP TO I.D) 2. INDIVIDUAL PARTICPATED WHILE AT PREVIOUS FIRM (SKIP TO I.D.) 3. NEITHER FIRM NOR INDIVIDUAL PARTICIPATED (SKIP TO I.F) 4. UNSURE (SKIP TO I.F)
C. [FOR PREVIOUS PARTICIPANTS] According to our records, your firm DID
PARTICIPATE in the SPC program PRIOR TO 2002. Is this correct? 1 FIRM PARTICIPATED (CONTINUE) 2. INDIVIDUAL PARTICPATED WHILE AT PREVIOUS FIRM (CONTINUE) 3. FIRM DID NOT PARTICIPATE (DOUBLE-CHECK THEN SKIP TO I.F) 4. UNSURE (DOUBLE-CHECK THEN SKIP TO I.F)

Page 4 of 9
Clarifications:_____________________________________________________________
________________________________________________________________________
D. Our records show your firm participated in the SPC Program in the following years, is that
correct.
1998………………………………………………………1 1999………………………………………………………2
2000………………………………………………………3 2001………………………………………………………4
E. Does your firm have any applications that are pending or are still being processed from previous
years?
1. Yes 2. No
[IF YES] Please elaborate on the status of these applications. ________________________________________________________________________
________________________________________________________________________
________________________________________________________________________
F. [FOR PREVIOUS PARTICIPANTS MARK “YES” BELOW AND PROCEED TO SECTION II] Prior to this call, had you ever heard of the California Non-Residential Standard Performance Contract Program?
1. Yes 2. No

Page 5 of 9
II. FIRMOGRAPHICS Now I have a few questions on the general characteristics of your company.
A. What type of energy services firm is your firm? Would you say: [IMPORTANT: NOTE ANY UNIQUE "SELF-CLASSIFICATION" TERMS.]
1. "Traditional" ESCO (predominantly performance based contracts) 2. Energy Efficiency Services Company (EESP, mostly efficiency services) 3. Retail Energy Service Co. (RESCO) (selling both energy commodity and efficiency
services) 4. Architecture / Engineering / Design Engineering 5. Building Maintenance and Operations 6. Equipment Vendor/Distributor 7. Other (please describe) 8. Firm provides no energy-related equipment or energy-efficiency related products
or services to end users - TERMINATE
What are the primary products and service provided by your firm: _______________________________________________________________________
________________________________________________________________________
________________________________________________________________________
B. Which of the following best describes the geographic focus of your operations?
1. Local – What area? ______________________________ 2. Regional – What area? ___________________________ 3. Statewide (California) 4. National 5. International
C. How many years has your company been providing energy efficiency services in California?
________________
D. Approximately how many full-time equivalent employees (FTEs) do you employ, including all in-house contractors?
___ # FTEs in California?
___ # FTEs nationally?

Page 6 of 9
[IF I.F = 2, I.E., UNAWARE OF SPC PROGRAM, SKIP TO SECTION IV]
III. PROGRAM PERCEPTIONS FOR EESPS AWARE OF SPC
A. Do you recall when and how you became aware of the nonresidential SPC program?
_____________________________________________________________________________
_____________________________________________________________________________
B. Why didn’t your firm participate in the nonresidential SPC program in 2002? [DO NOT
PROMPT, ACCEPT MULTIPLE]
1. Tried to participate but program funds were expended 2. Firm’s projects typically do not require program assistance 3. Didn’t have enough information on program 4. Had heard that program participation was difficult 5. Didn’t think benefits of participation outweighed costs 6. Interested in participating but never got around to it 7. Firm no longer provides energy efficiency services 8. Other
Please Elaborate:
_____________________________________________________________________________
_____________________________________________________________________________
C. [SKIP IF NEVER PARTICIPATED IN SPC] Were there any aspects of the SPC program as
administered in prior years that influenced your decision to not participate in 2002?
_____________________________________________________________________________
_____________________________________________________________________________
D. Are you familiar with the changes to the program that occurred in 2001 and 2002?
Yes………………………………………………………1
No……………………………………………………….2
[IF YES] Did these changes increase or decrease your firm’s interest in participating in 2002? _____________________________________________________________________________
_____________________________________________________________________________

Page 7 of 9
E. Based upon your experience or perceptions, what do you view as the primary strengths and
weaknesses of the nonresidential SPC program?
Strengths:_____________________________________________________________________ _____________________________________________________________________________Weaknesses:_______________________________________________________________________________________________________________________________________________ How, if at all, has your perspective of the program’s strengths and weaknesses changed over the history of the program? __________________________________________________________________________________________________________________________________________________________
F. Now I’d like to ask you how familiar you are with several aspects of the 2002 SPC program. Please rate how familiar you are with the following elements of the 2002 program, where 1 = not at all familiar and, 5 = very familiar]
1. Program Objectives ______ 2. Program Rules & Requirements ______ 3. Application Process ______ 4. "Measured" vs. "Calculated" savings requirements ______ 5. Incentive Levels and Payment Process ______
G. Did any of the above elements influence your decision to not participate? [PROBE] _____________________________________________________________________________
_____________________________________________________________________________
H. [SKIP IF NEVER PARTICIPATED IN SPC; ASK ONLY IF I.B or I.C = 1 or 2; I.E., IF
RESPONDENT OR THEIR CURRENT FIRM PARTICIPATED IN SPC PRIOR TO 2002] Now I’d like you to rate your experience with the following elements of the program you experienced while participating in the SPC program PRIOR TO 2002, where 1 = Very Dissatisfied and 5 = Very Satisfied. [Note year of participation to which comments relate, note multiple scores for different years if necessary]
Score Year(s) 1. Program Objectives _____ _____ 2. Program Rules & Requirements _____ _____ 3. Application Process _____ _____ 4. "Measured" vs. "Calculated" savings requirements _____ _____ 5. Incentive Levels and Payment Process _____ _____
I. What changes to the SPC program, if any, would increase the likelihood that your firm would
participate in the program in the future?

Page 8 of 9
_____________________________________________________________________________
_____________________________________________________________________________
J. [SKIP IF NEVER PARTICIPATED] What effect, if any, do you think the SPC has had or could have on your business and the market for energy efficiency in California? For example, has it, or do you think it could, lead to any improvements in your firms’ efficiency-related business development, marketing approaches, costs of serving customers, or product and service offerings? _____________________________________________________________________________
_____________________________________________________________________________
[SKIP SECTION IV AND GO DIRECTLY TO SECTION V –WRAP UP]
[SECTION IV IS FOR RESPONDENTS UNAWARE OF SPC, I.E., I.F = 2]
IV. RESPONDENTS THAT ARE NOT AWARE OF THE PROGRAM
The 2002 SPC program is a performance-based energy efficiency program, which means that, unlike traditional rebate programs in which dollars are paid for installing specific items from a pre-approved list of energy-saving equipment, SPC offers financial incentives based on verified energy savings for custom-designed projects. The program incentives are tied to the type of measure implemented. The program pays 5 cents per kilowatt-hour saved for lighting measures, 14 cents per kilowatt-hour saved for HVAC and refrigeration measures, and 8 cents per kilowatt-hour saved for all other types of measures. The program pays up to 50 percent of the incremental costs for energy-efficiency projects.
A. What communication methods and channels would be most effective at keeping you informed about SPC program participation benefits and opportunities in the future? [PROBE FOR SPECIFICS, E.G., TRADE ASSOCIATION/MAGAZINE NAMES, DIRECT MAIL OF BROCHURES, EMAILS, WEBSITES, SEMINARS, ETC.] _____________________________________________________________________________
_____________________________________________________________________________

Page 9 of 9
V. WRAP-UP
A. Do you have any other comments or suggestions regarding your past experience with or impression of the SPC Program? _____________________________________________________________________________
_____________________________________________________________________________
B. Do you intend to participate/ are you participating in the 2003 SPC?
1. Yes, plan to participate 2. Yes, already participating 3. No, don't plan to participate 4. Unsure / undecided / don't know
IF “No” or “Unsure” please elaborate on why?: _____________________________________________________________________________
_____________________________________________________________________________
THE END

APPENDIX C.6 PROGRAM MANAGER INTERVIEW GUIDE

oa:wsce37:instruments:utility:guide
2002 NRSPC Utility Interview Guide June 27, 2003
The evaluation team will provide an overview of the evaluation objectives and planned data collection activities to begin the interview.
1 PY02 PROGRAM DESIGN AND OBJECTIVES
�� Any additions or elaboration on program goals beyond what is included in CPUC program filings?
�� Are there any changes in the basic program design that you would recommend beyond those already incorporated into the 2003 programs?
2 PY2002 TRACKING DATA
[Evaluation team will provide a summary overview of PY2002 Tracking Data]
��Comments on data summary and trends?
3 PY02 PROMOTION OF THE NSPC
�� What types of marketing and promotion were conducted for the PY02 Program?
�� Did early subscription of funds cause changes in outreach plans for 2002?
4 PY02 MARKET EFFECTS
�� In general, what impact do you think the 2002 program had on the marketplace?
�� Did you see much innovation in project design or measures?
�� Did you see any major changes in the level of interest in the marketplace between 2001 and 2002? (perhaps as evidenced by information requests, length of waiting lists?)
�� Any new thoughts on early or potential market effects not previously discussed?
5 PY02 ADMINISTRATION
5.1 Organization
�� Overview of organizational structure (admin, marketing, processing, verifications, use of technical support contractors, etc.)
�� Any new administrative / organizational issues?

oa:wsce37:instruments:utility:guide
�� Pros and cons of current structures/any changes being considered?
�� Satisfaction with technical consultants (Discuss plans to interview subcontractors)
5.2 Application Process / Procedures
5.2.1 Project Application and Installation
�� Quality of applications?
�� Approval logistics?
�� Percent approved?
�� Percent installed?
��Probe and discuss the June 1, 2003 installation requirement ��What are some of the reasons why project PIRs are not complete by this date? ��Does the installation lag beyond June 1 cause any issues from an external or internal
point of view? ��What happens when projects drop out past the end of the program year? ��Should the required installation date be moved out in future years?
�� Reasons rejected?
�� Projects withdrawn? Discuss dropout survey results.
�� Comments on customer/ project size mix, issues, appropriateness?
�� Any issues associated with free-riders or spillover?
�� Comments on any unusual trends found in the tracking data
5.2.2 Measurement and Verification
�� Is current mix of calculated/measured optimal?
�� Any issues with over/under usage of M&V?
�� General Issues around M&V plan approval
�� Any issues around calculated savings option
�� Status of PY1998/1999 1st and 2nd year M&V reports?
�� Has there ever been a complete compiling and integration of realization rates from the M&V results obtained through the history of the program? Would that provide any value/useful information for informing calculated savings?

oa:wsce37:instruments:utility:guide
5.2.3 EESP vs. Self-sponsorship
�� Trends/Issues in sponsorship? [Probe: Fraction of EESP sponsored applications is down.]
5.2.4 Measures
�� How well did 2002 eligible measures work
�� Any issues with eligibility, end use groupings, incentive levels?
5.2.5 Invoicing / Payment
�� Any payment/timing issues?
6 OTHER ISSUES UNIQUE TO PY2002?
7 HOW IS PY2003 GOING?
8 THOUGHTS ON PY2004 PROGRAM DESIGN CHANGES (IF ANY)
9 COMMENTS ON EVALUATION
�� Any questions on the evaluation?
�� Any further requests/needs from the evaluation team?