citigroup January 20, 2006 - Fourth Quarter Financial Supplement
SECURITIES AND EXCHANGE COMMISSIONWashington, D. C. 20549
FORM 10-Q
QUARTERLY REPORT PURSUANT TO SECTION 13 OR 15(d) OFTHE SECURITIES EXCHANGE ACT OF 1934
For the quarterly period ended March 31, 2002
OR
TRANSITION REPORT PURSUANT TO SECTION 13 OR 15(d) OFTHE SECURITIES EXCHANGE ACT OF 1934
For the transition period from ________ to _______
Commission file number 1-9924
Citigroup Inc.(Exact name of registrant as specified in its charter)
Delaware(State or other jurisdiction of
incorporation or organization)
52-1568099(I.R.S. Employer
Identification No.)
399 Park Avenue, New York, New York 10043
(Address of principal executive offices) (Zip Code)
(212) 559-1000(Registrant’s telephone number, including area code)
Indicate by check mark whether the registrant (1) has filed all reports required to be filed by Section 13 or 15(d) of theSecurities Exchange Act of 1934 during the preceding 12 months (or for such shorter period that the registrant was requiredto file such reports), and (2) has been subject to such filing requirements for the past 90 days. Yes x No
Indicate the number of shares outstanding of each of the issuer’s classes of common stock as of the latest practicable date:
Common stock outstanding as of April 30, 2002: 5,147,065,889
Available on the Web at www.citigroup.com
Citigroup Inc.
TABLE OF CONTENTS
Part I − Financial Information
Item 1. Financial Statements: Page No.
Consolidated Statement of Income (Unaudited) − Three Months Ended March 31, 2002 and 2001 44
Consolidated Statement of Financial Position − March 31, 2002 (Unaudited) and December 31, 2001 45
Consolidated Statement of Changes in Stockholders’ Equity (Unaudited) − Three Months Ended March 31, 2002 and 2001 46
Consolidated Statement of Cash Flows (Unaudited) − Three Months Ended March 31, 2002 and 2001 47
Notes to Consolidated Financial Statements (Unaudited) 48
Item 2. Management’s Discussion and Analysis of Financial Condition and Results of Operations 1 - 43
Item 3. Quantitative and Qualitative Disclosures About Market Risk 33 - 3556
Part II - Other Information
Item 4. Submission of Matters to a Vote of Security Holders 59
Item 6. Exhibits and Reports on Form 8-K 60
Signatures 61
Exhibit Index 62

1
CITIGROUP INC. AND SUBSIDIARIES
MANAGEMENT'S DISCUSSION and ANALYSIS of FINANCIAL CONDITIONand RESULTS of OPERATIONS
Impact from Argentina’s Economic Changes
During the first quarter of 2002, Argentina continued to experience significant political and economic changes. The government ofArgentina implemented substantial economic changes, including abandoning the country’s fixed U.S. dollar-to-peso exchange rate, aswell as the redenomination of substantially all remaining loans and deposits and certain other assets and liabilities denominated inU.S. dollars into pesos. As a result of the impact of these government actions on operations, the Company changed its functionalcurrency in Argentina from the U.S. dollar to the Argentine peso. Additionally, the government announced the terms of certaincompensation instruments it has committed to issue to financial institutions, to compensate them in part for losses incurred as a resultof the redenomination events. The government also announced a 180 day moratorium against creditors filing foreclosures orbankruptcy proceedings against borrowers. The government actions, combined with the severe recessionary economic situation andthe devaluation of the peso, have adversely impacted Citigroup's consumer and commercial borrowers in Argentina.
To reflect the impact of the economic situation in Argentina, Citigroup recorded a total of $858 million in pretax charges in the 2002first quarter, as follows: a $475 million addition to the allowance for credit losses, $269 million in loan and investment write-downs, a$72 million net charge for currency redenomination and other foreign currency items, and a $42 million restructuring charge. The $72million net charge includes a benefit from the compensation instruments the Argentine government has committed to issue.
First Quarter 2002 Pretax Charges
In millions of dollars TotalGlobal
CorporateGlobal
ConsumerInvestmentActivities
Provision for credit losses ($475) ($240) ($235) $ -Credit and investment write-downs (269) (117) (52) (100)Redenomination charge – net (72) (101) 29 -Pretax impact – core income (816) (458) (258) (100)Restructuring charge (42) (9) (33) -Total pretax income impact ($858) ($467) ($291) ($100)
In addition, the impact of the devaluation of the peso since January 1, 2002 produced foreign currency translation losses that reducedCitigroup’s equity by $512 million.
As the economic situation, financial regulations and implementation issues in Argentina remain fluid, we continue to work with thegovernment and our customers and will continue to monitor conditions closely. Additional losses may be incurred. This statement isa forward-looking statement within the meaning of the Private Securities Litigation Reform Act. See “Forward-Looking Statements”on page 32.
Initial Public Offering and Tax-Free Distribution of Travelers Property Casualty Corp.
Travelers Property Casualty Corp. (TPC) (an indirect wholly-owned subsidiary of Citigroup on December 31, 2001) sold 231 millionshares of its class A common stock representing approximately 23.1% of its outstanding equity securities at $18.50 per share in aninitial public offering on March 27, 2002. Citigroup recognized an after-tax gain of $1.061 billion as a result of the TPC offering.Citigroup plans to make a tax-free distribution to its stockholders of a portion of its remaining ownership interest in TPC by year-end2002, such that following the distribution, Citigroup would remain a holder of approximately 9.9% of TPC’s outstanding equitysecurities. This statement is a forward-looking statement within the meaning of the Private Securities Litigation Reform Act. See"Forward-Looking Statements" on page 32. Income statement minority interest will be recognized on the initial public offeringportion beginning on April 1, 2002.
The distribution is subject to receipt of a private letter ruling from the Internal Revenue Service that the distribution will be tax-free toCitigroup, its stockholders and TPC, as well as various other conditions. These other conditions may include receipt of any necessarythird-party consents and regulatory approvals, the existence of satisfactory market conditions and the satisfaction of any conditionswhich may be imposed by the Internal Revenue Service. Citigroup has no obligation to consummate the distribution by the end of2002 or at all, whether or not these conditions are satisfied.
The distribution of TPC, if it occurs, will be treated as a dividend to stockholders for accounting purposes that will reducestockholders’ equity by an amount in excess of $7 billion. Prior to the initial public offering during 2002, TPC paid dividends toCitigroup in the form of notes in the aggregate amount of $5.095 billion.

2
In connection with the initial public offering, Citigroup entered into an agreement with TPC that provides that, in any fiscal year inwhich TPC records asbestos-related income statement charges in excess of $150 million, net of any reinsurance, Citigroup will pay toTPC the amount of any such excess up to a cumulative aggregate of $800 million, reduced by the tax effect of the highest applicablefederal income tax rate. A portion of the gain as a result of the offering was deferred to offset any payments arising in connection withthis agreement.
Citigroup and TPC are currently reviewing whether Citigroup business units will continue to offer certain TPC products. The twocompanies plan to enter into an agreement under which Citigroup businesses will provide investment advisory and certain back officeservices to TPC during a transition period. Ongoing revenues on our remaining ownership in TPC following the distribution are notexpected to be significant.
Accounting Changes
Business Combinations, Goodwill and Other Intangible AssetsEffective July 1, 2001, the Company adopted the provisions of Statement of Financial Accounting Standards (SFAS) No. 141,"Business Combinations" (SFAS No. 141) and certain provisions of SFAS No. 142, "Goodwill and Other Intangible Assets" (SFASNo. 142), as required for goodwill and indefinite-lived intangible assets resulting from business combinations consummated after June30, 2001. The new rules require that all business combinations consummated after June 30, 2001 be accounted for under the purchasemethod. The nonamortization provisions of the new rules affecting goodwill and intangible assets deemed to have indefinite lives areeffective for all purchase business combinations completed after June 30, 2001.
On January 1, 2002, Citigroup adopted the remaining provisions of SFAS No. 142, when the rules became effective for calendar yearcompanies. Under the new rules, effective January 1, 2002, goodwill and intangible assets deemed to have indefinite lives are nolonger amortized, but are subject to annual impairment tests. Other intangible assets will continue to be amortized over their usefullives. During the first quarter of 2001, the after-tax amortization expense related to goodwill and indefinite-lived intangible assetswhich are no longer amortized was as follows:
First QuarterIn millions of dollars 2001
Global ConsumerNorth AmericaCitibanking North America $ 4North America Cards 3CitiFinancial 19Primerica Financial Services 2
Total North America 28
InternationalWestern Europe 2Japan 14
Latin America 5Mexico 5
Total Emerging Markets Consumer Banking 10
Total International 26Other 3
Total Global Consumer 57
Global CorporateCorporate and Investment Bank 20Emerging Markets Corporate Banking and Global Transaction Services 8
Total Global Corporate 28
Global Investment Management and Private BankingTravelers Life and Annuity (1)Citigroup Asset Management 11
Total Global Investment Management and Private Banking 10
Property and CasualtyPersonal Lines 5Commercial Lines 15
Total Property and Casualty 20
Corporate/Other 5
Total after-tax amortization expense $120

3
The Company has performed the required impairment tests of goodwill and indefinite-lived intangible assets as of January 1, 2002.There was no impairment of goodwill upon adoption of SFAS No. 142. The initial adoption resulted in a cumulative adjustment of$47 million after-tax recorded as a charge to earnings related to the impairment of certain intangible assets related to the Property andCasualty and Global Investment Management and Private Banking businesses. See Note 2 to the Consolidated Financial Statementsfor additional information about this accounting change.
Derivatives and Hedge AccountingOn January 1, 2001, Citigroup adopted SFAS No. 133, “Accounting for Derivative Instruments and Hedging Activities” (SFAS No.133). SFAS No. 133 changed the accounting treatment of derivative contracts (including foreign exchange contracts) that areemployed to manage risk outside of Citigroup’s trading activities, as well as certain derivative instruments embedded in othercontracts. SFAS No. 133 requires that all derivatives be recorded on the balance sheet at their fair value. The treatment of changes inthe fair value of derivatives depends on the character of the transaction, including whether it has been designated and qualifies as partof a hedging relationship. The majority of Citigroup’s derivatives are entered into for trading purposes and were not impacted by theadoption of SFAS No. 133. The cumulative effect of adopting SFAS No. 133 at January 1, 2001 was an after-tax charge of $42million included in net income and an increase of $25 million included in other changes in stockholders’ equity from nonownersources.
Business Focus
The table below shows the core income (loss) for each of Citigroup’s businesses:
First QuarterIn millions of dollars, except per share amounts 2002 2001 (1)
Global Consumer
North AmericaCitibanking North America $ 183 $ 149Mortgage Banking 93 75North America Cards 520 472CitiFinancial 320 220Primerica Financial Services 128 125
Total North America 1,244 1,041
InternationalWestern Europe 155 112Japan 238 205
Asia 149 147Latin America (89) 68Mexico 280 4Central & Eastern Europe, Middle East and Africa 24 18
Total Emerging Markets Consumer Banking 364 237
Total International 757 554e-Consumer (20) (24)Other (29) (17)
Total Global Consumer 1,952 1,554
Global CorporateCorporate and Investment Bank 987 1,023Emerging Markets Corporate Banking and Global Transaction Services 195 421
Total Global Corporate 1,182 1,444
Global Investment Management and Private BankingTravelers Life and Annuity 200 210The Citigroup Private Bank 112 95Citigroup Asset Management 94 79
Total Global Investment Management and Private Banking $ 406 $ 384
(Business Focus table continues on the following page)

4
(Business Focus table continued)
First QuarterIn millions of dollars, except per share amounts 2002 2001 (1)
Property and Casualty (Excluding Realized Portfolio Gains and Losses)Personal Lines $ 65 $ 87Commercial Lines 261 278Interest and Other 1 (23)
Total Property and Casualty 327 342
Investment Activities 70 132
Corporate/Other (78) (196)
Total Core Income 3,859 3,660
Restructuring-Related Items, After-Tax (2) (30) (80)Gain on Sale of Stock by Subsidiary, After-Tax (3) 1,061 -Cumulative Effect of Accounting Changes (4) (47) (42)
Net Income $4,843 $3,538
Diluted Earnings Per Share:
Core Income $0.74 $0.71Net Income $0.93 $0.69
(1) Reclassified to conform to the current period’s presentation.(2) Restructuring-related items in the 2002 first quarter related principally to severance and costs associated with the reduction of staff in Argentina within the Latin
America consumer and corporate businesses, and in the 2001 first quarter related principally to severance and costs associated with the reduction of staff in theGlobal Corporate businesses. See Note 8 to the Consolidated Financial Statements.
(3) TPC sold 231 million shares of its class A common stock at $18.50 per share in an initial public offering on March 27, 2002. Citigroup recognized an after-taxgain of $1.061 billion as a result of the TPC offering. See Note 3 to the Consolidated Financial Statements.
(4) Accounting Changes refer to the first quarter 2002 adoption of the remaining provisions of SFAS No. 142, and the first quarter 2001 adoption of SFAS No. 133.See Note 2 to the Consolidated Financial Statements.

5
Results of Operations
Managed Basis Reporting
The discussion that follows includes amounts reported in the financial statements (owned basis) adjusted to include certain effects ofsecuritization activity and receivables held for securitization (managed basis). On a managed basis, these earnings are reclassified andpresented as if the receivables had neither been held for securitization nor sold.
Income Analysis
The income analysis below reconciles amounts shown in the Consolidated Statement of Income on page 44 to the basis presented inthe business segment discussions.
First QuarterIn millions of dollars 2002 2001Total revenues, net of interest expense $20,995 $20,281Effect of securitization activities 1,021 766Adjusted revenues, net of interest expense 22,016 21,047Total operating expenses 9,812 10,501Restructuring-related items (47) (132)Adjusted operating expenses 9,765 10,369Benefits, claims, and credit losses 5,348 4,201Effect of securitization activities 1,021 766Adjusted benefits, claims, and credit losses 6,369 4,967Core income before income taxes and minority interest 5,882 5,711Taxes on core income 2,006 2,042Minority interest, net of tax 17 9Core income 3,859 3,660Restructuring-related items, after-tax (30) (80)Gain on sale of stock by subsidiary, after-tax 1,061 -Cumulative effect of accounting changes (47) (42)Net Income $ 4,843 $ 3,538
Income and Earnings Per Share
Citigroup reported core income of $3.859 billion or $0.74 per diluted common share in the 2002 first quarter, up 5% and 4% from$3.660 billion or $0.71 in the 2001 first quarter. Core income in the 2002 first quarter excluded the after-tax gain on sale of TPC’sstock, an after-tax charge of $30 million for restructuring-related items and an after-tax charge of $47 million reflecting the cumulativeeffect of adopting SFAS No. 142 (as described in Notes 2, 3 and 8 of Notes to Consolidated Financial Statements). Net income for thequarter was $4.843 billion or $0.93 per diluted share, up 37% and 35% from $3.538 billion or $0.69 in the year-ago quarter. Coreincome return on common equity was 19.1% compared to 22.5% a year ago.
Global Consumer core income increased $398 million or 26% while Global Corporate declined $262 million or 18%. GlobalInvestment Management and Private Banking grew $22 million or 6%, while Property and Casualty decreased $15 million or 4% andInvestment Activities decreased $62 million or 47% from the 2001 first quarter.
Revenues, Net of Interest Expense
Adjusted revenues, net of interest expense, of $22.0 billion in the 2002 first quarter were up $1.0 billion or 5% from the 2001 firstquarter. Global Consumer revenues were up $1.7 billion or 20% in the 2002 first quarter to $10.2 billion, led by a $932 millionincrease in Mexico, reflecting the Banamex acquisition. North America (excluding Mexico) was up $810 million or 14%, includingincreases of $426 million or 14% in North America Cards, $153 million or 25% in Citibanking North America, and $149 million or11% in CitiFinancial. Property and Casualty revenues increased $150 million or 5% from the year-ago quarter.
Global Corporate revenues of $6.7 billion decreased $830 million or 11% from the 2001 first quarter, including a $637 million or 11%decrease in the Corporate and Investment Bank, reflecting decreases in global equities. Additionally, Emerging Markets CorporateBanking and Global Transaction Services revenues were down $193 million or 11%, reflecting declines in all regions.
Global Investment Management and Private Banking revenues of $1.7 billion in the 2002 first quarter were down $230 million or 12%from the 2001 first quarter, reflecting declines in Travelers Life and Annuity (TLA). Revenues from Investment Activities in the 2002first quarter declined $87 million or 37% from year-ago levels, primarily reflecting higher impairment write-downs in insurance-

6
related and other proprietary investments, and write-downs on certain investments in Argentina, partially offset by higher venturecapital results.
Selected Revenue Items
Net interest revenue was $9.7 billion in the 2002 first quarter, up $2.1 billion or 27% from the comparable 2001 period, reflectingacquisitions and business volume growth. Total commissions, asset management and administration fees, and other fee revenues of$5.4 billion were down $169 million or 3%, primarily as a result of lower Private Client transactional activity, partially offset byvolume-related growth in other customer activities and assets under fee-based management. Insurance premiums of $3.4 billion wereflat to year-ago levels.
Principal transactions revenues of $1.7 billion were down $659 million or 28% from a year ago, primarily reflecting declines in globalequities. Realized gains from sales of investments were down $397 million to $54 million in the 2002 quarter, primarily in theCompany’s insurance portfolio. Other income as shown in the Consolidated Statement of Income of $856 million decreased $177million from 2001, primarily reflecting an increase in securitized card losses, partially offset by higher venture capital results.
Operating Expenses
Adjusted operating expenses, which exclude restructuring-related items, were $9.8 billion for the 2002 first quarter, down $604million or 6% from the comparable 2001 period. The decrease reflects expense control initiatives, lower incentive compensation, andthe absence of goodwill and indefinite-lived intangible asset amortization in the 2002 first quarter due to the adoption of SFAS No.141 and SFAS No. 142, partially offset by the impact of acquisitions.
Global Consumer expenses were up 6% from the 2001 first quarter, while Global Corporate expenses were down 17% and GlobalInvestment Management and Private Banking expenses decreased 8% from the year-ago quarter.
Restructuring-Related Items
Restructuring-related items of $47 million ($30 million after-tax) in the 2002 first quarter primarily related to severance and costsassociated with the reduction of staff in Argentina within the Latin America consumer and corporate businesses. Restructuring-relateditems of $132 million ($80 million after-tax) in the 2001 first quarter primarily represented severance charges related to downsizingcertain front and back office functions in the Corporate and Investment Bank in order to align its cost structure with market conditions.
Benefits, Claims, and Credit Losses
Adjusted benefits, claims, and credit losses were $6.4 billion in the 2002 first quarter, up $1.4 billion or 28% from the 2001 firstquarter. Policyholder benefits and claims increased 2% from the 2001 first quarter to $2.8 billion, primarily as a result of increasedvolume in Property and Casualty, partially offset by declines in TLA. The adjusted provision for credit losses increased 23% from ayear ago.
Global Consumer adjusted provisions for benefits, claims, and credit losses of $3.2 billion were up 45% from the 2001 first quarter,reflecting increases in North America Cards, Latin America, Mexico and CitiFinancial. Managed net credit losses were $2.654 billionand the related loss ratio was 3.36% in the 2002 first quarter, as compared to $2.580 billion and 3.20% in the preceding quarter and$1.931 billion and 2.61% a year ago. The managed consumer loan delinquency ratio (90 days or more past due) increased to 2.44%from 2.37% at December 31, 2001 and 2.04% a year ago.
Global Corporate provisions for benefits, claims, and credit losses of $680 million in the 2002 first quarter increased $411 millionfrom year-ago levels, primarily due to an addition to the loan loss reserve and write-offs in Emerging Markets Corporate Banking andGlobal Transaction Services reflecting the economic deterioration in Argentina and higher loss rates in the transportation leasingportfolio in the Corporate and Investment Bank.
Commercial cash-basis loans at March 31, 2002 and 2001 were $4.5 billion and $2.4 billion, respectively, while the commercial OtherReal Estate Owned (OREO) portfolio totaled $270 million and $301 million, respectively. The increase in cash-basis loans fromMarch 31, 2001 was primarily related to the acquisition of Banamex, the transportation portfolio, and increases attributable toborrowers in the telecommunication and energy industries. Commercial cash-basis loans at March 31, 2002 increased $458 millionfrom December 31, 2001. The improvements in OREO were primarily related to the North America real estate portfolio.

7
Capital
Total capital (Tier 1 and Tier 2) was $78.9 billion or 11.59% of net risk-adjusted assets, and Tier 1 capital was $62.2 billion or 9.13%at March 31, 2002, compared to $75.8 billion or 10.92% and $58.4 billion or 8.42%, respectively, at December 31, 2001.
The Income line in each of the following business segment discussions excludes the cumulative effect of adopting SFAS No. 133. SeeNote 2 of Notes to Consolidated Financial Statements.
GLOBAL CONSUMER
First Quarter %In millions of dollars 2002 2001 (1) ChangeTotal revenues, net of interest expense $ 9,199 $7,718 19Effect of securitization activities 1,021 766 33Adjusted revenues, net of interest expense 10,220 8,484 20Adjusted operating expenses (2) 4,071 3,829 6Provisions for benefits, claims, and credit losses 2,152 1,417 52Effect of securitization activities 1,021 766 33Adjusted provisions for benefits, claims, and credit losses 3,173 2,183 45Core income before taxes and minority interest 2,976 2,472 20Income taxes 1,014 913 11Minority interest, after-tax 10 5 100Core income 1,952 1,554 26Restructuring-related items, after-tax (18) (12) (50)Income $ 1,934 $1,542 25
(1) Reclassified to conform to the current period’s presentation.(2) Excludes restructuring-related items.
Global Consumer -- which provides banking, lending, including credit and charge cards, and investment and personal insuranceproducts and services to customers around the world -- reported core income of $1.952 billion in the 2002 first quarter, up $398million or 26% from 2001. North America core income increased $203 million or 20%, marked by double-digit growth inCitiFinancial, Mortgage Banking, Citibanking North America and North America Cards. The developed markets businesses ofWestern Europe and Japan reported core income of $393 million, up $76 million or 24%, primarily reflecting the impact of higherbusiness volumes, partially offset by increased credit losses. Core income in Emerging Markets Consumer increased $127 million or54% to $364 million in the first quarter of 2002, as the impact of the Banamex acquisition was partially offset by losses in Argentina.Income of $1.934 billion in the 2002 first quarter and $1.542 billion in the 2001 first quarter included restructuring-related charges of$18 million ($29 million pretax) and $12 million ($19 million pretax), respectively. See Note 8 of Notes to Consolidated FinancialStatements for a discussion of the restructuring-related items.
North America
Citibanking North America
First Quarter %In millions of dollars 2002 2001 (1) ChangeTotal revenues, net of interest expense $768 $615 25Total operating expenses 453 368 23Provision for credit losses 24 7 NMIncome before taxes 291 240 21Income taxes 108 91 19Income $183 $149 23Average assets (in billions of dollars) $ 16 $ 9 78Return on assets 4.64% 6.71%
(1) Reclassified to conform to the current period’s presentation.NM Not meaningful
Citibanking North America -- which delivers banking, lending, and investment and insurance services to customers throughCitibank’s branches and electronic delivery systems -- reported income of $183 million in the 2002 first quarter, up $34 million or23% from 2001, primarily reflecting the July 2001 acquisition of European American Bank (EAB) along with growth in revenues.
8
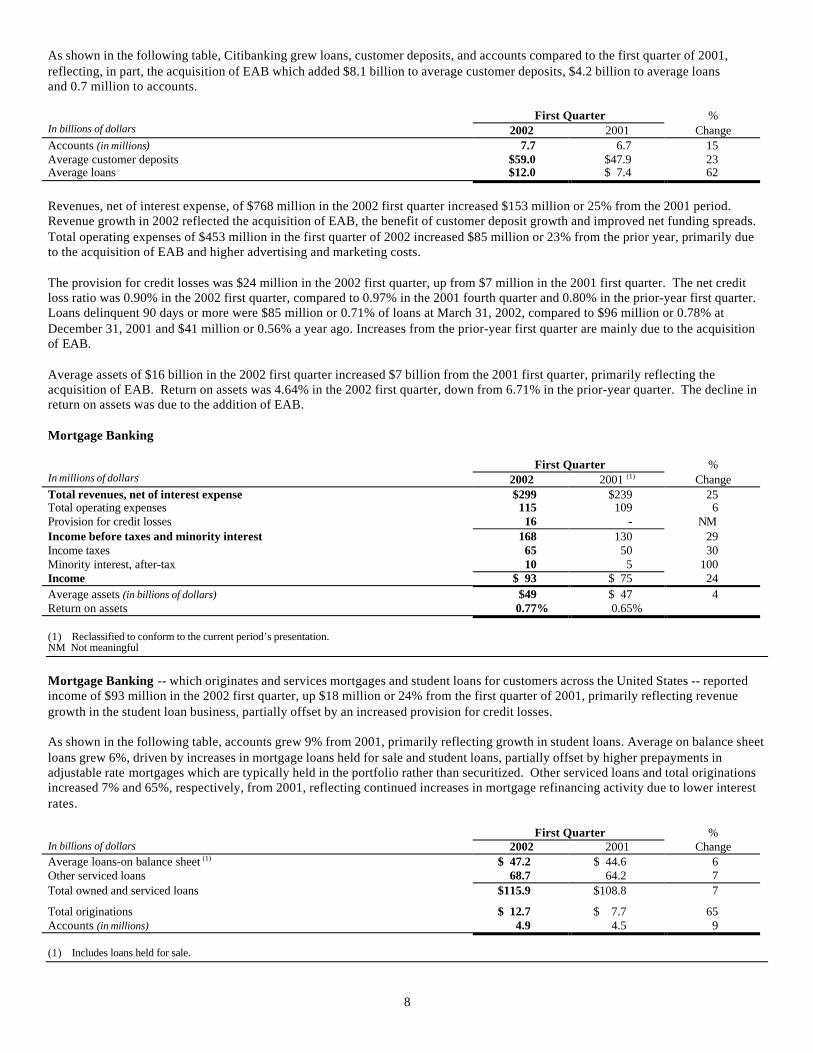
As shown in the following table, Citibanking grew loans, customer deposits, and accounts compared to the first quarter of 2001,reflecting, in part, the acquisition of EAB which added $8.1 billion to average customer deposits, $4.2 billion to average loansand 0.7 million to accounts.
First Quarter %In billions of dollars 2002 2001 ChangeAccounts (in millions) 7.7 6.7 15Average customer deposits $59.0 $47.9 23Average loans $12.0 $ 7.4 62
Revenues, net of interest expense, of $768 million in the 2002 first quarter increased $153 million or 25% from the 2001 period.Revenue growth in 2002 reflected the acquisition of EAB, the benefit of customer deposit growth and improved net funding spreads.Total operating expenses of $453 million in the first quarter of 2002 increased $85 million or 23% from the prior year, primarily dueto the acquisition of EAB and higher advertising and marketing costs.
The provision for credit losses was $24 million in the 2002 first quarter, up from $7 million in the 2001 first quarter. The net creditloss ratio was 0.90% in the 2002 first quarter, compared to 0.97% in the 2001 fourth quarter and 0.80% in the prior-year first quarter.Loans delinquent 90 days or more were $85 million or 0.71% of loans at March 31, 2002, compared to $96 million or 0.78% atDecember 31, 2001 and $41 million or 0.56% a year ago. Increases from the prior-year first quarter are mainly due to the acquisitionof EAB.
Average assets of $16 billion in the 2002 first quarter increased $7 billion from the 2001 first quarter, primarily reflecting theacquisition of EAB. Return on assets was 4.64% in the 2002 first quarter, down from 6.71% in the prior-year quarter. The decline inreturn on assets was due to the addition of EAB.
Mortgage Banking
First Quarter %In millions of dollars 2002 2001 (1) ChangeTotal revenues, net of interest expense $299 $239 25Total operating expenses 115 109 6Provision for credit losses 16 - NMIncome before taxes and minority interest 168 130 29Income taxes 65 50 30Minority interest, after-tax 10 5 100Income $ 93 $ 75 24Average assets (in billions of dollars) $49 $ 47 4Return on assets 0.77% 0.65%
(1) Reclassified to conform to the current period’s presentation.NM Not meaningful
Mortgage Banking -- which originates and services mortgages and student loans for customers across the United States -- reportedincome of $93 million in the 2002 first quarter, up $18 million or 24% from the first quarter of 2001, primarily reflecting revenuegrowth in the student loan business, partially offset by an increased provision for credit losses.
As shown in the following table, accounts grew 9% from 2001, primarily reflecting growth in student loans. Average on balance sheetloans grew 6%, driven by increases in mortgage loans held for sale and student loans, partially offset by higher prepayments inadjustable rate mortgages which are typically held in the portfolio rather than securitized. Other serviced loans and total originationsincreased 7% and 65%, respectively, from 2001, reflecting continued increases in mortgage refinancing activity due to lower interestrates.
First Quarter %In billions of dollars 2002 2001 ChangeAverage loans-on balance sheet (1) $ 47.2 $ 44.6 6Other serviced loans 68.7 64.2 7Total owned and serviced loans $115.9 $108.8 7
Total originations $ 12.7 $ 7.7 65Accounts (in millions) 4.9 4.5 9
(1) Includes loans held for sale.

9
Revenues, net of interest expense, of $299 million in the 2002 first quarter grew $60 million or 25% from the 2001 first quarter. Theincrease in revenue was primarily due to spread improvements in student loans and higher mortgage securitization-related activity,including increased net interest revenue on mortgage loans held for sale. Revenue growth in 2002 was partially offset by spreadcompression in the mortgage portfolio. Total operating expenses increased $6 million or 6% from the 2001 first quarter, mainlyreflecting additional business volumes.
The provision for credit losses increased $16 million from the first quarter of 2001. Net credit losses in the 2002 first quarter were $16million and the related loss ratio was 0.14%, compared to $13 million and 0.12% in the 2001 fourth quarter and $7 million or 0.06% inthe 2001 first quarter. Loans delinquent 90 days or more were $1.344 billion or 2.87% of loans at March 31, 2002, compared to$1.157 billion or 2.53% at December 31, 2001 and $957 million or 2.12% a year ago. The increase in delinquencies from both the2001 fourth quarter and 2001 first quarter mainly reflects a higher level of buy backs from GNMA pools where the credit risk ismaintained by government agencies. The increase in delinquencies from the prior quarter also reflects a seasonal increase ingovernment-guaranteed student loans.
North America Cards
First Quarter %In millions of dollars 2002 2001 (1) ChangeTotal revenues, net of interest expense $2,425 $2,281 6Effect of securitization activities 1,013 731 39Adjusted revenues, net of interest expense 3,438 3,012 14Total operating expenses 953 1,040 (8)Provision for credit losses 646 490 32Effect of securitization activities 1,013 731 39Adjusted provision for credit losses 1,659 1,221 36Income before taxes 826 751 10Income taxes 306 279 10Income $ 520 $ 472 10Average assets (in billions of dollars) (2) $44 $49 (10)Return on assets (2) 4.79% 3.91%
(1) Reclassified to conform to the current period’s presentation.(2) Adjusted for the effect of securitization activities, managed average assets and the related return on assets for North America Cards were $110 billion and 1.92%
in the first quarter of 2002, compared to $106 billion and 1.81% in the first quarter of 2001.
North America Cards -- which includes Citi Cards (bankcards and private-label cards) and Diners Club -- reported income of $520million in the 2002 first quarter, up $48 million or 10% from the 2001 period, as revenue growth and expense management werepartially offset by higher credit costs.
Adjusted revenues, net of interest expense, of $3.438 billion in the 2002 first quarter were up $426 million or 14% from the 2001 firstquarter, reflecting spread improvements due to lower cost of funds and repricing actions, combined with the benefit of receivablegrowth. In addition, revenues benefited during the 2002 first quarter as a result of an increase in the amortization period for certaindirect loan origination costs, which had a minor impact in the 2002 first quarter and is expected to benefit the 2002 second quarter.This statement is a forward-looking statement within the meaning of the Private Securities Litigation Reform Act. See "Forward-Looking Statements" on page 32. Total operating expenses of $953 million in the 2002 first quarter decreased $87 million or 8% fromthe 2001 first quarter, primarily reflecting disciplined expense management including a decline in advertising and marketing costs.
As shown in the following table, on a managed basis, the Citi Cards portfolio experienced growth in the 2002 first quarter of 5% inend-of-period receivables and slight declines in accounts and total sales.
First Quarter %In billions of dollars 2002 2001 ChangeAccounts (in millions) 91.6 93.2 (2)Total sales $ 50.8 $ 51.2 (1)End-of-period managed receivables $105.4 $100.5 5

10
Risk adjusted margin is a measure of profitability calculated as adjusted revenues less managed net credit losses divided by averagemanaged loans. This measure is consistent with the goal of matching the revenues generated by the loan portfolio with the credit riskundertaken. As shown in the following table, Citi Cards risk adjusted margin of 6.64% in the 2002 first quarter decreased 31 basispoints from the 2001 period as higher net interest revenue was more than offset by higher net credit losses.
First QuarterIn billions of dollars 2002 2001Risk adjusted revenues (1) $1.705 $1.716Risk adjusted margin % (2) 6.64% 6.95%
(1) Citi Cards adjusted revenues less managed net credit losses.(2) Risk adjusted revenues as a percentage of average managed loans.
The adjusted provision for credit losses in the 2002 first quarter was $1.659 billion, compared to $1.221 billion in the 2001 firstquarter. Citi Cards managed net credit losses rose in the 2002 first quarter to $1.646 billion with the related loss ratio increasing to6.41%, compared to $1.554 billion and 5.91% in the 2001 fourth quarter and $1.196 billion and 4.84% in the 2001 first quarter. CitiCards managed loans delinquent 90 days or more were $2.219 billion or 2.13% of loans at March 31, 2002, compared to $2.135billion or 1.98% at December 31, 2001 and $1.836 billion or 1.84% at March 31, 2001. Net credit losses and the related ratio areexpected to increase from the 2002 first quarter as a result of continued economic weakness. This statement is a forward-lookingstatement within the meaning of the Private Securities Litigation Reform Act. See “Forward-Looking Statements” on page 32.
CitiFinancial
First Quarter %In millions of dollars 2002 2001 (1) ChangeAdjusted revenues, net of interest expense (2) $1,479 $1,330 11Adjusted operating expenses (3) 475 569 (17)Adjusted provisions for benefits, claims, and credit losses (2) 500 408 23Core income before taxes 504 353 43Income taxes 184 133 38Core income 320 220 45Restructuring-related items, after-tax - (8) (100)Income $ 320 $ 212 51Average assets (in billions of dollars) $68 $64 6Return on assets 1.91% 1.34%Excluding restructuring-related itemsReturn on assets 1.91% 1.39%
(1) Reclassified to conform to the current period’s presentation.(2) Adjusted for the effect of securitization activities of $15 million in the 2001 first quarter.(3) Excludes restructuring-related items.
CitiFinancial -- which provides community-based lending services through its branch network, regional sales offices and cross-selling initiatives with other Citigroup businesses -- reported core income of $320 million in the 2002 first quarter, up $100 million or45% from the 2001 first quarter, principally reflecting growth in net interest revenue and efficiencies resulting from the integration ofAssociates First Capital Corporation (Associates), partially offset by higher credit costs. Core income growth in the first quarter of2002 also included a $19 million after-tax benefit due to the absence of goodwill and other indefinite-lived intangible assetamortization.

11
As shown in the following table, average loans grew 6% compared to the 2001 first quarter resulting from the cross selling of productsthrough other Citigroup distribution channels and an increase in auto loans. Average auto loans increased $1.9 billion or 54% from2001, reflecting a shift in strategy to fund business volumes internally rather than externally through the securitization of receivables.The average net interest margin of 8.41% in the 2002 first quarter increased 65 basis points from the 2001 first quarter, mainly due tolower cost of funds.
First Quarter %In billions of dollars 2002 2001 ChangeAverage loansReal estate-secured loans – other $33.3 $34.5 (3)Real estate-secured loans – PFS sourced 8.2 5.4 52Personal loans 9.6 9.7 (1)Auto 5.4 3.5 54Sales finance and other 2.7 2.6 4Total average loans $59.2 $55.7 6
Average net interest margin % 8.41% 7.76% 65 bps
Adjusted revenues, net of interest expense, of $1.479 billion in the 2002 first quarter increased $149 million or 11% from the 2001first quarter, reflecting lower cost of funds which was mainly due to a lower interest rate environment and growth in receivables,partially offset by lower yields. Adjusted operating expenses of $475 million in the 2002 first quarter decreased $94 million or 17%from the prior-year quarter, primarily reflecting efficiencies resulting from the integration of Associates and a $23 million benefit dueto the absence of goodwill and other indefinite-lived intangible asset amortization.
Adjusted provisions for benefits, claims, and credit losses were $500 million in the 2002 first quarter, up from $408 million in theprior-year quarter. The net credit loss ratio of 2.97% in the 2002 first quarter was down from 3.06% in the 2001 fourth quarter and upfrom 2.50% in the 2001 first quarter. Net credit losses in the 2001 fourth quarter included losses of $42 million from the sales ofcertain underperforming loans, which were charged against the allowance for credit losses and resulted in a 28 basis point increase inthe net credit loss ratio. Excluding the sales, the 2002 first quarter net credit loss ratio increased 19 basis points from the 2001 fourthquarter. Loans delinquent 90 days or more were $1.969 billion or 3.30% of loans at March 31, 2002, compared to $1.991 billion or3.38% at December 31, 2001 and $1.580 billion or 2.82% a year ago. The increase in delinquencies versus the prior year was partlydue to the impact of the alignment of credit and collection policies in the Associates real estate portfolio to those of CitiFinancialcombined with the impact of current U.S. economic conditions. Net credit losses and the related loss ratio may increase from the 2002first quarter as a result of economic conditions and credit performance of the portfolios, including bankruptcy filings. This statementis a forward-looking statement within the meaning of the Private Securities Litigation Reform Act. See “Forward-LookingStatements” on page 32.
Primerica Financial Services
First Quarter %In millions of dollars 2002 2001 ChangeTotal revenues, net of interest expense $512 $490 4Provision for benefits and claims 134 128 5Total operating expenses 181 169 7Income before taxes 197 193 2Income taxes 69 68 1Income (1) $128 $125 2
(1) Excludes investment gains/losses included in Investment Activities segment.
Primerica Financial Services -- which sells life insurance as well as other products manufactured by the Company, includingSalomon Smith Barney mutual funds, CitiFinancial mortgages and personal loans, and Travelers Insurance Company (TIC) annuityproducts -- reported income of $128 million in the 2002 first quarter, up from $125 million in the comparable period of 2001. Theimprovement in 2002 reflects strong $.M.A.R.T. loan sales, partially offset by lower net investment income. Earned premiums,net of reinsurance, were $294 million in the 2002 first quarter, up from $284 million in the comparable period of 2001.
Total face amount of issued term life insurance was $18.3 billion in the 2002 first quarter, compared to $16.3 billion in the prior-yearperiod. Life insurance in force reached $441.3 billion at March 31, 2002, up from $434.8 billion at year-end 2001 and $415.4 billionat March 31, 2001, and continued to reflect good policy persistency.
Primerica leverages its cross selling efforts through the Financial Needs Analysis (FNA) -- the diagnostic tool that enhances the abilityof the Personal Financial Analysts to address client needs -- to expand its business beyond life insurance by offering its clients agreater array of financial products and services, delivered personally through its sales force. During the 2002 first quarter, 109,000

12
FNAs were submitted. Primerica sales of variable annuities predominately underwritten by TLA generated net written premiums anddeposits of $225 million in the 2002 first quarter, compared to $248 million in the prior-year period. Cash advanced on loan productsprimarily underwritten by CitiFinancial was $1.254 billion in the 2002 first quarter, up 81% from the comparable period last year. Theincrease in cash advanced reflects rate reductions implemented during 2001 and increased sales efforts through higher levels of agentslicensed for $.M.A.R.T. loan and $.A.F.E. loan products. Sales of mutual funds were $937 million for the 2002 first quarter, 6%below last year’s first quarter, reflecting a difficult market environment. During the 2002 first quarter, proprietary mutual fundsaccounted for 70% of Primerica’s U.S. sales and 57% of total sales, compared to 59% and 48%, respectively, in the 2001 first quarter.
International Consumer
Western Europe
First Quarter %In millions of dollars 2002 2001 (1) ChangeTotal revenues, net of interest expense $682 $626 9Total operating expenses 352 350 1Provisions for benefits, claims, and credit losses 99 99 -Income before taxes 231 177 31Income taxes 76 65 17Income $155 $112 38Average assets (in billions of dollars) $24 $23 4Return on assets 2.62% 1.97%
(1) Reclassified to conform to the current period’s presentation.
Western Europe -- which provides banking, community-based lending, including credit and charge cards, and investment productsand services -- reported income of $155 million in the 2002 first quarter, up $43 million or 38% from the 2001 first quarter, mainlyreflecting growth in the branch and consumer finance businesses across the region, particularly in the U.K. and Germany.
The net effect of foreign currency translation reduced income growth by approximately $5 million in the 2002 first quarter. Revenues,expenses and the provisions for benefits, claims, and credit losses growth rates were also reduced by approximately 4, 3, and 4percentage points, respectively, from the 2001 first quarter.
As shown in the following table, Western Europe accounts increased 4% and deposit volumes increased 1% from a year ago. Growthin loan volumes in the 2002 first quarter was driven by increases in Germany, Italy, Spain and in the U.K., which also benefited fromthe impact of acquisitions.
First Quarter %In billions of dollars 2002 2001 ChangeAccounts (in millions) 10.8 10.4 4Average customer deposits $13.0 $12.9 1Average loans $19.7 $18.3 8
Revenues, net of interest expense, of $682 million in the 2002 first quarter increased $56 million or 9% from the 2001 first quarter,principally due to growth in branch lending, bankcard and consumer finance revenues, reflecting increased volumes and spreads.Revenue growth in 2002 was partially offset by the first quarter 2001 sale of Diners Club franchises in the region and foreign currencytranslation. Total operating expenses of $352 million in the 2002 first quarter increased $2 million or 1% from the 2001 first quarter asvolume-related increases were essentially offset by foreign currency translation and expense-reduction initiatives.
The provisions for benefits, claims, and credit losses were $99 million in the 2002 first quarter, unchanged from the 2001 first quarter.The net credit loss ratio was 1.99% in the 2002 first quarter, compared to 2.00% in the 2001 fourth quarter and 2.01% in the 2001 firstquarter. Loans delinquent 90 days or more were $817 million or 4.10% of loans at March 31, 2002, compared to $824 million or4.07% at December 31, 2001 and $811 million or 4.52% at March 31, 2001. Net credit losses and the related loss ratio may increasein the future as a result of economic conditions, statutory changes in the region and future credit performance of the portfolios. Thisstatement is a forward-looking statement within the meaning of the Private Securities Litigation Reform Act. See “Forward-LookingStatements” on page 32.

13
Japan
First Quarter %In millions of dollars 2002 2001 (1) ChangeTotal revenues, net of interest expense $826 $835 (1)Total operating expenses 259 353 (27)Provision for credit losses 195 162 20Income before taxes 372 320 16Income taxes 134 115 17Income $238 $205 16Average assets (in billions of dollars) $20 $19 5Return on assets 4.83% 4.38%
(1) Reclassified to conform to the current period’s presentation.
Japan -- which provides banking, community-based lending, including credit cards, and investment products and services -- reportedincome of $238 million in the 2002 first quarter, up $33 million or 16% from 2001, reflecting a $15 million after-tax benefit due to theabsence of goodwill and other indefinite-lived intangible asset amortization and growth in business volumes, including the impact ofthe acquisition of Taihei Co., Ltd. (Taihei), partially offset by higher credit losses and the net effect of foreign currency translation.On February 28, 2002, CitiFinancial Japan acquired the consumer finance business of Taihei, which added approximately $650million in end-of-period receivables.
The net effect of foreign currency translation reduced income growth by approximately $27 million in the 2002 first quarter.Revenues, expenses, and provision for credit losses growth rates were also reduced by 17, 15, and 29 percentage points, respectively,from the 2001 first quarter.
As shown in the following table, the Japan business experienced growth in accounts, customer deposits, and loans from 2001. Growthin 2002 benefited from the acquisition of Taihei, which added approximately $0.2 billion to average loans and 0.2 million to accounts.Excluding the impact of foreign currency translation, average customer deposits and average loans increased 23 and 16 percentagepoints, respectively from the prior year.
First Quarter %In billions of dollars 2002 2001 ChangeAccounts (in millions) 5.4 4.9 10Average customer deposits $15.8 $14.3 10Average loans $14.2 $13.5 5
Total revenues, net of interest expense, of $826 million in the 2002 first quarter decreased $9 million or 1% from 2001, reflecting theadverse impact of foreign currency translation and lower spreads, partially offset by growth in business volumes, including theacquisition of Taihei, and increased foreign exchange fees. Total operating expenses of $259 million were down $94 million or 27%from the 2001 first quarter, reflecting the impact of foreign currency translation and a $19 million benefit due to the absence ofgoodwill and other indefinite-lived intangible asset amortization.
The provision for credit losses in the 2002 first quarter was $195 million, up $33 million or 20% from the 2001 first quarter. The netcredit loss ratio of 5.57% in the 2002 first quarter increased from 4.53% in the 2001 fourth quarter and 4.06% in the prior-year quarter.The increase in net credit losses was primarily due to increased bankruptcy filings and deteriorating credit quality. Loans delinquent90 days or more were $187 million or 1.26% of loans at March 31, 2002, compared to $178 million or 1.24% at December 31, 2001and $107 million or 0.81% a year ago. Net credit losses and the related ratio are expected to increase from the 2002 first quarter as aresult of continued increases in bankruptcy filings and higher unemployment rates in Japan. This is a forward-looking statementwithin the meaning of the Private Securities Litigation Reform Act. See “Forward-Looking Statements” on page 32.

14
Asia
First Quarter %In millions of dollars 2002 2001 (1) ChangeTotal revenues, net of interest expense $562 $540 4Total operating expenses 248 245 1Provisions for benefits, claims, and credit losses 82 62 32Income before taxes 232 233 -Income taxes 83 86 (3)Income $149 $147 1Average assets (in billions of dollars) $26 $25 4Return on assets 2.32% 2.38%
(1) Reclassified to conform to the current period’s presentation.
Asia (excluding Japan) -- which provides banking, lending, including credit and charge cards, and investment services to customersthroughout the region -- reported income of $149 million in the 2002 first quarter, up $2 million or 1% from 2001, reflecting volumegrowth across the region especially in investment product fees, cards, treasury results and branch lending, partially offset by highercredit losses and the effects of foreign currency translation. Income of $147 million in the 2001 first quarter included a gain related tothe contribution of Citigroup’s insurance operations in Taiwan to its joint venture with Fubon.
The net effect of foreign currency translation reduced income growth by approximately $7 million in the 2002 first quarter andreduced revenues, expenses, and the provisions for benefits, claims, and credit losses growth by 4, 2, and 5 percentage points,respectively, from the 2001 first quarter.
As shown in the following table, Asia experienced strong growth in accounts from the 2001 first quarter, reflecting growth in the cardsbusiness across the region. Foreign currency translation effects reduced growth in loan and deposit volumes.
First Quarter %In billions of dollars 2002 2001 ChangeAccounts (in millions) 10.0 8.6 16Average customer deposits $35.0 $36.1 (3)Average loans $21.2 $21.6 (2)
Revenues, net of interest expense, of $562 million in the 2002 first quarter increased $22 million or 4% from 2001, reflecting growthin investment product fees, cards, treasury revenue and branch lending, partially offset by the January 2001 gain related to Fubon andforeign currency translation effects. Total operating expenses increased $3 million or 1% from the 2001 first quarter reflectingexpansion initiatives across the region, partially offset by foreign currency translation effects.
The provisions for benefits, claims, and credit losses were $82 million in the 2002 first quarter, up $20 million from the 2001 firstquarter. Net credit losses in the 2002 first quarter were $79 million and the related loss ratio was 1.51%, up from $68 million and1.28% in the 2001 fourth quarter and $61 million and 1.14% a year ago. Loans delinquent 90 days or more were $374 million or1.79% of loans at March 31, 2002, compared with $367 million or 1.73% at December 31, 2001 and $334 million or 1.58% a yearago. The increases in the net credit loss ratio and loans delinquent 90 days or more are primarily in Taiwan, Hong Kong and SouthKorea. Net credit losses and loans delinquent 90 days or more may increase from 2002 first quarter levels due to economic weaknessin Asia, whose exporting economies have been impacted by the slowdown in the U.S. This statement is a forward-looking statementwithin the meaning of the Private Securities Litigation Reform Act. See “Forward Looking Statements” on page 32.

15
Latin America
First Quarter %In millions of dollars 2002 2001 (1) ChangeTotal revenues, net of interest expense $383 $472 (19)Adjusted operating expenses (2) 218 287 (24)Provisions for benefits, claims, and credit losses 324 84 NMCore income (loss) before taxes (159) 101 NMIncome taxes (70) 33 NMCore income (loss) (89) 68 NMRestructuring-related items, after-tax (15) - NMIncome (loss) ($104) $ 68 NMAverage assets (in billions of dollars) $7 $9 (22)Return on assets NM 3.06%Excluding restructuring-related itemsReturn on assets NM 3.06%
(1) Reclassified to conform to the current period’s presentation.(2) Excludes restructuring-related items.NM Not meaningful
Latin America (excluding Mexico) -- which provides banking, lending, including credit and charge cards, insurance and pensionfund administration and investment services to customers throughout the region -- reported losses before restructuring-related items,of $89 million in the 2002 first quarter, compared to core income of $68 million a year ago, primarily reflecting charges taken inArgentina and the net effects of foreign currency translation due to the devaluation of the Argentine Peso. Losses of $104 million inthe 2002 first quarter included restructuring-related charges of $15 million ($25 million pretax), which reflects initiatives to downsizeheadcount and branches in Argentina.
As shown in the following table, average customer deposits and average loans decreased primarily reflecting foreign currencytranslation effects due to the devaluation of the Argentine Peso.
First Quarter %In billions of dollars 2002 2001 ChangeAccounts (in millions) 8.4 8.2 2Average customer deposits $9.1 $11.0 (17)Average loans 4.8 6.5 (26)
Revenues, net of interest expense, of $383 million in the 2002 first quarter were down $89 million or 19% from 2001, primarilyreflecting weakness in Argentina, due to reduced business activity as well as the unfavorable foreign currency translation effects fromthe devaluation of the Argentine Peso, partially offset by higher regional treasury results. Adjusted operating expenses of $218million decreased $69 million or 24% from the 2001 first quarter, primarily reflecting the benefit of foreign currency translation andexpense reduction initiatives across the region.
The provisions for benefits, claims, and credit losses were $324 million in the 2002 first quarter, compared with $84 million in theprior year. The increase in the provisions for benefits, claims, and credit losses was mainly due to an addition of $235 million to theloan loss reserve, due to deteriorating credit in Argentina. The increase in the loan loss reserve for Argentina reflects management'sestimate of the impact on the consumer portfolio of the economic and political events which occurred in the first quarter, including thelimitations imposed on withdrawals of funds, the bankruptcy moratorium, and the rising unemployment rate. The net credit loss ratioin the 2002 first quarter was 6.50%, compared with 4.93% in the 2001 fourth quarter and 4.24% a year ago, primarily reflecting write-downs in Argentina. Loans delinquent 90 days or more were $171 million or 4.03% of loans at March 31, 2002, compared with $248million or 4.71% at December 31, 2001 and $302 million or 4.74% a year ago. Loans delinquent 90 days or more declined, primarilyreflecting foreign currency translation effects due to the devaluation of the Argentine Peso. The ratio of loans delinquent 90 days ormore declined from the 2001 fourth quarter as Argentina now reflects a smaller proportion of the Latin American loan portfolio,primarily reflecting the devaluation of the Argentine Peso. Net credit losses and loans delinquent 90 days or more may increase from2002 first quarter levels due to the continuing economic crisis in Argentina and may be impacted by further unemployment andinstability of prices. Income may also be impacted by government decrees and judicial orders in Argentina. These statements areforward-looking statements within the meaning of the Private Securities Litigation Reform Act. See “Forward-Looking Statements”on page 32.

16
Mexico
First QuarterIn millions of dollars 2002 2001 (1)
Total revenues, net of interest expense $1,085 $153Adjusted operating expenses (2) 614 129Provisions for benefits, claims, and credit losses 121 11Core income before taxes 350 13Income taxes 70 9Core income 280 4Restructuring-related items, after-tax (3) -Income $ 277 $ 4Average assets (in billions of dollars) $69 $11Return on assets 1.63% 0.15%Excluding restructuring-related itemsReturn on assets 1.65% 0.15%
(1) Reclassified to conform to the current period’s presentation.(2) Excludes restructuring-related items.
Mexico -- which includes the results of Grupo Financiero Banamex (Banamex) from August 2001, as well as Citigroup’s legacyconsumer banking, corporate banking, and retirement services businesses in Mexico and provides a wide array of banking, insurance,and financial services products -- reported core income of $280 million in the 2002 first quarter, up $276 million compared to 2001,primarily reflecting the acquisition of Banamex. Income of $277 million in the 2002 first quarter includes a restructuring-relatedcharge of $3 million ($4 million pretax).
On August 6, 2001, Citicorp completed its acquisition of Banamex with the transaction being accounted for as a purchase. In the 2001fourth quarter, Citibank Mexico’s banking operations merged into Banamex, with Banamex being the surviving entity. In February2002, Banamex completed the purchase of AEGON’s 48% interest in Seguros Banamex (Life Insurance) and AFORE Banamex(Pension Fund Manager) for $1.24 billion. The business also finalized the sale of Bansud (a subsidiary of Banamex) in Argentina inJanuary 2002.
First QuarterIn billions of dollars 2002 2001Accounts (in millions) 17.5 1.7Average customer deposits $30.2 $3.0Average loans 19.5 3.7
Revenues, net of interest expense, of $1.085 billion in the 2002 first quarter increased $932 million from 2001, primarily reflecting theacquisition of Banamex. Revenues reflect strong volume growth from the underlying customer deposit business and cards, combinedwith improvements in trading revenue primarily due to interest rate positioning, partially offset by declining spreads. The customerdeposit business was impacted by lower interest rates that reduced spreads on deposits. Adjusted operating expenses of $614 millionin the 2002 first quarter increased $485 million from 2001, primarily reflecting the acquisition of Banamex. The business continues totake actions to rationalize headcount, branches and systems.
The provisions for benefits, claims, and credit losses in the 2002 first quarter were $121 million compared with $11 million in 2001.The consumer net credit loss ratio was 3.89% in the 2002 first quarter, compared with 3.88% in the 2001 fourth quarter and 4.13% ayear ago. Consumer loans delinquent 90 days or more were $470 million or 7.89% of loans at March 31, 2002, compared with $523million or 8.75% at December 31, 2001 and $16 million or 5.19% a year ago. The improvement in consumer loans delinquent 90 daysor more from the 2001 fourth quarter primarily reflects improved collections. The increase from March 31, 2001 primarily resultsfrom the acquisition of Banamex.
Commercial cash-basis loans were $1.095 billion at March 31, 2002, compared with $1.030 billion at December 31, 2001 and $68million a year ago. The increase in the 2002 first quarter versus March 31, 2001 reflects the acquisition of Banamex whosecommercial cash-basis loans include exposures in steel, textile, food products and other industries.
Net credit losses, cash-basis loans, and loans delinquent 90 days or more may increase from first quarter 2002 levels, due to economicweakness in Mexico, whose exports have been impacted by the slowdown in the U.S. This statement is a forward-looking statementwithin the meaning of the Private Securities Litigation Reform Act. See “Forward-Looking Statements” on page 32.

17
Central & Eastern Europe, Middle East & Africa
First Quarter %In millions of dollars 2002 2001 (1) ChangeTotal revenues, net of interest expense $149 $130 15Total operating expenses 100 93 8Provision for credit losses 11 9 22Income before taxes 38 28 36Income taxes 14 10 40Income $ 24 $ 18 33Average assets (in billions of dollars) $4 $4 -Return on assets 2.43% 1.83%
(1) Reclassified to conform to the current period’s presentation.
Central & Eastern Europe, Middle East & Africa (CEEMEA--including India and Pakistan) -- which provides banking, lending,including credit and charge cards, and investment services to customers throughout the region -- reported income of $24 million in the2002 first quarter, up $6 million or 33% from 2001, reflecting continued growth in cards, investment product fees and branch lendingacross the region, particularly in India and Poland, partially offset by lower results in Turkey and Pakistan and due to increasedspending on branch expansion and marketing initiatives.
As shown in the following table, CEEMEA reported 21% account growth from the 2001 first quarter, primarily reflecting growth incards, customer deposits, and other lending, as franchise growth efforts continued across the region.
First Quarter %In billions of dollars 2002 2001 ChangeAccounts (in millions) 4.0 3.3 21Average customer deposits $6.1 $5.6 9Average loans 2.5 2.2 14
Revenues, net of interest expense, of $149 million in the 2002 first quarter increased $19 million or 15% from 2001, primarilyreflecting volume growth in cards, investment product fees and branch lending across the region, particularly in India and Poland,partially offset by lower results in Turkey and Pakistan. Total operating expenses of $100 million increased $7 million or 8% from the2001 first quarter, reflecting higher business volumes and franchise expansion initiatives in the region.
The provision for credit losses was $11 million in the 2002 first quarter, compared with $9 million in 2001. The net credit loss ratiowas 1.75% in the 2002 first quarter, compared with 1.60% in the 2001 fourth quarter and 1.66% a year ago. The increase in the netcredit loss ratio primarily reflects higher losses in certain segments in the Middle East and economic slowdown in Eastern Europe.Loans delinquent 90 days or more of $36 million or 1.42% of loans at March 31, 2002 were essentially unchanged from $36 million or1.41% at December 31, 2001 and increased from $33 million or 1.40% at March 31, 2001.
e-Consumer
First Quarter %In millions of dollars 2002 2001 (1) ChangeTotal revenues, net of interest expense $40 $ 47 (15)Total operating expenses 73 86 (15)Loss before tax benefits (33) (39) 15Income tax benefits (13) (15) 13Loss ($20) ($24) 17
(1) Reclassified to conform to the current period’s presentation.
e-Consumer -- the business responsible for developing and implementing Global Consumer Internet financial services products and e-commerce solutions -- reported a loss of $20 million in the 2002 first quarter, compared to a loss of $24 million in the 2001 firstquarter.
Revenues, net of interest expense, in the 2002 first quarter decreased $7 million or 15% from 2001 as a prior year realized investmentgain was partially offset by growth in Citicorp Electronic Financial Services, which provides electronic benefit transfer services tostates throughout the country. Total operating expenses declined $13 million or 15% from the 2001 first quarter, mainly reflectinglower depreciation, amortization and compensation costs.

18
Other Consumer
First Quarter %In millions of dollars 2002 2001 (1) ChangeAdjusted revenues, net of interest expense ($ 3) ($ 5) 40Adjusted operating expenses (2) 30 31 (3)Adjusted provisions for benefits, claims, and credit losses 8 (8) NMCore loss before tax benefits (41) (28) (46)Income tax benefits (12) (11) 9Core income (loss) (29) (17) (71)Restructuring-related items, after-tax - (4) 100Loss ($29) ($21) (38)
(1) Reclassified to conform to the current period’s presentation.(2) Excludes restructuring-related items.NM Not meaningful
Other Consumer -- which includes certain treasury and other unallocated staff functions and global marketing and other programs --reported losses before restructuring-related items of $29 million in the 2002 first quarter and $17 million in the 2001 first quarter. Theincrease in losses from 2001 was primarily due to lower foreign currency hedge gains and treasury results. The loss of $21 million inthe 2001 first quarter included restructuring-related items of $4 million ($6 million pretax). Revenues, expenses, and the provisionsfor benefits, claims, and credit losses reflect offsets to certain line-item reclassifications reported in other Global Consumerbusinesses.

19
Consumer Portfolio Review
In the consumer portfolio, credit loss experience is often expressed in terms of annualized net credit losses as a percentage of averageloans. Pricing and credit policies reflect the loss experience of each particular product. Consumer loans are generally written off nolater than a predetermined number of days past due on a contractual basis, or earlier in the event of bankruptcy. The number of days isset at an appropriate level according to loan product and country.
The following table summarizes delinquency and net credit loss experience in both the managed and on-balance sheet loan portfoliosin terms of loans 90 days or more past due, net credit losses, and as a percentage of related loans.
Consumer Loan Delinquency Amounts, Net Credit Losses, and Ratios
TotalLoans 90 Days or More Past Due (1)
AverageLoans Net Credit Losses (1)
In millions of dollars, except loan amounts in billions
Mar. 31,2002
Mar. 31,2002
Dec. 31,2001 (2)
Mar. 31,2001 (2)
1st Qtr.2002
1st Qtr.2002
4th Qtr.2001 (2)
1st Qtr.2001 (2)
Citibanking North America $12.0 $ 85 $ 96 $ 41 $12.0 $ 27 $ 30 $ 15 Ratio 0.71% 0.78% 0.56% 0.90% 0.97% 0.80%Mortgage Banking 46.9 1,344 1,157 957 47.2 16 13 7 Ratio 2.87% 2.53% 2.12% 0.14% 0.12% 0.06%Citi Cards 104.2 2,219 2,135 1,836 104.2 1,646 1,554 1,196 Ratio 2.13% 1.98% 1.84% 6.41% 5.91% 4.84%Other North America Cards 1.4 5 6 6 1.2 12 13 12 Ratio 0.40% 0.61% 0.32% 4.08% 4.39% 2.90%CitiFinancial 59.7 1,969 1,991 1,580 59.2 434 452 344 Ratio 3.30% 3.38% 2.82% 2.97% 3.06% 2.50%Western Europe 19.9 817 824 811 19.7 97 101 91 Ratio 4.10% 4.07% 4.52% 1.99% 2.00% 2.01%Japan 14.9 187 178 107 14.2 195 174 135 Ratio 1.26% 1.24% 0.81% 5.57% 4.53% 4.06%Asia (excluding Japan) 20.9 374 367 334 21.2 79 68 61 Ratio 1.79% 1.73% 1.58% 1.51% 1.28% 1.14%Mexico 6.0 470 523 16 6.0 57 57 3 Ratio 7.89% 8.75% 5.19% 3.89% 3.88% 4.13%Latin America 4.3 171 248 302 4.8 77 69 68 Ratio 4.03% 4.71% 4.74% 6.50% 4.93% 4.24%CEEMEA 2.6 36 36 33 2.5 11 10 9 Ratio 1.42% 1.41% 1.40% 1.75% 1.60% 1.66%The Citigroup Private Bank (3) 27.5 143 135 65 27.0 2 10 (1) Ratio 0.52% 0.53% 0.27% 0.04% 0.15% (0.01%)Other 0.6 - 5 17 1.2 1 29 (9)
Total managed $320.9 $7,820 $7,701 $6,105 $320.4 $2,654 $2,580 $1,931 Ratio 2.44% 2.37% 2.04% 3.36% 3.20% 2.61%Securitized receivables (65.9) (1,351) (1,282) (1,243) (66.9) (935) (897) (691)Loans held for sale (12.5) (122) (110) (148) (12.5) (78) (69) (75)Consumer loans $242.5 $6,347 $6,309 $4,714 $241.0 $1,641 $1,614 $1,165 Ratio 2.62% 2.58% 2.14% 2.76% 2.66% 2.10%
(1) The ratios of 90 days or more past due and net credit losses are calculated based on end-of-period and average loans, respectively, both net of unearned income.(2) Reclassified to conform to the current period's presentation.(3) The Citigroup Private Bank results are reported as part of the Global Investment Management and Private Banking segment.
Consumer Loan Balances, Net of Unearned Income
End of Period Average
In billions of dollarsMar. 31,
2002Dec. 31,
2001Mar. 31,
20011st Qtr.
20024th Qtr.
20011st Qtr.
2001Total managed $320.9 $324.4 $299.6 $320.4 $320.2 $300.0Securitized receivables (65.9) (68.4) (63.7) (66.9) (67.6) (62.2)Loans held for sale (12.5) (11.9) (15.3) (12.5) (11.6) (13.4)On-balance sheet $242.5 $244.1 $220.6 $241.0 $241.0 $224.4

20
Total delinquencies 90 days or more past due in the managed portfolio were $7.820 billion or 2.44% of loans at March 31, 2002,compared to $7.701 billion or 2.37% at December 31, 2001 and $6.105 billion or 2.04% at March 31, 2001. Total managed net creditlosses in the 2002 first quarter were $2.654 billion and the related loss ratio was 3.36%, compared to $2.580 billion and 3.20% in the2001 fourth quarter and $1.931 billion and 2.61% in the 2001 first quarter. For a discussion of trends by business, see businessdiscussions on pages 7 - 18.
Citigroup’s allowance for credit losses of $10.520 billion is available to absorb probable credit losses inherent in the entire portfolio.For analytical purposes only, the portion of Citigroup’s allowance for credit losses attributed to the consumer portfolio was $5.401billion at March 31, 2002, $5.169 billion at December 31, 2001, and $4.956 billion at March 31, 2001. The increase in the allowancefor credit losses from December 31, 2001 was due to increases related to Argentina. The increase in the allowance for credit lossesfrom a year ago also includes the impact of the acquisitions of Banamex and EAB. The allowance as a percentage of loans on thebalance sheet was 2.23% at March 31, 2002, up from 2.13% at December 31, 2001 and down from 2.24% at March 31, 2001. Theincrease in the allowance as a percentage of loans from December 31, 2001 was primarily due to the increase in the allowance relatedto Argentina combined with declines in loans in Citi Cards, mainly due to increased securitizations, and Latin America, primarilyreflecting the devaluation of the Argentine Peso. The decline in the allowance as a percentage of loans from a year ago primarilyreflects the growth in consumer loans as well as stricter lending standards in individual businesses. On-balance sheet consumer loansof $242.5 billion grew $22 billion or 10% from March 31, 2001, primarily driven by the impact of the acquisitions of Banamex andEAB and increases in CitiFinancial’s real estate and auto loans. On-balance sheet loans in Citi Cards declined in 2002 as growth inmanaged receivables was more than offset by increased securitization activity. In addition, loans in 2002 increased in Japan andWestern Europe, mainly in consumer finance, and decreased in Asia and Latin America. The attribution of the allowance is made foranalytical purposes only and may change from time to time.
Net credit losses, delinquencies, and the related ratios may increase from the 2002 first quarter as a result of the credit performance ofthe portfolios, including bankruptcies, global economic conditions, portfolio growth, and seasonal factors. This statement is aforward-looking statement within the meaning of the Private Securities Litigation Reform Act. See “Forward-Looking Statements” onpage 32.
GLOBAL CORPORATE
First Quarter %In millions of dollars 2002 2001 (1) ChangeTotal revenues, net of interest expense $ 6,650 $7,480 (11)Adjusted operating expenses (2) 4,131 4,959 (17)Provisions for benefits, claims, and credit losses 680 269 NMCore income before taxes and minority interest 1,839 2,252 (18)Income taxes 654 804 (19)Minority interest, after-tax 3 4 (25)Core income 1,182 1,444 (18)Restructuring-related items, after-tax (8) (68) 88Income $1,174 $1,376 (15)
(1) Reclassified to conform to the current period’s presentation.(2) Excludes restructuring-related items.NM Not meaningful
Global Corporate serves corporations, financial institutions, governments, investors, and other participants in capital marketsthroughout the world. It consists of the Corporate and Investment Bank (CIB) and Emerging Markets Corporate Banking & GlobalTransaction Services (EM Corporate & GTS).
Global Corporate reported core income of $1.182 billion in the 2002 first quarter, down $262 million or 18% from the 2001 firstquarter. The decline in core income resulted from a decrease in EM Corporate & GTS, down $226 million or 54% to $195 millionand a decrease in the CIB, down $36 million or 4% to $987 million. EM Corporate & GTS core income decreased primarily due tocharges reflecting the impact of economic conditions in Argentina, partially offset by growth in trading-related revenue in all regionsand expense control initiatives. The CIB decline reflects decreases in equities trading-related revenues and higher net credit losses,partially offset by expense control initiatives.
Income of $1.174 billion in the 2002 first quarter included a restructuring-related charge of $8 million ($13 million pretax). See Note8 to the Consolidated Financial Statements for a discussion of the restructuring-related items.
The businesses of Global Corporate are significantly affected by the levels of activity in the global capital markets which, in turn, areinfluenced by macro-economic and political policies and developments, among other factors, in the 100 countries in which thebusinesses operate. Global economic and market events can have both positive and negative effects on the revenue performance of the

21
businesses and can affect credit performance. Losses on commercial lending activities and the level of cash-basis loans can varywidely with respect to timing and amount, particularly within any narrowly-defined business or loan type. Net credit losses and cash-basis loans may increase from 2002 first quarter levels due to weak global economic conditions, sovereign or regulatory actions andother factors. This paragraph contains forward-looking statements within the meaning of the Private Securities Litigation Reform Act.See “Forward-Looking Statements” on page 32.
Corporate and Investment Bank
First Quarter %In millions of dollars 2002 2001 (1) ChangeTotal revenues, net of interest expense $5,045 $5,682 (11)Adjusted operating expenses (2) 3,185 3,868 (18)Provision for credit losses 312 230 36Core income before taxes 1,548 1,584 (2)Income taxes 561 561 -Core income 987 1,023 (4)Restructuring-related items, after-tax - (66) 100Income $987 $ 957 3
(1) Reclassified to conform to the current period’s presentation.(2) Excludes restructuring-related items.
The Corporate and Investment Bank delivers a full range of financial services and products including investment banking,brokerage, research and advisory services, foreign exchange, structured products, derivatives, loans, leasing and equipment finance.
The CIB reported core income of $987 million in the 2002 first quarter, down $36 million or 4% from $1.023 billion in the 2001 firstquarter. The decline primarily reflects decreases in equities trading-related revenues and higher net credit losses, partially offset byexpense control initiatives.
Revenues by category were as follows:
First Quarter %In millions of dollars 2002 2001 (1) ChangeCommissions and fees $ 992 $1,072 (7)Investment banking 1,043 1,239 (16)Principal transactions 928 1,561 (41)Asset management and administration fees 513 536 (4)Interest and dividend income, net 1,509 1,003 50Other income 60 271 (78)Total revenues, net of interest expense $5,045 $5,682 (11)
(1) Reclassified to conform to the current period's presentation.
Revenues, net of interest expense, decreased $637 million or 11% to $5.045 billion in the 2002 first quarter from $5.682 billion in the2001 first quarter.
Commissions and fees of $992 million decreased $80 million or 7% from the 2001 first quarter, primarily reflecting lower customertransaction activity. Declines in listed securities and options commissions were partially offset by increases in commissions fromover-the-counter securities.
Investment banking revenues were $1.043 billion in the 2002 first quarter, down $196 million or 16% from the 2001 first quarter,primarily due to declines in merger and acquisition fees and high-grade debt underwriting, partially offset by increases in equityunderwriting which included fees on the TPC initial public offering.
Principal transactions revenues were $928 million in the 2002 first quarter, down $633 million or 41% from the 2001 first quarter,primarily reflecting decreases in fixed income and equities. Fixed income principal transactions decreases were more than offset byan associated increase in net interest revenue.
Asset management and administration fees of $513 million decreased $23 million or 4% from the 2001 first quarter. The decreaseprimarily reflects a shift in the mix of asset levels whose billings are calculated on a one quarter lag. These fees include results fromassets managed by the Financial Consultants and other internally managed assets as well as those that are managed through theConsulting Group.

22
Net interest and dividend income of $1.509 billion increased $506 million or 50% compared to the 2001 first quarter, primarily due towider spreads in fixed income products, particularly mortgage-backed securities, as well as in loans.
Other income of $60 million decreased $211 million or 78% compared to the 2001 first quarter, primarily due to lower earnings fromthe Nikko Salomon Smith Barney joint-venture and the effect of a change in the second quarter of 2001 in the presentation ofintercompany balances that had the effect of reducing other income and other expense.
Total assets under fee-based management at March 31, were as follows:
March 31, %In billions of dollars 2002 2001 ChangeFinancial Consultant managed accounts $55.2 $ 51.9 6Consulting Group internally managed assets 154.3 134.4 15Total assets under fee-based management (1) $209.5 $186.3 12
(1) Includes assets managed jointly with Citigroup Asset Management.
Adjusted operating expenses were $3.185 billion in the 2002 first quarter, down $683 million or 18% compared to the prior-yearquarter. The decrease primarily reflects lower compensation and benefits and other operating and administrative expenses.Compensation and benefits decreased primarily as a result of declines in production-related compensation and savings fromrestructuring actions initiated in 2001. Other operating and administrative expenses declined primarily due to tight expense controls, achange in the presentation of intercompany balances that had the effect of reducing other income and other expense, and the absenceof goodwill and other indefinite-lived intangible asset amortization.
The provision for credit losses was $312 million in the 2002 first quarter, up $82 million from $230 million in the 2001 first quarter,primarily due to higher net credit losses in the telecommunications and energy industries.
Cash-basis loans were $1.598 billion at March 31, 2002, $1.525 billion at December 31, 2001, and $1.149 billion at March 31, 2001,primarily reflecting increases in the transportation leasing portfolio and borrowers in the telecommunication and energy industries.Losses on commercial lending activities and the level of cash-basis loans can vary widely with respect to timing and amount,particularly within any narrowly-defined business or loan type. Net credit losses and cash-basis loans may increase from 2002 firstquarter levels due to weak economic conditions in the U.S., Japan and Europe as well as stress in the telecommunications industry.This statement is a forward-looking statement within the meaning of the Private Securities Litigation Reform Act. See “Forward-Looking Statements” on page 32.
Emerging Markets Corporate Banking and Global Transaction Services
First Quarter %In millions of dollars 2002 2001 (1) ChangeTotal revenues, net of interest expense $1,605 $1,798 (11)Adjusted operating expenses (2) 946 1,091 (13)Provision for credit losses 368 39 NMCore income before taxes and minority interest 291 668 (56)Income taxes 93 243 (62)Minority interest, after-tax 3 4 (25)Core income 195 421 (54)Restructuring-related items, after-tax (8) (2) NMIncome $ 187 $ 419 (55)Average assets (in billions of dollars) $112 $109 3Return on assets 0.68% 1.56%Excluding restructuring-related itemsReturn on assets 0.71% 1.57%
(1) Reclassified to conform to the current period’s presentation.(2) Excludes restructuring-related items.NM Not meaningful
EM Corporate Banking & GTS -- which offers a wide array of banking and financial services products in the emerging markets(excluding Mexico) and also includes the global operations of Transaction Services -- reported core income of $195 million in the2002 first quarter, down $226 million or 54% from the 2001 first quarter due to charges reflecting the impact of economic conditionsin Argentina, partially offset by growth in trading-related revenue in all regions and expense control initiatives. The decline in coreincome was driven by Latin America, which was down $244 million, and CEEMEA, which was down $22 million, partially offset byexpense improvements in Transaction Services operations in North America and Europe. Income of $187 million in the 2002 first

23
quarter included a restructuring-related charge of $8 million ($13 million pretax), primarily related to the downsizing of operations inArgentina.
Total revenues, net of interest expense, of $1.605 billion in the 2002 first quarter declined $193 million or 11% compared to the 2001first quarter. The decline in revenue was primarily due to Latin America, which was down 15% mainly due to the redenominationlosses and the adverse impact of currency translation in Argentina, partially offset by the benefit recorded for the compensationinstruments. CEEMEA revenues were down 11% from the 2001 first quarter primarily reflecting a Bank Handlowy merger-relatedgain in the 2001 first quarter. Asia revenues were down 4% primarily due to weakness in Transaction Services, partially offset bystrong growth in trading-related revenue.
Adjusted operating expenses of $946 million in the 2002 first quarter decreased $145 million or 13% primarily due to expensereduction initiatives in Transaction Services operations in North America and Europe, the benefit of restructuring actions initiated inthe 2001 second quarter across all regions and foreign currency translation benefits in Argentina.
The provision for credit losses of $368 million in the 2002 first quarter increased $329 million compared to the 2001 first quarter,primarily due to an addition to the loan loss reserve of $240 million and write-offs of $100 million in Argentina. The reserveadditions and write-offs in Argentina reflect the impairment of loans in the first quarter due to the impact of the devaluation,redenomination, economic conditions and other factors. Cash-basis loans (excluding Mexico) were $1.767 billion at March 31, 2002,up $630 million from March 31, 2001 principally due to the increases in Latin America, mainly Argentina, and increases in Asia,mainly Australia and New Zealand. Cash-basis loans were up $302 million from December 31, 2001 principally due to the increasesin Latin America, mainly Argentina. Losses on commercial lending activities and the level of cash-basis loans can vary widely withrespect to timing and amount, particularly within any narrowly-defined business or loan type. Net credit losses and cash-basis loansmay increase from 2002 first quarter levels due to weak global economic conditions, the economic crisis in Argentina, sovereign orregulatory actions and other factors. Income may also be impacted by government decrees and judicial orders in Argentina. Thisstatement is a forward-looking statement within the meaning of the Private Securities Litigation Reform Act. See “Forward-LookingStatements” on page 32.
Commercial Portfolio Review
Commercial loans are identified as impaired and placed on a nonaccrual basis when it is determined that the payment of interest orprincipal is doubtful of collection or when interest or principal is past due for 90 days or more, except when the loan is well-securedand in the process of collection. Impaired commercial loans are written down to the extent that principal is judged to be uncollectible.Impaired collateral-dependent loans are written down to the lower of cost or collateral value. The following table summarizescommercial cash-basis loans at period-end and net credit losses for the corresponding three-month period.
In millions of dollarsMar. 31,
2002Dec. 31,
2001Mar. 31,2001 (1)
Commercial cash-basis loansCorporate and Investment Bank $1,598 $1,525 $1,149EM Corporate & GTS 1,767 1,465 1,137Mexico (2) 1,095 1,030 68Insurance and Investment Activities 39 21 63
Total commercial cash-basis loans $4,499 $4,041 $2,417Net credit losses
Corporate and Investment Bank $357 $560 $229EM Corporate & GTS 128 195 40Mexico (2) 2 46 8
Total commercial net credit losses $487 $801 $277
(1) Reclassified to conform to the current period’s presentation.(2) Includes Banamex cash-basis loans and net credit losses in the 2002 first quarter and 2001 fourth quarter.
Total commercial cash-basis loans were $4.499 billion at March 31, 2002, $4.041 billion at December 31, 2001, and $2.417 billion atMarch 31, 2001. Cash-basis loans in the CIB of $1.598 billion at March 31, 2002, $1.525 billion at December 31, 2001, and $1.149billion at March 31, 2001 primarily reflect increases in the transportation leasing portfolio and borrowers in the telecommunicationsand energy industries. EM Corporate & GTS cash-basis loans (excluding Mexico) were $1.767 billion at March 31, 2002, up $630million from March 31, 2001 principally due to the increases in Latin America, mainly Argentina, and increases in Asia, mainlyAustralia and New Zealand. EM Corporate & GTS cash-basis loans were up $302 million from December 31, 2001 principally due tothe increases in Latin America, mainly Argentina. Mexico cash-basis loans were $1.095 billion at March 31, 2002, compared with$1.030 billion at December 31, 2001 and $68 million at March 31, 2001. The increases primarily reflect the acquisition of Banamexwhose commercial cash-basis loans include exposures in steel, textile, food products and other industries.

24
Total commercial net credit losses of $487 million in the first quarter of 2002 increased $210 million compared to the first quarter of2001, primarily reflecting increases in the CIB and in EM Corporate & GTS. CIB net credit losses of $357 million increased $128million compared to the first quarter of 2001, primarily due to higher net credit losses in the telecommunications and energy industriesand the transportation leasing portfolio. EM Corporate & GTS net credit losses of $128 million increased $88 million compared to thefirst quarter of 2001 primarily due to write-offs in Argentina. For a further discussion of trends by business, see the businessdiscussions on pages 20 -- 23.
Citigroup’s allowance for credit losses of $10.520 billion is available to absorb probable credit losses inherent in the entire portfolio.For analytical purposes only, the portion of Citigroup’s allowance for credit losses attributed to the commercial portfolio was $5.119billion at March 31, 2002 compared to $4.919 billion and $4.001 billion at December 31, 2001 and March 31, 2001, respectively. Theincrease in the allowance in the first quarter of 2002 primarily reflects an addition to the allowance of $240 million for Argentina. Thereserve addition for Argentina reflects the impairment caused in the first quarter due to the impact on borrowers in the commercialportfolio from the devaluation, redenomination, economic conditions and other factors. The increase in the allowance from the 2001first quarter also reflects the acquisition of Banamex. Losses on commercial lending activities and the level of cash-basis loans canvary widely with respect to timing and amount, particularly within any narrowly-defined business or loan type. Commercial net creditlosses and cash-basis loans may increase from 2002 first quarter levels due to weak global economic conditions, the economic crisis inArgentina, sovereign or regulatory actions and other factors. This statement is a forward-looking statement within the meaning of thePrivate Securities Litigation Reform Act. See “Forward-Looking Statements” on page 32.
In billions of dollarsMar. 31,
2002Dec. 31,
2001Mar. 31,
2001Commercial allowance for credit losses $5.119 $4.919 $4.001As a percentage of total commercial loans 3.49% 3.31% 2.75%
GLOBAL INVESTMENT MANAGEMENT AND PRIVATE BANKING
First Quarter %In millions of dollars 2002 2001 (1) ChangeTotal revenues, net of interest expense $1,736 $1,966 (12)Adjusted operating expenses (2) 589 639 (8)Provision for benefits, claims, and credit losses 540 731 (26)Core income before taxes 607 596 2Income taxes 201 212 (5)Core income 406 384 6Restructuring-related items, after-tax (3) - -Income $ 403 $ 384 5
(1) Reclassified to conform to the current period’s presentation.(2) Excludes restructuring-related items.
Global Investment Management and Private Banking comprises Travelers Life and Annuity (TLA), The Citigroup Private Bankand Citigroup Asset Management. These businesses offer a broad range of life insurance, annuity and asset management products andservices including individual annuity, group annuity, individual life insurance products, Corporate Owned Life Insurance (COLI)products, mutual funds, closed-end funds, managed accounts, unit investment trusts, variable annuities, pension administration, andpersonalized wealth management services distributed to institutional, high net worth, and retail clients.
Global Investment Management and Private Banking reported core income of $406 million in the 2002 first quarter, up $22 million or6% from the 2001 first quarter. The increase reflects higher core income from The Citigroup Private Bank of $17 million or 18%, andCitigroup Asset Management, up $15 million or 19%, partially offset by lower income from TLA of $10 million, a decrease of 5%from the 2001 first quarter. The increase at The Citigroup Private Bank primarily reflects continued customer revenue momentumacross a range of products including client trading activity, investments and lending, and the impact of lower interest rates, partiallyoffset by increased expenses due to higher variable, employee-related and technology costs and an increase in the provision for creditlosses. The increase at Citigroup Asset Management primarily reflects decreased expenses and strong net flows, partially offset by theimpact of prior year one-time fees and weak global equity markets. The decrease at TLA primarily reflects lower net investmentincome and was partially offset by the impact of expense management and business volumes.

25
Travelers Life and Annuity
First Quarter %In millions of dollars 2002 2001 ChangeTotal revenues, net of interest expense $888 $1,130 (21)Provision for benefits and claims 534 729 (27)Total operating expenses 65 88 (26)Income before taxes 289 313 (8)Income taxes 89 103 (14)Income (1) $200 $ 210 (5)
(1) Excludes investment gains/losses included in Investment Activities segment.
TLA -- whose core offerings include individual annuity, group annuity, and individual life insurance and corporate-owned lifeinsurance (COLI) products -- reported income of $200 million in the 2002 first quarter compared to $210 million in the comparableperiod of 2001. The 5% decline reflects lower net investment income which was partially offset by continued expense management.Business volumes were strong with double-digit growth in individual annuity and group annuity account balances and individual lifenet written premiums versus the prior-year first quarter. These increases reflected growth in retirement savings and estate planningproducts and continued sales from cross-selling initiatives. Total operating expenses decreased 26% in the 2002 first quarter comparedto the prior-year first quarter due to continued expense management and a change in deferred policy acquisition costs.
The cross-selling initiative of TLA products through Primerica Financial Services (Primerica), Citibank, Salomon Smith BarneyFinancial Consultants, and CitiStreet, as well as strong sales through various intermediaries, a nationwide network of independentagents and outside broker dealers, reflect the ongoing effort to build market share by strengthening relationships in key distributionchannels.
The following table shows net written premiums and deposits by product line:
First Quarter %In millions of dollars 2002 2001 ChangeIndividual annuities
Fixed $ 614 $ 427 44Variable 898 1,099 (18)Individual payout 14 19 (26)
GICs and other group annuities 1,525 2,502 (39)Individual life insurance
Direct periodic premiums and deposits 233 187 25Single premium deposits 76 47 62Reinsurance (26) (22) (18)
Total $3,334 $4,259 (22)
The majority of the annuity business and a substantial portion of the life business written by TLA are accounted for as investmentcontracts, with the result that the premiums are considered deposits and are not included in revenues.
Individual annuities account balances reached $30.7 billion at March 31, 2002, up from $27.9 billion at March 31, 2001, reflectinggood in force policy retention. Net written premiums and deposits for individual annuities in the 2002 first quarter were $1.526billion, slightly below the $1.545 billion in the comparable period of 2001, primarily driven by a decline in variable annuity sales dueto current market conditions, partially offset by significant fixed annuity sales increases over the prior-year period. Sales continue toreflect the cross-selling initiatives at all of the Citigroup affiliates, and reflect continued penetration of outside broker-dealer channels.
Group annuity account balances and benefit reserves reached $21.3 billion at March 31, 2002, up 13% from $18.9 billion at the end ofthe 2001 first quarter. This volume growth reflects 2001 strong sales momentum in all products. Net written premiums and deposits(excluding Citigroup’s employee pension plan deposits) were $1.525 billion in the 2002 first quarter, compared to $2.502 billion in thecomparable period of 2001, which included higher levels of structured finance transactions.
Direct periodic premiums and deposits for individual life insurance of $233 million in the 2002 first quarter were 25% ahead of the$187 million for the comparable period of 2001, driven by independent agent, high end, and retirement and estate planning. Lifeinsurance in force was $77.8 billion at March 31, 2002, up from $75.0 billion at year-end 2001 and $69.4 billion at March 31, 2001.

26
The Citigroup Private Bank
First Quarter %In millions of dollars 2002 2001 (1) ChangeTotal revenues, net of interest expense $423 $392 8Adjusted operating expenses (2) 254 239 6Provision for credit losses 6 2 NMCore income before taxes 163 151 8Income taxes 51 56 (9)Core income 112 95 18Restructuring-related items, after-tax (2) - -Income $110 $ 95 16Average assets (in billions of dollars) $ 28 $ 25 12Return on assets 1.62% 1.54%Client business volumes under management (in billions of dollars) $166 $146 14
(1) Reclassified to conform to the current period’s presentation.(2) Excludes restructuring-related items.NM Not meaningful
The Citigroup Private Bank provides personalized wealth management services for high net worth clients around the world. TheCitigroup Private Bank core income was $112 million in the 2002 first quarter, up $17 million or 18% from the 2001 first quarter,primarily reflecting continued customer revenue momentum and the impact of lower rates, partially offset by increased expenses andan increase in the provision for credit losses.
Client business volumes under management, which include custody accounts, client assets under fee-based management, deposits, andloans, were $166 billion at the end of the 2002 first quarter, up 14% from $146 billion at the end of the prior year quarter and reflectsincreases in each major product line. Regionally, the increase primarily reflects continued growth in Asia and the U.S.
Revenues, net of interest expense, were $423 million in the 2002 first quarter, up $31 million or 8% from the 2001 first quarter,primarily reflecting continued customer revenue momentum across a range of products including client trading activity, investmentsand lending, and the impact of lower interest rates. The increase in revenues reflected strong growth in Japan and North America, up35% and 30%, respectively, from the prior year quarter, partially offset by a 28% decline in Europe primarily due to lowerperformance fees and client trading activity.
Adjusted operating expenses of $254 million in the 2002 first quarter were up $15 million or 6% from the prior-year quarter, primarilyreflecting higher levels of revenues and employee-related expenses, partially due to investment spending in technology and front-endsales and servicing capabilities.
The provision for credit losses was $6 million in the 2002 first quarter, compared with $2 million in the 2001 first quarter. Theincrease primarily reflects higher write-offs and lower recoveries in the 2002 first quarter. Loans 90 days or more past due at the 2002quarter-end were $143 million or 0.52% of total loans outstanding, compared with $65 million or 0.27% at the end of the 2001 firstquarter.
Average assets of $28 billion in the 2002 first quarter increased $3 billion or 12% from $25 billion in the 2001 first quarter, primarilydue to higher mortgage financing, margin and tailored lending.

27
Citigroup Asset Management
First Quarter %In millions of dollars 2002 2001 (1) ChangeTotal revenues, net of interest expense $425 $444 (4)Adjusted operating expenses (2) 270 312 (13)Core income before taxes 155 132 17Income taxes 61 53 15Core income 94 79 19Restructuring-related items, after-tax (1) - -Income $ 93 $ 79 18Assets under management (in billions of dollars) (3) (4) $455 $403 13
(1) Reclassified to conform to the current period’s presentation.(2) Excludes restructuring-related items.(3) Includes $31 billion and $29 billion in 2002 and 2001, respectively, for The Citigroup Private Bank clients.(4) Includes Unit Investment Trusts held in client accounts of $7 billion and $8 billion and Latin America Affiliates assets under management of $21 billion and $7
billion in 2002 and 2001, respectively.
Citigroup Asset Management comprises the substantial resources that are available through its three primary asset managementbusiness platforms -- Smith Barney Asset Management, Salomon Brothers Asset Management and Citibank Asset Management.These businesses offer institutional, high net worth and retail clients a broad range of investment alternatives from investment centerslocated around the world. Products and services offered include mutual funds, closed-end funds, separately managed accounts, unitinvestment trusts and alternative investments.
Core income of $94 million in the 2002 first quarter was up $15 million or 19% compared to the 2001 first quarter, primarily due todecreased expenses and strong net flows, partially offset by the impact of negative market action, prior year one-time fees and thecumulative impact of outflows of retail Money Market funds to the SSB Bank Deposit Program.
Assets under management rose 13% from the year-ago quarter to $455 billion, reflecting strong net flows and an increase in LatinAmerica Affiliates assets, partially offset by negative market action and the transfer of retail Money Market assets to the SSB BankDeposit Program. Institutional client assets of $155 billion at March 31, 2002, were up 33% compared to a year ago, reflecting anincrease in institutional money market funds and long-term product flows, partially offset by negative market action. Retail clientassets were $231 billion, down 1% compared to a year ago, primarily due to the SSB Bank Deposit Program and negative marketaction, partially offset by strong net flows. Citigroup Alternative Investments and Latin America Affiliates assets were $49 billion and$21 billion, respectively, at March 31, 2002, up 6% and 212%, respectively, from the year-ago quarter. The increase in Latin AmericaAffiliates assets primarily relates to the Banamex acquisition.
Sales of proprietary mutual funds and managed account products at SSB declined 6% to $7.2 billion in the first quarter of 2002,compared to the prior-year quarter, and represented 56% of SSB’s retail channel sales. Sales of mutual and money funds throughGlobal Consumer’s banking network decreased 23% to $2.2 billion in the 2002 first quarter compared to the prior-year quarter,representing 45% of total sales, including $1.4 billion in International and $0.8 billion in the U.S., of which Primerica sold $0.5 billionof proprietary U.S. mutual and money funds, representing 70% of Primerica’s total U.S. mutual and money fund sales in the 2002 firstquarter compared to 59% in the year-ago quarter.
Revenues, net of interest expense, decreased $19 million or 4% from the year-ago quarter to $425 million in the 2002 first quarter.The decrease was primarily due to the cumulative impact of the outflows of retail Money Market funds to the SSB Bank DepositProgram and the impacts of negative market action and prior year one-time fees, partially offset by strong net flows.
Adjusted operating expenses of $270 million in the 2002 first quarter were down $42 million or 13% from the 2001 first quarter,primarily reflecting continued expense management, the absence of goodwill and indefinite-lived intangible asset amortization in the2002 first quarter, and reduced advertising and marketing costs.

28
PROPERTY AND CASUALTY
First Quarter %In millions of dollars 2002 2001 ChangeTotal revenues, net of interest expense $3,168 $3,018 5Claims and claim adjustment expenses 1,976 1,783 11Adjusted operating expenses (1) 756 769 (2)Income before taxes and minority interest 436 466 (6)Income taxes 109 124 (12)Minority interest, after-tax - - -Core income (2) 327 342 (4)Restructuring-related items, after-tax (1) - -Income $ 326 $ 342 (5)
(1) Excludes restructuring-related items.(2) Excludes investment gains/losses included in Investment Activities segment.
Property and Casualty -- which reflects the Property and Casualty operations of Travelers Property Casualty Corp. including theresults of its Personal lines business, Commercial lines business and Interest and Other which includes interest expense and certaincorporate income and expenses which have not been allocated to the business lines -- reported core income of $327 million in the2002 first quarter compared to $342 million in the prior-year period. The decrease in core income in 2002 was primarily due toincreased loss cost trends, primarily due to inflationary pressures, favorable prior-year reserve development in the 2001 first quarterand lower net investment income, partially offset by the benefit of rate increases and lower interest expense. Core income in the 2002first quarter has benefited from rate increases in excess of loss cost trends in both Commercial Lines and Personal Lines. Personallines core income declined 25% in the 2002 first quarter compared to the 2001 first quarter, reflecting increased weather-relatedlosses, continued higher loss cost trends and a decline in net investment income which were offset in part by an 8% increase in earnedpremiums. Commercial lines income declined 6% in the 2002 first quarter compared to the 2001 first quarter, largely resulting from adecrease in net investment income and favorable prior year reserve development in the 2001 first quarter. Interest and Other incomein the 2002 first quarter was $1 million compared to a loss of $23 million in the 2001 first quarter. The primary component of Interestand Other is interest expense. The increase in income in the 2002 first quarter compared to the 2001 first quarter is due to loweraverage interest bearing debt levels and lower interest rates. The decrease in interest bearing debt levels was primarily due torepayments of debt obligations to Citigroup.
In late March 2002, TPC completed its initial public offering of 231 million shares of its class A common stock, representingapproximately 23.1% of its outstanding equity securities, for net proceeds after underwriting discount of $4.1 billion. Citigrouprecognized an after-tax gain of $1.061 billion ($1.270 billion pretax) as a result of the TPC offering. Citigroup plans to make a tax-free distribution to its stockholders of a portion of its remaining ownership interest in TPC by year-end 2002, such that following thedistribution, Citigroup would remain a holder of approximately 9.9% of TPC's outstanding equity securities. Citigroup has noobligation to consummate the distribution by the end of 2002 or at all. Income statement minority interest will be recognized on theinitial public offering portion beginning on April 1, 2002.
Personal Lines
First Quarter %In millions of dollars 2002 2001 ChangeTotal revenues, net of interest expense $1,146 $1,080 6Claims and claim adjustment expenses 786 688 14Adjusted operating expenses (1) 271 267 1Income before taxes and minority interest 89 125 (29)Income taxes 24 38 (37)Minority interest, after-tax - - -Core income (2) 65 87 (25)Restructuring-related items, after-tax (1) - -Income $ 64 $ 87 (26)
(1) Excludes restructuring-related items.(2) Excludes investment gains/losses included in Investment Activities segment.
Personal Lines -- which writes all types of property and casualty insurance covering personal risks -- reported core income of $65million in the 2002 first quarter compared to $87 million in the prior-year period. The decline in the 2002 first quarter compared tothe 2001 first quarter reflects the effects of increased loss cost trends, favorable prior-year reserve development in the 2001 firstquarter, higher catastrophe losses and lower net investment income, partially offset by the benefit of rate increases. Rate increases andthe benefits of underwriting actions initiated in 2001 are now exceeding the rise in loss cost trends in the 2002 first quarter.

29
The following table shows net written premiums by product line:
First Quarter %In millions of dollars 2002 2001 ChangePersonal automobile $ 687 $639 8Homeowners and other 350 323 8Total net written premiums $1,037 $962 8
Personal Lines net written premiums for the 2002 first quarter were $1.037 billion compared to $962 million in the comparable periodof 2001. The increase in net written premiums in the 2002 first quarter compared to the 2001 first quarter primarily reflects growth intarget markets served by independent agents and growth in affinity group marketing and joint marketing arrangements, partially offsetby continued emphasis on disciplined underwriting and risk management.
Catastrophe losses, net of taxes and reinsurance, were $10 million in the 2002 first quarter and were primarily due to ice storms in theMidwest and New York. There were no catastrophe losses in the 2001 first quarter.
The statutory combined ratio for Personal Lines in the 2002 first quarter was 101.5% compared to 98.4% in the comparable period of2001. The GAAP combined ratio for Personal Lines in the 2002 first quarter was 102.5% compared to 99.4% in the comparableperiod of 2001. GAAP combined ratios for Personal Lines differ from statutory combined ratios primarily due to the deferral andamortization of certain expenses for GAAP reporting purposes only.
The increase in the statutory and GAAP combined ratios for the 2002 first quarter compared to the statutory and GAAP combinedratios for the 2001 first quarter was primarily due to increased loss cost trends, favorable prior-year reserve development in the 2001first quarter and higher catastrophe losses, partially offset by rate increases.
Commercial Lines
First Quarter %In millions of dollars 2002 2001 ChangeTotal revenues, net of interest expense $2,011 $1,970 2Claims and claim adjustment expenses 1,190 1,095 9Total operating expenses 485 499 (3)Income before taxes and minority interest 336 376 (11)Income taxes 75 98 (23)Minority interest, after-tax - - -Income (1) $ 261 $ 278 (6)
(1) Excludes investment gains/losses included in Investment Activities segment.
Commercial Lines -- which offers a broad array of property and casualty insurance and insurance-related services through brokersand independent agencies -- reported income of $261 million in the 2002 first quarter compared to $278 million in the comparableperiod of 2001. The decline in the 2002 first quarter compared to the 2001 first quarter reflects favorable prior-year reservedevelopment in the 2001 first quarter and lower net investment income, largely offset by the benefit of rate increases in excess of losscost trends, the absence of goodwill and indefinite-lived intangible asset amortization in the 2002 first quarter, and no catastrophelosses in the 2002 first quarter (compared to $8 million in the 2001 first quarter).
Net written premiums by market were as follows:
First Quarter %In millions of dollars 2002 2001 (1) ChangeNational Accounts $ 97 $ 126 (23)Commercial Accounts 849 761 12Select Accounts 455 429 6Bond 131 168 (22)Gulf 145 175 (17)Total net written premiums $1,677 $1,659 1
(1) Reclassified to conform to the current period’s presentation.
Commercial Lines net written premiums in the 2002 first quarter totaled $1.677 billion, slightly ahead of the $1.659 billion in thecomparable period of 2001. The trend in written premiums for Commercial Accounts and Select Accounts reflects the impact of animproving rate environment as evidenced by the favorable pricing on new and renewal business. The increase in CommercialAccounts net written premiums also reflects favorable new business in national property. The decrease in National Accounts net
30
written premiums was primarily due to a shift in current year business from retrospective to deductible and prior year retrospectivepremium true-up adjustments, partially offset by the repopulation of the involuntary pools.
National Accounts new business was significantly higher in the 2002 first quarter than in the comparable period of 2001, reflectingNational Accounts being favorably impacted in its target loss-sensitive market by businesses seeking quality insurers while stillmaintaining a strict underwriting discipline. National Accounts business retention ratio in the 2002 first quarter was moderately lowerthan in the 2001 first quarter, reflecting a focus on account profitability and an increase in lost business due to renewal price increasesin 2002.
Commercial Accounts new business in the 2002 first quarter was significantly higher than in the 2001 first quarter, reflecting thefavorable impact of businesses seeking quality insurers. Commercial Accounts business retention ratio in the 2002 first quarter wasmoderately higher than in the 2001 first quarter, reflecting the aggressive pricing strategy which has become more prevalent in theoverall marketplace.
New premium business in Select Accounts was moderately lower in the 2002 first quarter than in the comparable period of 2001,reflecting the continued disciplined approach to underwriting and risk management. Select Accounts business retention ratio in the2002 first quarter was marginally lower than in the comparable period of 2001, reflecting an increase in lost business due to renewalprice increases in 2002.
Bond provides a variety of fidelity and surety bonds and executive liability coverages to clients of all sizes through independent agentsand brokers. The 2002 net written premium amount is lower by $18 million due to a reinsurance change in Bond Executive LiabilityExcess of Loss Reinsurance Treaty that was effective January 1, 2002. In addition, the 2001 amount is higher by $34 million due tothe termination of the Master Bond Liability Treaty effective January 1, 2001. Excluding these two reinsurance adjustments, Bond netwritten premiums increased $15 million during the first quarter of 2002 compared to 2001 reflecting growth across all markets,partially offset by higher reinsurance costs.
Gulf markets products to national, mid-size and small customers and distributes them through both wholesale brokers and retail agentsand brokers throughout the United States. The decrease in Gulf net written premiums primarily reflects a scale-back of assumedreinsurance business and the restructuring of its transportation and property business.
There were no catastrophe losses in the 2002 first quarter. Catastrophe losses, net of taxes and reinsurance, were $8 million in the2001 first quarter due to the Seattle earthquake.
The statutory combined ratio before policyholder dividends for Commercial Lines in the 2002 first quarter was 101.6% compared to100.5% in the comparable period of 2001. The GAAP combined ratio before policyholder dividends for Commercial Lines in the2002 first quarter was 99.3% compared to 98.4% in the comparable period of 2001. GAAP combined ratios for Commercial Linesdiffer from statutory combined ratios primarily due to the deferral and amortization of certain expenses for GAAP reporting purposesonly.
The increase in the 2002 first quarter statutory and GAAP combined ratios before policyholder dividends compared to the 2001 firstquarter statutory and GAAP combined ratios before policyholder dividends was primarily due to increased loss cost trends andfavorable prior-year reserve development in the 2001 first quarter, partially offset by the benefit of rate increases, underwritingdiscipline and expense management.
Uncertainty Regarding Adequacy of Environmental and Asbestos Reserves
The reserves for environmental claims are not established on a claim-by-claim basis. An aggregate bulk reserve is carried for all ofthe environmental claims that are in dispute, until the dispute is resolved. This bulk reserve is established and adjusted based upon theaggregate volume of in-process environmental claims and the experience in resolving such claims. At March 31, 2002, approximately78% of the net environmental reserve (approximately $284 million), is carried in a bulk reserve and includes unresolved as well asincurred but not reported environmental claims for which the Company has not received any specific claims as well as for theanticipated cost of coverage litigation disputes relating to these claims. The balance, approximately 22% of the net environmental lossreserve (approximately $80 million), consists of case reserves for resolved claims.
In general, the Company posts case reserves for pending asbestos claims within approximately 30 business days of receipt of suchclaims. At March 31, 2002, approximately 79% (approximately $629 million) of the net asbestos reserve represents incurred but notreported losses for which the Company has not received any specific claims. The balance, approximately 21% of the net asbestosreserve (approximately $165 million), is for pending asbestos claims.

31
It is difficult to estimate the reserves for environmental and asbestos-related claims due to the vagaries of court coverage decisions,plaintiffs’ expanded theories of liability, the risks inherent in major litigation, and other uncertainties. Conventional actuarialtechniques are not used to estimate such reserves.
The reserves carried for environmental and asbestos claims at March 31, 2002 are the Company’s best estimate of ultimate claims andclaim adjustment expenses based upon known facts and current law. However, the uncertainties surrounding the final resolution ofthese claims continue. These include, without limitation, the risks inherent in major litigation, any impact from the bankruptcyprotection sought by various asbestos producers and other asbestos defendants, a further increase or decrease in asbestos andenvironmental claims which cannot now be anticipated, the role of any umbrella or excess policies the Company has issued for theseclaims, whether or not an asbestos claim is a product/completed operation claim subject to an aggregate limit and the availablecoverage, if any, for that claim, the resolution or adjudication of some disputes pertaining to the amount of available coverage forasbestos claims in a manner inconsistent with the Company’s previous assessment of these claims, the number and outcome of directactions against the Company, unanticipated developments pertaining to the Company’s ability to recover reinsurance forenvironmental and asbestos claims, and the willingness of parties, including the Company, to related litigation to settle. It is also notpossible to predict changes in the legal and legislative environment and their impact on the future development of asbestos andenvironmental claims. This development will be affected by future court decisions and interpretations, as well as changes inapplicable legislation. In addition, particularly during the last few months of 2001 and continuing into 2002, the asbestos-relatedtrends have both accelerated and become more visible. These trends include, but are not limited to, the filing of additional claims,more intensive advertising by lawyers seeking asbestos claimants, more aggressive litigation based on novel theories of liability andlitigation against new and previously peripheral defendants, including insurers, and developments in existing and pending bankruptcyproceedings.
Because of the uncertainties set forth above, additional liabilities may arise for amounts in excess of the current related reserves.These additional amounts, or a range of these additional amounts, cannot now be reasonably estimated and could result in a liabilityexceeding those reserves by an amount that could be material to the Company’s operating results in future periods. However, in theopinion of the Company’s management, it is not likely that these claims will have a material adverse effect on its financial conditionor liquidity. This paragraph contains forward-looking statements within the meaning of the Private Securities Litigation Reform Act.See “Forward-Looking Statements” on page 32.
INVESTMENT ACTIVITIES
First Quarter %In millions of dollars 2002 2001 (1) ChangeTotal revenues, net of interest expense $146 $233 (37)Total operating expenses 33 32 3Income before taxes and minority interest 113 201 (44)Income taxes 44 70 (37)Minority interest, after-tax (1) (1) -Income $ 70 $132 (47)
(1) Reclassified to conform to the current period’s presentation.
Investment Activities comprises Citigroup’s venture capital activities, realized investment gains (losses) from certain insurance-related investments, results from certain proprietary investments, the results of certain investments in countries that refinanced debtunder the 1989 Brady Plan or plans of a similar nature, and since August 2001, the investment portfolio related to Banamex.
Revenues, net of interest expense, are comprised of $88 million and ($94) million from proprietary investments, $4 million and $20million from LDC Debt Sales/Refinancing portfolios and $54 million and $307 million from net realized gains from insurance-relatedinvestments for the 2002 first quarter and 2001 first quarter, respectively.
Revenues, net of interest expense, of $146 million for the 2002 first quarter decreased $87 million or 37% from the 2001 first quarter,primarily reflecting higher impairment write-downs in insurance-related and other proprietary investments, including $100 million inpretax write-downs on certain investments in Argentina, and lower realized gains in insurance-related investments, partially offset byhigher venture capital results and a mark to market gain on an investment in India.
Investment Activities results may fluctuate in the future as a result of market and asset-specific factors. This statement is a forward-looking statement within the meaning of the Private Securities Litigation Reform Act. See “Forward-Looking Statements” on page32.

32
CORPORATE/OTHER
First Quarter %In millions of dollars 2002 2001 (1) ChangeTotal revenues, net of interest expense $ 96 ($134) NMTotal operating expenses 185 141 31Provision for benefits, claims, and credit losses - 1 NMLoss before tax benefits and minority interest (89) (276) 68Income tax benefits (16) (81) 80Minority interest, after-tax 5 1 NMLoss ($78) ($196) 60
(1) Reclassified to conform to the current period’s presentation.NM Not meaningful
Corporate/Other includes net corporate treasury results, corporate staff and other corporate expenses, certain intersegmenteliminations, and the remainder of Internet-related development activities not allocated to the individual businesses.
Revenues, net of interest expense, were $96 million in the 2002 first quarter, up $230 million from the 2001 first quarter, primarilydue to lower net treasury costs and the impact of higher intersegment eliminations. The lower net treasury results are primarily relatedto reduced rates and the recognized benefits from interest rate hedging activities, partially offset by increased funding costs related tothe Banamex acquisition.
Operating expenses were $185 million in the 2002 first quarter, up $44 million from the 2001 first quarter, primarily due to the impactof higher intersegment eliminations, partially offset by a decrease in certain net unallocated corporate costs.
FORWARD-LOOKING STATEMENTS
Certain of the statements contained herein that are not historical facts are forward-looking statements within the meaning of thePrivate Securities Litigation Reform Act. The Company's actual results may differ materially from those included in the forward-looking statements. Forward-looking statements are typically identified by words or phrases such as "believe," "expect," "anticipate,""intend," "estimate," "may increase," "may fluctuate," and similar expressions or future or conditional verbs such as "will," "should,""would," and "could." These forward-looking statements involve risks and uncertainties including, but not limited to, weakeningglobal economic conditions; the economic crisis in Argentina; government decrees and judicial orders in Argentina; higherunemployment rates and the continued increase in bankruptcy filings in Japan; sovereign or regulatory actions, and political conditionsand developments; credit performance of the portfolios, including bankruptcies, portfolio growth, and seasonal factors; stress in thetelecommunications industry; subsidiaries’ dividending capability; an increase in the amortization period for certain direct loanorigination costs; asbestos-related and environmental-related developments including any impact from the bankruptcy protectionsought by various asbestos producers and other asbestos defendants, the role of any umbrella or excess policies the Company hasissued, unanticipated developments pertaining to the Company’s ability to recover reinsurance for asbestos and environmental claims,changes in the legal and legislative environment and their impact on the future development of asbestos and environmental claims,more intensive advertising by lawyers seeking asbestos claimants and the increasing focus by plaintiffs on new and previouslyperipheral defendants, including insurers; the effect of banking and financial services reforms, of rules governing the regulatorytreatment of merchant banking investments, and of rules regarding the regulatory capital treatment of recourse, direct credit substitutesand residual interest in asset securitizations; possible amendments to, and interpretations of, risk-based capital guidelines and reportinginstructions; the ability of states to adopt more extensive consumer privacy protections through legislation or regulation; the resolutionof legal proceedings and related matters; and the Company’s success in managing the costs associated with the expansion of existingdistribution channels and developing new ones, and in realizing increased revenues from such distribution channels, including cross-selling initiatives and electronic commerce-based efforts.

33
MANAGING GLOBAL RISK
The Citigroup Risk Management framework recognizes the wide range and diversity of global business activities by balancing strongcorporate oversight with defined independent risk management functions at the business level. The Citigroup Risk ManagementFramework is described in detail in Citigroup's 2001 Annual Report and Form 10-K.
The Credit Risk Management Process
The credit risk management process at Citigroup relies on corporate-wide standards to ensure consistency and integrity, with business-specific policies and practices to ensure applicability and ownership. Citigroup's credit risk management process is described in detailin Citigroup's 2001 Annual Report and Form 10-K.
The Market Risk Management Process
Market risk at Citigroup – like credit risk – is managed through corporate-wide standards and business policies and procedures.• Market risks are measured in accordance with established standards to ensure consistency across businesses and the ability to
aggregate like risks at the Citigroup-level.• Each business is required to establish, and have approved by independent Market Risk Management, a market risk limit
framework, including risk measures, limits and controls, that clearly defines approved risk profiles and is within the parameters ofCitigroup’s overall risk appetite.
• Businesses, working in conjunction with independent Market Risk Management, must ensure that market risks are independentlymeasured, monitored and reported, to ensure transparency in risk-taking activities and integrity in risk reports.
In all cases, the businesses are ultimately responsible for the market risks that they take, and for remaining within their defined limits.Market risk encompasses liquidity risk and price risk, both of which arise in the normal course of business of a global financialintermediary. Liquidity risk is the risk that some entity, in some location and in some currency, may be unable to meet a financialcommitment to a customer, creditor, or investor when due. Liquidity Risk is discussed in the Liquidity and Capital Resources section.Price risk is the risk to earnings that arises from changes in interest rates, foreign exchange rates, equity and commodity prices, and intheir implied volatilities. Price risk arises in Non-Trading Portfolios, as well as in Trading Portfolios.
Non-trading Portfolios
Price risk in non-trading portfolios is measured predominantly through Earnings-at-Risk and Factor Sensitivity techniques. Thesemeasurement techniques are supplemented with additional tools, including stress testing and cost-to-close analysis.
Business units manage the potential earnings effect of interest rate movements by managing the asset and liability mix, either directlyor through the use of derivative financial products. These include interest rate swaps and other derivative instruments that aredesignated and effective as hedges. The utilization of derivatives is managed in response to changing market conditions as well as tochanges in the characteristics and mix of the related assets and liabilities.
Earnings-at-Risk is the primary method for measuring price risk in Citigroup’s non-trading portfolios (excluding the insurancecompanies). Earnings-at-Risk measures the pretax earnings impact of a specified upward and downward parallel shift in the yieldcurve for the appropriate currency. The Earnings-at-Risk is calculated separately for each currency and reflects the repricing gaps inthe position as well as option positions, both explicit and embedded. U.S. dollar exposures are calculated by multiplying the gapbetween interest sensitive items, including assets, liabilities, derivative instruments and other off-balance sheet instruments, by 100basis points. Non-U.S. dollar exposures are calculated utilizing the statistical equivalent of a 100 basis point change in interest ratesand assuming no correlation between exposures in different currencies.
Citigroup’s primary non-trading price risk exposure is to movements in the U.S. dollar and Mexican peso interest rates. Citigroup alsohas Earnings-at-Risk in various other currencies, however, there are no significant risk concentrations in any other individual non-U.S.dollar currency.
The following table illustrates the impact to Citigroup’s pretax earnings from a 100 basis point increase or decrease in the U.S. dollaryield curve. As of March 31, 2002, the potential impact on pretax earnings over the next 12 months is a decrease of $611 million froman interest rate increase and an increase of $499 million from an interest rate decrease. The potential impact on pretax earnings forperiods beyond the first 12 months is an increase of $154 million from an increase in interest rates and a decrease of $771 millionfrom an interest rate decrease. The change in Earnings-at-Risk from the prior year and prior-year end primarily reflects an increase inthe proportion of floating rate funding.
The statistical equivalent of a 100 basis point increase in Mexican peso interest rates would have a potential positive impact onCitigroup’s pretax earnings of approximately $348 million over the next 12 months and a potential positive impact of $34 million for

34
the years thereafter. The statistical equivalent of a 100 basis points decrease in Mexican peso interest rates would have a potentialnegative impact on Citigroup’s pretax earnings of approximately $348 million for the next 12 months and potential negative impact of$34 million for the years thereafter. The change in Earnings-at-Risk from the prior year primarily represents the inclusion ofBanamex's Mexican peso exposure while the change in Earnings-at-Risk from the prior year-end reflects the repricing characteristicsof the portfolio.
Excluding the impact of changes in Mexican peso interest rates, the statistical equivalent of a 100 basis point increase in other non-U.S. dollar interest rates would have a potential negative impact on Citigroup’s pretax earnings of $176 million over the next twelvemonths and potential negative impact of $26 million for the years thereafter. The statistical equivalent of a 100 basis point decrease inother non-U.S. dollar interest rates would have a potential positive impact on Citigroup’s pretax earnings of $178 million over the nexttwelve months and a potential positive impact of $39 million for the years thereafter. The change in Earnings-at-Risk from the prioryear and the prior year-end primarily represents changes in the asset and liability mix across a range of currencies to reflect Citigroup'scurrent view of interest rates.
Citigroup Earnings-at-Risk (impact on pretax earnings) (1) (2)
March 31, 2002 December 31, 2001
In millions of dollars U.S. Dollar Mexican PesoOther Non-U.S.
Dollar U.S. Dollar Mexican PesoOther Non-U.S.
DollarIncrease Decrease Increase Decrease Increase Decrease Increase Decrease Increase Decrease Increase Decrease
Twelve months and less ($611) $499 $348 ($348) ($176) $178 ($241) $ 244 $208 ($208) ($275) $278Thereafter 154 (771) 34 (34) (26) 39 898 (1,082) 207 (207) (236) 250Total ($457) ($272) $382 ($382) ($202) $217 $657 ($ 838) $415 ($415) ($511) $528
March 31, 2001
In millions of dollars U.S. Dollar Mexican PesoOther Non-U.S.
DollarIncrease Decrease Increase Decrease Increase Decrease
Twelve months and less ($ 171) $ 186 ($20) $20 ($214) $216Thereafter 1,042 (1,229) (26) 26 (192) 206Total $ 871 ($1,043) ($46) $46 ($406) $422
(1) Excludes the insurance companies (see below).(2) Prior year amounts have been restated to conform with the current period’s presentation.
Insurance Companies
The table below reflects the estimated decrease in the fair value of financial instruments held in the insurance companies, as a result ofa 100 basis point increase in interest rates.
In millions of dollarsMarch 31,
2002December 31,
2001March 31,
2001AssetsInvestments $3,659 $3,404 $2,980LiabilitiesLong-term debt $ 47 $ 18 $ 26Contractholder funds 774 775 557Redeemable securities of subsidiary trusts 48 1 86
A significant portion of insurance companies' liabilities (e.g., insurance policy and claims reserves) are not financial instruments andare excluded from the above sensitivity analysis. Corresponding changes in fair value of these accounts, based on the present value ofestimated cash flows, would materially mitigate the impact of the net decrease in values implied above. The analysis reflects theestimated gross change in value resulting from a change in interest rates only and is not comparable to the Earnings-at-Risk used forthe Citigroup non-trading portfolios described above or the Value-at-Risk used for the trading portfolios described below.
Trading Portfolios
Price risk in trading portfolios is measured through a complementary set of tools, including Factor Sensitivities, Value-at-Risk, andStress Testing. Each trading portfolio has its own market risk limit framework, encompassing these measures and other controls,including permitted product lists and a new, complex product approval process, established by the business, and approved byindependent market risk management.
Factor Sensitivities are defined as the change in the value of a position for a defined change in a market risk factor (e.g., the change inthe value of a Treasury bill for a 1 basis point change in interest rates). It is the responsibility of independent market risk management

35
to ensure that factor sensitivities are calculated, monitored, and, in some cases, limited for all relevant risks taken in a tradingportfolio. Value-at-Risk estimates the potential decline in the value of a position or a portfolio, under normal market conditions, overa one-day holding period, at a 99% confidence level. The Value-at-Risk method incorporates the Factor Sensitivities of the tradingportfolio with the volatilities and correlations of those factors.
Stress Testing is performed on trading portfolios on a regular basis, to estimate the impact of extreme market movements. StressTesting is performed on individual trading portfolios, as well as on aggregations of portfolios and businesses, as appropriate. It is theresponsibility of independent market risk management, in conjunction with the businesses, to develop stress scenarios, review theoutput of periodic stress testing exercises, and utilize the information to make judgments as to the ongoing appropriateness ofexposure levels and limits.
New and/or complex products in trading portfolios are required to be reviewed and approved by the Capital Markets ApprovalCommittee (CMAC). The CMAC is responsible for ensuring that all relevant risks are identified and understood, and can bemeasured, managed, and reported in accordance with applicable business policies and practices. The CMAC is made up of seniorrepresentatives from market and credit risk management, legal, accounting, operations, and other support areas, as required.
The level of price risk exposure at any given point in time depends on the market environment and expectations of future price andmarket movements, and will vary from period to period.
For Citigroup’s major trading centers, the aggregate pretax Value-at-Risk in the trading portfolios was $71 million at March 31, 2002.Daily exposures averaged $69 million during the first quarter and ranged from $57 million to $97 million.
The following table summarizes Value-at-Risk in the trading portfolios as of March 31, 2002 and December 31, 2001, along with theaverages.
In millions of dollarsMarch 31,
2002
2002First
QuarterAverage
December 312001
FullYear2001
AverageInterest rate $50 $50 $44 $55Foreign exchange 11 10 9 12Equity 27 22 10 15All other (primarily commodity) 26 20 21 18Covariance adjustment (43) (33) (30) (37)Total $71 $69 $54 $63
The table below provides the range of Value-at-Risk in the trading portfolios that was experienced during the first quarter of 2002 andall of 2001.
First Quarter Full-Year2002 2001
In millions of dollars Low High Low HighInterest rate $42 $67 $33 $90Foreign exchange 5 16 6 22Equity 13 51 9 53All other (primarily commodity) 17 26 8 52
Management of Cross-Border Risk
Cross-border risk is the risk that Citigroup will be unable to obtain payment from customers on their contractual obligations as a resultof actions taken by foreign governments such as exchange controls, debt moratoria, and restrictions on the remittance of funds.Citigroup manages cross-border risk as part of the risk management framework described in the 2001 Annual Report and Form 10-K.
Except as described below for cross-border resale agreements and the netting of certain long and short securities positions, thefollowing table presents total cross-border outstandings and commitments on a regulatory basis in accordance with Federal FinancialInstitutions Examination Council's (FFIEC) guidelines. In regulatory reports under FFIEC guidelines, cross-border resale agreementsare presented based on the domicile of the issuer of the securities that are held as collateral. However, for purposes of the followingtable, cross-border resale agreements are presented based on the domicile of the counterparty because the counterparty has the legalobligation for repayment. Similarly, under FFIEC guidelines, long securities positions are required to be reported on a gross basis.However, for purposes of the following table, certain long and short securities positions are presented on a net basis consistent withinternal cross-border risk management policies, reflecting a reduction of risk from offsetting positions.

36
Cross-Border Outstandings and Commitments
Total cross-border outstandings include cross-border claims on third parties as well as investments in and funding of local franchises.Countries with FFIEC outstandings greater than 0.75% of Citigroup assets at March 31, 2002 and December 31, 2001 include:
March 31, 2002 December 31, 2001
Cross-Border Claims on Third Parties Investments
In billions of dollars
Trading andShort-term
Claims (1)
Cross-Border ResaleAgreements All Other Total
In andFunding of
LocalFranchises
Total Cross-Border
OutstandingsCommit-ments (2)
Total Cross-Border
OutstandingsCommit-ments (2)
Germany $7.3 $6.2 $1.5 $15.0 $1.7 $16.7 $6.1 $13.5 $7.3Mexico 4.2 - 5.5 9.7 2.3 12.0 0.8 12.3 0.6Brazil 2.9 - 3.3 6.2 5.2 11.4 0.2 10.7 0.3France 5.0 3.2 1.3 9.5 0.1 9.6 7.6 10.9 8.7Italy 4.9 1.2 1.3 7.4 1.3 8.7 2.5 9.7 2.4Japan 2.4 4.8 1.4 8.6 - 8.6 1.6 7.9 3.3United Kingdom 3.4 1.6 3.5 8.5 - 8.5 17.2 11.2 16.8Canada 2.4 0.6 2.3 5.3 2.2 7.5 3.4 7.9 3.4
(1) Trading and short-term claims include cross-border debt and equity securities held in the trading account, trade finance receivables, net revaluation gains onforeign exchange and derivative contracts, and other claims with a maturity of less than one year.
(2) Commitments (not included in total cross-border outstandings) include legally binding cross-border letters of credit and other commitments and contingencies asdefined by the FFIEC.
Total cross-border outstandings for March 31, 2002 under FFIEC guidelines, including cross-border resale agreements based on thedomicile of the issuer of the securities that are held as collateral and long securities positions reported on a gross basis, amounted to$27.4 billion for Germany, $13.3 billion for Mexico, $12.8 billion for Brazil, $10.2 billion for France, $12.6 billion for Italy, $8.0billion for Japan, $8.8 billion for the United Kingdom, and $8.4 billion for Canada.
Total cross-border outstandings for December 31, 2001 under FFIEC guidelines, including cross-border resale agreements based onthe domicile of the issuer of the securities that are held as collateral and long securities positions reported on a gross basis, amountedto $19.5 billion for Germany, $13.2 billion for Mexico, $11.9 billion for Brazil, $13.5 billion for France, $12.8 billion for Italy, $6.5billion for Japan, $9.3 billion for the United Kingdom, and $8.9 billion for Canada.
LIQUIDITY AND CAPITAL RESOURCES
Citigroup’s primary source of capital resources is its net earnings. Other sources include proceeds from the issuance of trust preferredsecurities, senior debt, subordinated debt and commercial paper. Citigroup can also generate funds by securitizing various financialassets including credit card receivables and other receivables generally secured by collateral such as automobiles and single-familyresidences.
Citigroup uses these capital resources to pay dividends to its stockholders, to repurchase its shares in the market pursuant to Board-of-Directors approved plans, to support organic growth, to make acquisitions and to service its debt obligations. As a financial holdingcompany, substantially all of Citigroup’s net earnings are generated within its operating subsidiaries including Citibank, SalomonSmith Barney Inc., TIC and TPC. Each of these subsidiaries makes these funds available to Citigroup in the form of dividends. Thesubsidiaries’ dividend paying abilities are limited by certain covenant restrictions in credit agreements and/or by regulatoryrequirements. Certain of these subsidiaries are also subject to rating agency considerations that also impact their capitalization levels.
During 2002, it is not anticipated that any restrictions on the subsidiaries’ dividending capability will restrict Citigroup’s ability tomeet its obligations as and when they become due. It is also anticipated that Citigroup will maintain its share repurchase programduring 2002.
In late March 2002, TPC completed its initial public offering of 231 million shares of its class A common stock, representingapproximately 23.1% of its outstanding equity securities, for net proceeds after underwriting discount of $4.1 billion. Citigrouprecognized an after-tax gain of $1.061 billion ($1.270 billion pretax) as a result of the TPC offering. Citigroup plans to make a tax-free distribution to its stockholders of a portion of its remaining ownership interest in TPC by year-end 2002, such that following thedistribution, Citigroup would remain a holder of approximately 9.9% of TPC's outstanding equity securities. Citigroup has noobligation to consummate the distribution by the end of 2002 or at all. The distribution of TPC, if it occurs, will be treated as adividend to stockholders for accounting purposes that will reduce stockholders’ equity by an amount in excess of $7 billion. Thisparagraph and the preceding paragraph contain forward-looking statements within the meaning of the Private Securities LitigationReform Act. See “Forward-Looking Statements” on page 32.

37
Citigroup, Citicorp and certain other subsidiaries issue commercial paper directly to investors. Citigroup and Citicorp, both of whichare bank holding companies, maintain combined liquidity reserves of cash, securities and unused bank lines of credit to support theircombined outstanding commercial paper.
Citigroup has unutilized bilateral committed revolving credit facilities in the amount of $950 million that expire in 2002. Under thesefacilities, Citigroup is required to maintain a certain level of consolidated stockholders’ equity (as defined in the agreements).Citigroup exceeded this requirement by approximately $58.6 billion at March 31, 2002.
Associates, a subsidiary of Citicorp, has a combination of unutilized credit facilities of $6.8 billion as of March 31, 2002 which havematurities ranging from 2002 to 2005. All of these facilities are guaranteed by Citicorp. In connection with the facilities, Citicorp isrequired to maintain a certain level of consolidated stockholder’s equity (as defined in the agreements). At March 31, 2002, thisrequirement was exceeded by approximately $51.3 billion. Citicorp has also guaranteed various debt obligations of Associates andCitiFinancial Credit Company (CCC), an indirect subsidiary of Citicorp.
Borrowings under bank lines of credit may be at interest rates based on LIBOR, CD rates, the prime rate, or bids submitted by thebanks. Each company pays its banks facility fees for its lines of credit.
Citicorp, Salomon Smith Barney, and some of their nonbank subsidiaries have credit facilities with Citicorp’s subsidiary banks,including Citibank, N.A. Borrowings under these facilities must be secured in accordance with Section 23A of the Federal ReserveAct.
Management of Liquidity
Management of liquidity at Citigroup is the responsibility of the Corporate Treasurer. A uniform liquidity risk management policyexists for Citigroup and its major operating subsidiaries. Under this policy, there is a single set of standards for the measurement ofliquidity risk in order to ensure consistency across businesses, stability in methodologies and transparency of risk. Management ofliquidity at each operating subsidiary and/or country is performed on a daily basis and is monitored by Corporate Treasury. Eachmajor operating subsidiary and/or country must prepare an annual liquidity and funding plan for the approval by the CorporateTreasurer. Under the annual liquidity and funding plan, liquidity limits, targets and ratios are established. Contingency Funding Plansare prepared on a periodic basis for Citigroup and each major operating subsidiary and country. These plans include stress testing ofassumptions about significant changes in key funding sources, credit ratings, contingent uses of funding, and political and economicconditions in Emerging Markets countries.
Citigroup’s funding sources are well-diversified across funding types and geography, a benefit of the strength of the global franchise.Funding for the Parent and its major operating subsidiaries includes a large geographically diverse retail and corporate deposit base, asignificant portion of which is considered core. Other sources of funding include collateralized borrowings, securitizations (primarilycredit card and mortgages), long-term debt, and purchased/wholesale funds. This funding is significantly enhanced by Citigroup’sstrong capital position. Each of Citigroup’s major operating subsidiaries finances its operations on a basis consistent with itscapitalization, regulatory structure and the operating environment in which it operates.
Other liquidity and capital resource considerations for Citigroup and its major operating facilities follow.
OFF-BALANCE SHEET ARRANGEMENTS
Citigroup and its subsidiaries are involved with several types of off-balance sheet arrangements, including special purpose entities(SPEs), lines and letters of credit, and loan commitments. The principal uses of SPEs are to obtain sources of liquidity by securitizingcertain of Citigroup’s financial assets, to assist our clients in securitizing their financial assets, and to create other investment productsfor our clients.
SPEs may be organized as trusts, partnerships, or corporations. In a securitization, the company transferring assets to an SPE convertsthose assets into cash before they would have been realized in the normal course of business. The SPE obtains the cash needed to paythe transferor for the assets received by issuing securities to investors in the form of debt instruments, certificates, commercial paper,and other notes of indebtedness. Investors usually have recourse to the assets in the SPE and often benefit from other creditenhancements, such as a cash collateral account, overcollateralization in the form of excess assets in the SPE, or a liquidity facility,such as a line of credit or asset purchase agreement. Accordingly, the SPE can typically obtain a more favorable credit rating fromrating agencies, such as Standard and Poor’s and Moody’s Investors Service, than the transferor could obtain for its own debtissuances, resulting in less expensive financing costs. The transferor can use the cash proceeds from the sale to extend credit toadditional customers or for other business purposes. The SPE may also enter into a derivative contract in order to convert the yield orcurrency of the underlying assets to match the needs of the SPE’s investors or to limit the credit risk of the SPE. The Company maybe the counterparty to any such derivative. The securitization process enhances the liquidity of the financial markets, may spreadcredit risk among several market participants, and makes new funds available to extend credit to consumers and commercial entities.
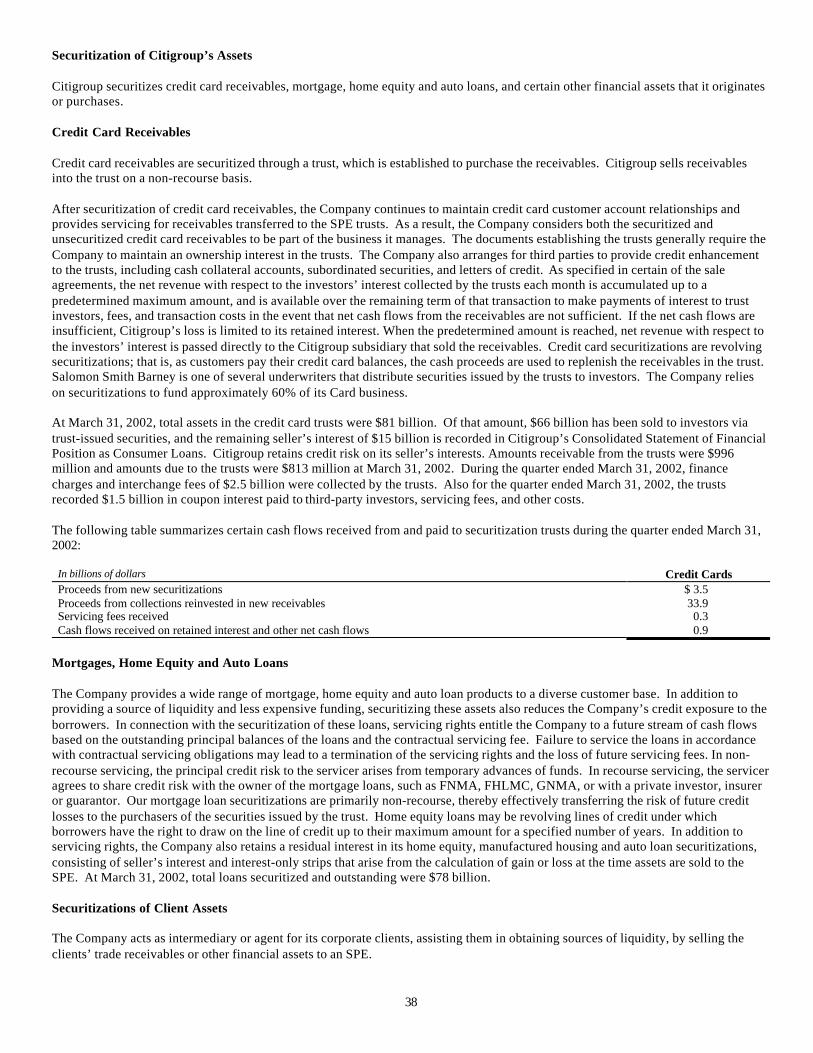
38
Securitization of Citigroup’s Assets
Citigroup securitizes credit card receivables, mortgage, home equity and auto loans, and certain other financial assets that it originatesor purchases.
Credit Card Receivables
Credit card receivables are securitized through a trust, which is established to purchase the receivables. Citigroup sells receivablesinto the trust on a non-recourse basis.
After securitization of credit card receivables, the Company continues to maintain credit card customer account relationships andprovides servicing for receivables transferred to the SPE trusts. As a result, the Company considers both the securitized andunsecuritized credit card receivables to be part of the business it manages. The documents establishing the trusts generally require theCompany to maintain an ownership interest in the trusts. The Company also arranges for third parties to provide credit enhancementto the trusts, including cash collateral accounts, subordinated securities, and letters of credit. As specified in certain of the saleagreements, the net revenue with respect to the investors’ interest collected by the trusts each month is accumulated up to apredetermined maximum amount, and is available over the remaining term of that transaction to make payments of interest to trustinvestors, fees, and transaction costs in the event that net cash flows from the receivables are not sufficient. If the net cash flows areinsufficient, Citigroup’s loss is limited to its retained interest. When the predetermined amount is reached, net revenue with respect tothe investors’ interest is passed directly to the Citigroup subsidiary that sold the receivables. Credit card securitizations are revolvingsecuritizations; that is, as customers pay their credit card balances, the cash proceeds are used to replenish the receivables in the trust.Salomon Smith Barney is one of several underwriters that distribute securities issued by the trusts to investors. The Company relieson securitizations to fund approximately 60% of its Card business.
At March 31, 2002, total assets in the credit card trusts were $81 billion. Of that amount, $66 billion has been sold to investors viatrust-issued securities, and the remaining seller’s interest of $15 billion is recorded in Citigroup’s Consolidated Statement of FinancialPosition as Consumer Loans. Citigroup retains credit risk on its seller’s interests. Amounts receivable from the trusts were $996million and amounts due to the trusts were $813 million at March 31, 2002. During the quarter ended March 31, 2002, financecharges and interchange fees of $2.5 billion were collected by the trusts. Also for the quarter ended March 31, 2002, the trustsrecorded $1.5 billion in coupon interest paid to third-party investors, servicing fees, and other costs.
The following table summarizes certain cash flows received from and paid to securitization trusts during the quarter ended March 31,2002:
In billions of dollars Credit CardsProceeds from new securitizations $ 3.5Proceeds from collections reinvested in new receivables 33.9Servicing fees received 0.3Cash flows received on retained interest and other net cash flows 0.9
Mortgages, Home Equity and Auto Loans
The Company provides a wide range of mortgage, home equity and auto loan products to a diverse customer base. In addition toproviding a source of liquidity and less expensive funding, securitizing these assets also reduces the Company’s credit exposure to theborrowers. In connection with the securitization of these loans, servicing rights entitle the Company to a future stream of cash flowsbased on the outstanding principal balances of the loans and the contractual servicing fee. Failure to service the loans in accordancewith contractual servicing obligations may lead to a termination of the servicing rights and the loss of future servicing fees. In non-recourse servicing, the principal credit risk to the servicer arises from temporary advances of funds. In recourse servicing, the serviceragrees to share credit risk with the owner of the mortgage loans, such as FNMA, FHLMC, GNMA, or with a private investor, insureror guarantor. Our mortgage loan securitizations are primarily non-recourse, thereby effectively transferring the risk of future creditlosses to the purchasers of the securities issued by the trust. Home equity loans may be revolving lines of credit under whichborrowers have the right to draw on the line of credit up to their maximum amount for a specified number of years. In addition toservicing rights, the Company also retains a residual interest in its home equity, manufactured housing and auto loan securitizations,consisting of seller’s interest and interest-only strips that arise from the calculation of gain or loss at the time assets are sold to theSPE. At March 31, 2002, total loans securitized and outstanding were $78 billion.
Securitizations of Client Assets
The Company acts as intermediary or agent for its corporate clients, assisting them in obtaining sources of liquidity, by selling theclients’ trade receivables or other financial assets to an SPE.

39
The Company administers several third-party owned, special purpose, multi-seller finance companies that purchase pools of tradereceivables, credit cards, and other financial assets from third-party clients of the Company. As administrator, the Company providesaccounting, funding, and operations services to these conduits. The Company has no ownership interest in the conduits. The clientscontinue to service the transferred assets. The conduits’ asset purchases are funded by issuing commercial paper and medium-termnotes. Clients absorb the first losses of the conduit by providing collateral in the form of excess assets. The Company along withother financial institutions provides liquidity facilities, such as commercial paper back-stop lines of credit to the conduits. TheCompany also provides second loss enhancement in the form of letters of credit and other guarantees. All fees are charged on amarket basis. At March 31, 2002, total assets in the conduits were $53 billion.
The Company also securitizes clients’ debt obligations in transactions involving SPEs that issue collateralized debt obligations(CDOs). A majority of the transactions are on behalf of clients where the Company first purchases the assets at the request of theclients and warehouses them until the securitization transaction is executed. Other CDOs are structured where the underlying debtobligations are purchased directly in the open market or from issuers. Some CDOs have static unmanaged portfolios of assets, whileothers have a more actively managed portfolio of financial assets. The Company receives fees for structuring and distributing theCDO securities to investors.
Creation of Other Investment Products
The Company packages and securitizes assets purchased in the financial markets in order to create new security offerings, includinghedge funds, mutual funds, and other investment funds, for institutional and private bank clients as well as retail customers, that matchthe clients’ investment needs and preferences. The SPEs may be credit-enhanced by excess assets in the investment pool or by thirdparty insurers assuming the risks of the underlying assets, thus reducing the credit risk assumed by the investors and diversifyinginvestors’ risk to a pool of assets as compared with investments in individual assets. The Company typically manages the SPE formarket-rate fees. In addition, the Company may be one of several liquidity providers to the SPE and may place the securities withinvestors. The Company has no ownership interest in these entities.
Credit Commitments and Lines of Credit
The table below summarizes Citigroup’s credit commitments as of March 31, 2002 and December 31, 2001.
In millions of dollars March 31, 2002 December 31, 2001Financial standby letters of credit and foreign office guarantees $ 31,799 $ 29,541Performance standby letters of credit and foreign office guarantees 7,376 7,749Commercial and similar letters of credit 4,730 5,681One-to-four family residential mortgages 4,438 5,470Revolving open-end loans secured by 1-4 family residential properties 7,996 7,107Commercial real estate, construction and land development 1,912 1,882Credit card lines (1) 401,891 387,396Commercial and other consumer loan commitments (2) 199,509 210,909Total $659,651 $655,735
(1) Credit card lines are unconditionally cancelable by the issuer.(2) Includes $127 billion and $138 billion with original maturity less than one year at March 31, 2002 and December 31, 2001, respectively.
CAPITAL
Citigroup Inc.
Citigroup is subject to risk-based capital guidelines issued by the Board of Governors of the Federal Reserve System (FRB). Theseguidelines are used to evaluate capital adequacy based primarily on the perceived credit risk associated with balance sheet assets, aswell as certain off-balance sheet exposures such as unused loan commitments, letters of credit, and derivative and foreign exchangecontracts. The risk-based capital guidelines are supplemented by a leverage ratio requirement.
Citigroup Ratios
March 31, 2002 December 31, 2001Tier 1 capital 9.13% 8.42%Total capital (Tier 1 and Tier 2) 11.59 10.92Leverage (1) 5.89 5.64Common stockholders’ equity 7.78 7.58
(1) Tier 1 capital divided by adjusted average asset s.

40
Citigroup maintained a strong capital position during the first quarter of 2002. Total capital (Tier 1 and Tier 2) amounted to $78.9billion at March 31, 2002, representing 11.59% of risk-adjusted assets. This compares to $75.8 billion and 10.92% at December 31,2001. Tier 1 capital of $62.2 billion at March 31, 2002 represented 9.13% of risk-adjusted assets, compared to $58.4 billion and8.42% at December 31, 2001. Citigroup’s leverage ratio was 5.89% at March 31, 2002 compared to 5.64% at December 31, 2001.
Components of Capital Under Regulatory Guidelines
In millions of dollars March 31, 2002 December 31, 2001Tier 1 capitalCommon stockholders’ equity $82,238 $79,722Qualifying perpetual preferred stock 1,400 1,400Qualifying mandatorily redeemable securities of subsidiary trusts 6,725 6,725Minority interest (1) 2,971 803Less: Net unrealized gains on securities available-for-sale (2) (264) (852)Accumulated net gains on cash flow hedges, net of tax (233) (168)Intangible assets:Goodwill (25,506) (23,861)Other intangible assets (4,798) (4,944)50% investment in certain subsidiaries (3)
Other(67)
(306)(72)
(305)Total Tier 1 capital $62,160 $58,448Tier 2 capitalAllowance for credit losses (4) 8,538 8,694Qualifying debt (5) 8,207 8,648Unrealized marketable equity securities gains (2) 79 79Less: 50% investment in certain subsidiaries (3) (67) (72)Total Tier 2 capital 16,757 17,349Total capital (Tier 1 and Tier 2) $78,917 $75,797Risk-adjusted assets (6) $680,984 $694,035
(1) The increase from December 31, 2001 primarily reflects the minority interest related to the TPC Initial Public Offering.(2) Tier 1 capital excludes unrealized gains and losses on debt securities available-for-sale in accordance with regulatory risk-based capital guidelines. The Federal
bank regulatory agencies permit institutions to include in Tier 2 capital up to 45% of pretax net unrealized holding gains on available-for-sale equity securitieswith readily determinable fair values. Institutions are required to deduct from Tier 1 capital net unrealized holding losses on available-for-sale equity securitieswith readily determinable fair values, net of tax.
(3) Represents investment in certain overseas insurance activities and unconsolidated banking and finance subsidiaries.(4) Includable up to 1.25% of risk-adjusted assets. Any excess allowance is deducted from risk-adjusted assets.(5) Includes qualifying senior and subordinated debt in an amount not exceeding 50% of Tier 1 capital, and subordinated capital notes subject to certain limitations.(6) Includes risk-weighted credit equivalent amounts, net of applicable bilateral netting agreements, of $25.0 billion for interest rate, commodity and equity
derivative contracts and foreign exchange contracts, as of March 31, 2002, compared to $26.2 billion as of December 31, 2001. Market risk-equivalent assetsincluded in risk-adjusted assets amounted to $34.4 billion at March 31, 2002 and $31.4 billion at December 31, 2001. Risk-adjusted assets also includes theeffect of other off-balance sheet exposures such as unused loan commitments and letters of credit and reflects deductions for intangible assets and any excessallowance for credit losses.
Common stockholders’ equity increased a net $2.5 billion during the first quarter of 2002 to $82.2 billion at March 31, 2002,representing 7.78% of assets, compared to $79.7 billion and 7.58% at year-end 2001. The net increase in common stockholders’equity during the first quarter of 2002 principally reflected net income of $4.8 billion and issuance of shares pursuant to employeebenefit plans and other activity of $1.3 billion which was offset by the net issuance of restricted stock of $1.1 billion, $0.9 billionrelated to foreign currency translation adjustment, change in hedging activities and unrealized gains and losses on investmentsecurities, common and preferred stock dividends of $0.8 billion, and treasury stock acquired of $0.8 billion. The increase in thecommon stockholders’ equity ratio during the first quarter of 2002 also reflected the above items, partially offset by the increase intotal assets.
During the 2001 fourth quarter, the Board of Directors of Citigroup granted approval for the repurchase of an additional $5 billion ofCitigroup common stock, continuing the Company’s program of buying back its shares. Under its long-standing repurchase program,the Company buys back shares in the market from time to time.
On January 7, 2002, Citigroup redeemed for cash all outstanding shares of its Series U cumulative preferred stock.
The total mandatorily redeemable securities of subsidiary trusts (trust securities) which qualify as Tier 1 capital at both March 31,2002 and December 31, 2001 were $6.725 billion. The amount outstanding at March 31, 2002 includes $4.450 billion of parent-obligated securities and $2.275 billion of subsidiary-obligated securities, and at December 31, 2001 includes $4.85 billion of parent-obligated securities and $2.275 billion of subsidiary-obligated securities. On January 7, 2002, Citigroup redeemed for cash the $400million Citigroup Capital I Trust Preferred Securities (16 million 8% Trust Preferred Securities at the redemption price of $25 perPreferred Security plus any accrued and unpaid distribution thereon).

41
Citigroup’s subsidiary depository institutions are subject to the risk-based capital guidelines issued by their respective primary Federalbank regulatory agencies, which are generally similar to the FRB’s guidelines. At March 31, 2002, all of Citigroup’s subsidiarydepository institutions were “well capitalized” under the Federal bank regulatory agencies’ definitions.
On January 8, 2002, the FRB issued final rules that govern the regulatory treatment of merchant banking investments and certainsimilar equity investments, including investments made by venture capital subsidiaries, in nonfinancial companies held by bankholding companies with certain exclusions. The new rules impose a capital charge that would increase in steps as the bankingorganization’s level of concentration in equity investments increases. An 8% Tier 1 capital deduction applies on covered investmentsthat in the aggregate represent up to 15% of an organization’s Tier 1 capital. For covered investments that aggregate more than 25%of the organization’s Tier 1 capital, a top marginal charge of 25% applies. The rules are not expected to have a significant impact onCitigroup.
In December 2001, the Basel Committee on Banking Supervision (Committee) announced that a new consultative package on the newBasel Capital Accord (new Accord) would not be issued in early 2002, as previously indicated. Instead, the Committee will first seekto complete a comprehensive impact assessment of the draft proposal, after which a new consultative package will be issued. Thenew Accord, which will apply to all “significant” banks, as well as to holding companies that are parents of banking groups, is stillintended to be finalized by year-end 2002, with implementation of the new framework beginning in 2005. The Company ismonitoring the status and progress of the proposed rule.
On November 29, 2001, the FRB issued final rules regarding the regulatory capital treatment of recourse, direct credit substitutes andresidual interest in asset securitizations. The rules require a deduction from Tier 1 capital for the amount of credit-enhancing interest-only strips (a type of residual interest) that exceeds 25% of Tier 1 capital, as well as requiring dollar-for-dollar capital for residualinterests not deducted for Tier 1 capital. These rules, which require adoption in the fourth quarter of 2002, are not expected to have asignificant impact on Citigroup.
Additionally, from time to time, the FRB and the FFIEC propose amendments to, and issue interpretations of, risk-based capitalguidelines and reporting instructions. Such proposals or interpretations could, if implemented in the future, affect reported capitalratios and net risk-adjusted assets. This paragraph and the preceding three paragraphs contain forward-looking statements within themeaning of the Private Securities Litigation Reform Act. See “Forward-Looking Statements” on page 32.
Citicorp
The in-country forum for liquidity issues is the Asset/Liability Management Committee (ALCO), which includes senior executiveswithin each country. The ALCO reviews the current and prospective funding requirements for all businesses and legal entities withinthe country, as well as the capital position and balance sheet. All businesses within the country are represented on the committee withthe focal point being the Country Treasurer. The Country Corporate Officer and the Country Treasurer ensure that all fundingobligations in each country are met when due. The Citigroup Corporate Treasurer, in concert with the Country Corporate Officer andthe Regional Market Risk Manager, appoints the Country Treasurer.
Each Country Treasurer must prepare a liquidity plan at least annually that is approved by the Country Corporate Officer, theRegional Treasurer, and the Citigroup Corporate Treasurer. The liquidity profile is monitored on an on-going basis and reportedmonthly. Limits are established on the extent to which businesses in a country can take liquidity risk. The size of the limit depends onthe depth of the market, experience level of local management, the stability of the liabilities, and liquidity of the assets. Finally, thelimits are subject to the evaluation of the entities’ stress test results. Generally, limits are established such that in stress scenarios,entities need to be self-funded or providers of liquidity to Citicorp.
Regional Treasurers generally have responsibility for monitoring liquidity risk across a number of countries within a definedgeography. They are also available for consultation and special approvals, especially in unusual or volatile market conditions.
Citicorp’s assets and liabilities are diversified across many currencies, geographic areas, and businesses. Particular attention is paid tothose businesses which for tax, sovereign risk, or regulatory reasons cannot be freely and readily funded in the international markets.
A diversity of funding sources, currencies, and maturities is used to gain a broad access to the investor base. Citicorp’s deposits,which represent 60% of total funding at March 31, 2002 and 59% of funding at December 31, 2001, are broadly diversified by bothgeography and customer segments.
Stockholders’ equity, which grew $1.6 billion during the first three months of 2002 to $65.0 billion at March 31, 2002, continues to bean important component of the overall funding structure. In addition, long-term debt is issued by Citicorp and its subsidiaries. TotalCiticorp long-term debt outstanding at the end of the 2002 first quarter was $74.6 billion, compared with $81.1 billion at year-end2001.

42
Asset securitization programs remain an important source of liquidity. Loans securitized during the first three months of 2002included $3.5 billion of U.S. credit cards and $6.4 billion of U.S. consumer mortgages. As credit card securitization transactionsamortize, newly originated receivables are recorded on Citicorp’s balance sheet and become available for asset securitization. Duringthe first quarter of 2002, the scheduled amortization of certain credit card securitization transactions made available $3.5 billion ofnew receivables. In addition, at least $5.9 billion of credit card securitization transactions are scheduled to amortize during the rest of2002.
Citicorp is a legal entity separate and distinct from Citibank, N.A. and its other subsidiaries and affiliates. There are various legallimitations on the extent to which Citicorp’s banking subsidiaries may extend credit, pay dividends or otherwise supply funds toCiticorp. The approval of the Office of the Comptroller of the Currency is required if total dividends declared by a national bank inany calendar year exceed net profits (as defined) for that year combined with its retained net profits for the preceding two years. Inaddition, dividends for such a bank may not be paid in excess of the bank’s undivided profits. State-chartered bank subsidiaries aresubject to dividend limitations imposed by applicable state law.
Citicorp’s national and state-chartered bank subsidiaries can declare dividends to their respective parent companies in 2002, withoutregulatory approval, of approximately $5.7 billion, adjusted by the effect of their net income (loss) for 2002 up to the date of any suchdividend declaration. In determining whether and to what extent to pay dividends, each bank subsidiary must also consider the effectof dividend payments on applicable risk-based capital and leverage ratio requirements as well as policy statements of the Federalregulatory agencies that indicate that banking organizations should generally pay dividends out of current operating earnings.Consistent with these considerations, Citicorp estimates that its bank subsidiaries could have distributed dividends to Citicorp, directlyor through their parent holding company, of approximately $5.4 billion of the available $5.7 billion, adjusted by the effect of their netincome (loss) up to the date of any such dividend declaration.
Citicorp also receives dividends from its nonbank subsidiaries. These nonbank subsidiaries are generally not subject to regulatoryrestrictions on their payment of dividends except that the approval of the Office of Thrift Supervision may be required if totaldividends declared by a savings association in any calendar year exceed amounts specified by that agency’s regulations.
Citicorp is subject to risk-based capital and leverage guidelines issued by the FRB.
Citicorp Ratios
March 31, 2002 December 31, 2001Tier 1 capital 8.55% 8.33%Total capital (Tier 1 and Tier 2) 12.82 12.41Leverage (1) 6.83 6.85Common stockholders’ equity 10.17 9.81
(1) Tier 1 capital divided by adjusted average assets.
Citicorp maintained a strong capital position during the 2002 first quarter. Total capital (Tier 1 and Tier 2) amounted to $63.2 billionat March 31, 2002, representing 12.82% of net risk-adjusted assets. This compares with $62.9 billion and 12.41% at December 31,2001. Tier 1 capital of $42.2 billion at March 31, 2002 represented 8.55% of net risk-adjusted assets, compared with $42.2 billion and8.33% at December 31, 2001. Citicorp’s Tier 1 capital ratio at March 31, 2002 was above Citicorp’s target range of 8.00% to 8.30%.
Salomon Smith Barney Holdings Inc. (Salomon Smith Barney)
Salomon Smith Barney manages liquidity and monitors and evaluates capital adequacy through a well-defined process described inCitigroup’s 2001 Annual Report and Form 10-K. Total assets were $308 billion at March 31, 2002, compared to $301 billion at year-end 2001. Due to the nature of Salomon Smith Barney’s trading activities, it is not uncommon for asset levels to fluctuate from periodto period.
Salomon Smith Barney has a $5.0 billion 364-day committed uncollateralized revolving line of credit with unaffiliated banks thatextends through May 21, 2002, with repayment on any borrowings due by May 21, 2004. Salomon Smith Barney may borrow underthis revolving credit facility at various interest rate options (LIBOR or base rate) and compensates the banks for this facility throughfacility fees. At March 31, 2002, there were no borrowings outstanding under this facility. Salomon Smith Barney also hascommitted long-term financing facilities with unaffiliated banks. At March 31, 2002, Salomon Smith Barney had drawn down the full$950 million then available under these facilities. A bank can terminate its facility by giving Salomon Smith Barney one year'snotice. Salomon Smith Barney compensates the banks for the facilities through facility fees. Under all of these facilities, SalomonSmith Barney is required to maintain a certain level of consolidated adjusted net worth (as defined in the respective agreements). AtMarch 31, 2002, these requirements were exceeded by approximately $4.7 billion. Salomon Smith Barney also has substantialborrowing arrangements consisting of facilities that it has been advised are available, but where no contractual lending obligationexists. These arrangements are reviewed on an ongoing basis to ensure flexibility in meeting short-term requirements.
43
Unsecured term debt is a significant component of Salomon Smith Barney’s long-term capital. Long-term debt totaled $26.2 billion atMarch 31, 2002 and $26.8 billion at December 31, 2001. Salomon Smith Barney utilizes interest rate swaps to convert the majority ofits fixed-rate long-term debt used to fund inventory-related working capital requirements into variable rate obligations. Long-termdebt issuances denominated in currencies other than the U.S. dollar that are not used to finance assets in the same currency areeffectively converted to U.S. dollar obligations through the use of cross-currency swaps and forward currency contracts.
Travelers Property Casualty Corp. (TPC)
TPC’s insurance subsidiaries are subject to various regulatory restrictions that limit the maximum amount of dividends available to bepaid to their parent without prior approval of insurance regulatory authorities. A maximum of $1.0 billion is available by the end of2002 for such dividends without prior approval of the Connecticut Insurance Department. However, the payment of a significantportion of this amount is likely to be subject to such approval depending upon the amount and timing of the payments. TPC received$275 million of dividends from its insurance subsidiaries during the first three months of 2002.
The Travelers Insurance Company (TIC)
At March 31, 2002, TIC had $34.8 billion of life and annuity product deposit funds and reserves. Of that total, $19.3 billion is notsubject to discretionary withdrawal based on contract terms. The remaining $15.5 billion is for life and annuity products that aresubject to discretionary withdrawal by the contractholder. Included in the amount that is subject to discretionary withdrawal is $4.6billion of liabilities that is surrenderable with market value adjustments. Also included is an additional $5.0 billion of the lifeinsurance and individual annuity liabilities which is subject to discretionary withdrawals and an average surrender charge of 4.63%.In the payout phase, these funds are credited at significantly reduced interest rates. The remaining $5.9 billion of liabilities issurrenderable without charge. More than 9.58% of this relates to individual life products. These risks would have to be underwrittenagain if transferred to another carrier, which is considered a significant deterrent against withdrawal by long-term policyholders.Insurance liabilities that are surrendered or withdrawn are reduced by outstanding policy loans, and related accrued interest prior topayout.
TIC is subject to various regulatory restrictions that limit the maximum amount of dividends available to its parent without priorapproval of the Connecticut Insurance Department. A maximum of $586 million of statutory surplus is available by the end of theyear 2002 for such dividends without the prior approval of the Connecticut Insurance Department, of which $271 million was paidduring the first three months of 2002.

44
CONSOLIDATED FINANCIAL STATEMENTS
CITIGROUP INC. AND SUBSIDIARIESCONSOLIDATED STATEMENT OF INCOME (UNAUDITED)
Three Months Ended March 31,In millions, except per share amounts 2002 2001RevenuesLoan interest, including fees $ 9,166 $10,004Other interest and dividends 5,436 7,169Insurance premiums 3,364 3,361Commissions and fees 4,032 4,132Principal transactions 1,666 2,325Asset management and administration fees 1,320 1,389Realized gains from sales of investments 54 451Other income 856 973Total revenues 25,894 29,804Interest expense 4,899 9,523Total revenues, net of interest expense 20,995 20,281
Benefits, claims, and credit lossesPolicyholder benefits and claims expense 2,789 2,727Provision for credit losses 2,559 1,474Total benefits, claims, and credit losses 5,348 4,201
Operating expensesNon-insurance compensation and benefits 5,090 5,329Insurance underwriting, acquisition, and operating 992 999Restructuring-related items 47 132Other operating 3,683 4,041Total operating expenses 9,812 10,501
Gain on sale of stock by subsidiary 1,270 -
Income before income taxes, minority interest and cumulative effect of accounting changes 7,105 5,579Provision for income taxes 2,198 1,990Minority interest, net of income taxes 17 9Income before cumulative effect of accounting changes 4,890 3,580Cumulative effect of accounting changes (47) (42)Net income $ 4,843 $ 3,538Basic Earnings Per ShareIncome before cumulative effect of accounting changes $0.95 $0.71Cumulative effect of accounting changes (0.01) (0.01)Net income $0.94 $0.70Weighted average common shares outstanding 5,110.5 4,984.7Diluted Earnings Per ShareIncome before cumulative effect of accounting changes $0.94 $0.70Cumulative effect of accounting changes (0.01) (0.01)Net income $0.93 $0.69Adjusted weighted average common shares outstanding 5,209.8 5,110.0
See Notes to Consolidated Financial Statements.

45
CITIGROUP INC. AND SUBSIDIARIESCONSOLIDATED STATEMENT OF FINANCIAL POSITION
In millions of dollars
March 31,2002
(Unaudited)December 31,
2001AssetsCash and due from banks (including segregated cash and other deposits) $ 15,984 $ 18,515Deposits at interest with banks 17,189 19,216Federal funds sold and securities borrowed or purchased under agreements to resell 150,605 134,809Brokerage receivables 26,848 35,155Trading account assets (including $22,977 and $36,351 pledged to creditors at March 31, 2002 and December 31, 2001, respectively) 145,059 144,904Investments (including $13,821 and $15,475 pledged to creditors at March 31, 2002 and December 31, 2001, respectively) 172,085 160,837Loans, net of unearned income
Consumer 242,463 244,159Commercial 146,498 147,774
Loans, net of unearned income 388,961 391,933Allowance for credit losses (10,520) (10,088)
Total loans, net 378,441 381,845Goodwill 25,506 23,861Intangible assets 8,885 9,003Reinsurance recoverables 12,531 12,373Separate and variable accounts 25,981 25,569Other assets 78,543 85,363Total assets $1,057,657 $1,051,450
LiabilitiesNon-interest-bearing deposits in U.S. offices $ 21,652 $ 23,054Interest-bearing deposits in U.S. offices 119,083 110,388Non-interest-bearing deposits in offices outside the U.S. 18,488 18,779Interest-bearing deposits in offices outside the U.S. 223,166 222,304
Total deposits 382,389 374,525Federal funds purchased and securities loaned or sold under agreements to repurchase 165,120 153,511Brokerage payables 25,790 32,891Trading account liabilities 81,537 80,543Contractholder funds and separate and variable accounts 49,992 48,932Insurance policy and claims reserves 49,840 49,294Investment banking and brokerage borrowings 17,091 14,804Short-term borrowings 24,805 24,461Long-term debt 117,757 121,631Other liabilities 52,992 62,486Citigroup or subsidiary obligated mandatorily redeemable securities of subsidiary trusts holding solely junior subordinated debt securities of -- Parent 4,326 4,850 -- Subsidiary 2,380 2,275Total liabilities 974,019 970,203
Stockholders’ equityPreferred stock ($1.00 par value; authorized shares: 30 million), at aggregate liquidation value 1,400 1,525Common stock ($.01 par value; authorized shares: 15 billion), issued shares -- 5,477,416,254 at March 31, 2002 and at December 31, 2001 55 55Additional paid-in capital 23,860 23,196Retained earnings 73,798 69,803Treasury stock, at cost: March 31, 2002 -- 312,056,455 shares and December 31, 2001 -- 328,727,790 shares (11,194) (11,099)Accumulated other changes in equity from nonowner sources (1,770) (844)Unearned compensation (2,511) (1,389)Total stockholders’ equity 83,638 81,247Total liabilities and stockholders’ equity $1,057,657 $1,051,450
See Notes to Consolidated Financial Statements.
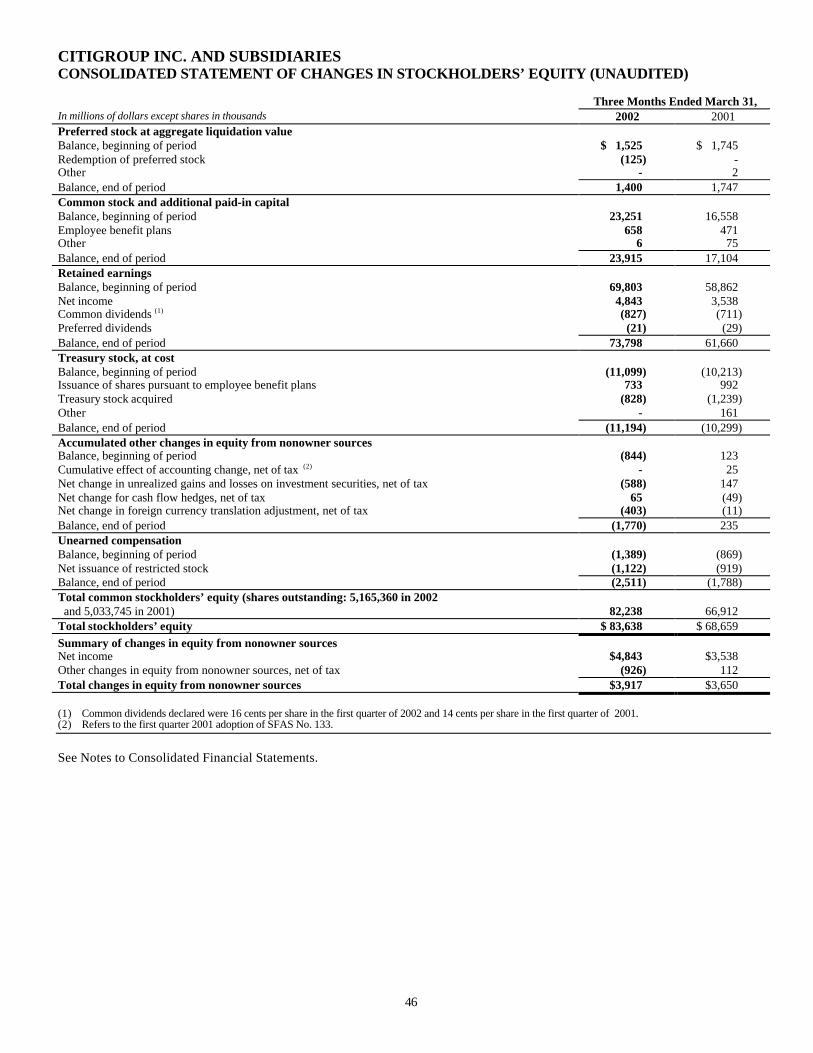
46
CITIGROUP INC. AND SUBSIDIARIESCONSOLIDATED STATEMENT OF CHANGES IN STOCKHOLDERS’ EQUITY (UNAUDITED)
Three Months Ended March 31,In millions of dollars except shares in thousands 2002 2001Preferred stock at aggregate liquidation valueBalance, beginning of period $ 1,525 $ 1,745Redemption of preferred stock (125) -Other - 2Balance, end of period 1,400 1,747Common stock and additional paid-in capitalBalance, beginning of period 23,251 16,558Employee benefit plans 658 471Other 6 75Balance, end of period 23,915 17,104Retained earningsBalance, beginning of period 69,803 58,862Net income 4,843 3,538Common dividends (1) (827) (711)Preferred dividends (21) (29)Balance, end of period 73,798 61,660Treasury stock, at costBalance, beginning of period (11,099) (10,213)Issuance of shares pursuant to employee benefit plans 733 992Treasury stock acquired (828) (1,239)Other - 161Balance, end of period (11,194) (10,299)Accumulated other changes in equity from nonowner sourcesBalance, beginning of period (844) 123Cumulative effect of accounting change, net of tax (2) - 25Net change in unrealized gains and losses on investment securities, net of tax (588) 147Net change for cash flow hedges, net of tax 65 (49)Net change in foreign currency translation adjustment, net of tax (403) (11)Balance, end of period (1,770) 235Unearned compensationBalance, beginning of period (1,389) (869)Net issuance of restricted stock (1,122) (919)Balance, end of period (2,511) (1,788)Total common stockholders’ equity (shares outstanding: 5,165,360 in 2002 and 5,033,745 in 2001) 82,238 66,912Total stockholders’ equity $ 83,638 $ 68,659Summary of changes in equity from nonowner sourcesNet income $4,843 $3,538Other changes in equity from nonowner sources, net of tax (926) 112Total changes in equity from nonowner sources $3,917 $3,650
(1) Common dividends declared were 16 cents per share in the first quarter of 2002 and 14 cents per share in the first quarter of 2001.(2) Refers to the first quarter 2001 adoption of SFAS No. 133.
See Notes to Consolidated Financial Statements.

47
CITIGROUP INC. AND SUBSIDIARIESCONSOLIDATED STATEMENT OF CASH FLOWS (UNAUDITED)
Three Months Ended March 31,In millions of dollars 2002 2001Cash flows from operating activitiesNet income $4,843 $ 3,538Adjustments to reconcile net income to net cash used in operating activities:
Amortization of deferred policy acquisition costs and value of insurance in force 462 445Additions to deferred policy acquisition costs (619) (605)Depreciation and amortization 376 673Provision for credit losses 2,559 1,474Change in trading account assets (155) (4,624)Change in trading account liabilities 994 (324)Change in federal funds sold and securities borrowed or purchased under agreements to resell (15,796) (28,311)Change in federal funds purchased and securities loaned or sold under agreements to repurchase 11,609 25,614Change in brokerage receivables net of brokerage payables 1,206 (1,363)Change in insurance policy and claims reserves 546 491Net gains from sales of investments (54) (451)Gain on sale of stock by subsidiary (1,270) -Venture capital activity (44) 339Restructuring-related items 47 132Cumulative effect of accounting changes, net of tax 47 42Other, net (8,340) (2,067)
Total adjustments (8,432) (8,535)Net cash used in operating activities (3,589) (4,997)Cash flows from investing activitiesChange in deposits at interest with banks 2,027 (3,120)Change in loans (9,218) (8,135)Proceeds from sales of loans 11,548 6,831Purchases of investments (186,257) (40,769)Proceeds from sales of investments 162,924 26,617Proceeds from maturities of investments 10,776 7,001Other investments, primarily short-term, net 124 490Capital expenditures on premises and equipment (342) (461)Proceeds from sales of premises and equipment, subsidiaries and affiliates, and repossessed assets 157 483Business acquisitions (2,071) (198)Net cash used in investing activities (10,332) (11,261)Cash flows from financing activitiesDividends paid (848) (740)Issuance of common stock 205 428Redemption of preferred stock (125) -Issuance of mandatorily redeemable securities of subsidiary trust 105 -Redemption of mandatorily redeemable securities of parent trust (524) -Treasury stock acquired (828) (1,239)Stock tendered for payment of withholding taxes (330) (272)Proceeds from sale of stock by subsidiary 4,093 -Issuance of long-term debt 8,842 13,956Payments and redemptions of long-term debt (10,726) (6,728)Change in deposits 7,864 12,699Change in short-term borrowings and investment banking and brokerage borrowings 3,078 (3,018)Contractholder fund deposits 2,088 2,598Contractholder fund withdrawals (1,503) (1,485)Net cash provided by financing activities 11,391 16,199Effect of exchange rate changes on cash and cash equivalents (1) (189)Change in cash and due from banks (2,531) (248)Cash and due from banks at beginning of period 18,515 14,621Cash and due from banks at end of period $15,984 $ 14,373Supplemental disclosure of cash flow informationCash paid during the period for income taxes $3,312 $209Cash paid during the period for interest 5,201 9,117Non-cash investing activitiesTransfers to repossessed assets 263 173
See Notes to Consolidated Financial Statements.

48
CITIGROUP INC. AND SUBSIDIARIESNOTES TO CONSOLIDATED FINANCIAL STATEMENTS (UNAUDITED)
1. Basis of Presentation
The accompanying consolidated financial statements as of March 31, 2002 and for the three-month periods ended March 31, 2002and 2001 are unaudited and include the accounts of Citigroup Inc. (Citigroup) and its subsidiaries (collectively, the Company). Inthe opinion of management, all adjustments, consisting of normal recurring adjustments, necessary for a fair presentation have beenreflected. The accompanying consolidated financial statements should be read in conjunction with the consolidated financialstatements and related notes included in Citigroup's 2001 Annual Report and Form 10-K.
Certain financial information that is normally included in annual financial statements prepared in accordance with accountingprinciples generally accepted in the United States of America, but is not required for interim reporting purposes, has been condensedor omitted.
Certain reclassifications have been made to the prior year’s financial statements to conform to the current year’s presentation.
2. Accounting Changes
Business Combinations, Goodwill and Other Intangible AssetsEffective July 1, 2001, the Company adopted the provisions of SFAS No. 141 and certain provisions of SFAS No. 142 as requiredfor goodwill and intangible assets resulting from business combinations consummated after June 30, 2001. The new rules requirethat all business combinations consummated after June 30, 2001 be accounted for under the purchase method. The nonamortizationprovisions of the new rules affecting goodwill and intangible assets deemed to have indefinite lives are effective for all purchasebusiness combinations completed after June 30, 2001.
On January 1, 2002, Citigroup adopted the remaining provisions of SFAS No. 142, when the rules became effective for calendar yearcompanies. Under the new rules, effective January 1, 2002, goodwill and intangible assets deemed to have indefinite lives are nolonger amortized, but are subject to annual impairment tests. Other intangible assets will continue to be amortized over their usefullives.
The Company has performed the required impairment tests of goodwill and indefinite-lived intangible assets as of January 1, 2002.There was no impairment of goodwill upon adoption of SFAS No. 142. The initial adoption resulted in a cumulative adjustment of$47 million after-tax recorded as a charge to earnings related to the impairment of certain intangible assets in the Property andCasualty and Global Investment Management and Private Banking businesses.

49
Net income and earnings per share for the first quarter of 2002 and 2001 adjusted to exclude amortization expense (net of taxes)related to goodwill and indefinite lived intangible assets which are no longer amortized are as follows:
Three Months Ended March 31,In millions, except per share amounts 2002 2001Net income: Reported net income $4,843 $3,538 Goodwill amortization - 109 Indefinite-lived intangible assets amortization - 11 Adjusted net income $4,843 $3,658
Basic earnings per share: Reported basic earnings per share $0.94 $0.70 Goodwill amortization - 0.03 Indefinite-lived intangible assets amortization - - Adjusted basic earnings per share $0.94 $0.73
Diluted earnings per share: Reported diluted earnings per share $0.93 $0.69 Goodwill amortization - 0.02 Indefinite-lived intangible assets amortization - - Adjusted diluted earnings per share $0.93 $0.71
During the first quarter of 2002, no goodwill was impaired or written off. In February 2002, Banamex completed the purchase of theremaining 48% interest in Seguros Banamex, a life insurance business, and AFORE Banamex, a pension fund management business,from AEGON for $1.24 billion which resulted in additional goodwill of $1.07 billion in the Consumer segment. In addition, $74million of goodwill was recorded in the Consumer segment in connection with CitiFinancial Japan’s acquisition of the consumerfinance business of Taihei Co., Ltd.
The changes in goodwill during the first quarter of 2002 were as follows:
In millions of dollarsGlobal
ConsumerGlobal
Corporate
GlobalInvestment
Managementand Private
BankingProperty and
CasualtyInvestmentActivities
Corporate/Other Total
Balance at January 1, 2002 $17,738 $3,315 $234 $2,574 $ - $ - $23,861Goodwill acquired during the period 1,144 - - - - - 1,144Other (1) 256 171 - 74 - - 501Balance at March 31, 2002 $19,138 $3,486 $234 $2,648 $ - $ - $25,506
(1) Other changes in goodwill includes foreign exchange effects on non-dollar denominated goodwill and certain other reclassifications.
At March 31, 2002, $1,265 million of the Company’s acquired intangible assets, including $760 million of asset management andadministration contracts, $460 million of trade names and $45 million of other intangible assets, were considered to be indefinite-lived and not subject to amortization. All other acquired intangible assets are subject to amortization.

50
The components of intangible assets were as follows:
March 31, 2002 December 31, 2001Gross Carrying Accumulated Net Carrying Gross Carrying Accumulated Net Carrying
(In millions) Amount Amortization Amount Amount Amortization AmountPurchased credit card relationships $ 4,084 $1,233 $2,851 $ 4,084 $1,136 $2,948Mortgage servicing rights 2,440 1,126 1,314 2,248 1,075 1,173Core deposit intangibles 1,032 74 958 975 38 937Other customer relationships 1,310 275 1,035 1,176 249 927Present value of future profits 622 416 206 587 410 177Other (1) 1,644 388 1,256 3,782 941 2,841Total Amortizing Intangible Assets $11,132 $3,512 $7,620 $12,852 $3,849 $9,003
Indefinite-lived intangible assets 1,265 -Total Intangible Assets $8,885 $9,003
(1) Primarily contract-related intangible assets.
The intangible assets recorded during the first quarter of 2002 and their respective amortization periods were as follows:
(In millions)First Quarter
2002Weighted-Average
Amortization Period in YearsMortgage servicing rights $141 15Present value of future profits (1) 35 22Other customer relationships 137 6Total intangible assets recorded during the period (2) $313
(1) Present value of future profits acquired during the first quarter of 2002 will be amortized on an accelerated basis over 22 years.(2) There was no significant residual value estimated for the intangible assets recorded during the first quarter of 2002.
Intangible assets amortization expense was $204 million and $202 million for the first three months of 2002 and 2001, respectively.Intangible assets amortization expense is estimated to be $690 million for the remainder of 2002, $840 million in 2003, $800 millionin 2004, $760 million in 2005, $720 million in 2006, and $660 million in 2007.
Derivatives and Hedge AccountingOn January 1, 2001, Citigroup adopted SFAS No. 133, “Accounting for Derivative Instruments and Hedging Activities” (SFAS No.133). SFAS No. 133 changed the accounting treatment of derivative contracts (including foreign exchange contracts) that areemployed to manage risk outside of Citigroup’s trading activities, as well as certain derivative instruments embedded in othercontracts. SFAS No. 133 requires that all derivatives be recorded on the balance sheet at their fair value. The treatment of changes inthe fair value of derivatives depends on the character of the transaction, including whether it has been designated and qualifies as partof a hedging relationship. The majority of Citigroup’s derivatives are entered into for trading purposes and were not impacted by theadoption of SFAS No. 133. The cumulative effect of adopting SFAS No. 133 at January 1, 2001 was an after-tax charge of $42million included in net income and an increase of $25 million included in other changes in stockholders’ equity from nonownersources.
Transfers and Servicing of Financial AssetsIn September 2000, the Financial Accounting Standards Board (FASB) issued SFAS No. 140, “Accounting for Transfers andServicing of Financial Assets and Extinguishments of Liabilities, a replacement of FASB Statement No. 125” (SFAS No. 140). InJuly 2001, FASB issued Technical Bulletin No. 01-1, “Effective Date for Certain Financial Institutions of Certain Provisions ofStatement 140 Related to the Isolation of Transferred Assets.”
Certain provisions of SFAS No. 140 require that the structure for transfers of financial assets to certain securitization vehicles bemodified to comply with revised isolation guidance for institutions subject to receivership by the Federal Deposit InsuranceCorporation. These provisions were effective for transfers taking place after December 31, 2001, with an additional transition periodending no later than September 30, 2006 for transfers to certain master trusts. It is not expected that these provisions will materiallyaffect the financial statements. SFAS No. 140 also provides revised guidance for an entity to be considered a qualifying specialpurpose entity.
Impairment or Disposal of Long-Lived AssetsOn January 1, 2002, Citigroup adopted SFAS No. 144, “Accounting for the Impairment or Disposal of Long-Lived Assets” (SFASNo. 144), when the rule became effective for calendar year companies. SFAS No. 144 established additional criteria as compared toprevious generally accepted accounting principles to determine when a long-lived asset is held for sale. It also broadens thedefinition of “discontinued operations,” but does not allow for the accrual of future operating losses, as was previously permitted.

51
The provisions of the new standard are generally to be applied prospectively. The provisions of SFAS No. 144 will affect the timingof discontinued operations treatment for the planned tax-free distribution of Travelers Property Casualty Corp.
3. Business Developments
Initial Public Offering and Tax-Free Distribution of Travelers Property Casualty Corp.
Travelers Property Casualty Corp. (TPC) (an indirect wholly-owned subsidiary of Citigroup on December 31, 2001) sold 231 millionshares of its class A common stock representing approximately 23.1% of its outstanding equity securities at $18.50 per share in aninitial public offering on March 27, 2002. Citigroup recognized an after-tax gain of $1.061 billion as a result of the TPC offering.Citigroup plans to make a tax-free distribution to its stockholders of a portion of its remaining ownership interest in TPC by year-end2002, such that following the distribution, Citigroup would remain a holder of approximately 9.9% of TPC’s outstanding equitysecurities. Income statement minority interest will be recognized on the initial public offering portion beginning on April 1, 2002.
The distribution is subject to receipt of a private letter ruling from the Internal Revenue Service that the distribution will be tax-freeto Citigroup, its stockholders and TPC, as well as various other conditions. These other conditions may include receipt of anynecessary third-party consents and regulatory approvals, the existence of satisfactory market conditions and the satisfaction of anyconditions which may be imposed by the Internal Revenue Service. Citigroup has no obligation to consummate the distribution bythe end of 2002 or at all, whether or not these conditions are satisfied.
The distribution of TPC, if it occurs, will be treated as a dividend to stockholders for accounting purposes that will reducestockholders’ equity by an amount in excess of $7 billion. Prior to the initial public offering during 2002, TPC paid dividends toCitigroup in the form of notes in the aggregate amount of $5.095 billion.
In connection with the initial public offering, Citigroup entered into an agreement with TPC that provides that, in any fiscal year inwhich TPC records asbestos-related income statement charges in excess of $150 million, net of any reinsurance, Citigroup will payto TPC the amount of any such excess up to a cumulative aggregate of $800 million, reduced by the tax effect of the highestapplicable federal income tax rate. A portion of the gain as a result of the offering was deferred to offset any payments arising inconnection with this agreement.
Citigroup and TPC are currently reviewing whether Citigroup business units will continue to offer certain TPC products. The twocompanies plan to enter into an agreement under which Citigroup businesses will provide investment advisory and certain backoffice services to TPC during a transition period. Ongoing revenues on our remaining ownership in TPC following the distributionare not expected to be significant.

52
4. Business Segment Information
The following table presents certain information regarding the Company’s industry segments. The Property and Casualty segmentwas created during the first quarter of 2002 encompassing the property and casualty operations of Travelers Property and CasualtyCorp. Prior periods have been reclassified to conform to the current period's presentation.
Total Revenues, Netof Interest Expense
Provision forIncome Taxes
Income (Loss)Before Cumulative
Effect of AccountingChange (1) (2) Identifiable Assets
First Quarter Mar. 31, Dec. 31,In millions of dollars, except identifiable assets in billions 2002 2001 2002 2001 2002 2001 2002 2001Global Consumer $ 9,199 $ 7,718 $1,003 $ 906 $1,934 $1,542 $ 344 $ 351Global Corporate 6,650 7,480 649 759 1,174 1,376 532 524Global Investment Management and Private Banking 1,736 1,966 200 212 403 384 102 98Property and Casualty 3,168 3,018 109 124 326 342 56 56Investment Activities 146 233 44 70 70 132 9 9Corporate/Other (3) 96 (134) 193 (81) 983 (196) 15 13Total $20,995 $20,281 $2,198 $1,990 $4,890 $3,580 $1,058 $1,051
(1) The 2002 first quarter results reflect after-tax restructuring-related items of $18 million in Global Consumer, $8 million in Global Corporate, $3 million inGlobal Investment Management and Private Banking, and $1 million in Property and Casualty. The 2001 first quarter results reflect after-tax restructuring-related items of $12 million in Global Consumer and $68 million in Global Corporate.
(2) Includes pretax provisions for benefits, claims, and credit losses in the Global Consumer results of $2.2 billion and $1.4 billion, in the Global Corporate resultsof $0.7 billion and $0.3 billion, in the Global Investment Management and Private Banking results of $0.5 billion and $0.7 billion, and in the Property andCasualty results of $2.0 billion and $1.8 billion for the first quarters of 2002 and 2001, respectively. The 2001 first quarter also includes pretax provisions forbenefits, claims, and credit losses in the Corporate/Other results of $1 million.
(3) Includes the gain on sale of stock by TPC of $1.270 billion ($1.061 billion after-tax).
5. Investments
In millions of dollarsMarch 31,
2002December 31,
2001Fixed maturities, primarily available for sale, at fair value $150,940 $139,344Equity securities, primarily at fair value 7,606 7,577Venture capital, at fair value 4,360 4,316Short-term and other 9,179 9,600
$172,085 $160,837
The amortized cost and fair value of investments in fixed maturities and equity securities at March 31, 2002 and December 31, 2001were as follows:
March 31, 2002 December 31, 2001
In millions of dollarsAmortized
Cost
GrossUnrealized
Gains
GrossUnrealized
LossesFair
ValueAmortized
CostFair
Value
Fixed maturity securities held to maturity (1) $ 184 $ - $ - $ 184 $ 26 $ 26
Fixed maturity securities available for saleMortgage-backed securities, principally obligations of U.S. Federal agencies $ 34,006 $ 272 $ 267 $34,011 $ 28,614 $ 28,802U.S. Treasury and Federal agencies 13,358 181 221 13,318 6,136 6,113State and municipal 17,042 399 156 17,285 16,712 17,001Foreign government 42,886 301 129 43,058 44,942 45,129U.S. corporate 31,527 636 747 31,416 30,097 30,349Other debt securities 11,361 426 119 11,668 11,516 11,924
150,180 2,215 1,639 150,756 138,017 139,318Total fixed maturities $150,364 $2,215 $1,639 $150,940 $138,043 $139,344Equity securities (2) $7,430 $399 $223 $7,606 $7,401 $7,577
(1) Recorded at amortized cost.(2) Includes non-marketable equity securities carried at cost, which are reported in both the amortized cost and fair value columns.

53
6. Trading Account Assets and Liabilities
Trading account assets and liabilities at market value consisted of the following:
In millions of dollarsMarch 31,
2002December 31,
2001Trading Account AssetsU.S. Treasury and Federal agency securities $ 40,641 $ 46,218State and municipal securities 3,527 4,517Foreign government securities 16,251 12,450Corporate and other debt securities 28,055 21,318Derivative and other contractual commitments (1) 25,836 29,762Equity securities 16,407 15,619Mortgage loans and collateralized mortgage securities 6,214 6,869Other 8,128 8,151
$145,059 $144,904Trading Account LiabilitiesSecurities sold, not yet purchased $56,827 $51,815Derivative and other contractual commitments (1) 24,710 28,728
$81,537 $80,543
(1) Net of master netting agreements and securitization.
7. Debt
Investment banking and brokerage borrowings consisted of the following:
In millions of dollarsMarch 31,
2002December 31,
2001Commercial paper $15,965 $13,858Bank borrowings 450 565Other 676 381
$17,091 $14,804
Short-term borrowings consisted of commercial paper and other short-term borrowings as follows:
In millions of dollarsMarch 31,
2002December 31,
2001Commercial paper
Citigroup Inc. $ 511 $ 481Citicorp and Subsidiaries 12,808 12,215
13,319 12,696Other short-term borrowings 11,486 11,765
$24,805 $24,461
Long-term debt, including its current portion, consisted of the following:
In millions of dollarsMarch 31,
2002December 31,
2001Citigroup Inc. $ 37,191 $ 34,794Citicorp and Subsidiaries 53,151 59,628Salomon Smith Barney Holdings Inc. 26,152 26,813Travelers Insurance Group Holdings Inc. 380 380Travelers Property Casualty Corp. 867 16Travelers Insurance Company 16 -
$117,757 $121,631

54
8. Restructuring-Related Items
Restructuring InitiativesIn millions of dollars 2002 2001 2000 TotalRestructuring Charges $42 $448 $579 $1,069Acquisitions (1) - 112 23 135Utilization (2) - (367) (516) (883)Changes in estimates - (18) (29) (47)Balance at March 31, 2002 $42 $175 $ 57 $ 274
(1) Represents additions to restructuring liabilities arising from acquisitions.(2) Utilization amounts include translation effects on the restructuring reserve.
During the first quarter of 2002, Citigroup recorded restructuring charges of $42 million, primarily consisting of the downsizing ofGlobal Consumer and Global Corporate operations in Argentina.
During 2001, Citigroup recorded restructuring charges of $448 million. Of the $448 million, $319 million related to the downsizingof certain functions in the Global Corporate and Global Consumer businesses in order to align their cost structures with currentmarket conditions and $129 million related to the acquisition of Banamex and the integration of its operations within the GlobalConsumer business. In addition, a restructuring reserve of $112 million was recorded in connection with the acquisition of Banamexand recognized as a liability in the purchase price allocation of Banamex. The total Banamex reserves of $241 million include costsrelated to downsizings, the reconfiguration of branch operations in Mexico, and the integration of operations and operatingplatforms. These restructuring initiatives are expected to be implemented this year. The reserves included $423 million related toemployee severance, $72 million related to exiting leasehold and other contractual obligations, and $65 million of asset impairmentcharges.
The $423 million related to employee severance reflects the cost of eliminating approximately 12,500 positions, including 4,200 inCitigroup’s Global Consumer business and 3,600 in Banamex related to the acquisition, and 1,300 in the Global Consumer businessand 3,400 in the Global Corporate business related to other restructuring initiatives. Approximately 3,200 of these positions were inthe United States.
Through March 31, 2002, the 2001 restructuring reserve utilization included $65 million of asset impairment charges as well as $302million of severance and other costs (of which $243 million of employee severance and $18 million of leasehold and other exit costshave been paid in cash and $41 million is legally obligated), together with translation effects. Utilization of the 2001 restructuringreserve in the 2002 first quarter was $15 million. Through March 31, 2002, approximately 9,500 gross staff positions have beeneliminated under these programs, including approximately 900 in the 2002 first quarter.
During 2000, Citigroup recorded restructuring charges of $579 million, primarily consisting of exit costs related to the acquisition ofAssociates. The charges included $241 million related to employee severance, $154 million related to exiting leasehold and othercontractual obligations, and $184 million of asset impairment charges.
Of the $579 million charge, $474 million related to the acquisition of Associates and included the reconfiguration of certain branchoperations, the exit from non-strategic businesses and from activities as mandated by Federal bank regulations, and the consolidationand integration of corporate, middle and back office functions. In the Global Consumer business, $51 million includes thereconfiguration of certain branch operations outside the U.S. and the downsizing and consolidation of certain back office functions inthe U.S. Approximately $440 million of the $579 million charge related to operations in the United States.
The $241 million portion of the charge related to employee severance reflects the costs of eliminating approximately 5,800 positions,including approximately 4,600 in Associates and 700 in the Global Consumer business. Approximately 5,000 of these positionsrelated to the United States. In 2000, an additional reserve of $23 million was recorded, $20 million of which related to theelimination of 1,600 non-U.S. positions of an acquired entity.
Through March 31, 2002, the 2000 restructuring reserve utilization included $184 million of asset impairment charges and $332million of severance and other exit costs (of which $167 million of employee severance and $114 million of leasehold and other exitcosts have been paid in cash and $51 million is legally obligated), together with translation effects. Utilization of the 2000restructuring reserve in the 2002 first quarter was $30 million. Through March 31, 2002, approximately 5,850 staff positions havebeen eliminated under these programs including approximately 400 in the 2002 first quarter.
The implementation of these restructuring initiatives also caused certain related premises and equipment assets to become redundant.The remaining depreciable lives of these assets were shortened, and accelerated depreciation charges (in addition to normalscheduled depreciation on those assets) of $5 million and $22 million were recognized in the first three months of 2002 and 2001,respectively.

55
Changes in estimates are attributable to facts and circumstances arising subsequent to an original restructuring charge. Changes inestimates attributable to lower than anticipated costs of implementing certain projects and a reduction in the scope of certaininitiatives during 2001 resulted in the reduction of the reserve for 2001 restructuring initiatives of $18 million during the secondquarter of 2001 and a reduction of $29 million for 2000 restructuring initiatives during the fourth quarter of 2001.
Additional information about restructuring-related items, including the business segments affected, may be found in Citigroup's 2001Annual Report and Form 10-K.
9. Changes in Equity from Nonowner Sources
Changes in each component of “Accumulated Other Changes in Equity from Nonowner Sources” for the three-month period endedMarch 31, 2002 are as follows:
In millions of dollars
Net UnrealizedGains on
InvestmentSecurities
ForeignCurrency
TranslationAdjustment
Cash FlowHedges
AccumulatedOther Changesin Equity from
NonownerSources
Balance, December 31, 2001 $852 ($1,864) $168 ($ 844)Unrealized gains on investment securities, net of tax (1) (588) - - (588)Foreign currency translation adjustment (2) - (403) - (403)Cash flow hedges, net of tax - - 65 65Current period change (588) (403) 65 (926)Balance, March 31, 2002 $264 ($2,267) $233 ($1,770)
(1) Primarily reflects the impact of a rising interest rate yield curve on fixed-income securities.(2) Includes the $512 million after-tax impact of translating Argentina’s operations into the U.S. dollar equivalent. As a result of government actions in Argentina,
which began in the fourth quarter of 2001 and continue, the functional currency of the Argentine branch and subsidiaries has been changed from the U.S. dollarto the Argentine peso.
10. Earnings Per Share
The following reflects the income and share data used in the basic and diluted earnings per share computations for the three monthsended March 31, 2002 and 2001.
Three Months Ended March 31,In millions, except per share amounts 2002 2001
Income before cumulative effect of accounting changes $4,890 $3,580Cumulative effect of accounting changes (47) (42)Preferred dividends (21) (28)Income available to common stockholders for basic EPS 4,822 3,510Effect of dilutive securities - -Income available to common stockholders for diluted EPS $4,822 $3,510
Weighted average common shares outstanding applicable to basic EPS 5,110.5 4,984.7Effect of dilutive securities:
Options 65.2 95.9Restricted stock 33.0 28.3Convertible securities 1.1 1.1
Adjusted weighted average common shares outstanding applicable to diluted EPS 5,209.8 5,110.0Basic earnings per shareIncome before cumulative effect of accounting changes $0.95 $0.71Cumulative effect of accounting changes (0.01) (0.01)Net income $0.94 $0.70Diluted earnings per shareIncome before cumulative effect of accounting changes $0.94 $0.70Cumulative effect of accounting changes (0.01) (0.01)Net income $0.93 $0.69

56
11. Derivatives and Other Activities
The following table summarizes certain information related to the Company’s hedging activities for the three months ended March31, 2002 and 2001:
Three Months Ended March 31,In millions of dollars 2002 2001Fair Value Hedges:Hedge ineffectiveness recognized in earnings ($28) $ 72Net gain (loss) excluded from assessment of effectiveness (5) 47Cash Flow Hedges:Hedge ineffectiveness recognized in earnings 5 (3)Amount excluded from assessment of effectiveness - -Net Investment Hedges:Net gain (loss) included in foreign currency translation adjustment within accumulated other changes in equity from nonowner sources (60) 248
The accumulated other changes in equity from nonowner sources from cash flow hedges for the three months ended March 31, 2002and 2001 can be summarized as follows (net of taxes):
Three Months Ended March 31,In millions of dollars 2002 2001Beginning balance (1) $168 ($ 3)Net gain (loss) from cash flow hedges 164 (22)Net amounts reclassified to earnings (99) (27)Ending balance $233 ($52)
(1) Beginning balance of 2001 results from the cumulative effect of the accounting change for cash-flow hedges.
12. Contingencies
It is difficult to estimate the reserves for environmental and asbestos-related claims due to the vagaries of court coverage decisions,plaintiffs’ expanded theories of liability, the risks inherent in major litigation, and other uncertainties. Conventional actuarialtechniques are not used to estimate such reserves.
The reserves carried for environmental and asbestos claims at March 31, 2002 are the Company’s best estimate of ultimate claimsand claim adjustment expenses based upon known facts and current law. However, the uncertainties surrounding the final resolutionof these claims continue. These include, without limitation, the risks inherent in major litigation, any impact from the bankruptcyprotection sought by various asbestos producers and other asbestos defendants, a further increase or decrease in asbestos andenvironmental claims which cannot now be anticipated, the role of any umbrella or excess policies the Company has issued for theseclaims, whether or not an asbestos claim is a product/completed operation claim subject to an aggregate limit and the availablecoverage, if any, for that claim, the resolution or adjudication of some disputes pertaining to the amount of available coverage forasbestos claims in a manner inconsistent with the Company’s previous assessment of these claims, the number and outcome of directactions against the Company, unanticipated developments pertaining to the Company’s ability to recover reinsurance forenvironmental and asbestos claims, and the willingness of parties, including the Company, to related litigation to settle. It is also notpossible to predict changes in the legal and legislative environment and their impact on the future development of asbestos andenvironmental claims. This development will be affected by future court decisions and interpretations, as well as changes inapplicable legislation. In addition, particularly during the last few months of 2001 and continuing into 2002, the asbestos-relatedtrends have both accelerated and become more visible. These trends include, but are not limited to, the filing of additional claims,more intensive advertising by lawyers seeking asbestos claimants, more aggressive litigation based on novel theories of liability andlitigation against new and previously peripheral defendants, including insurers, and developments in existing and pending bankruptcyproceedings.
In the ordinary course of business, Citigroup and its subsidiaries are defendants or co-defendants in various litigation mattersincidental to and typical of the businesses in which they are engaged. In the opinion of the Company’s management, the ultimateresolution of these legal proceedings would not be likely to have a material adverse effect on the results of the Company and itssubsidiaries’ operations, financial condition, or liquidity.

57
FINANCIAL DATA SUPPLEMENT
Cash-Basis, Renegotiated, and Past Due Loans
In millions of dollarsMar. 31,
2002Dec. 31,
2001Sept. 30,2001 (1)
June 30,2001
Mar. 31,2001 (1)
Commercial cash-basis loansCollateral dependent (at lower of cost or collateral value) (2) $ 493 $ 699 $ 699 $ 527 $ 528Other 4,006 3,342 2,721 2,102 1,889Total $4,499 $4,041 $3,420 $2,629 $2,417Commercial cash-basis loansIn U.S. offices $1,468 $1,315 $1,089 $1,108 $1,052In offices outside the U.S. 3,031 2,726 2,331 1,521 1,365Total $4,499 $4,041 $3,420 $2,629 $2,417Commercial renegotiated loansIn U.S. offices $514 $551 $605 $700 $740In offices outside the U.S. 116 130 143 164 169Total $630 $681 $748 $864 $909Consumer loans on which accrual of interest had been suspendedIn U.S. offices $2,428 $2,501 $2,630 $2,480 $2,146In offices outside the U.S. 2,114 1,733 1,801 1,631 1,658Total $4,542 $4,234 $4,431 $4,111 $3,804Accruing loans 90 or more days delinquent (3)
In U.S. offices $2,101 $1,822 $1,761 $1,694 $1,475In offices outside the U.S. 716 776 832 433 393Total $2,817 $2,598 $2,593 $2,127 $1,868
(1) Reclassified to conform to the current period’s presentation.(2) A cash-basis loan is defined as collateral dependent when repayment is expected to be provided solely by the underlying collateral and there are no other
available and reliable sources of repayment, in which case the loans are written down to the lower of cost or collateral value.(3) Substantially all consumer loans, of which $1,106 million, $920 million, and $755 million are government-guaranteed student loans and mortgages at March 31,
2002, December 31, 2001, and March 31, 2001, respectively.
Other Real Estate Owned and Other Repossessed Assets
In millions of dollarsMar. 31,
2002Dec. 31,2001 (1)
Sept. 30,2001 (1)
June 30,2001 (1)
Mar. 31,2001 (1)
Other real estate ownedConsumer (2) $384 $393 $407 $289 $268Commercial (2) 270 265 301 310 301Other - 8 9 8 8Total other real estate owned $654 $666 $717 $607 $577Other repossessed assets (3) $381 $439 $479 $409 $419
(1) Reclassified to conform to the current period's presentation.(2) Represents repossessed real estate, carried at lower of cost or fair value, less costs to sell.(3) Primarily commercial transportation equipment and manufactured housing, carried at lower of cost or fair value, less costs to sell.

58
Details of Credit Loss Experience
In millions of dollars1st Qtr.
20024th Qtr.
20013rd Qtr.
20012nd Qtr.
20011st Qtr.
2001Allowance for credit losses at beginning of period $10,088 $9,918 $8,917 $8,957 $8,961
Provision for credit lossesConsumer 1,876 1,563 1,360 1,196 1,197Commercial 683 698 220 289 277
2,559 2,261 1,580 1,485 1,474Gross credit lossesConsumerIn U.S. offices 1,281 1,284 1,041 945 915In offices outside the U.S. 615 590 547 462 449CommercialIn U.S. offices 316 572 303 285 241In offices outside the U.S. 243 381 99 84 90
2,455 2,827 1,990 1,776 1,695Credit recoveriesConsumerIn U.S. offices 148 144 109 81 101In offices outside the U.S. 107 116 102 102 98Commercial (1)
In U.S. offices 30 94 78 56 35In offices outside the U.S. 42 58 41 26 19
327 412 330 265 253Net credit lossesIn U.S. offices 1,419 1,618 1,157 1,093 1,020In offices outside the U.S. 709 797 503 418 422
2,128 2,415 1,660 1,511 1,442Other -- net (2) 1 324 1,081 (14) (36)Allowance for credit losses at end of period $10,520 $10,088 $9,918 $8,917 $8,957Net consumer credit losses $1,641 $1,614 $1,377 $1,224 $1,165As a percentage of average consumer loans 2.76% 2.66% 2.31% 2.19% 2.10%Net commercial credit losses $ 487 $ 801 $ 283 $ 287 $ 277As a percentage of average commercial loans 1.38% 2.14% 0.73% 0.82% 0.81%
(1) Includes amounts received under credit default swaps purchased from third parties.(2) Includes foreign currency translation effects and the addition of reserves for credit losses related to acquisitions.

59
PART II. OTHER INFORMATION
Item 4. Submission of Matters to a Vote of Security Holders.
Citigroup's Annual Meeting of Stockholders was held on April 16, 2002. At the meeting:
(1) 17 persons were elected to serve as directors of Citigroup;
(2) the selection of KPMG LLP to serve as the independent auditors of Citigroup for 2002 was ratified;
(3) a stockholder proposal regarding political neutrality was defeated;
(4) a stockholder proposal regarding an employee and retiree matching gift program was defeated;
(5) a stockholder proposal regarding the number of candidates for each board position was defeated;
(6) a stockholder proposal regarding executive pay and predatory lending performance was defeated;
(7) a stockholder proposal regarding severance agreements was defeated; and
(8) a stockholder proposal regarding climate change was defeated.
The number of votes cast for, against or withheld, and the number of abstentions with respect to each such matter is set forthbelow, as are the number of broker non-votes, where applicable.
FOR AGAINST/WITHHELD ABSTAINED BROKER NON-VOTES(1) Election of Directors:
NOMINEEC. Michael Armstrong 4,321,975,511 82,410,050Alain J.P. Belda 4,332,599,775 71,785,786George David 4,357,747,178 46,638,383Kenneth T. Derr 4,331,672,374 72,713,187John M. Deutch 4,316,351,715 88,033,846Alfredo Harp Helú 4,358,514,951 45,870,610Roberto Hernández Ramirez 4,358,379,274 46,006,287Ann Dibble Jordan 4,356,172,941 48,212,620Reuben Mark 4,332,355,120 72,030,441Michael T. Masin 4,359,419,117 44,966,444Dudley C. Mecum 4,318,473,762 85,911,799Richard D. Parsons 4,358,903,248 45,482,313Andrall E. Pearson 4,357,022,208 47,363,353Robert E. Rubin 4,355,005,323 49,380,238Franklin A. Thomas 4,356,543,961 47,841,600Sanford I. Weill 4,357,516,914 46,868,647Arthur Zankel 4,356,448,106 47,937,455
(2) Ratification of Auditors 4,238,397,032 144,216,912 25,022,066
(3) Approval of Stockholder 245,218,415 3,018,587,880 300,224,227 840,355,039 Proposal Regarding Political Neutrality
(4) Approval of Stockholder 128,848,835 3,272,927,484 181,446,976 821,162,266 Proposal Regarding Employee and Retiree Matching Gift Program

60
FOR AGAINST/WITHHELD ABSTAINED BROKER NON-VOTES
(5) Approval of Stockholder 146,004,719 3,301,499,107 95,335,130 861,546,605 Proposal Regarding the Number of Candidates for each Board Position
(6) Approval of Stockholder 252,110,742 3,203,939,624 108,103,398 840,231,797 Proposal Regarding Executive Pay and Predatory Lending Performance
(7) Approval of Stockholder 1,646,806,428 1,805,942,544 88,087,540 863,549,049 Proposal Regarding Severance Agreements
(8) Approval of Stockholder 194,341,322 3,055,241,163 314,466,335 840,336,741 Proposal Regarding Climate Change
Item 6. Exhibits and Reports on Form 8-K.
(a) Exhibits
See Exhibit Index.
(b) Reports on Form 8-K
On January 18, 2002, the Company filed a Current Report on Form 8-K, dated January 17, 2002, reporting under Item 5thereof the results of its operations for the quarter and year ended December 31, 2001, and certain other selected financialdata.
On February 22, 2002, the Company filed a Current Report on Form 8-K, dated February 13, 2002, filing as exhibits underItem 7 thereof the Terms Agreement, dated February 13, 2002, and the Form of Note relating to the offer and sale of theCompany's 6.00% Notes due February 21, 2012.
On March 7, 2002, the Company filed a Current Report on Form 8-K, dated February 27, 2002, filing as exhibits under Item7 thereof the Terms Agreement, dated February 27, 2002, and the Form of Note relating to the offer and sale of theCompany's 5.00% Notes due March 6, 2007.
On March 22, 2002, the Company filed a Current Report on Form 8-K, dated March 21, 2002, filing as an exhibit underItem 7 thereof the Historical Annual Supplement of Citigroup Inc. and subsidiaries.
No other reports on Form 8-K were filed during the first quarter of 2002; however,
On April 16, 2002, the Company filed a Current Report on Form 8-K, dated April 15, 2002, reporting under Item 5 thereofthe results of its operations for the quarter ended March 31, 2002, and certain other selected financial data.

61
SIGNATURES
Pursuant to the requirements of the Securities Exchange Act of 1934, the Registrant has duly caused this report to be signed on itsbehalf by the undersigned thereunto duly authorized, on the 13th day of May, 2002.
CITIGROUP INC.(Registrant)
By /s/Todd S. Thomson Todd S. Thomson Chief Financial Officer Principal Financial Officer
By /s/Irwin R. Ettinger By /s/William P. Hannon Irwin R. Ettinger William P. Hannon Principal Accounting Officer Controller

62
EXHIBIT INDEX
ExhibitNumber Description of Exhibit
3.01.1 Restated Certificate of Incorporation of Citigroup Inc. (the Company), incorporated by reference to Exhibit 4.01 tothe Company's Registration Statement on Form S-3 filed December 15, 1998 (No. 333-68949).
3.01.2 Certificate of Designation of 5.321% Cumulative Preferred Stock, Series YY, of the Company, incorporated byreference to Exhibit 4.45 to Amendment No. 1 to the Company's Registration Statement on Form S-3 filed January22, 1999 (No. 333-68949).
3.01.3 Certificate of Amendment to the Restated Certificate of Incorporation of the Company dated April 18, 2000,incorporated by reference to Exhibit 3.01.3 to the Company’s Quarterly Report on Form 10-Q for the fiscal quarterended March 31, 2000 (File No. 1-9924).
3.01.4 Certificate of Amendment to the Restated Certificate of Incorporation of the Company dated April 17, 2001,incorporated by reference to Exhibit 3.01.4 to the Company's Quarterly Report on Form 10-Q for the fiscal quarterended March 31, 2001 (File No. 1-9924).
3.01.5 Certificate of Designation of 6.767% Cumulative Preferred Stock, Series YYY, of the Company, incorporated byreference to Exhibit 3.01.5 to the Company's Annual Report on Form 10-K for the fiscal year ended December 31,2001 (File 1-9924).
3.02 By-Laws of the Company, as amended, effective October 26, 1999, incorporated by reference to Exhibit 3.02 tothe Company’s Quarterly Report on Form 10-Q for the fiscal quarter ended September 30, 1999 (File No. 1-9924).
12.01+ Calculation of Ratio of Income to Fixed Charges.
12.02+ Calculation of Ratio of Income to Fixed Charges (including preferred stock dividends).
______________
The total amount of securities authorized pursuant to any instrument defining rights of holders of long-term debt of the Companydoes not exceed 10% of the total assets of the Company and its consolidated subsidiaries. The Company will furnish copies of anysuch instrument to the Securities and Exchange Commission upon request.
______________
+ Filed herewith