2000 25.0 20.0 BFSI, defensives to deliver steady growth...
61
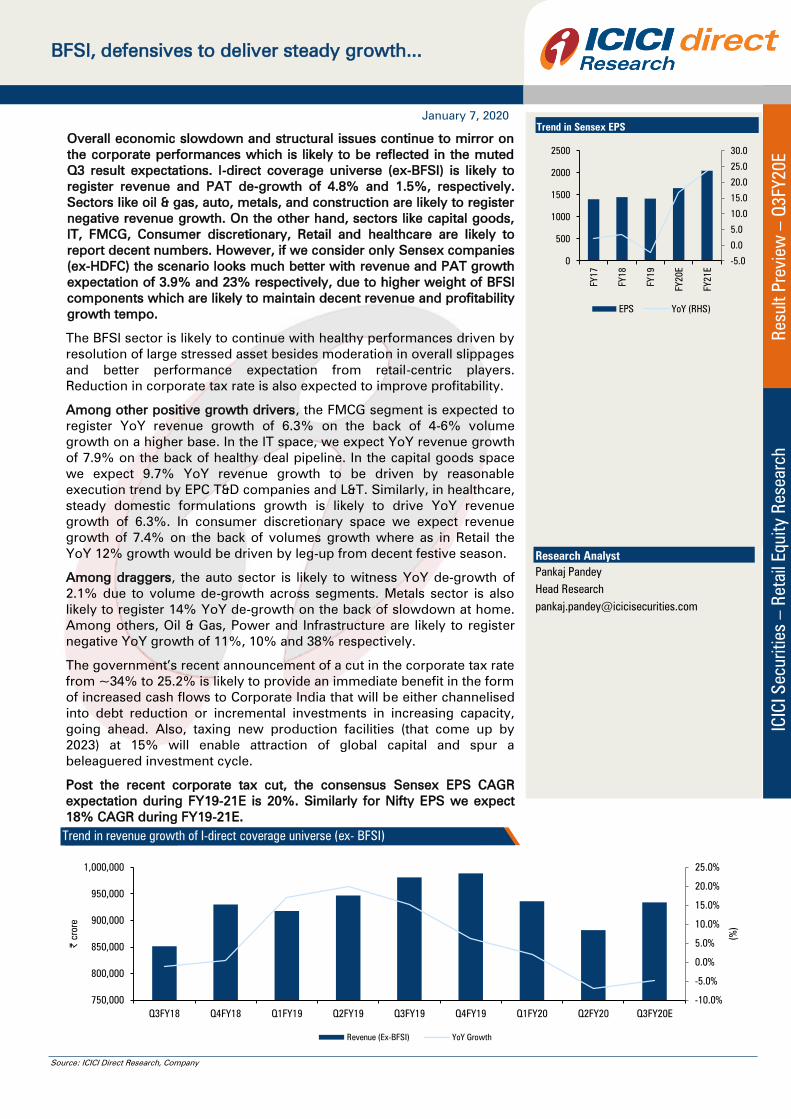
ICICI Securities – Retail Equity Research Result Preview – Q3FY20E January 7, 2020 BFSI, defensives to deliver steady growth... Overall economic slowdown and structural issues continue to mirror on the corporate performances which is likely to be reflected in the muted Q3 result expectations. I-direct coverage universe (ex-BFSI) is likely to register revenue and PAT de-growth of 4.8% and 1.5%, respectively. Sectors like oil & gas, auto, metals, and construction are likely to register negative revenue growth. On the other hand, sectors like capital goods, IT, FMCG, Consumer discretionary, Retail and healthcare are likely to report decent numbers. However, if we consider only Sensex companies (ex-HDFC) the scenario looks much better with revenue and PAT growth expectation of 3.9% and 23% respectively, due to higher weight of BFSI components which are likely to maintain decent revenue and profitability growth tempo. The BFSI sector is likely to continue with healthy performances driven by resolution of large stressed asset besides moderation in overall slippages and better performance expectation from retail-centric players. Reduction in corporate tax rate is also expected to improve profitability. Among other positive growth drivers, the FMCG segment is expected to register YoY revenue growth of 6.3% on the back of 4-6% volume growth on a higher base. In the IT space, we expect YoY revenue growth of 7.9% on the back of healthy deal pipeline. In the capital goods space we expect 9.7% YoY revenue growth to be driven by reasonable execution trend by EPC T&D companies and L&T. Similarly, in healthcare, steady domestic formulations growth is likely to drive YoY revenue growth of 6.3%. In consumer discretionary space we expect revenue growth of 7.4% on the back of volumes growth where as in Retail the YoY 12% growth would be driven by leg-up from decent festive season. Among draggers, the auto sector is likely to witness YoY de-growth of 2.1% due to volume de-growth across segments. Metals sector is also likely to register 14% YoY de-growth on the back of slowdown at home. Among others, Oil & Gas, Power and Infrastructure are likely to register negative YoY growth of 11%, 10% and 38% respectively. The government’s recent announcement of a cut in the corporate tax rate from ~34% to 25.2% is likely to provide an immediate benefit in the form of increased cash flows to Corporate India that will be either channelised into debt reduction or incremental investments in increasing capacity, going ahead. Also, taxing new production facilities (that come up by 2023) at 15% will enable attraction of global capital and spur a beleaguered investment cycle. Post the recent corporate tax cut, the consensus Sensex EPS CAGR expectation during FY19-21E is 20%. Similarly for Nifty EPS we expect 18% CAGR during FY19-21E. Trend in revenue growth of I-direct coverage universe (ex- BFSI) -10.0% -5.0% 0.0% 5.0% 10.0% 15.0% 20.0% 25.0% 750,000 800,000 850,000 900,000 950,000 1,000,000 Q3FY18 Q4FY18 Q1FY19 Q2FY19 Q3FY19 Q4FY19 Q1FY20 Q2FY20 Q3FY20E (%) | crore Revenue (Ex-BFSI) YoY Growth Source: ICICI Direct Research, Company Trend in Sensex EPS -5.0 0.0 5.0 10.0 15.0 20.0 25.0 30.0 0 500 1000 1500 2000 2500 FY17 FY18 FY19 FY20E FY21E EPS YoY (RHS) Research Analyst Pankaj Pandey Head Research [email protected]
Transcript of 2000 25.0 20.0 BFSI, defensives to deliver steady growth...
ICIC
I S
ecurit
ies –
Retail E
quit
y R
esearch
Result
Previe
w –
Q3FY20E
January 7, 2020
BFSI, defensives to deliver steady growth...
Overall economic slowdown and structural issues continue to mirror on
the corporate performances which is likely to be reflected in the muted
Q3 result expectations. I-direct coverage universe (ex-BFSI) is likely to
register revenue and PAT de-growth of 4.8% and 1.5%, respectively.
Sectors like oil & gas, auto, metals, and construction are likely to register
negative revenue growth. On the other hand, sectors like capital goods,
IT, FMCG, Consumer discretionary, Retail and healthcare are likely to
report decent numbers. However, if we consider only Sensex companies
(ex-HDFC) the scenario looks much better with revenue and PAT growth
expectation of 3.9% and 23% respectively, due to higher weight of BFSI
components which are likely to maintain decent revenue and profitability
growth tempo.
The BFSI sector is likely to continue with healthy performances driven by
resolution of large stressed asset besides moderation in overall slippages
and better performance expectation from retail-centric players.
Reduction in corporate tax rate is also expected to improve profitability.
Among other positive growth drivers, the FMCG segment is expected to
register YoY revenue growth of 6.3% on the back of 4-6% volume
growth on a higher base. In the IT space, we expect YoY revenue growth
of 7.9% on the back of healthy deal pipeline. In the capital goods space
we expect 9.7% YoY revenue growth to be driven by reasonable
execution trend by EPC T&D companies and L&T. Similarly, in healthcare,
steady domestic formulations growth is likely to drive YoY revenue
growth of 6.3%. In consumer discretionary space we expect revenue
growth of 7.4% on the back of volumes growth where as in Retail the
YoY 12% growth would be driven by leg-up from decent festive season.
Among draggers, the auto sector is likely to witness YoY de-growth of
2.1% due to volume de-growth across segments. Metals sector is also
likely to register 14% YoY de-growth on the back of slowdown at home.
Among others, Oil & Gas, Power and Infrastructure are likely to register
negative YoY growth of 11%, 10% and 38% respectively.
The government’s recent announcement of a cut in the corporate tax rate
from ~34% to 25.2% is likely to provide an immediate benefit in the form
of increased cash flows to Corporate India that will be either channelised
into debt reduction or incremental investments in increasing capacity,
going ahead. Also, taxing new production facilities (that come up by
2023) at 15% will enable attraction of global capital and spur a
beleaguered investment cycle.
Post the recent corporate tax cut, the consensus Sensex EPS CAGR
expectation during FY19-21E is 20%. Similarly for Nifty EPS we expect
18% CAGR during FY19-21E.
Trend in revenue growth of I-direct coverage universe (ex- BFSI)
-10.0%
-5.0%
0.0%
5.0%
10.0%
15.0%
20.0%
25.0%
750,000
800,000
850,000
900,000
950,000
1,000,000
Q3FY18 Q4FY18 Q1FY19 Q2FY19 Q3FY19 Q4FY19 Q1FY20 Q2FY20 Q3FY20E
(%
)
| c
rore
Revenue (Ex-BFSI) YoY Growth
Source: ICICI Direct Research, Company
Trend in Sensex EPS
-5.0
0.0
5.0
10.0
15.0
20.0
25.0
30.0
0
500
1000
1500
2000
2500
FY17
FY18
FY19
FY20E
FY21
E
EPS YoY (RHS)
Research Analyst
Pankaj Pandey
Head Research
ICICI Securities | Retail Research 2
ICICI Direct Research
Result Preview Q3FY20E
Performance of Sensex companies
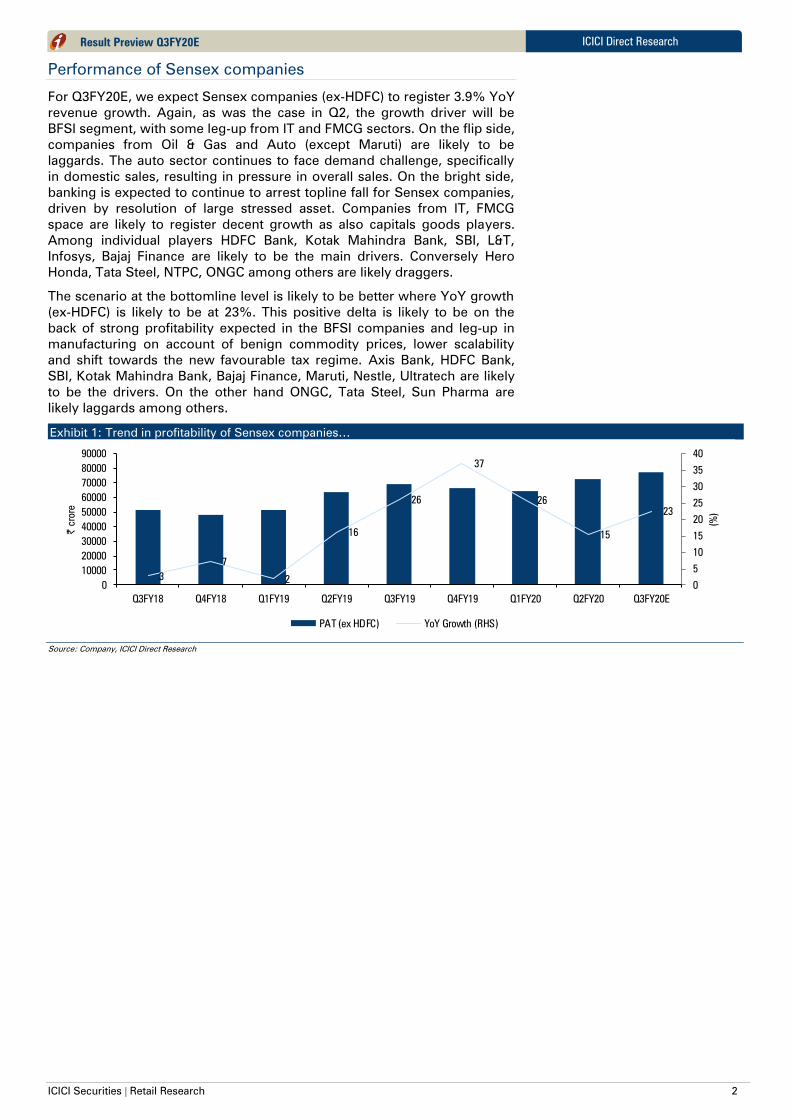
For Q3FY20E, we expect Sensex companies (ex-HDFC) to register 3.9% YoY
revenue growth. Again, as was the case in Q2, the growth driver will be
BFSI segment, with some leg-up from IT and FMCG sectors. On the flip side,
companies from Oil & Gas and Auto (except Maruti) are likely to be
laggards. The auto sector continues to face demand challenge, specifically
in domestic sales, resulting in pressure in overall sales. On the bright side,
banking is expected to continue to arrest topline fall for Sensex companies,
driven by resolution of large stressed asset. Companies from IT, FMCG
space are likely to register decent growth as also capitals goods players.
Among individual players HDFC Bank, Kotak Mahindra Bank, SBI, L&T,
Infosys, Bajaj Finance are likely to be the main drivers. Conversely Hero
Honda, Tata Steel, NTPC, ONGC among others are likely draggers.
The scenario at the bottomline level is likely to be better where YoY growth
(ex-HDFC) is likely to be at 23%. This positive delta is likely to be on the
back of strong profitability expected in the BFSI companies and leg-up in
manufacturing on account of benign commodity prices, lower scalability
and shift towards the new favourable tax regime. Axis Bank, HDFC Bank,
SBI, Kotak Mahindra Bank, Bajaj Finance, Maruti, Nestle, Ultratech are likely
to be the drivers. On the other hand ONGC, Tata Steel, Sun Pharma are
likely laggards among others.
Exhibit 1: Trend in profitability of Sensex companies…
3
7
2
16
26
37
26
15
23
0
5
10
15
20
25
30
35
40
0
10000
20000
30000
40000
50000
60000
70000
80000
90000
Q3FY18 Q4FY18 Q1FY19 Q2FY19 Q3FY19 Q4FY19 Q1FY20 Q2FY20 Q3FY20E
(%
)
| crore
PAT (ex HDFC) YoY Growth (RHS)
Source: Company, ICICI Direct Research

ICICI Securities | Retail Research 3
ICICI Direct Research
Result Preview Q3FY20E
BFSI to lead coverage growth again
I-direct coverage universe (ex-BFSI) is likely to register revenue and PAT de-
growth of 4.8% and 1.5%, respectively. Sectors like auto, metals, oil & gas
and construction are likely to register negative revenue growth. On the
other hand, sectors like retail, IT, FMCG, consumer discretionary, healthcare
and capital goods are likely to report decent numbers. BFSI will continue to
remain a key driver of overall growth of coverage universe.
In BFSI, resolution of large stressed asset (Essar Steel) pending in NCLT is
expected to provide breather to NPA ratios and provide a boost to earnings
with large recovery. Incremental slippages will come from the HFC account.
For our coverage universe, we expect absolute GNPA to increase marginally
at 1% YoY to ~| 292205 crore in Q3FY20E. PAT seen growing 54% YoY
and 63% QoQ in Q3. In terms of growth, festive season & lower NBFC
competition is seen favouring retail centric banks. Stance of PSU banks on
reduction in tax rate is to be watched which is anticipated to shore up
profitability in medium term. Operationally, we expect banking sector to
clock steady operational performance on the back of sturdy margins and
moderation in slippages. Recovery from large stressed accounts is expected
to be utilized by banks to increase coverage ratio on slippage of large HFC,
thereby cushioning substantial impact on earnings. Consequently, private
banks are seen to report healthy traction in earnings at ~38% YoY. SBI is
seen as biggest beneficiary of resolution of Essar steel and report highest
quarterly PAT of ~ |7787 crore up almost 158% YoY.
Exhibit 2: Pre provisioning profit (PPP) of banks
16987
16163
20
79
4
17522
23535
32325
0
10000
20000
30000
40000
50000
Q2FY19 Q3FY19 Q4FY19 Q1FY20 Q2FY20 Q3FY20E
| c
rore
Source: Company, ICICI Direct Research
Exhibit 3: Provisions of banks
20502
14832 28411
19836
24966
26498
0
10000
20000
30000
40000
50000
Q2FY19 Q3FY19 Q4FY19 Q1FY20 Q2FY20 Q3FY20E
| c
rore
Source: Company, ICICI Direct Research
The EBITDA margins of the coverage universe (ex-BFSI) are likely to expand
120 bps YoY to 15.6%, also aided by Ind-AS 116 reporting and cost control
measures in selected sector companies.
Exhibit 4: Trend in EBITDA margins of I-direct coverage universe (ex- BFSI)
17.716.8 17.2
15.7
14.4
15.915.4 15.2 15.6
0.0
5.0
10.0
15.0
20.0
Q3FY18
Q4FY18
Q1FY19
Q2FY19
Q3FY19
Q4FY19
Q1FY20
Q2FY20
Q3FY20E
(%
)
EBITDA Margin (%)
Source: Company, ICICI Direct Research

ICICI Securities | Retail Research 4
ICICI Direct Research
Result Preview Q3FY20E
The dent on the universe profitability (ex-BFSI) is likely to be less severe vis-
à-vis revenue. The universe (ex BFSI) is likely to report YoY de-growth of
1.5% YoY. This (lower dent) could be attributable to 1) 120 bps EBITDA
margin expansion which would be on account of cost rationalisation
measures, better realisation besides implementation of IndAS 116, and 2)
lowering of corporate tax rates.
Exhibit 5: Trend in coverage PAT (ex BFSI)
72,1
70
78,3
73
75,3
81
69,0
94
70,1
06
81,8
34
61,1
91
70,2
68
69,0
46
9.4
17.7
24.6
5.0
-2.9
4.4
-18.8
1.7
-1.5
-30
-20
-10
0
10
20
30
0
20,000
40,000
60,000
80,000
100,000
Q3FY18
Q4FY18
Q1FY19
Q2FY19
Q3FY19
Q4FY19
Q1FY20
Q2FY20
Q3FY20
(%
)
(|
Crore)
PAT (Ex BFSI) Growth (RHS)
Source: Company, ICICI Direct Research
Defensives: Steady revenue growth to provide cushion
(Sector composition: IT, FMCG, consumer discretionary, retail, healthcare)
Key highlights:
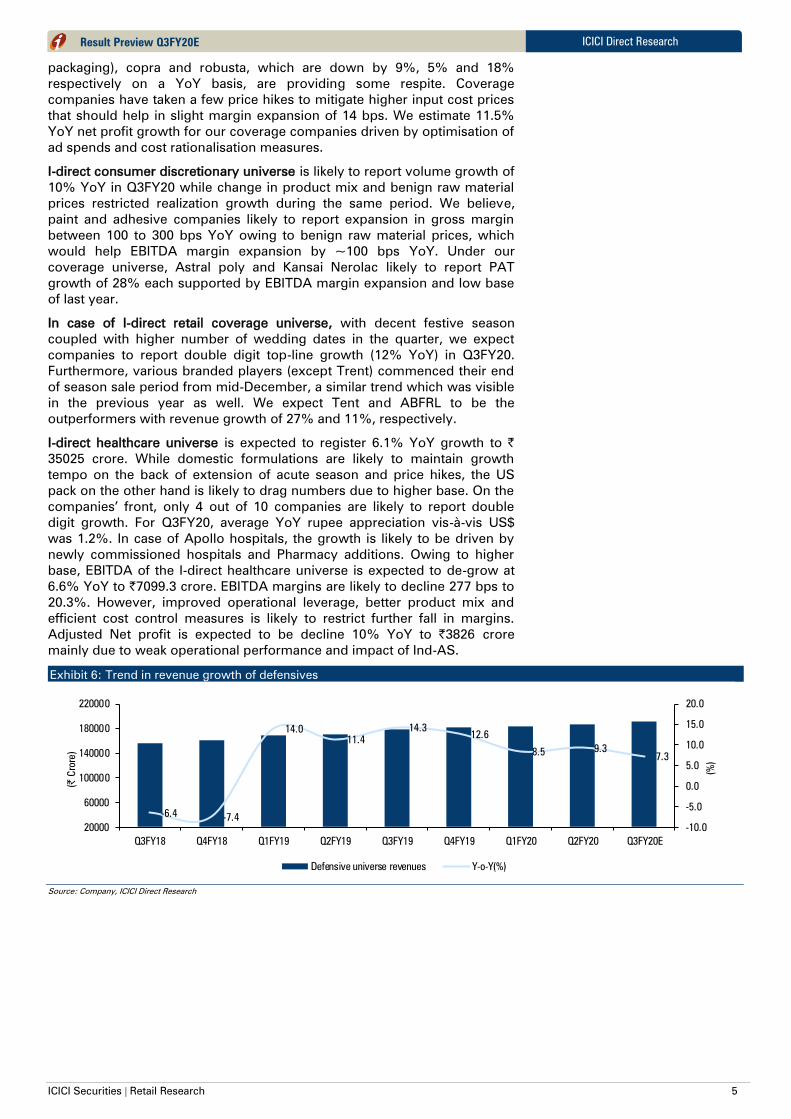
We expect defensives to continue to provide cushion to the universe
financials as cyclicals continue to face headwinds. I-direct defensive
universe is likely to report 7.3% YoY revenue growth. However, the growth
rate is likely to be slowest in the last few quarters as issues at the
distribution level and consumption slowdown continue to weigh. Among
defensives, healthcare is likely to post ~6% growth, which is likely to be
driven by domestic formulations but dragged down by high US base
business. The FMCG coverage universe is expected to post sales growth of
~7% on the back of 4-6% volume growth. The consumer discretionary
sector is likely to grow at 7% on the back ~10% volume growth. IT pack is
expected to deliver ~8% YoY growth which would be driven by sizeable
deal wins.
For IT companies, weak seasonality of the quarter coupled with slowdown
in banking financial services and retail segments is likely to lead to
moderation in growth rates especially for Tier-1 IT companies. We expect
Tier-1 IT companies to report revenue growth in the range of 1-1.8% QoQ in
constant currency (CC) terms. Cross currency would act as a tailwind of
average 30-60 bps to reported dollar growth mainly on the back of GBP
appreciating 4.5% QoQ vs. US dollar. On a YoY basis, the universe is likely
to grow at 7.9%. Of top tier, Wipro is expected to lead followed by rest.
Mid-tier is expected to drive better revenue performance compared to Tier-
1, with L&T Infotech leading the growth with 4.5% sequential dollar revenue
growth. On the margin front, currency tailwind would provide cushion to
margins for most companies. To be keenly watched would be, outlook for
CY20E in direction of clients IT budgets, demand environment for banking
and retail verticals, deal funnel and managing margins in wake of increasing
cost pressures.
Due to rural slowdown and liquidity issues at wholesale level, I-direct FMCG
coverage universe would witness muted growth in Q3FY20E as witnessed
in previous quarter. The coverage companies are expected to report muted
organic volume growth in the range of 4-6% YoY on a high base whereby
sales is expected to grow by 6.3% YoY. Raw material prices have been on
an upward trend over last few months. Palm oil, cocoa, barley, milk, wheat
and sugar prices have increased by 29%, 12%, 11%, 10%, 8% and 5% YoY
respectively. However, few commodities such as crude oil (used for
ICICI Securities | Retail Research 5
ICICI Direct Research
Result Preview Q3FY20E
packaging), copra and robusta, which are down by 9%, 5% and 18%
respectively on a YoY basis, are providing some respite. Coverage
companies have taken a few price hikes to mitigate higher input cost prices
that should help in slight margin expansion of 14 bps. We estimate 11.5%
YoY net profit growth for our coverage companies driven by optimisation of
ad spends and cost rationalisation measures.
I-direct consumer discretionary universe is likely to report volume growth of
10% YoY in Q3FY20 while change in product mix and benign raw material
prices restricted realization growth during the same period. We believe,
paint and adhesive companies likely to report expansion in gross margin
between 100 to 300 bps YoY owing to benign raw material prices, which
would help EBITDA margin expansion by ~100 bps YoY. Under our
coverage universe, Astral poly and Kansai Nerolac likely to report PAT
growth of 28% each supported by EBITDA margin expansion and low base
of last year.
In case of I-direct retail coverage universe, with decent festive season
coupled with higher number of wedding dates in the quarter, we expect
companies to report double digit top-line growth (12% YoY) in Q3FY20.
Furthermore, various branded players (except Trent) commenced their end
of season sale period from mid-December, a similar trend which was visible
in the previous year as well. We expect Tent and ABFRL to be the
outperformers with revenue growth of 27% and 11%, respectively.
I-direct healthcare universe is expected to register 6.1% YoY growth to |
35025 crore. While domestic formulations are likely to maintain growth
tempo on the back of extension of acute season and price hikes, the US
pack on the other hand is likely to drag numbers due to higher base. On the
companies’ front, only 4 out of 10 companies are likely to report double
digit growth. For Q3FY20, average YoY rupee appreciation vis-à-vis US$
was 1.2%. In case of Apollo hospitals, the growth is likely to be driven by
newly commissioned hospitals and Pharmacy additions. Owing to higher
base, EBITDA of the I-direct healthcare universe is expected to de-grow at
6.6% YoY to |7099.3 crore. EBITDA margins are likely to decline 277 bps to
20.3%. However, improved operational leverage, better product mix and
efficient cost control measures is likely to restrict further fall in margins.
Adjusted Net profit is expected to be decline 10% YoY to |3826 crore
mainly due to weak operational performance and impact of Ind-AS.
Exhibit 6: Trend in revenue growth of defensives
-6.4-7.4
14.0
11.4
14.312.6
8.59.3
7.3
-10.0
-5.0
0.0
5.0
10.0
15.0
20.0
20000
60000
100000
140000
180000
220000
Q3FY18 Q4FY18 Q1FY19 Q2FY19 Q3FY19 Q4FY19 Q1FY20 Q2FY20 Q3FY20E
(%
)
(| C
rore)
Defensive universe revenues Y-o-Y(%)
Source: Company, ICICI Direct Research

ICICI Securities | Retail Research 6
ICICI Direct Research
Result Preview Q3FY20E
Exhibit 7: Trend in EBITDA margins
23.0
23.2
22.7
23.1
23.9
23.4
23.2
23.4
23.2
22.0
22.2
22.4
22.6
22.8
23.0
23.2
23.4
23.6
23.8
24.0
24.2
Q3FY18
Q4FY18
Q1FY19
Q2FY19
Q3FY19
Q4FY19
Q1FY20
Q2FY20
Q3FY20E
(%
)
Source: Company, ICICI Direct Research
Exhibit 8: Trend in profitability
1.65.6
18.6
9.4
12.7
15.2
9.9
15.5
3.1
0.0
5.0
10.0
15.0
20.0
20000
22000
24000
26000
28000
30000
32000
34000
Q3FY18
Q4FY18
Q1FY19
Q2FY19
Q3FY19
Q4FY19
Q1FY20
Q2FY20
Q3FY20E
(%
)
(|
Crore)
Net Profit Y-o-Y(%)
Source: Company, ICICI Direct Research
Cyclicals: Likely to feel heat due to slowdown in demand
(Sector composition: auto, capital goods, oil & gas, metals, cement,
construction)
Key highlights:
I-direct cyclical universe is again expected to register negative revenue
growth of 7.9% YoY (as was the case in Q2), mainly dragged by almost all
heavyweights except capital goods and cement sectors. The auto space,
one of the major sectors in cyclicals, is expected to decline 2.1% due to
volume de-growth across segments. Metals sector is also likely to register
14% negative growth on the back of slowdown at home. On the positive
side, the capital goods segment is likely to register 9.7% growth on the back
of reasonable execution trend by at EPC T&D companies and L&T. Similarly
cement companies are likely to deliver ~5% growth on the back of 2.7%
volume growth.
For Auto universe, wholesale volume de-growth trend continued for the
domestic automobile space with volume declining ~13% YoY in Q3FY20,
amidst sharp retail uptick in the festive period (October 2019). CV segment
remains to be the worst hit with volumes declining at ~30% YoY while the
PV segment was the key outlier with neutral to positive volume growth on
YoY basis in Q3FY20. Consequently, top-line decline for the coverage
universe is anticipated at 2.1% YoY, outperforming the volume de-growth
courtesy increase in ASPs due to regulatory changes and successful launch
of BS-VI variants. On the margins front, benign raw material prices (Steel,
Rubber) will aid gross margin recovery for most of the coverage companies,
the extent however limited by perils of negative operating leverage. We
expect coverage margins to expand to 13.2% in Q3FY20, up 60 bps QoQ &
230 bps YoY. Ex-Tata Motors, PAT growth for the coverage in Q3FY20E is
expected at 3.0% YoY.
I-direct capital goods coverage universe is are expected to post reasonable
execution trend led by EPC T&D companies and L&T. Revenues are
expected to grow by 9.7% owing to accelerated execution rates at
engineering and T&D companies like L&T, KEC, Kalpataru and Bharat
Electronics (BEL). On the EBITDA front however we expect muted growth of
1.3% YoY due to expected dismal performance by product companies amid
auto and industrial slowdown. The PAT is expected to grow by 5.5% aided
by corporate tax rate cut benefit.
Regarding oil & gas space, the global crude oil prices reported a bullish
trend in the quarter after witnessing a decline in Q2FY20. Global events
such as OPEC+ decision to cut the oil production by 2.1 million barrels per
day and easing of US-China trade tensions led to the rise of crude oil prices
ICICI Securities | Retail Research 7
ICICI Direct Research Result Preview Q3FY20E
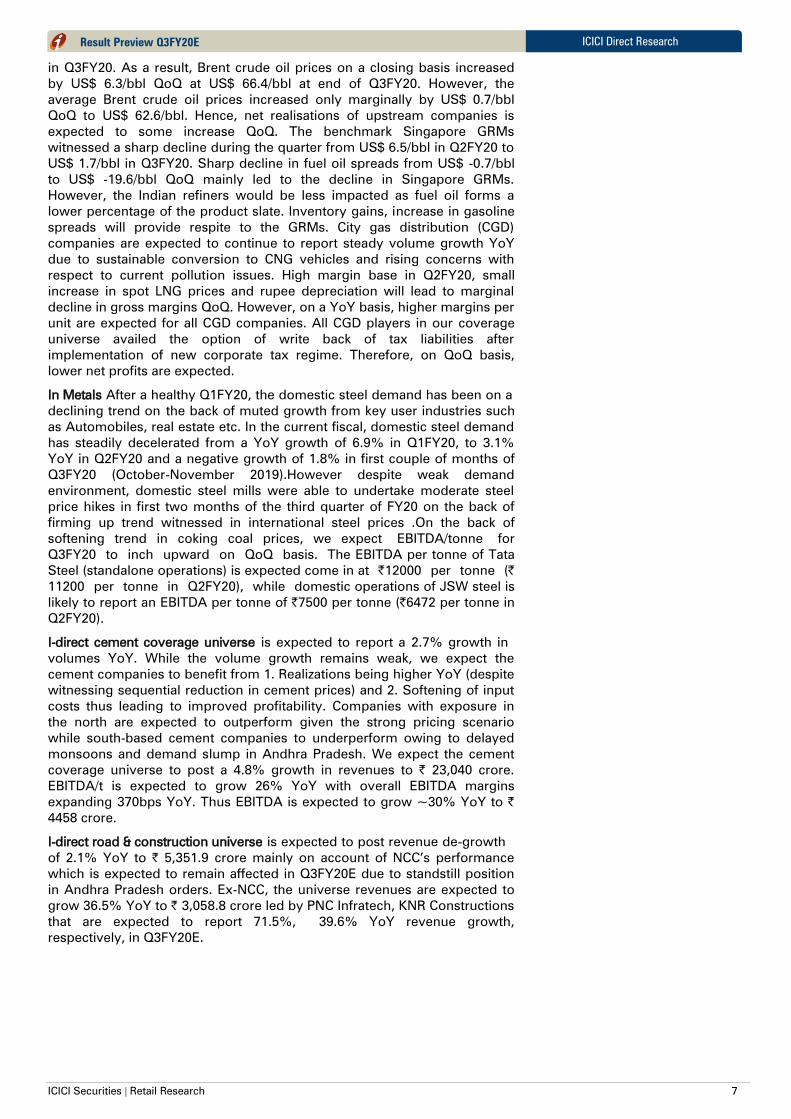
in Q3FY20. As a result, Brent crude oil prices on a closing basis increased
by US$ 6.3/bbl QoQ at US$ 66.4/bbl at end of Q3FY20. However, the
average Brent crude oil prices increased only marginally by US$ 0.7/bbl
QoQ to US$ 62.6/bbl. Hence, net realisations of upstream companies is
expected to some increase QoQ. The benchmark Singapore GRMs
witnessed a sharp decline during the quarter from US$ 6.5/bbl in Q2FY20 to
US$ 1.7/bbl in Q3FY20. Sharp decline in fuel oil spreads from US$ -0.7/bbl
to US$ -19.6/bbl QoQ mainly led to the decline in Singapore GRMs.
However, the Indian refiners would be less impacted as fuel oil forms a
lower percentage of the product slate. Inventory gains, increase in gasoline
spreads will provide respite to the GRMs. City gas distribution (CGD)
companies are expected to continue to report steady volume growth YoY
due to sustainable conversion to CNG vehicles and rising concerns with
respect to current pollution issues. High margin base in Q2FY20, small
increase in spot LNG prices and rupee depreciation will lead to marginal
decline in gross margins QoQ. However, on a YoY basis, higher margins per
unit are expected for all CGD companies. All CGD players in our coverage
universe availed the option of write back of tax liabilities after
implementation of new corporate tax regime. Therefore, on QoQ basis,
lower net profits are expected.
In Metals After a healthy Q1FY20, the domestic steel demand has been on a
declining trend on the back of muted growth from key user industries such
as Automobiles, real estate etc. In the current fiscal, domestic steel demand
has steadily decelerated from a YoY growth of 6.9% in Q1FY20, to 3.1%
YoY in Q2FY20 and a negative growth of 1.8% in first couple of months of
Q3FY20 (October-November 2019).However despite weak demand
environment, domestic steel mills were able to undertake moderate steel
price hikes in first two months of the third quarter of FY20 on the back of
firming up trend witnessed in international steel prices .On the back of
softening trend in coking coal prices, we expect EBITDA/tonne for
Q3FY20 to inch upward on QoQ basis. The EBITDA per tonne of Tata
Steel (standalone operations) is expected come in at |12000 per tonne (|
11200 per tonne in Q2FY20), while domestic operations of JSW steel is
likely to report an EBITDA per tonne of |7500 per tonne (|6472 per tonne in
Q2FY20).
I-direct cement coverage universe is expected to report a 2.7% growth in
volumes YoY. While the volume growth remains weak, we expect the
cement companies to benefit from 1. Realizations being higher YoY (despite
witnessing sequential reduction in cement prices) and 2. Softening of input
costs thus leading to improved profitability. Companies with exposure in
the north are expected to outperform given the strong pricing scenario
while south-based cement companies to underperform owing to delayed
monsoons and demand slump in Andhra Pradesh. We expect the cement
coverage universe to post a 4.8% growth in revenues to | 23,040 crore.
EBITDA/t is expected to grow 26% YoY with overall EBITDA margins
expanding 370bps YoY. Thus EBITDA is expected to grow ~30% YoY to |
4458 crore.
I-direct road & construction universe is expected to post revenue de-growth
of 2.1% YoY to | 5,351.9 crore mainly on account of NCC’s performance
which is expected to remain affected in Q3FY20E due to standstill position
in Andhra Pradesh orders. Ex-NCC, the universe revenues are expected to
grow 36.5% YoY to | 3,058.8 crore led by PNC Infratech, KNR Constructions
that are expected to report 71.5%, 39.6% YoY revenue growth,
respectively, in Q3FY20E.
ICICI Securities | Retail Research 8
ICICI Direct Research Result Preview Q3FY20E
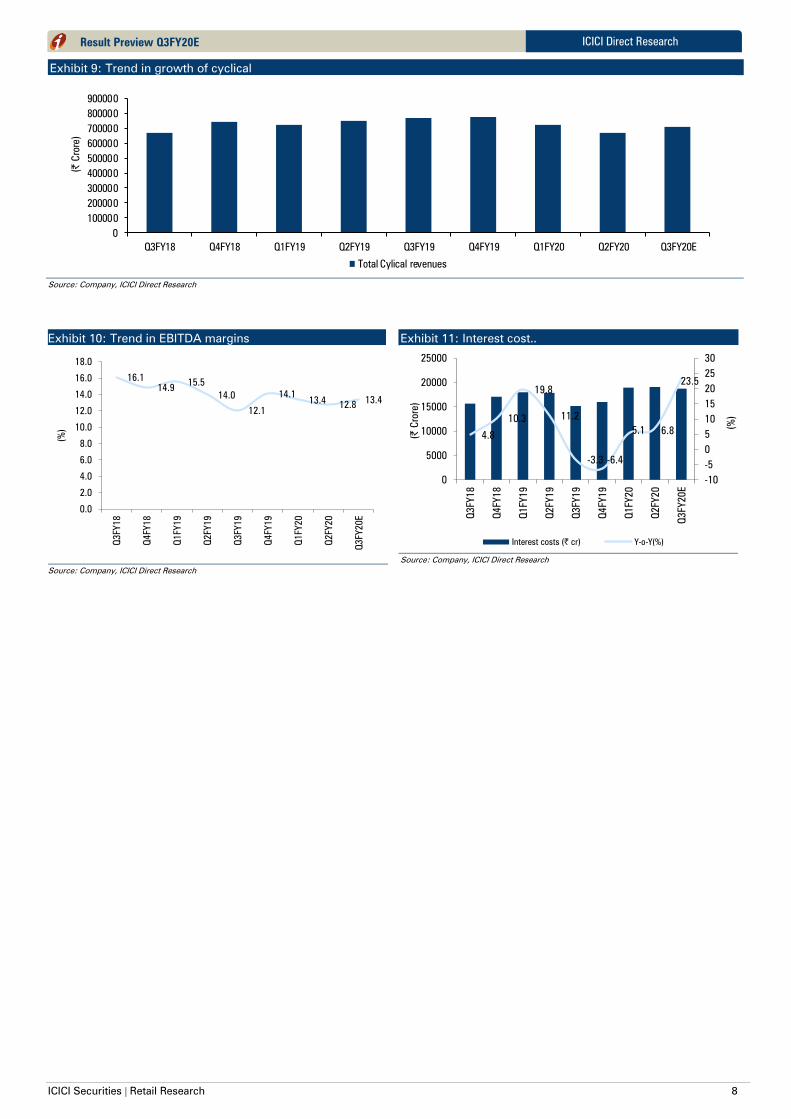
Exhibit 9: Trend in growth of cyclical
0
100000
200000
300000
400000
500000
600000
700000
800000
900000
Q3FY18 Q4FY18 Q1FY19 Q2FY19 Q3FY19 Q4FY19 Q1FY20 Q2FY20 Q3FY20E
(| C
rore)
Total Cylical revenues
Source: Company, ICICI Direct Research
Exhibit 10: Trend in EBITDA margins
16.1
14.915.5
14.0
12.1
14.113.4
12.813.4
0.0
2.0
4.0
6.0
8.0
10.0
12.0
14.0
16.0
18.0
Q3FY18
Q4FY18
Q1FY19
Q2FY19
Q3FY19
Q4FY19
Q1FY20
Q2FY20
Q3FY20E
(%
)
Source: Company, ICICI Direct Research
Exhibit 11: Interest cost..
4.8
10.3
19.8
11.2
-3.3 -6.4
5.1 6.8
23.5
-10
-5
0
5
10
15
20
25
30
0
5000
10000
15000
20000
25000
Q3FY18
Q4FY18
Q1FY19
Q2FY19
Q3FY19
Q4FY19
Q1FY20
Q2FY20
Q3FY
20
E
(%
)
(|
Crore)
Interest costs (| cr) Y-o-Y(%)
Source: Company, ICICI Direct Research

ICICI Securities | Retail Research 9
ICICI Direct Research
Result Preview Q3FY20E
Auto and auto ancillary
Dark clouds return post festive uptick …
Q3FY20 began on a positive note for the auto space. The seasonally strong
festive period (entirely in October this time) and intense price incentives
combined to provide some relief to the industry, with several leading OEMs
reporting encouraging climb downs in inventory levels amid healthy retail
offtake. However, the respite proved short lived as volumes suffered again
in succeeding months of November and December despite continued high
discounting, indicating absence of meaningful improvement in underlying
demand. Nevertheless, system inventory is leaner today compared to
September levels (particularly for PV), which is a positive ahead of
upcoming BS-VI changeover.
Soft commodity prices to lend support amid volume declines!
Wholesale volume decline continued in varying degrees at key OEMs during
Q3FY20, with PV heavyweight MSIL being the sole exception, reporting 2%
YoY growth. M&M and Tata Motors posted 7.6% and 31.6% drop in their PV
divisions respectively. Elsewhere, HMCL registered 14.3% decline while
rival Bajaj Auto posted 4.7% dip in its 2-W portfolio (aided by healthy
exports). Eicher Motors’ Royal Enfield volumes fell by 6% YoY. Among CVs,
Ashok Leyland recorded 28.7% decline, faring worse than Tata Motors’
19.3% CV segment drop. Fortunately for the auto pack, input commodity
prices remained supportive, continuing the trend of the past quarter. Steel
and rubber prices were soft in particular, thus helping gross margins for
OEMs and tyre ancillaries. Lagged pass through of firmer lead prices from
Q2FY20, however, is seen weighing on margins of battery makers.
Another poor showing expected for coverage universe …
Our coverage universe is expected to endure yet more pain during Q3FY20,
with top line seen declining by 2.2% YoY to | 1.4 lakh crore tracking ~13%
decline in overall auto industry volumes for the quarter. While gross margin
expansion is likely for most coverage companies (ex-batteries), the benefit
would be limited on account of negative operating leverage. EBITDA margin
for the universe is expected to expand by 60 bps QoQ to 13.2%. Ex-Tata
Motors, our coverage universe is expected to post 2.1% YoY top line
decline with EBITDA margins of 14.1% and PAT increase of 3.0% YoY. On
the back of strong gross margin led gains, OEM pack is seen outperforming
ancillaries despite steady state aftermarket support to the value chain.
Among OEMs (ex-Tata Motors), top line is expected to dip by 1.9% YoY
while total PAT is seen increasing by 5.6% YoY, while in ancillary pack, top
line and bottom line de-growth is expected at 3.6% & 18.4 % respectively.
Some respite in PAT is also on account of transition to lower tax rate
(25.2%) for the quarter.
Exhibit 12: Estimates for Q3FY20E (| crore)
Revenue EBITDA PAT
Q3FY20E YoY QoQ Q3FY20E YoY QoQ Q3FY20E YoY QoQ
Apollo Tyre 4,414.3 -6.4 10.7 473.0 -10.3 9.5 98.6 -50.2 18.8
Ashok Leyland 4,120.0 -34.9 4.8 344.2 -47.0 50.6 161.5 -57.6 315.6
Bajaj Auto 7,646.2 3.2 -0.8 1,298.7 12.3 1.6 1,160.8 5.3 -17.2
Bharat Forge 1,389.7 -17.9 10.3 373.5 -29.0 16.6 215.8 -30.3 -11.9
Eicher Motors 2,343.0 0.1 6.9 632.9 -6.9 16.9 536.0 0.6 -6.4
Escorts 1,573.6 -4.9 18.9 188.8 -5.8 49.0 129.7 -7.4 24.0
Exide 2,782.6 11.4 6.6 388.4 24.3 5.8 226.9 46.4 -4.4
Hero Motocorp 6,896.8 -12.3 -8.9 965.8 -12.6 -12.3 724.3 -5.8 -17.2
M & M 12,303.3 -5.9 11.1 1,745.0 15.0 25.4 1,036.7 -3.7 -14.5
Maruti Suzuki 22,346.0 13.6 31.6 2,895.5 49.9 80.3 2,047.1 37.5 50.7
Tata Motors 75,252.4 -2.3 15.0 9,379.5 30.8 13.6 766.5 LP LP
Total 141,068.0 -2.2 13.7 18,685.2 18.4 19.4 7,104.0 LP 19.6
Company
Change (%) Change (%) Change (%)
Source: Company, ICICI Direct Research;
Top line & Profitability (Coverage Universe)
144243
158715
127842
124073
141068
2
4
6
8
10
12
14
0
40000
80000
120000
160000
Q3FY19
Q4FY19
Q1FY20
Q2FY20
Q3FY20E
(%
)
| C
rore
Revenue EBITDA Margin
PAT Margin
Key players volume growth for Q3FY20 (%)
-14.3
-4.6
2.0
-24.7
-7.6
-28.7
-6.0
6.7
-8.9
2.5
29.3
23.1
10.7
7.8
9.6
(2.4)
HMCL
BAL
Maruti
TML
M&M
ALL
Eicher - RE
Escorts
YoY QoQ
Average commodity price movement (|/kg)
Commodity Q3FY20 Q3FY19 YoY (%) Q2FY20 QoQ (%)
Steel 40 51 -22.0 42 -4.8
Aluminium 140 142 -1.6 143 -2.4
Rubber 125 124 1.4 142 -11.6
Plastics 72 79 -8.5 73 -1.5
Lead 145 143 1.9 145 0.3
Average currency movement against INR
Q3FY20 Q3FY19 YoY (%) Q2FY20 QoQ (%)
USD/INR 71.2 72.0 -1.1 71.2 0.0
EUR/INR 78.9 82.2 -4.0 79.2 -0.4
GBP/INR 91.8 92.6 -0.9 87.8 4.6
JPY/INR 0.7 0.6 6.7 0.7 0.0
Top Picks
Exide Industries
Analysts
Shashank Kanodia, CFA
Jaimin Desai
Cheragh Sidhwa
Top line & Profitability (Coverage Universe)
144243
158715
127842
124073
141068
2
4
6
8
10
12
14
0
40000
80000
120000
160000
Q3FY19
Q4FY19
Q1FY20
Q2FY20
Q3FY20E
(%
)
| C
rore
Revenue EBITDA Margin
PAT Margin
Key players volume growth for Q3FY20 (%)
-14.3
-4.6
2.0
-24.7
-7.6
-28.7
-6.0
6.7
-8.9
2.5
29.3
23.1
10.7
7.8
9.6
(2.4)
HMCL
BAL
Maruti
TML
M&M
ALL
Eicher - RE
Escorts
YoY QoQ
Average commodity price movement (|/kg)
Commodity Q3FY20 Q3FY19 YoY (%) Q2FY20 QoQ (%)
Steel 40 51 -22.0 42 -4.8
Aluminium 140 142 -1.6 143 -2.4
Rubber 125 124 1.4 142 -11.6
Plastics 72 79 -8.5 73 -1.5
Lead 145 143 1.9 145 0.3
Average currency movement against INR
Q3FY20 Q3FY19 YoY (%) Q2FY20 QoQ (%)
USD/INR 71.2 72.0 -1.1 71.2 0.0
EUR/INR 78.9 82.2 -4.0 79.2 -0.4
GBP/INR 91.8 92.6 -0.9 87.8 4.6
JPY/INR 0.7 0.6 6.7 0.7 0.0
Top Picks
Exide Industries
Research Analysts
Shashank Kanodia, CFA
Jaimin Desai

ICICI Securities | Retail Research 10
ICICI Direct Research
Result Preview Q3FY20E
Exhibit 13: Company Specific view - OEMs
Company Remarks
Ashok Leyland
Ashok Leyland is expected to report dismal performance in Q3FY20E courtesy 29% YoY
decline in volumes to 31,200 units. Product mix remains adverse with MHCV:LCV ratio
at ~60:40 vs. its usual run rate of ~70:30. Blended ASP's are also expected to decline
~3% QoQ primarily tracking high discounting in the market place. Consequent Net
sales for the quarter is expected at | 4,120 crore, down 35% YoY, with corresponding
EBITDA margins at 8.4% (up 260 bps QoQ, down 190 bps YoY). Resultant PAT is
expected at | 162 crore, down 58% YoY
Bajaj Auto
Bajaj Auto is expected to report a decent Q3FY20E courtesy single digit decline in
volumes and benign raw material costs. Total volumes for the quarter came in at 12.0
lakh units, down 4.6% YoY with 2-W volumes down 5% YoY to 10.3 lakh units and 3-W
volumes down 3% YoY at 1.75 lakh units. Consequent net sales in Q3FY20E is expected
at | 7646 crore, up 3.2% YoY. EBITDA margins are seen at | 17.0% (up 140 bps YoY &
40 bps QoQ) respectively. Consequent PAT is expected at | 1161 crore, up 5.3% YoY
Eicher Motors
Eicher Motors is expected to report muted performance in Q3FY19E amidst sales
volume decline (RE sales volume at 1.83 lakh units, down 6% YoY; VECV sales volume
at 12.5 K units, down 26% YoY), although consequent operating income in Q3FY20E is
anticipated at | 2343 crore, flat YoY. EBITDA for the quarter is expected at | 633 crore
with corresponding EBITDA margins at 27.0% (up 230 bps QoQ and down 200 bps YoY).
Resultant PAT is expected at | 536 crore, flat YoY. Share of profits from VECV segment
is expected at | 14.5 crore (vs. | 41.5 crore in Q3FY19 and | 8.3 crore in Q2FY20)
Escorts
Escorts is expected to report muted performance in Q3FY20E primarily tracking decline
in tractor sales volume at 25,109 units (down 2.5% YoY) and muted prospects in the
construction equipment industry. Net sales for the quarter is expected at | 1574 crore,
down 5% YoY. EBITDA in Q3FY20E is expected at | 189 crore with corresponding
EBITDA margins at 12.0% (up 240 bps QoQ and 10 bps YoY). Sequential improvement in
margins is on account of operating leverage benefit in a seasonally strong quarter and
muted raw material prices. Resultant PAT is expected at | 130 crore, down 7.4% YoY
Hero MotoCorp
Hero Motocorp is expected to report muted performance in Q3FY20E primarily tracking
decline in volumes and associated perils of negative operating leverage amidst benign
raw material costs. Sales volume in Q3FY20E came in at 15.4 lakh units, down 14%
YoY and 9% QoQ with scooters witnessing a steep volume decline of 42% YoY.
Consequent net sales for the quarter is expected at | 6897 crore, down 12.3% YoY.
EBITDA in Q3FY20E stood at | 966 crore with corresponding EBITDA margins at 14.0%
(down 50 bps QoQ). PAT for the quarter is expected at | 724 crore, down 6% YoY
M&M
Subdued performance trend is likely to continue at M&M. For Q3FY20E, automobile
segment volumes are down 7.6% YoY to 1.3 lakh units while tractor sales volume are
down 6.9% YoY to 0.8 lakh units. Consequent net sales at the standalone level is
expected at | 12,303 crore down 6% YoY. Benign raw material prices and sequential
growth in volumes are seen supporting operating margins. Consequent EBITDA &
EBITDA margins are expected at | 1745 crore and 14.2% respectively (up 260 bps YoY).
PAT in Q3FY20E is expected at | 1037 crore, down 4% YoY
Maruti Suzuki
Dark clouds of subdued performance seems to be largely behind Maruti, with company
expected to report healthy numbers in Q3FY20E courtesy recovery in sales volume and
benign raw material prices. Total dispatches in Q3FY20E came in at 4.4 lakh units, up
2.0% YoY, the volumes however are tilted in favour of PC segment. ASP's for the
quarter are expected to improve on account of wide acceptance of BS-VI variants.
Total operating income in Q3FY20E is expected at | 22,346 crore, up 13.6% YoY.
EBITDA for the quarter is expected at | 2,896 crore with corresponding EBITDA margins
at 13.0%, up 320 bps YoY. Consequent PAT is expected at | 2047 crore, up 37.5% YoY.
PAT growth both YoY as well as QoQ exceeds 30% courtesy low margins (9.8% in
Q3FY19 & 9.5% in Q2FY20)
Tata Motors
Tata Motors is expected to report stable performance in Q3FY20E with sequential
growth in volumes and benign raw material costs. Sustainability of margins at JLR will
be the key monitorable for the quarter. Domestic sales volume (MHCV + PV) declined
25% YoY to 1.3 lakh units while JLR volumes are expected at 1.43 lakh units, up 1.3%
YoY. Jaguar to Land Rover mix is expected to be stable at 26:74. Consequent
consolidated net sales is expected at | 75,252 crore, down 2.3% YoY. EBITDA in
Q3FY20E is expected at | 9,380 crore with corresponding EBITDA margins at 12.5%
(down 10 bps QoQ and up 320 bps YoY). Consolidated PAT is expected at | 767 crore
as against substantial loss in base quarter i.e. Q3FY19 (courtesy impairment charge)
Source: Company, ICICI Direct Research

ICICI Securities | Retail Research 11
ICICI Direct Research
Result Preview Q3FY20E
Exhibit 14: Company Specific views – Ancillaries
Company Remarks
Apollo Tyres
(APL)
We expect consolidated revenues to dip 6.4% YoY to | 4,414 crore, tracking persistent
weakness in the domestic OEM space on the PV and CV side. during Q3FY20.
However, soft rubber prices on the back of muted demand scenario is seen aiding
gross margins, with the benefit expected to be countered by negative operating
leverage. Consolidated EBITDA margins are expected to contract 10 bps QoQ to 10.7%,
Consequent consolidated PAT is expected at | 98.6 crore.
Bharat Forge
(BFL)
Total operating income is expected to drop 18% YoY to | 1,390 given weakness in most
of the company's core business segments, viz. domestic CV, global CV and Oil & Gas.
Revenues from India are seen declining 25% YoY to | 505 crore while revenues from
outside India are expected to drop 14% YoY to | 844 crore. The company is expected to
benefit from benign steel prices during the quarter, with the associated gross margin
uptick seen counteracting negative operating leverage, leading to 140 bps QoQ EBITDA
margin expansion to 26.9%. Consequent PAT is expected to fall 30% YoY to | 216 crore
Exide Industries
(EIL)
Topline is seen growing by 11.4% YoY to | 2,783 crore, supported by healthy
replacement demand and rise in ASPs on account of spurt in lead prices (delayed pass
through of ~7.6% QoQ rise during Q2FY20). However, the same would have a negative
impact on gross margins. Additionally, limited operating leverage due to continued
weak OEM sales are seen hurting EBITDA margins, which we expect to dip by 10 bps
QoQ to 14.0%. Consequent PAT in Q3FY20 is expected at | 227 crore, up 46% YoY,
courtesy low margins (12.5%) in the base quarter and increase in blended realisations
on YoY basis
Source: Company, ICICI Direct Research
Bajaj Auto’s sales performance (‘000 units)
1260
1194
1247
1174
1202
25.9
14.2
1.6
(12.4)
(4.6)
-20
-15
-10
-5
0
5
10
15
20
25
30
35
40
45
950
1050
1150
1250
1350
Q3FY19
Q4FY19
Q1FY20
Q2FY20
Q3FY20
(%
)Total Sales YoY %
Maruti Suzuki’s sales performance (‘000 units)
429
421
403
338
437
7.7
(0.4)
(17.8)
(30.2)
2.0
-35
-28
-21
-14
-7
0
7
14
21
28
35
300
350
400
450
500
Q3FY19
Q4FY19
Q1FY20
Q2FY20
Q3FY20
(%
)
Total Sales YoY %
Hero MotoCorp’s sales performance (‘000 units)
1799
1781
1843
1691
1541
5.3
(11.0)(12.5)
(20.7)
(14.3)
-25
-20
-15
-10
-5
0
5
10
15
20
25
1200
1300
1400
1500
1600
1700
1800
1900
2000
2100
2200
Q3FY19
Q4FY19
Q1FY20
Q2FY20
Q3FY20
(%
)
Total Sales YoY %
Ashok Leyland’s sales performance (‘000 units)
44
60
40
29
31
(6.9)
0.9
(5.7)
(44.4)
(28.7)
-50
-30
-10
10
30
20
35
50
65
Q3FY19
Q4FY19
Q1FY20
Q2FY20
Q3FY20
(%
)
Total Sales YoY %
M&M’s sales performance (‘000 units)
143
175
132
120
132
11.1
5.9
(5.9)
(20.6)
(7.6)
-25
-20
-15
-10
-5
0
5
10
15
20
25
100
120
140
160
180
200
Q3FY19
Q4FY19
Q1FY20
Q2FY20
Q3FY20
(%
)
Total Sales YoY %
Eicher Motors’ sales performance (‘000 units)
194
196
184
167
183
(6.1)
(13.6)
(18.4) (20.6)
(6.0)
-35
-25
-15
-5
5
15
25
35
45
150
165
180
195
210
Q3FY19
Q4FY19
Q1FY20
Q2FY20
Q3FY20
(%
)
Total Sales YoY %
ICICI Securities | Retail Research 12
ICICI Direct Research
Result Preview Q3FY20E
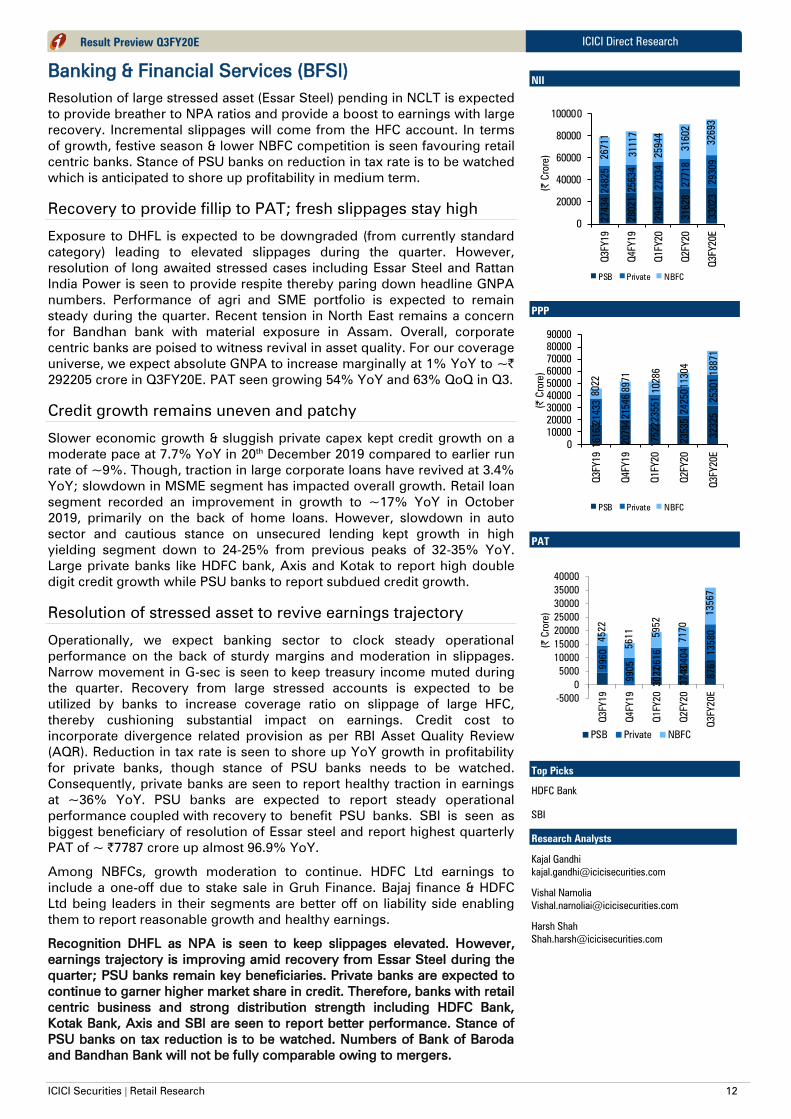
Banking & Financial Services (BFSI)
Resolution of large stressed asset (Essar Steel) pending in NCLT is expected
to provide breather to NPA ratios and provide a boost to earnings with large
recovery. Incremental slippages will come from the HFC account. In terms
of growth, festive season & lower NBFC competition is seen favouring retail
centric banks. Stance of PSU banks on reduction in tax rate is to be watched
which is anticipated to shore up profitability in medium term.
Recovery to provide fillip to PAT; fresh slippages stay high
Exposure to DHFL is expected to be downgraded (from currently standard
category) leading to elevated slippages during the quarter. However,
resolution of long awaited stressed cases including Essar Steel and Rattan
India Power is seen to provide respite thereby paring down headline GNPA
numbers. Performance of agri and SME portfolio is expected to remain
steady during the quarter. Recent tension in North East remains a concern
for Bandhan bank with material exposure in Assam. Overall, corporate
centric banks are poised to witness revival in asset quality. For our coverage
universe, we expect absolute GNPA to increase marginally at 1% YoY to ~|
292205 crore in Q3FY20E. PAT seen growing 54% YoY and 63% QoQ in Q3.
Credit growth remains uneven and patchy
Slower economic growth & sluggish private capex kept credit growth on a
moderate pace at 7.7% YoY in 20th December 2019 compared to earlier run
rate of ~9%. Though, traction in large corporate loans have revived at 3.4%
YoY; slowdown in MSME segment has impacted overall growth. Retail loan
segment recorded an improvement in growth to ~17% YoY in October
2019, primarily on the back of home loans. However, slowdown in auto
sector and cautious stance on unsecured lending kept growth in high
yielding segment down to 24-25% from previous peaks of 32-35% YoY.
Large private banks like HDFC bank, Axis and Kotak to report high double
digit credit growth while PSU banks to report subdued credit growth.
Resolution of stressed asset to revive earnings trajectory
Operationally, we expect banking sector to clock steady operational
performance on the back of sturdy margins and moderation in slippages.
Narrow movement in G-sec is seen to keep treasury income muted during
the quarter. Recovery from large stressed accounts is expected to be
utilized by banks to increase coverage ratio on slippage of large HFC,
thereby cushioning substantial impact on earnings. Credit cost to
incorporate divergence related provision as per RBI Asset Quality Review
(AQR). Reduction in tax rate is seen to shore up YoY growth in profitability
for private banks, though stance of PSU banks needs to be watched.
Consequently, private banks are seen to report healthy traction in earnings
at ~36% YoY. PSU banks are expected to report steady operational
performance coupled with recovery to benefit PSU banks. SBI is seen as
biggest beneficiary of resolution of Essar steel and report highest quarterly
PAT of ~ |7787 crore up almost 96.9% YoY.
Among NBFCs, growth moderation to continue. HDFC Ltd earnings to
include a one-off due to stake sale in Gruh Finance. Bajaj finance & HDFC
Ltd being leaders in their segments are better off on liability side enabling
them to report reasonable growth and healthy earnings.
Recognition DHFL as NPA is seen to keep slippages elevated. However,
earnings trajectory is improving amid recovery from Essar Steel during the
quarter; PSU banks remain key beneficiaries. Private banks are expected to
continue to garner higher market share in credit. Therefore, banks with retail
centric business and strong distribution strength including HDFC Bank,
Kotak Bank, Axis and SBI are seen to report better performance. Stance of
PSU banks on tax reduction is to be watched. Numbers of Bank of Baroda
and Bandhan Bank will not be fully comparable owing to mergers.
NII
27434
28021
29437
31628
33023
24825
25634
27034
27718
29309
26711
31117
25944
31602
32693
0
20000
40000
60000
80000
100000
Q3FY19
Q4FY19
Q1FY20
Q2FY20
Q3FY20E
(| C
rore)
PSB Private NBFC
PPP
16163
20794
17522
23535
32325
21433
21546
23551
24250
25301
8022
8971
10286
11304
18871
0
10000
20000
30000
40000
50000
60000
70000
80000
90000
Q3FY19
Q4FY19
Q1FY20
Q2FY20
Q3FY20E
(| C
rore)
PSB Private NBFC
PAT
3022
3748
8761
9960
9905
10616
10404 13580
4522
5611
5952
7170
13567
-5000
0
5000
10000
15000
20000
25000
30000
35000
40000
Q3FY19
Q4FY19
Q1FY20
Q2FY20
Q3FY20E
(|
Crore)
PSB Private NBFC
Top Picks
HDFC Bank
SBI
Research Analysts
Kajal Gandhi
Vishal Narnolia
Harsh Shah
Bharat Chhoda
Cheragh Sidhwa
ICICI Securities | Retail Research 13
ICICI Direct Research
Result Preview Q3FY20E
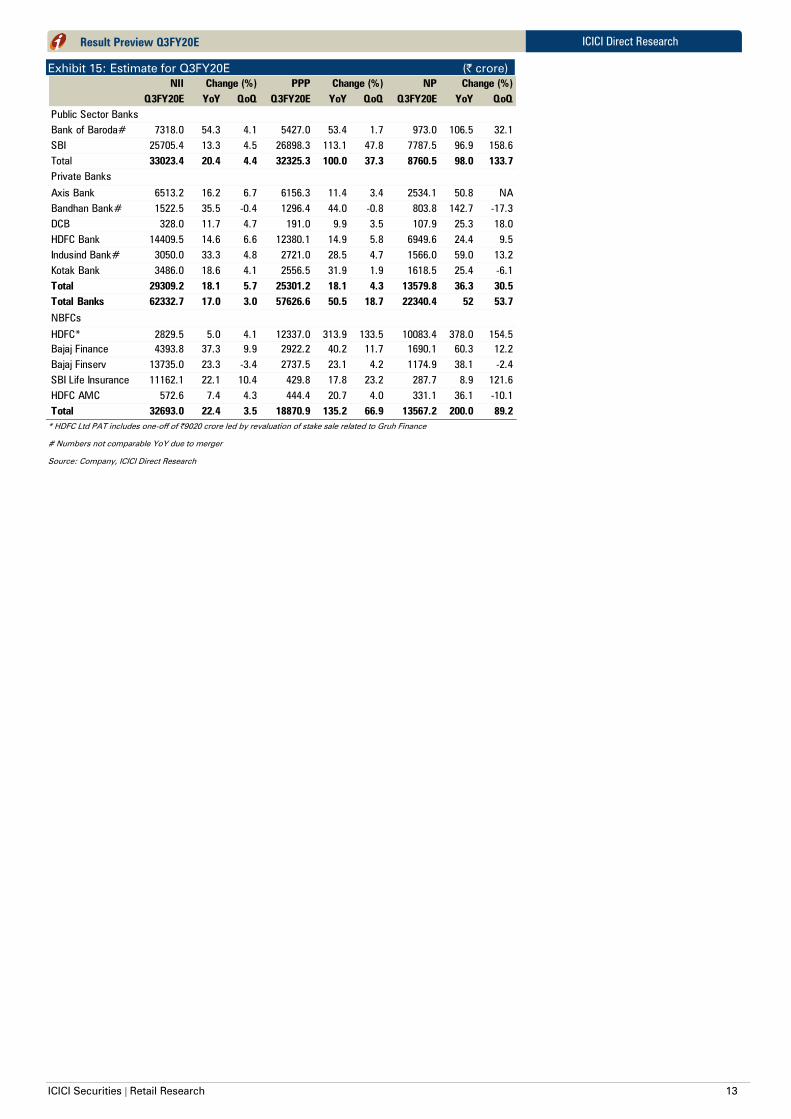
Exhibit 15: Estimate for Q3FY20E (| crore)
NII PPP NP
Q3FY20E YoY QoQ Q3FY20E YoY QoQ Q3FY20E YoY QoQ
Bank of Baroda# 7318.0 54.3 4.1 5427.0 53.4 1.7 973.0 106.5 32.1
SBI 25705.4 13.3 4.5 26898.3 113.1 47.8 7787.5 96.9 158.6
Total 33023.4 20.4 4.4 32325.3 100.0 37.3 8760.5 98.0 133.7
Axis Bank 6513.2 16.2 6.7 6156.3 11.4 3.4 2534.1 50.8 NA
Bandhan Bank# 1522.5 35.5 -0.4 1296.4 44.0 -0.8 803.8 142.7 -17.3
DCB 328.0 11.7 4.7 191.0 9.9 3.5 107.9 25.3 18.0
HDFC Bank 14409.5 14.6 6.6 12380.1 14.9 5.8 6949.6 24.4 9.5
Indusind Bank# 3050.0 33.3 4.8 2721.0 28.5 4.7 1566.0 59.0 13.2
Kotak Bank 3486.0 18.6 4.1 2556.5 31.9 1.9 1618.5 25.4 -6.1
Total 29309.2 18.1 5.7 25301.2 18.1 4.3 13579.8 36.3 30.5
Total Banks 62332.7 17.0 3.0 57626.6 50.5 18.7 22340.4 52 53.7
HDFC* 2829.5 5.0 4.1 12337.0 313.9 133.5 10083.4 378.0 154.5
Bajaj Finance 4393.8 37.3 9.9 2922.2 40.2 11.7 1690.1 60.3 12.2
Bajaj Finserv 13735.0 23.3 -3.4 2737.5 23.1 4.2 1174.9 38.1 -2.4
SBI Life Insurance 11162.1 22.1 10.4 429.8 17.8 23.2 287.7 8.9 121.6
HDFC AMC 572.6 7.4 4.3 444.4 20.7 4.0 331.1 36.1 -10.1
Total 32693.0 22.4 3.5 18870.9 135.2 66.9 13567.2 200.0 89.2
Change (%) Change (%) Change (%)
Public Sector Banks
Private Banks
NBFCs
* HDFC Ltd PAT includes one-off of |9020 crore led by revaluation of stake sale related to Gruh Finance
# Numbers not comparable YoY due to merger
Source: Company, ICICI Direct Research
ICICI Securities | Retail Research 14
ICICI Direct Research
Result Preview Q3FY20E
Company Specific Views (BFSI)
Banks
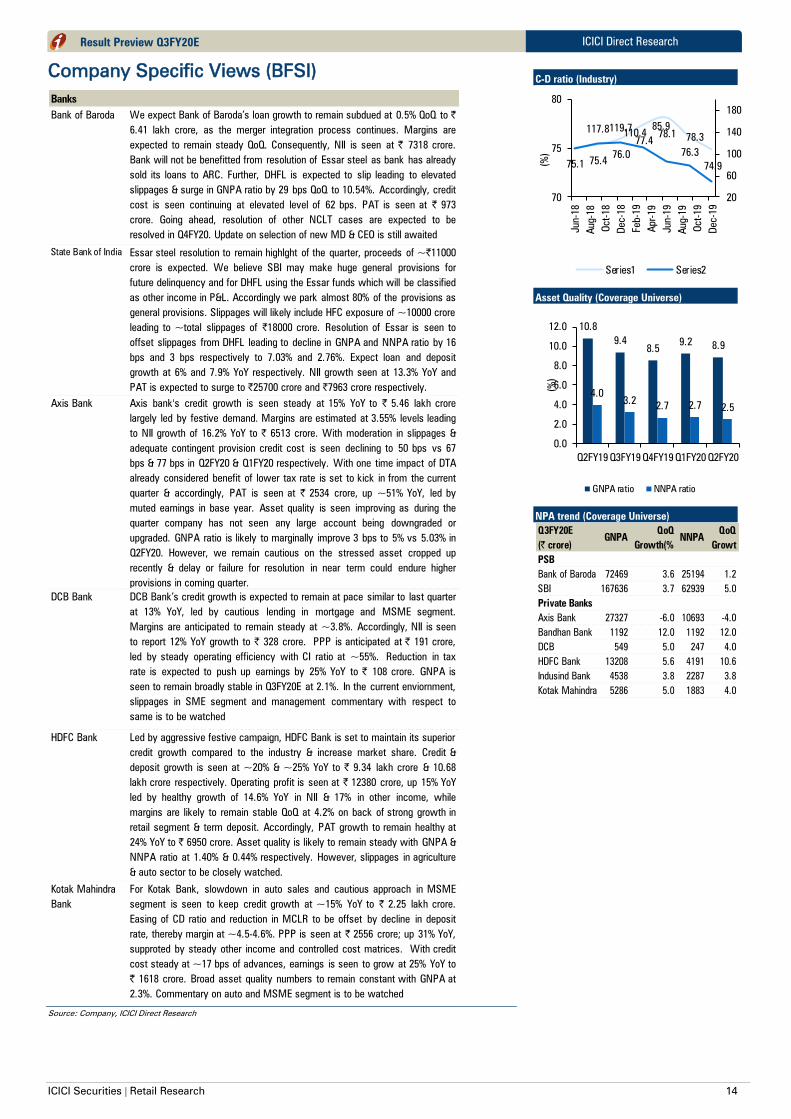
Bank of Baroda We expect Bank of Baroda’s loan growth to remain subdued at 0.5% QoQ to |
6.41 lakh crore, as the merger integration process continues. Margins are
expected to remain steady QoQ. Consequently, NII is seen at | 7318 crore.
Bank will not be benefitted from resolution of Essar steel as bank has already
sold its loans to ARC. Further, DHFL is expected to slip leading to elevated
slippages & surge in GNPA ratio by 29 bps QoQ to 10.54%. Accordingly, credit
cost is seen continuing at elevated level of 62 bps. PAT is seen at | 973
crore. Going ahead, resolution of other NCLT cases are expected to be
resolved in Q4FY20. Update on selection of new MD & CEO is still awaited
State Bank of India Essar steel resolution to remain highlght of the quarter, proceeds of ~|11000
crore is expected. We believe SBI may make huge general provisions for
future delinquency and for DHFL using the Essar funds which will be classified
as other income in P&L. Accordingly we park almost 80% of the provisions as
general provisions. Slippages will likely include HFC exposure of ~10000 crore
leading to ~total slippages of |18000 crore. Resolution of Essar is seen to
offset slippages from DHFL leading to decline in GNPA and NNPA ratio by 16
bps and 3 bps respectively to 7.03% and 2.76%. Expect loan and deposit
growth at 6% and 7.9% YoY respectively. NII growth seen at 13.3% YoY and
PAT is expected to surge to |25700 crore and |7963 crore respectively.
Axis Bank Axis bank's credit growth is seen steady at 15% YoY to | 5.46 lakh crore
largely led by festive demand. Margins are estimated at 3.55% levels leading
to NII growth of 16.2% YoY to | 6513 crore. With moderation in slippages &
adequate contingent provision credit cost is seen declining to 50 bps vs 67
bps & 77 bps in Q2FY20 & Q1FY20 respectively. With one time impact of DTA
already considered benefit of lower tax rate is set to kick in from the current
quarter & accordingly, PAT is seen at | 2534 crore, up ~51% YoY, led by
muted earnings in base year. Asset quality is seen improving as during the
quarter company has not seen any large account being downgraded or
upgraded. GNPA ratio is likely to marginally improve 3 bps to 5% vs 5.03% in
Q2FY20. However, we remain cautious on the stressed asset cropped up
recently & delay or failure for resolution in near term could endure higher
provisions in coming quarter.
DCB Bank DCB Bank’s credit growth is expected to remain at pace similar to last quarter
at 13% YoY, led by cautious lending in mortgage and MSME segment.
Margins are anticipated to remain steady at ~3.8%. Accordingly, NII is seen
to report 12% YoY growth to | 328 crore. PPP is anticipated at | 191 crore,
led by steady operating efficiency with CI ratio at ~55%. Reduction in tax
rate is expected to push up earnings by 25% YoY to | 108 crore. GNPA is
seen to remain broadly stable in Q3FY20E at 2.1%. In the current enviornment,
slippages in SME segment and management commentary with respect to
same is to be watched
HDFC Bank Led by aggressive festive campaign, HDFC Bank is set to maintain its superior
credit growth compared to the industry & increase market share. Credit &
deposit growth is seen at ~20% & ~25% YoY to | 9.34 lakh crore & 10.68
lakh crore respectively. Operating profit is seen at | 12380 crore, up 15% YoY
led by healthy growth of 14.6% YoY in NII & 17% in other income, while
margins are likely to remain stable QoQ at 4.2% on back of strong growth in
retail segment & term deposit. Accordingly, PAT growth to remain healthy at
24% YoY to | 6950 crore. Asset quality is likely to remain steady with GNPA &
NNPA ratio at 1.40% & 0.44% respectively. However, slippages in agriculture
& auto sector to be closely watched.
Kotak Mahindra
Bank
For Kotak Bank, slowdown in auto sales and cautious approach in MSME
segment is seen to keep credit growth at ~15% YoY to | 2.25 lakh crore.
Easing of CD ratio and reduction in MCLR to be offset by decline in deposit
rate, thereby margin at ~4.5-4.6%. PPP is seen at | 2556 crore; up 31% YoY,
supproted by steady other income and controlled cost matrices. With credit
cost steady at ~17 bps of advances, earnings is seen to grow at 25% YoY to
| 1618 crore. Broad asset quality numbers to remain constant with GNPA at
2.3%. Commentary on auto and MSME segment is to be watched
Source: Company, ICICI Direct Research
C-D ratio (Industry)
75.175.4
76.0
77.478.1
76.3
74.9
117.8119.7110.4
85.9
78.3
20
60
100
140
180
70
75
80
Jun-18
Aug-18
Oct-18
Dec-18
Feb-19
Apr-19
Jun-19
Aug-19
Oct-19
Dec-19
(%
)
Series1 Series2
Asset Quality (Coverage Universe)
10.8
9.4
8.59.2
8.9
4.0
3.22.7 2.7 2.5
0.0
2.0
4.0
6.0
8.0
10.0
12.0
Q2FY19 Q3FY19 Q4FY19 Q1FY20 Q2FY20
(%
)
GNPA ratio NNPA ratio
NPA trend (Coverage Universe)
Q3FY20E
(| crore)
PSB
Bank of Baroda 72469 3.6 25194 1.2
SBI 167636 3.7 62939 5.0
Private Banks
Axis Bank 27327 -6.0 10693 -4.0
Bandhan Bank 1192 12.0 1192 12.0
DCB 549 5.0 247 4.0
HDFC Bank 13208 5.6 4191 10.6
Indusind Bank 4538 3.8 2287 3.8
Kotak Mahindra Bank 5286 5.0 1883 4.0
GNPA QoQ
Growth(%
NNPAQoQ
Growt

ICICI Securities | Retail Research 15
ICICI Direct Research
Result Preview Q3FY20E
IndusInd Bank IndusInd Bank's advances growth is seen at 19.4% YoY to ~| 2.07 lakh crore,
though numbers are not comparable YoY owing to merger of Bharat Financial
Inclusion Ltd. Continued slack in the auto sales volume is likely to keep
pressure in auto segment. Contrary, owing to festive season unsecured retail
lending may witness higher traction. Owing to higher growth within retail &
MFI segment margins are likely to improve by 5 bps to 4.15% leading to 33%
YoY growth in NII to | 3050 crore. Further, healthy growth in other income is
likely to keep operational performance healthy with operating profit growth of
29% YoY & 5% QoQ to | 2721 crore. With repayment from high profile stressed
asset witnessed, pressure on asset quality & provisioning is seen subsiding
marginally. Accordingly GNPA & NNPA ratio are seen steady at 2.2% & 1.11%
respectively. Credit cost for quarter is likely to lower at 30 bps vs 37 bps in
Q2FY20. PAT growth to remain healthy at | 1566 crore
Bandhan Bank Bandhan Bank’s business traction is expected to remain healthy at ~30% YoY
to | 65679 crore. However, protest in Assam which is substantial part of MFI
AUM is seen impacting pace of overall growth & asset quality of the lender.
Robust deposit growth is expected to continue, however margins could
remain under pressure due to change in asset mix & cut in MCLR.
Accordingly, NII is seen at | 1523 crore, up 36% YoY. Asset quality could
marginally increase on back of stress in state of Assam & floods in other
state. GNPA ratio is seen rising 5 bps QoQ to 1.81% vs 1.76% in Q2FY20. This
is likely to increase credit cost on sequential basis to 32 bps compared to 23
bps in Q2FY20. Increased provisions are seen denting earnings for the quarter
as we estimate 17% QoQ decline in PAT to | 803 crore. Going ahead,
management’s commentary on stress in Assam & integration status with Gruh
are to be closely watched.
Source: Company, ICICI Direct Research
ICICI Securities | Retail Research 16
ICICI Direct Research
Result Preview Q3FY20E
NBFC
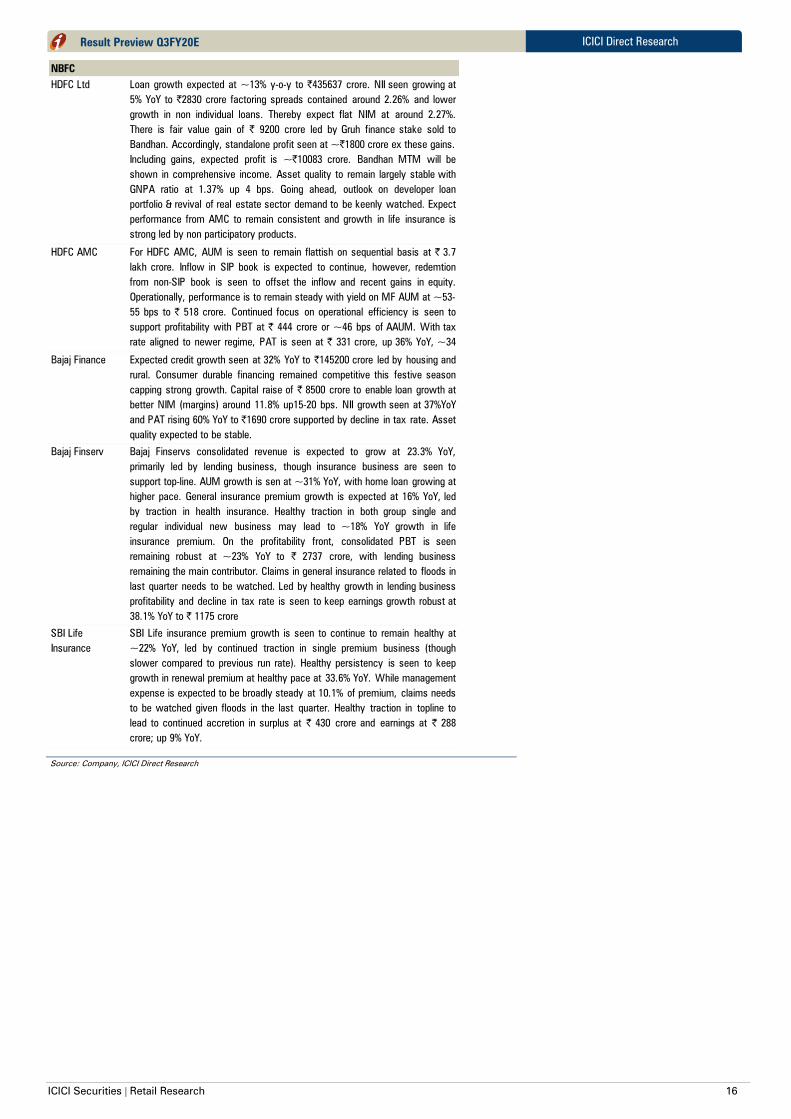
HDFC Ltd Loan growth expected at ~13% y-o-y to |435637 crore. NII seen growing at
5% YoY to |2830 crore factoring spreads contained around 2.26% and lower
growth in non individual loans. Thereby expect flat NIM at around 2.27%.
There is fair value gain of | 9200 crore led by Gruh finance stake sold to
Bandhan. Accordingly, standalone profit seen at ~|1800 crore ex these gains.
Including gains, expected profit is ~|10083 crore. Bandhan MTM will be
shown in comprehensive income. Asset quality to remain largely stable with
GNPA ratio at 1.37% up 4 bps. Going ahead, outlook on developer loan
portfolio & revival of real estate sector demand to be keenly watched. Expect
performance from AMC to remain consistent and growth in life insurance is
strong led by non participatory products.
HDFC AMC For HDFC AMC, AUM is seen to remain flattish on sequential basis at | 3.7
lakh crore. Inflow in SIP book is expected to continue, however, redemtion
from non-SIP book is seen to offset the inflow and recent gains in equity.
Operationally, performance is to remain steady with yield on MF AUM at ~53-
55 bps to | 518 crore. Continued focus on operational efficiency is seen to
support profitability with PBT at | 444 crore or ~46 bps of AAUM. With tax
rate aligned to newer regime, PAT is seen at | 331 crore, up 36% YoY, ~34
bps of AAUM. Bajaj Finance Expected credit growth seen at 32% YoY to |145200 crore led by housing and
rural. Consumer durable financing remained competitive this festive season
capping strong growth. Capital raise of | 8500 crore to enable loan growth at
better NIM (margins) around 11.8% up15-20 bps. NII growth seen at 37%YoY
and PAT rising 60% YoY to |1690 crore supported by decline in tax rate. Asset
quality expected to be stable.
Bajaj Finserv Bajaj Finservs consolidated revenue is expected to grow at 23.3% YoY,
primarily led by lending business, though insurance business are seen to
support top-line. AUM growth is sen at ~31% YoY, with home loan growing at
higher pace. General insurance premium growth is expected at 16% YoY, led
by traction in health insurance. Healthy traction in both group single and
regular individual new business may lead to ~18% YoY growth in life
insurance premium. On the profitability front, consolidated PBT is seen
remaining robust at ~23% YoY to | 2737 crore, with lending business
remaining the main contributor. Claims in general insurance related to floods in
last quarter needs to be watched. Led by healthy growth in lending business
profitability and decline in tax rate is seen to keep earnings growth robust at
38.1% YoY to | 1175 crore
SBI Life
Insurance
SBI Life insurance premium growth is seen to continue to remain healthy at
~22% YoY, led by continued traction in single premium business (though
slower compared to previous run rate). Healthy persistency is seen to keep
growth in renewal premium at healthy pace at 33.6% YoY. While management
expense is expected to be broadly steady at 10.1% of premium, claims needs
to be watched given floods in the last quarter. Healthy traction in topline to
lead to continued accretion in surplus at | 430 crore and earnings at | 288
crore; up 9% YoY.
Source: Company, ICICI Direct Research
ICICI Securities | Retail Research 17
ICICI Direct Research
Result Preview Q3FY20E
Cement
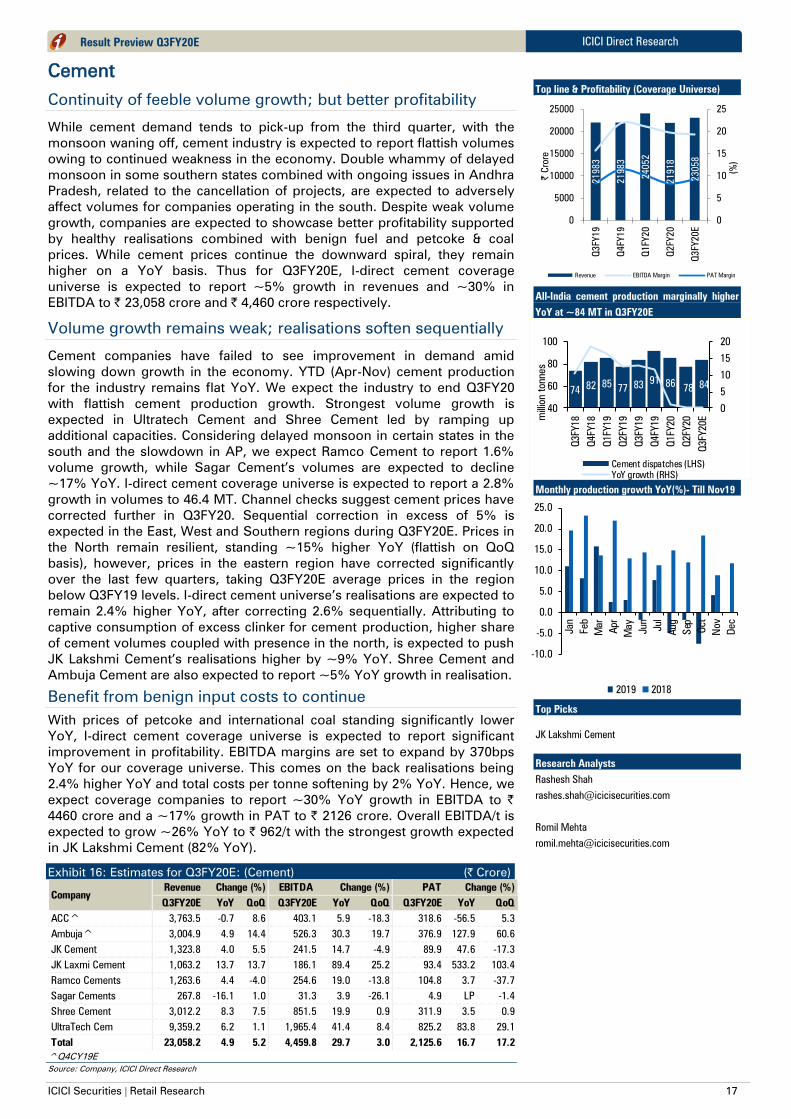
Continuity of feeble volume growth; but better profitability
While cement demand tends to pick-up from the third quarter, with the
monsoon waning off, cement industry is expected to report flattish volumes
owing to continued weakness in the economy. Double whammy of delayed
monsoon in some southern states combined with ongoing issues in Andhra
Pradesh, related to the cancellation of projects, are expected to adversely
affect volumes for companies operating in the south. Despite weak volume
growth, companies are expected to showcase better profitability supported
by healthy realisations combined with benign fuel and petcoke & coal
prices. While cement prices continue the downward spiral, they remain
higher on a YoY basis. Thus for Q3FY20E, I-direct cement coverage
universe is expected to report ~5% growth in revenues and ~30% in
EBITDA to | 23,058 crore and | 4,460 crore respectively.
Volume growth remains weak; realisations soften sequentially
Cement companies have failed to see improvement in demand amid
slowing down growth in the economy. YTD (Apr-Nov) cement production
for the industry remains flat YoY. We expect the industry to end Q3FY20
with flattish cement production growth. Strongest volume growth is
expected in Ultratech Cement and Shree Cement led by ramping up
additional capacities. Considering delayed monsoon in certain states in the
south and the slowdown in AP, we expect Ramco Cement to report 1.6%
volume growth, while Sagar Cement’s volumes are expected to decline
~17% YoY. I-direct cement coverage universe is expected to report a 2.8%
growth in volumes to 46.4 MT. Channel checks suggest cement prices have
corrected further in Q3FY20. Sequential correction in excess of 5% is
expected in the East, West and Southern regions during Q3FY20E. Prices in
the North remain resilient, standing ~15% higher YoY (flattish on QoQ
basis), however, prices in the eastern region have corrected significantly
over the last few quarters, taking Q3FY20E average prices in the region
below Q3FY19 levels. I-direct cement universe’s realisations are expected to
remain 2.4% higher YoY, after correcting 2.6% sequentially. Attributing to
captive consumption of excess clinker for cement production, higher share
of cement volumes coupled with presence in the north, is expected to push
JK Lakshmi Cement’s realisations higher by ~9% YoY. Shree Cement and
Ambuja Cement are also expected to report ~5% YoY growth in realisation.
Benefit from benign input costs to continue
With prices of petcoke and international coal standing significantly lower
YoY, I-direct cement coverage universe is expected to report significant
improvement in profitability. EBITDA margins are set to expand by 370bps
YoY for our coverage universe. This comes on the back realisations being
2.4% higher YoY and total costs per tonne softening by 2% YoY. Hence, we
expect coverage companies to report ~30% YoY growth in EBITDA to |
4460 crore and a ~17% growth in PAT to | 2126 crore. Overall EBITDA/t is
expected to grow ~26% YoY to | 962/t with the strongest growth expected
in JK Lakshmi Cement (82% YoY).
Exhibit 16: Estimates for Q3FY20E: (Cement) (| Crore)
Revenue EBITDA PAT
Q3FY20E YoY QoQ Q3FY20E YoY QoQ Q3FY20E YoY QoQ
ACC^ 3,763.5 -0.7 8.6 403.1 5.9 -18.3 318.6 -56.5 5.3
Ambuja^ 3,004.9 4.9 14.4 526.3 30.3 19.7 376.9 127.9 60.6
JK Cement 1,323.8 4.0 5.5 241.5 14.7 -4.9 89.9 47.6 -17.3
JK Laxmi Cement 1,063.2 13.7 13.7 186.1 89.4 25.2 93.4 533.2 103.4
Ramco Cements 1,263.6 4.4 -4.0 254.6 19.0 -13.8 104.8 3.7 -37.7
Sagar Cements 267.8 -16.1 1.0 31.3 3.9 -26.1 4.9 LP -1.4
Shree Cement 3,012.2 8.3 7.5 851.5 19.9 0.9 311.9 3.5 0.9
UltraTech Cem 9,359.2 6.2 1.1 1,965.4 41.4 8.4 825.2 83.8 29.1
Total 23,058.2 4.9 5.2 4,459.8 29.7 3.0 2,125.6 16.7 17.2
Change (%) Change (%) Change (%)
Company
^Q4CY19E
Source: Company, ICICI Direct Research
Top line & Profitability (Coverage Universe)
21983
21983
24052
21918
23058
0
5
10
15
20
25
0
5000
10000
15000
20000
25000
Q3FY19
Q4FY19
Q1FY20
Q2FY20
Q3FY20E
(%
)
| C
rore
Revenue EBITDA Margin PAT Margin
All-India cement production marginally higher
YoY at ~84 MT in Q3FY20E
7482 85
7783
9186
78 84
0
5
10
15
20
40
60
80
100
Q3FY18
Q4FY18
Q1FY19
Q2FY19
Q3FY19
Q4FY19
Q1FY20
Q2FY20
Q3FY20Em
illion tonnes
Cement dispatches (LHS)
YoY growth (RHS)
Monthly production growth YoY(%)- Till Nov19
-10.0
-5.0
0.0
5.0
10.0
15.0
20.0
25.0
Jan
Feb
Mar
Apr
May
Jun
Jul
Aug
Sep
Oct
Nov
Dec
2019 2018
Top Picks
JK Lakshmi Cement
Research Analysts
Rashesh Shah
Romil Mehta
ICICI Securities | Retail Research 18
ICICI Direct Research
Result Preview Q3FY20E
Company specific view
Company Remarks
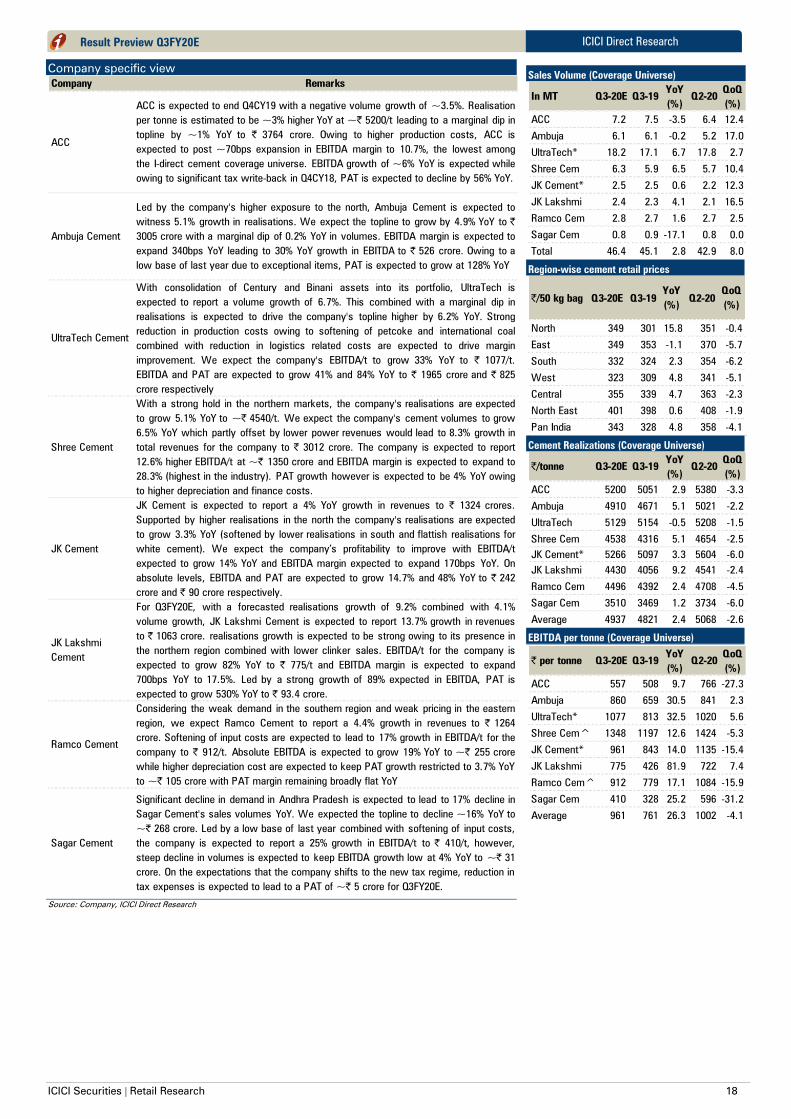
ACC
ACC is expected to end Q4CY19 with a negative volume growth of ~3.5%. Realisation
per tonne is estimated to be ~3% higher YoY at ~| 5200/t leading to a marginal dip in
topline by ~1% YoY to | 3764 crore. Owing to higher production costs, ACC is
expected to post ~70bps expansion in EBITDA margin to 10.7%, the lowest among
the I-direct cement coverage universe. EBITDA growth of ~6% YoY is expected while
owing to significant tax write-back in Q4CY18, PAT is expected to decline by 56% YoY.
Ambuja Cement
Led by the company's higher exposure to the north, Ambuja Cement is expected to
witness 5.1% growth in realisations. We expect the topline to grow by 4.9% YoY to |
3005 crore with a marginal dip of 0.2% YoY in volumes. EBITDA margin is expected to
expand 340bps YoY leading to 30% YoY growth in EBITDA to | 526 crore. Owing to a
low base of last year due to exceptional items, PAT is expected to grow at 128% YoY
UltraTech Cement
With consolidation of Century and Binani assets into its portfolio, UltraTech is
expected to report a volume growth of 6.7%. This combined with a marginal dip in
realisations is expected to drive the company's topline higher by 6.2% YoY. Strong
reduction in production costs owing to softening of petcoke and international coal
combined with reduction in logistics related costs are expected to drive margin
improvement. We expect the company's EBITDA/t to grow 33% YoY to | 1077/t.
EBITDA and PAT are expected to grow 41% and 84% YoY to | 1965 crore and | 825
crore respectively
Shree Cement
With a strong hold in the northern markets, the company's realisations are expected
to grow 5.1% YoY to ~| 4540/t. We expect the company's cement volumes to grow
6.5% YoY which partly offset by lower power revenues would lead to 8.3% growth in
total revenues for the company to | 3012 crore. The company is expected to report
12.6% higher EBITDA/t at ~| 1350 crore and EBITDA margin is expected to expand to
28.3% (highest in the industry). PAT growth however is expected to be 4% YoY owing
to higher depreciation and finance costs.
JK Cement
JK Cement is expected to report a 4% YoY growth in revenues to | 1324 crores.
Supported by higher realisations in the north the company's realisations are expected
to grow 3.3% YoY (softened by lower realisations in south and flattish realisations for
white cement). We expect the company’s profitability to improve with EBITDA/t
expected to grow 14% YoY and EBITDA margin expected to expand 170bps YoY. On
absolute levels, EBITDA and PAT are expected to grow 14.7% and 48% YoY to | 242
crore and | 90 crore respectively.
JK Lakshmi
Cement
For Q3FY20E, with a forecasted realisations growth of 9.2% combined with 4.1%
volume growth, JK Lakshmi Cement is expected to report 13.7% growth in revenues
to | 1063 crore. realisations growth is expected to be strong owing to its presence in
the northern region combined with lower clinker sales. EBITDA/t for the company is
expected to grow 82% YoY to | 775/t and EBITDA margin is expected to expand
700bps YoY to 17.5%. Led by a strong growth of 89% expected in EBITDA, PAT is
expected to grow 530% YoY to | 93.4 crore.
Ramco Cement
Considering the weak demand in the southern region and weak pricing in the eastern
region, we expect Ramco Cement to report a 4.4% growth in revenues to | 1264
crore. Softening of input costs are expected to lead to 17% growth in EBITDA/t for the
company to | 912/t. Absolute EBITDA is expected to grow 19% YoY to ~| 255 crore
while higher depreciation cost are expected to keep PAT growth restricted to 3.7% YoY
to ~| 105 crore with PAT margin remaining broadly flat YoY
Sagar Cement
Significant decline in demand in Andhra Pradesh is expected to lead to 17% decline in
Sagar Cement's sales volumes YoY. We expected the topline to decline ~16% YoY to
~| 268 crore. Led by a low base of last year combined with softening of input costs,
the company is expected to report a 25% growth in EBITDA/t to | 410/t, however,
steep decline in volumes is expected to keep EBITDA growth low at 4% YoY to ~| 31
crore. On the expectations that the company shifts to the new tax regime, reduction in
tax expenses is expected to lead to a PAT of ~| 5 crore for Q3FY20E.
Source: Company, ICICI Direct Research
Sales Volume (Coverage Universe)
In MT Q3-20E Q3-19YoY
(%)
Q2-20QoQ
(%)
ACC 7.2 7.5 -3.5 6.4 12.4
Ambuja 6.1 6.1 -0.2 5.2 17.0
UltraTech* 18.2 17.1 6.7 17.8 2.7
Shree Cem 6.3 5.9 6.5 5.7 10.4
JK Cement* 2.5 2.5 0.6 2.2 12.3
JK Lakshmi 2.4 2.3 4.1 2.1 16.5
Ramco Cem 2.8 2.7 1.6 2.7 2.5
Sagar Cem 0.8 0.9 -17.1 0.8 0.0
Total 46.4 45.1 2.8 42.9 8.0
Region-wise cement retail prices
|/50 kg bag Q3-20E Q3-19
YoY
(%)Q2-20
QoQ
(%)
North 349 301 15.8 351 -0.4
East 349 353 -1.1 370 -5.7
South 332 324 2.3 354 -6.2
West 323 309 4.8 341 -5.1
Central 355 339 4.7 363 -2.3
North East 401 398 0.6 408 -1.9
Pan India 343 328 4.8 358 -4.1
Cement Realizations (Coverage Universe)
|/tonne Q3-20E Q3-19YoY
(%)
Q2-20QoQ
(%)
ACC 5200 5051 2.9 5380 -3.3
Ambuja 4910 4671 5.1 5021 -2.2
UltraTech 5129 5154 -0.5 5208 -1.5
Shree Cem 4538 4316 5.1 4654 -2.5
JK Cement* 5266 5097 3.3 5604 -6.0
JK Lakshmi 4430 4056 9.2 4541 -2.4
Ramco Cem 4496 4392 2.4 4708 -4.5
Sagar Cem 3510 3469 1.2 3734 -6.0
Average 4937 4821 2.4 5068 -2.6
EBITDA per tonne (Coverage Universe)
| per tonne Q3-20E Q3-19YoY
(%)
Q2-20QoQ
(%)
ACC 557 508 9.7 766 -27.3
Ambuja 860 659 30.5 841 2.3
UltraTech* 1077 813 32.5 1020 5.6
Shree Cem^ 1348 1197 12.6 1424 -5.3
JK Cement* 961 843 14.0 1135 -15.4
JK Lakshmi 775 426 81.9 722 7.4
Ramco Cem^ 912 779 17.1 1084 -15.9
Sagar Cem 410 328 25.2 596 -31.2
Average 961 761 26.3 1002 -4.1
ICICI Securities | Retail Research 19
ICICI Direct Research
Result Preview Q3FY20E
Capital Goods and Power
Capital Goods:
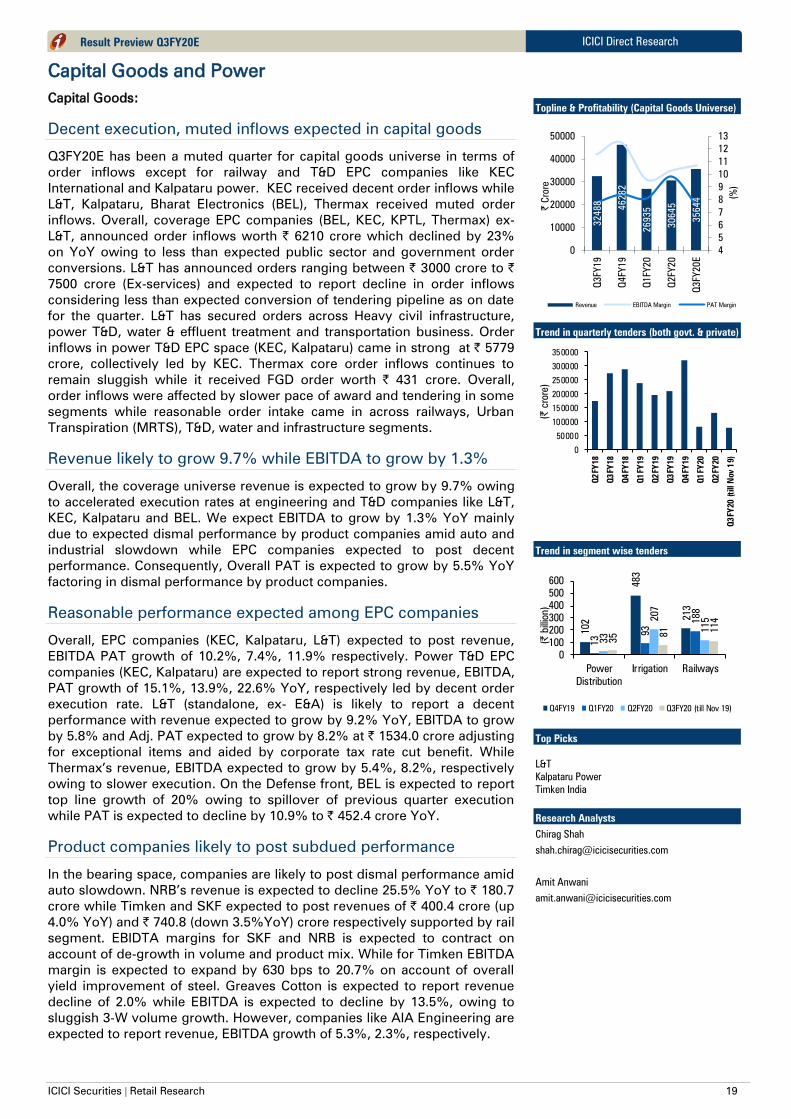
Decent execution, muted inflows expected in capital goods
Q3FY20E has been a muted quarter for capital goods universe in terms of
order inflows except for railway and T&D EPC companies like KEC
International and Kalpataru power. KEC received decent order inflows while
L&T, Kalpataru, Bharat Electronics (BEL), Thermax received muted order
inflows. Overall, coverage EPC companies (BEL, KEC, KPTL, Thermax) ex-
L&T, announced order inflows worth | 6210 crore which declined by 23%
on YoY owing to less than expected public sector and government order
conversions. L&T has announced orders ranging between | 3000 crore to |
7500 crore (Ex-services) and expected to report decline in order inflows
considering less than expected conversion of tendering pipeline as on date
for the quarter. L&T has secured orders across Heavy civil infrastructure,
power T&D, water & effluent treatment and transportation business. Order
inflows in power T&D EPC space (KEC, Kalpataru) came in strong at | 5779
crore, collectively led by KEC. Thermax core order inflows continues to
remain sluggish while it received FGD order worth | 431 crore. Overall,
order inflows were affected by slower pace of award and tendering in some
segments while reasonable order intake came in across railways, Urban
Transpiration (MRTS), T&D, water and infrastructure segments.
Revenue likely to grow 9.7% while EBITDA to grow by 1.3%
Overall, the coverage universe revenue is expected to grow by 9.7% owing
to accelerated execution rates at engineering and T&D companies like L&T,
KEC, Kalpataru and BEL. We expect EBITDA to grow by 1.3% YoY mainly
due to expected dismal performance by product companies amid auto and
industrial slowdown while EPC companies expected to post decent
performance. Consequently, Overall PAT is expected to grow by 5.5% YoY
factoring in dismal performance by product companies.
Reasonable performance expected among EPC companies
Overall, EPC companies (KEC, Kalpataru, L&T) expected to post revenue,
EBITDA PAT growth of 10.2%, 7.4%, 11.9% respectively. Power T&D EPC
companies (KEC, Kalpataru) are expected to report strong revenue, EBITDA,
PAT growth of 15.1%, 13.9%, 22.6% YoY, respectively led by decent order
execution rate. L&T (standalone, ex- E&A) is likely to report a decent
performance with revenue expected to grow by 9.2% YoY, EBITDA to grow
by 5.8% and Adj. PAT expected to grow by 8.2% at | 1534.0 crore adjusting
for exceptional items and aided by corporate tax rate cut benefit. While
Thermax’s revenue, EBITDA expected to grow by 5.4%, 8.2%, respectively
owing to slower execution. On the Defense front, BEL is expected to report
top line growth of 20% owing to spillover of previous quarter execution
while PAT is expected to decline by 10.9% to | 452.4 crore YoY.
Product companies likely to post subdued performance
In the bearing space, companies are likely to post dismal performance amid
auto slowdown. NRB’s revenue is expected to decline 25.5% YoY to | 180.7
crore while Timken and SKF expected to post revenues of | 400.4 crore (up
4.0% YoY) and | 740.8 (down 3.5%YoY) crore respectively supported by rail
segment. EBIDTA margins for SKF and NRB is expected to contract on
account of de-growth in volume and product mix. While for Timken EBITDA
margin is expected to expand by 630 bps to 20.7% on account of overall
yield improvement of steel. Greaves Cotton is expected to report revenue
decline of 2.0% while EBITDA is expected to decline by 13.5%, owing to
sluggish 3-W volume growth. However, companies like AIA Engineering are
expected to report revenue, EBITDA growth of 5.3%, 2.3%, respectively.
Topline & Profitability (Capital Goods Universe)
32488
46282
26935
30645
35644
4
5
6
7
8
9
10
11
12
13
0
10000
20000
30000
40000
50000
Q3FY19
Q4FY19
Q1FY20
Q2FY20
Q3FY
20
E
(%
)
| C
rore
Revenue EBITDA Margin PAT Margin
Trend in quarterly tenders (both govt. & private)
0
50000
100000
150000
200000
250000
300000
350000
Q2
FY
18
Q3
FY
18
Q4
FY
18
Q1
FY
19
Q2
FY
19
Q3
FY
19
Q4
FY
19
Q1
FY
20
Q2
FY
20
Q3
FY
20 (t
ill N
ov 1
9)
(| crore)
Trend in segment wise tenders
102
483
213
13
93
188
33
207
115
35 8
1 114
0
100
200
300
400
500
600
Power
Distribution
Irrigation Railways
(| billion)
Q4FY19 Q1FY20 Q2FY20 Q3FY20 (till Nov 19)
Top Picks
L&T
Kalpataru Power
Timken India
Research Analysts
Chirag Shah
Amit Anwani
Cheragh Sidhwa
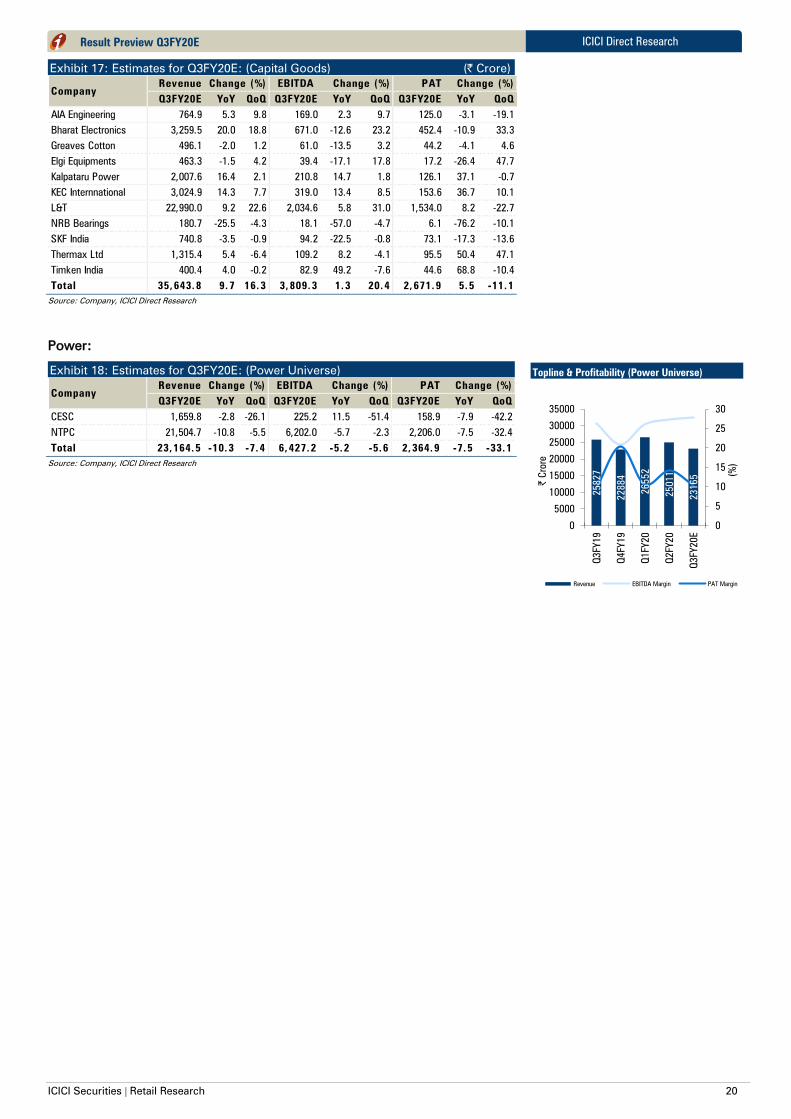
ICICI Securities | Retail Research 20
ICICI Direct Research
Result Preview Q3FY20E
Exhibit 17: Estimates for Q3FY20E: (Capital Goods) (| Crore)
Revenue EBITDA PAT
Q3FY20E YoY QoQ Q3FY20E YoY QoQ Q3FY20E YoY QoQ
AIA Engineering 764.9 5.3 9.8 169.0 2.3 9.7 125.0 -3.1 -19.1
Bharat Electronics 3,259.5 20.0 18.8 671.0 -12.6 23.2 452.4 -10.9 33.3
Greaves Cotton 496.1 -2.0 1.2 61.0 -13.5 3.2 44.2 -4.1 4.6
Elgi Equipments 463.3 -1.5 4.2 39.4 -17.1 17.8 17.2 -26.4 47.7
Kalpataru Power 2,007.6 16.4 2.1 210.8 14.7 1.8 126.1 37.1 -0.7
KEC Internnational 3,024.9 14.3 7.7 319.0 13.4 8.5 153.6 36.7 10.1
L&T 22,990.0 9.2 22.6 2,034.6 5.8 31.0 1,534.0 8.2 -22.7
NRB Bearings 180.7 -25.5 -4.3 18.1 -57.0 -4.7 6.1 -76.2 -10.1
SKF India 740.8 -3.5 -0.9 94.2 -22.5 -0.8 73.1 -17.3 -13.6
Thermax Ltd 1,315.4 5.4 -6.4 109.2 8.2 -4.1 95.5 50.4 47.1
Timken India 400.4 4.0 -0.2 82.9 49.2 -7.6 44.6 68.8 -10.4
Total 35,643.8 9.7 16.3 3,809.3 1.3 20.4 2,671.9 5.5 -11.1
Change (%)
Company
Change (%) Change (%)
Source: Company, ICICI Direct Research
Power:
Exhibit 18: Estimates for Q3FY20E: (Power Universe)
Revenue EBITDA PAT
Q3FY20E YoY QoQ Q3FY20E YoY QoQ Q3FY20E YoY QoQ
CESC 1,659.8 -2.8 -26.1 225.2 11.5 -51.4 158.9 -7.9 -42.2
NTPC 21,504.7 -10.8 -5.5 6,202.0 -5.7 -2.3 2,206.0 -7.5 -32.4
Total 23,164.5 -10.3 -7.4 6,427.2 -5.2 -5.6 2,364.9 -7.5 -33.1
Company
Change (%) Change (%) Change (%)
Source: Company, ICICI Direct Research
Topline & Profitability (Power Universe)
25827
22884
26552
25011
23165
0
5
10
15
20
25
30
0
5000
10000
15000
20000
25000
30000
35000
Q3FY19
Q4FY19
Q1FY20
Q2FY20
Q3FY20E
(%
)
| C
rore
Revenue EBITDA Margin PAT Margin
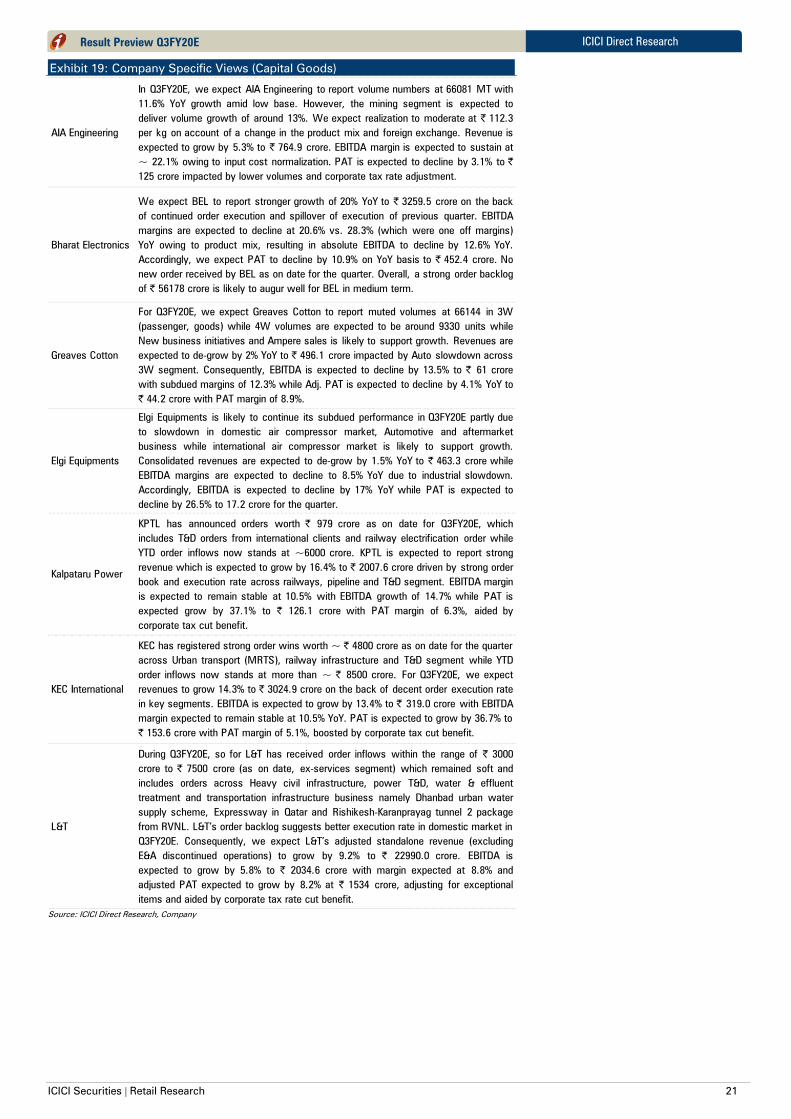
ICICI Securities | Retail Research 21
ICICI Direct Research
Result Preview Q3FY20E
Exhibit 19: Company Specific Views (Capital Goods)
AIA Engineering
In Q3FY20E, we expect AIA Engineering to report volume numbers at 66081 MT with
11.6% YoY growth amid low base. However, the mining segment is expected to
deliver volume growth of around 13%. We expect realization to moderate at | 112.3
per kg on account of a change in the product mix and foreign exchange. Revenue is
expected to grow by 5.3% to | 764.9 crore. EBITDA margin is expected to sustain at
~ 22.1% owing to input cost normalization. PAT is expected to decline by 3.1% to |
125 crore impacted by lower volumes and corporate tax rate adjustment.
Bharat Electronics
We expect BEL to report stronger growth of 20% YoY to | 3259.5 crore on the back
of continued order execution and spillover of execution of previous quarter. EBITDA
margins are expected to decline at 20.6% vs. 28.3% (which were one off margins)
YoY owing to product mix, resulting in absolute EBITDA to decline by 12.6% YoY.
Accordingly, we expect PAT to decline by 10.9% on YoY basis to | 452.4 crore. No
new order received by BEL as on date for the quarter. Overall, a strong order backlog
of | 56178 crore is likely to augur well for BEL in medium term.
Greaves Cotton
For Q3FY20E, we expect Greaves Cotton to report muted volumes at 66144 in 3W
(passenger, goods) while 4W volumes are expected to be around 9330 units while
New business initiatives and Ampere sales is likely to support growth. Revenues are
expected to de-grow by 2% YoY to | 496.1 crore impacted by Auto slowdown across
3W segment. Consequently, EBITDA is expected to decline by 13.5% to | 61 crore
with subdued margins of 12.3% while Adj. PAT is expected to decline by 4.1% YoY to
| 44.2 crore with PAT margin of 8.9%.
Elgi Equipments
Elgi Equipments is likely to continue its subdued performance in Q3FY20E partly due
to slowdown in domestic air compressor market, Automotive and aftermarket
business while international air compressor market is likely to support growth.
Consolidated revenues are expected to de-grow by 1.5% YoY to | 463.3 crore while
EBITDA margins are expected to decline to 8.5% YoY due to industrial slowdown.
Accordingly, EBITDA is expected to decline by 17% YoY while PAT is expected to
decline by 26.5% to 17.2 crore for the quarter.
Kalpataru Power
KPTL has announced orders worth | 979 crore as on date for Q3FY20E, which
includes T&D orders from international clients and railway electrification order while
YTD order inflows now stands at ~6000 crore. KPTL is expected to report strong
revenue which is expected to grow by 16.4% to | 2007.6 crore driven by strong order
book and execution rate across railways, pipeline and T&D segment. EBITDA margin
is expected to remain stable at 10.5% with EBITDA growth of 14.7% while PAT is
expected grow by 37.1% to | 126.1 crore with PAT margin of 6.3%, aided by
corporate tax cut benefit.
KEC International
KEC has registered strong order wins worth ~ | 4800 crore as on date for the quarter
across Urban transport (MRTS), railway infrastructure and T&D segment while YTD
order inflows now stands at more than ~ | 8500 crore. For Q3FY20E, we expect
revenues to grow 14.3% to | 3024.9 crore on the back of decent order execution rate
in key segments. EBITDA is expected to grow by 13.4% to | 319.0 crore with EBITDA
margin expected to remain stable at 10.5% YoY. PAT is expected to grow by 36.7% to
| 153.6 crore with PAT margin of 5.1%, boosted by corporate tax cut benefit.
L&T
During Q3FY20E, so for L&T has received order inflows within the range of | 3000
crore to | 7500 crore (as on date, ex-services segment) which remained soft and
includes orders across Heavy civil infrastructure, power T&D, water & effluent
treatment and transportation infrastructure business namely Dhanbad urban water
supply scheme, Expressway in Qatar and Rishikesh-Karanprayag tunnel 2 package
from RVNL. L&T’s order backlog suggests better execution rate in domestic market in
Q3FY20E. Consequently, we expect L&T’s adjusted standalone revenue (excluding
E&A discontinued operations) to grow by 9.2% to | 22990.0 crore. EBITDA is
expected to grow by 5.8% to | 2034.6 crore with margin expected at 8.8% and
adjusted PAT expected to grow by 8.2% at | 1534 crore, adjusting for exceptional
items and aided by corporate tax rate cut benefit.
Source: ICICI Direct Research, Company

ICICI Securities | Retail Research 22
ICICI Direct Research
Result Preview Q3FY20E
Exhibit 20: Company Specific Views (Capital Goods) Continued...
NRB Bearings
For Q3FY20E, we expect NRB to post dismal performance with revenues expected at
| 180.7 crore, down 25.5% YoY as the auto sector (which contributes ~ 70% to
NRB's topline) blues continued in the third quarter. Given the declining topline led by
volume de-growth, we expect negative operating leverage to contract EBIDTA
margins by 730 bps YoY, with an EBIDTA margin of 10% for the quarter. We expect
absolute EBIDTA and PAT at | 18.1 crore and | 6.1 crore respectively.
SKF India
For Q3FY20E, SKF is expected to report revenue at | 740.8 crore, down -3.5% YoY on
account of slowdown in Industrial and auto sector. However, we expect industrials
(gearbox etc) and exports should cushion the topline. On the margin front, we expect
EBIDTA margin to contract by 310 bps to 12.7% on the back of increased share of
traded goods in the overall product mix. We expect absolute EBIDTA and PAT to
come in at | 94.2 crore and | 73.1 crore respectively.
Thermax
For Q3FY20E, Thermax received order worth | 431 crore for FGD systems. In terms of
financial performance, we expect revenues to grow by 5.4% to | 1315.4 crore on the
back of moderation in execution rate due to muted order backlog which remains a
key concern. We expect EBITDA to grow by 8.2% to | 109.2 crore with EBITDA
margins expected to marginally improve to 8.3% YoY. PBT (before exceptional items)
is expected to grow by 11% while adjusted PAT is expected to grow by 50.4% to|
95.5 crore with PAT margin of 7.3% also aided by corporate tax rate cut benefit and
high tax base in Q3FY19.
Timken India
Timken India is expected to report a modest performance amid the slowdown in auto
segment on account of strong traction from Railways and Exports. For Q3FY20E, we
expect revenues to grow 4% YoY to | 400.4 crore. On the margin front we expect
EBIDTA margin at 20.7% expanding 630 bps on account of shift towards localization
and improvement in the overall yield of steel. We expect absolute EBIDTA and PAT to
come in at | 82.9 crore and | 44.6 crore respectively.
Source: Company, ICICI Direct Research
Exhibit 21: Company Specific Views: (Power)
NTPC
During Q3FY20E, the company has installed capacity to the tune of 1050 MW and is well
on track to achieve target of 5000 MW of capacity addition in FY20E. However, on
account of economic slowdown, better hydro generation and LC payment mechanisms
issues for SEB's has hurt the operational performance for Q3FY20E. We expect NTPC to
post a YoY decline in gross generation to the tune of 13.5% at 60.65 billion units while
energy sold is likely to decline 13.4% to the tune of 56.6 billion units (BUs). Tariff/KwHr
for Q3FY20E is expected at | 3.8/KwHr. Hence, revenues and PAT are expected at
|21504.7 crore (down 10.8% YoY) and | 2206 crore, respectively. Improvement in under
recovery on account of fuel costs will be a key monitarable.
CESC
CESC is expected to report weak Q3FY20E results on back of lower generation in the
base business. We expect gross generation in its standalone operations to decline
10.5% at 122.1 crore units. However, energy sold is likely to decline at a lower pace of
2.9% YoY at 222.8 crore units on back of higher power purchased. We built in tariff of |
7.45/KwHr. Standalone revenues are expected to decline 2.8% YoY to |1659.8 crore. PAT
is expected at |158.9 crore on the back of weak operational performance.
Source: Company, ICICI Direct Research
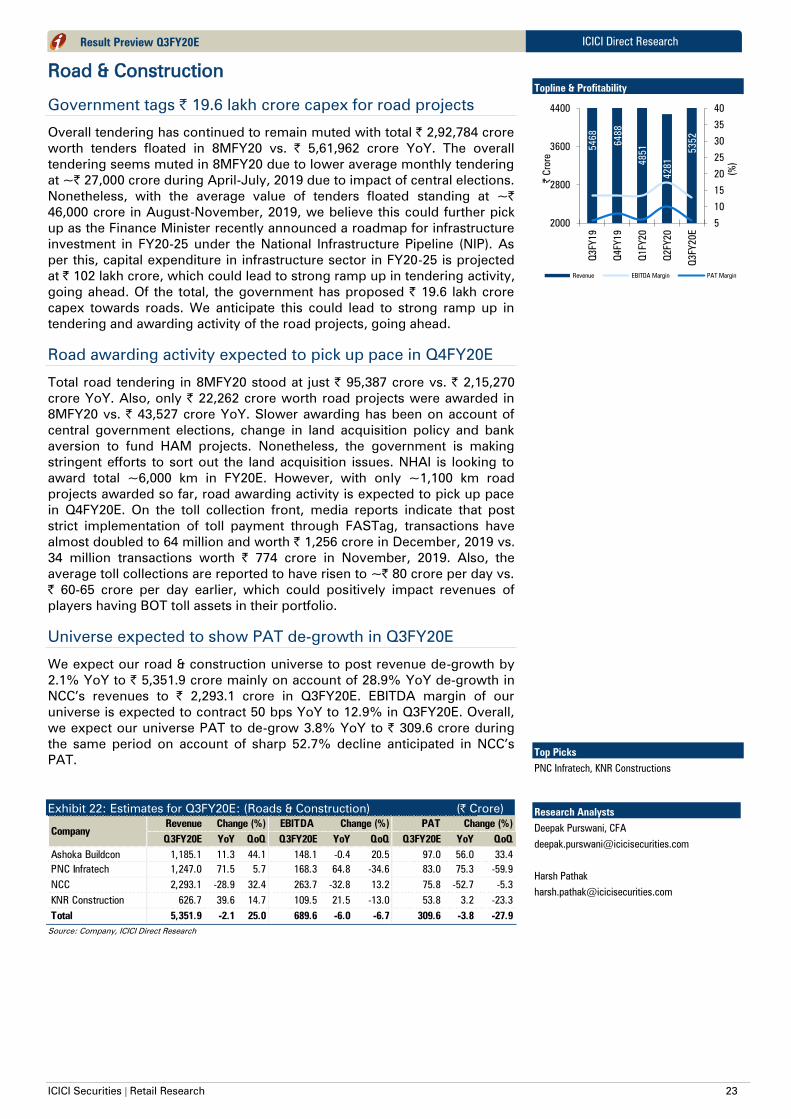
ICICI Securities | Retail Research 23
ICICI Direct Research
Result Preview Q3FY20E
Road & Construction
Government tags | 19.6 lakh crore capex for road projects
Overall tendering has continued to remain muted with total | 2,92,784 crore
worth tenders floated in 8MFY20 vs. | 5,61,962 crore YoY. The overall
tendering seems muted in 8MFY20 due to lower average monthly tendering
at ~| 27,000 crore during April-July, 2019 due to impact of central elections.
Nonetheless, with the average value of tenders floated standing at ~|
46,000 crore in August-November, 2019, we believe this could further pick
up as the Finance Minister recently announced a roadmap for infrastructure
investment in FY20-25 under the National Infrastructure Pipeline (NIP). As
per this, capital expenditure in infrastructure sector in FY20-25 is projected
at | 102 lakh crore, which could lead to strong ramp up in tendering activity,
going ahead. Of the total, the government has proposed | 19.6 lakh crore
capex towards roads. We anticipate this could lead to strong ramp up in
tendering and awarding activity of the road projects, going ahead.
Road awarding activity expected to pick up pace in Q4FY20E
Total road tendering in 8MFY20 stood at just | 95,387 crore vs. | 2,15,270
crore YoY. Also, only | 22,262 crore worth road projects were awarded in
8MFY20 vs. | 43,527 crore YoY. Slower awarding has been on account of
central government elections, change in land acquisition policy and bank
aversion to fund HAM projects. Nonetheless, the government is making
stringent efforts to sort out the land acquisition issues. NHAI is looking to
award total ~6,000 km in FY20E. However, with only ~1,100 km road
projects awarded so far, road awarding activity is expected to pick up pace
in Q4FY20E. On the toll collection front, media reports indicate that post
strict implementation of toll payment through FASTag, transactions have
almost doubled to 64 million and worth | 1,256 crore in December, 2019 vs.
34 million transactions worth | 774 crore in November, 2019. Also, the
average toll collections are reported to have risen to ~| 80 crore per day vs.
| 60-65 crore per day earlier, which could positively impact revenues of
players having BOT toll assets in their portfolio.
Universe expected to show PAT de-growth in Q3FY20E
We expect our road & construction universe to post revenue de-growth by
2.1% YoY to | 5,351.9 crore mainly on account of 28.9% YoY de-growth in
NCC’s revenues to | 2,293.1 crore in Q3FY20E. EBITDA margin of our
universe is expected to contract 50 bps YoY to 12.9% in Q3FY20E. Overall,
we expect our universe PAT to de-grow 3.8% YoY to | 309.6 crore during
the same period on account of sharp 52.7% decline anticipated in NCC’s
PAT.
Exhibit 22: Estimates for Q3FY20E: (Roads & Construction) (| Crore)
Revenue EBITDA PAT
Q3FY20E YoY QoQ Q3FY20E YoY QoQ Q3FY20E YoY QoQ
Ashoka Buildcon 1,185.1 11.3 44.1 148.1 -0.4 20.5 97.0 56.0 33.4
PNC Infratech 1,247.0 71.5 5.7 168.3 64.8 -34.6 83.0 75.3 -59.9
NCC 2,293.1 -28.9 32.4 263.7 -32.8 13.2 75.8 -52.7 -5.3
KNR Construction 626.7 39.6 14.7 109.5 21.5 -13.0 53.8 3.2 -23.3
Total 5,351.9 -2.1 25.0 689.6 -6.0 -6.7 309.6 -3.8 -27.9
Change (%)
Company
Change (%) Change (%)
Source: Company, ICICI Direct Research
Topline & Profitability
5468
6488
4851
4281
5352
5
10
15
20
25
30
35
40
2000
2800
3600
4400
Q3FY19
Q4FY19
Q1FY20
Q2FY20
Q3FY
20
E
(%
)
| C
rore
Revenue EBITDA Margin PAT Margin
Top Picks
PNC Infratech, KNR Constructions
Research Analysts
Deepak Purswani, CFA
Harsh Pathak
Bharat Chhoda
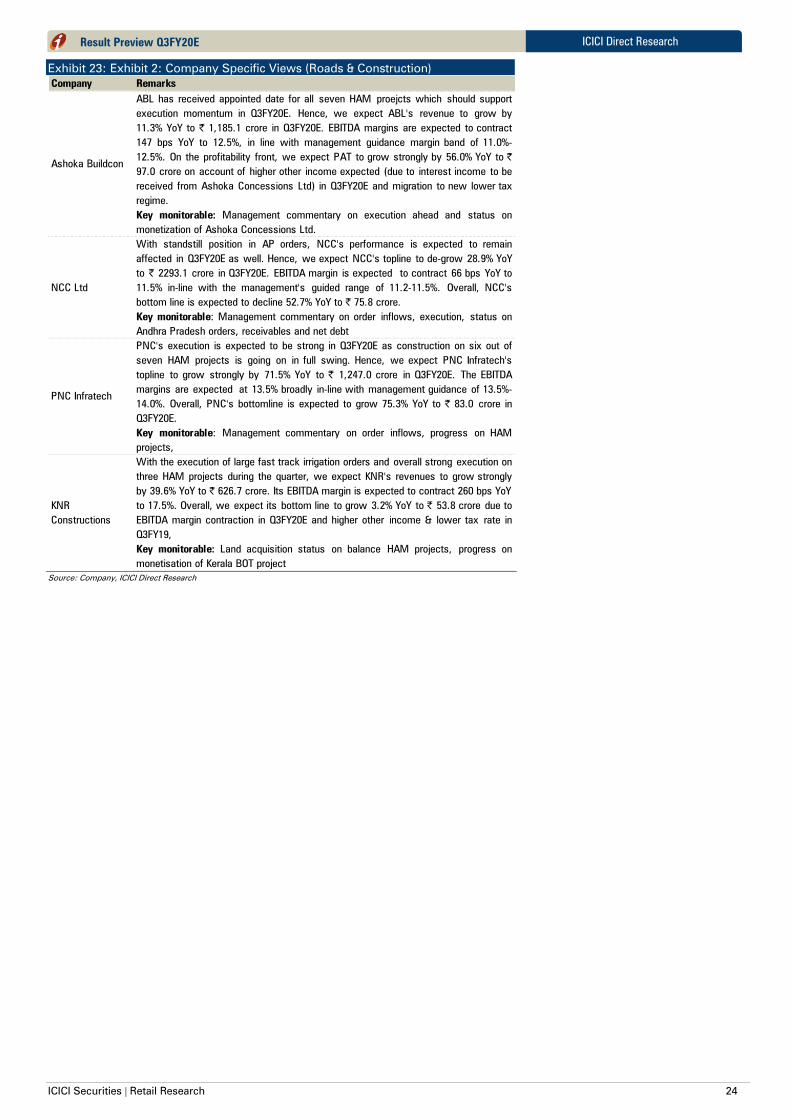
ICICI Securities | Retail Research 24
ICICI Direct Research
Result Preview Q3FY20E
Exhibit 23: Exhibit 2: Company Specific Views (Roads & Construction)
Company Remarks
Ashoka Buildcon
ABL has received appointed date for all seven HAM proejcts which should support
execution momentum in Q3FY20E. Hence, we expect ABL's revenue to grow by
11.3% YoY to | 1,185.1 crore in Q3FY20E. EBITDA margins are expected to contract
147 bps YoY to 12.5%, in line with management guidance margin band of 11.0%-
12.5%. On the profitability front, we expect PAT to grow strongly by 56.0% YoY to |
97.0 crore on account of higher other income expected (due to interest income to be
received from Ashoka Concessions Ltd) in Q3FY20E and migration to new lower tax
regime.
Key monitorable: Management commentary on execution ahead and status on
monetization of Ashoka Concessions Ltd.
NCC Ltd
With standstill position in AP orders, NCC's performance is expected to remain
affected in Q3FY20E as well. Hence, we expect NCC's topline to de-grow 28.9% YoY
to | 2293.1 crore in Q3FY20E. EBITDA margin is expected to contract 66 bps YoY to
11.5% in-line with the management's guided range of 11.2-11.5%. Overall, NCC's
bottom line is expected to decline 52.7% YoY to | 75.8 crore.
Key monitorable: Management commentary on order inflows, execution, status on
Andhra Pradesh orders, receivables and net debt
PNC Infratech
PNC's execution is expected to be strong in Q3FY20E as construction on six out of
seven HAM projects is going on in full swing. Hence, we expect PNC Infratech's
topline to grow strongly by 71.5% YoY to | 1,247.0 crore in Q3FY20E. The EBITDA
margins are expected at 13.5% broadly in-line with management guidance of 13.5%-
14.0%. Overall, PNC's bottomline is expected to grow 75.3% YoY to | 83.0 crore in
Q3FY20E.
Key monitorable: Management commentary on order inflows, progress on HAM
projects,
KNR
Constructions
With the execution of large fast track irrigation orders and overall strong execution on
three HAM projects during the quarter, we expect KNR's revenues to grow strongly
by 39.6% YoY to | 626.7 crore. Its EBITDA margin is expected to contract 260 bps YoY
to 17.5%. Overall, we expect its bottom line to grow 3.2% YoY to | 53.8 crore due to
EBITDA margin contraction in Q3FY20E and higher other income & lower tax rate in
Q3FY19,
Key monitorable: Land acquisition status on balance HAM projects, progress on
monetisation of Kerala BOT project
Source: Company, ICICI Direct Research

ICICI Securities | Retail Research 25
ICICI Direct Research
Result Preview Q3FY20E
Consumer Discretionary
Volume growth to drive revenue in Q3FY20E
We model revenue growth of ~7% YoY for our discretionary universe, led
by volume growth of ~10% in Q3FY20. Paint companies likely to record
volume growth of ~10% YoY led by ~11% YoY growth in the decorative
segment, while industrial category performance likely to remain tepid. Our
channel check suggests paint companies have passed on benefit of low raw
material prices to the extent of 3% to its dealers during Q3FY20E. On the
piping front, we believe though the volume growth likely to remain higher at
11%-12% the value growth would be largely impacted by decline in PVC
prices by 7% during Q3FY20. However, the CPVC prices remained firm
during Q3FY20. Besides, under the electrical goods segments while Q3
happens to be a lean period the major growth has been driven by new
launches and water heater product categories.
Lower raw material prices to benefit paints and adhesive
segment
We believe paints and adhesive companies likely to witnessed gross margin
expansion in the range of 100 bps to 300 bps YoY as TiO2 and VAM prices
declined by 7% and 18% YoY in Q3FY20. However, higher employee cost
and other expenses during Q3FY20 would restrict any sharp expansion in
EBITDA margin for Asian Paints and Pidilite Industries during the same
period. Further, drop in PVC prices by 7% during Q3FY20E is likely to result
in flattish gross margin for Supreme Industries, whereas higher CPVC prices
(due to anti-dumping duty by government) would result expansion in gross
margin by 300 bps YoY for Astral Poly. On the electrical goods front, we
believe Havells EBITDA margin to decline by 70 bps YoY to 11% due to
lower utilisation of industrial products, while Voltas to report increase in
EBITDA margin by 60 bps YoY to 8.4% largely on account of better
profitability in the UCP segment.
PAT to grow at 18% YoY
Despite a flattish EBITDA margin, our coverage universe likely to post
bottom-line growth of 18% YoY by supported by recent cut in corporate tax
rate (tax reduced from ~33% to ~25%). We believe, Astral poly and Kansai
Nerolac likely to report PAT growth of 28% each supported by EBITDA
margin expansion and low base of last year.
Exhibit 24: Estimates for Q3FY20E: (Consumer Discretionary) (| crore)
Revenue EBITDA PAT
Q3FY20E YoY QoQ Q3FY20E YoY QoQ Q3FY20E YoY QoQ
Asian Paints 5,806.3 9.7 15.0 1,166.1 11.8 22.1 779.2 20.4 -7.5
Astral Poly Technik 716.2 13.0 5.6 120.3 28.5 1.1 65.5 23.3 -20.5
Havells 2,674.9 6.2 19.9 294.2 -0.1 25.7 201.0 2.7 10.8
Kansai Nerolac 1,415.4 5.3 13.8 215.7 21.9 1.3 144.1 27.9 -25.5
Pidilite Industries 1,916.7 3.7 6.1 373.9 11.0 1.5 255.1 17.0 -21.5
Supreme Industries 1,513.4 7.3 19.1 191.0 8.8 10.5 103.8 28.1 -25.6
Voltas Ltd 1,572.9 5.4 10.6 132.3 14.4 25.0 92.4 18.3 -13.9
Total 15,615.7 7.4 14.0 2,493.6 11.5 15.0 1,641.0 18.4 -12.3
Company
Change (%) Change (%)Change (%)
Source: Company, ICICI Direct Research
Topline & Profitability (Coverage Universe)
sf
14540
14931
15994
13702
15616
4
6
8
10
12
14
16
18
0
4500
9000
13500
18000
Q3FY19
Q4FY19
Q1FY20
Q2FY20
Q3FY20E
(%
)
| C
rore
Revenue EBITDA Margin PAT Margin
EBITDA Margin (%) movement
EBITDA
margin
Q3'19 Q4'19 Q1'20 Q2'20 Q3'20
Asian Paints 19.7 17.6 22.7 18.9 20.1
Kansai Nerolac 13.1 13.0 17.0 17.1 15.2
Pidilite Ind 18.2 17.0 22.0 20.4 19.5
Havells 11.7 11.7 10.2 10.5 11.0
Voltas 7.8 7.0 11.0 7.4 8.4
Supreme Ind 12.7 13.2 11.6 13.6 12.6
Astral Poly 14.8 15.4 15.3 17.5 16.8
f
Volume growth movement of paint companies
0.0
5.0
10.0
15.0
20.0
25.0
Q3FY18E
Q1FY19E
Q3FY19E
Q1FY20E
Q3FY20E
Asian Paints Kansai Nerolac
Research Analysts
Sanjay Manyal
Hitesh Taunk
Bharat Chhoda
Cheragh Sidhwa
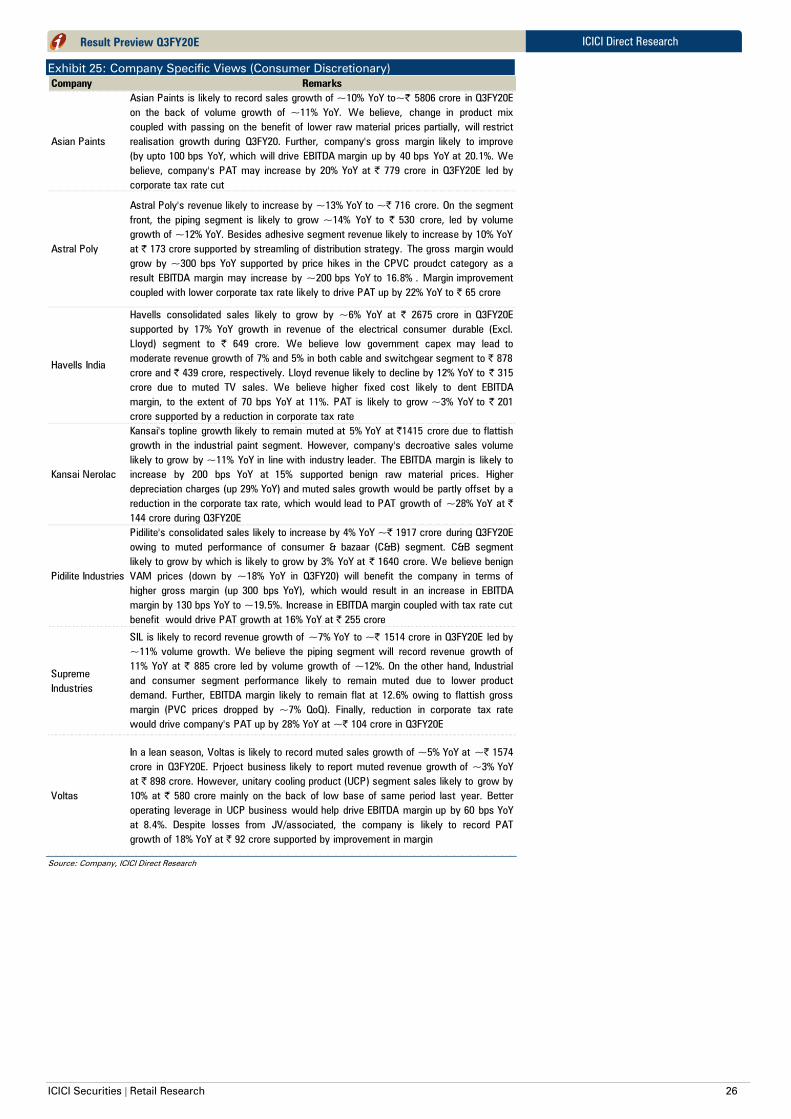
ICICI Securities | Retail Research 26
ICICI Direct Research
Result Preview Q3FY20E
Exhibit 25: Company Specific Views (Consumer Discretionary)
Company Remarks
Asian Paints
Asian Paints is likely to record sales growth of ~10% YoY to~| 5806 crore in Q3FY20E
on the back of volume growth of ~11% YoY. We believe, change in product mix
coupled with passing on the benefit of lower raw material prices partially, will restrict
realisation growth during Q3FY20. Further, company's gross margin likely to improve
(by upto 100 bps YoY, which will drive EBITDA margin up by 40 bps YoY at 20.1%. We
believe, company's PAT may increase by 20% YoY at | 779 crore in Q3FY20E led by
corporate tax rate cut
Astral Poly
Astral Poly's revenue likely to increase by ~13% YoY to ~| 716 crore. On the segment
front, the piping segment is likely to grow ~14% YoY to | 530 crore, led by volume
growth of ~12% YoY. Besides adhesive segment revenue likely to increase by 10% YoY
at | 173 crore supported by streamling of distribution strategy. The gross margin would
grow by ~300 bps YoY supported by price hikes in the CPVC proudct category as a
result EBITDA margin may increase by ~200 bps YoY to 16.8% . Margin improvement
coupled with lower corporate tax rate likely to drive PAT up by 22% YoY to | 65 crore
Havells India
Havells consolidated sales likely to grow by ~6% YoY at | 2675 crore in Q3FY20E
supported by 17% YoY growth in revenue of the electrical consumer durable (Excl.
Lloyd) segment to | 649 crore. We believe low government capex may lead to
moderate revenue growth of 7% and 5% in both cable and switchgear segment to | 878
crore and | 439 crore, respectively. Lloyd revenue likely to decline by 12% YoY to | 315
crore due to muted TV sales. We believe higher fixed cost likely to dent EBITDA
margin, to the extent of 70 bps YoY at 11%. PAT is likely to grow ~3% YoY to | 201
crore supported by a reduction in corporate tax rate
Kansai Nerolac
Kansai's topline growth likely to remain muted at 5% YoY at |1415 crore due to flattish
growth in the industrial paint segment. However, company's decroative sales volume
likely to grow by ~11% YoY in line with industry leader. The EBITDA margin is likely to
increase by 200 bps YoY at 15% supported benign raw material prices. Higher
depreciation charges (up 29% YoY) and muted sales growth would be partly offset by a
reduction in the corporate tax rate, which would lead to PAT growth of ~28% YoY at |
144 crore during Q3FY20E
Pidilite Industries
Pidilite's consolidated sales likely to increase by 4% YoY ~| 1917 crore during Q3FY20E
owing to muted performance of consumer & bazaar (C&B) segment. C&B segment
likely to grow by which is likely to grow by 3% YoY at | 1640 crore. We believe benign
VAM prices (down by ~18% YoY in Q3FY20) will benefit the company in terms of
higher gross margin (up 300 bps YoY), which would result in an increase in EBITDA
margin by 130 bps YoY to ~19.5%. Increase in EBITDA margin coupled with tax rate cut
benefit would drive PAT growth at 16% YoY at | 255 crore
Supreme
Industries
SIL is likely to record revenue growth of ~7% YoY to ~| 1514 crore in Q3FY20E led by
~11% volume growth. We believe the piping segment will record revenue growth of
11% YoY at | 885 crore led by volume growth of ~12%. On the other hand, Industrial
and consumer segment performance likely to remain muted due to lower product
demand. Further, EBITDA margin likely to remain flat at 12.6% owing to flattish gross
margin (PVC prices dropped by ~7% QoQ). Finally, reduction in corporate tax rate
would drive company's PAT up by 28% YoY at ~| 104 crore in Q3FY20E
Voltas
In a lean season, Voltas is likely to record muted sales growth of ~5% YoY at ~| 1574
crore in Q3FY20E. Prjoect business likely to report muted revenue growth of ~3% YoY
at | 898 crore. However, unitary cooling product (UCP) segment sales likely to grow by
10% at | 580 crore mainly on the back of low base of same period last year. Better
operating leverage in UCP business would help drive EBITDA margin up by 60 bps YoY
at 8.4%. Despite losses from JV/associated, the company is likely to record PAT
growth of 18% YoY at | 92 crore supported by improvement in margin
Source: Company, ICICI Direct Research
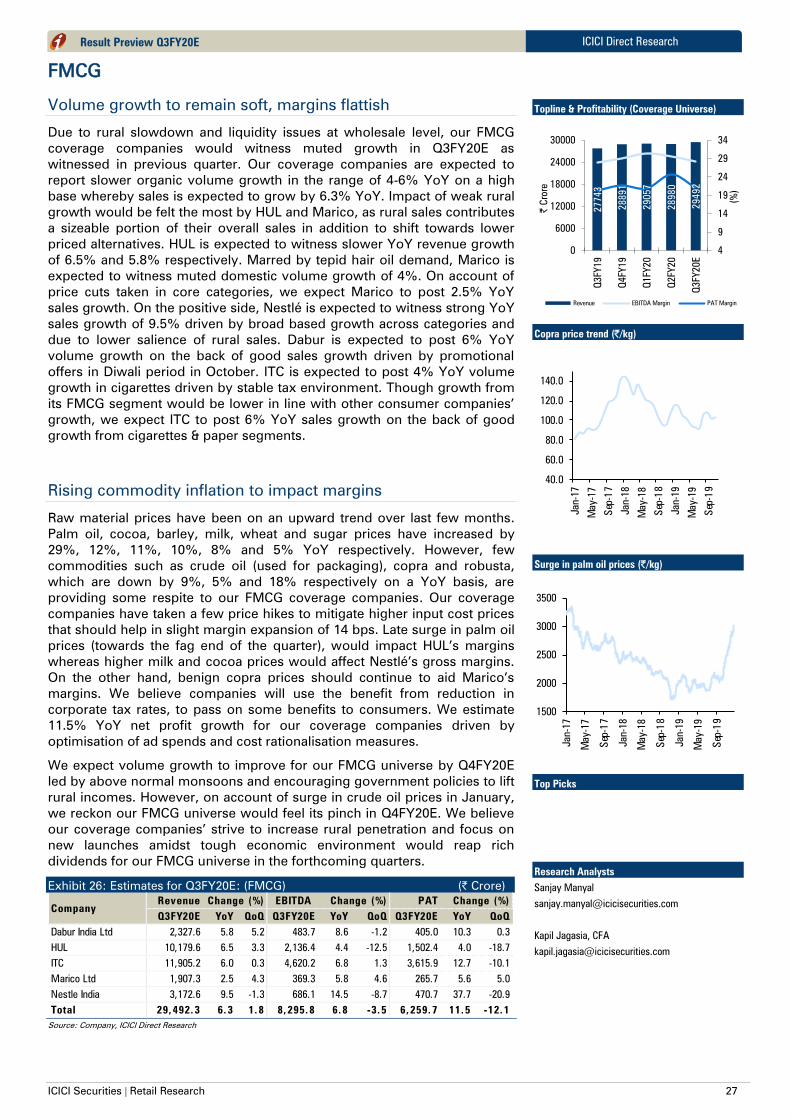
ICICI Securities | Retail Research 27
ICICI Direct Research
Result Preview Q3FY20E
FMCG
Volume growth to remain soft, margins flattish
Due to rural slowdown and liquidity issues at wholesale level, our FMCG
coverage companies would witness muted growth in Q3FY20E as
witnessed in previous quarter. Our coverage companies are expected to
report slower organic volume growth in the range of 4-6% YoY on a high
base whereby sales is expected to grow by 6.3% YoY. Impact of weak rural
growth would be felt the most by HUL and Marico, as rural sales contributes
a sizeable portion of their overall sales in addition to shift towards lower
priced alternatives. HUL is expected to witness slower YoY revenue growth
of 6.5% and 5.8% respectively. Marred by tepid hair oil demand, Marico is
expected to witness muted domestic volume growth of 4%. On account of
price cuts taken in core categories, we expect Marico to post 2.5% YoY
sales growth. On the positive side, Nestlé is expected to witness strong YoY
sales growth of 9.5% driven by broad based growth across categories and
due to lower salience of rural sales. Dabur is expected to post 6% YoY
volume growth on the back of good sales growth driven by promotional
offers in Diwali period in October. ITC is expected to post 4% YoY volume
growth in cigarettes driven by stable tax environment. Though growth from
its FMCG segment would be lower in line with other consumer companies’
growth, we expect ITC to post 6% YoY sales growth on the back of good
growth from cigarettes & paper segments.
Rising commodity inflation to impact margins
Raw material prices have been on an upward trend over last few months.
Palm oil, cocoa, barley, milk, wheat and sugar prices have increased by
29%, 12%, 11%, 10%, 8% and 5% YoY respectively. However, few
commodities such as crude oil (used for packaging), copra and robusta,
which are down by 9%, 5% and 18% respectively on a YoY basis, are
providing some respite to our FMCG coverage companies. Our coverage
companies have taken a few price hikes to mitigate higher input cost prices
that should help in slight margin expansion of 14 bps. Late surge in palm oil
prices (towards the fag end of the quarter), would impact HUL’s margins
whereas higher milk and cocoa prices would affect Nestlé’s gross margins.
On the other hand, benign copra prices should continue to aid Marico’s
margins. We believe companies will use the benefit from reduction in
corporate tax rates, to pass on some benefits to consumers. We estimate
11.5% YoY net profit growth for our coverage companies driven by
optimisation of ad spends and cost rationalisation measures.
We expect volume growth to improve for our FMCG universe by Q4FY20E
led by above normal monsoons and encouraging government policies to lift
rural incomes. However, on account of surge in crude oil prices in January,
we reckon our FMCG universe would feel its pinch in Q4FY20E. We believe
our coverage companies’ strive to increase rural penetration and focus on
new launches amidst tough economic environment would reap rich
dividends for our FMCG universe in the forthcoming quarters.
Exhibit 26: Estimates for Q3FY20E: (FMCG) (| Crore)
Revenue EBITDA PAT
Q3FY20E YoY QoQ Q3FY20E YoY QoQ Q3FY20E YoY QoQ
Dabur India Ltd 2,327.6 5.8 5.2 483.7 8.6 -1.2 405.0 10.3 0.3
HUL 10,179.6 6.5 3.3 2,136.4 4.4 -12.5 1,502.4 4.0 -18.7
ITC 11,905.2 6.0 0.3 4,620.2 6.8 1.3 3,615.9 12.7 -10.1
Marico Ltd 1,907.3 2.5 4.3 369.3 5.8 4.6 265.7 5.6 5.0
Nestle India 3,172.6 9.5 -1.3 686.1 14.5 -8.7 470.7 37.7 -20.9
Total 29,492.3 6.3 1.8 8,295.8 6.8 -3.5 6,259.7 11.5 -12.1
Change (%) Change (%)
Company
Change (%)
Source: Company, ICICI Direct Research
Topline & Profitability (Coverage Universe)
27
74
3
28891
29057
28
98
0
29492
4
9
14
19
24
29
34
0
6000
12000
18000
24000
30000
Q3FY19
Q4FY19
Q1FY20
Q2FY20
Q3FY20E
(%
)
| C
rore
Revenue EBITDA Margin PAT Margin
Copra price trend (|/kg)
40.0
60.0
80.0
100.0
120.0
140.0
Jan-17
May-17
Sep-1
7
Jan-18
May-18
Sep-1
8
Jan-19
May-19
Sep-1
9
Surge in palm oil prices (|/kg)
1500
2000
2500
3000
3500
Jan-17
May-17
Sep-1
7
Jan-18
May-18
Sep-1
8
Jan-19
May-19
Sep-1
9
Top Picks
Research Analysts
Sanjay Manyal
Kapil Jagasia, CFA
Bharat Chhoda
Cheragh Sidhwa

ICICI Securities | Retail Research 28
ICICI Direct Research
Result Preview Q3FY20E
Exhibit 27: Company Specific Views (FMCG)
Company Remarks
Dabur
We expect Dabur to post 5.8% YoY revenue growth led by 6% volume growth. Dabur's
volume growth is expected to improve on a sequential basis on account of higher A&P
spends to support new launches and its strong focus on power brands to drive growth.
International operations are expected to witness 5.1% YoY sales growth on account of a
revival in Turkey, MENA and Nepal regions. We expect EBITDA margins to increase by 49
bps to 20.8% driven by tight control over operational costs. PAT is expected to increase
by 10.3% to | 405 crore on the back of higher operating profit
HUL
HUL is expected to witness 6.5% YoY sales growth mainly driven by 4% volume growth in
addition to product mix improvement of 2%. We believe muted sales growth would be due
to weak growth in personal care segment (~50% of sales), impacted by intensified
competition in soaps category. Home care and foods & refreshment segment should
witness better sales growth owing to premiumisation trend. We expect HUL to witness
slight operating margin decline of 42 bps to 21% due to upsurge in palm oil prices. We
expect net profit growth of 4% YoY to | 1502.4 crore.
ITC
ITC is expected to post sales growth of 6% YoY driven by good growth from cigarettes &
paper segment. Cigarette segment sales growth would be driven by volume growth of 4%
and price hikes of 1.5-2% taken in the segment recently. FMCG segment should witness
slower growth of 6% sales growth as compared to its erstwhile quarters, affected by
demand slowdown in rural regions. With select price hikes in cigarettes segment, rapid
improvement in FMCG operating margins and reduction in corporate tax rates, we expect
net profit to show strong growth of 12.7% to | 3615.9 crore
Marico
Marico is expected to post muted revenue growth of 2.5% YoY sales growth due to weak
domestic business environment. We expect volume growth of 4% on the back of double
digit growth in Saffola and Foods segment. Parachute and VAHO segments are expected
to report flattish volume gorwth during the quarter. International business is also expected
to witness sales growth in a similar trajectory driven by strong growth from Bangladesh;
however, other regions are expected to witness some softness. Due to a decline in copra
prices of ~5% YoY, we expect 61 bps expansion in operating margins to 19.4%. Net profit
is expected to increase by 5.6% YoY to | 265.7 crore
Nestlé India
Led by robust growth in Maggi and chocolates segment in addition to aggressive new
launches and higher advertising spend, we expect Nestlé to post 9.5% YoY sales growth
to | 3,172.6 crore. Despite higher input cost prices (milk & cocoa), we expect operating
margins to expand by 95 bps to 21.6% YoY on a low base base of 20.7%. A&P spend was
up by ~25% in base quarter. We expect net profit to grow by 37.7% YoY to | 470.7 crore
during the quarter mainly led by reduction in tax rates. Adjusted for one-offs in base
quarter, net profit is expected to grow by 27.6% YoY.
Source: Company, ICICI Direct Research
Crude oil prices trend ($/barrel)
0
15
30
45
60
75
90
105
Jan-17
Jun-17
Nov-17
Apr-18
Sep-1
8
Feb-19
Jul-19
Dec-19

ICICI Securities | Retail Research 29
ICICI Direct Research
Result Preview Q3FY20E
Hotels
FTAs growth to rebound in Q3FY20E after four quarters of low
single digit growth
After reporting average low single digit growth of ~3% in the past 18
months, foreign tourist arrivals (FTA) growth is expected to rebound to over
6.5% YoY during the quarter. This improvement we believe is partly
attributed to recent measures taken by the government in terms of reducing
the E-visa fees and bringing down the GST rates for hotels which has made
India more competitive in the South East Asian regions. This, coupled with
balanced room supply across business and leisure destinations, would have
a positive impact on occupancy levels of the premium segment hotel
rooms. On the other hand, moderate room demand from domestic
travellers and business segment would keep the room rates under check
during the quarter. In terms of individual performances, we expect premium
player Indian Hotels to report revenue growth of over 6% YoY backed by
improvement in FTAs while budget hotel Lemon tree hotels would report
revenue growth of over 32% YoY led by launch of new properties in
Udaipur, Kolkata and Mumbai) and consolidation of revenues from Key
Hotels during the quarter. On the other hand, EIH would report 11% YoY
drop in revenues mainly due to lower income from flight catering business
that was affected due to closure of Jet Airways. Overall, we expect I-direct
hotel universe to report 4.1% YoY revenue growth during the quarter.
Margins to broadly remain flattish YoY
Margins of the I-direct hotel universe are expected to broadly remain flat
YoY. During the quarter, we expect Indian Hotels to report margin
expansion of 173 bps mainly due to improved business of international
segment (healthy RevPAR in US) while EIH may report 370bps dip in
margins YoY due to lower income from high margin flight catering
business. Margins to Lemon tree to get impacted marginally due to launch
of new properties during the quarter. Overall, we expect margins of I-direct
universe to remain flat YoY at 27.5% during the quarter.
Leisure and select business destinations to drive growth during
the quarter
Average occupancy levels continued to remain higher at leisure
destinations compared to business destinations during the quarter due to
the onset of peak season. However, select business destinations are
expected to report marginally better occupancy levels during the quarter.
Among leisure destinations Goa and Jaipur would report healthy
improvement in occupancy levels during the quarter. In business
destinations, Mumbai, Hyderabad and Bengaluru would register better
occupancies compared to the previous year.
Exhibit 28: Estimates for Q3FY20E: (Hotels) (| Crore)
Revenue EBITDA PAT
Q3FY20E YoY QoQ Q3FY20E YoY QoQ Q3FY20E YoY QoQ
EIH 395.1 -11.0 37.3 103.3 -22.0 530.8 49.3 -22.8 20.3
Indian Hotel 1,404.2 6.1 39.4 380.3 13.3 137.0 169.6 -0.3 137.8
Lemon Tree Hotels 189.6 32.3 24.1 64.1 30.7 32.3 2.9 -78.4 LP
Total 1,988.9 4.1 37.4 547.7 5.9 143.1 221.8 -10.3 102.4
Change (%)Change (%) Change (%)
Company
Source: Company, ICICI Direct Research
Topline & Profitability (Coverage Universe) S
1387
1370 1
853
1769
1494
-15
-5
5
15
25
35
0
200
400
600
800
1000
1200
1400
1600
1800
Q1FY19
Q2FY19
Q3FY19
Q4FY19
Q1FY20E
(%
)
| C
rore
Revenue EBITDA Margin PAT Margin
FTAs growth (up 3.2% YoY) to moderate on
higher base during Q1FY20E
400
600
800
1000
1200
1400
Apr
May
Jun
Jul
Aug
Sep
Oct
Nov
Dec
Jan
Feb
Mar
FY18 FY19 FY20
Trend in average occupancy level (%)
71 7174
79
72
64 65
76
81
65
50
60
70
80
90
100
Q1FY19
Q2FY19
Q3FY19
Q4FY19
Q1FY20
(%
)
Business Destinations Leisure Destinations
Trend in average room rates (In |)
6460
6502
6548
7313
6680
6154
6102 9179
8956
6450
0
2500
5000
7500
10000
Q1FY19
Q2FY19
Q3FY19
Q4FY19
Q1FY20E
(|)
Business Destinations Leisure Destinations
Top Picks
Indian Hotels
Research Analysts
Rashesh Shah
Romil Mehta
Bharat Chhoda
Cheragh Sidhwa
Topline & Profitability (Coverage Universe) S
1298 1
767
1675
1416
1326
-15
-10
-5
0
5
10
15
20
25
30
0
200
400
600
800
1000
1200
1400
1600
1800
Q2FY19
Q3FY19
Q4FY19
Q1FY20
Q2FY20E
(%
)
| C
rore
Revenue EBITDA Margin PAT Margin
FTAs growth to moderate on higher base
400
600
800
1000
1200
1400
Apr
May
Jun
Jul
Aug
Sep
Oct
Nov
Dec
Jan
Feb
Mar
FY18 FY19 FY20
Trend in average occupancy level (%)
7168
75
68 70
55
73
80
64
5550
60
70
80
90
100
Q2FY19
Q3FY19
Q4FY19
Q1FY20
Q2FY20E
(%
)
Business Destinations Leisure Destinations
Trend in average room rates (In |)
6500
6550
6610
5800
6600
6100
9180
8850
6210
6600
0
2500
5000
7500
10000
Q2FY19
Q3FY19
Q4FY19
Q1FY20
Q2FY20
(|)
Business Destinations Leisure Destinations
Top Picks
Indian Hotels
Research Analysts
Rashesh Shah
Romil Mehta
Bharat Chhoda
Cheragh Sidhwa
Topline & Profitability (Coverage Universe) S
1911
1826
1451
1448 1
989
-15
-10
-5
0
5
10
15
20
25
30
0
200
400
600
800
1000
1200
1400
1600
1800
Q3FY19
Q4FY19
Q1FY20
Q2FY20
Q3FY
20
E
(%
)
| C
rore
Revenue EBITDA Margin PAT Margin
FTAs growth to rebound to 6.5% YoY vs. 2%
YoY growth reported last year
400
600
800
1000
1200
1400
Apr
May
Jun
Jul
Aug
Sep
Oct
Nov
Dec
Jan
Feb
Mar
FY18 FY19 FY20
Trend in average occupancy level (%)
68
75
6870
6873
80
64
55
76
50
60
70
80
90
100
Q3FY19
Q4FY19
Q1FY20
Q2FY20
Q3FY20E
(%
)
Business Destinations Leisure Destinations
Trend in average room rates (In |)
7080
7440
6520
6620
72009180
8850
6210
6280
9300
0
2500
5000
7500
10000
Q3FY19
Q4FY19
Q1FY20
Q2FY20
Q3FY20E
(|)
Business Destinations Leisure Destinations
Top Picks
Indian Hotels
Lemon Tree Hotels
Research Analysts
Rashesh Shah
Romil Mehta
Bharat Chhoda
Cheragh Sidhwa

ICICI Securities | Retail Research 30
ICICI Direct Research
Result Preview Q3FY20E
Company specific view
Company Remarks
Indian Hotels
On the revenue front, we expect domestic revenue growth of 7.2% YoY in line with
industry growth vs 5.6% YoY growth reported last year. The marginal improvement in
the growth is backed by improvement in foreign tourist arrivals with likely growth of
6.5% YoY vs 2.0% YoY growth reported last year. The international segment is
expected to grow by 5% YoY. Margins are expected to improve 173bps YoY depsite
challenges in the domestic segment which will be offset by turnaround of international
subsidiaries. PAT growth to remain flat YoY as LY net profit included exceptional gain
of |41 crore
EIH
Earnings of EIH to continue to get impacted due to lower revenues from catering
businss during the quarter. On the other hand, stabilisation of Delhi property which
was reopened in January 2018 would help in stabilising revenues. With lower-than-
expected revenue from catering business, we expect revenue to decline by 11% YoY.
The margins to decline by 370bps YoY to 26.1% mainly due to lower income from high
margin catering segment.
LemonTree
Launch of premium properties in Udaipur, Mumbai and Kolkata along with integration of
Keys hotel, we expect the revenue to grow at 32.3% YoY. On the other hand, we
expect margins to get impacted due to high fixed operating overheads vis-o-vis lower
incremental revenues from new properties in intial stages. Also, with higher interest
and depreciation charge, we expect net profitability to get impacted during the quarter.
Source: Company, ICICI Direct Research
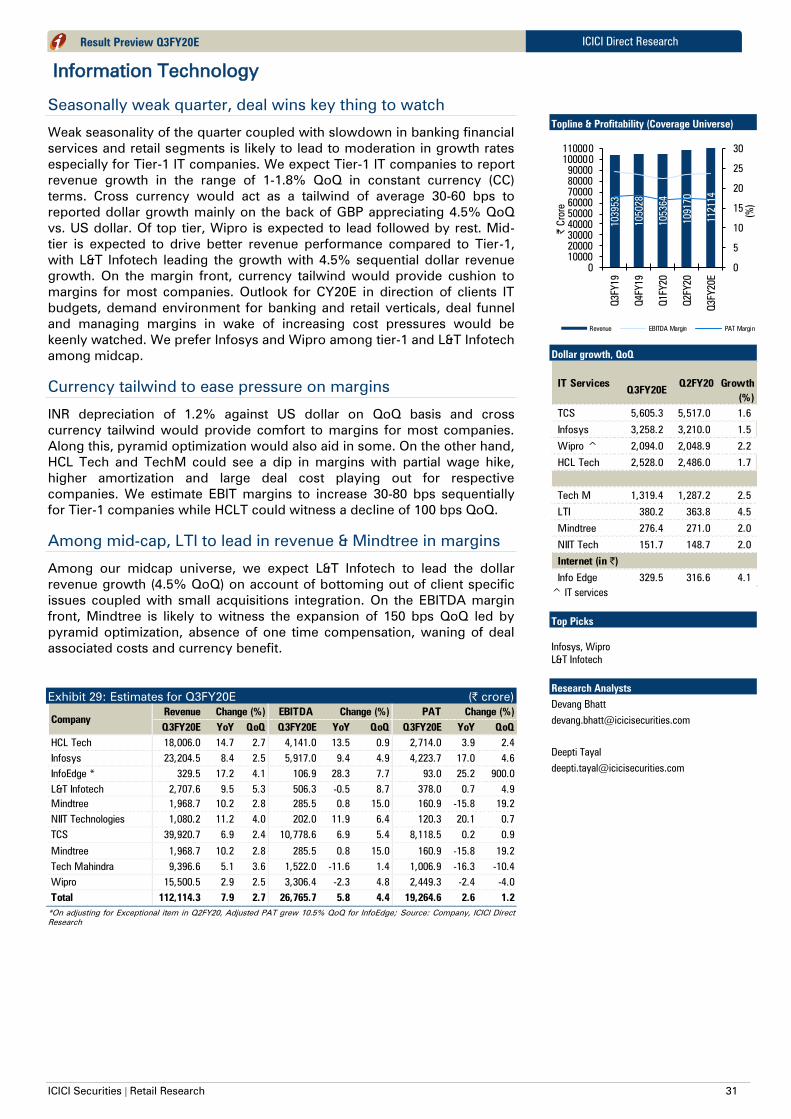
ICICI Securities | Retail Research 31
ICICI Direct Research
Result Preview Q3FY20E
Information Technology
Seasonally weak quarter, deal wins key thing to watch
Weak seasonality of the quarter coupled with slowdown in banking financial
services and retail segments is likely to lead to moderation in growth rates
especially for Tier-1 IT companies. We expect Tier-1 IT companies to report
revenue growth in the range of 1-1.8% QoQ in constant currency (CC)
terms. Cross currency would act as a tailwind of average 30-60 bps to
reported dollar growth mainly on the back of GBP appreciating 4.5% QoQ
vs. US dollar. Of top tier, Wipro is expected to lead followed by rest. Mid-
tier is expected to drive better revenue performance compared to Tier-1,
with L&T Infotech leading the growth with 4.5% sequential dollar revenue
growth. On the margin front, currency tailwind would provide cushion to
margins for most companies. Outlook for CY20E in direction of clients IT
budgets, demand environment for banking and retail verticals, deal funnel
and managing margins in wake of increasing cost pressures would be
keenly watched. We prefer Infosys and Wipro among tier-1 and L&T Infotech
among midcap.
Currency tailwind to ease pressure on margins
INR depreciation of 1.2% against US dollar on QoQ basis and cross
currency tailwind would provide comfort to margins for most companies.
Along this, pyramid optimization would also aid in some. On the other hand,
HCL Tech and TechM could see a dip in margins with partial wage hike,
higher amortization and large deal cost playing out for respective
companies. We estimate EBIT margins to increase 30-80 bps sequentially
for Tier-1 companies while HCLT could witness a decline of 100 bps QoQ.
Among mid-cap, LTI to lead in revenue & Mindtree in margins
Among our midcap universe, we expect L&T Infotech to lead the dollar
revenue growth (4.5% QoQ) on account of bottoming out of client specific
issues coupled with small acquisitions integration. On the EBITDA margin
front, Mindtree is likely to witness the expansion of 150 bps QoQ led by
pyramid optimization, absence of one time compensation, waning of deal
associated costs and currency benefit.
Exhibit 29: Estimates for Q3FY20E (| crore)
Revenue EBITDA PAT
Q3FY20E YoY QoQ Q3FY20E YoY QoQ Q3FY20E YoY QoQ
HCL Tech 18,006.0 14.7 2.7 4,141.0 13.5 0.9 2,714.0 3.9 2.4
Infosys 23,204.5 8.4 2.5 5,917.0 9.4 4.9 4,223.7 17.0 4.6
InfoEdge * 329.5 17.2 4.1 106.9 28.3 7.7 93.0 25.2 900.0
L&T Infotech 2,707.6 9.5 5.3 506.3 -0.5 8.7 378.0 0.7 4.9
Mindtree 1,968.7 10.2 2.8 285.5 0.8 15.0 160.9 -15.8 19.2
NIIT Technologies 1,080.2 11.2 4.0 202.0 11.9 6.4 120.3 20.1 0.7
TCS 39,920.7 6.9 2.4 10,778.6 6.9 5.4 8,118.5 0.2 0.9
Mindtree 1,968.7 10.2 2.8 285.5 0.8 15.0 160.9 -15.8 19.2
Tech Mahindra 9,396.6 5.1 3.6 1,522.0 -11.6 1.4 1,006.9 -16.3 -10.4
Wipro 15,500.5 2.9 2.5 3,306.4 -2.3 4.8 2,449.3 -2.4 -4.0
Total 112,114.3 7.9 2.7 26,765.7 5.8 4.4 19,264.6 2.6 1.2
Change (%) Change (%)
Company
Change (%)
*On adjusting for Exceptional item in Q2FY20, Adjusted PAT grew 10.5% QoQ for InfoEdge; Source: Company, ICICI Direct
Research
Topline & Profitability (Coverage Universe)
103953
105028
105364
109170
112114
0
5
10
15
20
25
30
0
10000
20000
30000
40000
50000
60000
70000
80000
90000
100000
110000
Q3FY19
Q4FY19
Q1FY20
Q2FY20
Q3FY20E
(%
)
| C
rore
Revenue EBITDA Margin PAT Margin
Dollar growth, QoQ
IT Services
Q3FY20E Q2FY20
Growth
(%)
TCS 5,605.3 5,517.0 1.6
Infosys 3,258.2 3,210.0 1.5
Wipro ^ 2,094.0 2,048.9 2.2
HCL Tech 2,528.0 2,486.0 1.7
Tech M 1,319.4 1,287.2 2.5
LTI 380.2 363.8 4.5
Mindtree 276.4 271.0 2.0
NIIT Tech 151.7 148.7 2.0
Internet (in |)
Info Edge 329.5 316.6 4.1
^ IT services
Top Picks
Infosys, Wipro
L&T Infotech
Research Analysts
Devang Bhatt
Deepti Tayal
Cheragh Sidhwa

ICICI Securities | Retail Research 32
ICICI Direct Research
Result Preview Q3FY20E
Commentary on various fronts for CY20E of major interest
Recent few quarters have been impacted by weakness in banking financial
services (specifically capital markets), auto, retail & client specific issues in
some. Going ahead, commentary related to pattern in clients IT budgets,
demand environment for banking and retail verticals, deal funnel and
managing margins in wake of increasing cost pressures would be the key
factors to watch out for FY21E.
Exhibit 30: Company Specific view
Company Remarks
TCS Constant currency revenues are expected to grow by mere 1% sequentially mainly on
the back of weakness in pockets of banking & retail segments along with quarter
seasonality. Cross currency would act as a tailwind of 60 bps leading to US$ revenue
growth of 1.6% QoQ to $5,605 million. Further, rupee revenue growth is expected to
grow at 2.4% QoQ (to | 39,920 crore) mainly due to rupee depreciation. EBIT margins
could expand 80 bps QoQ to 24.8% mainly driven by rupee depreciation, cross currency
benefit along with utilization of employees hired in H1FY20. Lower other income (mainly
on account of special dividend) may lead to 0.9% QoQ growth in PAT. Investor interest:
Demand update across verticals, IT budgets outlook for CY20E, commentary regarding
deal ramp ups and margin trajectory
Infosys Revenues is expected to grow 1.2% QoQ in constant currency terms. US$ revenue may
increase 1.5% QoQ to $3,258 million while dollar appreciation would lead to rupee
revenue growth of 2.5% QoQ at | 23,204 crore. Currency tailwind coupled with absence
of acquisition costs incurred in Q2 would likely lead to EBIT margins expansion of 60 bps
QoQ to 22.3% in the quarter. Investor interest: Revision in upper band revenue guidance
for FY20E (9-10%), demand commentary on BFSI (especially capital markets) and
European auto verticals, measures to control attrition and update on investigations in
light of whistleblower complaints
Wipro We expect global IT services revenues to grow 1.8% QoQ in constant currency well in
the guided range of 0.8-2.8%. With cross currency tailwind of 0.4%, US$ revenues in IT
services segment to grow 2.2% QoQ to US$2094 million supported by full quarter
consolidation of ITI acquisition (0.3%). In rupee terms, consolidated revenues could grow
2.5% QoQ to | 15,501 crore. Global IT services EBIT margins is expected to expand by
30 bps QoQ to 18.4%. Lower other income (mainly on account of share buyback) is
leading to 4% QoQ de-growth in PAT. Investor interest: Q4FY20E guidance taking into
account strong quarter for company, deal renewals, top client trajectory, demand
outlook across various operating segments and margin momentum
HCL Tech We expect dollar revenues to grow 1.7% QoQ to $2,528 million led by organic growth
aided by Sankalp acquisition (0.2%). This accompanied with rupee depreciation benefit,
rupee revenues is expected to grow by 2.7% QoQ to | 18,006 crore. EBIT margins could
decline 100 bps QoQ to 19% owing to impact from partial wage hike (spread across Q2 &
Q3), amortization pertaining to IBM acquisition partially countered by currency benefit.
Investor interest: Momentum in IMS business, magnitude of investments in acquisition
led strategy, digital deal pipeline and margin sustainability
Tech Mahindra We expect US$ revenues to grow by 2.5% QoQ to $1319 million mainly driven by partial
contribution by acquisition of Born group and AT&T deal. Rupee revenues may grow
3.6% QoQ to | 9,397 crore. EBITDA margins could decline 30 bps QoQ to 16.2% on
account of large deal transition cost and normalization of SG&A expenses. Investor
Interest: Update on large deal won of AT&T in Sep 2019, momentum in portfolio
companies, attrition rates and timeline progress on 5G roll out
Larsen &
Toubro Infotech
US$ revenues is expected to witness a strong growth of 4.5% QoQ to $380 million on
account of bottoming out of client specific issues coupled with small acquisitions
integration. Rupee revenues may grow by 5.3% QoQ to | 2,707 crore. EBITDA margins
likely to expand 60 bps QoQ to 18.7% mainly due to currency tailwind. Investor Interest:
Growth outlook for CY20E, top client trajectory, deal pipeline and margin course in the
wake of increased cost pressure
Source: Company, ICICI Direct Research
EBIT margin impact
EBIT margins Q3FY20E Q2FY20
Change
(bps)
TCS 24.8 24.0 80
Infosys 22.3 21.7 60
Wipro ^ 18.4 18.1 30
HCL Tech 19.0 20.0 (100)
EBITDA margins
Tech M 16.2 16.5 (30)
LTI 18.7 18.1 60
Mindtree 14.5 13.0 150
NIIT Tech 18.7 18.3 40
Internet (in |)
Info Edge 32.4 31.4 100
^ IT services
|/$
50
55
60
65
70
75
80
Ja
n-14
Ju
l-14
Ja
n-15
Ju
l-15
Ja
n-16
Ju
l-16
Ja
n-17
Ju
l-17
Ja
n-18
Ju
l-18
Ja
n-19
Ju
l-19
Ja
n-20
||/$
$ vs. global currencies
0.6
1.0
1.4
1.8
2.2
2.6
Ja
n-14
Ju
l-14
Ja
n-15
Ju
l-15
Ja
n-16
Ju
l-16
Ja
n-17
Ju
l-17
Ja
n-18
Ju
l-18
Ja
n-19
Ju
l-19
Ja
n-20
$/Euro $/GBP $/AUD
ICICI Securities | Retail Research 33
ICICI Direct Research
Result Preview Q3FY20E
Exhibit 31: Company Specific views
Company Remarks
Info Edge Rupee revenues are expected to grow 17.2% YoY to | 330 crore led by continued growth
momentum in Naukri business (18% YoY) and 99 acres (15% YoY). EBITDA margins may
increase 100 bps QoQ at 32.4% owing to productivity enhancements in Naukri business
partially countered by cash burn at Jeevansathi and continuity in ad expenses in Naukri
business. Investor interest: Hiring viewpoint in IT and non IT segments, growth outlook in
99 acres, update on Zomato & PolicyBazaar and any new investments
MindTree We expect dollar revenues to grow 2% QoQ to $276 million led by deal ramp ups and
growth in top client. Rupee revenue may grow 2.8% QoQ to | 1,969 crore. EBITDA
margins may expand by 150 bps QoQ to 14.5% in the quarter mainly led by absence of
one time compensation cost, waning of deal associated costs and currency benefit.
Investor interest: Update of strategy by new management, margin trajectory post sharp
dip in Q1FY20, attrition in senior leadership, client mining opportunity and order pipeline
NIIT Tech On account of healthy traction in insurance and transportation segment, dollar revenue is
expected to increase 2% QoQ to US$152 million partially offset by seasonal weakness in
banking vertical. Following that, rupee revenues may witness a growth of 4% QoQ to |
1080 crore. EBITDA margins may see an expansion of 40 bps to 18.7% due to
operational efficiency and currency benefit. Investor interest: Commentary on top 5
clients amid softness in banking financial space, order book conversion, margin course
and traction in digital segments
Source: Company, ICICI Direct Research
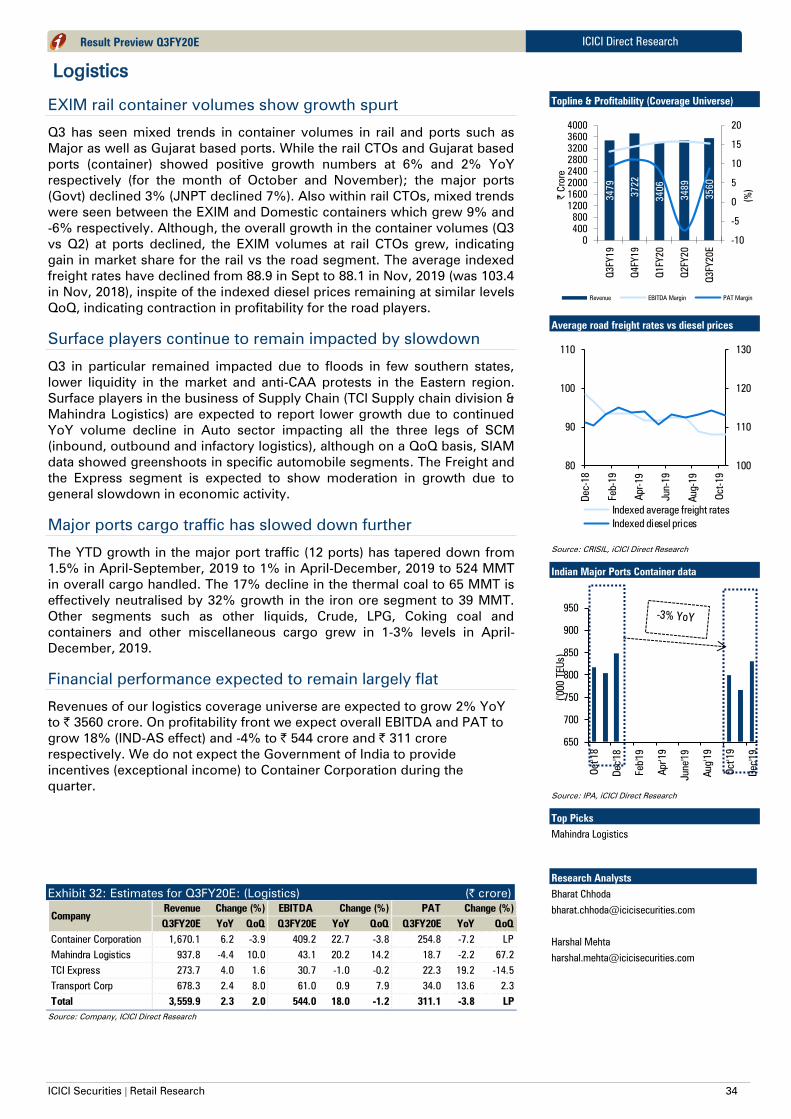
ICICI Securities | Retail Research 34
ICICI Direct Research Result Preview Q3FY20E
Logistics
EXIM rail container volumes show growth spurt
Q3 has seen mixed trends in container volumes in rail and ports such as
Major as well as Gujarat based ports. While the rail CTOs and Gujarat based
ports (container) showed positive growth numbers at 6% and 2% YoY
respectively (for the month of October and November); the major ports
(Govt) declined 3% (JNPT declined 7%). Also within rail CTOs, mixed trends
were seen between the EXIM and Domestic containers which grew 9% and
-6% respectively. Although, the overall growth in the container volumes (Q3
vs Q2) at ports declined, the EXIM volumes at rail CTOs grew, indicating
gain in market share for the rail vs the road segment. The average indexed
freight rates have declined from 88.9 in Sept to 88.1 in Nov, 2019 (was 103.4
in Nov, 2018), inspite of the indexed diesel prices remaining at similar levels
QoQ, indicating contraction in profitability for the road players.
Surface players continue to remain impacted by slowdown
Q3 in particular remained impacted due to floods in few southern states,
lower liquidity in the market and anti-CAA protests in the Eastern region.
Surface players in the business of Supply Chain (TCI Supply chain division &
Mahindra Logistics) are expected to report lower growth due to continued
YoY volume decline in Auto sector impacting all the three legs of SCM
(inbound, outbound and infactory logistics), although on a QoQ basis, SIAM
data showed greenshoots in specific automobile segments. The Freight and
the Express segment is expected to show moderation in growth due to
general slowdown in economic activity.
Major ports cargo traffic has slowed down further
The YTD growth in the major port traffic (12 ports) has tapered down from
1.5% in April-September, 2019 to 1% in April-December, 2019 to 524 MMT
in overall cargo handled. The 17% decline in the thermal coal to 65 MMT is
effectively neutralised by 32% growth in the iron ore segment to 39 MMT.
Other segments such as other liquids, Crude, LPG, Coking coal and
containers and other miscellaneous cargo grew in 1-3% levels in April-
December, 2019.
Financial performance expected to remain largely flat
Revenues of our logistics coverage universe are expected to grow 2% YoY
to | 3560 crore. On profitability front we expect overall EBITDA and PAT to
grow 18% (IND-AS effect) and -4% to | 544 crore and | 311 crore
respectively. We do not expect the Government of India to provide
incentives (exceptional income) to Container Corporation during the
quarter.
Exhibit 32: Estimates for Q3FY20E: (Logistics) (| crore)
Revenue EBITDA PAT
Q3FY20E YoY QoQ Q3FY20E YoY QoQ Q3FY20E YoY QoQ
Container Corporation 1,670.1 6.2 -3.9 409.2 22.7 -3.8 254.8 -7.2 LP
Mahindra Logistics 937.8 -4.4 10.0 43.1 20.2 14.2 18.7 -2.2 67.2
TCI Express 273.7 4.0 1.6 30.7 -1.0 -0.2 22.3 19.2 -14.5
Transport Corp 678.3 2.4 8.0 61.0 0.9 7.9 34.0 13.6 2.3
Total 3,559.9 2.3 2.0 544.0 18.0 -1.2 311.1 -3.8 LP
Change (%) Change (%)
Company
Change (%)
Source: Company, ICICI Direct Research
Topline & Profitability (Coverage Universe)
3479
3722
3406
3489
3560
-10
-5
0
5
10
15
20
0
400
800
1200
1600
2000
2400
2800
3200
3600
4000
Q3FY19
Q4FY19
Q1FY20
Q2FY20
Q3FY20E
(%
)
| C
rore
Revenue EBITDA Margin PAT Margin
Average road freight rates vs diesel prices
100
110
120
130
80
90
100
110
Dec-18
Feb-19
Apr-19
Jun-19
Aug-19
Oct-19
Indexed average freight rates
Indexed diesel prices
Source: CRISIL, iCICI Direct Research
Indian Major Ports Container data
650
700
750
800
850
900
950
Oct'1
8
Dec'1
8
Feb'1
9
Apr'1
9
June'1
9
Aug'1
9
Oct'1
9
Dec'1
9
('0
00 TEU
s)
Source: IPA, iCICI Direct Research
Top Picks
Mahindra Logistics
Research Analysts
Bharat Chhoda
Harshal Mehta
Bharat Chhoda
Cheragh Sidhwa
ICICI Securities | Retail Research 35
ICICI Direct Research Result Preview Q3FY20E
Exhibit 33: Company Specific Views (Logistics)
Company Remarks
Container
Corporation
Core revenues are expected to grow 6% YoY to |1670 crore due to 5% YoY growth in
both Exim and domestic realisation, whereas the EXIM volumes are expected to grow
mere 2% and the domestic volumes are expected to de-grow by 2%. EBITDA margins
are expected to grow 350 bps YoY to 22.7% (due to lower empties and a better product
mix). Absolute EBITDA is expected to decline 23% YoY to | 409 crore. However,
adjusted PAT is expected to decline 7% YoY to | 255 crore owing to presence
exceptional income of | 186 crore in Q3FY19
Transport
Corporation of
India
Freight segment, which witnessed strong growth in FY19 (17% revenue growth), is
expected to grow at a slower pace of 7% YoY in Q3FY20 due to lower growth in the
manufacturing sector. SCM revenues continued to be impacted by a slowdown in the
auto Industry. However, shipping segment revenues are expected to grow 8% YoY due
to improved fleet utilisation. Resultant revenues are expected to grow mere 2% YoY to |
678 crore. EBITDA is expected to grow 1% YoY to | 61 crore (EBITDA margin expected
to remain rangebound at 9%). Due to lower tax rate (for freight & supply chain division)
and lower interest expense, PAT growth is expected to clock 14% YoY to | 34 crore
Mahindra
Logistics
Revenue is expected to remain subded with 4% YoY decline amid a continued
slowdown in the auto sector (~65% exposure). EBITDA margins are expected to remain
rangebound at 4.5%. Subsequently, EBITDA is expected to grow 20% YoY to | 43 crore
(mainly due to IND-AS effect). However, PAT is expected to decline 2% YoY to | 19
crore (due to higher depreciation and interest expense related to the IND-AS effect),
inspite of benefit of lower corporate tax rate announced by the government recently
(effective tax rate reduced from 35% to 25.2%)
TCI Express
Revenues are expected to grow mere 4% YoY to |274 crore, mainly due to a slowdown
in the auto sector (transports spare parts to auto companies) and a general
consumption based slowdown in the economy. EBITDA margins are expected to remain
steady at 11.2%. Subsequently, PAT is expected to grow 19% YoY, amid lower tax rate
Source: Company, ICICI Direct Research
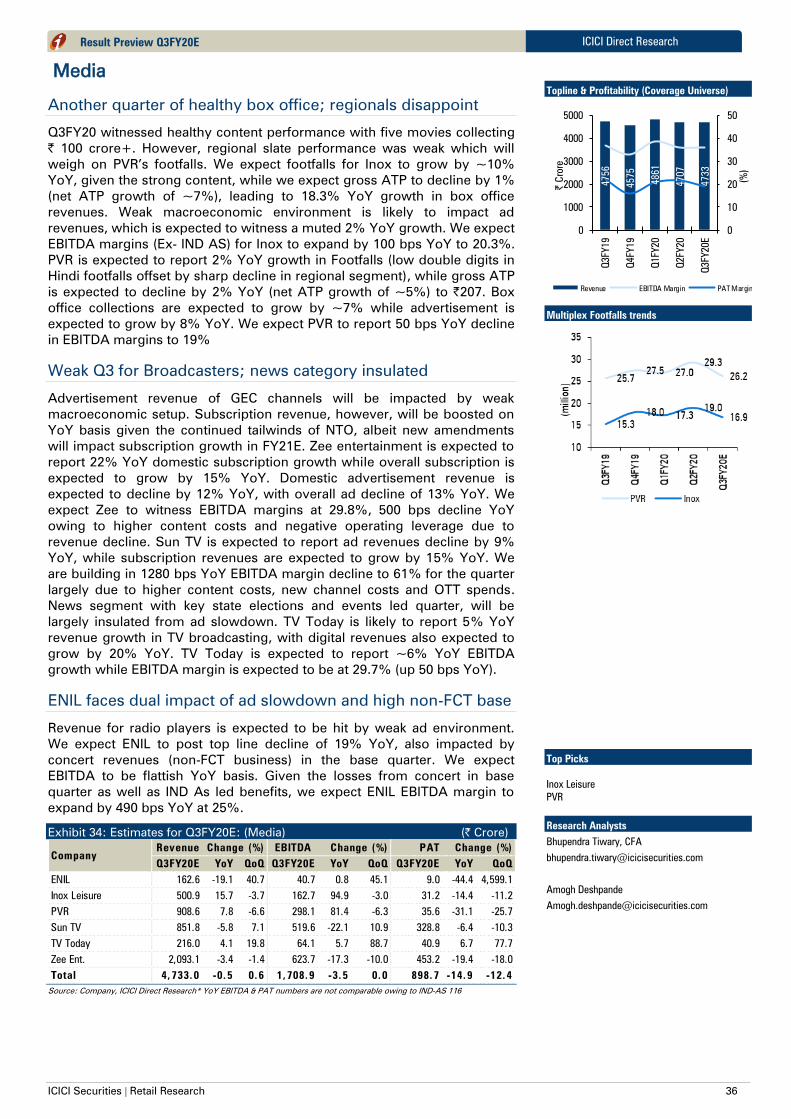
ICICI Securities | Retail Research 36
ICICI Direct Research Result Preview Q3FY20E
Media
Another quarter of healthy box office; regionals disappoint
Q3FY20 witnessed healthy content performance with five movies collecting
| 100 crore+. However, regional slate performance was weak which will
weigh on PVR’s footfalls. We expect footfalls for Inox to grow by ~10%
YoY, given the strong content, while we expect gross ATP to decline by 1%
(net ATP growth of ~7%), leading to 18.3% YoY growth in box office
revenues. Weak macroeconomic environment is likely to impact ad
revenues, which is expected to witness a muted 2% YoY growth. We expect
EBITDA margins (Ex- IND AS) for Inox to expand by 100 bps YoY to 20.3%.
PVR is expected to report 2% YoY growth in Footfalls (low double digits in
Hindi footfalls offset by sharp decline in regional segment), while gross ATP
is expected to decline by 2% YoY (net ATP growth of ~5%) to |207. Box
office collections are expected to grow by ~7% while advertisement is
expected to grow by 8% YoY. We expect PVR to report 50 bps YoY decline
in EBITDA margins to 19%
Weak Q3 for Broadcasters; news category insulated
Advertisement revenue of GEC channels will be impacted by weak
macroeconomic setup. Subscription revenue, however, will be boosted on
YoY basis given the continued tailwinds of NTO, albeit new amendments
will impact subscription growth in FY21E. Zee entertainment is expected to
report 22% YoY domestic subscription growth while overall subscription is
expected to grow by 15% YoY. Domestic advertisement revenue is
expected to decline by 12% YoY, with overall ad decline of 13% YoY. We
expect Zee to witness EBITDA margins at 29.8%, 500 bps decline YoY
owing to higher content costs and negative operating leverage due to
revenue decline. Sun TV is expected to report ad revenues decline by 9%
YoY, while subscription revenues are expected to grow by 15% YoY. We
are building in 1280 bps YoY EBITDA margin decline to 61% for the quarter
largely due to higher content costs, new channel costs and OTT spends.
News segment with key state elections and events led quarter, will be
largely insulated from ad slowdown. TV Today is likely to report 5% YoY
revenue growth in TV broadcasting, with digital revenues also expected to
grow by 20% YoY. TV Today is expected to report ~6% YoY EBITDA
growth while EBITDA margin is expected to be at 29.7% (up 50 bps YoY).
ENIL faces dual impact of ad slowdown and high non-FCT base
Revenue for radio players is expected to be hit by weak ad environment.
We expect ENIL to post top line decline of 19% YoY, also impacted by
concert revenues (non-FCT business) in the base quarter. We expect
EBITDA to be flattish YoY basis. Given the losses from concert in base
quarter as well as IND As led benefits, we expect ENIL EBITDA margin to
expand by 490 bps YoY at 25%.
Exhibit 34: Estimates for Q3FY20E: (Media) (| Crore)
Revenue EBITDA PAT
Q3FY20E YoY QoQ Q3FY20E YoY QoQ Q3FY20E YoY QoQ
ENIL 162.6 -19.1 40.7 40.7 0.8 45.1 9.0 -44.4 4,599.1
Inox Leisure 500.9 15.7 -3.7 162.7 94.9 -3.0 31.2 -14.4 -11.2
PVR 908.6 7.8 -6.6 298.1 81.4 -6.3 35.6 -31.1 -25.7
Sun TV 851.8 -5.8 7.1 519.6 -22.1 10.9 328.8 -6.4 -10.3
TV Today 216.0 4.1 19.8 64.1 5.7 88.7 40.9 6.7 77.7
Zee Ent. 2,093.1 -3.4 -1.4 623.7 -17.3 -10.0 453.2 -19.4 -18.0
Total 4,733.0 -0.5 0.6 1,708.9 -3.5 0.0 898.7 -14.9 -12.4
Change (%)Change (%) Change (%)
Company
Source: Company, ICICI Direct Research* YoY EBITDA & PAT numbers are not comparable owing to IND-AS 116
Topline & Profitability (Coverage Universe)
4756
4575
4861
4707
4733
0
10
20
30
40
50
0
1000
2000
3000
4000
5000
Q3FY19
Q4FY19
Q1FY20
Q2FY20
Q3FY20E
(%
)
| C
rore
Revenue EBITDA Margin PAT Margin
Multiplex Footfalls trends
Top Picks
Inox Leisure
PVR
Research Analysts
Bhupendra Tiwary, CFA
Amogh Deshpande
Cheragh Sidhwa
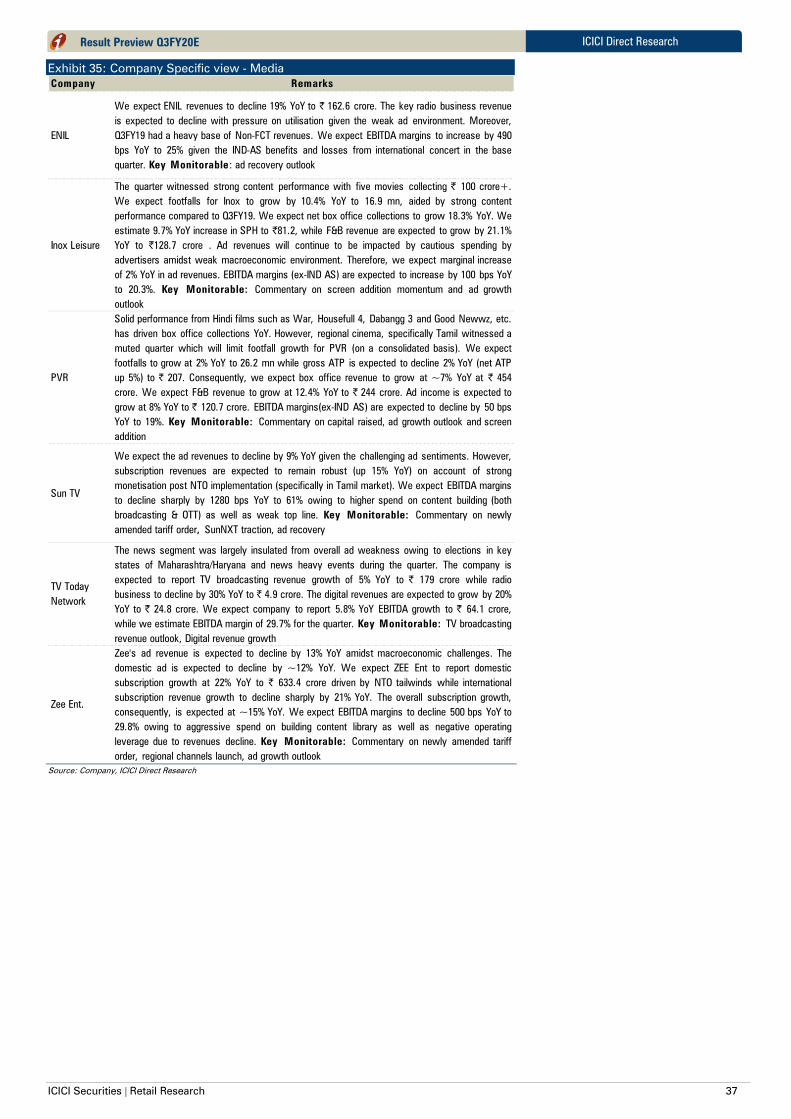
ICICI Securities | Retail Research 37
ICICI Direct Research Result Preview Q3FY20E
Exhibit 35: Company Specific view - Media
Company Remarks
ENIL
We expect ENIL revenues to decline 19% YoY to | 162.6 crore. The key radio business revenue
is expected to decline with pressure on utilisation given the weak ad environment. Moreover,
Q3FY19 had a heavy base of Non-FCT revenues. We expect EBITDA margins to increase by 490
bps YoY to 25% given the IND-AS benefits and losses from international concert in the base
quarter. Key Monitorable : ad recovery outlook
Inox Leisure
The quarter witnessed strong content performance with five movies collecting | 100 crore+.
We expect footfalls for Inox to grow by 10.4% YoY to 16.9 mn, aided by strong content
performance compared to Q3FY19. We expect net box office collections to grow 18.3% YoY. We
estimate 9.7% YoY increase in SPH to |81.2, while F&B revenue are expected to grow by 21.1%
YoY to |128.7 crore . Ad revenues will continue to be impacted by cautious spending by
advertisers amidst weak macroeconomic environment. Therefore, we expect marginal increase
of 2% YoY in ad revenues. EBITDA margins (ex-IND AS) are expected to increase by 100 bps YoY
to 20.3%. Key Monitorable: Commentary on screen addition momentum and ad growth
outlook
PVR
Solid performance from Hindi films such as War, Housefull 4, Dabangg 3 and Good Newwz, etc.
has driven box office collections YoY. However, regional cinema, specifically Tamil witnessed a
muted quarter which will limit footfall growth for PVR (on a consolidated basis). We expect
footfalls to grow at 2% YoY to 26.2 mn while gross ATP is expected to decline 2% YoY (net ATP
up 5%) to | 207. Consequently, we expect box office revenue to grow at ~7% YoY at | 454
crore. We expect F&B revenue to grow at 12.4% YoY to | 244 crore. Ad income is expected to
grow at 8% YoY to | 120.7 crore. EBITDA margins(ex-IND AS) are expected to decline by 50 bps
YoY to 19%. Key Monitorable: Commentary on capital raised, ad growth outlook and screen
addition
Sun TV
We expect the ad revenues to decline by 9% YoY given the challenging ad sentiments. However,
subscription revenues are expected to remain robust (up 15% YoY) on account of strong
monetisation post NTO implementation (specifically in Tamil market). We expect EBITDA margins
to decline sharply by 1280 bps YoY to 61% owing to higher spend on content building (both
broadcasting & OTT) as well as weak top line. Key Monitorable: Commentary on newly
amended tariff order, SunNXT traction, ad recovery
TV Today
Network
The news segment was largely insulated from overall ad weakness owing to elections in key
states of Maharashtra/Haryana and news heavy events during the quarter. The company is
expected to report TV broadcasting revenue growth of 5% YoY to | 179 crore while radio
business to decline by 30% YoY to | 4.9 crore. The digital revenues are expected to grow by 20%
YoY to | 24.8 crore. We expect company to report 5.8% YoY EBITDA growth to | 64.1 crore,
while we estimate EBITDA margin of 29.7% for the quarter. Key Monitorable: TV broadcasting
revenue outlook, Digital revenue growth
Zee Ent.
Zee's ad revenue is expected to decline by 13% YoY amidst macroeconomic challenges. The
domestic ad is expected to decline by ~12% YoY. We expect ZEE Ent to report domestic
subscription growth at 22% YoY to | 633.4 crore driven by NTO tailwinds while international
subscription revenue growth to decline sharply by 21% YoY. The overall subscription growth,
consequently, is expected at ~15% YoY. We expect EBITDA margins to decline 500 bps YoY to
29.8% owing to aggressive spend on building content library as well as negative operating
leverage due to revenues decline. Key Monitorable: Commentary on newly amended tariff
order, regional channels launch, ad growth outlook
Source: Company, ICICI Direct Research

ICICI Securities | Retail Research 38
ICICI Direct Research Result Preview Q3FY20E
Metals and Mining
EBITDA to Inch upward on QoQ basis….
After a healthy Q1FY20, the domestic steel demand has been on a declining
trend on the back of muted growth from key user industries such as
Automobiles, real estate etc. In the current fiscal, domestic steel demand
has steadily decelerated from a YoY growth of 6.9% in Q1FY20, to 3.1%
YoY in Q2FY20 and a negative growth of 1.8% in first couple of months of
Q3FY20 (October-November 2019).However despite weak demand
environment, domestic steel mills were able to undertake moderate steel
price hikes in first two months of the third quarter of FY20 on the back of
firming up trend witnessed in international steel prices .On the back of
softening trend in coking coal prices, we expect EBITDA/tonne for
Q3FY20 to inch upward on QoQ basis. The EBITDA per tonne of Tata
Steel (standalone operations) is expected come in at |12000 per tonne (|
11200 per tonne in Q2FY20), while domestic operations of JSW steel is
likely to report an EBITDA per tonne of |7500 per tonne (|6472 per tonne in
Q2FY20).
Non-ferrous prices to remain flattish on a QoQ basis….
For Q3FY20, the prices of Non-ferrous metals have remained flattish. During
this quarter, in US$ terms the average price of Aluminium declined by
10.7% YoY & marginally by 0.5% QoQ to US$1966/tonne. As for Lead, its
average price stood at US$1966/tonne, up by 3.9% YoY, & 0.6% QoQ.
Average Zinc prices for Q3FY20 stood at US$2387/tonne, down 9.2% YoY,
albeit up by 1.4% QoQ, while average copper prices for quarter under
review stood at US$5891/tonne, down 3.7% YoY, while up by 1.4% QoQ.
Overall in Q3FY20 most of the Non-ferrous prices were flattish due to
macroeconomic uncertainties in regards to trade tussle between US and
China.
Operating performance to improve sequentially…
We expect the aggregate topline of coverage companies to increase 5.1%
QoQ. On the back of benign trend witnessed in prices of key raw materials
(especially coking coal) we expect aggregate EBITDA margin to increase
270 bps QoQ to 18.5%. The EBITDA/tonne of domestic miners like Coal
India is likely to come in at | 360/tonne with NMDC expected to report the
same at | 1800/tonne. We expect Novelis (Hindalco’s subsidiary) to clock an
EBITDA/tonne of US$425/tonne.
Exhibit 36: Estimates for Q3FY20E: (Metals) (| Crore)
Revenue EBITDA PAT
Q3FY20E YoY QoQ Q3FY20E YoY QoQ Q3FY20E YoY QoQ
Coal India 23,480.0 -6.3 15.2 5,099.9 NA 41.2 4,340.0 NA 23.2
Graphite India 492.5 -73.5 -44.2 68.6 -93.7 -51.0 66.9 -91.2 -63.8
Hindalco 10,119.1 -15.2 1.5 1,154.6 -32.8 5.4 211.8 -70.3 26.8
Hindustan Zinc 4,688.6 -15.4 3.9 2,317.0 -18.4 9.4 1,650.1 -25.4 -20.7
JSW Steel 16,777.9 -17.4 -1.9 2,584.5 -42.6 14.1 431.2 -73.1 -83.0
NMDC 3,192.0 -12.5 42.4 1,512.0 -29.8 42.6 1,145.0 -27.4 62.9
Tata Steel 35,361.3 -14.2 2.3 4,668.0 -30.6 22.2 494.0 -71.8 -85.0
Ratnamani Metals & Tube 740.1 1.6 21.3 133.2 32.0 14.3 93.7 49.2 22.6
Total 94,851.5 -14.0 5.1 17,537.8 -32.3 23.3 8,432.7 -36.4 -32.9
Change (%) Change (%) Change (%)
Company
Source: Company, ICICI Direct Research, Hindalco results are Hindalco Standalone + Utkal
Topline & Profitability (Coverage Universe)
110295
116790
100559
90279
94852
0
5
10
15
20
25
0
27000
54000
81000
108000
Q3FY19
Q4FY19
Q1FY20
Q2FY20
Q3FY20E
(%
)
| C
rore
Revenue EBITDA Margin PAT Margin
Movement of base metal prices on LME9)
Zinc 2,387 2,630 (9.2) 2,353 1.4
Lead 2,042 1,966 3.9 2,029 0.6
Alum. 1,756 1,966 (10.7) 1,765 (0.5)
Copper 5,891 6,120 (3.7) 5,808 1.4
QoQ %US$/t Q3FY20 Q3FY19 YoY % Q2FY20
Source: Bloomberg, ICICI Direct Research,
Zinc 169,961 189,611 (10.4) 165,438 2.7
Lead 145,392 141,726 2.6 142,638 1.9
Alum. 125,011 141,746 (11.8) 124,062 0.8
Copper 419,433 441,224 (4.9) 408,270 2.7
QoQ %|/t Q3FY20 Q3FY19 YoY % Q2FY20
Source: Bloomberg, ICICI Direct Research,
Research Analysts
Dewang Sanghavi
Bharat Chhoda
Cheragh Sidhwa
Top Picks
Tata Steel
Ratnamani Metals & Tubes
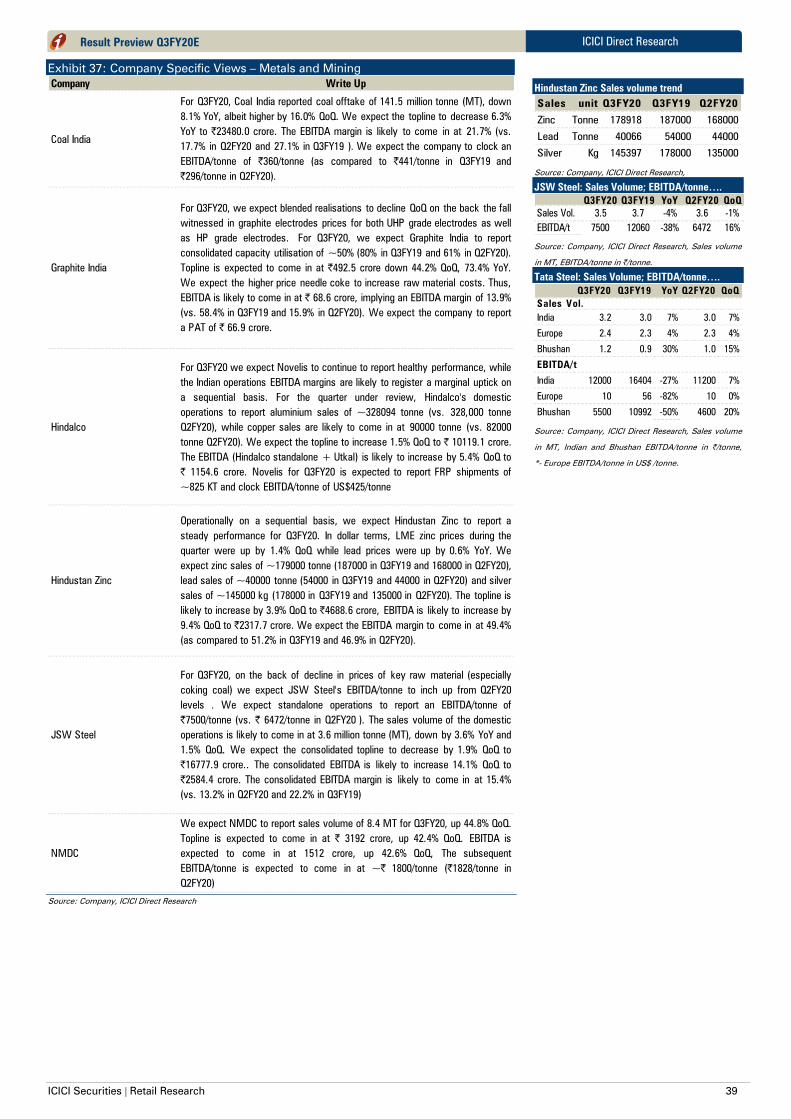
ICICI Securities | Retail Research 39
ICICI Direct Research
Result Preview Q3FY20E
Exhibit 37: Company Specific Views – Metals and Mining
Company Write Up
Coal India
For Q3FY20, Coal India reported coal offtake of 141.5 million tonne (MT), down
8.1% YoY, albeit higher by 16.0% QoQ. We expect the topline to decrease 6.3%
YoY to |23480.0 crore. The EBITDA margin is likely to come in at 21.7% (vs.
17.7% in Q2FY20 and 27.1% in Q3FY19 ). We expect the company to clock an
EBITDA/tonne of |360/tonne (as compared to |441/tonne in Q3FY19 and
|296/tonne in Q2FY20).
Graphite India
For Q3FY20, we expect blended realisations to decline QoQ on the back the fall
witnessed in graphite electrodes prices for both UHP grade electrodes as well
as HP grade electrodes. For Q3FY20, we expect Graphite India to report
consolidated capacity utilisation of ~50% (80% in Q3FY19 and 61% in Q2FY20).
Topline is expected to come in at |492.5 crore down 44.2% QoQ, 73.4% YoY.
We expect the higher price needle coke to increase raw material costs. Thus,
EBITDA is likely to come in at | 68.6 crore, implying an EBITDA margin of 13.9%
(vs. 58.4% in Q3FY19 and 15.9% in Q2FY20). We expect the company to report
a PAT of | 66.9 crore.
Hindalco
For Q3FY20 we expect Novelis to continue to report healthy performance, while
the Indian operations EBITDA margins are likely to register a marginal uptick on
a sequential basis. For the quarter under review, Hindalco's domestic
operations to report aluminium sales of ~328094 tonne (vs. 328,000 tonne
Q2FY20), while copper sales are likely to come in at 90000 tonne (vs. 82000
tonne Q2FY20). We expect the topline to increase 1.5% QoQ to | 10119.1 crore.
The EBITDA (Hindalco standalone + Utkal) is likely to increase by 5.4% QoQ to
| 1154.6 crore. Novelis for Q3FY20 is expected to report FRP shipments of
~825 KT and clock EBITDA/tonne of US$425/tonne
Hindustan Zinc
Operationally on a sequential basis, we expect Hindustan Zinc to report a
steady performance for Q3FY20. In dollar terms, LME zinc prices during the
quarter were up by 1.4% QoQ while lead prices were up by 0.6% YoY. We
expect zinc sales of ~179000 tonne (187000 in Q3FY19 and 168000 in Q2FY20),
lead sales of ~40000 tonne (54000 in Q3FY19 and 44000 in Q2FY20) and silver
sales of ~145000 kg (178000 in Q3FY19 and 135000 in Q2FY20). The topline is
likely to increase by 3.9% QoQ to |4688.6 crore, EBITDA is likely to increase by
9.4% QoQ to |2317.7 crore. We expect the EBITDA margin to come in at 49.4%
(as compared to 51.2% in Q3FY19 and 46.9% in Q2FY20).
JSW Steel
For Q3FY20, on the back of decline in prices of key raw material (especially
coking coal) we expect JSW Steel's EBITDA/tonne to inch up from Q2FY20
levels . We expect standalone operations to report an EBITDA/tonne of
|7500/tonne (vs. | 6472/tonne in Q2FY20 ). The sales volume of the domestic
operations is likely to come in at 3.6 million tonne (MT), down by 3.6% YoY and
1.5% QoQ. We expect the consolidated topline to decrease by 1.9% QoQ to
|16777.9 crore.. The consolidated EBITDA is likely to increase 14.1% QoQ to
|2584.4 crore. The consolidated EBITDA margin is likely to come in at 15.4%
(vs. 13.2% in Q2FY20 and 22.2% in Q3FY19)
NMDC
We expect NMDC to report sales volume of 8.4 MT for Q3FY20, up 44.8% QoQ.
Topline is expected to come in at | 3192 crore, up 42.4% QoQ. EBITDA is
expected to come in at 1512 crore, up 42.6% QoQ, The subsequent
EBITDA/tonne is expected to come in at ~| 1800/tonne (|1828/tonne in
Q2FY20)
Source: Company, ICICI Direct Research
Hindustan Zinc Sales volume trend
Sales unit Q3FY20 Q3FY19 Q2FY20
Zinc Tonne 178918 187000 168000
Lead Tonne 40066 54000 44000
Silver Kg 145397 178000 135000
Source: Company, ICICI Direct Research,
JSW Steel: Sales Volume; EBITDA/tonne….
Q3FY20 Q3FY19 YoY Q2FY20 QoQ
Sales Vol. 3.5 3.7 -4% 3.6 -1%
EBITDA/t 7500 12060 -38% 6472 16%
Source: Company, ICICI Direct Research, Sales volume
in MT, EBITDA/tonne in |/tonne.
Tata Steel: Sales Volume; EBITDA/tonne….
Q3FY20 Q3FY19 YoY Q2FY20 QoQ
Sales Vol.
India 3.2 3.0 7% 3.0 7%
Europe 2.4 2.3 4% 2.3 4%
Bhushan 1.2 0.9 30% 1.0 15%
EBITDA/t
India 12000 16404 -27% 11200 7%
Europe 10 56 -82% 10 0%
Bhushan 5500 10992 -50% 4600 20%
Source: Company, ICICI Direct Research, Sales volume
in MT, Indian and Bhushan EBITDA/tonne in |/tonne,
*- Europe EBITDA/tonne in US$ /tonne.
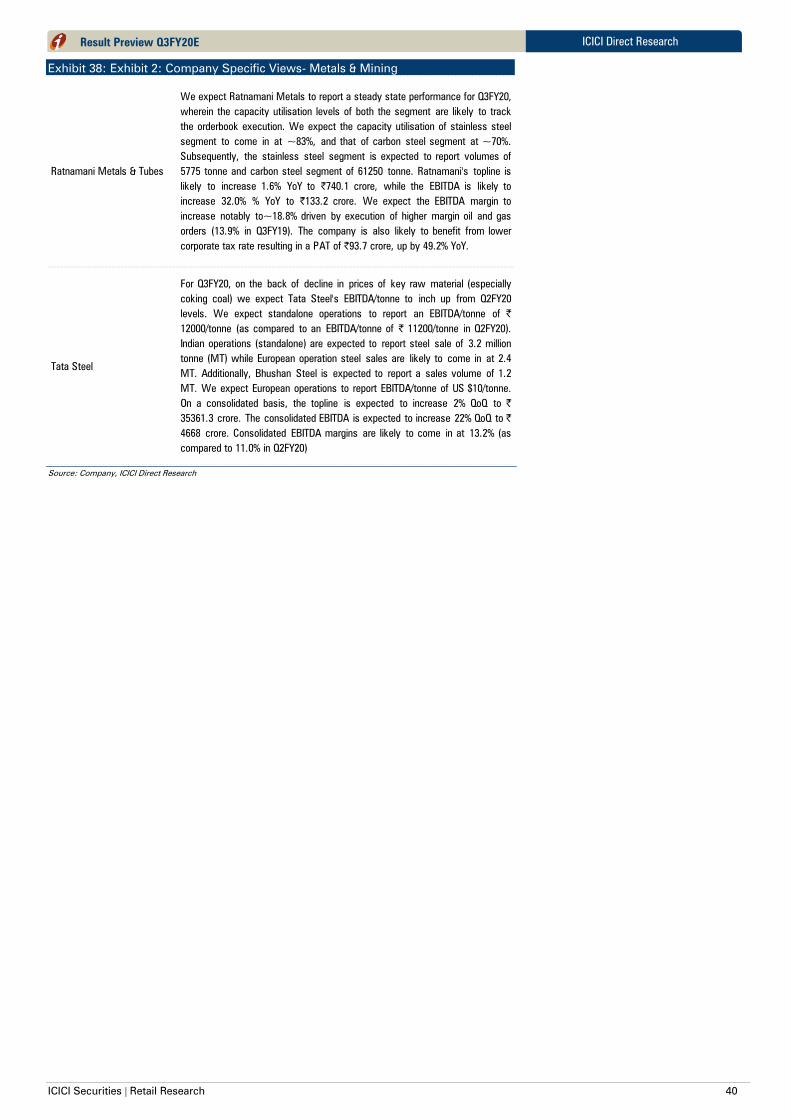
ICICI Securities | Retail Research 40
ICICI Direct Research
Result Preview Q3FY20E
Exhibit 38: Exhibit 2: Company Specific Views- Metals & Mining
Ratnamani Metals & Tubes
We expect Ratnamani Metals to report a steady state performance for Q3FY20,
wherein the capacity utilisation levels of both the segment are likely to track
the orderbook execution. We expect the capacity utilisation of stainless steel
segment to come in at ~83%, and that of carbon steel segment at ~70%.
Subsequently, the stainless steel segment is expected to report volumes of
5775 tonne and carbon steel segment of 61250 tonne. Ratnamani's topline is
likely to increase 1.6% YoY to |740.1 crore, while the EBITDA is likely to
increase 32.0% % YoY to |133.2 crore. We expect the EBITDA margin to
increase notably to~18.8% driven by execution of higher margin oil and gas
orders (13.9% in Q3FY19). The company is also likely to benefit from lower
corporate tax rate resulting in a PAT of |93.7 crore, up by 49.2% YoY.
Tata Steel
For Q3FY20, on the back of decline in prices of key raw material (especially
coking coal) we expect Tata Steel's EBITDA/tonne to inch up from Q2FY20
levels. We expect standalone operations to report an EBITDA/tonne of |
12000/tonne (as compared to an EBITDA/tonne of | 11200/tonne in Q2FY20).
Indian operations (standalone) are expected to report steel sale of 3.2 million
tonne (MT) while European operation steel sales are likely to come in at 2.4
MT. Additionally, Bhushan Steel is expected to report a sales volume of 1.2
MT. We expect European operations to report EBITDA/tonne of US $10/tonne.
On a consolidated basis, the topline is expected to increase 2% QoQ to |
35361.3 crore. The consolidated EBITDA is expected to increase 22% QoQ to |
4668 crore. Consolidated EBITDA margins are likely to come in at 13.2% (as
compared to 11.0% in Q2FY20)
Source: Company, ICICI Direct Research
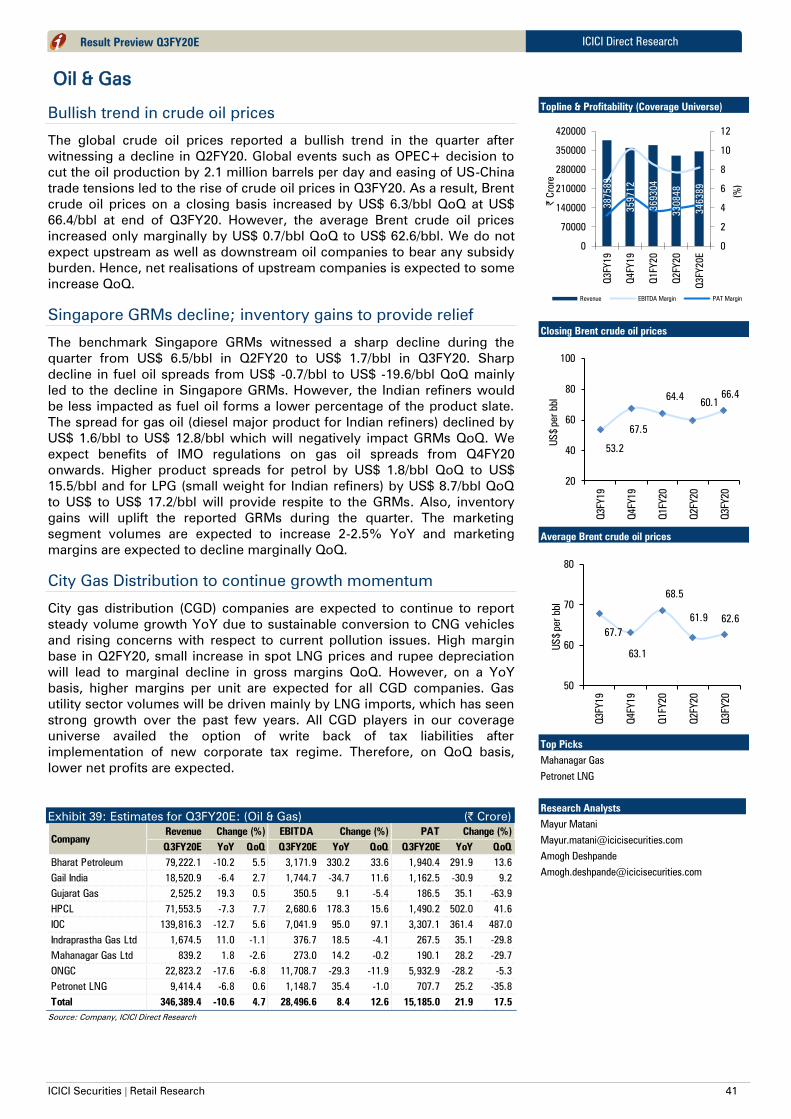
ICICI Securities | Retail Research 41
ICICI Direct Research
Result Preview Q3FY20E
Oil & Gas
Bullish trend in crude oil prices
The global crude oil prices reported a bullish trend in the quarter after
witnessing a decline in Q2FY20. Global events such as OPEC+ decision to
cut the oil production by 2.1 million barrels per day and easing of US-China
trade tensions led to the rise of crude oil prices in Q3FY20. As a result, Brent
crude oil prices on a closing basis increased by US$ 6.3/bbl QoQ at US$
66.4/bbl at end of Q3FY20. However, the average Brent crude oil prices
increased only marginally by US$ 0.7/bbl QoQ to US$ 62.6/bbl. We do not
expect upstream as well as downstream oil companies to bear any subsidy
burden. Hence, net realisations of upstream companies is expected to some
increase QoQ.
Singapore GRMs decline; inventory gains to provide relief
The benchmark Singapore GRMs witnessed a sharp decline during the
quarter from US$ 6.5/bbl in Q2FY20 to US$ 1.7/bbl in Q3FY20. Sharp
decline in fuel oil spreads from US$ -0.7/bbl to US$ -19.6/bbl QoQ mainly
led to the decline in Singapore GRMs. However, the Indian refiners would
be less impacted as fuel oil forms a lower percentage of the product slate.
The spread for gas oil (diesel major product for Indian refiners) declined by
US$ 1.6/bbl to US$ 12.8/bbl which will negatively impact GRMs QoQ. We
expect benefits of IMO regulations on gas oil spreads from Q4FY20
onwards. Higher product spreads for petrol by US$ 1.8/bbl QoQ to US$
15.5/bbl and for LPG (small weight for Indian refiners) by US$ 8.7/bbl QoQ
to US$ to US$ 17.2/bbl will provide respite to the GRMs. Also, inventory
gains will uplift the reported GRMs during the quarter. The marketing
segment volumes are expected to increase 2-2.5% YoY and marketing
margins are expected to decline marginally QoQ.
City Gas Distribution to continue growth momentum
City gas distribution (CGD) companies are expected to continue to report
steady volume growth YoY due to sustainable conversion to CNG vehicles
and rising concerns with respect to current pollution issues. High margin
base in Q2FY20, small increase in spot LNG prices and rupee depreciation
will lead to marginal decline in gross margins QoQ. However, on a YoY
basis, higher margins per unit are expected for all CGD companies. Gas
utility sector volumes will be driven mainly by LNG imports, which has seen
strong growth over the past few years. All CGD players in our coverage
universe availed the option of write back of tax liabilities after
implementation of new corporate tax regime. Therefore, on QoQ basis,
lower net profits are expected.
Exhibit 39: Estimates for Q3FY20E: (Oil & Gas) (| Crore)
Revenue EBITDA PAT
Q3FY20E YoY QoQ Q3FY20E YoY QoQ Q3FY20E YoY QoQ
Bharat Petroleum 79,222.1 -10.2 5.5 3,171.9 330.2 33.6 1,940.4 291.9 13.6
Gail India 18,520.9 -6.4 2.7 1,744.7 -34.7 11.6 1,162.5 -30.9 9.2
Gujarat Gas 2,525.2 19.3 0.5 350.5 9.1 -5.4 186.5 35.1 -63.9
HPCL 71,553.5 -7.3 7.7 2,680.6 178.3 15.6 1,490.2 502.0 41.6
IOC 139,816.3 -12.7 5.6 7,041.9 95.0 97.1 3,307.1 361.4 487.0
Indraprastha Gas Ltd 1,674.5 11.0 -1.1 376.7 18.5 -4.1 267.5 35.1 -29.8
Mahanagar Gas Ltd 839.2 1.8 -2.6 273.0 14.2 -0.2 190.1 28.2 -29.7
ONGC 22,823.2 -17.6 -6.8 11,708.7 -29.3 -11.9 5,932.9 -28.2 -5.3
Petronet LNG 9,414.4 -6.8 0.6 1,148.7 35.4 -1.0 707.7 25.2 -35.8
Total 346,389.4 -10.6 4.7 28,496.6 8.4 12.6 15,185.0 21.9 17.5
Company
Change (%) Change (%) Change (%)
Source: Company, ICICI Direct Research
Topline & Profitability (Coverage Universe)
387589
35
97
12
369304
330848
34
63
89
0
2
4
6
8
10
12
0
70000
140000
210000
280000
350000
420000
Q3FY19
Q4FY19
Q1FY20
Q2FY20
Q3FY20E
(%
)
| C
rore
Revenue EBITDA Margin PAT Margin
Closing Brent crude oil prices
53.2
67.5
64.460.1
66.4
20
40
60
80
100
Q3FY19
Q4FY19
Q1FY20
Q2FY20
Q3FY20
US
$ p
er bbl
Average Brent crude oil prices
67.7
63.1
68.5
61.9 62.6
50
60
70
80
Q3FY19
Q4FY19
Q1FY20
Q2FY20
Q3FY20
US
$ p
er bbl
Top Picks
Mahanagar Gas
Petronet LNG a
Research Analysts
Mayur Matani
Amogh Deshpande
Bharat Chhoda
Cheragh Sidhwa

ICICI Securities | Retail Research 42
ICICI Direct Research
Result Preview Q3FY20E
Exhibit 40: Company Specific Views (Oil & Gas)
Company Remarks
BPCL
Crude throughput is expected at 7.9 MMT, an increase of 3.1% QoQ. Marketing segment
volumes are expected to increase 2.5% YoY with marginally reduced margins QoQ. GRMs
are expected at $5.1/bbl vs. $3.4/bbl in Q2FY20 on account of inventory gains, better
efficiency and increase in gasoline spreads. Hence, PAT is expected to improve 13.6%
QoQ to | 1940.4 crore.
Gail
GAIL’s operational performance is expected to remain weak mainly on account of
subdued profits from petrochemicals and LPG business segments. On the LPG liquid
hydrocarbon front, EBIT is expected to decline 31.9% to | 567.2 crore on account of lower
realisations. Lower realisations will continue to impact petchem segment as well, which
is expected to post losses on EBIT front. On the gas business front, gas transmission
volumes are expected to remain flattish YoY at 107 mmscmd with its EBIT at | 805.5
crore. We expect lower EBIT from the gas trading business segment at | 342.2 crore due
to lower margins on US volumes
Gujarat Gas
We expect revenues to increase 19.3% YoY on account of higher volumes. Volumes are
expected to grow at 42.7% YoY to 9.4 mmscmd due to higher volumes from Morbi. On a
QoQ basis volumes will remain flattish. Gross margins will decline YoY by |1.8/scm to |
6.3/scm as gross margins were exceptionally high in Q3FY19 owing to price hike in that
quarter. On a QoQ basis, we expect gross margins to decline marginally by 0.2/scm on
some increase in spot LNG prices and rupee depreciation. Subsequently, we expect PAT
at | 186.5 crore, 35.1% up YoY
Hindustan
Petroleum
Crude throughput is expected at 4.3 MMT, a decrease of 5.7% QoQ. Marketing segment
volumes are expected to increase 2.5% YoY while margins are expected to decline
marginally QoQ. GRMs are expected at $4.5/bbl vs $2.8/bbl in Q2FY20 on account of
inventory gains, better efficiency and increase in gasoline spreads. Also, lower tax rate
will help company to report increase in PAT by 41.6% QoQ to | 1490.2 crore
Indian Oil
Crude throughput is expected at 18 MMT, an increase of 2.6 % QoQ. Marketing segment
volumes are expected to increase 2.4% YoY with marginally reduced margins QoQ. GRMs
are expected at $4.7/bbl vs. $1.3/bbl in Q2FY20 on account of inventory gains, better
efficiency and increase in gasoline spreads. Also, lower tax rate will help company to
report increase in PAT by 487% QoQ to | 3307.1 crore.
Indraprastha
Gas
With encouraging CNG vehicle conversions and Delhi's pollution issues, IGL's volumes
are expected to grow 11.5% YoY. Total volumes are expected at 6.6 mmscmd (CNG: 4.9
mmscmd, PNG: 1.7 mmscmd). We expect gross margins to increase by | 0.4/scm YoY
to | 11.4/scm. However, on a QoQ basis, margins are expected to be marginally lower by
|0.1/scm on some increase in spot LNG prices and rupee depreciation. EBITDA/scm is
expected at | 6.2 per scm with PAT up 35.1% YoY to | 267.5 crore.
Mahanagar
Gas
We expect better volume growth of 5.4% YoY supported by continuous conversion rate of
CNG vehicles. Volumes are expected at 3.1 mmscmd (CNG : 2.3 mmscmd, PNG : 0.8
mmscmd). Gross margins are expected to increase by | 0.8/scm to | 14.3/scm on better
pricing power. However, on QoQ basis, gross margins will decline marginally by |
0.4/scm as Q2FY20 margins were exceptionally high and had benefit of low LNG prices.
EBITDA/scm is expected to increase by | 0.7/scm YoY to | 9.5/scm.
ONGC
Oil production is expected to decline 2.4% QoQ and 5.6% YoY. Similarly, Gas production is
estimated to decline 3.2% QoQ and 9.3% YoY. Oil production is estimated at 5.7 MMT,
with gas output expected at 6.1 MMT in Q3FY20E. We expect marginal increase in
realisations QoQ at $61.1/bbl due to higher average crude oil prices. We do not expect
any subsidy during the quarter. PAT is expected to decline by 5.3% QoQ as volumes are
expected to remain lower.
Petronet LNG
We expect the topline to decline 6.8% YoY to | 941.4 crore on account of lower LNG
realisations. Total volumes are expected to increase 20.9% YoY to 244.2 trillion British
thermal units (tbtu) (~4.7 MMT). However, on QoQ basis, volumes are expected to
decline by 2.3%. Blended margins are expected to increase by 9.7% YoY to |54.2/mmbtu.
On a QoQ basis, blended margins are expected to increase by 3.2%. PAT is expected to
increase by 25.2% YoY to | 707.7 crore. However, on QoQ basis, profitability is expected
to decline by 35.8% on account of tax writeback in Q2FY20.
Source: Company, ICICI Direct Research
Singapore gross refining margins (GRMs)
4.3
3.2
3.5
6.5
1.7
0
2
4
6
8
Q3FY19
Q4FY19
Q1FY20
Q2FY20
Q3FY20
Refin
ing m
argin
s (U
S$ per b
bl)
Source: Reuters
Singapore benchmark product spreads ($/bbl)
Product Spreads Q3FY19 Q2FY20 Q3FY20
Gasoline 7.4 13.7 15.5
Naphtha -5.3 -7.4 -1.7
Jet Kerosene 16.7 16.2 14.7
Gas Oil 14.3 14.4 12.8
Fuel Oil 0.1 -0.7 -19.6
LPG -21.1 -25.9 -17.2
Source: Reuters
Gross under-recoveries of petroleum products
13593
6567
8160
4735
8123
0
3000
6000
9000
12000
15000
Q3FY19
Q4FY19
Q1FY20
Q2FY20
Q3FY20
| C
rore
Gross under-recoveries of petroleum products
276
197
257
374
300
0
150
300
450
600
FY16
FY17
FY18
FY19
FY20
E
| b
n
Gross under-recoveries
Sharing of oil under-recoveries (| crore)
Q3FY19 Q2FY20 Q3FY20
Upstream 0 0 0
Downstream 0 0 0
Government 13593 4735 8123
Total 13593 4735 8123
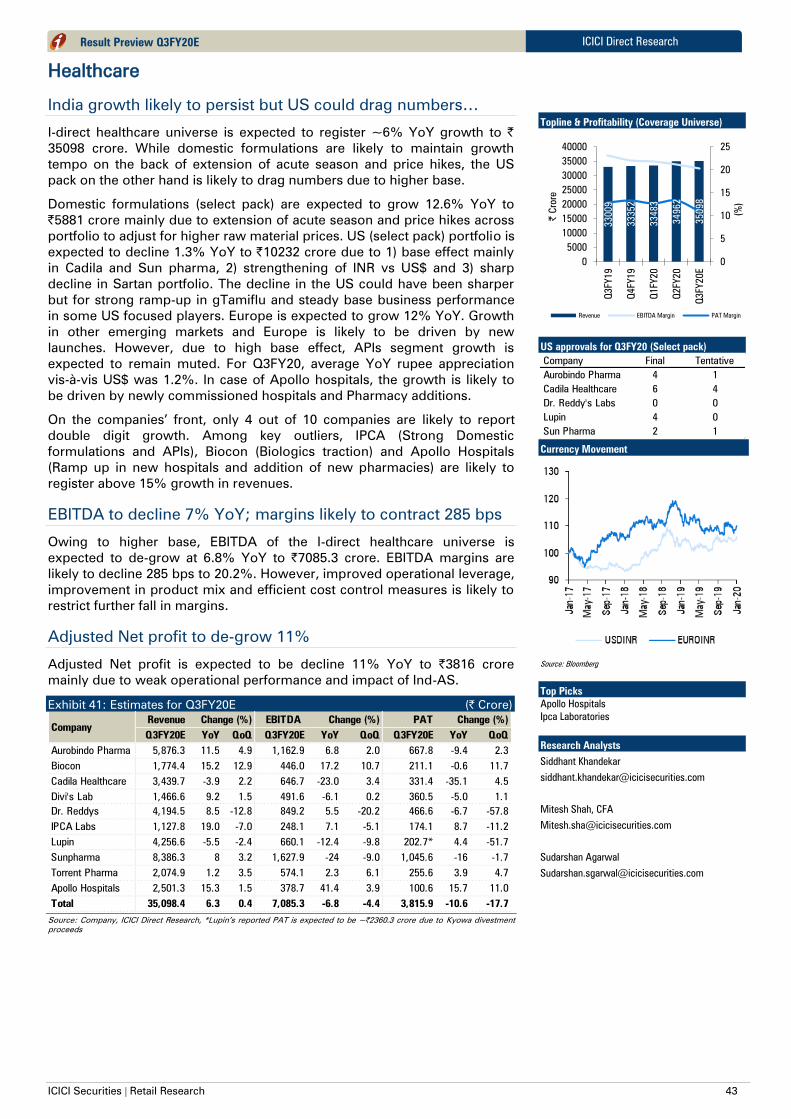
ICICI Securities | Retail Research 43
ICICI Direct Research
Result Preview Q3FY20E
Healthcare
India growth likely to persist but US could drag numbers…
I-direct healthcare universe is expected to register ~6% YoY growth to |
35098 crore. While domestic formulations are likely to maintain growth
tempo on the back of extension of acute season and price hikes, the US
pack on the other hand is likely to drag numbers due to higher base.
Domestic formulations (select pack) are expected to grow 12.6% YoY to
|5881 crore mainly due to extension of acute season and price hikes across
portfolio to adjust for higher raw material prices. US (select pack) portfolio is
expected to decline 1.3% YoY to |10232 crore due to 1) base effect mainly
in Cadila and Sun pharma, 2) strengthening of INR vs US$ and 3) sharp
decline in Sartan portfolio. The decline in the US could have been sharper
but for strong ramp-up in gTamiflu and steady base business performance
in some US focused players. Europe is expected to grow 12% YoY. Growth
in other emerging markets and Europe is likely to be driven by new
launches. However, due to high base effect, APIs segment growth is
expected to remain muted. For Q3FY20, average YoY rupee appreciation
vis-à-vis US$ was 1.2%. In case of Apollo hospitals, the growth is likely to
be driven by newly commissioned hospitals and Pharmacy additions.
On the companies’ front, only 4 out of 10 companies are likely to report
double digit growth. Among key outliers, IPCA (Strong Domestic
formulations and APIs), Biocon (Biologics traction) and Apollo Hospitals
(Ramp up in new hospitals and addition of new pharmacies) are likely to
register above 15% growth in revenues.
EBITDA to decline 7% YoY; margins likely to contract 285 bps
Owing to higher base, EBITDA of the I-direct healthcare universe is
expected to de-grow at 6.8% YoY to |7085.3 crore. EBITDA margins are
likely to decline 285 bps to 20.2%. However, improved operational leverage,
improvement in product mix and efficient cost control measures is likely to
restrict further fall in margins.
Adjusted Net profit to de-grow 11%
Adjusted Net profit is expected to be decline 11% YoY to |3816 crore
mainly due to weak operational performance and impact of Ind-AS.
Exhibit 41: Estimates for Q3FY20E (| Crore)
Revenue EBITDA PAT
Q3FY20E YoY QoQ Q3FY20E YoY QoQ Q3FY20E YoY QoQ
Aurobindo Pharma 5,876.3 11.5 4.9 1,162.9 6.8 2.0 667.8 -9.4 2.3
Biocon 1,774.4 15.2 12.9 446.0 17.2 10.7 211.1 -0.6 11.7
Cadila Healthcare 3,439.7 -3.9 2.2 646.7 -23.0 3.4 331.4 -35.1 4.5
Divi's Lab 1,466.6 9.2 1.5 491.6 -6.1 0.2 360.5 -5.0 1.1
Dr. Reddys 4,194.5 8.5 -12.8 849.2 5.5 -20.2 466.6 -6.7 -57.8
IPCA Labs 1,127.8 19.0 -7.0 248.1 7.1 -5.1 174.1 8.7 -11.2
Lupin 4,256.6 -5.5 -2.4 660.1 -12.4 -9.8 202.7* 4.4 -51.7
Sunpharma 8,386.3 8 3.2 1,627.9 -24 -9.0 1,045.6 -16 -1.7
Torrent Pharma 2,074.9 1.2 3.5 574.1 2.3 6.1 255.6 3.9 4.7
Apollo Hospitals 2,501.3 15.3 1.5 378.7 41.4 3.9 100.6 15.7 11.0
Total 35,098.4 6.3 0.4 7,085.3 -6.8 -4.4 3,815.9 -10.6 -17.7
Change (%) Change (%) Change (%)
Company
Source: Company, ICICI Direct Research, *Lupin’s reported PAT is expected to be ~|2360.3 crore due to Kyowa divestment
proceeds
Topline & Profitability (Coverage Universe)
33009
33352
33483
34962
35098
0
5
10
15
20
25
0
5000
10000
15000
20000
25000
30000
35000
40000
Q3FY19
Q4FY19
Q1FY20
Q2FY20
Q3FY20E
(%
)
| C
rore
Revenue EBITDA Margin PAT Margin
US approvals for Q3FY20 (Select pack)
Company Final Tentative
Aurobindo Pharma 4 1
Cadila Healthcare 6 4
Dr. Reddy's Labs 0 0
Lupin 4 0
Sun Pharma 2 1
Currency Movement
Source: Bloomberg
Top Picks
Apollo Hospitals
Ipca Laboratories
Research Analysts
Siddhant Khandekar
Mitesh Shah, CFA
Sudarshan Agarwal
Cheragh Sidhwa

ICICI Securities | Retail Research 44
ICICI Direct Research
Result Preview Q3FY20E
Exhibit 42: Company Specific view
Company Remarks
Apollo
Hospitals
Standalone sales are likely to grow ~15% YoY to |2501 crore on the back of 12% growth
in healthcare service business and 19% growth in pharmacy business. The pharmacy
business is expected to be largely driven by addition of new pharmacies while the hospital
segment is expected to be driven by strong growth at new hospitals. EBITDA margins are
likely to improve 279 bps YoY to 15.1% mainly due to improvement in new hospitals
margins and impact of IndAs 116. Net profit is expected to increase ~16% YoY to ~|101
crore mainly due to better operational performance which could be partially offset by
impact of IndAs 116
Aurobindo
Pharma
Revenues are expected to grow ~12% YoY to |5876 crore mainly due to 19% growth in US
led by strong growth in injectables and consolidation of Spectrum business. The growth is
likely to offset partially by decline in ARV and muted growth in RoW. EBITDA margins are
likely to decline 88bps to ~20%. Net profit is expected to decline 6% YoY to ~| 668 crore.
Delta vis-a-vis operational growth is mainly due to higher depreciation and taxation
Biocon
Revenues are likely to grow ~15% YoY |1774 crore mainly on the back of continuing
traction in the biologics. Similarly, contract research business (Syngene) is expected to
grow 15% YoY to |537.1 crore. EBITDA margins are expected to improve 43 bps YoY to
25.1% mainly due to better product mix. However, net profit is expected to decline ~1%
YoY to | 211 crore due to higher tax rate (23% vs 16.7% in Q3FY19).
Cadila
Healthcare
Revenues are expected to decline 4% YoY |3440 crore mainly due to seasonality impact at
Craft portfolio. EBITDA margins are likely to decline 467 bps YoY to ~22% mainly due to
higher employee expenses and other expenditure. Subsequently, Net profit is expected to
decline 35% YoY to |331 crore on the back of lower operational performance and higher
interest cost.
Divi's Lab
Revenues are expected to grow 9% YoY to |1467 crore mainly due to strong growth in
Carotenoid segment. EBITDA margins are expected to decline 545 bps to ~34% YoY due to
lower gross margins. Net profit is expected to decline ~5% YoY to | 360 crore on the back
of lower operational performance
Dr Reddy's
Revenues are likely to grow ~9% YoY to |4194 crore mainly due to 12% growth in
domestic formulations and 15% growth in PSAI. US growth on the other hand is likely to be
muted. EBITDA margins are likely to decline 57 bps YoY to 20.2% due to lower gross
margins. Net profit is expected to decline ~7% YoY to |467 crore mainly due to higher
other income in base year.
Ipca Lab
Revenues are expected to grow 19% YoY to |1128 crore mainly due to strong growth in
APIs, domestic formulations and exports institution business. Domestic formulations are
expected to grow 16% YoY to |489 crore. Export formulations to grow 14% to |322 crore
mainly due to strong growth in institutional formulations. EBITDA margins are likely to
decline 245 bps YoY to 22.0% mainly due to lower gross margins. Net profit is expected to
increase 9% YoY to |174 crore
Lupin
Revenues are expected to decline ~6% YoY to |4257 crore due to divestment of Kyowa
business in Japan and muted US growth. India business is expected to grow 13%. EBITDA
margins are likely to contract 122 bps to 15.5% mainly due to lower gross margins.
Adjusted net profit (excluding net income of | 2157 crore from Kyowa divestment
proceeds) is expected to grow 4% YoY to |203 crore. Delta vis-a-vis operational
performance is mainly due to base effect of tax outgo in Q3FY19
Sun
Pharma
Revenues are likely to grow 8% YoY to |8386 crore mainly due to 18% YoY in domestic
formulations and consolidation of Pola Pharma, which is likely to partially offset by 5%
decline in US business. Owing to higher base, Taro's sales are expected to decline ~11%
YoY to |1130 crore. EBITDA margins are expected to decline to 840 bps YoY to 19.4%
mainly mainly due to incremental cost of specialty products launched in the US.
Subsequently, net profit is expected to decline ~16% to |1046 crore
Torrent
Pharma
Revenues are expected grow mere ~1% YoY to |2075 crore. 10% YoY growth in domestic
formulations is likely to get offset by 24% de-growth in US business. EBITDA margins are
expected to improve 32 bps to ~27.7%. Net profit is expected to increase just 4% YoY to
|256 crore, due to higher tax rate.
Source: Company, ICICI Direct Research
Expected growth in Domestic formulations
(| cr) Q3FY20E Q3FY19 % Q2FY20 %
Biocon 138 212 -35.0 128 7.4
Cadila 947 846 12.0 978 -3.1
Ipca 489 422 16.0 543 -10.0
Lupin 1,345 1,190 13.0 1,342 0.2
Dr Reddy's 755 674 12.0 751 0.5
Sun Pharma2,634 2,235 17.8 2,515 4.7
Torrent 919 835 10.0 899 2.2
Total 5881 5224 12.6 10369 -43.3
Expected growth in US formulations
(| cr) Q3FY20E Q3FY19 % Q2FY20 %
Aurobindo 2,890 2,433 18.8 2,836 1.9
Cadila 1,564 1,934 -19.1 1,448 8.0
Lupin 1,413 1,417 -0.3 1,324 6.7
Dr Reddy's 1,518 1,483 2.3 1,427 6.4
Sun Pharma2,476 2,606 -5.0 2,390 3.6
Torrent 372 490 -24.1 380 -2.2
Total 10232 10364 -1.3 9805 4.4
Expected growth in Europe formulations
(| cr) Q3FY20E Q3FY19 % Q2FY20 %
Aurobindo 1,454 1,293 12.4 1,401 3.7
Cadila 47 60 -21.0 41 15.5
Dr Reddy's 274 203 35.0 276 -0.9
Lupin 159 142 12.0 172 -7.4
Torrent 264 267 -1.0 250 5.7
Total 2198 1965 11.9 2141 2.7
Expected growth in API segment
(| cr) Q3FY20E Q3FY19 % Q2FY20 %
Aurobindo 830 922 -10.0 806 3.0
Cadila 104 130 -20.0 105 -0.9
Divi's Lab 712 678 5.0 701 1.6
Ipca Labs 304 230 31.9 314 -3.4
Lupin 326 362 -10.0 305 6.9
Dr Reddy's 683 594 15.0 711 -3.9
Sun Pharma 447 426 5.0 468 -4.4
Total 2693 2664 1.1 2709 -0.57

ICICI Securities | Retail Research 45
ICICI Direct Research
Result Preview Q3FY20E
Real Estate
Commercial real estate marching towards a new record
As per CBRE report, commercial real estate has shown robust leasing
activity with total absorption rising by 30% to 47 million sq ft (msf) in
9MCY19. We note that this is almost equivalent to the 47.4 msf leasing seen
in entire CY18, which is indicative of the strong demand for office space in
India. Leasing activity was led by Bengaluru, followed by Hyderabad, NCR
and Mumbai, which together accounted for 80% of the activity.
Furthermore, the total office space supply has lagged the overall office
space absorption at 43.5 msf in 9MCY19, which has been pivotal in
declining office space vacancy rates vis-à-vis pushing the rental rates
upwards majorly in Bengaluru, Hyderabad and NCR. With leasing activity
expected to remain strong and expected to touch record high in CY19, our
coverage stocks like Brigade Enterprises and The Phoenix Mills are poised
to be key beneficiaries of this trend.
Government support expected to revive real estate sentiment
An Anarock report suggest that residential sales has risen albeit at a slower
rate in CY19, continuing the uptrend set forth in CY18. Residential sales
across top seven cities rose 5% YoY to 2.61 lakh units in CY19. While the
yearly trend seems to be on the up rise, sales were slower in H2CY19,
which showed a 22% decline as compared to H1CY19. On the supply front,
compared to H1CY19 it slowed down by 31% to 97,000 units in H2CY19.
Overall, on a yearly basis, supply increased by 21% YoY to 2.37 lakh units in
CY19. We note that overall demand & supply slowdown in residential
market seen in H2CY19 is reflective of the sector being entangled in the
liquidity crunch following NBFC crisis & the effects of the ban on subvention
schemes. However, on a positive note, government has announced several
measures to revive the residential market. The most prominent is the recent
| 25,000 crore Alternate Investment Fund announced by government to
provide support to ~4.58 lakh stalled housing units. This move could lead
to completion of more than 50% stuck projects which could revive
homebuyer sentiment, going ahead.
Sales volume expected to grow 15.6% YoY in Q3FY20E
In accordance with the broader market dynamics, our real estate universe is
expected to report sales volume de-growth of 6.3% QoQ to 10.7 lakh sq ft
(lsf) in Q3FY20E. Nonetheless, prudent large developers with strong
experience in the sector are expected to perform relatively better compared
to the overall market. Accordingly, sales volume of our real estate universe
players is expected to grow 15.6% YoY as Brigade Enterprises is expected
to clock 15.8% YoY sales volumes growth to 9.0 lsf in Q3FY20E. Also,
Oberoi Realty is expected to show 14.4% YoY growth in sales volumes to
1.7 lsf in Q3FY20E on account of lower sales volume base in Q3FY19.
Real estate PAT expected to remain flattish in Q3FY20E…
Our real estate universe revenue is expected to grow 4.7% YoY to | 1,731.7
crore. EBITDA margins are expected to expand 180 bps to 37.2%. Overall,
we expect our universe PAT to remain flattish YoY at | 259.5 crore.
Exhibit 43: Estimates for Q3FY20E: (Real Estate) (| Crore)
Revenue EBITDA PAT
Q3FY20E YoY QoQ Q3FY20E YoY QoQ Q3FY20E YoY QoQ
Oberoi Realty 497.6 -5.5 1.3 209.0 11.1 -1.8 136.9 -0.7 -0.8
Brigade Enterprises 754.6 9.7 2.6 196.2 11.5 3.2 41.4 -15.3 10.7
The Phoenix Mills 479.5 8.9 15.5 239.7 7.7 13.7 81.2 14.6 23.4
Total 1,731.7 4.7 5.5 644.9 10.0 5.1 259.5 0.7 7.6
Change (%) Change (%)Change (%)
Company
Source: Company, ICICI Direct Research
Topline & Profitability (Real Estate Universe)
16
54
20
56
1927
1642
1732
0
7
14
21
28
35
42
900
1200
1500
1800
2100
Q3FY19
Q4FY19
Q1FY20
Q2FY20
Q3FY20E
(%
)
| C
rore
Revenue EBITDA Margin PAT Margin
Sales volumes
1.5 1.5
2.4
1.4 1.7
7.8
9.6
11.3
10.0
9.0
0.0
2.0
4.0
6.0
8.0
10.0
12.0
Q3FY19
Q4FY19
Q1FY20
Q2FY20
Q3FY20E
Oberoi Realty Brigade Enterprises
Top Picks
Brigade Enterprises
Research Analysts
Deepak Purswani, CFA
Harsh Pathak
Bharat Chhoda
Cheragh Sidhwa
ICICI Securities | Retail Research 46
ICICI Direct Research
Result Preview Q3FY20E
Exhibit 44: Company Specific Views (Real Estate)
Company Remarks
Oberoi Realty
We anticipate Oberoi' (ORL) sales volumes to grow 14.2% YoY to 1.68 lakh sq ft (lsf)
given lower sales clocked in Q3FY19. On financial front, we expect topline to de-grow
5.8% YoY to | 495.6 crore on account of lower revenue recognition expected in
Q3FY20E. Overall, we anticipate ORL net income to remain flattish YoY at | 136.9
crore in Q3FY20E.
Key Monitorable: Progress on new launches such as Thane & Exquisite-III in
Goregaon, progress on annuity portfolio
The Phoenix Mills
We expect The Phoenix Mills' (Phoenix) revenues to grow steadily by 8.9% YoY to |
479.5 crore led by 13.7% YoY growth in retail segment income to | 329.6 crore on
account of healthy consumption trend during festive season in Q3FY20E. In the
residential segmental, the revenues are expected at | 28.8 crore in Q3FY20E vs. |
19.9 crore in Q3FY19. The company's EBITDA margin is expected to contract 50 bps
to 50% in Q3FY20E. Overall, we expect Phoenix's PAT to grow 4.1% YoY to | 81.2
crore in Q3FY20E.
Key Monitorable: Progress on under construction mall assets
Brigade
Enterprises
Brigade Enterprises' (BEL) sales momentum is expected to remain strong on the back
of recently launched big ticket projects in the affordable and mid premium category
such as Brigade Orchards Kino, Brigade Utopia and El Dorado. Hence, we expect its
sales volume to grow 15.8% YoY to 0.9 mn sq ft in Q3FY20E despite challenging
environment. On the financial front, we expect the company's topline to grow 9.7%
YoY to | 754.6 crore in Q3FY20E. Overall, we expect BEL's net income to decline
15.3% YoY to | 41.4 crore.
Key Monitorable: Pre-leasing and construction progress on Brigade Tech Garden and
WTC, Chennai
Source: Company, ICICI Direct Research

ICICI Securities | Retail Research 47
ICICI Direct Research
Result Preview Q3FY20E
Retail
Festive fervour, higher wedding dates to spur revenue growth
In the backdrop of the challenging market environment, retail sector
witnessed mixed results in Q2FY20, wherein high ticket discretionary items
were impacted the most. However, apparel segment appeared to be more
resilient in the discretionary spending. With festive season having panned
out decently, coupled with higher number of wedding dates in the quarter,
we expect retail coverage universe to report double digit topline growth
(12% YoY) in Q3FY20. Furthermore, various branded players (except Trent)
commenced their end of season sale period from mid-December, a similar
trend which was visible in the previous year as well. While majority of the
companies have incorporated in the new tax regime (major beneficiaries:
Bata, Page Industries, Titan Company), certain companies (Trent, ABFRL)
are still evaluating the tax rate to be adopted.
Green shoots in consumer sentiment visible; Trent to
outperform
While elevated gold prices (up 18% YTD) materially impacted the
grammage growth, the management of Titan indicated that festive season
had panned out to be reasonably moderate (September 28–October 31)
with retail sales growth of ~ 10% (regional jewellers sales declined 12-22%
during the festive period). Furthermore, green shoots were visible in
November-December, wherein demand for wedding jewellery (22%
revenue contribution) started gaining traction. We expect the jewellery
division for Titan to register revenue growth of 12% YoY in Q3FY20. Trent
has been one of the few companies that has consistently reported industry
best same stores sales growth (Westside: 13% SSSG in H1FY20), coupled
with aggressive store addition trends. We expect the growth momentum to
sustain and expect standalone revenues (Westside + Zudio) to grow 28%
YoY in Q3FY20. We expect ABFRL to report revenue growth of 10.8% YoY
to | 2497.7 crore, albeit on a high base of Q3FY19 (23% YoY revenue
growth). We expect revenues from Pantaloons division (40% of revenues)
to cross | 1000 crore quarterly run rate mark with growth of ~11% YoY.
Retail footprint expansion momentum to sustain
In H1FY20, ABFRL added 23 Pantaloons stores taking the total store count
to 331 stores. We expect the company to add another ten Pantaloons stores
in Q3FY20 (39 store addition YoY) with square feet addition of 1.2 lakh sq ft
QoQ (4.3 lakh sq ft YoY). Trent's value fashion business, Zudio has
witnessed exceptional ramp up with company adding ~44 new stores
(added 33 stores in FY19) in YTDFY20, taking the total store count to 84
Zudio stores. For FY20, the management has guided at adding ~100 Zudio
stores. For Titan, the management has trimmed down its store addition
guidance from 65 to 50 Tanishq stores in FY20, mainly due to operational
delays. It has already added 34 stores (1.17 lakh sq ft) in YTDFY20, which is
equivalent to FY19 store addition.
Exhibit 45: Estimates for Q3FY20E: (Retail) (| crore)
Revenue EBITDA PAT
Q3FY20E YoY QoQ Q3FY20E YoY QoQ Q3FY20E YoY QoQ
Aditya Birla Fashion & Retail 2,528.3 10.8 10.1 204.8 18.4 -40.8 60.4 -14.1 775.0
Bata India 849.2 9.1 17.6 179.6 9.8 -3.1 133.1 29.0 86.5
Titan Company 6,537.0 11.3 40.2 681.1 15.2 30.4 477.3 16.1 51.9
Trent Ltd 835.0 27.2 2.1 86.8 19.6 -34.6 60.1 49.1 56.9
Total 10,749.6 12.1 26 1,152.4 15.2 -2.9 730.8 17.0 69.6
Change (%)
Company
Change (%) Change (%)
Source: Company, ICICI Direct Research. We have not incorporated impact of IND-AS 116 accounting, hence QoQ variance are
not comparable.
Topline & Profitability (Coverage Universe)
9588
8152
8866
8499
10750
0
2
4
6
8
10
12
14
16
0
2000
4000
6000
8000
10000
Q3FY19
Q4FY19
Q1FY20
Q2FY20
Q3FY20E
(%
)
| C
rore
Revenue EBITDA Margin PAT Margin
Space addition- million sq. ft. (QoQ)
0.140.13
0.040.05
0.10
0.060.05
0.19
0.12
0.00
0.10
0.20
0.30
Q3FY18
Q4FY18
Q1FY19
Q2FY19
Q3FY19
Q4FY19
Q1FY20
Q2FY20
Q3FY20E
Pantaloons
Store addition –(QoQ) Pantaloons (ABFRL)
13
19
76
14
6 6
17
10
2
7
12
17
22
27
32
Q3FY18
Q4FY18
Q1FY19
Q2FY19
Q3FY19
Q4FY19
Q1FY20
Q2FY20
Q3FY20E
Pantaloons
Top Picks
Bata & Trent
Research Analysts
Bharat Chhoda
Cheragh Sidhwa
Bharat Chhoda
Cheragh Sidhwa
ICICI Securities | Retail Research 48
ICICI Direct Research
Result Preview Q3FY20E
Exhibit 46: Company Specific Views (Retail)
Company Remarks
Bata India
Having built a strong portfolio of premium brands, the management has now enhanced its
focus on maintaining a balance between value and volume growth. We expect Bata to
register steady revenue growth of 9.1% YoY to | 849.3 crore in Q3FY20. In Q3FY19, Bata
had reported its highest ever EBITDA margin of 21.0%, mainly driven by robust expansion in
gross margins (up 350 bps YoY to 58.6%). Hence, on a high base, we anticipate limited
scope of margin expansion. We expect EBITDA margins to remain steady YoY at 21.2%,
with gross margins increasing by 40 bps YoY to 59.0%. Reduction in tax rate and higher
other income is expected to boost PAT. We expect PAT to increase by 29% YoY to | 133.1
crore.
Titan
Company
H1FY20 has been a challenging period for Titan's jewellery division, mainly owing to
significant surge in gold prices and weak consumer sentiments impacting higher
discretionary items. With gold prices up by ~ 18% on a YTD basis, substantial decline in
grammage has led to subdued topline growth. In the previous conference call, the
management indicated that the festive season (28th Sep-31st Oct) panned out to be
moderate with retail sales growth of ~10%. Higher number of wedding dates in H2FY20 is
expected to perk up demand for wedding jewellery in the quarter (22% revenue
contribution). Hence, we expect Titan's jewellery division to report revenue growth of 12%
YoY. We expect watches division to report muted revenue growth of 1%. In Q3FY19, the
company had provided for IL&FS exposure (| 70.0 crore), which negatively impacted the
profitability at the EBITDA level. Hence, on a low base, we expect EBITDA margins to
improve 30 bps YoY to 10.4%. Reduction in taxation rate (25.2% vs. 31.3% in Q2FY19) is
expected to assist PAT growth, to a certain extent. Subsequently, PAT is expected to
grow 16.1% YoY to | 477.3 crore
Trent Ltd
Trent is one of the few companies that has consistently delivered robust performance
with healthy same stores sales growth coupled with aggressive store addition trends. We
expect standalone revenues (Westside + Zudio) to report healthy topline growth of 27.2%
YoY to | 835.0 crore. We expect Westside format (~85% of revenues) to report revenue
growth of 19% YoY driven by SSSG of 12%. Trent's value fashion business, Zudio has
witnessed exceptional ramp up with the company adding 33 stores in FY19. For FY20, the
management has guided at adding ~100 Zudio stores (44 stores added in YTDFY20).
Revenue contribution from Zudio has almost doubled to ~15%. We expect EBITDA margins
to decline 70 bps YoY to 10.4% owing to an increase in share of revenue from Zudio format
and front loading expenses of new store additions. Higher other income is expected to
assist PAT growth. We build in PAT growth of 49% YoY to | 60.1 crore (we have factored
in tax rate of 34.0%).
ABFRL
ABFRL reported strong performance in Q2FY20 (14% topline growth) driven by early festive
buying and enhanced momentum of sales promotion. We expect ABFRL to report revenue
growth of 10.8% YoY to | 2528.3 crore, albeit on a high base of Q3FY19 (23% YoY revenue
growth). We expect revenues from Pantaloons (40% of revenues) to cross | 1000 crore
quarterly run rate mark with growth of ~11% YoY. In H1FY20, ABFRL added ~ 23
Pantaloons stores and is expected to add another 10 stores in Q3FY20 taking the total
count to 341 stores. We expect revenue from lifestyle brand to report steady growth of 9%
YoY. We expect EBITDA margins to improve by 50 bps YoY to 8.1%, with EBITDA
increasing 18.4% YoY to | 204.8 crore.
Source: Company, ICICI Direct Research
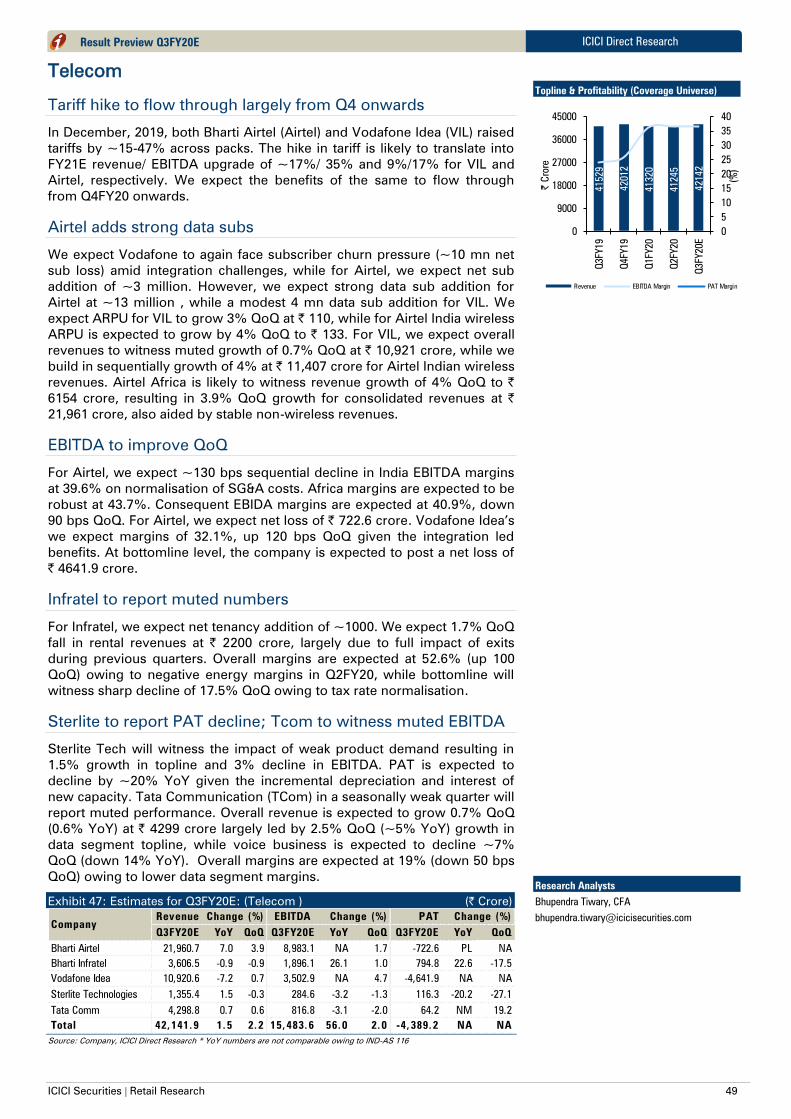
ICICI Securities | Retail Research 49
ICICI Direct Research
Result Preview Q3FY20E
Telecom
Tariff hike to flow through largely from Q4 onwards
In December, 2019, both Bharti Airtel (Airtel) and Vodafone Idea (VIL) raised
tariffs by ~15-47% across packs. The hike in tariff is likely to translate into
FY21E revenue/ EBITDA upgrade of ~17%/ 35% and 9%/17% for VIL and
Airtel, respectively. We expect the benefits of the same to flow through
from Q4FY20 onwards.
Airtel adds strong data subs
We expect Vodafone to again face subscriber churn pressure (~10 mn net
sub loss) amid integration challenges, while for Airtel, we expect net sub
addition of ~3 million. However, we expect strong data sub addition for
Airtel at ~13 million , while a modest 4 mn data sub addition for VIL. We
expect ARPU for VIL to grow 3% QoQ at | 110, while for Airtel India wireless
ARPU is expected to grow by 4% QoQ to | 133. For VIL, we expect overall
revenues to witness muted growth of 0.7% QoQ at | 10,921 crore, while we
build in sequentially growth of 4% at | 11,407 crore for Airtel Indian wireless
revenues. Airtel Africa is likely to witness revenue growth of 4% QoQ to |
6154 crore, resulting in 3.9% QoQ growth for consolidated revenues at |
21,961 crore, also aided by stable non-wireless revenues.
EBITDA to improve QoQ
For Airtel, we expect ~130 bps sequential decline in India EBITDA margins
at 39.6% on normalisation of SG&A costs. Africa margins are expected to be
robust at 43.7%. Consequent EBIDA margins are expected at 40.9%, down
90 bps QoQ. For Airtel, we expect net loss of | 722.6 crore. Vodafone Idea’s
we expect margins of 32.1%, up 120 bps QoQ given the integration led
benefits. At bottomline level, the company is expected to post a net loss of
| 4641.9 crore.
Infratel to report muted numbers
For Infratel, we expect net tenancy addition of ~1000. We expect 1.7% QoQ
fall in rental revenues at | 2200 crore, largely due to full impact of exits
during previous quarters. Overall margins are expected at 52.6% (up 100
QoQ) owing to negative energy margins in Q2FY20, while bottomline will
witness sharp decline of 17.5% QoQ owing to tax rate normalisation.
Sterlite to report PAT decline; Tcom to witness muted EBITDA
Sterlite Tech will witness the impact of weak product demand resulting in
1.5% growth in topline and 3% decline in EBITDA. PAT is expected to
decline by ~20% YoY given the incremental depreciation and interest of
new capacity. Tata Communication (TCom) in a seasonally weak quarter will
report muted performance. Overall revenue is expected to grow 0.7% QoQ
(0.6% YoY) at | 4299 crore largely led by 2.5% QoQ (~5% YoY) growth in
data segment topline, while voice business is expected to decline ~7%
QoQ (down 14% YoY). Overall margins are expected at 19% (down 50 bps
QoQ) owing to lower data segment margins.
Exhibit 47: Estimates for Q3FY20E: (Telecom ) (| Crore)
Revenue EBITDA PAT
Q3FY20E YoY QoQ Q3FY20E YoY QoQ Q3FY20E YoY QoQ
Bharti Airtel 21,960.7 7.0 3.9 8,983.1 NA 1.7 -722.6 PL NA
Bharti Infratel 3,606.5 -0.9 -0.9 1,896.1 26.1 1.0 794.8 22.6 -17.5
Vodafone Idea 10,920.6 -7.2 0.7 3,502.9 NA 4.7 -4,641.9 NA NA
Sterlite Technologies 1,355.4 1.5 -0.3 284.6 -3.2 -1.3 116.3 -20.2 -27.1
Tata Comm 4,298.8 0.7 0.6 816.8 -3.1 -2.0 64.2 NM 19.2
Total 42,141.9 1.5 2.2 15,483.6 56.0 2.0 -4,389.2 NA NA
Change (%)Change (%) Change (%)
Company
Source: Company, ICICI Direct Research * YoY numbers are not comparable owing to IND-AS 116
Topline & Profitability (Coverage Universe)
41529
42012
41320
41245
42142
0
5
10
15
20
25
30
35
40
0
9000
18000
27000
36000
45000
Q3FY19
Q4FY19
Q1FY20
Q2FY20
Q3FY20E
(%
)
| C
rore
Revenue EBITDA Margin PAT Margin
Research Analysts
Bhupendra Tiwary, CFA
Cheragh Sidhwa

ICICI Securities | Retail Research 50
ICICI Direct Research
Result Preview Q3FY20E
Exhibit 48: Company Specific view - Telecom
Company Remarks
Bharti Airtel
While overall subscriber base is expected to witness a modest addition of 3 million , we
expect data sub addition at a healthy 13 milllion largely aided by conversion from own
base. With higher proportion of data subs, reported ARPU is likely to witness ~4% QoQ
growth at | 133. Indian wireless revenues are expected to witness 4% QoQ growth at |
11,407 crore. Africa is likely to witness revenue growth of 4% QoQ to | 6154 crore.
Consolidated revenues are expected to be up 3.9% QoQ at | 21961 crore, further aided
by stable non-wireless revenues traction. We expect ~130 bps sequential decline in
India EBITDA margins at 39.6%. Africa margins are expected to be stable at 43.7%.
Reported EBIDA margins are expected at 40.9%, down 90 bps QoQ. Expected loss at
bottmline level is ~| 723 crore. Key monitorable : AGR issue outcome
Bharti Infratel
For Bharti Infratel, we bake in net tenancy addition of ~1000. We expect 1.7% QoQ
decline in rental revenues at | 2200 crore, largely due to full impact of exits during
previous quarters. Energy revenues would be flattish QoQ at | 1406 crore. Overall
margins are expected at 52.6% (up 100 bps QoQ) owing to negative energy margins in
Q2FY20. Key monitorable : future outlook and growth plans
Vodafone Idea
We expect churn for Vodafone Idea to continue amid integration led challenges and
consequently bake in ~10 million customer exit on a QoQ basis. WIth ARPU growth of
~3% QoQ at |112, we expect overall revenues to be up 0.7% QoQ at | 10,921 crore.
Reported margins are expected at 32.1%, up 120 bps QoQ given the integration led
opex benefits. The company is expected to post a net loss of | 4642 crore. Key
monitorable: AGR issue outcome
Sterlite Tech
Given the weak demand in product segment and management guidance of challenging
H2FY20, we bake in muted topline growth of 1.5% YoY to | 1355 crore. Consolidated
EBITDA is expected to decline by 3% YoY at | 285 crore while EBITDA margins for the
quarter are expected to decline 100 bps YoY to 21%, given the increased proportion of
services revenues, which have lower margins as well as price moderation in product
segment. PBT is expected to decline by ~29% YoY to | 172 crore given the
incremental depreciation and interest of new capacity. The report PAT at | 116 crore,
down 20% YoY with decline partially offset by lower tax rate. Key monitorable:
Management commentary on overall demand
Tata Comm
Revenue for the voice business is expected to decline ~7% QoQ (down 14% YoY) to |
814 crore. The data business, however, is expected to post 2.5% QoQ (~5% YoY)
growth in topline at | 3485 crore. Revenue growth was driven by growth services
(expected to be up~10% YoY) while traditional data segment is likely to witness ~3%
YoY growth, with stabilisation of operator consolidation. The overall revenue, therefore,
is expected to grow 2.8% QoQ (4.8% YoY) at | 4299 crore. Overall margins are expected
at 19% (down 50 bps QoQ) owing to normalisation of traditional data segment margins.
The data segment margins is expected at 21.5% (down 60 bps QoQ). Key
monitorable: Growth outlook commentary
Source: Company, ICICI Direct Research

ICICI Securities | Retail Research 51
ICICI Direct Research
Result Preview Q3FY20E
Others
Exhibit 49: Estimates for Q3FY20E: (Others ) (| Crore)
Revenue EBITDA PAT
Q3FY20E YoY QoQ Q3FY20E YoY QoQ Q3FY20E YoY QoQ
Kajaria Ceramics 799.0 5.3 11.8 117.9 -2.4 12.1 69.3 5.9 -25.6
Page Industries 772.1 4.6 -0.4 154.4 -6.6 3.6 110.2 8.2 -3.8
TTK Prestige 579.9 5.0 1.1 87.9 3.0 1.6 64.2 12.9 -20.1
TeamLease Services 1,328.6 13.3 4.8 23.8 -2.9 -2.9 19.6 -22.4 -3.0
United Spirits 2,448.7 -1.9 6.6 428.5 19.6 3.1 254.5 32.3 13.3
United Breweries 1,550.3 6.8 -1.8 217.0 -12.4 12.8 107.8 -1.3 -6.4
Total 7,478.6 4.3 3.8 1,029.5 2.8 5.8 625.6 13.5 -3.4
Change (%)Change (%)
Company
Change (%)
Source: Company, ICICI Direct Research
Exhibit 50: Company views
Company Remarks
Page Industries
We expect Page Industries to report moderate set of results in Q3FY20, mainly owing
to challenging market conditions (Liquidity issues faced by MBO's) and high base of
Q3FY19 (company had reported 12% YoY volume growth). We expect revenues to
increase by 4.6% YoY to | 757.3 crore, driven by 3% volume growth at 45.7 million
pieces and 2% hike in blended realisation at | 166/piece. We expect EBITDA margins
to decline 240 bps YoY to 20.0% (Q2FY20: 18.0%) mainly owing to negative operating
leverage. Reduction in taxation rate (25.2% vs. 37.0% in Q3FY19) is expected to assist
PAT growth. Subsequently, we expect PAT to increase 8.0% YoY to | 110.2 crore
TTK Prestige
H1FY20 has been a challenging period for TTK Prestige owing to sluggish demand
environment (especially in the rural segment) and increasing competiveness in entry-
level products. Cooker segment (32% of revenues) has been the most impacted
category, with revenue declining 5% in H1FY20. In a bid to address the challenges, the
management is undertaking various initiatives such as expanding distribution network,
launching new products across categories. We expect TTK to report revenue growth of
5% YoY to | 579.9 crore, albeit on high base of Q3FY20 (20% YOY growth). We expect
cookers and appliance segment to report revenue growth of 3% and 5%, respectively.
EBITDA margins are expected to decline 30 bps YoY at 15.2%. Reduction in tax rate
(25.2% vs. 33% in Q3FY19) is expected to assist PAT growth. Hence, we expect PAT
to grow 13% YoY to | 64.2 crore
TeamLease
Financials
For Q3FY20E, revenues are expected to grow 4.8% sequentially to | 1329 crore driven
by 4.2% QoQ growth in general staffing, 9.9% QoQ growth in specialised staffing
(supported by IMSI acquisition) and 12.6% QoQ growth in other HR services. Further,
we expect EBITDA margins to decline 10 bps QoQ to 1.8% mainly led by an
improvement in margin in specialised staffing. PAT is expected to dip 2.6% QoQ to |
19.6 crore mainly on account of dip in operating margins
United Spirits
Overall volumes are expected to remain flat YoY at 21.9 million cases, on the back of
mere 2% YoY growth in the Prestige and Above segment, while the popular segment
volumes are expected to de-grow at 2% YoY. We expect 2% de-growth in the net
revenues to | 2449 crore. Continued higher inflation in the raw material (ENA) may
cap the gross margin in the 47-48% range. However, absolute EBITDA is expected to
grow 20% YoY (from operational efficiencies and IND-AS impact). Subsequently PAT is
expected to grow 32% to | 255 crore (better operational performance and lower tax
rate)
United Breweries
Volumes are expected to grow 6% to 42 million cases while net revenues are expected
to grow 7% YoY to | 1550 crore. EBITDA margins are expected to decline by 310 bps to
14% due to higher input cost (Barley & Glass) with absolute EBITDA likely to decline
12% YoY to | 217 crore. Subsequently, PAT is expected to de-grow 1% YoY to | 108
crore (tax rate expected at 25.2%)
Kajaria Ceramics
The overall demand dynamics in the ceramic tiles sector still seems to be subdued
following stress in real estate sector.Competition intensity continues to remain high in
the sector. In this scenario, prudent ceramic players like Kajaria have given due
attention to their credit control at the expense of sales to maintain their healthy
balance sheet. Hence, we anticipate Kajaria's sales volume to grow at a slow rate of
5.6% YoY to 21.2 MSM. On the revenues front, we expect it to grow 5.3% YoY to |
799.0 crore mainly led by volume growth. Additionally, with stable gas prices
expectation in Q3FY20E, we expect EBITDA margin to remain flat QoQ at 14.8%.
Source: Company, ICICI Direct Research
Topline & Profitability (Coverage Universe)
7169
6911
7487
72
06
7479
0
2
4
6
8
10
12
14
16
0
2000
4000
6000
8000
Q3FY19
Q4FY19
Q1FY20
Q2FY20
Q3FY20E
(%
)
| C
rore
Revenue EBITDA Margin PAT Margin
Bharat Chhoda
Cheragh Sidhwa
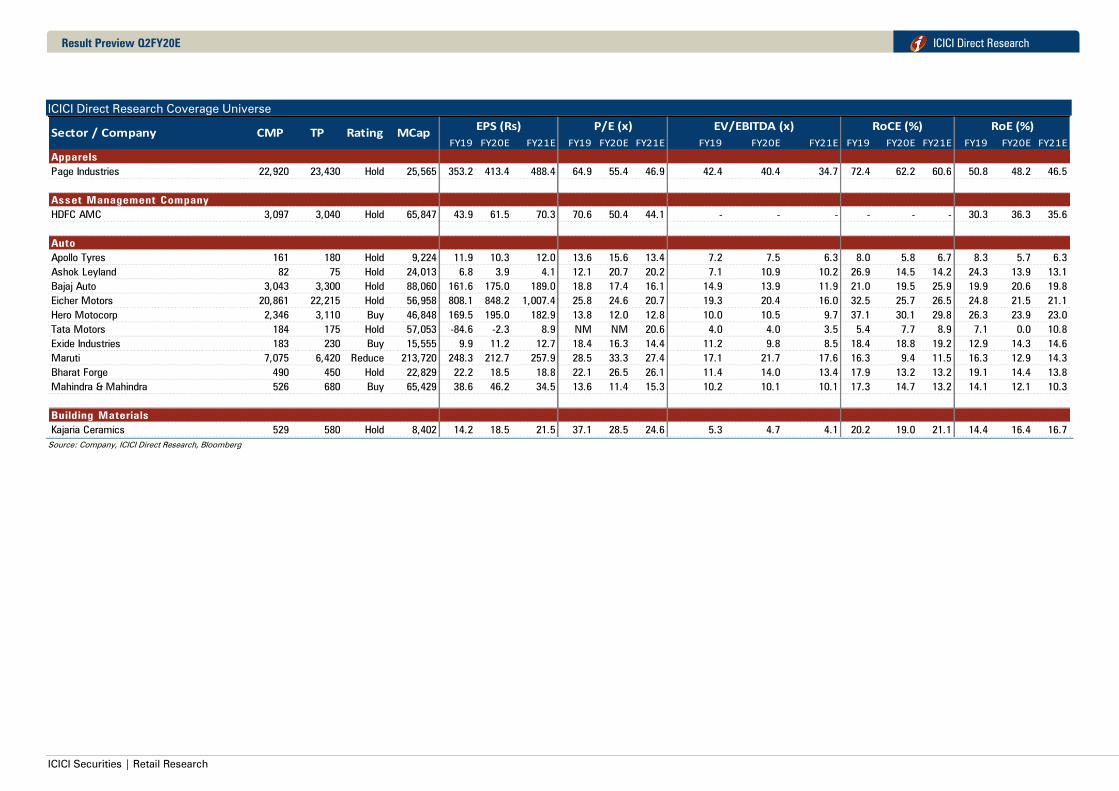
ICICI Securities | Retail Research
ICICI Direct Research Result Preview Q2FY20E
ICICI Direct Research Coverage Universe
FY19 FY20E FY21E FY19 FY20E FY21E FY19 FY20E FY21E FY19 FY20E FY21E FY19 FY20E FY21E
Apparels
Page Industries 22,920 23,430 Hold 25,565 353.2 413.4 488.4 64.9 55.4 46.9 42.4 40.4 34.7 72.4 62.2 60.6 50.8 48.2 46.5
RoA (%)
Asset Management Company
HDFC AMC 3,097 3,040 Hold 65,847 43.9 61.5 70.3 70.6 50.4 44.1 - - - - - - 30.3 36.3 35.6
RoA (%)
Auto
Apollo Tyres 161 180 Hold 9,224 11.9 10.3 12.0 13.6 15.6 13.4 7.2 7.5 6.3 8.0 5.8 6.7 8.3 5.7 6.3
Ashok Leyland 82 75 Hold 24,013 6.8 3.9 4.1 12.1 20.7 20.2 7.1 10.9 10.2 26.9 14.5 14.2 24.3 13.9 13.1
Bajaj Auto 3,043 3,300 Hold 88,060 161.6 175.0 189.0 18.8 17.4 16.1 14.9 13.9 11.9 21.0 19.5 25.9 19.9 20.6 19.8
Eicher Motors 20,861 22,215 Hold 56,958 808.1 848.2 1,007.4 25.8 24.6 20.7 19.3 20.4 16.0 32.5 25.7 26.5 24.8 21.5 21.1
Hero Motocorp 2,346 3,110 Buy 46,848 169.5 195.0 182.9 13.8 12.0 12.8 10.0 10.5 9.7 37.1 30.1 29.8 26.3 23.9 23.0
Tata Motors 184 175 Hold 57,053 -84.6 -2.3 8.9 NM NM 20.6 4.0 4.0 3.5 5.4 7.7 8.9 7.1 0.0 10.8
Exide Industries 183 230 Buy 15,555 9.9 11.2 12.7 18.4 16.3 14.4 11.2 9.8 8.5 18.4 18.8 19.2 12.9 14.3 14.6
Maruti 7,075 6,420 Reduce 213,720 248.3 212.7 257.9 28.5 33.3 27.4 17.1 21.7 17.6 16.3 9.4 11.5 16.3 12.9 14.3
Bharat Forge 490 450 Hold 22,829 22.2 18.5 18.8 22.1 26.5 26.1 11.4 14.0 13.4 17.9 13.2 13.2 19.1 14.4 13.8
Mahindra & Mahindra 526 680 Buy 65,429 38.6 46.2 34.5 13.6 11.4 15.3 10.2 10.1 10.1 17.3 14.7 13.2 14.1 12.1 10.3
Building Materials
Kajaria Ceramics 529 580 Hold 8,402 14.2 18.5 21.5 37.1 28.5 24.6 5.3 4.7 4.1 20.2 19.0 21.1 14.4 16.4 16.7
MCapSector / Company CMP TP RatingEV/EBITDA (x)P/E (x) RoCE (%) RoE (%)EPS (Rs)
Source: Company, ICICI Direct Research, Bloomberg

ICICI Securities | Retail Research
ICICI Direct Research Result Preview Q2FY20E
ICICI Direct Research Coverage Universe
FY19 FY20E FY21E FY19 FY20E FY21E FY19 FY20E FY21E FY19 FY20E FY21E FY19 FY20E FY21E
Capital Goods
SKF Bearing 2,139 1,840 Reduce 10,572 67.9 65.6 70.9 31.5 32.6 30.2 6.2 5.5 4.8 29.4 22.3 21.3 19.8 16.7 15.9
Timken India 911 1,020 Buy 6,852 19.8 25.9 29.1 46.1 35.1 31.3 5.1 4.5 4.0 15.7 18.1 17.9 11.1 12.8 12.7
NRB Bearing 95 95 Reduce 922 11.2 4.0 6.4 8.5 23.6 14.9 2.0 1.9 1.7 21.0 9.7 12.3 19.5 7.9 11.4
Thermax 1,091 1,215 Hold 13,003 23.1 29.6 36.2 47.2 36.9 30.1 4.8 4.3 3.9 18.0 16.3 18.0 11.2 11.7 12.9
KEC International 305 335 Buy 7,832 19.2 25.0 31.4 15.8 12.2 9.7 3.2 2.6 2.2 24.8 24.3 25.5 20.1 21.7 22.2
Kalpataru Power 415 600 Buy 6,421 26.1 35.3 39.2 15.9 11.7 10.6 2.0 1.7 1.5 19.6 19.4 18.9 12.7 14.5 13.9
Greaves Cotton 139 135 Hold 3,214 6.9 7.4 8.0 20.1 18.9 17.3 3.3 3.2 3.2 27.4 23.4 25.6 18.7 17.5 19.3
Larsen & Toubro 1,320 1,740 Buy 185,252 44.6 59.3 63.9 29.6 22.3 20.7 3.6 3.2 2.9 16.0 16.2 16.3 11.4 12.7 13.4
AIA Engineering 1,632 1,770 Hold 15,392 54.4 58.1 63.2 30.0 28.1 25.8 4.4 3.9 3.6 18.8 17.3 17.4 14.6 13.9 13.8
Bharat Electronics Ltd 96 130 Buy 23,379 7.9 7.2 8.2 12.1 13.3 11.7 2.6 2.4 2.1 30.0 24.9 25.8 21.4 17.8 18.3
Elgi Equipments 271 270 Hold 4,286 6.5 6.8 8.9 41.6 39.7 30.5 5.6 5.1 4.5 13.8 13.8 15.9 13.4 13.0 14.8
cement
Ambuja 200 190 Hold 39,772 5.6 7.2 7.9 35.7 28.0 25.5 1.9 1.9 1.8 11.6 14.4 15.8 6.0 6.7 7.2
Ultratech 4,250 5,350 Buy 122,660 83.7 143.8 163.0 50.8 29.6 26.1 3.7 3.3 3.0 9.0 12.5 13.6 7.6 11.2 11.4
JK Lakshmi 308 425 Buy 3,618 6.8 19.5 28.8 45.5 15.8 10.7 11.7 6.5 5.3 9.3 17.7 20.6 5.2 14.9 16.4
Jk cement 1,300 1,360 Buy 10,045 42.0 65.3 75.8 31.0 19.9 17.1 11.8 8.8 7.4 12.5 15.4 16.7 11.2 15.3 15.4
Shree cement 21,944 23,060 Buy 79,176 273.3 546.0 647.3 80.3 40.2 33.9 25.7 18.3 15.3 11.5 17.8 20.1 11.5 17.0 17.1
ACC 1,460 1,900 Buy 27,408 80.9 77.8 90.8 18.0 18.8 16.1 14.5 11.5 10.3 14.7 18.6 19.3 10.0 13.5 14.6
The Ramco Cement 789 1,020 Buy 18,589 21.5 30.6 34.6 36.7 25.8 22.8 19.7 14.7 12.3 8.1 10.4 11.6 11.7 14.9 15.0
Sagar Cements 555 700 Buy 1,219 6.2 29.1 35.6 89.9 19.1 15.6 11.1 8.0 7.8 6.4 9.8 9.8 1.6 6.5 6.8
Construction
NCC Limited 55 75 Buy 3,313 9.4 6.1 7.1 5.9 9.0 7.7 3.6 4.9 4.6 21.2 15.0 15.2 11.9 7.3 7.9
KNR Constructions 258 300 Buy 3,621 18.7 17.0 19.0 13.8 15.2 13.6 8.7 7.9 6.5 19.0 16.2 17.8 18.6 14.5 14.0
RoE (%)MCap
EPS (Rs) P/E (x) EV/EBITDA (x) RoCE (%)Sector / Company CMP TP Rating
Source: Company, ICICI Direct Research, Bloomberg
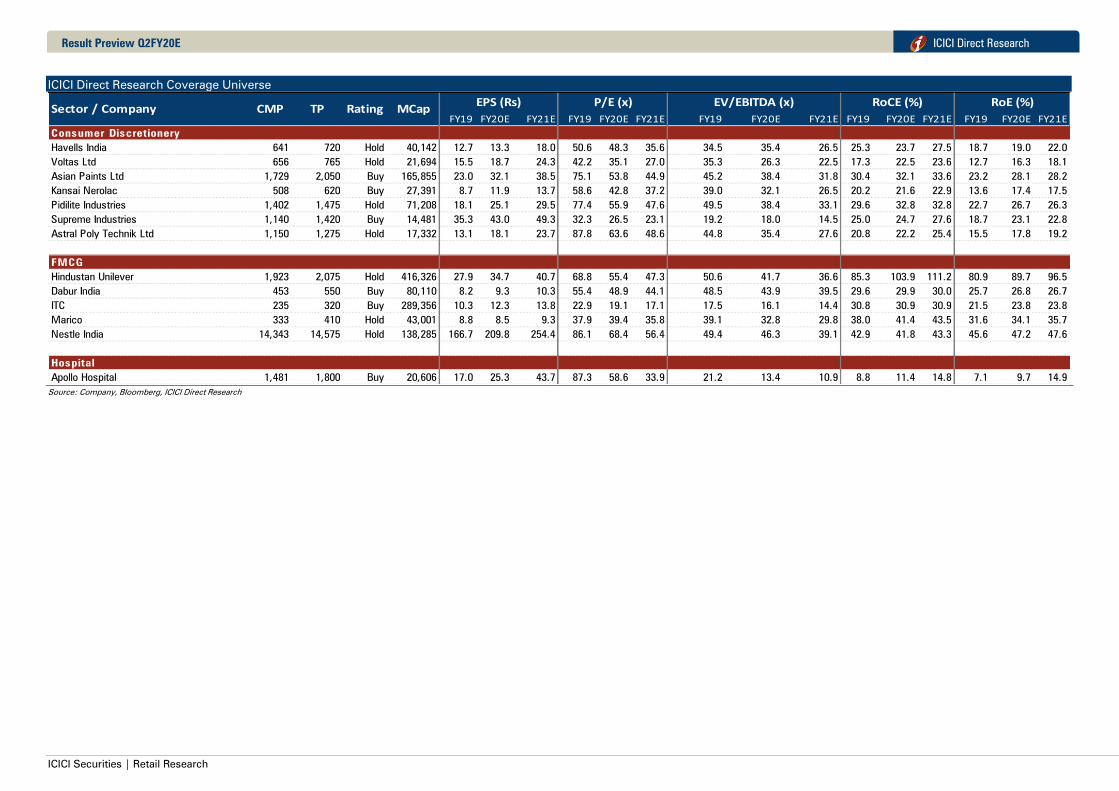
ICICI Securities | Retail Research
ICICI Direct Research Result Preview Q2FY20E
ICICI Direct Research Coverage Universe
FY19 FY20E FY21E FY19 FY20E FY21E FY19 FY20E FY21E FY19 FY20E FY21E FY19 FY20E FY21E
Consumer Discretionery
Havells India 641 720 Hold 40,142 12.7 13.3 18.0 50.6 48.3 35.6 34.5 35.4 26.5 25.3 23.7 27.5 18.7 19.0 22.0
Voltas Ltd 656 765 Hold 21,694 15.5 18.7 24.3 42.2 35.1 27.0 35.3 26.3 22.5 17.3 22.5 23.6 12.7 16.3 18.1
Asian Paints Ltd 1,729 2,050 Buy 165,855 23.0 32.1 38.5 75.1 53.8 44.9 45.2 38.4 31.8 30.4 32.1 33.6 23.2 28.1 28.2
Kansai Nerolac 508 620 Buy 27,391 8.7 11.9 13.7 58.6 42.8 37.2 39.0 32.1 26.5 20.2 21.6 22.9 13.6 17.4 17.5
Pidilite Industries 1,402 1,475 Hold 71,208 18.1 25.1 29.5 77.4 55.9 47.6 49.5 38.4 33.1 29.6 32.8 32.8 22.7 26.7 26.3
Supreme Industries 1,140 1,420 Buy 14,481 35.3 43.0 49.3 32.3 26.5 23.1 19.2 18.0 14.5 25.0 24.7 27.6 18.7 23.1 22.8
Astral Poly Technik Ltd 1,150 1,275 Hold 17,332 13.1 18.1 23.7 87.8 63.6 48.6 44.8 35.4 27.6 20.8 22.2 25.4 15.5 17.8 19.2
RoA (%)
FMCG
Hindustan Unilever 1,923 2,075 Hold 416,326 27.9 34.7 40.7 68.8 55.4 47.3 50.6 41.7 36.6 85.3 103.9 111.2 80.9 89.7 96.5
Dabur India 453 550 Buy 80,110 8.2 9.3 10.3 55.4 48.9 44.1 48.5 43.9 39.5 29.6 29.9 30.0 25.7 26.8 26.7
ITC 235 320 Buy 289,356 10.3 12.3 13.8 22.9 19.1 17.1 17.5 16.1 14.4 30.8 30.9 30.9 21.5 23.8 23.8
Marico 333 410 Hold 43,001 8.8 8.5 9.3 37.9 39.4 35.8 39.1 32.8 29.8 38.0 41.4 43.5 31.6 34.1 35.7
Nestle India 14,343 14,575 Hold 138,285 166.7 209.8 254.4 86.1 68.4 56.4 49.4 46.3 39.1 42.9 41.8 43.3 45.6 47.2 47.6
RoA (%)
Hospital
Apollo Hospital 1,481 1,800 Buy 20,606 17.0 25.3 43.7 87.3 58.6 33.9 21.2 13.4 10.9 8.8 11.4 14.8 7.1 9.7 14.9
RoCE (%)Sector / Company CMP TP Rating
RoE (%)MCap
EPS (Rs) P/E (x) EV/EBITDA (x)
Source: Company, Bloomberg, ICICI Direct Research

ICICI Securities | Retail Research
ICICI Direct Research Result Preview Q2FY20E
ICICI Direct Research Coverage Universe
FY19 FY20E FY21E FY19 FY20E FY21E FY19 FY20E FY21E FY19 FY20E FY21E FY19 FY20E FY21E
Hotels
EIH 142 195 Buy 8,131 2.6 3.1 4.4 55.2 46.2 32.3 22.4 25.9 20.1 9.2 7.7 10.1 6.4 5.7 7.8
Indian Hotels 141 175 Buy 16,727 2.5 4.1 4.2 56.7 34.0 33.7 23.0 18.4 14.8 8.0 9.5 11.3 6.7 11.0 10.1
Lemon Tree Hotels 59 73 Buy 4,698 0.7 0.9 1.3 83.0 63.8 46.7 34.0 23.2 18.6 5.5 6.8 7.8 6.7 8.1 10.1
RoA (%)
Insurance
SBI Life Insurance Company Ltd 985 1,000 Buy 98,510 13.4 13.9 17.1 73.4 71.0 57.7 - - - 17.8 17.9 18.2 19.2 17.4 18.6
RoA (%)
IT
HCL Technologies 585 600 Hold 158,749 37.3 38.3 42.7 15.7 15.3 13.7 10.5 9.3 8.0 26.9 25.2 24.6 24.5 21.3 20.6
Infosys 733 855 Buy 312,045 35.4 39.1 44.8 20.7 18.8 16.4 13.7 12.3 10.6 32.9 32.4 34.3 23.7 24.2 25.6
Larsen & Toubro Infotech Ltd 1,835 2,025 Buy 31,939 87.5 89.4 103.8 21.0 20.5 17.7 14.8 13.4 11.2 40.4 34.5 33.6 31.0 26.4 25.8
Mindtree Ltd 840 690 Hold 13,829 45.9 33.7 45.8 18.3 25.0 18.3 10.3 10.9 8.5 29.8 22.1 26.5 22.8 15.3 18.6
NIIT Technologies 1,657 1,415 Hold 10,348 65.7 73.6 83.2 25.2 22.5 19.9 12.4 10.6 9.2 25.2 23.5 23.8 19.5 19.2 19.2
Tata Consultancy Services 2,208 2,005 Hold 828,677 84.1 86.4 95.7 26.3 25.6 23.1 17.7 16.6 14.8 43.8 42.6 43.9 34.4 33.4 34.4
Tech Mahindra 778 900 Buy 75,087 47.7 47.6 54.9 16.3 16.3 14.2 9.9 9.8 8.3 23.6 21.2 21.9 21.2 18.5 18.7
Wipro Technologies 255 300 Buy 145,825 15.0 17.3 20.5 17.0 14.8 12.4 10.2 9.9 7.9 17.8 18.7 20.0 15.8 18.0 19.1
InfoEdge 2,549 2,630 Hold 31,227 23.1 23.1 36.6 110.2 110.3 69.6 90.9 70.1 55.8 18.6 20.0 21.8 12.1 11.2 15.8
TeamLease Services 2,500 2,670 Hold 4,274 57.1 51.5 78.6 43.8 48.5 31.8 46.0 40.1 27.7 18.6 15.4 19.1 18.3 14.1 17.9
Sector / Company CMP TP Rating MCapEPS (Rs) P/E (x) EV/EBITDA (x) RoCE (%) RoE (%)
Source: Company, Bloomberg, ICICI Direct Research

ICICI Securities | Retail Research
ICICI Direct Research Result Preview Q2FY20E
ICICI Direct Research Coverage Universe
FY19 FY20E FY21E FY19 FY20E FY21E FY19 FY20E FY21E FY19 FY20E FY21E FY19 FY20E FY21E
Logistics
Container Corporation of India 557 620 Buy 33,938 19.3 23.5 24.0 28.9 23.7 23.2 15.8 14.6 11.6 15.4 13.9 14.9 11.4 13.1 11.5
Transport Corporation of India 270 330 Buy 2,072 15.8 17.7 21.5 17.1 15.2 12.6 9.8 9.0 7.5 14.2 12.8 14.2 16.3 16.6 15.9
TCI Express 718 900 Buy 2,754 19.0 24.7 30.0 37.7 29.1 24.0 24.7 22.1 18.4 41.9 33.7 32.6 27.3 27.3 25.7
Mahindra Logistics 410 450 Buy 2,932 12.0 13.8 16.9 34.2 29.7 24.3 17.2 16.6 13.3 25.8 22.4 23.4 17.2 17.0 17.7
RoA (%)
Media
Sun TV Limited 426 500 Hold 16,782 36.4 36.7 41.7 11.7 11.6 10.2 6.3 7.0 5.8 38.5 30.3 30.0 25.9 23.1 22.8
Entertainment Network Limited 256 270 Hold 1,220 11.3 8.8 12.2 22.6 29.2 21.0 7.2 5.6 4.3 9.0 7.3 9.2 5.8 4.4 5.9
Inox Leisure Ltd 377 465 Buy 3,875 13.0 10.8 16.9 28.9 34.9 22.2 13.4 10.3 8.4 19.6 11.8 14.1 14.2 15.4 20.0
PVR Limited 1,865 2,200 Buy 9,572 39.2 25.3 43.8 47.6 73.8 42.6 18.8 12.2 10.4 13.8 9.5 11.3 14.8 9.6 14.4
Zee Entertainment Enterprises Ltd 268 352 Hold 25,746 16.1 19.5 22.0 16.7 13.7 12.2 12.5 11.7 10.3 25.7 24.5 22.4 15.7 17.3 15.9
TV Today Network Limited 243 380 Buy 1,450 22.0 24.1 31.7 11.1 10.1 7.7 8.0 7.4 5.9 26.2 28.7 29.8 16.9 18.4 21.8
RoA (%)
Metals, Mining & Pipes
Tata Steel 477 470 Buy 54,164 78.6 42.1 67.7 6.1 11.3 7.0 4.5 6.0 4.8 12.7 7.5 9.3 13.0 7.4 10.5
JSW Steel 266 235 Hold 64,262 31.3 20.7 19.9 8.5 12.9 13.4 6.2 9.7 8.5 15.8 9.0 10.3 21.7 15.0 13.1
NMDC 128 110 Hold 39,085 14.7 12.1 10.9 8.7 10.6 11.8 4.3 5.0 5.5 26.7 19.3 16.4 17.9 12.7 10.8
Hindalco 209 210 Hold 47,043 24.7 20.4 25.3 8.5 10.3 8.3 5.2 5.8 5.0 10.3 8.6 9.6 9.6 7.2 8.3
Hindustan Zinc 213 235 Hold 90,063 18.8 18.2 20.6 11.3 11.7 10.3 6.9 6.8 5.3 29.2 24.8 25.4 23.7 19.8 19.6
Graphite India 296 330 Buy 5,773 173.8 40.1 55.0 1.7 7.4 5.4 0.6 3.3 2.1 88.8 20.6 24.8 63.5 15.6 18.7
Coal India 207 225 Hold 127,353 27.6 28.4 30.4 7.5 7.3 6.8 8.2 10.1 9.2 94.5 67.3 58.9 66.2 53.5 45.8
Ratnamani Metals and Tubes 1,114 1,150 Buy 5,205 54.1 70.8 79.1 20.6 15.7 14.1 10.9 10.1 8.6 24.3 22.9 23.4 16.6 18.4 17.5
RoCE (%)Sector / Company CMP TP Rating
RoE (%)MCap
EPS (Rs) P/E (x) EV/EBITDA (x)
Source: Company, Bloomberg, ICICI Direct Research
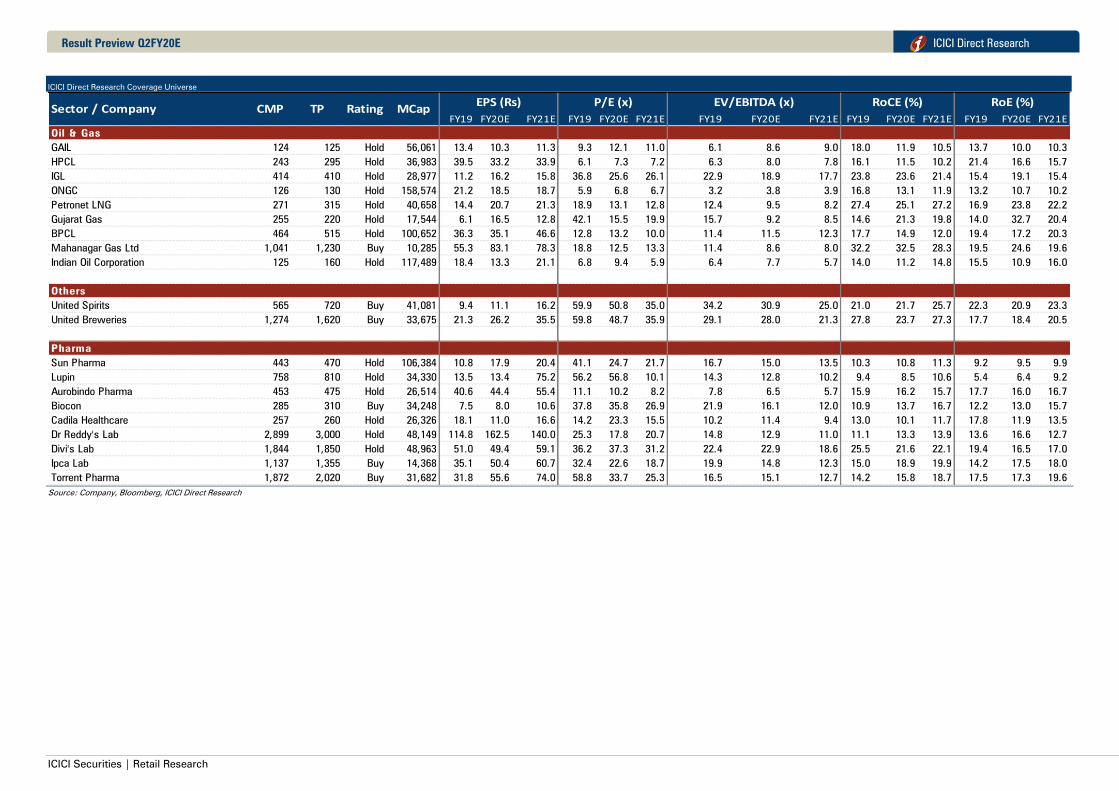
ICICI Securities | Retail Research
ICICI Direct Research Result Preview Q2FY20E
ICICI Direct Research Coverage Universe
FY19 FY20E FY21E FY19 FY20E FY21E FY19 FY20E FY21E FY19 FY20E FY21E FY19 FY20E FY21E
Oil & Gas
GAIL 124 125 Hold 56,061 13.4 10.3 11.3 9.3 12.1 11.0 6.1 8.6 9.0 18.0 11.9 10.5 13.7 10.0 10.3
HPCL 243 295 Hold 36,983 39.5 33.2 33.9 6.1 7.3 7.2 6.3 8.0 7.8 16.1 11.5 10.2 21.4 16.6 15.7
IGL 414 410 Hold 28,977 11.2 16.2 15.8 36.8 25.6 26.1 22.9 18.9 17.7 23.8 23.6 21.4 15.4 19.1 15.4
ONGC 126 130 Hold 158,574 21.2 18.5 18.7 5.9 6.8 6.7 3.2 3.8 3.9 16.8 13.1 11.9 13.2 10.7 10.2
Petronet LNG 271 315 Hold 40,658 14.4 20.7 21.3 18.9 13.1 12.8 12.4 9.5 8.2 27.4 25.1 27.2 16.9 23.8 22.2
Gujarat Gas 255 220 Hold 17,544 6.1 16.5 12.8 42.1 15.5 19.9 15.7 9.2 8.5 14.6 21.3 19.8 14.0 32.7 20.4
BPCL 464 515 Hold 100,652 36.3 35.1 46.6 12.8 13.2 10.0 11.4 11.5 12.3 17.7 14.9 12.0 19.4 17.2 20.3
Mahanagar Gas Ltd 1,041 1,230 Buy 10,285 55.3 83.1 78.3 18.8 12.5 13.3 11.4 8.6 8.0 32.2 32.5 28.3 19.5 24.6 19.6
Indian Oil Corporation 125 160 Hold 117,489 18.4 13.3 21.1 6.8 9.4 5.9 6.4 7.7 5.7 14.0 11.2 14.8 15.5 10.9 16.0
RoA (%)
Others
United Spirits 565 720 Buy 41,081 9.4 11.1 16.2 59.9 50.8 35.0 34.2 30.9 25.0 21.0 21.7 25.7 22.3 20.9 23.3
United Breweries 1,274 1,620 Buy 33,675 21.3 26.2 35.5 59.8 48.7 35.9 29.1 28.0 21.3 27.8 23.7 27.3 17.7 18.4 20.5
RoA (%)
Pharma
Sun Pharma 443 470 Hold 106,384 10.8 17.9 20.4 41.1 24.7 21.7 16.7 15.0 13.5 10.3 10.8 11.3 9.2 9.5 9.9
Lupin 758 810 Hold 34,330 13.5 13.4 75.2 56.2 56.8 10.1 14.3 12.8 10.2 9.4 8.5 10.6 5.4 6.4 9.2
Aurobindo Pharma 453 475 Hold 26,514 40.6 44.4 55.4 11.1 10.2 8.2 7.8 6.5 5.7 15.9 16.2 15.7 17.7 16.0 16.7
Biocon 285 310 Buy 34,248 7.5 8.0 10.6 37.8 35.8 26.9 21.9 16.1 12.0 10.9 13.7 16.7 12.2 13.0 15.7
Cadila Healthcare 257 260 Hold 26,326 18.1 11.0 16.6 14.2 23.3 15.5 10.2 11.4 9.4 13.0 10.1 11.7 17.8 11.9 13.5
Dr Reddy's Lab 2,899 3,000 Hold 48,149 114.8 162.5 140.0 25.3 17.8 20.7 14.8 12.9 11.0 11.1 13.3 13.9 13.6 16.6 12.7
Divi's Lab 1,844 1,850 Hold 48,963 51.0 49.4 59.1 36.2 37.3 31.2 22.4 22.9 18.6 25.5 21.6 22.1 19.4 16.5 17.0
Ipca Lab 1,137 1,355 Buy 14,368 35.1 50.4 60.7 32.4 22.6 18.7 19.9 14.8 12.3 15.0 18.9 19.9 14.2 17.5 18.0
Torrent Pharma 1,872 2,020 Buy 31,682 31.8 55.6 74.0 58.8 33.7 25.3 16.5 15.1 12.7 14.2 15.8 18.7 17.5 17.3 19.6
Sector / Company CMP TP Rating MCapEPS (Rs) P/E (x) EV/EBITDA (x) RoCE (%) RoE (%)
Source: Company, Bloomberg, ICICI Direct Research
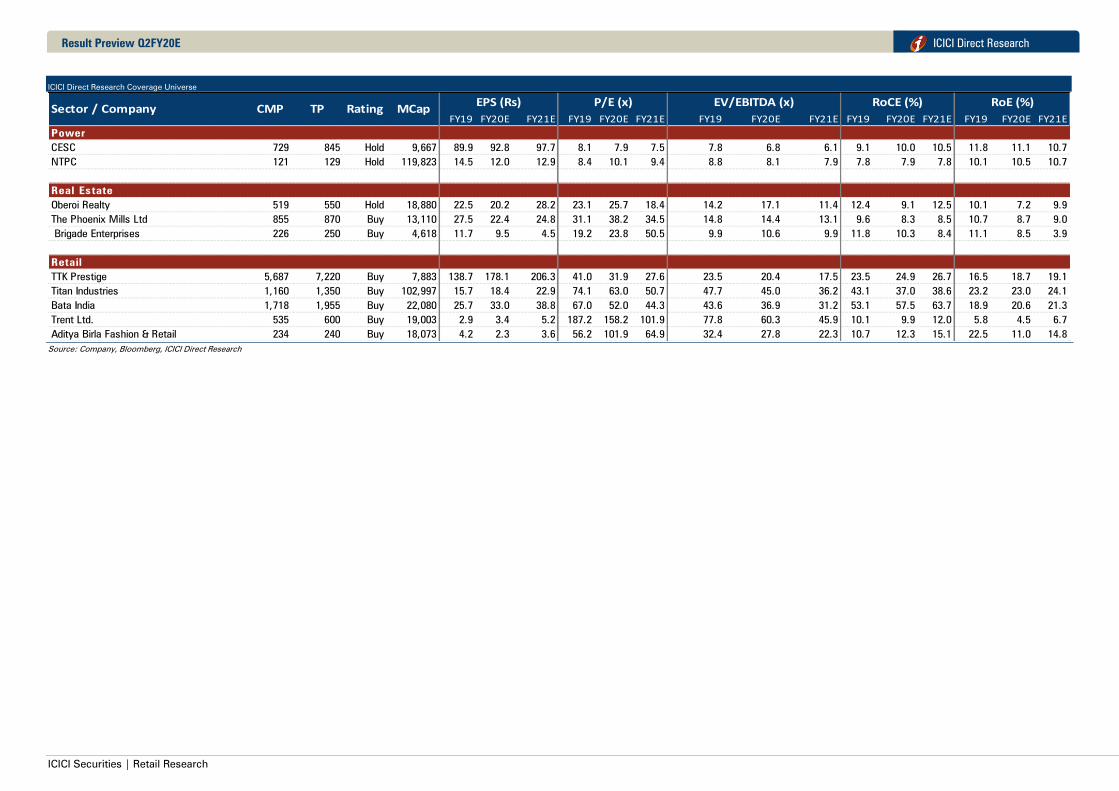
ICICI Securities | Retail Research
ICICI Direct Research Result Preview Q2FY20E
ICICI Direct Research Coverage Universe
FY19 FY20E FY21E FY19 FY20E FY21E FY19 FY20E FY21E FY19 FY20E FY21E FY19 FY20E FY21E
Power
CESC 729 845 Hold 9,667 89.9 92.8 97.7 8.1 7.9 7.5 7.8 6.8 6.1 9.1 10.0 10.5 11.8 11.1 10.7
NTPC 121 129 Hold 119,823 14.5 12.0 12.9 8.4 10.1 9.4 8.8 8.1 7.9 7.8 7.9 7.8 10.1 10.5 10.7
RoA (%)
Real Estate
Oberoi Realty 519 550 Hold 18,880 22.5 20.2 28.2 23.1 25.7 18.4 14.2 17.1 11.4 12.4 9.1 12.5 10.1 7.2 9.9
The Phoenix Mills Ltd 855 870 Buy 13,110 27.5 22.4 24.8 31.1 38.2 34.5 14.8 14.4 13.1 9.6 8.3 8.5 10.7 8.7 9.0
Brigade Enterprises 226 250 Buy 4,618 11.7 9.5 4.5 19.2 23.8 50.5 9.9 10.6 9.9 11.8 10.3 8.4 11.1 8.5 3.9
RoA (%)
Retail
TTK Prestige 5,687 7,220 Buy 7,883 138.7 178.1 206.3 41.0 31.9 27.6 23.5 20.4 17.5 23.5 24.9 26.7 16.5 18.7 19.1
Titan Industries 1,160 1,350 Buy 102,997 15.7 18.4 22.9 74.1 63.0 50.7 47.7 45.0 36.2 43.1 37.0 38.6 23.2 23.0 24.1
Bata India 1,718 1,955 Buy 22,080 25.7 33.0 38.8 67.0 52.0 44.3 43.6 36.9 31.2 53.1 57.5 63.7 18.9 20.6 21.3
Trent Ltd. 535 600 Buy 19,003 2.9 3.4 5.2 187.2 158.2 101.9 77.8 60.3 45.9 10.1 9.9 12.0 5.8 4.5 6.7
Aditya Birla Fashion & Retail 234 240 Buy 18,073 4.2 2.3 3.6 56.2 101.9 64.9 32.4 27.8 22.3 10.7 12.3 15.1 22.5 11.0 14.8
RoCE (%)Sector / Company CMP TP Rating
RoE (%)MCap
EPS (Rs) P/E (x) EV/EBITDA (x)
Source: Company, Bloomberg, ICICI Direct Research
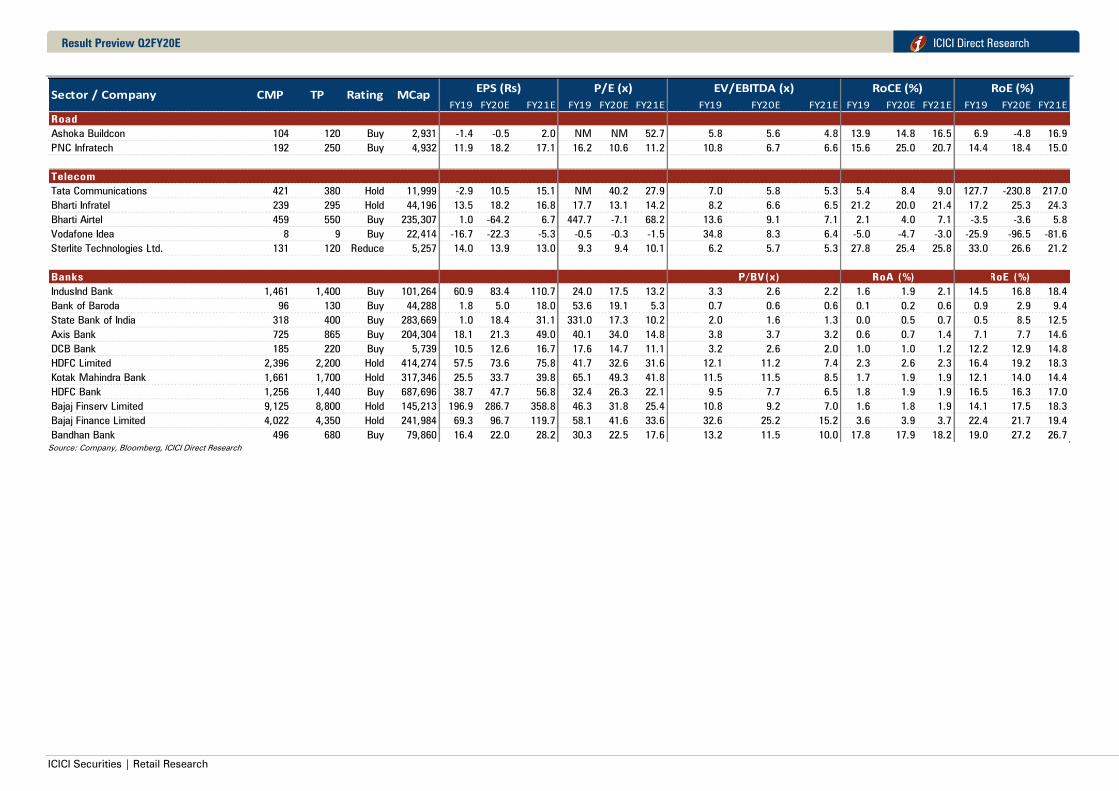
ICICI Securities | Retail Research
ICICI Direct Research Result Preview Q2FY20E
FY19 FY20E FY21E FY19 FY20E FY21E FY19 FY20E FY21E FY19 FY20E FY21E FY19 FY20E FY21E
Road
Ashoka Buildcon 104 120 Buy 2,931 -1.4 -0.5 2.0 NM NM 52.7 5.8 5.6 4.8 13.9 14.8 16.5 6.9 -4.8 16.9
PNC Infratech 192 250 Buy 4,932 11.9 18.2 17.1 16.2 10.6 11.2 10.8 6.7 6.6 15.6 25.0 20.7 14.4 18.4 15.0
RoA (%)
Telecom
Tata Communications 421 380 Hold 11,999 -2.9 10.5 15.1 NM 40.2 27.9 7.0 5.8 5.3 5.4 8.4 9.0 127.7 -230.8 217.0
Bharti Infratel 239 295 Hold 44,196 13.5 18.2 16.8 17.7 13.1 14.2 8.2 6.6 6.5 21.2 20.0 21.4 17.2 25.3 24.3
Bharti Airtel 459 550 Buy 235,307 1.0 -64.2 6.7 447.7 -7.1 68.2 13.6 9.1 7.1 2.1 4.0 7.1 -3.5 -3.6 5.8
Vodafone Idea 8 9 Buy 22,414 -16.7 -22.3 -5.3 -0.5 -0.3 -1.5 34.8 8.3 6.4 -5.0 -4.7 -3.0 -25.9 -96.5 -81.6
Sterlite Technologies Ltd. 131 120 Reduce 5,257 14.0 13.9 13.0 9.3 9.4 10.1 6.2 5.7 5.3 27.8 25.4 25.8 33.0 26.6 21.2
RoA (%)
Banks P/BV(x) RoA (%) RoE (%)
IndusInd Bank 1,461 1,400 Buy 101,264 60.9 83.4 110.7 24.0 17.5 13.2 3.3 2.6 2.2 1.6 1.9 2.1 14.5 16.8 18.4
Bank of Baroda 96 130 Buy 44,288 1.8 5.0 18.0 53.6 19.1 5.3 0.7 0.6 0.6 0.1 0.2 0.6 0.9 2.9 9.4
State Bank of India 318 400 Buy 283,669 1.0 18.4 31.1 331.0 17.3 10.2 2.0 1.6 1.3 0.0 0.5 0.7 0.5 8.5 12.5
Axis Bank 725 865 Buy 204,304 18.1 21.3 49.0 40.1 34.0 14.8 3.8 3.7 3.2 0.6 0.7 1.4 7.1 7.7 14.6
DCB Bank 185 220 Buy 5,739 10.5 12.6 16.7 17.6 14.7 11.1 3.2 2.6 2.0 1.0 1.0 1.2 12.2 12.9 14.8
HDFC Limited 2,396 2,200 Hold 414,274 57.5 73.6 75.8 41.7 32.6 31.6 12.1 11.2 7.4 2.3 2.6 2.3 16.4 19.2 18.3
Kotak Mahindra Bank 1,661 1,700 Hold 317,346 25.5 33.7 39.8 65.1 49.3 41.8 11.5 11.5 8.5 1.7 1.9 1.9 12.1 14.0 14.4
HDFC Bank 1,256 1,440 Buy 687,696 38.7 47.7 56.8 32.4 26.3 22.1 9.5 7.7 6.5 1.8 1.9 1.9 16.5 16.3 17.0
Bajaj Finserv Limited 9,125 8,800 Hold 145,213 196.9 286.7 358.8 46.3 31.8 25.4 10.8 9.2 7.0 1.6 1.8 1.9 14.1 17.5 18.3
Bajaj Finance Limited 4,022 4,350 Hold 241,984 69.3 96.7 119.7 58.1 41.6 33.6 32.6 25.2 15.2 3.6 3.9 3.7 22.4 21.7 19.4
Bandhan Bank 496 680 Buy 79,860 16.4 22.0 28.2 30.3 22.5 17.6 13.2 11.5 10.0 17.8 17.9 18.2 19.0 27.2 26.7
Sector / Company CMP TP Rating MCapEPS (Rs) P/E (x) EV/EBITDA (x) RoCE (%) RoE (%)
Source: Company, Bloomberg, ICICI Direct Research

ICICI Securities | Retail Research
ICICI Direct Research Result Preview Q3FY20E
RATING RATIONALE
ICICI Direct endeavours to provide objective opinions and recommendations. ICICI Direct assigns ratings to its stocks
according to their notional target price vs. current market price and then categorises them as Buy, Hold, Reduce and
Sell. The performance horizon is two years unless specified and the notional target price is defined as the analysts'
valuation for a stock
Buy: >15%;
Hold: -5% to 15%;
Reduce: -5% to -15%;
Sell: <-15%
Pankaj Pandey Head – Research [email protected]
ICICI Direct Research Desk,
ICICI Securities Limited,
1st Floor, Akruti Trade Centre,
Road No 7, MIDC,
Andheri (East)
Mumbai – 400 093
ICICI Securities | Retail Research 53
ICICI Direct Research Result Preview Q3FY20E
ANALYST CERTIFICATION
We /I Pankaj Pandey, MBA, Research Analysts, authors and the names subscribed to this report, hereby certify that all of the views expressed in this research report accurately reflect our views about the subject
issuer(s) or securities. We also certify that no part of our compensation was, is, or will be directly or indirectly related to the specific recommendation(s) or view(s) in this report. It is also confirmed that
above mentioned Analysts of this report have not received any compensation from the companies mentioned in the report in the preceding twelve months and do not serve as an officer, director or
employee of the companies mentioned in the report.
Terms & conditions and other disclosures:
ICICI Securities Limited (ICICI Securities) is a full-service, integrated investment banking and is, inter alia, engaged in the business of stock brokering and distribution of financial products. ICICI Securities
Limited is a SEBI registered Research Analyst with SEBI Registration Number – INH000000990. ICICI Securities Limited SEBI Registration is INZ000183631 for stock broker. ICICI Securities is a subsidiary of
ICICI Bank which is India’s largest private sector bank and has its various subsidiaries engaged in businesses of housing finance, asset management, life insurance, general insurance, venture capital fund
management, etc. (“associates”), the details in respect of which are available on www.icicibank.com
ICICI Securities is one of the leading merchant bankers/ underwriters of securities and participate in virtually all securities trading markets in India. We and our associates might have investment banking
and other business relationship with a significant percentage of companies covered by our Investment Research Department. ICICI Securities generally prohibits its analysts, persons reporting to analysts
and their relatives from maintaining a financial interest in the securities or derivatives of any companies that the analysts cover.
Recommendation in reports based on technical and derivative analysis centre on studying charts of a stock's price movement, outstanding positions, trading volume etc as opposed to focusing on a
company's fundamentals and, as such, may not match with the recommendation in fundamental reports. Investors may visit icicidirect.com to view the Fundamental and Technical Research Reports.
Our proprietary trading and investment businesses may make investment decisions that are inconsistent with the recommendations expressed herein.
ICICI Securities Limited has two independent equity research groups: Institutional Research and Retail Research. This report has been prepared by the Retail Research. The views and opinions expressed in
this document may or may not match or may be contrary with the views, estimates, rating, target price of the Institutional Research.
The information and opinions in this report have been prepared by ICICI Securities and are subject to change without any notice. The report and information contained herein is strictly confidential and
meant solely for the selected recipient and may not be altered in any way, transmitted to, copied or distributed, in part or in whole, to any other person or to the media or reproduced in any form, without
prior written consent of ICICI Securities. While we would endeavour to update the information herein on a reasonable basis, ICICI Securities is under no obligation to update or keep the information current.
Also, there may be regulatory, compliance or other reasons that may prevent ICICI Securities from doing so. Non-rated securities indicate that rating on a particular security has been suspended
temporarily and such suspension is in compliance with applicable regulations and/or ICICI Securities policies, in circumstances where ICICI Securities might be acting in an advisory capacity to this
company, or in certain other circumstances.
This report is based on information obtained from public sources and sources believed to be reliable, but no independent verification has been made nor is its accuracy or completeness guaranteed. This
report and information herein is solely for informational purpose and shall not be used or considered as an offer document or solicitation of offer to buy or sell or subscribe for securities or other financial
instruments. Though disseminated to all the customers simultaneously, not all customers may receive this report at the same time. ICICI Securities will not treat recipients as customers by virtue of their
receiving this report. Nothing in this report constitutes investment, legal, accounting and tax advice or a representation that any investment or strategy is suitable or appropriate to your specific
circumstances. The securities discussed and opinions expressed in this report may not be suitable for all investors, who must make their own investment decisions, based on their own investment
objectives, financial positions and needs of specific recipient. This may not be taken in substitution for the exercise of independent judgment by any recipient. The recipient should independently evaluate
the investment risks. The value and return on investment may vary because of changes in interest rates, foreign exchange rates or any other reason. ICICI Securities accepts no liabilities whatsoever for any
loss or damage of any kind arising out of the use of this report. Past performance is not necessarily a guide to future performance. Investors are advised to see Risk Disclosure Document to understand the
risks associated before investing in the securities markets. Actual results may differ materially from those set forth in projections. Forward-looking statements are not predictions and may be subject to
change without notice.
ICICI Securities or its associates might have managed or co-managed public offering of securities for the subject company or might have been mandated by the subject company for any other assignment
in the past twelve months.
ICICI Securities or its associates might have received any compensation from the companies mentioned in the report during the period preceding twelve months from the date of this report for services in
respect of managing or co-managing public offerings, corporate finance, investment banking or merchant banking, brokerage services or other advisory service in a merger or specific transaction.
ICICI Securities encourages independence in research report preparation and strives to minimize conflict in preparation of research report. ICICI Securities or its associates or its analysts did not receive any
compensation or other benefits from the companies mentioned in the report or third party in connection with preparation of the research report. Accordingly, neither ICICI Securities nor Research Analysts
and their relatives have any material conflict of interest at the time of publication of this report.
Compensation of our Research Analysts is not based on any specific merchant banking, investment banking or brokerage service transactions.
ICICI Securities or its subsidiaries collectively or Research Analysts or their relatives do not own 1% or more of the equity securities of the Company mentioned in the report as of the last day of the month
preceding the publication of the research report.
Since associates of ICICI Securities are engaged in various financial service businesses, they might have financial interests or beneficial ownership in various companies including the subject
company/companies mentioned in this report.
ICICI Securities may have issued other reports that are inconsistent with and reach different conclusion from the information presented in this report.
Neither the Research Analysts nor ICICI Securities have been engaged in market making activity for the companies mentioned in the report.
We submit that no material disciplinary action has been taken on ICICI Securities by any Regulatory Authority impacting Equity Research Analysis activities.
This report is not directed or intended for distribution to, or use by, any person or entity who is a citizen or resident of or located in any locality, state, country or other jurisdiction, where such distribution,
publication, availability or use would be contrary to law, regulation or which would subject ICICI Securities and affiliates to any registration or licensing requirement within such jurisdiction. The securities
described herein may or may not be eligible for sale in all jurisdictions or to certain category of investors. Persons in whose possession this document may come are required to inform themselves of and
to observe such restriction.
ICICI Securities has received an investment banking mandate from Government of India for disinvestment in Bharat Heavy Electricals Limited. This report is prepared based on publicly available information