2.0 KOREA - UNIST
94
Attribution-NonCommercial-NoDerivs 2.0 KOREA You are free to : Share — copy and redistribute the material in any medium or format Under the follwing terms : Attribution — You must give appropriate credit, provide a link to the license, and indicate if changes were made. You may do so in any reasonable manner, but not in any way that suggests the licensor endorses you or your use. NonCommercial — You may not use the material for commercial purposes. NoDerivatives — If you remix, transform, or build upon the material, you may not distribute the modified material. You do not have to comply with the license for elements of the material in the public domain or where your use is permitted by an applicable exception or limitation. This is a human-readable summary of (and not a substitute for) the license. Disclaimer
Transcript of 2.0 KOREA - UNIST

Attribution-NonCommercial-NoDerivs 2.0 KOREA
You are free to :
Share — copy and redistribute the material in any medium or format
Under the follwing terms :
Attribution — You must give appropriate credit, provide a link to the license, and
indicate if changes were made. You may do so in any reasonable manner, but
not in any way that suggests the licensor endorses you or your use.
NonCommercial — You may not use the material for commercial purposes.
NoDerivatives — If you remix, transform, or build upon the material, you may
not distribute the modified material.
You do not have to comply with the license for elements of the material in the public domain or where your use
is permitted by an applicable exception or limitation.
This is a human-readable summary of (and not a substitute for) the license.
Disclaimer
Master's Thesis
A Steering Wheel Mounted Grip Sensor:
Design, Development and Evaluation
Suraiya Jahan Liza
Department of Human Factors Engineering
Graduate School of UNIST
2017

A Steering Wheel Mounted Grip Sensor: Design, Development and Evaluation
Suraiya Jahan Liza
Department of Human Factors Engineering
Graduate School of UNIST
A Steering Wheel Mounted Grip Sensor: Design, Development and Evaluation
A thesis/dissertation
submitted to the Graduate School of UNIST
in partial fulfillment of the
requirements for the degree of
Master of Science
Suraiya Jahan Liza
1. 3. 2017
Approved by
_________________________
Advisor
Ian Oakley

A Steering Wheel Mounted Grip Sensor: Design, Development and Evaluation
Suraiya Jahan Liza
This certifies that the thesis/dissertation of Suraiya Jahan Liza is approved.
1/3/2017
___________________________
Advisor: Ian Oakley
___________________________
Prof. Gyouhyung Kyung
___________________________
Prof. Oh-Sang Kwon

i
Abstract
Driving is a commonplace but safety critical daily activity for billions of people. It remains
one of the leading causes of death worldwide, particularly in younger adults. In the last decades, a
wide range of technologies, such as intelligent braking or speed regulating systems, have been
integrated into vehicles to improve safety; annually decreasing death rates testify to their success. A
recent research focus in this area has been in the development of systems that sense human states or
activities during driving. This is valuable because human error remains a key reason underlying many
vehicle accidents and incidents. Technologies that can intervene in response to information sensed
about a driver may be able to detect, predict and ultimately prevent problems before they progress
into accidents, thus avoiding the occurrence of critical situations rather than just mitigating their
consequences. Commercial examples of this kind of technology include systems that monitor driver
alertness or lane holding and prompt drivers who are sleepy or drifting off-lane. More exploratory
research in this area has sought to capture emotional state or stress/workload levels via physiological
measurements of Heart Rate Variability (HRV), Electrocardiogram (ECG) and Electroencephalogram
(EEG), or behavioral measurements of eye gaze or face pose. Other research has monitored explicitly
user actions, such as head pose or foot movements to infer intended actions (such as overtaking or
lane change) and provide automatic assessments of the safety of these future behaviors – for example,
providing a timely warning to a driver who is planning to overtake about a vehicle in his or her blind
spot. Researchers have also explored how sensing hands on the wheel can be used to infer a driver’s
presence, identity or emotional state.
This thesis extends this body of work through the design, development and evaluation of a
steering wheel sensor platform that can directly detect a driver’s hand pose all around a steering
wheel. This thesis argues that full steering hand pose is a potentially rich source of information about
a driver’s intended actions. For example, it proposes a link between hand posture on the wheel and
subsequent turning or lane change behavior. To explore this idea, this thesis describes the construction
of a touch sensor in the form of a steering wheel cover. This cover integrates 32 equidistantly spread
touch sensing electrodes (11.250 inter-sensor spacing) in the form of conductive ribbons (0.2" wide
and 0.03" thick). Data from each ribbons is captured separately via a set of capacitive touch sensor
microcontrollers every 64 ms. We connected this hardware platform to an OpenDS, an open source
driving simulator and ran two studies capturing hand pose during a sequential lane change task and a
slalom task. We analyzed the data to determine whether hand pose is a useful predictor of future
turning behavior. For this we classified a 5-lane road into 4 turn sizes and used machine-learning
recognizers to predict the future turn size from the change in hand posture in terms of hand movement
properties from the early driving data. Driving task scenario of the first experiment was not

ii
appropriately matched with the real life turning task therefore we modified the scenario with more
appropriate task in the second experiments. Class-wise prediction of the turn sizes for both
experiments didn’t show good accuracy, however prediction accuracy was improved when the classes
were reduced into two classes from four classes. In the experiment 2 turn sizes were overlapped
between themselves, which made it very difficult to distinguish them. Therefore, we did continuous
prediction as well and the prediction accuracy was better than the class-wise prediction system for the
both experiments.
In summary, this thesis designed, developed and evaluated a combined hardware and software
system that senses the steering behavior of a driver by capturing grip pose. We assessed the value of
this information via two studies that explored the relationship between wheel grip and future turning
behaviors. The ultimate outcome of this study can inform the development of in car sensing systems
to support safer driving.

iii
ACKNOWLEDGEMENT
First and above all, I praise Allah, the almighty to give me the opportunity and capability of
graduation in the field of Human Computer Interaction. Without the assistance and guidance of
several people this thesis might not have been completed. I would therefore like to thank all the
people from the bottom of my heart.
I would like to express my special thanks and appreciation to my advisor Professor Ian
Oakley. You are the best Professor in my whole academic life. Thank you so much for believing and
encouraging me whenever I felt down. During my whole graduation period you were so friendly,
patience and supportive. Without your continuous support in the programming and technical part my
thesis would not have been possible. I also feel happy thinking that I am your first graduate student at
UNIST. I also want to show my sincere gratitude to Professor Oh-Sang Kwon and Professor
Gyouhyung Kyung for reviewing my thesis and providing the insightful comments by managing your
busy time. All of your valuable direction and comments were very helpful for me to successfully
finish my thesis.
I would like to acknowledge my friends and lab mates: DoYoung Lee, HyunJae Gil,
Hyeongmin Kang, Youngeun Song, Youryang Lee, Marian Adusei and Hongmin Kim. Thank you
DoYoung, for teaching me several times how Arduino and Processing code works. Without your help
it was impossible for me to finish the work as you helped me to make the working skeleton code of
the steering wheel. You always lend a helping hand whenever I need you to solve any kind of
problem inside and outside of the lab. Thank you to HyunJae and Hyeongmin for helping me to
analyze the data of my two experiments. Both of your continuous and endless effort helped me to
finish the analysis as without your support I might not have been finished it. My special thanks to
Hyeongmin, you really worked very hard, I must appreciate you. Thank you Youryang to help me for
recruiting participants for my experiments. You and Youngeun made my lab time more enjoyable, I
will always remember our precious relationship. Youngeun you are such a good friend whom I always
found beside me. Thanks to color lab members also and all of my study participants.
Finally, I would like to give my very special thanks to my parents and sisters for always
believing in me, specially my Mom, who always encouraged me, for whom I am here today. And a
very big thanks to my beloved husband and lab mate Md. Rasel Islam. Words can’t express how
much grateful I am to you. Thanks for introducing Professor Ian Oakley, thanks for being such a
caring, encouraging, supportive husband. May Allah give you all the best in return.

iv

v
PUBLICATIONS
Domestic Conference:
Cho, K., Liza, S. J., & Kim, C. (2014). The influence of smart phone in distributed cognition. 2014
KSDS Fall Conference, 2014, 112-113.
Youngeun Song, Suraiya Jahan Liza, Ian Oakley (2016). Typing on the Edge: Korean Text Entry on a
Smartwatch Using a Side Mounted Input Surface. EXTENDED ABSTRACT OF HCI KOREA,
2016.1, 223-225.
Suraiya Jahan Liza, Hyeongmin Kang, DoYoung Lee, HyunJae Gil, Ian Oakley (2016). A Steering
Wheel Mounted Grip sensor: Design, Development and Evaluation. In: proceedings of Ergonomics
Society of Korea, ESK 2016 Fall Conference, Nov 30-Dec 03, Gangwon-do, South Korea.
Md Rasel Islam, DoYoung Lee, Suraiya Jahan Liza, Ian Oakley (2016). Novel pattern based
authentication input technique for unlocking smart eyewear. In: proceedings of Ergonomics Society of
Korea, ESK 2016 Fall Conference, Nov 30-Dec 03, Gangwon-do, South Korea.
vi
CONTENTS Table of Contents
ABSTRACT…………………………………………………………………………………………… i
ACKNOWLEDGEMENTS……………….…………………………………...................................... iii
PUBLICATIONS……………………………………………………………………………………… v
CONTENTS…………………………………………………………………………………………... vi
LIST OF FIGURES ………………………………………………...................................................... ix
LIST OF TABLES.…………………………………………………………………………………… xi
CHAPTER 1. INTRODUCTION 1
1.1 Danger of driving and the importance of driving study…………………………………………… 2
1.2 How Digital technology can improve driving safety……………………………………………… 2
1.3 Research contribution and novelty of this study….……………………………………………….. 4
1.4 Research objective…….…………………………………………………………………………... 4
1.5 Encapsulation of the research…….……………………………………………………………….. 4
CHAPTER 2. LITERATURE REVIEW 6
2.1 ADAS (Advanced Driver Assistance System)……………………………………………………. 7
2.2 Components of Intelligent vehicle……………………………………………………………….... 8
2.2.1 Environmental state sensing……………………………………………………………. 9
2.2.2 Vehicle state sensing…………………………………………………………………... 10
2.2.3 Driver’s state sensing………………………………………………………………….. 11
2.2.3.1 Sensing the driver through physiological signal……………………………. 11
2.2.3.2 Behavioral signal measure………………………………………………….. 13
2.2.3.2.1 Driver’s action directly related to driving task/action…………… 13
2.2.3.2.2 Driver’s action indirectly related to driving task/action…………. 14
2.3 Implication of steering wheel on driving study………………………………………………….. 16
2.3.1 Driver’s physiological signal measurement by sensor mounted steering wheel……… 16
2.3.2 Driver’s fatigue/workload measurement from steering wheel behavior ……………... 16
2.3.3 Driver’s grasp behavior and handgrip pattern analysis……………………………….. 17
2.3.4 Driver’s driving maneuver (turn intention, lane change) prediction………………….. 17
2.4: Importance of driving simulator on driving study………………………………………………. 18
2.5 Generalization of literature review………………………………………………………………. 18

vii
CHAPTER 3. HARDWARE AND SOFTWARE SYSTEM 21
3.1 Overview of hardware prototype and software system………………………………………...… 22
3.2 Hardware prototype……………………………………………………………………………… 22
3.2.1 Touch sensor mounted steering wheel………………………………………………… 22
3.2.1.1 Overview of touch sensor board……………………………………………. 23
3.2.1.2 Overview of rotation sensor………………………………………………… 23
3.2.1.3 Connection of IMU and touch sensor boards with Arduino Fio board…...…23
3.2.1.4 Touch data transfer from Arduino Fio to computer………………………… 24
3.2.1.5 Connection of touch sensor board’s electrodes with steering wheel…..…… 24
3.2.2 Connection of gaming pedal…………………………………………………………... 25
3.2.3 Attachment of Steering wheel with base…………………………………………….... 26
3.3 Software description…………………………..………………………………………….…….... 26
3.3.1 Communication protocol between Arduino and Processing software………………… 27
3.3.2 Unojoy joystick connection with Arduino Fio and OpenDs….……………………..… 27
3.3.3 Modification made inside OpenDs driving simulator…….….……………………..…. 28
CHAPTER 4. EXPERIMENTAL DESIGN, RESULT AND ANALYSIS 29
4.1 Overview……………………….…………………………………..…………………………..… 30
4.2 Research hypothesis………………………………………..…..………………………………… 30
4.3 A brief description about hand movement properties……….....………………………………… 31
4.4 Experiments...………………….…………………………………..…………………………..… 32
4.4.1 Experiment 1…...…………………………………..………………………..………… 32
4.1.1.1 Participants…………………………………………………….............…… 32
4.4.1.2 Apparatus…………………………………………………………………… 33
4.4.1.3 Experimental design……………….………….……………………………. 33
4.4.2 Experiment 2…...…………………………………..………………………..………… 37
4.1.2.1 Participants…………………………………………………….............…… 37
4.4.2.2 Apparatus…………………………………………………………………… 37
4.4.2.3 Experimental design……………….………….……………………………. 37
4.1.4.2 Written instruction about the experimental procedure……………………... 35
4.5 Machine-learning approaches for predicting future turning behavior……..…………………… 40
4.5.1 WEKA: Machine learning software………………….……………………..………… 41
4.5.2 Neural network: Multilayer Perceptron (MLP)….……………………………………. 42
4.5.3 Decision tree: Random Forest……………..….………………………………………. 42
4.5.4: Statistical model: logistic Regression………...………………………………………. 43
4.5.5: Statistical model: Linear Regression.……………………………………………….... 43

viii
4.6 Discrete and continuous prediction of turn sizes……………………………………………...…. 43
4.7 Descriptive statistics of the data……………….……………………………………………...…. 43
4.7.1: Success rate…………………………………………...………………………………. 47
4.7.2: Task time………..……………………………………………………………………. 47
4.7.3: Reaction time……………...………………………………………………………….. 48
4.8 Analysis and the Predictive models………….………………………………………………..…. 49
4.8.1 Analysis of the hand movement properties through repeated measure ANOVA………49
4.8.1.1 ANOVA for whole data set….………………………………….…………...49
4.8.1.2 ANOVA until maximum wheel angle data….………………….…………...49
4.8.2 Predictive models………………………………………………………….……………57
4.8.2.1 Category wise prediction of turn size…….………….……………………... 57
4.8.2.2 Prediction accuracy of different models.…….………………………………58
4.8.2.3 Continuous prediction of turn size….………………………………………..60
4.8.2.4 Prediction accuracy of different models……….…………………………….61
4.9 Analyzing the full data to detect the false positive rate……….……………….………………….64
CHAPTER 6. CONCLUSION 60
6.1 Overall Discussion…………………………………………………………………………….…. 61
6.2 Limitations and Future work……………………………………………………………………... 63
REFERENCES 65

ix
LIST OF FIGURES
Figure 1: Proposed in-vehicle sensing components…………………………………………………… 9
Figure 2: Block diagram of hardware prototype and software requirements. …………………….… 22
Figure 3: A) Front view, B) Back view, C) Layout design of all connections………………………. 24
Figure 4: Arduino Xbee for wireless communication between Arduino Fio board and PC……….… 24
Figure 5: A) Conductive ribbons were sewed by conductive thread with conductive washer, B) Sensor
box connection with steering wheel………………………………………………………………….. 25
Figure 6: gaming pedal A) front view B) Back view after cut off the USB port wire.……………… 26
Figure 7: A) front view of UNOJOY joystick, B) Fritzing Layout design…………………………... 28
Figure 8: Time vs. right hand movement with aggregate distance…………...…………………........ 31
Figure 9: Time vs. right hand movement with no aggregate distance……………..………………… 31
Figure 10: Lane changing task scenario of OpenDs for experiment 1…..………………………..…. 34
Figure 11: Experimental scenario inside OpenDs driving simulator for experiment 1………..…..… 36
Figure 12: Slalom task scenario of OpenDs for experiment 2……………………………….………. 38
Figure 13: Experimental scenario inside OpenDs driving simulator for experiment 2…………….... 40
Figure 14: Typical trajectory of wheel angle for the four turn sizes………………………………… 41
Figure 15: Histogram of turn sizes for A) fast speed, B) slow speed of experiment 1 and C)
experiment 2…………………………………..……………………………….……………………... 44
Figure 16: Actual travelled distance by the car while changing 1, 2, 3 and 4 lanes for experiment
2………………………………………………………………………………………………………. 45
Figure 17: Histogram of total hand movement for A) turn size 1, B) turn size 2, C) turn size 3 and D)
turn size 4 for the fast speed of experiment 1…………..……………………………….………...…. 46
Figure 18: Histogram of total hand movement for A) turn size 1, B) turn size 2, C) turn size 3 and D)
turn size 4 for the slow speed of experiment 1…………..……………………………….……….…. 46
Figure 19: Histogram of total hand movement for A) turn size 1, B) turn size 2, C) turn size 3 and D)
turn size 4 for the second experiment…………………..……………………………….………….... 47
Figure 20: Turn size vs. task time for fast and slow speed conditions of experiment 1 (left) and
experiment 2 (right). Bars show standard error……….……………………………….………….…. 48
Figure 21. Turn size vs. reaction time for fast and slow speed conditions of experiment 1 (left) and
experiment 2 (right). Bars show standard error…….……………………………….…………….…. 48
Figure 22. Total mean travelled distances of hands for four turn sizes for fast and slow speed
conditions of experiment 1 (left) and experiment 2 (right). Bars show standard error……………… 50
Figure 23: Total mean aggregate distances of hands for four turn sizes for fast and slow speed
conditions of experiment 1 (left) and experiment 2 (right). Bars show standard error……..……….. 50

x
Figure 24: Total mean hand movement events for four turn sizes for fast and slow speed conditions of
experiment 1 (left) and experiment 2 (right). Bars show standard error.……………………….....… 51
Figure 25: Total mean number of hand direction changes for four turn sizes for fast and slow speed
conditions of experiment 1 (left) and experiment 2 (right). Bars show standard error……..…...……52
Figure 26: Change in wheel angle for four turn size categories for fast and slow speed conditions of
experiment 1 (left) and experiment 2 (right). Bars show standard error…………………………….. 53
Figure 27: Total mean travelled distances of hands for four turn sizes for fast and slow speed
conditions of experiment 1 (left) and experiment 2 (right). Bars show standard error……………… 54
Figure 28: Total mean aggregate distances of hands of four turn sizes for fast and slow speed
conditions of experiment 1 (left) and experiment 2 (right). Bars show standard error……………… 54
Figure 29: Total mean hand movement events of four turn sizes for fast and slow speed conditions of
experiment 1 (left) and experiment 2 (right). Bars show standard error…………………………….. 55
Figure 30: Total mean number of hand direction changes for four turn size categories for fast and
slow speed conditions of experiment 1 (left) and experiment 2 (right). Bars show standard error….. 56
Figure 31: Change in wheel angle for four turn size categories for fast and slow speed conditions of
experiment 1 (left) and experiment 2 (right). Bars show standard error.……………………………. 57

xi
LIST OF TABLES
Table 1: Results from machine learning models constructed to classify turn size………………...… 58
Table 2: Results from machine learning models constructed to classify turn sizes (after filtering the no
hand movement cases)…………………………..…………………………….……………………... 59
Table 3: Results from machine learning models for numeric prediction………………………….…. 61
Table 4: Results from machine learning models for numeric prediction (after filtering the no hand
movement cases)……………………………………………………….………………………….…. 62
Table 5: Attributes with normalized weight value of linear regression models for experiment 1 and
2………………………………………………………………………………………………………..63
Table 6: Attributes with normalized weight value of linear regression models for experiment 1 and 2
(after filtering the no hand movement cases)….……………………………………………….……..63
Table 7: False positive rate of four turn types of Experiment 1.................…………………………...64

1
Chapter 1:
Introduction

2
1.1 Danger of driving and the importance of driving study
Driving is an everyday activity providing a primary means of transportation worldwide.
Though it provides a high degree of mobility but the number of death caused by car accident is
incredibly high. Moreover, motor vehicle crashes are one of the leading reasons of death. To provide
an overall measure of highway safety by identifying the safety problems and suggesting the solutions,
National Highway Traffic Safety Administration (NHTSA) presents annual descriptive statistics about
traffic crashes with the help of Fatality Analysis Reporting system (FARS). It is a well-known source
to provide death related statistics of 50 states in United States of severe traffic crashes. According to
FARS approximately 30,057 driving related fatalities occurred in 20131. World Health Organization
(WHO) specified road traffic crashes as the main cause of death (1.2 million people worldwide) for
people aged 15-29 years2 , while European Commission Directorate General for Mobility and
Transport has been also reported 25,900 road fatalities on year 2013 across 27 countries of Europe3.
The loss of human life is the highest price we pay for car crashes. Not only the victim’s
family but also the society is affected by the loss. Society bears the loss by costing a huge amount of
money associated with car accidents. From the NTHSA statistics 24 million vehicles were damaged,
32,999 people died and 3.9 million were injured due to the motor vehicle accidents in 2012, which
costs a total of $242 billion in the United States4. Though the reasons behind vehicle accidents are
different (e.g. alcohol-related crashes, speeding, distracted driving, fatigue or drowsiness, using cell
phone) but the economic and social impacts because of the accidents are very high. These statistics
show us how dangerous driving is in terms of death, injuries and social cost. Therefore, it is a major
issue to talk about how to increase driving safety to save valuable human life.
1.2 How Digital technology can improve driving safety
The major challenge of road vehicle transportation is to enhance the safety of driving. In
recent years driving has become remarkably safer with the decreasing rate of fatality and injury rates.
According to European Union the road safety has been evaluated at a significant amount from year
1991 to 20135. There has been much progress in the development of digital technology in car; still it
is developing to ensure a safe and reliable driving experience. Driving safety is related with human
factors (emotional state, poor training etc.), vehicle factors (vehicle design or safety equipment) and
driving environments (traffic, road or weather conditions). As people are one of the main reasons of
accidents so implication of various digital technology can support or assist them in urgent situations.
1 http://www-nrd.nhtsa.dot.gov/Pubs/812139.pdf 2 http://www.who.int/violence_injury_prevention/road_safety_status/2015/en/ 3 http://ec.europa.eu/transport/road_safety/pdf/observatory/trends_figures.pdf 4 http://www-nrd.nhtsa.dot.gov/pubs/812013.pdf 5 http://ec.europa.eu/transport/road_safety/pdf/observatory/historical_evol.pdf

3
Modern cars are equipped with technologies like Global Positioning System (GPS) for navigation,
digital dashboard or various assistive techniques such as power steering system to increase driver
safety. As a whole, GPS aids the driver by showing the vehicles current location as well as the route
guidance by providing turn-by-turn navigation on a map with the help of both visual and audio
information [Barry, B. and L. Eric 2012]. Gilly, L., et al. (2008) proposed new design principle of
GPS with the opportunities to engage it with the environment. Brit Susan, J., et al. (2010) reported
that an addition of auditory modality along with the visual feedback can improve driving performance
by reducing frequent eye glances (eyes-off-the-road). Preventing tire failure and alerting drivers about
underinflated tires to increase driving safety by continuously monitoring air pressure inside the tire is
an way to mitigate car accidents using in-car technology [Persson, N., et al. 2001]. Ishtiaq Roufa, R.
M., et al. (2010) used the pressure sensor based tire pressure monitoring system (TMP) to monitor tire
pressure and triggered warning message along with warning light on a moving vehicle dashboard
from another nearby located vehicle using radio frequency transmitter. In recent years, application of
cameras in the development of driving assistance system for improving driving safety is also an
interesting area of research. Díaz, J., et al. (2006) used high frame-rate cameras to track the motion of
overtaking cars using the rear-view mirror perspective. A vision based forward collision warning
(FCW) system was proposed by Dagan, E., et al. (2004), just by using a single forward facing camera
located near the rear view mirror. Lane departure warning and headway monitoring system were also
combined with this system. Similarly, for tracking front closest vehicle to avoid collision Cindy, X., et
al. (2001) used a Pan-Tilt-Zoom (PTZ) camera with another low focal length standard camera, which
computed the position, size and orientation of the target object by keeping the rear view image of the
target vehicle. In order to reduce the probability of collision and safe backward movement while car
parking, advanced parking assistance system has been used by Wada, M., et al. (2003). Other assistive
technologies like brake assistance system (BAS), lane keeping assistance system (LKAS), electric
power assist steering system (EPAS) have been developed for advanced safety in car.
It has been proved by researchers that technology can mitigate driving hazards by sensing
them before they progress into accidents or can prevent them by taking the control of the vehicle by
itself to reduce the damage or to avoid a collision. As mentioned above, most of the driving accidents
are related to human errors [Peden, M., et al. 2004] either due to their mental workload, destruction,
and engagement in secondary activities or less training. Therefore, capturing driver’s mental state or
workload via physiological parameters such as heart rate variability, electrocardiogram (ECG),
Electroencephalogram (EEG), Electromyogram (EMG) etc. is an objective manner [Lin, Y., et al.
2007]. Other behavioral measurement such as tracking eye gaze movement and face pose [Ji, Q. and
X. Yang 2002] has been reported to determine the level of fatigue. On the other hand change in user
action such as lane changing or overtaking has been captured with the help of radar and cameras by
continuously tracking the head poses and orientations along with the lane markings [Doshi, A., et al.

4
2011] or foot movement break/accelerator [Tran, C., et al. 2012]. Thus, development of in-car digital
technologies is very obvious for the improvement of driving safety.
1.3 Research contribution and novelty of this study
Operation of steering wheel while driving is an important driver behavior, which requires
gestural interaction like grasping. From this viewpoint, researchers tried to apply various types of
sensors such as temperature sensor [Lin, Y., et al. 2007; Baronti, F., et al. 2009] to understand the
driver’s body temperature or pressure sensor [Baronti, F., et al. 2009; Eksioglu, M. and K. Kızılaslan,
2008; Chen, R., et al. 2011] to understand grip force on steering wheel. Measurement of this grip
force could give an idea about the level of fatigue [Baronti, F., et al. 2009] or the driver’s emotional
condition [Oehl, M., et al. 2011]. Though the use of sensor mounted steering wheel is not a
completely new approach in driving study, prior researchers were more focused on sensing human
emotion or fatigue rather than it’s application area.
In our research work we build a combined hardware/software system of steering wheel that
can facilitate to capture the driver’s grip posture with the help of complex sensor unit. Our aim was
not only sensing the driver’s hand presence on steering wheel [Baronti, F., et al. 2009] but also predict
their specific intention of driving activity like: turning or lane changing. Therefore, our sensor unit
has the capability to sense the driver’s hand posture at every 64 ms all around the wheel with the use
of capacitive touch sensors. The hardware system is also pretty simple compared with design of the
prior steering wheel [Imamura, T., et al. 2009] with less number of wires along with a centralized
acquisition module.
1.4 Research objective
The main objective of this work is to understand specific driving behavior through the use of
a sensor-based steering wheel. As we argued that a steering wheel could be an important car
accessory to understand driving activity due to its large area, which always remains in touch with the
driver by one or both hands. Moreover, a specific driving task: turning is directly related with steering
wheel movement. As turning is a dangerous driving activity and it is impossible to check the “blind
spot’ fully with the car mirrors so predicting future turning behavior by sensing present driving
behavior could prevent drivers from accidents. Here, we tried to establish a relationship between the
hand posture on steering wheel and the car turning or lane changing behavior. By answering the
research question: “Can hand posture predict turning behavior of a car?” our proposed system
developed a new in-car intelligent information system for safe driving.
1.5 Encapsulation of the research
Two separate experiments were done in this work to predict the future turning or lane
5
changing behavior of drivers from the early driving data of that specific turning task. Hand movement
properties of drivers and the steering wheel angle data were used as the predictors. In both
experiments an open source driving-simulator named OpenDs was used with modified driving
scenarios. A lane-changing task was used for the first experiment and a slalom task was used for the
second experiment. For both experiments current ‘reaction task’ scenario of OpenDs driving
simulator was modified according to the experimental requirements. Two different groups of
participants with valid driving license participated in the two experiments. Both experiments were
done in a 5-lane road. Participants changed their lane right after they see the lane-changing signal
over the gates for the lane-changing task where as participants followed some colored blocks to
change the lane for the slalom task. In slalom task participants were instructed to keep the red blocks
on their right side and blue blocks on their left side while changing the lane. Turn size was taken as an
outcome variable while hand movement properties were taken as the predictors. As each of the lanes
was 3.7 meter so four turn sizes were taken to check whether the predictor variables could predict the
end point of the turns from the early driving data. Repeated measure ANOVA result for the first and
second experiment indicated that the turn types were different from one another for all the hand
movement properties. Machine-learning approaches; Logistictic Regression, Multilayer Perceptron,
Random Forest were used for the discrete prediction and Linear Regression, Multilaye Perceptron and
Random Forest were used for the continuous prediction of the turn sizes by taking hand movement
properties and steering wheel angle as predictors. Prediction accuracy from the machine learning
recognizers revealed that future turning or lane-changing behavior could be predicted from the early
driving data.

6
Chapter 2:
Literature Review

7
2.1 ADAS (Advanced Driver Assistance System)
In recent decades the research and development of Intelligent Vehicle (IV) is rapidly growing
worldwide not only to enhance driving safety but also to solve the mobility problem. By integrating
different kind of intelligent system and autonomous functionality, efficiency of driving could be
improved while number of accidents will be decreased. According to European Commission most of
the EU citizen would like to have intelligent systems in their new car6. With the help of various
sensors, cameras, radar, laser or satellite IV can provide information, warning or feedback depending
on the situation and types of the system. ADAS (Advanced Driver Assistance System), a very popular
name in the field of autonomous industry is used to refer an IV with developed autonomous vehicle
functionality. In ADAS the system can interact both with the driver and the vehicle depending on the
types of the system presented on that vehicle.
ADAS has a considerable history and several researchers proposed different categories of
ADAS but roughly they are the same. According to Doshi, A., et al. (2011) the intelligent vehicle
should have predictive system to understand driver’s intention along with the capability of monitoring
the vehicle with its surroundings. They categorized ADAS as: System that can provide 1) early
notification, 2) warning in risky situation and 3) could take the control of the vehicle at critical
moment for reducing the damage of accidents. Carsten, O. M. J. and L. Nilsson (2001) proposed two
major areas of ADAS: area where the system could interact with the driver (navigation system) and
area where the system could interact with the vehicle directly (adaptive cruise control). As a broad
categorization of ADAD they mentioned about four types: system that provides 1) in-vehicle
information, 2) warning or/and feedback, 3) intervention in vehicle control, 4) automated driving.
According to Bishop, R. (2000) there are three types of IV systems: 1) advise/warning provider to
driver, 2) partial control taker of the vehicle either in steady state driver assistance or as an emergency
intervention and 3) full control taker of vehicle or automated driving. An elaborated ADAS
categorization was proposed by Gietelink, O., et al. (2006), where partial control were further
categorized in two areas: a) active support provider intervening system, e.g. Adaptive Cruise Control
(ACC) system and b) integrated safety system, where passive safety system are integrated with a pre-
crash system. The former one woks as a support for the driver while the later one can reduce the
damage of collision by occurring a pre-crash. The mechanism of ADAS contains a serial of actions
like recognition, decision-making and operation depending on which categories they belongs to e.g.
partial or full automated [Tsugawa, S. 2006]. Although there are slight difference among the
categorization but the common features of ADAS technology are firstly providing just-in-time
information about the vehicle or environment such as traffic or road condition. Secondly providing
warning or feedback to the driver when the vehicle is in a hazardous situation for mitigating the
6 http://ec.europa.eu/public_opinion/archives/ebs/ebs_267_en.pdf

8
driving errors. Collision warning system, lane departure warning system, blind spot warning,
intersection collision warning, pedestrian detection and warning these are the possible examples.
Thirdly, system that takes partial control of the vehicle but the driver has some control over it to
ignore the actions and lastly system that takes the full control of the vehicle. The last one is also
known as “automated car” where no driver is needed.
2.2 Components of Intelligent vehicle
In order to be an effective driver assistance system it should continuously monitor not only
the vehicle state but also the full context of vehicle such as the environment of the vehicle and the
driver. Researchers have been proposed three major components that need to be taken account while
designing an ADAS and they are [McCall, J. C. and M. M. Trivedi 2007]:
1) Sensing the environment: Sensing the environment of the vehicle like: traffic or road
infrastructure, weather condition, blind spot obstacle detection, capturing surrounding images for
assistive parking system etc.
2) Sensing the vehicle state: Sensing the vehicles current state like: vehicle speed,
acceleration, brake pressure, steering wheel movement, standard deviation of lane position etc.
3) Sensing the driver state: Driver’s physiological signals change over time, Eye gaze, Foot
gesture etc. while driving the vehicle.
Prior researches show that two possible types of signal could be found from the drivers such
as physiological signal (electroencephalogram, electrocardiogram, electromyogram etc.) and
behavioral signal (eye movement, head pose changes, facial expression etc.) [Baronti, F., et al. 2009;
Gusikhin, O., et al. 2008]. These signals could be received by applying electrodes to the driver in case
of physiological signal measure or by applying various sensors or cameras in case of behavioral signal
measure. According to Ji, Q. and X. Yang (2002) measuring drive’s physiological signals are
intrusive where as measuring drive’s behavior such as eye gaze movement or head movement is less
intrusive. On the other hand observing the vehicle’s behavior is non-intrusive but has some limitations
such as vehicle types or driving experience of the driver’s. It is very clear that some of the driver’s
actions or behaviors are directly related to some specific driving actions/tasks while some are
indirectly related. Driver’s eye gaze movement, yawning, Face pose/facial action, PERCLOS these
are Indirectly related to driving task (yawning could express drowsiness and could be related with bad
driving performance) where as driver’s head pose, foot gesture on accelerator or brake are directly
related to driving task (foot gesture on pedal is clearly related with acceleration change, or brake).
From this point of view and above description about in-vehicle sensing components we have extended
the current framework as below:

9
Figure 1: Proposed in-vehicle sensing components.
2.2.1 Environmental state sensing
Pedestrian detection:
An intelligent car should ensure the safety of both the pedestrian and the driver. Some of the
vehicle e.g. Lexus 460L, Mercedes S550, and Volvo XC60 are using Forward pedestrian collision
imminent braking (CIB) system, which helps to avoid or mitigate the collision with the pedestrian.
Different approaches are used to produce a CIB model. Tang, B., et al. (2014) used both the
environmental data (e. g. pedestrian speed, direction, size, weather condition etc.) and the CIB
performance data (Warning Starting Distance to Target, Warning Starting Time to Collision etc.) for
developing a pedestrian CIB simulation model for a specific vehicle. Kim, H., et al. (2011) developed
an on-board monocular camera based pedestrian detection system, which can detect not only the
pedestrians from the forward direction but also from left or right side.
Blind spot obstacle detection:
Blind spot is the large region located on the side or behind of the vehicle, which a driver can’t
see with the side or rear mirror view from his/her sitting position on the car. Therefore, a driver
assistance technology called blind spot detection system helps the driver to detect any vehicle or

10
pedestrian on that area by covering 360 degrees of electronic coverage around the car. Researchers
have been proposed ultrasonic and image sensors [Yet, W. C. and U. Qidwai 2005], omnidirectional
camera to generate side view image [Achler, O. and M. M. Trivedi 2004], optical flow algorithm
[Díaz, J., et al. 2003] based blind spot detection technologies to prevent blind spot related accidents.
Weather sensing:
Sensing the weather like rain for automatic wiper has been developed as an assistive
technology to reduce the destruction of the driver without interrupting him/her. Early works were
based on the amount of raindrop over the raindrop sensor. While the electrode of this sensor come in
contact with the raindrop a capacitance has been formed as a result of an electric double layer
between the raindrop and the electrode, which causes the windshield to operate automatically [Kato,
H. and T. Matsuki 1990]. Joshi, M., et al. (2013) has also reported a resistive cost effective rain sensor
for automatic wiper controller, where the resistance of the sensor changes upon the formation of a
film from the rain water on its surface.
Traffic monitoring:
In wireless sensor network based traffic monitoring system all the traffic data are collected
and send to the remote server first for processing them and later distributed to the traffic management
centers, road control units (RCU) and information providers. This traffic monitoring system can
detect traffics by sensors and could warn the drivers about traffic jams or accidents though the radios
and thus provides safety applications [Pascale, A., et al. 2012]. Another approach called Inter-Vehicle
Communication (IVC), a vehicle to vehicle communication along with Roadside-to-Vehicle
Communication (RVC) for communicating with roadside base stations are another efficient and
accurate way of providing traffic density information to the drivers [Jerbi, M., et al. 2007].
2.2.2 Vehicle state sensing
GPS for navigation:
Global positioning system (GPS) is a satellite based car navigation aid, which shows vehicle’s
current precise location on a digital map along with the vehicle’s speed, direction and time. It help’s
the driver to reach the destination location by providing efficient audio or video information.
According to Obradovic, D., et al. (2007) a car navigation system has three major tasks: positioning
(by collecting information from several sensors, GPS and digital maps), routing and navigation
(information about traffic jam, alternative route guidance). However, performance of a navigation
system depends on the accuracy (how accurate the velocity, speed etc. of the vehicle provided by the
system to actual values), integrity (trustworthiness), availability (percentage of the intended coverage

11
area) and continuity of the service [Skog, I. and P. Händel 2009]. As being an affordable and
convenient application GPS navigation system has become the widely used assistance system in
almost all types of vehicles.
Standard deviation of lane position:
Lane departure warning system (LDWS) is an assistive technology assisting drivers to
maintain proper lane on the road. Whenever the deviation from the lane is too much without activated
turn signal, then the system warns driver by continuously monitoring the vehicles current lane
position on the road. Lin, H.-Y., et al. 2012 proposed vision based approaches using only one camera
to capture the video, mounted behind the windshield both for LDWS (Lane Departure Warning
System) and FCWS (Forward Collision Warning System).
Other vehicle parameters like vehicle speed, accelerator pedal position, gear throttle position,
steering rate, acceleration, brake pressure, yaw rate etc. are monitored by in-vehicle sensors to provide
the current useful information about the vehicle.
2.2.3 Driver’s state sensing
2.2.3.1 Sensing the driver through physiological signal
Understanding driver’s mental emotion such as stress or workload is very important in
driving study for developing car safety. Subjective measures like Questionnaire is not possible to
apply in real time while physiological measure is reliable and accurate to find out mental conditions.
Moreover, physiological measures also have some advantages such as; it is a sensitive, qualitative and
continuous measurement of performance where subjective effect of the investigator can be
minimized. Researchers commonly use following physiological measures:
Electro-encephalogram (EEG):
Driver’s mental workload and accidents are realistically related with each other. Mental
workload such as: overload of information, fatigue are directly related to driving task performance
and can be measured by physiological signal. However, Detection of drowsiness or fatigue is
important in driving study as it cause longer reaction time, delayed performance in attention-
demanding task, and low and inaccurate decision making. Fatigue is a mental state with reduced
efficiency and general unwillingness to work. EEG represents the electrical activity of the brain and
can make accurate and quantitative assessment of alertness. It is the most predictive and reliable
measure for indicating level of alertness or fatigue [Lal, S. K. L. and A. Craig 2001]. Researchers
classify electrical activity of brain in terms of frequency band including delta, theta, alpha and beta.
Presence of delta activity indicates the transition to drowsiness and sleep while theta frequency is

12
associated with low level of alertness during drowsiness and sleep. Alpha waves appear during eye
closure and decrease during eye opening and also present both in alert or relaxed state. Beta waves
represent the increased alertness, arousal and excitement [Lal, S. K. L. and A. Craig 2001].
Researchers often use these EEG waveforms and power bands to visually level the transition from
alert to sleep and different sleep state. Researchers used EEG as an indication of fatigue of drowsy
driver [Roman, B., et al. 2001; Yang, G., et al. 2010; Zhao, C., et al. 2012; Borghini, G., et al. 2012]
or for measuring driver’s level of vigilance [Larue, G. S., et al. 2011]. Relation between vigilance
level: awake and sleeping, and EEG signal was measured by Yu, H., et al. (2007), where a precise
discrimination was present between awake and sleep condition from EEG data.
Electrocardiogram (ECG):
ECG is the recording of bioelectric current produced by the electro-dynamic functioning of
the heart. ECG signal include heart rate (HR), heart rate variability (HRV) and frequency of breathe.
The R peaks of ECG signals provide significant information, which is related to heart rate (HR, in
beats per minute), and the change in R-R interval is known as heart rate variability (HRV), indicates
the time interval between heart beats varied (beat to beat interval). According to Wilson, G. F. and R.
D. O'Donnell (1988) heart rate can be applied for fatigue detection as it reflects the physical and
mental level under different task requirements. On the other hand HRV can evaluate many cardiac
functionalities and an effective measure for drowsiness detection. Busek, P., et al. (2005) reported that
during fatigue driving spectrum of HRV varied significantly. Sun, Y., et al. (2011) did a driving
fatigue detection experiment using non contact ECG sensing system to capture HR and HRV signal.
Heart rate is also the most frequently used techniques for measuring mental workload, observed by
Wierwille, Walter W., et al. (1993). For ensuring adequate driving performance driver’s workload
should be optimal but during the high mental effort HR increases with a decreased HRV, hence HR
and HRV are influenced by the task amount and type of effort. Mehler, B., et al. (2011) found
significant difference in both HR and HRV between a single task driving and a secondary cognitive
workload driving. Similarly, Brookhuis, K. A. and D. de Waard (2010) found significant increase of
HR, while turning left or crossing a junction in a driving simulator compared with the resting
conditions.
Electromyogram (EMG):
Electromyogram measures human muscles electrical activity during rest and contraction, a
measure to observe the health of muscles and nerve cells. The EMG features differ during the rest and
the stress condition, indicating a clear evidence of stress detection. Changes in EMG signal of
trapezius muscle like increase of amplitude and decrease in the amount of gap (short period of
relaxation) indicates the elevation of muscle activity during a stressed task [Wijsman, J., et al. 2010].
13
Galvanic skin response (GSR) and skin conductivity:
Galvanic skin response (GSR) is known as electro dermal activity (EDA), an important
physiological parameter indicating the conductivity of human skin. Mental status and emotion can be
successfully determined by it, as skin conductivity changes upon the task difficulty. Change in skin
moisture level (sweating) varies with the variation of skin conductivity, so it can measure the change
in human sympathetic nervous system. Skin conductance decreases as the task difficulty increases,
providing an objective indicator of user cognitive load level [Nourbakhsh, N., et al. 2012; Shi, Y., et
al. 2007]. Typically GSR is acquired in hand finger and easy to get with less cost. Rigas, G., et al.
(2012) found high correlation between EDA and stress load by observing the two major components
of EDA: skin conductance level (SCL) and skin conductance response (SCR). Healey, J. A. and R. W.
Picard (2005) also stated similar results from his real-world driving task for stress detection. Collet,
C., et al. (2009) observed the EDA in terms of skin resistance by placing sensors on fingers to
measure the change in driver’s arousal while managing secondary driving task. Result showed that it
provided evidence about different arousal levels according to different experimental conditions.
2.2.3.2 Behavioral signal measure
Recognizing driver’s intention could be beneficial for the effective and smooth operation of a
driving assistance system as some of the driver’s intended maneuvers could be wrong or not perfectly
suitable with that current traffic situation. Understanding driver’s intention or analyzing their current
state is important as the assistive technology could take action from driver’s behavior without
bothering him/her in autonomous system or could warn driver’s in assistive system. Thus, there would
be no increased workload in critical driving situations. Some of the driver’s actions or behaviors are
directly related to some driving task while others are related indirectly.
2.2.3.2.1 Driver’s action directly related to driving task/action
Foot gesture:
Foot gesture or leg motion is very important in driving as it is related to controlling the brake
or accelerator pedal. Tran, C., et al. (2012) predicted driver’s behavior by capturing foot gesture on
pedal by using optical flow based foot tracking and a Hidden Markov Model (HMM) based technique.
By combining information from the pedal sensor and tracked data they interpret driver foot movement
into several categories such as moving towards brake or pedal, release or engage feet with brake or
acceleration pedal or neutral behavior like hovering. Antilock brake system (ABS), an emergency
stops and brake system is an example of ADAS technology also uses foot characteristics or leg
motion during the operation of pedal [Park, S. and T. B. Sheridan 2004]. For predicting the braking
behavior or to understand drivers intention of braking maneuver McCall, J. C. and M. M. Trivedi
14
(2007) used on-board vehicle sensors data such as: brake pedal pressure, accelerator pedal position,
lateral and longitudinal acceleration along with a foot camera for monitoring foot gesture to design a
braking assistance system for intelligent driver assistance system.
Head Pose:
Researchers successfully used capturing head pose for predicting driver’s intention of lane
change [Doshi, A. and M. M. Trivedi 2009]. A comparative study was done here to prove that head
pose could predict lane change intention better than eye gaze measurement as it is a strong indication
of driver’s current focus of attention, whereas eyes provides gaze direction only. Liebner, M., et al.
(2013) also captured head pose in terms of head heading angle and reported that capturing head pose
is more reliable than eye gaze direction for predicting driver’s intention of right turning.
Head and Hand pose:
Cheng, S. Y. and M. M. Trivedi (2006) used marker based motion capture system for body-
pose detection system for driver’s turn intention prediction. With the help of the retroreflective
markers located on the driver’s head and hand the 6DOF head position and 3DOF hand position was
captured. The collected steering data, body pose data and steering plus body pose data showed that
addition of body pose data predicted the turn intentions more clearly.
Body posture:
To understand the relationship between the body posture of save and unsafe driving maneuver
(e.g. lane changing, merging) Kondyli, A., et al. (2014) observed the 3D body posture of the driver,
by using a low cost infrared depth sensor. The body parts: wrists, elbows, shoulders and the
orientation of the torso was captured and the x, y and z coordinate values of these body parts was
fitted with a novel 7-point human skeletal model. There was difference between the body movements
of the participants while performing the same driving maneuvers. Moreover, torso activity was also
different for lane change and merging task between the drivers, which proved that some body
movement could hide unsafe situation of some driving maneuver performance.
2.2.3.2.2 Driver’s action indirectly related to driving task/action
Facial pose/facial action:
Horizontal facial rotation angle of driver’s face along with eye movement was observed by
Kimura, K., et al. (2007) for designing a forward collision avoidance system. A comparison was done
between the difference of facial rotation angle when the driver’s attention was and was not directed to
the forward direction. Facial rotation angle data from an overhead camera showed that facial angle

15
more than 15o for at least 0.3 seconds means that the driver is not looking at the forward direction,
which may increase the accident probability and reaction time of forward inattention warning system.
Therefore, an early warning system could be beneficial after monitoring the facial angle of
inattention. Jain, A., et al. (2016) also analyzed facial behavior and 3D head pose of driver’s for a left
lane changing maneuver for predicting lane changing maneuver of advanced driver assistance
technology. They tracked face with a face detector and extracted visually discriminative facial points
and processed them further. The precision of the anticipated maneuver was increased with the help of
face tracking. Hachisuka, S., et al. (2011) detected drowsy drivers from their facial expressions. They
classified the drowsiness state in 6 categories: Not Sleepy, Slightly Sleepy, Sleepy, Rather Sleepy,
Very Sleepy, and detected drowsiness from different facial muscles activities.
Eye gaze movement and PERCLOS:
Eye blinking, eye-closure, eye gaze movement monitoring, pupil response these are
commonly used bio behavioral ocular measures. Driver’s visual behavior clearly shows their level of
vigilance or drowsiness thus it is a common use in driving study. The term PERCLOS means the
percentage of eyelid closure or eye blinking per minute, which is a valid and reliable measure of
driver’s fatigue measurement [Ji, Q., et al. 2004; Wierwille, W. W., et al. 1994]. Researchers used
PERCLOS measurement for sleepiness or drowsiness detection [Papadelis, C., et al. 2007; Wang, Q.,
et al. 2006], vigilance monitoring [Ji, Q. and X. Yang 2002], stress or fatigue detection [Rigas, G., et
al. 2011]. Wortelen, B., et al. (2013) used eye tracker for monitoring driver’s visual attention in a
multitasking-driving situation inside a driving simulator. Another large-scale 100-car naturalistic
study also used driver’s eye glance analysis for observing their attention while driving and performing
primary and secondary driving tasks in real driving environment [Neale, V. L., et al. 2005].
Yawning:
Yawning is a human behavioral state that means a wide opening of the mouth and it happens
frequently because of tiredness or sleepiness Saradadevi, M. and P. Bajaj (2008) tracked facial
expression for detecting yawning as a measure of driver’s fatigue detection. They detected mouth
from the face and then classified yawning based on SVM (support vector machine) method. Other
researchers also tried to detect drowsiness [Abtahi, S., et al. 2011; Vural, E., et al. 2007] from
yawning.
Hand gesture on Steering Wheel:
Several prior researchers have been used the hand posture of driver on the steering wheel to
understand their state in terms of physiological signal, which is described in the section 2.3.

16
2.3 Implication of steering wheel on driving study
Car steering wheel is a weighty source of information about drivers state because drivers
generally keep one or both hand on steering wheel while driving. However it also represents vehicle’s
current state also. Capturing continuous steering data from wheel is also easy. Researchers have been
used steering wheel to understand both the vehicle state and the driver’s state. Thus a new structure
for the Implication of steering wheel is needed and would be discussed here.
2.3.1 Driver’s physiological signal measurement by sensor mounted steering wheel
Physiological information like: electrocardiogram (ECG), Electroencephalogram (EEG) and
Electromyography (EMG) is a rich source of driver’s mental stress or emotional state. Measuring just
one biological signal is not enough for accurate measurement of driver’s state so more than one
biological measure is needed as the combined result could give a better understanding about their
state. [63] Lin, Y., et al. (2007) made a “smart wheel” to measure driver’s state by integrating four
physiological signal: skin temperature waves by using a semiconductor temperature sensor, gripping
force by a tactile piezoresistive sensor, pulse (heart rate) and respiration waves by a group of PVDF
film sensor on the steering wheel. Ju, J. H., et al. (2015) also detected driver drowsiness from their
biological signal in terms of respiration, gripping force (by pressure sensor attached with steering
wheel and seat belt) and photoplethysmogram (PPG) (by light emitting diode (LED) and
phototransistor (PT) attached to the steering wheel).
Oehl, M., et al (2011) measured driver’s grip force by an optical fiber mounted steering wheel
to understand driver’s positive and negative mental condition such as happiness or anger.
Deformation of the fiber caused by the grip force proved that happiness was related with higher grip
strength while anger was related with decreased grip strength made by the drivers. Eksioglu, M. and
K. Kızılaslan (2008) measured grip force by a capacitive pressure sensor-mounted steering wheel as a
function of gender, speed and road condition and found that the male participants produced more
absolute and net grip force on the wheel compared to the female where as speed and road condition
had no significant effect on grip force. Application of force sensor to capture real-time grip force as a
representation of fatigue is a very common approach by the researches. Driver’s hand position and
grip force was captured by Baronti, F., et al. (2009) by a capacitor based steering wheel that could
change the capacitance based on touch.
2.3.2 Driver’s fatigue/workload measurement from steering wheel behavior
Steering wheel motion is directly related to driving activity thus prior researchers tried to
measure fatigue from driver’s driving behavior. King, D. J., et al. (1998) used steering wheel position
and motion to develop a fatigue detection algorithm by analyzing steering wheel characteristics in
time domain (steering wheel angle and angular velocity vs. time), frequency domain (power spectrum

17
of steering wheel angle and angular velocity) and phage region (steering wheel angle vs. angular
velocity) and found correlation between fatigue and steering wheel characteristics. Krajewski, J., et al.
(2009) also used a machine learning based approach (Support Vector Machine, K-Nearest Neighbor)
on steering behavior such as steering angle, steering reversal rate, steering wheel action rate, peak
steering deflection etc. in time, frequency and state space domain for driver’s fatigue detection. He,
Q., et al. (2011) detected driver’s vigilance level from steering wheel angle and lane deviation by a
Bayesian Network (BN) based model, where the correlation between lane deviation and steering angle
was used to evaluate driver’s fatigue level.
2.3.3 Driver’s grasp behavior and handgrip pattern analysis
Observing driver’s grasping behavior or grasping pattern is a behavior based biometric
measure, which is important to observe while diving to understand their driving activities. Cheng, S.
Y. and M. M. Trivedi (2006) tracked hands on steering wheel with LWIR (long wave infrared)
cameras along with the head movement. After extracting the location of the hands they analyzed five
different grasp behaviors (Grasp wheel and no move, Grasp wheel and turn left, Grasp wheel and turn
right, Grasp wheel and sliding over, other motion towards null target), which were combined with the
steering wheel angle and it’s angular velocity to understand driving activities. Imamura, T., et al.
(2009) also detected grasp position by using several micro force sensors on steering wheel. Grasping
behavior was observed by change in grasping force (a driver usually put his hand on a point, then
move the hand to another point and put his hand back to the first point). A handgrip pattern
recognition system was proposed by Chen, R., et al. (2011) by using a pressure sensor mat mounted
steering wheel, where the pressure distribution can be represented as images. Location of fingers,
force of grasping, variation of pressure in the whole grasping process was measured to observe the
dynamic handgrip pattern for recognizing driver.
2.3.4 Driver’s driving maneuver (turn intention, lane change) prediction
Lane change intention from steering angle:
Prediction of driving maneuver is very important for designing ADAS to understand driver’s
intention before doing that activity. Schmidt, K., et al. (2014) proposed a mathematical model of
steering wheel angle for the early predicting of lane change as it is the starting sign of lane change
preparation. Experimental result showed that steering wheel angle was different between high and low
experienced participants and also between male and female participants. Female participants drove
slower than the male and thus completed the lane change later.

18
Hand pose on steering wheel for predicting turn intention:
By detecting driver’s body pose (head and hand pose on steering wheel) Cheng, S. Y. and M.
M. Trivedi (2006) predicted turn intention with the help of a motion capture system. They placed
different number of marker on the left and right hand to distinguish them easily. Vehicle state data
such as steering angle, brake and throttle data were also collected along with the body pose data.
Experimental outcome showed that addition of body pose predicted the left and right turn intention
more clearly.
2.4 Importance of driving simulator on driving study:
Driving simulator is an artificial driving environment used for entertainment, training the
drivers or for research purposes such as measuring or observing driver’s physiological signal,
behavior, performance or stress level with the appropriate experimental scenarios and settings.
Research inside the driving simulator is very important as fake hazardous situations can be made for
improving the safety issues in automotive field without putting the drivers or the pedestrian in real
danger. Moreover, driving simulator has endless contributions in the development of current ADAS
technology. For conducting driving study researchers often use driving simulator as it is well proved
that driver’s behavior in real car in actual driving environment is related to the behavior inside a
computer-simulated environment [Clark, W. A. V. and T. R. Smith 1985]. Several researchers also
did validation study of driving simulator [Blana, E. 1996; Kaptein, N., et al. 1996; Reimer, B., et al.
2006]. According to Kaptein, N., et al. (1996) a medium-fidelity driving simulator can support
absolute validity for choosing the driving route while relative validity for lateral control and velocity
measure. On the other hand researchers also claimed that people could react differently inside a
simulator because of some reasons such as they know the experimenters are observing them and also
it is out of risk of physical harm or collision [Alm, H. and L. Nilsson 1995; Lee, J. D., et al. 2002].
However, driving simulator has become an important medium for conducting driving research
although it has some advantages (controllable, reproducible, data collection with less difficulty,
hazardous driving scenario generation, achieving feedback) and disadvantages (simulator sickness,
fidelity and validity issues) [De Winter, J., et al. 2012]. Previous sections contains simulator based
driving study for driver’s state monitoring such as: physiological signal measure [Sun, Y., et al. 2011;
Zhao, C., et al. 2012] and Behavioral signal measure [Wierwille, W. W., et al. 1994; Wortelen, B., et
al. 2013; Vural, E., et al. 2007; Park, S. and T. B. Sheridan 2004; McCall, J. C. and M. M. Trivedi
2007.
2.5 Generalization of literature review
An ADAS equipped vehicle is usually referred to ‘Intelligent car’, which should have the
capability of monitoring the vehicle environment with the help of various sensors, radar, laser or
19
vision system. At the same time it should track the vehicle’s state along with the driver’s state to
assist them in recognizing hazards and reacting on them for overcoming the potential dangers. A
partial ADAS equipped car could reduce the tendency of accident by providing early notification,
warning or taking the control of the vehicle in emergency situation while a full ADAS car can control
the vehicle without drive’s interruptions. Thus research about IV is very important for ensuring the
increased safety of drivers, pedestrians and vehicles.
The ADAS systems such as collision warning system, lane departure warning system, lane
keeping assistance system, automatic emergency breaking system these are already provided in many
vehicles in recent years. Study about adaptive cruise control and brake assistance has shown that rate
of accident has been reduced by 20% by using these systems [Eckstein, L. and A. Zlocki 2013].
Another study showed that application of collision mitigation braking system and lateral guidance
could avoid up to 25.1% of car accidents [Kuehn, M., et al. 2009]. Though ADAS is improving road
safety at a satisfactory level but still there are many factors and issues that need to be solved for the
better efficiency and reliability. According to Doshi, A., et al. (2011) an effective ADAS system
should have low false alarm rate along with low error rate. Limitations such as complexity of the
system, improper understanding of driver about the system or malfunction of the system could hinder
the successful implementation of ADAS even though the acceptance of ADAS systems is growing
day by day.
However, ADAS system based on predicting driver’s intention is a major field of research
interest as it is stated that 90% road accidents are caused due to driver’s error so it is very important to
understand their intention before they make any mistakes. A lot of studies have been done in this field
by monitoring driver’s behavior such as foot gesture on pedal/accelerator, hand gesture/ hand pose on
steering wheel, body pose etc. However some driving maneuvers such as lane change or turning are
very much related with the steering wheel state. As steering wheel is one of the most important parts
of vehicle, which is always in touch with the driver so prior, researches tried to use it either as a
source of information (steering wheel state or driver’s hand pose/gesture on the wheel) or as a
skeleton for attaching various sensors (such as touch and pressure). Some of the sensors are pretty
easy to attach or to use with the steering wheel such as touch [Baronti, F., et al., 2009] and pressure
sensors [Baronti, F., et al. 2009; Imamura, Takashi, et al. 2009; Chen, R., et al., 2011]. In order to use
the steering wheel as a platform of the sensors the hardware unit should be small enough with less
occupied space. Complex or difficult wiring of multiple sensors over the steering wheel [Imamura,
Takashi, et al, 2009] could restrict its rotational motion and force could be also made from different
sides of the torus, which could make the pressure measurement inaccurate. This problem could be
solved by using inter-connectable processors/sensor units distributed around the wheel as suggested
by Baronti, F., et al. (2009). However, the hardware system should also be small in size to match
with the steering wheel form factor. Thus, the aim of our work is to develop a multiple sensor-

20
mounted steering wheel with a less wiring complexity and compact hardware system, where the
interconnected sensor wiring system will not restrict the rotational movement of the wheel.
Understanding drivers diving intention was observed by researchers with the help of either
using vehicle parts such as steering wheel state or by using drivers body pose [Kondyli, A., et al.
2014], facial expression [Jain, A., et al. 2016], head pose [Doshi, A. and M. M. Trivedi 2009] or foot
gesture [McCall, J. C. and M. M. Trivedi 2007] as described above. Most of these researches required
special intelligent vehicular test bed [Tran, C., et al. 2012, Cheng, S. Y. and M. M. Trivedi 2006],
which are specially made only for the laboratory research with some specific experimental
environment. Other researches used some special device such as camera [Doshi, A. and M. M. Trivedi
2009, Abtahi, S., et al. 2011], which need to be installed inside the car and require complex set up.
Hence, our proposed system will not contain any complex device/sensor installation.

21
Chapter 3:
Hardware and Software System

22
3.1 Overview of hardware prototype and software system
In order to achieve the hand movement and the steering wheel rotation data we have used our
own customized steering wheel. For capturing the touch data we have used MPR121 touch sensor and
for capturing the rotational attributes we have used IMU sensor. The sensors were connected with an
Arduino Fio board mounted at the middle of the steering wheel. Touch sensor connections from
Arduino Fio board were enlarged by using ribbon types conductive electrodes, sewed with the
steering wheel cover. Through using these sensors Arduino Fio sent the precise touch and angle data
to the processing on the PC by a wireless communication for visualizing them and angle data only to
the Arduino UNO board. Here, we have used a normal Arduino UNO board and turned it as a joystick
named ‘UNOJOY’. This UNOJOY helped to maintain a precise car position inside the driving
simulator by mapping the wheel angle data into the position data inside the lane. At the same time this
UNOJOY receives the pedal data to control the forward and backward direction of the car. A wired
connection was used between the Arduino UNO and the PC to transfer these data for running the car
inside the OpenDs driving simulator on PC. The following block diagram represents the whole system
operation along with the hardware and software prototype description (Figure 2).
Figure 2: Block diagram of hardware prototype and software requirements.
23
3.2 Hardware prototype
3.2.1 Touch sensor mounted steering wheel
A touch sensor mounted standard car steering wheel (diameter: 36 cm) was used in this study
to run the driving study. Total 3 capacitive touch sensor boards, 12 channels in each were used to
convey the touch information of the steering wheel.
3.2.1.1 Overview of touch sensor board
In our study we used three MPR121 (height: 3cm, width: 2 cm) breakout boards as capacitive
touch sensor7. At present, capacitive touch sensors are widely used in touchscreen researches, as they
are highly responsive to human touch. All electrically charged objects have capacitance and this value
changes when it comes closer to another conductive object. However, the MPR121 Board can sense
the electrical capacitance of human body whenever it comes closer to the electrodes. This board has
12 individual electrodes and could be connected via i2C (Inter-integrated Circuit) communication
protocol. The operating voltages of the MPR121 touch sensor board are from 2.5v to 3.6VDC and
here it is connected with 3.3VDC power source from the Arduino Fio board.
3.2.1.2 Overview of rotation sensor
We measured the rotation or turn of the steering wheel by using a six-degrees of freedom
(DOF) IMU (Inertial Measurement Unit) sensor8 . This sensor consists of an accelerometer to
determine the orientation and a gyroscope to detect the rotation. Combined measurement from
accelerometer and gyroscope could give a clear and accurate orientation, thus used here to understand
the behavior of the steering wheel. This sensor also works via i2C communication protocol with an
operating voltage of 3.3V.
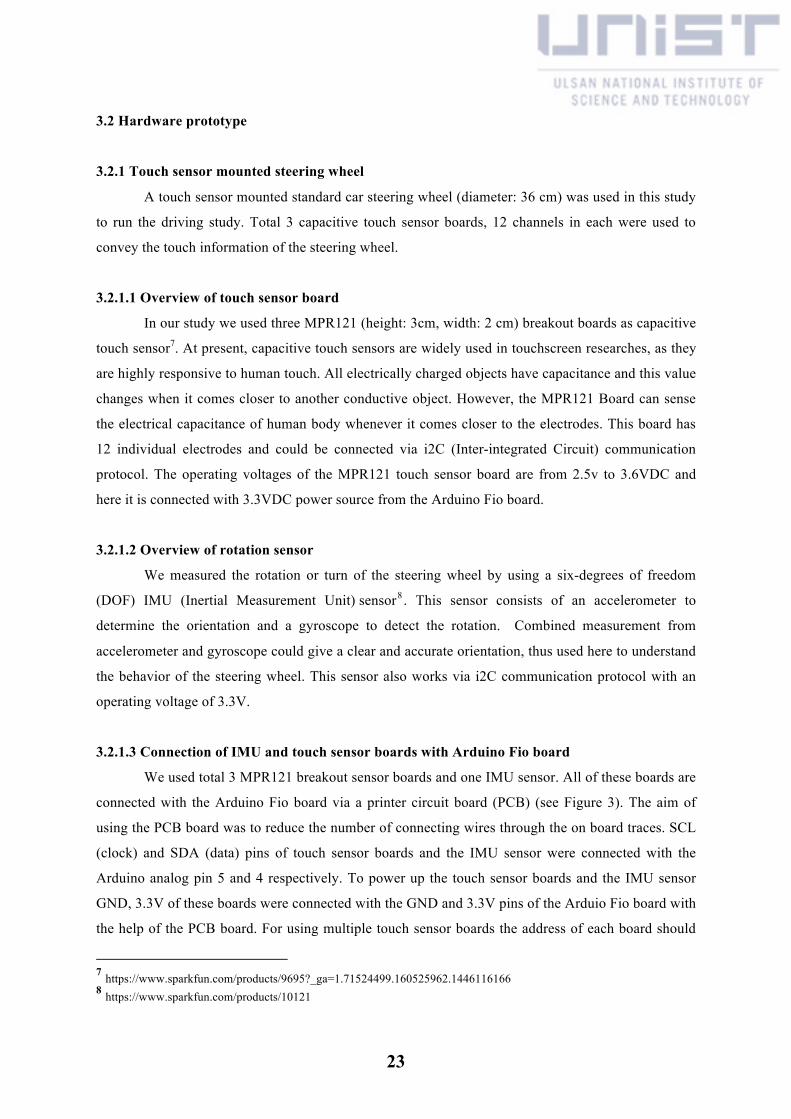
3.2.1.3 Connection of IMU and touch sensor boards with Arduino Fio board
We used total 3 MPR121 breakout sensor boards and one IMU sensor. All of these boards are
connected with the Arduino Fio board via a printer circuit board (PCB) (see Figure 3). The aim of
using the PCB board was to reduce the number of connecting wires through the on board traces. SCL
(clock) and SDA (data) pins of touch sensor boards and the IMU sensor were connected with the
Arduino analog pin 5 and 4 respectively. To power up the touch sensor boards and the IMU sensor
GND, 3.3V of these boards were connected with the GND and 3.3V pins of the Arduio Fio board with
the help of the PCB board. For using multiple touch sensor boards the address of each board should
7 https://www.sparkfun.com/products/9695?_ga=1.71524499.160525962.1446116166 8 https://www.sparkfun.com/products/10121
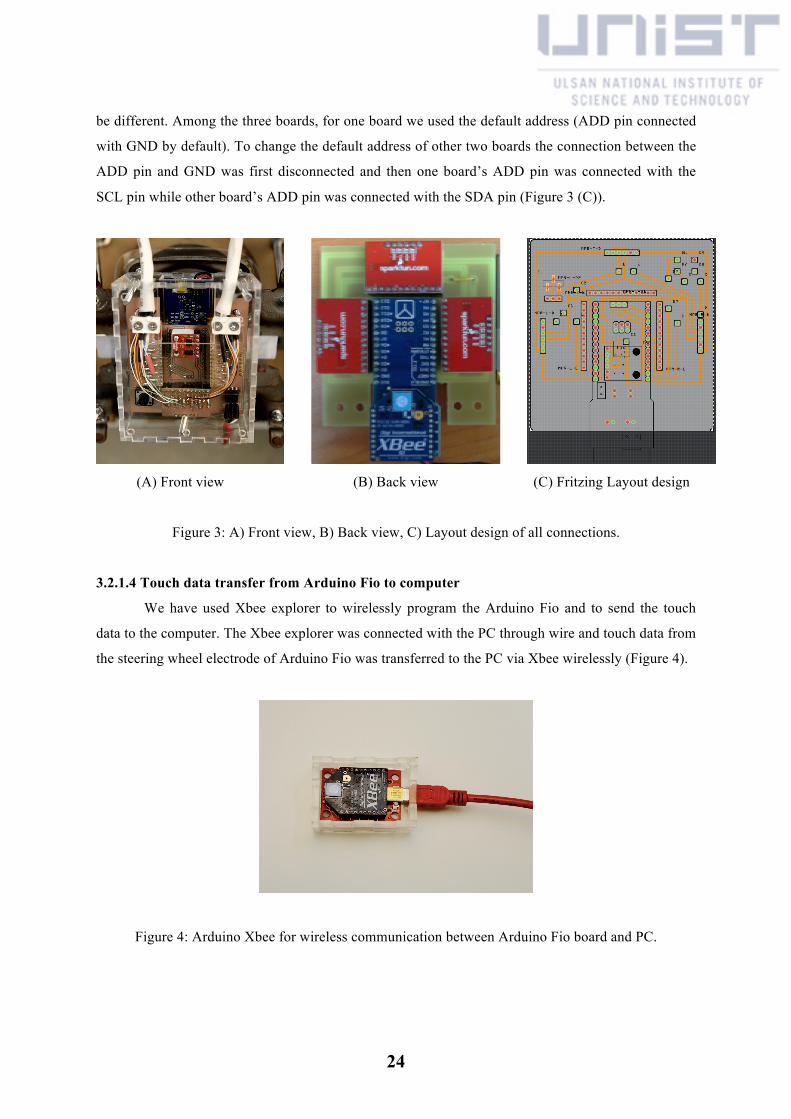
24
be different. Among the three boards, for one board we used the default address (ADD pin connected
with GND by default). To change the default address of other two boards the connection between the
ADD pin and GND was first disconnected and then one board’s ADD pin was connected with the
SCL pin while other board’s ADD pin was connected with the SDA pin (Figure 3 (C)).
(A) Front view
(B) Back view
(C) Fritzing Layout design
Figure 3: A) Front view, B) Back view, C) Layout design of all connections.
3.2.1.4 Touch data transfer from Arduino Fio to computer
We have used Xbee explorer to wirelessly program the Arduino Fio and to send the touch
data to the computer. The Xbee explorer was connected with the PC through wire and touch data from
the steering wheel electrode of Arduino Fio was transferred to the PC via Xbee wirelessly (Figure 4).
Figure 4: Arduino Xbee for wireless communication between Arduino Fio board and PC.
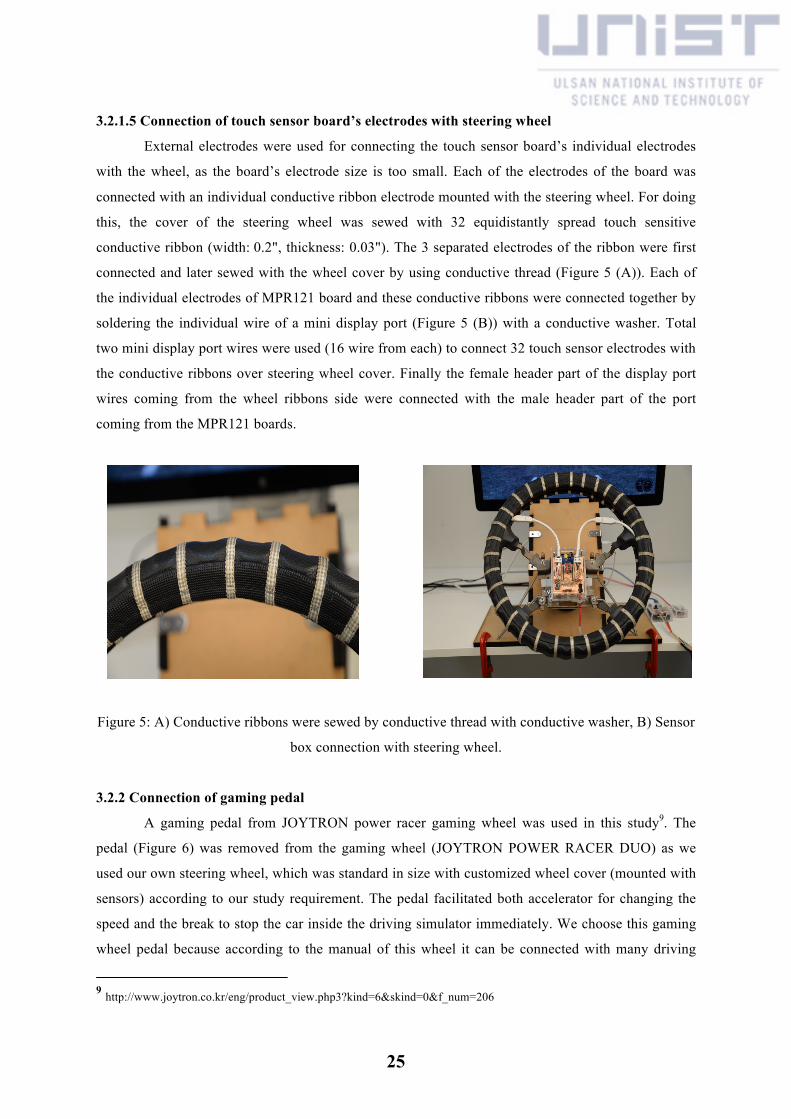
25
3.2.1.5 Connection of touch sensor board’s electrodes with steering wheel
External electrodes were used for connecting the touch sensor board’s individual electrodes
with the wheel, as the board’s electrode size is too small. Each of the electrodes of the board was
connected with an individual conductive ribbon electrode mounted with the steering wheel. For doing
this, the cover of the steering wheel was sewed with 32 equidistantly spread touch sensitive
conductive ribbon (width: 0.2", thickness: 0.03"). The 3 separated electrodes of the ribbon were first
connected and later sewed with the wheel cover by using conductive thread (Figure 5 (A)). Each of
the individual electrodes of MPR121 board and these conductive ribbons were connected together by
soldering the individual wire of a mini display port (Figure 5 (B)) with a conductive washer. Total
two mini display port wires were used (16 wire from each) to connect 32 touch sensor electrodes with
the conductive ribbons over steering wheel cover. Finally the female header part of the display port
wires coming from the wheel ribbons side were connected with the male header part of the port
coming from the MPR121 boards.
Figure 5: A) Conductive ribbons were sewed by conductive thread with conductive washer, B) Sensor
box connection with steering wheel.
3.2.2 Connection of gaming pedal
A gaming pedal from JOYTRON power racer gaming wheel was used in this study9. The
pedal (Figure 6) was removed from the gaming wheel (JOYTRON POWER RACER DUO) as we
used our own steering wheel, which was standard in size with customized wheel cover (mounted with
sensors) according to our study requirement. The pedal facilitated both accelerator for changing the
speed and the break to stop the car inside the driving simulator immediately. We choose this gaming
wheel pedal because according to the manual of this wheel it can be connected with many driving
9 http://www.joytron.co.kr/eng/product_view.php3?kind=6&skind=0&f_num=206

26
game and simulator software’s and are being used in many driving researches. It could be connected
with computer via the USB port but in is study we have connected the pedal with the joystick instead
of connecting it with the computer. For this the USB port connection wire was cut off (Figure 6 (B))
and the red wire (from accelerator rheostat) was connected with the GND of the joystick while the
yellow pin (from brake rheostat) was connected with the 3.3V power supply of the joystick. The
white pin (the shorted connection of accelerator and pedal rheostat) was connected with the analog
pin 4 of the joystick (Arduino UNO) (see section 3.2.2 for the description of Arduino UNO joystick).
Figure 6: Gaming pedal A) Front view B) Back view after cutting off the USB port wire.
3.2.3 Attachment of Steering wheel with base
To attach the wheel with the base at the right tilting angle the steering wheel column angle
was calculated. It is the angle between the horizontal base and the steering column (shaft). The
steering wheel was installed at a steering column angle of 25 degree by using a metal shaft with a
MDF frame. To rotate the wheel left and right direction a metal gear was used, which was connected
both with the MDF frame and the steering wheel via an acrylic frame. Friction of the steering wheel
was made similar to the real car by connecting a stainless spring on both sides of the wheel between
the acrylic frame and the horizontal base of the MDF frame. To prevent the movement of the wheel
structure, metal clamps were used on both sides to attach the wheel frame with the experimental desk
(see Figure 5 (B)).
3.3 Software description
In this driving study we used three different softwares:
§ Arduino: an open-source platform, used here for prototyping the hardware and software.
§ Processing: another open-source software, used here to communicate with Arduino,
visualizing and saving data into the computer.
§ OpenDs: an open-source driving simulator.

27
3.3.1 Communication protocol between Arduino and Processing software
Serial communication protocol was used to communicate between Arduino and Processing
software. Touch data by the capacitive touch sensors and the IMU angle data were continuously sent
from Arduino to Processing by the serial communication process. Processing visually showed the
frequent touch (capacitive touch on the touch sensor attached with the steering wheel) and angle data
(steering wheel angle data) on the computer screen and saved them in the computer.
3.3.2 Unojoy joystick connection with Arduino Fio and OpenDs
We have used a game controller to connect the sensor box (Arduino Fio with touch and IMU
sensor) with the driving simulator. An Arduino UNO board was turned in to a USB game controller
(known as UnoJoy), which could be used as a joystick by putting the board into DFU mode10. The
Arduino UNO board could be frequently changed into a ‘UnoJoy joystick” or a normal ‘Arduino
UNO’ board. The pedal was connected with the analog pin 4 of the Arduino UNO board (see section
3.1.2 for details). We used software serial communication to connect the two Arduino board (Arduino
Fio and Arduino UNO). For software serial communication analog pin 10 and 11 (Rx and TX) of
Arduino Fio board were connected with the Ardunio UNO analog pin 11 and 10 (Tx and RX)
respectively, while ground of these two boards was connected together. Figure 7 (A) shows the
Unojoy joystick (Arduino UNO) and Figure 7 (B) shows the fritzing layout of the PCB board to
connect the pedal and Arduino Fio board with it.
For making our own controller we used two axis of the UnoJoy, one for the pedal connection
and another for the software serial communication with the Arduino Fio board. The pedal axis helped
to control the speed of the car inside the simulator by pressing or releasing the accelerator. Another
axis got the IMU angle data directly coming from the rotation of the steering wheel via the software
serial communication between the Arduino Fio and Arduino UNO. The angle data was mapped inside
the simulator like this; it helped the car to turn left or right inside the OpenDs driving simulator just
by turning the physical steering wheel in left or right direction. The continuous angle data was
automatically saved inside the Processing sketch along with the touch data.
10 https://code.google.com/p/unojoy/
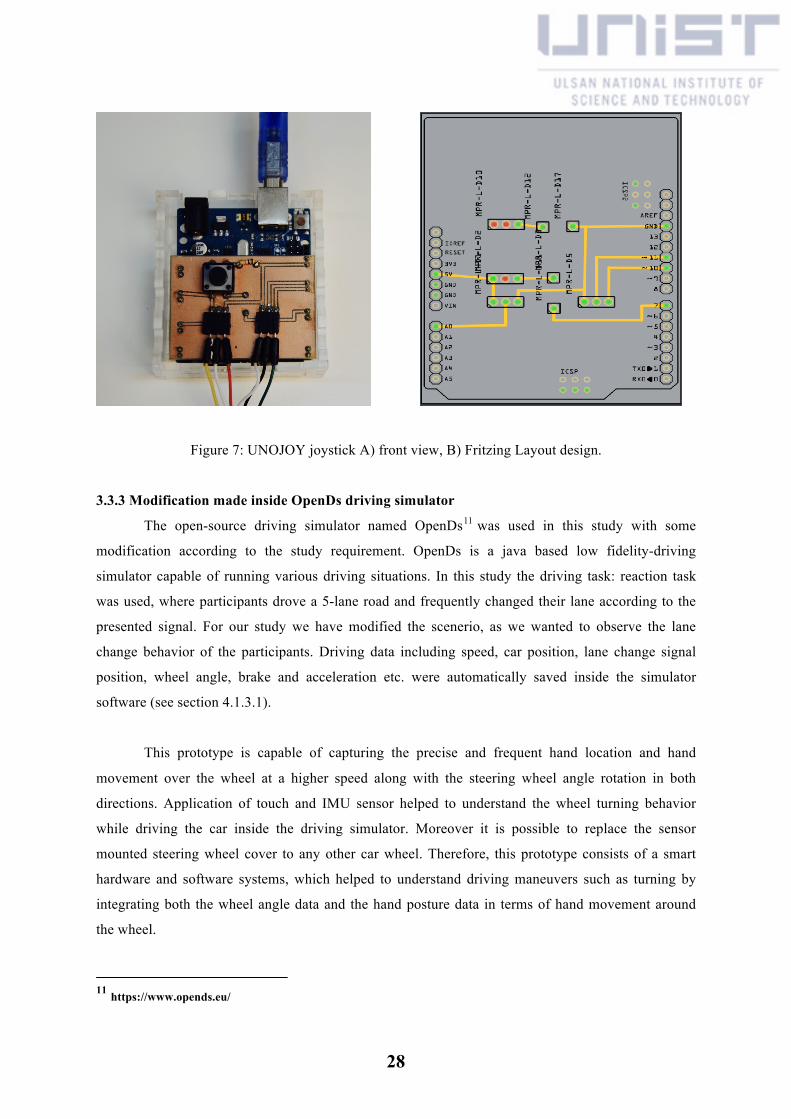
28
Figure 7: UNOJOY joystick A) front view, B) Fritzing Layout design.
3.3.3 Modification made inside OpenDs driving simulator
The open-source driving simulator named OpenDs11 was used in this study with some
modification according to the study requirement. OpenDs is a java based low fidelity-driving
simulator capable of running various driving situations. In this study the driving task: reaction task
was used, where participants drove a 5-lane road and frequently changed their lane according to the
presented signal. For our study we have modified the scenerio, as we wanted to observe the lane
change behavior of the participants. Driving data including speed, car position, lane change signal
position, wheel angle, brake and acceleration etc. were automatically saved inside the simulator
software (see section 4.1.3.1).
This prototype is capable of capturing the precise and frequent hand location and hand
movement over the wheel at a higher speed along with the steering wheel angle rotation in both
directions. Application of touch and IMU sensor helped to understand the wheel turning behavior
while driving the car inside the driving simulator. Moreover it is possible to replace the sensor
mounted steering wheel cover to any other car wheel. Therefore, this prototype consists of a smart
hardware and software systems, which helped to understand driving maneuvers such as turning by
integrating both the wheel angle data and the hand posture data in terms of hand movement around
the wheel.
11 https://www.opends.eu/

29
Chapter 4:
Experimental Design,
Result and Analysis

30
4.1 Overview:
We ran two different experiments, both in a 5-lane road inside the OpenDs driving simulator,
where all the participants completed all the conditions. The width of each lane was 3.7 meter.
Therefore to find out the relationship between the turn size (the x distance of the road travelled by the
car) and the subsequent hand movement properties we have categorized the turn sizes into four
categories. For the first experiment speed had two different levels. For both experiments four hand
movement properties were measured. Therefore the independent and the dependent variables for the
two experiments are given below:
Independent variables:
A) Turn size:
4 levels for both experiments
1) Turn size 1: 0 to 3.7 meters
2) Turn size 2: 3.7 to 7.4 meters
3) Turn size 3: 7.4 to 11.1 meters
4) Turn size 4: 11.1 to 14.8 meters
B) Speed:
2 levels for the first experiment:
1) Slow speed: maximum 25 km/h
2) Fast speed: maximum 50 km/h
For the second experiment:
Speed: maximum 70 km/h
Dependent variables:
Change in hand posture in terms of hand movement was measured as dependents variables.
Four hand movement properties were measured as below:
1) Total travelled distance
2) Aggregate distance
3) Total number of hand movement events
4) Total number of hand direction change
5) Wheel angle
4.2 Research hypothesis:
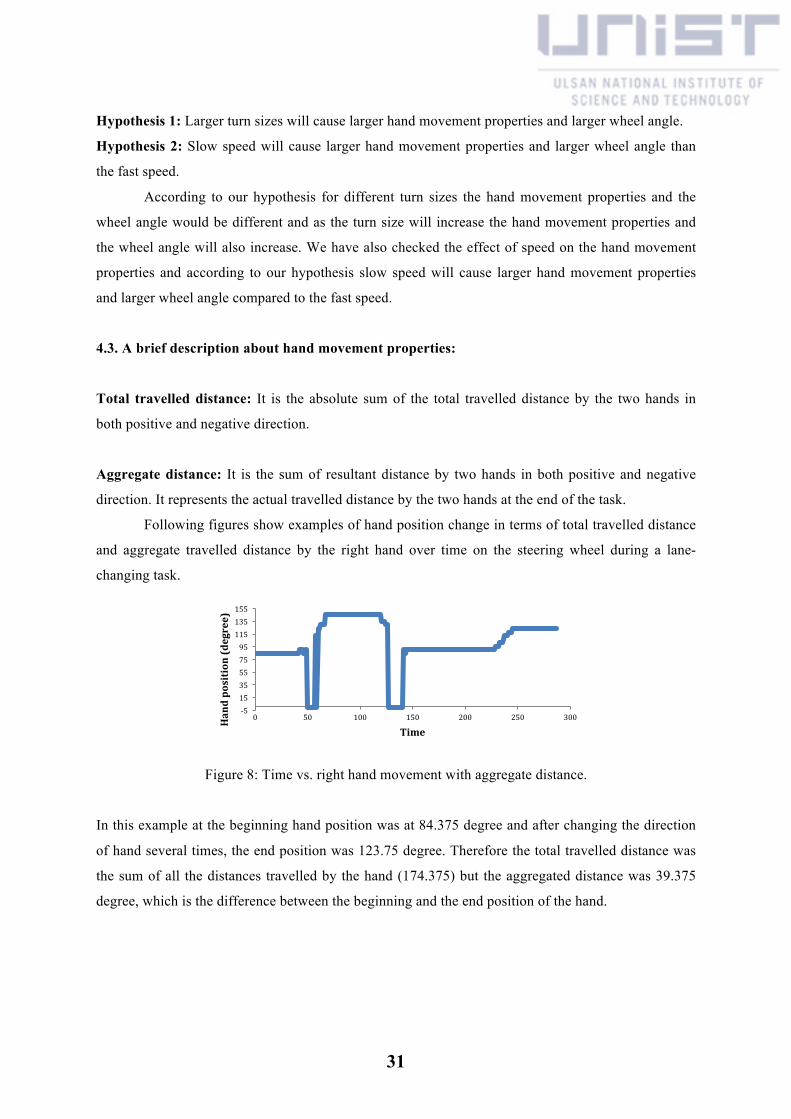
31
Hypothesis 1: Larger turn sizes will cause larger hand movement properties and larger wheel angle.
Hypothesis 2: Slow speed will cause larger hand movement properties and larger wheel angle than
the fast speed.
According to our hypothesis for different turn sizes the hand movement properties and the
wheel angle would be different and as the turn size will increase the hand movement properties and
the wheel angle will also increase. We have also checked the effect of speed on the hand movement
properties and according to our hypothesis slow speed will cause larger hand movement properties
and larger wheel angle compared to the fast speed.
4.3. A brief description about hand movement properties:
Total travelled distance: It is the absolute sum of the total travelled distance by the two hands in
both positive and negative direction.
Aggregate distance: It is the sum of resultant distance by two hands in both positive and negative
direction. It represents the actual travelled distance by the two hands at the end of the task.
Following figures show examples of hand position change in terms of total travelled distance
and aggregate travelled distance by the right hand over time on the steering wheel during a lane-
changing task.
Figure 8: Time vs. right hand movement with aggregate distance.
In this example at the beginning hand position was at 84.375 degree and after changing the direction
of hand several times, the end position was 123.75 degree. Therefore the total travelled distance was
the sum of all the distances travelled by the hand (174.375) but the aggregated distance was 39.375
degree, which is the difference between the beginning and the end position of the hand.
-51535557595115135155
0 50 100 150 200 250 300Handposition(degree)
Time
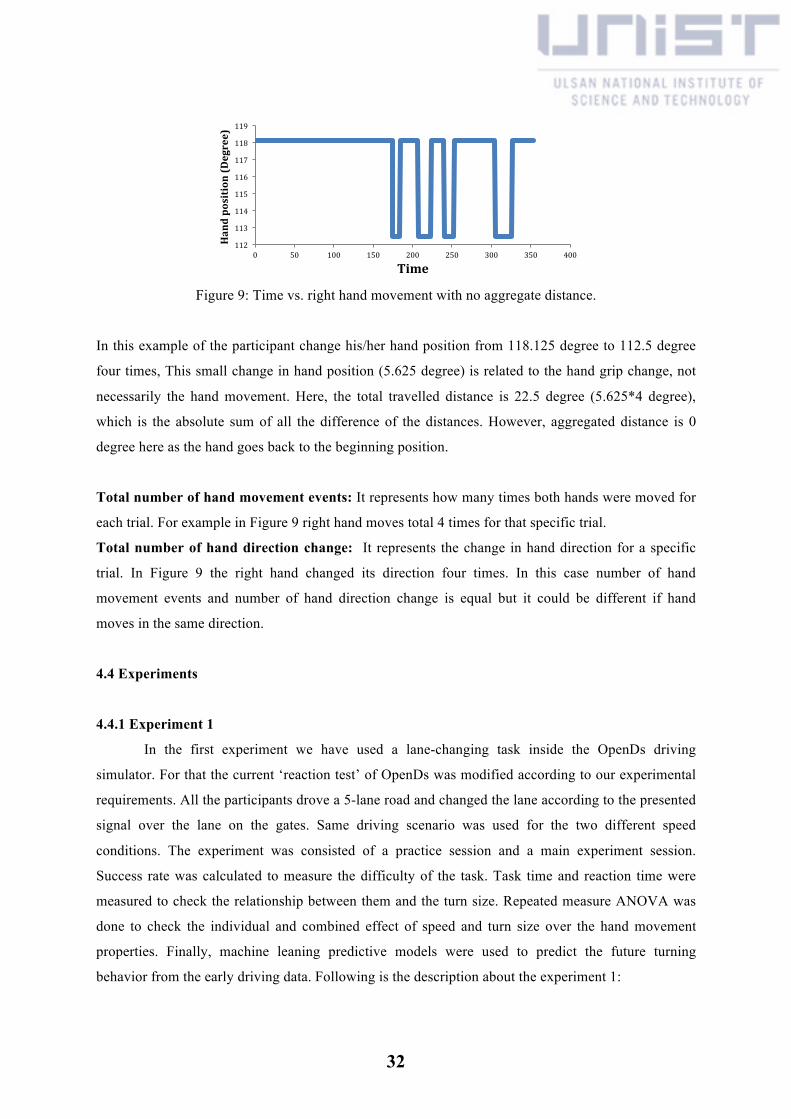
32
Figure 9: Time vs. right hand movement with no aggregate distance.
In this example of the participant change his/her hand position from 118.125 degree to 112.5 degree
four times, This small change in hand position (5.625 degree) is related to the hand grip change, not
necessarily the hand movement. Here, the total travelled distance is 22.5 degree (5.625*4 degree),
which is the absolute sum of all the difference of the distances. However, aggregated distance is 0
degree here as the hand goes back to the beginning position.
Total number of hand movement events: It represents how many times both hands were moved for
each trial. For example in Figure 9 right hand moves total 4 times for that specific trial.
Total number of hand direction change: It represents the change in hand direction for a specific
trial. In Figure 9 the right hand changed its direction four times. In this case number of hand
movement events and number of hand direction change is equal but it could be different if hand
moves in the same direction.
4.4 Experiments
4.4.1 Experiment 1
In the first experiment we have used a lane-changing task inside the OpenDs driving
simulator. For that the current ‘reaction test’ of OpenDs was modified according to our experimental
requirements. All the participants drove a 5-lane road and changed the lane according to the presented
signal over the lane on the gates. Same driving scenario was used for the two different speed
conditions. The experiment was consisted of a practice session and a main experiment session.
Success rate was calculated to measure the difficulty of the task. Task time and reaction time were
measured to check the relationship between them and the turn size. Repeated measure ANOVA was
done to check the individual and combined effect of speed and turn size over the hand movement
properties. Finally, machine leaning predictive models were used to predict the future turning
behavior from the early driving data. Following is the description about the experiment 1:
112
113
114
115
116
117
118
119
0 50 100 150 200 250 300 350 400
Handposition(D
egree)
Time
33
4.4.1.1 Participants
Nineteen healthy young participants (13 male and 6 female with average age: 24 ± 2 year)
participated in this experiment; all of them were either graduate or undergraduate students of UNIST
in South Korea. The selection criteria of the participants were they should have valid driving license
with minimum 1 year of driving experience. Before experiment demographic information was
collected about the participants along with their driving experience period and experience about such
kind of driving study experiment. According to the questionnaire, Participants had their diving
experience for about 1 year (min) to 5 years (max) and only one participant had experience about
participating in driving simulator based experiment. Compensation of the experiment was
approximately 10 USD in local currency (Korean Won).
4.4.1.2 Apparatus
Driving atmosphere: computer monitor, sitting and lighting conditions
Apple’s 27 inches thunderbolt display monitor (resolution: 2560*1440 pixels, brightness: 375
cd/m2, contrast ratio: 1000:1, vertical/horizontal viewing angle: 1780, response time: 12ms) was used
in the experiment to run the OpenDs driving simulator. The driving simulator was run with the full
screen mood at an 80 cm distance between the driver’s eye and the screen. The experimental chair,
computer screen, pedal height and the steering wheel height and angle were carefully fixed
resembling the real car. Drivers seat was 54 cm high and the height between the seat and the steering
wheel base was 20 cm. All the experiments were done during the daytime and the lighting conditions
were controlled to provide a high visual contrast. During the experiment participant used headphone
to hear the in-build auditory feedback made by OpenDs to block the surrounding noise and to fully
concentrate on the study.
Steering wheel
A steering wheel of standard size (diameter: 36 cm) was attached with the experimental desk
through a wooden base (see section 3.1.3). As the steering wheel represents the original dimension of
the real vehicle’s steering wheel so participants could easily manipulated it while driving the
simulator. Attachment of ribbon type touch electrode didn’t restrict the smooth hand movement of the
participants over the steering wheel.
Pedal
A gaming pedal from JOYTRON power racer gaming wheel was used here to facilitate the
participants to change the speed or to break immediately (see section 3.2.2). The pedal was attached
with the ground to restrict the unwanted movement.

34
4.4.1.3 Experimental design
Design of the experimental scenario
The original reaction task of OpenDs driving simulator was modified according to our
experimental requirement. We were interested only in the lane changing behavior of the participants
and therefore modified the current reaction task of OpenDs according to our requirement. According
to our task the driver should react immediately to the green tick signal positioned on the gate above
the road. We did our experiment for two different speed conditions: 25 km/h and 50 km/h. For the
speed limit of 25-km/h we took three distances as 60m, 80m and 100m where as for the 50-km/h limit
of speed we took 120m, 160m and 200m inter distances between the gates. Therefore the total
travelled distance varied from participant to participant due to the three random distances between the
gates even though the number of gates was same for all the participants.
Figure 10: Lane changing task scenario of OpenDs for experiment 1.
The driving task scenario description is as below:
1. Speed: Two different speed (max) conditions: 25 km/h, 50 km/h.
2. No of Lane change signal: 50, lane change signal presented over 50 gates.
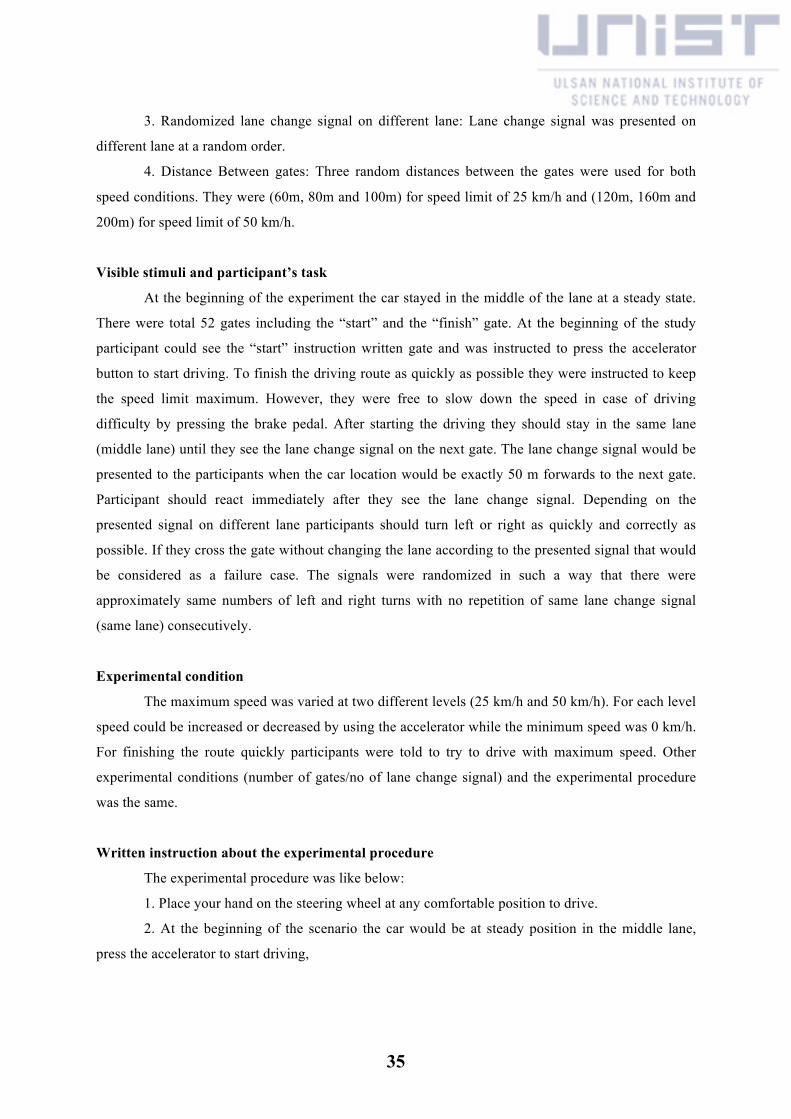
35
3. Randomized lane change signal on different lane: Lane change signal was presented on
different lane at a random order.
4. Distance Between gates: Three random distances between the gates were used for both
speed conditions. They were (60m, 80m and 100m) for speed limit of 25 km/h and (120m, 160m and
200m) for speed limit of 50 km/h.
Visible stimuli and participant’s task
At the beginning of the experiment the car stayed in the middle of the lane at a steady state.
There were total 52 gates including the “start” and the “finish” gate. At the beginning of the study
participant could see the “start” instruction written gate and was instructed to press the accelerator
button to start driving. To finish the driving route as quickly as possible they were instructed to keep
the speed limit maximum. However, they were free to slow down the speed in case of driving
difficulty by pressing the brake pedal. After starting the driving they should stay in the same lane
(middle lane) until they see the lane change signal on the next gate. The lane change signal would be
presented to the participants when the car location would be exactly 50 m forwards to the next gate.
Participant should react immediately after they see the lane change signal. Depending on the
presented signal on different lane participants should turn left or right as quickly and correctly as
possible. If they cross the gate without changing the lane according to the presented signal that would
be considered as a failure case. The signals were randomized in such a way that there were
approximately same numbers of left and right turns with no repetition of same lane change signal
(same lane) consecutively.
Experimental condition
The maximum speed was varied at two different levels (25 km/h and 50 km/h). For each level
speed could be increased or decreased by using the accelerator while the minimum speed was 0 km/h.
For finishing the route quickly participants were told to try to drive with maximum speed. Other
experimental conditions (number of gates/no of lane change signal) and the experimental procedure
was the same.
Written instruction about the experimental procedure
The experimental procedure was like below:
1. Place your hand on the steering wheel at any comfortable position to drive.
2. At the beginning of the scenario the car would be at steady position in the middle lane,
press the accelerator to start driving,
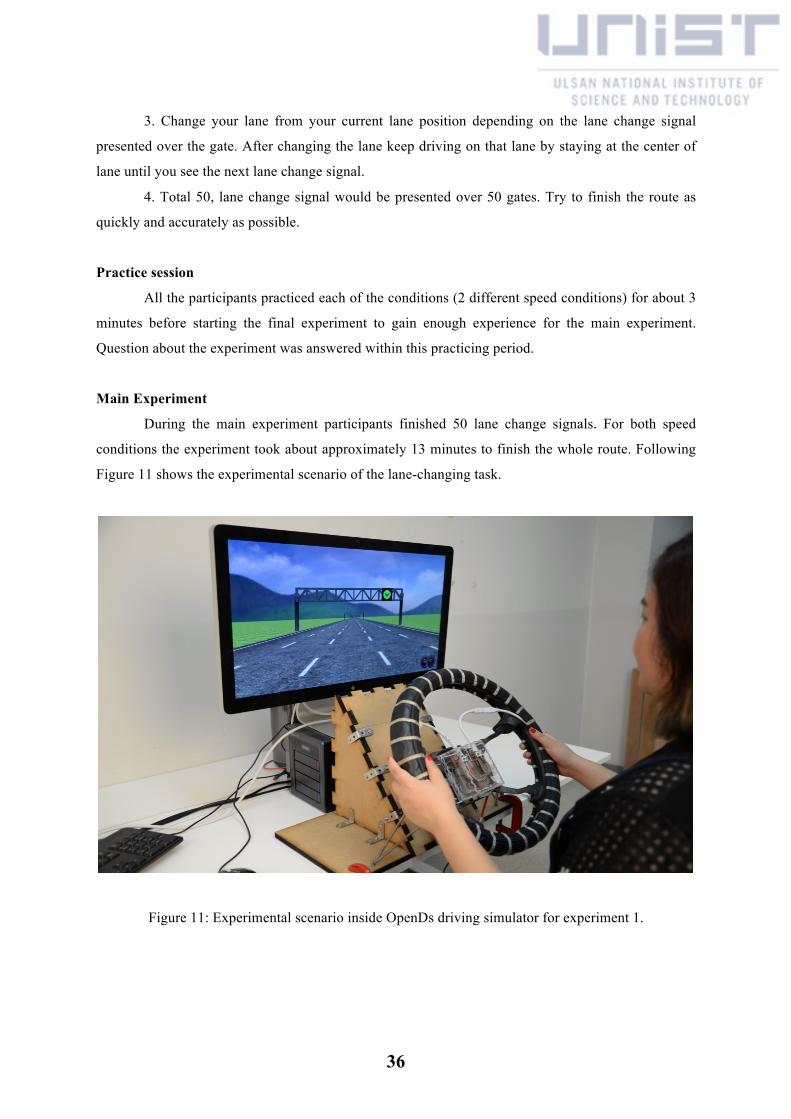
36
3. Change your lane from your current lane position depending on the lane change signal
presented over the gate. After changing the lane keep driving on that lane by staying at the center of
lane until you see the next lane change signal.
4. Total 50, lane change signal would be presented over 50 gates. Try to finish the route as
quickly and accurately as possible.
Practice session
All the participants practiced each of the conditions (2 different speed conditions) for about 3
minutes before starting the final experiment to gain enough experience for the main experiment.
Question about the experiment was answered within this practicing period.
Main Experiment
During the main experiment participants finished 50 lane change signals. For both speed
conditions the experiment took about approximately 13 minutes to finish the whole route. Following
Figure 11 shows the experimental scenario of the lane-changing task.
Figure 11: Experimental scenario inside OpenDs driving simulator for experiment 1.

37
From the experiment 1, we have observed that speed had a significant effect on the success
rate and the overall task time, which is described in the result section. AOVA result also revealed that
speed and turn size had a significant effect on the hand movement properties.
We have observed the hand movement properties from the experiment 1 of the lane-changing
task. We tried to predict the future end point of the turning from the participant’s early hand
movement data as we hypothesized that there is a strong relationship between the turning behavior
and their subsequent hand postures. However, our predictive models couldn’t predict the four turn
sizes very well from the first experiment. We suspect that the lane changing task, which we have used
in our experiment 1 is not suitable enough for the turning action of the drivers. Therefore, we
designed another experiment as described below.
4.4.2 Experiment 2
In this experiment 2 we further modified the ‘reaction test’ of OpenDs driving simulator as
we suspect that our experimental scenario of the first experiment couldn’t predict the final turning
points well, as this kind of lane changing task doesn’t perfectly resemble the turning task. A ‘slalom
driving task’ was implemented in the second experiment, by using red and blue blocks where
participants need to change the lane depending on the color of the blocks. Distance between the
blocks was made shorted that the distance between the gates used in the first experiment in order to
facilitate the participants more sharp turns. Like experiment 1 this experiment also consisted of a
practice and a main experiment session. Success rate, Task time and reaction time were also
measured. For the analysis of the result repeated measure ANOVA was performed. Finally the same
predictive models were used as experiment 1 for predicting the future tuning behavior. Following is
the description about the experiment 2:
4.4.2.1 Participants:
Another twenty healthy young participants (16 male and 3 female with average age: 24 ± 2
year) participated in the follow up experiment. The selection criteria of the participants and the
compensation of the experiment were same as the main experiment.
4.4.2.2 Apparatus:
All the apparatus such as sitting, lighting condition, computer monitor specification, steering
wheel and pedal used for the experiment were same as the first main experiment.
4.4.2.3 Experimental design
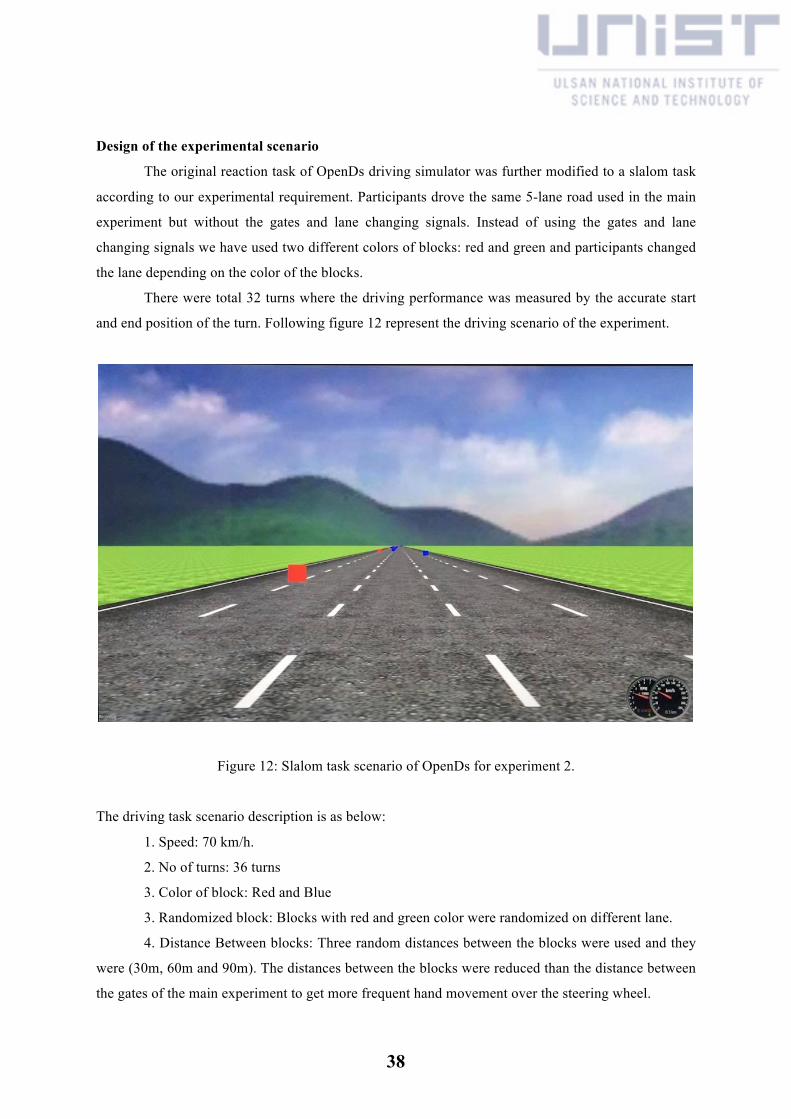
38
Design of the experimental scenario
The original reaction task of OpenDs driving simulator was further modified to a slalom task
according to our experimental requirement. Participants drove the same 5-lane road used in the main
experiment but without the gates and lane changing signals. Instead of using the gates and lane
changing signals we have used two different colors of blocks: red and green and participants changed
the lane depending on the color of the blocks.
There were total 32 turns where the driving performance was measured by the accurate start
and end position of the turn. Following figure 12 represent the driving scenario of the experiment.
Figure 12: Slalom task scenario of OpenDs for experiment 2.
The driving task scenario description is as below:
1. Speed: 70 km/h.
2. No of turns: 36 turns
3. Color of block: Red and Blue
3. Randomized block: Blocks with red and green color were randomized on different lane.
4. Distance Between blocks: Three random distances between the blocks were used and they
were (30m, 60m and 90m). The distances between the blocks were reduced than the distance between
the gates of the main experiment to get more frequent hand movement over the steering wheel.

39
Visible stimuli and participant’s task
At the beginning of the experiment the car were located in the middle of the lane at a steady
state. There were total 36 single turns. At the beginning of the study participant could see the “start”
instruction written gate and was instructed to press the accelerator button to start driving. To finish the
driving route as quickly as possible they were instructed to keep the speed limit maximum as the main
experiment.
Experimental condition
The maximum speed was 70 km/h while the minimum was 0 km/h. Speed could be increased
or decreased by using the accelerator. However, for finishing the route quickly participants were told
to try to drive with maximum speed.
Written instruction about the experimental procedure
The experimental procedure was like below:
1. Place your hand on the steering wheel at any comfortable position to drive.
2. At the beginning of the scenario the car would be at steady position in the middle lane,
press the accelerator to start driving,
3. Change your lane from your current lane position depending on the block color. Drive the
car by keeping the red blocks on your right side and blue blocks on your left side.
4. After you pass one block try to keep that lane by staying in the middle of the lane until you
reach closer to the next block.
5. Try to finish the route as quickly and accurately as possible.
It was considered as a failure case if participants failed to stay just next lane of the blocks depending
on the color of them.
Practice session
All the participants practiced the driving scenario for about 3 minutes, as they had to gain
enough experience for the main experiment.
Main Experiment
The experiment took about approximately 9 minutes to finish the whole route. Following
figure 13 shows the experimental scenario of the slalom-driving task.
40
Figure 13: Experimental scenario inside OpenDs driving simulator for experiment 2.
Like experiment 1 here also we have observed the hand movement properties of the
participants for different turn sizes. ANOVA result of turn sizes was significant for different hand
movement properties as explained in the result section. From the experiment 2 we got higher
prediction accuracy of the predictor models compared to the experiment 1, which suggest that the
driving task used in the experiment 2 was better and close to real turning task than experiment 1.
4.5 Machine-learning approaches for predicting future turning behavior
We have used few machine learning approaches to predict future turning behavior from the
early parts of the turning behavior. Typical trajectory of wheel angle over time for all the turn sizes
indicated that for changing the lane participants first need to move the wheel from near to zero degree
to one direction and than return it in previous direction to stabilize the wheel. Following figure shows
the change in wheel angle during lane-changing tasks for all the four turn sizes. As mentioned before
we have used the early part of the data from the whole raw data of a lane change task based on the
maximum wheel angle as marked in the figure. Data until the wheel angle reach to the maximum
value was used to predict the end point of the turns.
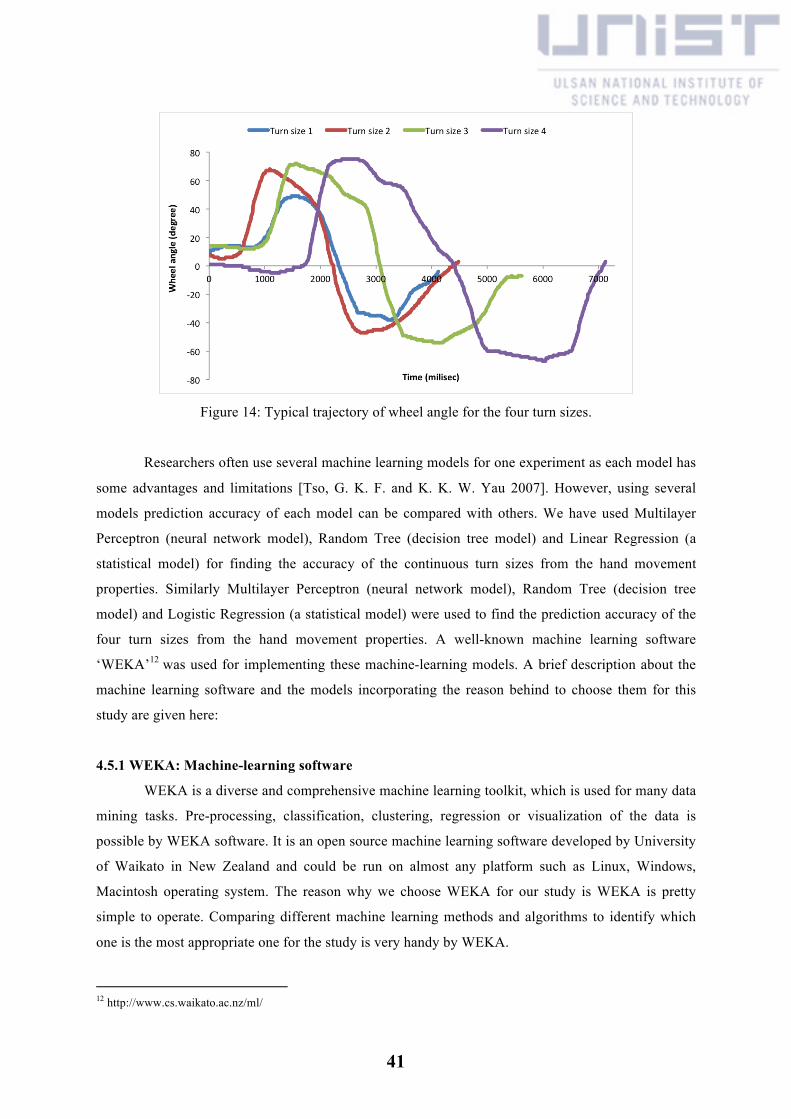
41
Figure 14: Typical trajectory of wheel angle for the four turn sizes.
Researchers often use several machine learning models for one experiment as each model has
some advantages and limitations [Tso, G. K. F. and K. K. W. Yau 2007]. However, using several
models prediction accuracy of each model can be compared with others. We have used Multilayer
Perceptron (neural network model), Random Tree (decision tree model) and Linear Regression (a
statistical model) for finding the accuracy of the continuous turn sizes from the hand movement
properties. Similarly Multilayer Perceptron (neural network model), Random Tree (decision tree
model) and Logistic Regression (a statistical model) were used to find the prediction accuracy of the
four turn sizes from the hand movement properties. A well-known machine learning software
‘WEKA’12 was used for implementing these machine-learning models. A brief description about the
machine learning software and the models incorporating the reason behind to choose them for this
study are given here:
4.5.1 WEKA: Machine-learning software
WEKA is a diverse and comprehensive machine learning toolkit, which is used for many data
mining tasks. Pre-processing, classification, clustering, regression or visualization of the data is
possible by WEKA software. It is an open source machine learning software developed by University
of Waikato in New Zealand and could be run on almost any platform such as Linux, Windows,
Macintosh operating system. The reason why we choose WEKA for our study is WEKA is pretty
simple to operate. Comparing different machine learning methods and algorithms to identify which
one is the most appropriate one for the study is very handy by WEKA.
12 http://www.cs.waikato.ac.nz/ml/
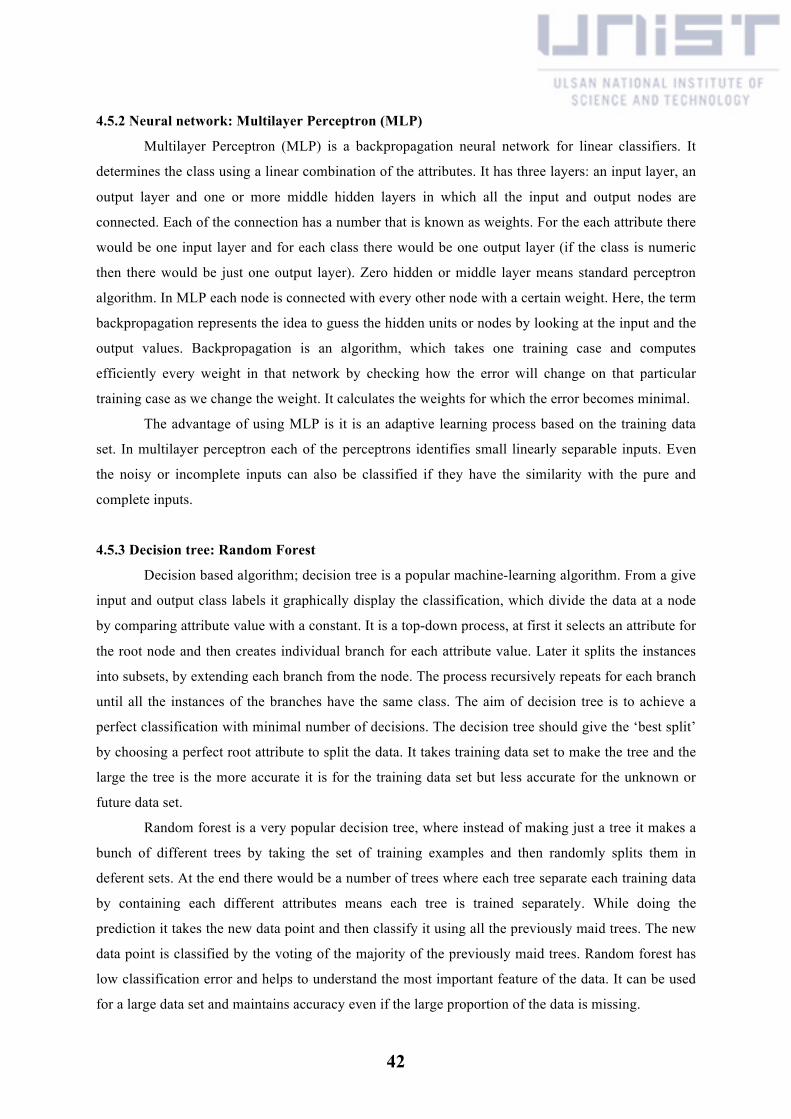
42
4.5.2 Neural network: Multilayer Perceptron (MLP)
Multilayer Perceptron (MLP) is a backpropagation neural network for linear classifiers. It
determines the class using a linear combination of the attributes. It has three layers: an input layer, an
output layer and one or more middle hidden layers in which all the input and output nodes are
connected. Each of the connection has a number that is known as weights. For the each attribute there
would be one input layer and for each class there would be one output layer (if the class is numeric
then there would be just one output layer). Zero hidden or middle layer means standard perceptron
algorithm. In MLP each node is connected with every other node with a certain weight. Here, the term
backpropagation represents the idea to guess the hidden units or nodes by looking at the input and the
output values. Backpropagation is an algorithm, which takes one training case and computes
efficiently every weight in that network by checking how the error will change on that particular
training case as we change the weight. It calculates the weights for which the error becomes minimal.
The advantage of using MLP is it is an adaptive learning process based on the training data
set. In multilayer perceptron each of the perceptrons identifies small linearly separable inputs. Even
the noisy or incomplete inputs can also be classified if they have the similarity with the pure and
complete inputs.
4.5.3 Decision tree: Random Forest
Decision based algorithm; decision tree is a popular machine-learning algorithm. From a give
input and output class labels it graphically display the classification, which divide the data at a node
by comparing attribute value with a constant. It is a top-down process, at first it selects an attribute for
the root node and then creates individual branch for each attribute value. Later it splits the instances
into subsets, by extending each branch from the node. The process recursively repeats for each branch
until all the instances of the branches have the same class. The aim of decision tree is to achieve a
perfect classification with minimal number of decisions. The decision tree should give the ‘best split’
by choosing a perfect root attribute to split the data. It takes training data set to make the tree and the
large the tree is the more accurate it is for the training data set but less accurate for the unknown or
future data set.
Random forest is a very popular decision tree, where instead of making just a tree it makes a
bunch of different trees by taking the set of training examples and then randomly splits them in
deferent sets. At the end there would be a number of trees where each tree separate each training data
by containing each different attributes means each tree is trained separately. While doing the
prediction it takes the new data point and then classify it using all the previously maid trees. The new
data point is classified by the voting of the majority of the previously maid trees. Random forest has
low classification error and helps to understand the most important feature of the data. It can be used
for a large data set and maintains accuracy even if the large proportion of the data is missing.
43
4.5.4 Statistical model: logistic Regression
Logistic regression predicts the output probabilities. It is an approach that predicts the class
probabilities directly instead of predicting the classes. It gives the chance of an input variable that it
will belong to any of the various classes. In a linear regression model the output is 1 if the training
instance belongs to that class and 0 if it doesn’t belong to that class. A linear regression could also
generate probabilities less than 0 or greater than 1 where as a logistic regression output probability
can lie anywhere between negative infinity and positive infinity. The output of logistic regression is
still a linear model but it models the probabilities on a non-linear scale (log scale). The logit
transformation transforms the variables, which is approximated by a linear function like the linear
regression. Here also the weights must fit the training data well. In linear regression the squared error
is measured to find the goodness of fit but in logistic regression log-likelihood of the model is used.
The weights are chosen in such a way to maximize the log likelihood.
A logistic regression is popular and powerful model and easy to train. It is resistant to
overfitting the data.
4.5.5 Statistical model: Linear Regression
Linear regression is a statistical method to find a linear relationship between the predictor
variable and the outcome. If only one predictor variable is used to predict the outcome then it is called
single linear regression where as multiple linear regression means multiple predictor or explanatory
variables are used to predict the single output. It can be used to fit a predictive model of an observed
data set. The fitted model is then can be used to predict the unknown dependent or outcome from the
given values of the input or the predictor variables.
Linear regression model is different than the classification problem. The classification
technique could be used for categorization of the data while linear regression is used for continuous
data set. It uses numeric values where as the classification problem predicts the nominal values. It
finds the best line or hyperplane, which fits the training data set. The output class is the linear
combination of the attributes, each of which has a predetermined weights calculated from the training
data set. The weights are chosen in such a way to minimize the squared error of the training data by
taking the squared error between the predicted and the actual values. Therefore, the best-fitted line
will have the least mean squared difference. Linear regression is one of the easiest and simple
techniques to use for numeric prediction. WEKA can remove highly correlated attributes and select
only the relevant attributes for the linear regression.
4.6 Discrete and continuous prediction of turn sizes
We have plotted the histograms of all the four turn sizes for the both experiments as below to
check the distribution of turn sizes:
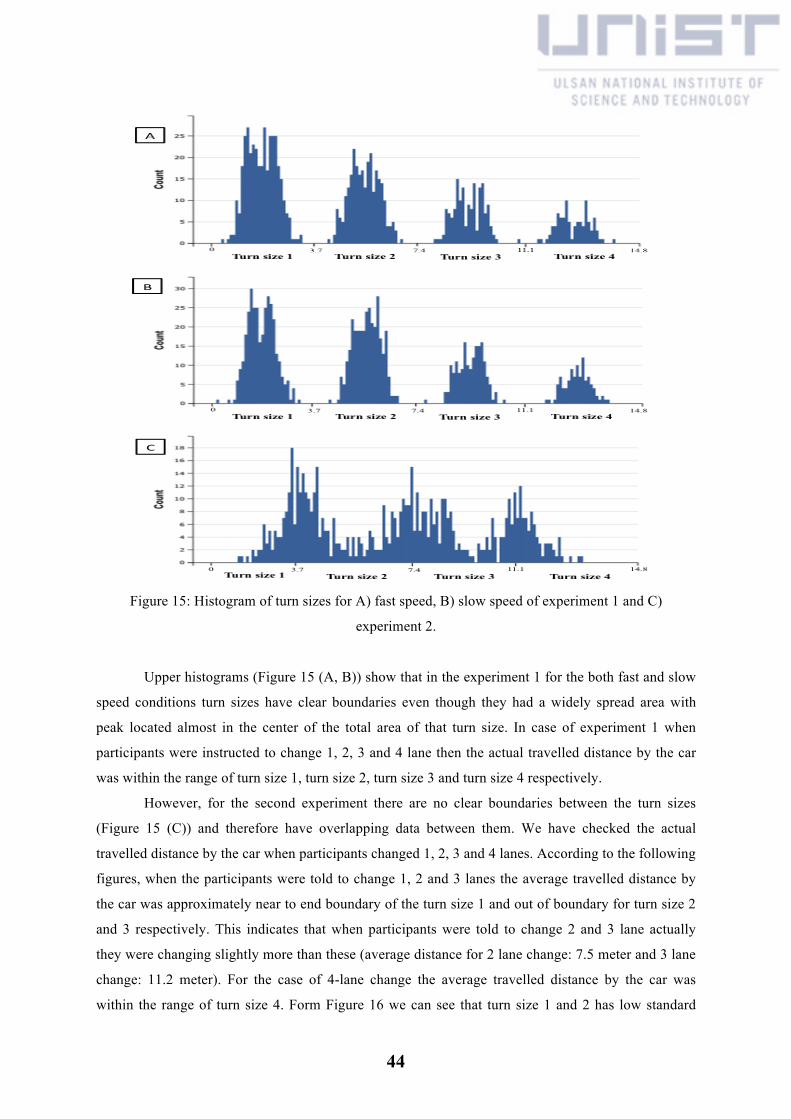
44
Figure 15: Histogram of turn sizes for A) fast speed, B) slow speed of experiment 1 and C)
experiment 2.
Upper histograms (Figure 15 (A, B)) show that in the experiment 1 for the both fast and slow
speed conditions turn sizes have clear boundaries even though they had a widely spread area with
peak located almost in the center of the total area of that turn size. In case of experiment 1 when
participants were instructed to change 1, 2, 3 and 4 lane then the actual travelled distance by the car
was within the range of turn size 1, turn size 2, turn size 3 and turn size 4 respectively.
However, for the second experiment there are no clear boundaries between the turn sizes
(Figure 15 (C)) and therefore have overlapping data between them. We have checked the actual
travelled distance by the car when participants changed 1, 2, 3 and 4 lanes. According to the following
figures, when the participants were told to change 1, 2 and 3 lanes the average travelled distance by
the car was approximately near to end boundary of the turn size 1 and out of boundary for turn size 2
and 3 respectively. This indicates that when participants were told to change 2 and 3 lane actually
they were changing slightly more than these (average distance for 2 lane change: 7.5 meter and 3 lane
change: 11.2 meter). For the case of 4-lane change the average travelled distance by the car was
within the range of turn size 4. Form Figure 16 we can see that turn size 1 and 2 has low standard

45
deviation where as turn size 3 has high standard deviation and turn size 4 has the highest standard
deviation from the mean. Moreover, mean actual travelled distance by the car for turn size 3 and 4
were very close to each other indicating a clear overlapping between them. These overlapping of turn
sizes (specially between turn size 3 and 4) and out of boundary values may cause difficulties to
distinguish them, which is a reason why we did continuous prediction of the turn sizes along with the
categorical prediction of the four turn sizes.
Figure 16: Actual travelled distance by the car while changing 1, 2, 3 and 4 lanes for experiment 2.
Bars show standard deviation.
We have also observed the histogram of total travelled distance by the hands for the two
experiments as shown if Figure 17-19. For all the turn sizes there were several no hand movement
cases. However turn size 3 and 4 had long tailed data compared with turn size 1 and 2, which means
participants moved their hands much for turn size 3 and 4 compared to turn size 1 and 2 indicating a
clear difference between turn size 1 and 2 (smaller turn) from turn size 3 and 4 (larger turn). After
observing the histograms of turn sizes and the total travelled distances of hands we did both the class-
wise prediction and continuous prediction of the turn sizes from the hand movement properties and
the wheel angle.
01234567891011121314
1lanechange
2lanechange
3lanechange
4lanechange
Actualtravelleddistancebycar
(meter)
Numberoflanechange

46
Figure 17: Histogram of total hand movement for A) turn size 1, B) turn size 2, C) turn size 3 and D)
turn size 4 for the fast speed of experiment 1.
Figure 18: Histogram of total hand movement for A) turn size 1, B) turn size 2, C) turn size 3 and D)
turn size 4 for the slow speed of experiment 1.

47
Figure 19: Histogram of total hand movement for A) turn size 1, B) turn size 2, C) turn size 3 and D)
turn size 4 for the experiment 2.
4.7 Descriptive statistics of the data:
4.7.1 Success rate
Success rate represents the percentage of the success cases of the tasks. Al the participant’s
finished 50 trials for the lane-changing task of the first experiment and 32 trials for the slalom task of
the second experiment. We have used two speed limits in he first experiment, slow (25 km/h) and fast
speed (50 km/h). However, success rate of lane change for the slow speed was higher (97.78 % with
standard deviation: 4.68 %) than the fast speed (95.26% with standard deviation: 6.04 %). Therefore,
speed had an effect on the success rates of the experiment 1. For the second experiment success rate
for the slalom task was 96.87% with a standard deviation of 4.3 %.
4.7.2 Task time
Task time is the time difference between participants saw the lane change signal over the gate
and the time when they successfully entered to the target lane. During the experiment participants
drove a 5-lane road on the driving simulator. Therefore whenever they changed lane from one to
another turn size also varied depending on the distance between the target and the destination lane.
Experimental result showed that the far they went means whenever the turn size increased task time
also increased with the size of the turn. Following figures represents the turn size vs. task time of all
participants for all the different turn sizes for the first and the second experiment. The low standard
error represents the small variability between the means.
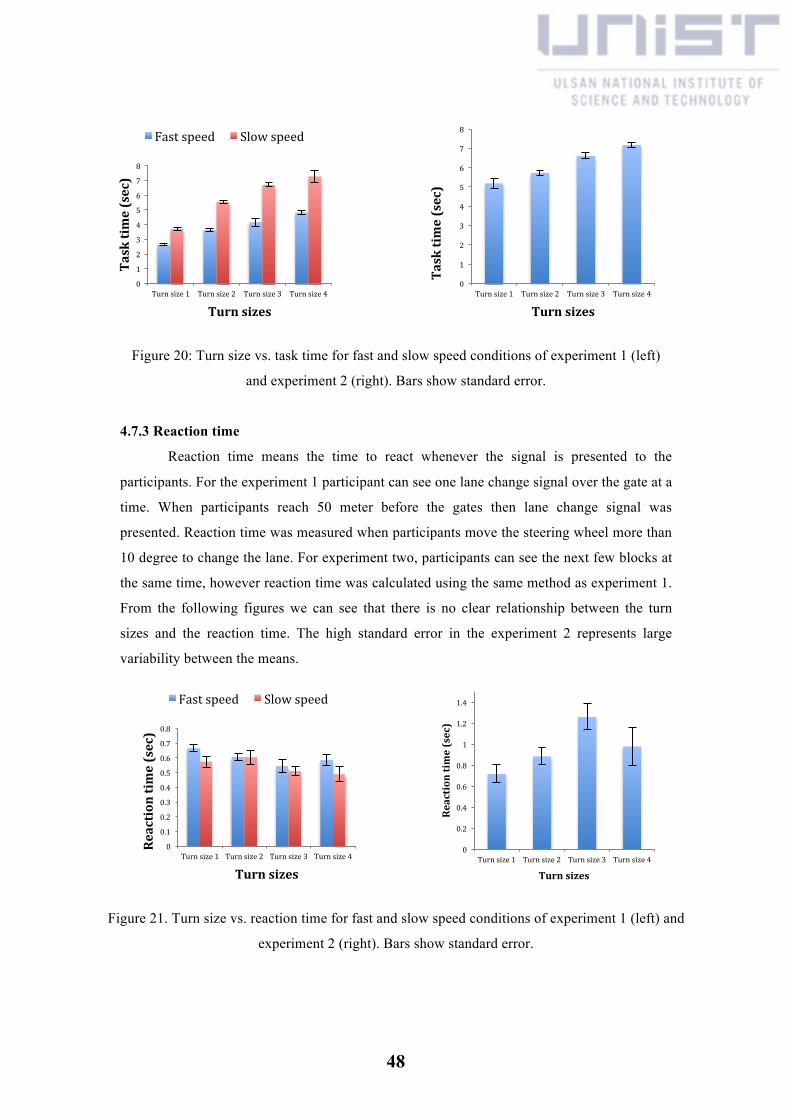
48
Figure 20: Turn size vs. task time for fast and slow speed conditions of experiment 1 (left)
and experiment 2 (right). Bars show standard error.
4.7.3 Reaction time
Reaction time means the time to react whenever the signal is presented to the
participants. For the experiment 1 participant can see one lane change signal over the gate at a
time. When participants reach 50 meter before the gates then lane change signal was
presented. Reaction time was measured when participants move the steering wheel more than
10 degree to change the lane. For experiment two, participants can see the next few blocks at
the same time, however reaction time was calculated using the same method as experiment 1.
From the following figures we can see that there is no clear relationship between the turn
sizes and the reaction time. The high standard error in the experiment 2 represents large
variability between the means.
Figure 21. Turn size vs. reaction time for fast and slow speed conditions of experiment 1 (left) and
experiment 2 (right). Bars show standard error.
0
1
2
3
4
5
6
7
8
Turnsize1 Turnsize2 Turnsize3 Turnsize4
Tasktime(sec)
Turnsizes
Fastspeed Slowspeed
0
1
2
3
4
5
6
7
8
Turnsize1 Turnsize2 Turnsize3 Turnsize4
Tasktime(sec)
Turnsizes
0
0.1
0.2
0.3
0.4
0.5
0.6
0.7
0.8
Turnsize1 Turnsize2 Turnsize3 Turnsize4
Reactiontime(sec)
Turnsizes
Fastspeed Slowspeed
0
0.2
0.4
0.6
0.8
1
1.2
1.4
Turnsize1 Turnsize2 Turnsize3 Turnsize4
Reactiontime(sec)
Turnsizes

49
4.8 Analysis and the Predictive models
4.8.1 Analysis of the hand movement properties through repeated measure ANOVA
Two compare the difference between the hand movement properties four separate 4*3
repeated measure ANOVA was done by taking turn size and speed as two independent variables for
the first experiment. For the second experiment four one way repeated measure ANOVA was done by
taking turn size as an independent variable. For both experiment the dependent variables were the four
hand movement properties of the hands over the steering wheel and the steering wheel angle.
For the both experiments we did repeated measure ANOVA twice. The first one is for the
whole data, which means when the lane-changing signal was presented to the participants to until they
reach to the target lanes to check whether the four hand movement properties and the wheel angle
were significantly different from each other for the four turn types (Figure 22-26). The second one is
when the lane-changing signal was presented to the participants to until they moved the steering
wheel at maximum angle value in order to change the lane (Figure 27-31) as we have applied our
machine-learning recognizers until this point of data to predict the future turning behavior.
For both one way and the factorial ANOVA we checked the violation of sphericity and
corrected it by Greenhouse-Geisser procedure. For the first experiment for the whole data (see section
5.8.1.1) Greenhouse-Geisser correction was needed for all the dependent variables for the turn size
factor and the interactions effect between turn size and speed. However, turn size factor for total
number of hand direction change and speed and turn size interaction factor for wheel angle didn’t
require the correction. For the ANOVA of until maximum wheel angle data (see section 5.8.1.2)
violation of sphericity for the turn size factor and the interactions effect between turn size and speed
was corrected for all the four hand movement properties and the wheel angle. As speed had only two
levels so checking the sphericity was not possible.
For the second experiment for both ANOVA for whole data and ANOVA until maximum
wheel angle data turn size factor violated the sphericity for all the four hand movement properties and
therefore Greenhouse-Geisser procedure was used to correct them. Wheel angle variable didn’t
violate the sphericity for both cases.
We have also reported the effect size for ANOVA results as partial-eta-squared (η2) as it can
help to estimate how large and meaningful the difference is between the means.
4.8.1.1 ANOVA for whole data set
ANOVA for total travelled distance

50
Figure 22: Total mean travelled distances of hands for four turn sizes for fast and slow speed
conditions of experiment 1 (left) and experiment 2 (right). Bars show standard error.
For the first experiment total travelled distance differed significantly for different turn
sizes (F (1.887, 33.961) = 19.127, p=0.00, η2 = 0.515) and speed (F (1, 18) = 6.474, p<0.05, η2
= 0.265) conditions but no interaction effect between the turn size and the speed (F (1.529,
27.519) = 0.856, p>0.05, η2 = 0.045) was seen. For the second experiment also turn size had
significant effect on total travelled distance (F (1.275, 24.225) = 16.820, p=0.00, η2 = 0.775).
In figure 22, in the first experiment participants moved their hand much for the slow
speed condition compared to the fast speed, indicating that if the speed it low participants
need to move their hand more compared to the fast speed. For both experiments as the turn
size increases total travelled distance by the hands also increases, indicating that the far
participants went the larger the travelled distance was. Standard error also increased as the
turn size increased indicating the increased variation between the means of the turn sizes.
ANOVA for Aggregate distance
0
50
100
150
200
250
300
350
Turnsize1 Turnsize2 Turnsize3 Turnsize4
Totaltravelleddistance(degree)
Turnsize
Fastspeed Slowspeed
0306090120150180210240270300330360
Turnsize1 Turnsize2 Turnsize3 Turnsize4
Totaltravelleddistance(degree)
Turnsize
0
10
20
30
40
50
60
70
80
90
Turnsize1 Turnsize2 Turnsize3 Turnsize4
Aggregatedistance(degree)
Turnsize
Fastspeed Slowspeed
0102030405060708090100110120
Turnsize1 Turnsize2 Turnsize3 Turnsize4
Aggregatedistance(degree)
Turnsize

51
Figure 23: Total mean aggregate distances of hands of four turn sizes for fast and slow speed
conditions of experiment 1 (left) and experiment 2 (right). Bars show standard error.
In experiment 1 aggregate distance differed for different turn sizes (F (1.720, 30.965)
= 22.514, P=0.00, η2 =0.556) but not for speed (F (1, 18) = 4.089, p>0.05, η2 = 0.185). It also
had no interactions effect between them (F (1.955, 35.183) = 0.493, p>0.05, η2 = 0.027). In
the second experiment turn size had significant effect on total aggregate distance (F (1.406,
26.718) = 21.746, p=0.00, η2 = 0.534).
Figure 23 shows the total mean aggregate travelled distance by all participants. It has
an increasing tendency as the turn size increases for the both experiments, indicating that
larger turn sizes required larger aggregated distance. However, ANOVA result of experiment
1 shows that for different speed conditions aggregate distance didn’t varied much, indicating
no effect of speed over it. In case of aggregate distance also standard error increased as the
turn size increased indicating the increased variation between the turn size means.
ANOVA for total number of hand movement events
Figure 24: Total mean hand movement events of four turn sizes for fast and slow speed conditions of
experiment 1 (left) and experiment 2 (right). Bars show standard error.
In the experiment 1 total number of hand movement events were significantly different both
for the turn size (F (2.003, 36.047) = 32.923, p=0.00, η2 = 0.647) and speed (F (1, 18) = 7.658,
p<0.05, η2 = 0.298) without having any interactions effect between the turn sizes and the speed (F
(1.784, 32.109) = 1.692, p>0.05, η2 = 0.086). In the second experiment turn size was significant for
number of hand movement events (F (1.930, 36.672) = 26.801, p=0.00, η2 = 0.585).
Figure 24 shows the number of hand movement events for the four turn types of the two
experiments, where number of hand movement events increased when the turn size increased. It
00.51
1.52
2.53
3.54
4.55
5.56
6.5
Turnsize1 Turnsize2 Turnsize3 Turnsize4
Handmovem
entevents
Turnsize
Fastspeed Slowspeed
00.51
1.52
2.53
3.54
4.55
5.56
Turnsize1 Turnsize2 Turnsize3 Turnsize4
Handmovem
entevents
Turnsize

52
indicates that the larger turn sizes require more hand movement events. Effect of speed indicated
when the speed is slow participants need to move their hand more than the fast speed while changing
the lane. Standard error bar is representing the variability of the sample means.
ANOVA for total number of hand direction change
Figure 25: Total mean number of hand direction changes for four turn size categories for fast and
slow speed conditions of experiment 1 (left) and experiment 2 (right). Bars show standard error.
For the first experiment turn size (F (3, 54) = 28.987, p=0.00, η2 = 0.617) and speed (F (1, 18)
= 5.545, p<0.05, η2 = 0.235) had the main effect on total number of hand direction change whereas no
interactions effect was found between them (F (2.198, 39.569) = 1.440, p>0.05, η2 = 0.074). In the
second experiment turn size was significant for number of hand direction change (F (1.989, 37.787) =
13.108, p=0.00, η2 = 0.408).
Figure 25 shows the number of hand direction changes for the four turn types of the two
experiments, where number of hand direction change increased when the turn size increased. It
indicates that the larger turn sizes require more hand direction changes. Effect of speed indicated
when the speed is slow participants need to change the direction of their hand more than the fast speed
while changing the lane. Standard error bar is representing the variability of the sample means.
ANOVA for wheel angle
0
0.5
1
1.5
2
2.5
3
3.5
4
4.5
Turnsize1 Turnsize2 Turnsize3 Turnsize4
Handdirectionchanges
Turnsize
Fastspeed Slowspeed
0
0.5
1
1.5
2
2.5
3
3.5
4
Turnsize1 Turnsize2 Turnsize3 Turnsize4
Handdirectionchanges
Turnsize

53
Figure 26: Change in wheel angle for four turn size categories for fast and slow speed conditions of
experiment 1 (left) and experiment 2 (right). Bars show standard error.
In the experiment 1 wheel angle were significantly different both for the turn size (F (2.001,
36.024) = 137.280, p=0.00, η2 = 0.884) and speed (F (1, 18) = 19.621, p=0.00, η2 = 0.522) with the
interactions effect between the turn size and the speed (F (2.807, 50.521) = 7.976, p=0.00, η2 = 0.307).
In the second experiment also turn size was significant for wheel angle (F (3, 57) = 137.234, p=0.00,
η2 = 0.878).
Figure 26 shows that wheel angle for the four turn types of the two experiments were
increased when the turn size increased. It indicates that the larger turn sizes required bigger wheel
angle changes. Effect of speed indicated when the speed is slow participants need to change the wheel
angle more than the fast speed while changing the lane. Standard error bar is representing the
variability of the sample means.
To sum up, for experiment 1 for all different turn sizes and speed conditions all the hand
movement variables varied except total aggregate distance didn’t has any effect of speed. Therefore,
the ANOVA result confirmed that the four turn sizes and the two speed conditions were significantly
different than each other, which caused the difference in the measured variables. Similarly,
experiment 2 also showed similar significant effect of turn sizes over all the dependent variables
indicating that all the turn sizes were different from each other.
4.8.1.2 ANOVA until maximum wheel angle data
ANOVA for total travelled distance
0
10
20
30
40
50
60
70
80
Turnsize1 Turnsize2 Turnsize3 Turnsize4
Wheelangle(degree)
Turnsize
Fastspeed Slowspeed
0
10
20
30
40
50
60
70
Turnsize1 Turnsize2 Turnsize3 Turnsize4
Wheelangle(degree)
Turnsize
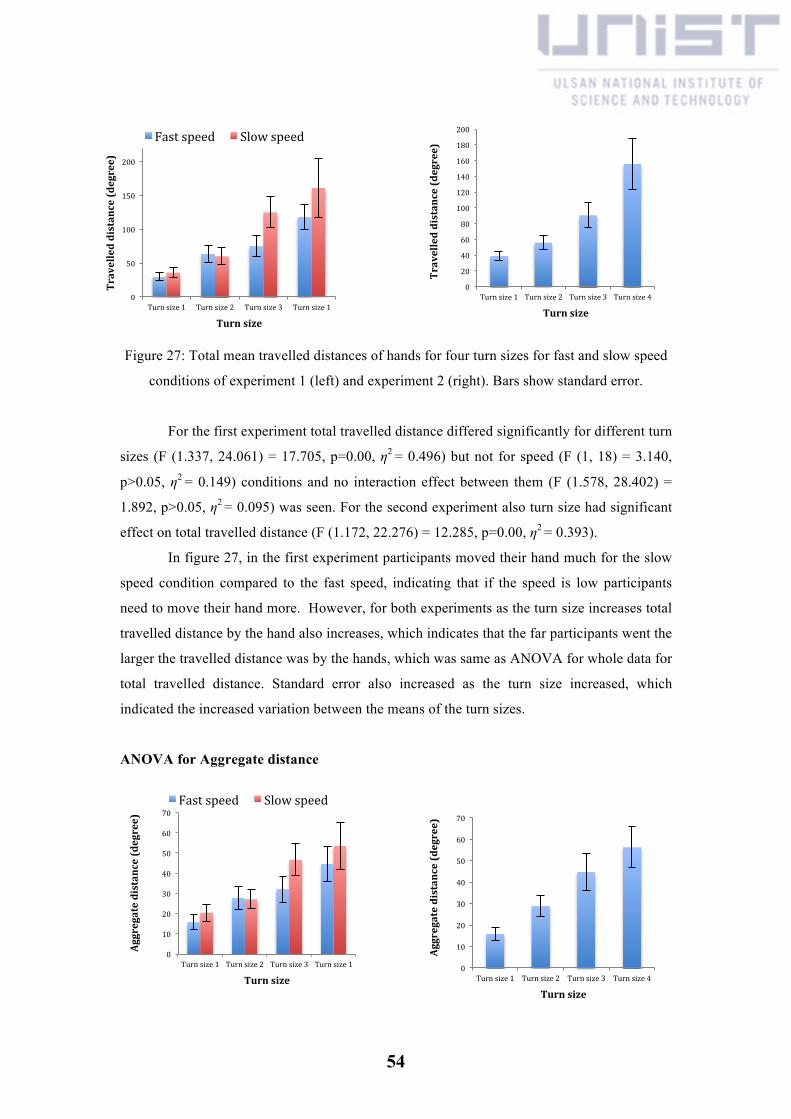
54
Figure 27: Total mean travelled distances of hands for four turn sizes for fast and slow speed
conditions of experiment 1 (left) and experiment 2 (right). Bars show standard error.
For the first experiment total travelled distance differed significantly for different turn
sizes (F (1.337, 24.061) = 17.705, p=0.00, η2 = 0.496) but not for speed (F (1, 18) = 3.140,
p>0.05, η2 = 0.149) conditions and no interaction effect between them (F (1.578, 28.402) =
1.892, p>0.05, η2 = 0.095) was seen. For the second experiment also turn size had significant
effect on total travelled distance (F (1.172, 22.276) = 12.285, p=0.00, η2 = 0.393).
In figure 27, in the first experiment participants moved their hand much for the slow
speed condition compared to the fast speed, indicating that if the speed is low participants
need to move their hand more. However, for both experiments as the turn size increases total
travelled distance by the hand also increases, which indicates that the far participants went the
larger the travelled distance was by the hands, which was same as ANOVA for whole data for
total travelled distance. Standard error also increased as the turn size increased, which
indicated the increased variation between the means of the turn sizes.
ANOVA for Aggregate distance
0
50
100
150
200
Turnsize1 Turnsize2 Turnsize3 Turnsize1
Travelleddistance(degree)
Turnsize
Fastspeed Slowspeed
0
20
40
60
80
100
120
140
160
180
200
Turnsize1 Turnsize2 Turnsize3 Turnsize4
Travelleddistance(degree)
Turnsize
0
10
20
30
40
50
60
70
Turnsize1 Turnsize2 Turnsize3 Turnsize1
Aggregatedistance(degree)
Turnsize
Fastspeed Slowspeed
0
10
20
30
40
50
60
70
Turnsize1 Turnsize2 Turnsize3 Turnsize4
Aggregatedistance(degree)
Turnsize

55
Figure 28: Total mean aggregate distances of hands of four turn sizes for fast and slow speed
conditions of experiment 1 (left) and experiment 2 (right). Bars show standard error.
In experiment 1 aggregate distance differed for different turn sizes (F (1.367, 24.603)
= 17.114, P=0.00, η2 =0.487) but not for speed (F (1, 18) = 3.099, p>0.05, η2 = 0.147). It also
had no interactions effect between them (F (1.912, 34.425) = 1.380, p>0.05, η2 = 0.071). In
the second experiment turn size had significant effect on total aggregate distance (F (2.039,
38.733) = 11.637, p=0.00, η2 = 0.380).
In the Figure 28 the aggregate travelled distance by the participants has an increasing
tendency as the turn size increases for the both experiments, which indicates that larger turn
sizes required larger aggregated distance. ANOVA result of experiment 1 shows that for
different speed conditions aggregate distance didn’t varied much, indicating no effect of
speed over the aggregate distance, which is same as ANOVA for whole data for aggregate
distance. Here also standard error increased as the turn size increased indicating the increased
variation between the turn size means.
ANOVA for total number of hand movement events
Figure 29: Total mean hand movement events of four turn sizes for fast and slow speed conditions of
experiment 1 (left) and experiment 2 (right). Bars show standard error.
In the experiment 1 total number of hand movement events were significantly different both
for the turn size (F (1.822, 32.800) = 32.097, p=0.00, η2 = 0.641) but not for speed (F (1, 18) = 1.087,
p>0.05, η2 = 0.057) and also without having any interactions effect between the turn sizes and the
speed (F (1.462, 26.313) = 1.827, p>0.05, η2 = 0.092). In the second experiment turn size was
significant for number of hand movement events (F (2.237, 42.494) = 14.097, p=0.00, η2 = 0.426).
0
0.5
1
1.5
2
2.5
3
3.5
4
Turnsize1 Turnsize2 Turnsize3 Turnsize1
Handmovem
entevents
Turnsize
Fastspeed Slowspeed
0
0.5
1
1.5
2
2.5
3
3.5
Turnsize1 Turnsize2 Turnsize3 Turnsize4
Handmovem
entevents
Turnsize
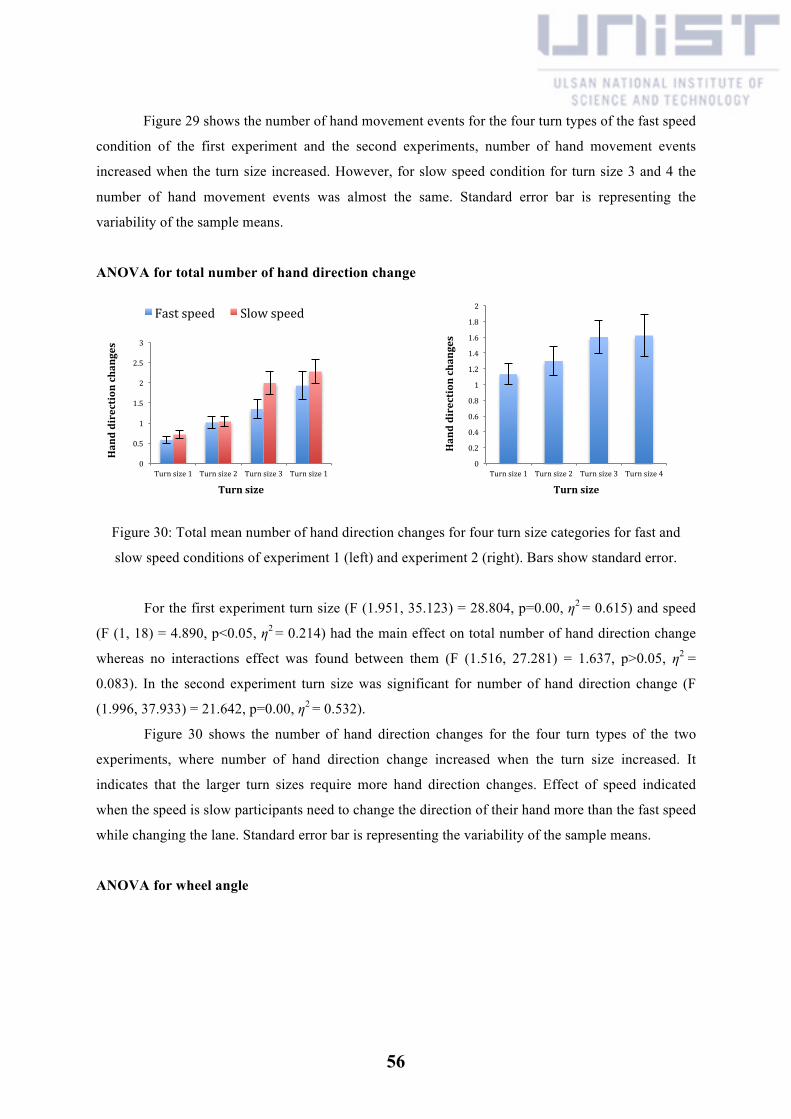
56
Figure 29 shows the number of hand movement events for the four turn types of the fast speed
condition of the first experiment and the second experiments, number of hand movement events
increased when the turn size increased. However, for slow speed condition for turn size 3 and 4 the
number of hand movement events was almost the same. Standard error bar is representing the
variability of the sample means.
ANOVA for total number of hand direction change
Figure 30: Total mean number of hand direction changes for four turn size categories for fast and
slow speed conditions of experiment 1 (left) and experiment 2 (right). Bars show standard error.
For the first experiment turn size (F (1.951, 35.123) = 28.804, p=0.00, η2 = 0.615) and speed
(F (1, 18) = 4.890, p<0.05, η2 = 0.214) had the main effect on total number of hand direction change
whereas no interactions effect was found between them (F (1.516, 27.281) = 1.637, p>0.05, η2 =
0.083). In the second experiment turn size was significant for number of hand direction change (F
(1.996, 37.933) = 21.642, p=0.00, η2 = 0.532).
Figure 30 shows the number of hand direction changes for the four turn types of the two
experiments, where number of hand direction change increased when the turn size increased. It
indicates that the larger turn sizes require more hand direction changes. Effect of speed indicated
when the speed is slow participants need to change the direction of their hand more than the fast speed
while changing the lane. Standard error bar is representing the variability of the sample means.
ANOVA for wheel angle
0
0.5
1
1.5
2
2.5
3
Turnsize1 Turnsize2 Turnsize3 Turnsize1
Handdirectionchanges
Turnsize
Fastspeed Slowspeed
0
0.2
0.4
0.6
0.8
1
1.2
1.4
1.6
1.8
2
Turnsize1 Turnsize2 Turnsize3 Turnsize4
Handdirectionchanges
Turnsize

57
Figure 31: Change in wheel angle for four turn size categories for fast and slow speed conditions of
experiment 1 (left) and experiment 2 (right). Bars show standard error.
In the experiment 1 wheel angle were significantly different both for the turn size (F (1.966,
35.389) = 44.451, p=0.00, η2 = 0.712) and speed (F (1, 18) = 17.644, p=0.00, η2 = 0.495) without
having any interactions effect between the turn sizes and the speed (F (1.613, 29.036) = 2.032,
p>0.05, η2 = 0.101). In the second experiment also turn size was significant for wheel angle (F (3, 57)
= 107.224, p=0.00, η2 = 0.849).
In the Figure 31, wheel angle for the four turn types of the two experiments were increased
when the turn size was increased, which It indicates that the larger turn sizes required bigger wheel
angle changes. Effect of speed indicated when the speed is slow participants need to change the wheel
angle more than the fast speed while changing the lane. Standard error bar is representing the
variability of the sample means.
In summary, in the ANOVA result until maximum wheel angle for experiment 1 for all
different turn sizes conditions all the hand movement variables varied significantly. However speed
factor had effect on wheel angle and total number of hand direction change variables only. Therefore,
the ANOVA result from experiment 1 confirmed that the four turn sizes were significantly different
from each other, which caused the difference in the measured variables. Similarly, experiment 2 also
showed similar significant effect of turn sizes over all dependent variables indicating that the turn
sizes were different from each other.
4.8.2 Predictive models
4.8.2.1 Category wise prediction of turn size
We tried to predict the four turn sizes (Turn size 1, Turn size 2. Turn size 3, Turn size 4) from
the hand movement properties and the steering wheel angle values. The hand movement properties
0
10
20
30
40
50
60
70
80
90
Turnsize1 Turnsize2 Turnsize3 Turnsize1
Wheelangle(degree)
Turnsize
Fastspeed Slowspeed
0
10
20
30
40
50
60
70
80
Turnsize1 Turnsize2 Turnsize3 Turnsize4
Wheelangle(degree)
Turnsize

58
were: total travelled distance, aggregate distance, total number of hand movement events and total
number of hand direction change. We have also added aggregated wheel angle as a predictor variable.
The reason why we have included wheel angle in our models is wheel angle represents the final
location of the car and hence it will help us to predict the final turning points. We have used three
predictive models named as recognizers and they are: logistic regression, multilayer perceptron and
random forest. Finally we have tried to interpret the prediction accuracy of our recognizers in terms of
mean and class-wise accuracy and the kappa statistics.
4.8.2.2 Prediction accuracy of different models
For constructing the recognizers we used WEKA machine learning tool. For all the recognizer
we used ten-fold cross validation process. Table 1 summarizes the results from the two experiments
with the contents including recognizers and their accuracies. Table 2 summarizes the results after
filtering the no hand movement cases for all the turn types. For the both experiments we used the five
attributes or predictor variables. Following descriptions further clarifies the results briefly.
Table 1: Results from machine learning models constructed to classify turn sizes.

59
Table 2: Results from machine learning models constructed to classify turn sizes (after filtering the no
hand movement cases).
Results of the experiments were measured by using accuracy and Kappa values. Accuracy
means the ability of a classifier of predicting the class level correctly. To be clear, how well a given
predictor can predict the outcome for a new data. Kappa statistic, a form of correlation coefficient
ranged from -1 to +1 is the most commonly used statistics to test interrater reliability proposed by
Jacob Cohen in 1960. Kappa values from 0.01-0.20 indicated none to slight, 0.21-0.40 as fair, 0.41-
0.60 as moderate, 0.61-0.80 as substantial, 0.81-1.00 as almost perfect agreement between the raters
[McHugh, M. L. 2012].
Mean accuracy of all the recognizers indicates that all the attributes had low discriminatory
power. Moreover, class-wise accuracy of the turn size 1 was higher than the other turn sizes.
Discriminatory power of the recognizers was improved when the classes were reduced for experiment
2 for both smaller and larger turn sizes. For reducing the classes we combined the turn size 1 with turn
size 2 that represents smaller turn type and turn size 3 with turn size 4 as larger turn type. Mean
accuracy and Kappa values of experiment 2 were improved when the class was reduced. Moreover the
mean accuracy of all the recognizer for the second study was higher than the two conditions of the
first study, which proved better experimental task design for capturing turning behavior.
As mentioned before all the turn types had several no hand movement cases, which means
participants didn’t move their hands while changing the lane. We tried to filter the no hand movement
cases, as our expectation was accuracy of prediction might increase after removing them. However,
the result was shown in Table 2 and would be described here.
60
Kappa statistic value was increased for the second experiment for the four-class classification
of all the recognizers such as logistic regression from 0.34 to 0.45, multilayer perceptron from 0.38 to
0.45 and random forest from 0.50 to 0.55. Class-wise accuracy of turn size 1 was also improved.
Mean accuracy of the recognizers was also improved well of all the recognizers. On the other hand for
two-class classification both the mean accuracy and the Kappa values decreased as the turn sizes had
overlapping area between them. For the first experiment the prediction accuracy and kappa values
didn’t improve significantly for the four or two class condition.
In summary, for experiment 2 the smaller turn and the larger turn type had high
discriminatory power for all the predictor models, which suggest a better experimental task design of
experiment 2 over experiment 1. We can say that in experiment 2 the recognizers had good prediction
accuracy for the two-class condition. However, in overall class-wise performance of all the
recognizers of the two experiments varied considerably for both four turn type cases and two turn type
cases. It suggests that it was hard to exactly classify the turn types with this category wise prediction
system, as the recognizers couldn’t discriminate the different turn types very well. Therefore, we also
did the continuous turn size prediction using the same attributes to further check the accuracy of the
recognizers.
4.8.2.3 Continuous prediction of turn size
We can mention classification as discrete variable prediction and continuous prediction as
numeric variable prediction. Classification is identifying the group membership while continuous
prediction does regression by predicting a value from a continuous set. Classification predicts the
'belonging' to a class but regression predicts the continuous value. Regression and classification is
same in a sense that both try to predict the output based on the early observations but regression tries
to estimate an actual value not the class of an observation.
Whenever the classes have numeric values then linear models or special form of trees are
needed for the numeric prediction. The output linear model will be the sum of attributes values with
some weights that are applied for each attribute before summing them together. The weights are
adjusted in a way so that the output model will match the desired output; the idea is exactly same as
‘linear regression’ in statistics.
WEKA provides linear regression model for numeric prediction. It outputs the statistical
correlation coefficient, which gives an indication on how much the measured and the predicted data
are closely related for the continuous prediction. The range of this correlation coefficient (COR) is
from -1 to +1, where -1 means negative correlation, 0 means no correlation and +1 means a perfect
correlation between the numeric output and the numeric input attributes. Besides the correlation
coefficient for measuring the prediction accuracy of the models another term named mean squared
error is commonly used to measure the performance of model for continuous prediction. The Root

61
Mean Squared Error (RMSE) indicates how much the predicted and the actual data vary. Prior
researchers also used COR and RMSE for the continuous prediction [Nicolaou, M. A., et al. 2012].
RMSE value near to zero represents very good performance of the recognizers.
Continuous decision tree is another approach used for numeric prediction. In discrete
prediction of decision tree the nodes compare the value of an attribute with some constant and create
individual branches for each attribute. However, if the attribute is numeric then the node will compare
the numeric value instead of comparing the attribute value with a constant. Random forest, which is a
popular decision tree can be used both for categorical and continuous prediction [Breiman, L. 2001].
We tried to evaluate the accuracy of the random forest regression model using the same COR and
RMSE measure as linear regression.
The neural network, multilayer perceptron can also be used for regression as the output nodes
is the linear combination of all the nodes in the hidden layer. COR and RMSE can also be used to
measure the accuracy of the model.
4.8.2.4 Prediction accuracy of different models
Prediction accuracy of the linear regression, multilayer perceptron and random forest
recognizers are given below for both experiment 1 and 2 in terms of COR and RMSE in Table 3.
Table 4 summarizes the results after filtering the no hand movement cases for all the turn types. For
the both experiments we used the same five attributes or predictor variables as used in category wise
prediction system. Following descriptions further clarifies the results briefly.
Table 3: Results from machine learning models for numeric prediction.

62
Table 4: Results from machine learning models for numeric prediction (after filtering the no hand
movement cases).
From the above Table 3 we can see that for the first experiment we got maximum correlation
of 0.65 and from the second experiment we got 0.77. For the first experiment for both speed
conditions linear regression recognizer performed well than the other two recognizers with greater
correlation coefficient value and smaller root mean squared error. However for experiment 2, random
forest performed best from all the recognizers. The overall result of experiment 2 is impressive
compared to the experiment 1, as there is less variation of the correlation coefficient among the
recognizers with low RMSE values. This indicates that in experiment 2 the prediction of continuous
turn sizes was done better than the experiment 1.
Correlation coefficient value greater than +0.5 indicates moderate and greater than +0.7
indicates a strong positive linear relationship between the input and the output variables statistically.
Correlation coefficient in WEKA also represents the statistical correlation between the actual and the
predicted values, ranges from -1 to +1 [Witten, I. H. and E. Frank 2005]. In that sense experiment 1
had moderate prediction accuracy while experiment 2 had strong prediction accuracy of the
continuous turn sizes.
We also measured the prediction accuracy of this continuous prediction system after
removing the no hand movement cases to check the change in accuracy in terms of correlation
coefficient and RMSE. Table 4 represents the result after removing the no hand movement cases,
where we can see that for the fast speed condition of experiment 1 correlation coefficient has been
increased for multilayer perceptron and random forest recognizer where as for slow speed condition
for linear regression and random forest recognizers. The root mean square error of these recognizers

63
also decreased. On the other hand, for experiment 2, correlation coefficient of all the recognizers
didn’t improved after removing the no hand movement case.
WEKA also provide linear regression model with normalized weights of the attributes. It
measures the goodness of fit and minimize the residuals using least square method. It finds the
parameters value (weights and intercepts) that minimizes the sum of square difference between the
predicted and the actual value. WEKA only uses the attributes that are statistically contributing to
predict the accuracy of the model and removes the attributes that are not contributing. Following
tables represents the attributes with normalized weight value before (Table 5) and after (Table 6)
removing the no hand movement cases.
Table 5: Attributes with normalized weight value of linear regression models for experiment 1 and 2.
Table 6: Attributes with normalized weight value of linear regression models for experiment 1 and 2
(after filtering the no hand movement cases).
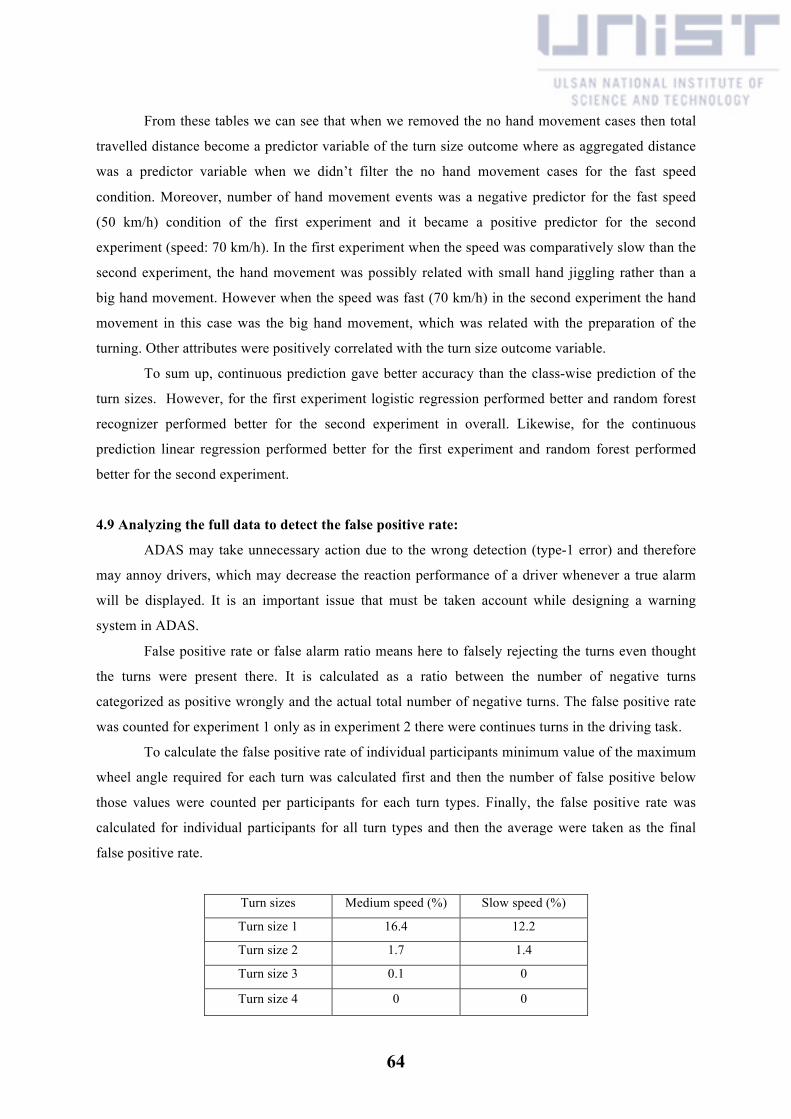
64
From these tables we can see that when we removed the no hand movement cases then total
travelled distance become a predictor variable of the turn size outcome where as aggregated distance
was a predictor variable when we didn’t filter the no hand movement cases for the fast speed
condition. Moreover, number of hand movement events was a negative predictor for the fast speed
(50 km/h) condition of the first experiment and it became a positive predictor for the second
experiment (speed: 70 km/h). In the first experiment when the speed was comparatively slow than the
second experiment, the hand movement was possibly related with small hand jiggling rather than a
big hand movement. However when the speed was fast (70 km/h) in the second experiment the hand
movement in this case was the big hand movement, which was related with the preparation of the
turning. Other attributes were positively correlated with the turn size outcome variable.
To sum up, continuous prediction gave better accuracy than the class-wise prediction of the
turn sizes. However, for the first experiment logistic regression performed better and random forest
recognizer performed better for the second experiment in overall. Likewise, for the continuous
prediction linear regression performed better for the first experiment and random forest performed
better for the second experiment.
4.9 Analyzing the full data to detect the false positive rate:
ADAS may take unnecessary action due to the wrong detection (type-1 error) and therefore
may annoy drivers, which may decrease the reaction performance of a driver whenever a true alarm
will be displayed. It is an important issue that must be taken account while designing a warning
system in ADAS.
False positive rate or false alarm ratio means here to falsely rejecting the turns even thought
the turns were present there. It is calculated as a ratio between the number of negative turns
categorized as positive wrongly and the actual total number of negative turns. The false positive rate
was counted for experiment 1 only as in experiment 2 there were continues turns in the driving task.
To calculate the false positive rate of individual participants minimum value of the maximum
wheel angle required for each turn was calculated first and then the number of false positive below
those values were counted per participants for each turn types. Finally, the false positive rate was
calculated for individual participants for all turn types and then the average were taken as the final
false positive rate.
Turn sizes Medium speed (%) Slow speed (%)
Turn size 1 16.4 12.2
Turn size 2 1.7 1.4
Turn size 3 0.1 0
Turn size 4 0 0

65
Table7: False positive rate of four turn types of Experiment 1.
From the above table, the rate of false positive increased as the turn size was increased. Most
of the false positive happened in the case of turn size 1, which means that it was considered as lane
change 1 even though participants stayed in the same lane. In case of turn size 2, the false positive
rate was very much negligible and for turn size 3 and 4 there were no false positive cases. Overall, the
false positive rate was not significant enough to annoy the drivers and therefore it had a great
predictability of the turn sizes.

66
Chapter 6:
Conclusion

67
6.1 Overall Discussion
Driver’s action prediction is a major concern for Advanced Driving Assistance system
(ADAD). Research in this field is very important, as human error is a major reason behind car
accidents [Peden, M., et al. 2004]. Literature review on this field has provided us enough evidence
that prediction technology can help us to mitigate the accidents by sensing them before they happen or
in emergency situation by taking the control of the car [Cheng, S. Y. and M. M. Trivedi 2006].
Predicting the driving maneuver such as turning or lane changing is very crucial, as the
advanced sensing technology can know more about the in-vehicle activities to respond more
appropriately in dangerous situations. The application scenario of this kind of predictive technology
could be a feedback or warning giver or in more advanced form could be a vehicle control taker if
driver wants to turn or change the lane in a possibly dangerous situation such as changing lane in
‘blind spot’.
Driver’s hand posture on steering wheel while driving is directly related to the driving action.
Therefore, sensing the hand posture over the steering wheel is important as we argue that steering
wheel is a rich source of information about the driving action such as lane changing or turning. The
aim of this work was not only to sense driver’s hand on steering wheel [Baronti, F., et al. 2009] but
also predict their future turning behavior from the early part of driving data during turning. For doing
this we have done two different experiments: one lane changing experiment and another slalom task
experiment. In both experiments participants drove in a 5-lane road and changed the lanes according
to the experimental tasks. Experimental result confirmed that participants moved their hands over the
steering wheel while they changed the lane. Hand movement on the steering wheel was higher in the
experiment 2 than experiment 1 as the ‘slalom’ driving task required sharper turning than the ‘lane-
changing’ task.
Results from the experiments showed that for all the four turn sizes (turn size 1, turn size 2,
turn size 3 and turn size 4) hand movement properties were different indicating that measurement of
hand posture in terms of hand movement is good measure of predicting the future turning behavior
along with the steering wheel angle data. Experiment 1 showed that speed also had an effect over the
hand movement properties of total travelled distance, number of hand movement events and number
of hand direction change. This indicates that for slow speed participants need to move their hand and
change the hand direction more over the steering wheel than the fast speed condition.
We build machine-learning recognizers for both category wise prediction and continuous
prediction of turn sizes from the hand movement properties of participants and steering wheel angle
data. Category wise prediction of turn size takes the four turn types as the outcome variables where as
continuous prediction predicted the continuous numeric value of the turn sizes. In category wise
prediction system mean prediction accuracy and the kappa values of the recognizers were low while
we used four turn types where as they have been improved while the classes were reduced into two. It
68
suggested that the recognizes can not discriminate the turn sizes well when there are four turn sizes
but it can discriminate the smaller turn size from the large turn size very well.
Experiment 2 showed that the turn sizes were overlapped (specially turn size 3 and 4) with
one other and hence it was very difficult to discriminate them very well. Therefore, we did the
continuous prediction of the turn sizes. Prediction accuracy of the continuous prediction was overall
better than the four-class category wise prediction system of the both first and the second experiment.
In summary, results obtained from the both experiments suggested that change in driver’s
hand posture on steering wheel while driving is a good measure of their future intention of lane
changing or turning behavior. Our combined hardware and software system of the steering wheel is
capable of capturing driver’s hand pose all around the wheel with a higher speed and accuracy.
Moreover, it helps us to understand the relationship between the turning behavior and the subsequent
hand posture, by successfully predicting the future turning behavior of the driver from the early hand
movement and the steering wheel angle data.
Prior researchers also tried to understand the safe and unsafe driving situation while
performing a driving maneuver. Kondyli, A., et al. (2014) observed merging and lane changing
maneuver and tried to find the specific body movement, that are responsible to hide unsafe situations
while performing a driving maneuver. Tran, C., et al. (2012) used pedal sensors to understand driver’s
foot behavior as it has strong impact on vehicle control. Therefore, our proposed steering wheel
mounted sensor system could also be a helpful medium to understand the steering behavior of the
driver. Moreover, it can also be used to understand the safe and unsafe hand posture of driver on
steering wheel while driving.
Prediction of lane-changing or turning intention is not a new concept in the field of ADAS.
Several researchers used head pose and eye gaze data [Tijerina, L., et al. 2005, Trivedi, M. M., et al.
2007, McCall, J. C., et al. 2005, Doshi, A., et al. (2011)] or 3D body movement combined with head
pose [Tran, C. and M. M. Trivedi 2010] to understand driver’s lane change intention. However, our
suggested approach for understanding driver’s turning intention from hand posture over the steering
wheel is a totally new approach. Steering wheel were also used by the prior researchers as a frame for
mounting sensor (most often they used the pressure sensor) but mostly they were used either to
understand driver’s physiological signal [Lin, Y., et al. 2007, Ju, Jin Hong, et al. 2015, Oehl, M., et al
2011, Eksioglu, M. and K. Kızılaslan 2008] or mental workload [King, D. J., et al. 1998, Krajewski,
J., et al. 2009, He, Q., et al. 2011]. Furthermore, Chen, R., et al. (2011) used the pressure sensitive
steering wheel for handgrip pattern recognition for recognizing the driver to prevent the unauthorized
access to cars.
Some researchers also used steering wheel angle data and hand pose data for predicting lane-
change or turning intention but there are some major difference between the objective and method of
their work and ours. Schmidt, K., et al. (2014) proposed that steering wheel is a promising early

69
predictor of lane change. However, they used wheel angle data just to predict whether the driver is
going to change the lane. Cheng, S. Y. and M. M. Trivedi (2006) also used steering wheel angle data
along with the body pose data to predict only the intersection turns, which requires approximately 90
degree change of vehicle heading. They proved that adding the body-pose data with the steering
wheel data improved the accuracy of the prediction of driver intention of turning. However, They
have used motion capture system and specially equipped test vehicle to recognize the body pose data
(head pose and hand pose). Compared to their work, our system doesn’t require any special test
vehicle or vision based recognition system. Our sensor-mounted steering wheel can capture the
change in hand pose all over the wheel very quickly and accurately. Moreover, it can predict driver’s
intention of turning along with the size or magnitude of the turning.
6.1 Limitations and future work:
Our combined hardware and software system can capture driver’s hand posture over the
steering wheel very quickly with a great accuracy. The hardware system also had no wiring
complexity. We build the system for the standard steering wheel of real car. However, the sensor box
was needed to place in the center of the steering wheel, as it needs to collect the steering wheel angle
data. This will make a problem while installing it in real car, as the driver side airbag is located in the
center of the steering wheel.
In our work we tried to predict the future turning behavior before the starting of the turning
action. Hand posture data in terms of movement properties before turning couldn’t help us to predict
the end point of the turning as participants didn’t change their hand posture before turning. Therefore,
we predicts their future turning behavior from the early part of that turning behavior, it means we
have used the early parts of during turning behavior to predicts the final end point of the turns.
We have modified the current scenarios of the OpenDs driving simulator. It was difficult to
modify the scenarios according to our requirements. We have modified the current ‘reaction test’ of
the OpenDs simulator where participants need to react to the lane changing and the brake signal as
quickly as possible. However, we were only interested on the lane changing behavior of the
participants. The reaction time was not that much important however we told participants to finish the
route as accurately and quickly as possible. In the first experiment we used the lane-changing task
where participants changed there according to the signal presented on the gates over the lanes. This
lane-changing signal was not totally appropriate with the real life turning action. This is a reason why
we got low prediction accuracy in the first experiment. Later we did another follow up study
(experiment 2) by improving the driving scenario. In the experiment participants changed their lane
according to the color of the red and blue block placed in between the lanes. While driving they kept
the red blocks on their right side and blue blocks on their left side. The distance between the blocks
were made shorter than the distance between the gates used in the experiment 1, thus it made zigzag

70
pattern of lane-change, which is called as slalom task. This driving task was more appropriate for
turning action compared to the task of experiment 1. Still the scenario was not completely appropriate
for turning situation as in real life scenarios, thus made it difficult to get a very good accuracy of the
prediction recognizers.
We did our experiments inside the laboratory under controlled environment by using OpenDs,
a computer based low fidelity open source driving simulator. Driving simulators are artificial driving
environment, and are being used hugely by the researchers to improve the vehicle safety. Some
researchers think driving behavior inside the simulator is related to the driving behavior in real car in
actual driving simulator [Clark, W. A. V. and T. R. Smith 1985]. On the other hand some researchers
argue that people could react differently inside a driving simulator, as they know it is a fake
environment and there is no risk of physical harm or damage [Alm, H. and L. Nilsson 1995; Lee, J.
D., et al. 2002]. However, because of the ethical issues such as safety of the drivers and the
pedestrian, fatigue or boredom of the participants, we didn’t run our driving study in real car in the
real driving environment.
In future work we will try to reduce these limitations by using the more appropriate driving
task scenarios. Moreover, the redesign of the hardware system also should be considered to place it in
any real car with the real driving environment.

71
References

72
Abtahi, S., et al. (2011). Driver drowsiness monitoring based on yawning detection. Instrumentation and Measurement Technology Conference (I2MTC), 2011 IEEE, IEEE. Achler, O. and M. M. Trivedi (2004). Vehicle wheel detector using 2D filter banks. Intelligent Vehicles Symposium, 2004 IEEE, IEEE. Alm, H. and L. Nilsson (1995). "The effects of a mobile telephone task on driver behaviour in a car following situation." Accident Analysis & Prevention 27(5): 707-715. Baronti, F., et al. (2009). Distributed sensor for steering wheel grip force measurement in driver fatigue detection. Proceedings of the Conference on Design, Automation and Test in Europe, European Design and Automation Association. Barry, B. and L. Eric (2012). The normal natural troubles of driving with GPS. Proceedings of the SIGCHI Conference on Human Factors in Computing Systems. Austin, Texas, USA, ACM. Bishop, R. (2000). A survey of intelligent vehicle applications worldwide. Intelligent Vehicles Symposium, 2000. IV 2000. Proceedings of the IEEE, IEEE. Blana, E. (1996). "Driving Simulator Validation Studies: A Literature Review." Borghini, G., et al. (2012). Assessment of mental fatigue during car driving by using high resolution EEG activity and neurophysiologic indices. Engineering in Medicine and Biology Society (EMBC), 2012 Annual International Conference of the IEEE, IEEE. Breiman, L. (2001). "Random forests." Machine learning 45(1): 5-32. Brit Susan, J., et al. (2010). Studying driver attention and behaviour for three configurations of GPS navigation in real traffic driving. Proceedings of the SIGCHI Conference on Human Factors in Computing Systems. Atlanta, Georgia, USA, ACM. Brookhuis, K. A. and D. de Waard (2010). "Monitoring drivers’ mental workload in driving simulators using physiological measures." Accident Analysis & Prevention 42(3): 898-903. Busek, P., et al. (2005). "Spectral analysis of heart rate variability in sleep." Physiological research 54(4): 369. Carsten, O. M. J. and L. Nilsson (2001). "Safety assessment of driver assistance systems." European Journal of Transport and Infrastructure Research 1(3): 225-243. Chen, R., et al. (2011). Driver Recognition Based on Dynamic Handgrip Pattern on Steeling Wheel. Software Engineering, Artificial Intelligence, Networking and Parallel/Distributed Computing (SNPD), 2011 12th ACIS International Conference on, IEEE. Cheng, S. Y. and M. M. Trivedi (2006). "Turn-intent analysis using body pose for intelligent driver assistance." Pervasive Computing, IEEE 5(4): 28-37. Cindy, X., et al. (2001). Object tracking with a pan-tilt-zoom camera: application to car driving assistance. Robotics and Automation, 2001. Proceedings 2001 ICRA. IEEE International Conference on, IEEE. Clark, W. A. V. and T. R. Smith (1985). "Production system models of residential search behavior: a comparison of behavior in computer-simulated and real-world environments." Environment and Planning A 17(4): 555-568.
73
Collet, C., et al. (2009). "Physiological and behavioural changes associated to the management of secondary tasks while driving." Applied ergonomics 40(6): 1041-1046. Dagan, E., et al. (2004). Forward collision warning with a single camera. Intelligent Vehicles Symposium, 2004 IEEE, IEEE. De Winter, J., et al. (2012). Advantages and Disadvantages of Driving Simulators: A Discussion. Proceedings of Measuring Behavior, Citeseer. Díaz, J., et al. (2003). "Optical flow for cars overtaking monitor: the rear mirror blind spot problem." Ecovision (European research project). Díaz, J., et al. (2006). Real-time embedded system for rear-view mirror overtaking car monitoring. Embedded Computer Systems: Architectures, Modeling, and Simulation, Springer: 385-394. Doshi, A. and M. M. Trivedi (2009). "On the roles of eye gaze and head dynamics in predicting driver's intent to change lanes." Intelligent Transportation Systems, IEEE Transactions on 10(3): 453-462. Doshi, A., et al. (2011). "On-road prediction of driver's intent with multimodal sensory cues." IEEE Pervasive Computing(3): 22-34. Eckstein, L. and A. Zlocki (2013). Safety Potential of ADAS–Combined Methods for an Effective Evaluation. 23rd International Technical Conference on the Enhanced Safety of Vehicles (ESV) Seoul, South Korea. Eksioglu, M. and K. Kızılaslan (2008). "Steering-wheel grip force characteristics of drivers as a function of gender, speed, and road condition." International journal of industrial ergonomics 38(3): 354-361. Gietelink, O., et al. (2006). "Development of advanced driver assistance systems with vehicle hardware-in-the-loop simulations." Vehicle System Dynamics 44(7): 569-590. Gilly, L., et al. (2008). In-car gps navigation: engagement with and disengagement from the environment. Proceedings of the SIGCHI Conference on Human Factors in Computing Systems. Florence, Italy, ACM. Gusikhin, O., et al. (2008). Intelligent vehicle systems: applications and new trends. Informatics in Control Automation and Robotics, Springer: 3-14. Hachisuka, S., et al. (2011). Facial expression measurement for detecting driver drowsiness. Engineering Psychology and Cognitive Ergonomics, Springer: 135-144. He, Q., et al. (2011). Estimation of driver’s fatigue based on steering wheel angle. International Conference on Engineering Psychology and Cognitive Ergonomics, Springer. Healey, J. A. and R. W. Picard (2005). "Detecting stress during real-world driving tasks using physiological sensors." Intelligent Transportation Systems, IEEE Transactions on 6(2): 156-166. Imamura, T., et al. (2009). Development of a sensor system for grasp behavior on a steering wheel. Systems, Man and Cybernetics, 2009. SMC 2009. IEEE International Conference on, IEEE. Ishtiaq Roufa, R. M., et al. (2010). Security and privacy vulnerabilities of in-car wireless networks: A tire pressure monitoring system case study. 19th USENIX Security Symposium, Washington DC.

74
Jain, A., et al. (2016). "Brain4Cars: Car That Knows Before You Do via Sensory-Fusion Deep Learning Architecture." arXiv preprint arXiv:1601.00740. Jerbi, M., et al. (2007). An infrastructure-free traffic information system for vehicular networks. Vehicular Technology Conference, 2007. VTC-2007 Fall. 2007 IEEE 66th, IEEE. Ji, Q. and X. Yang (2002). "Real-time eye, gaze, and face pose tracking for monitoring driver vigilance." Real-Time Imaging 8(5): 357-377. Ji, Q., et al. (2004). "Real-time nonintrusive monitoring and prediction of driver fatigue." Vehicular Technology, IEEE Transactions on 53(4): 1052-1068. Joshi, M., et al. (2013). A novel and cost effective resistive rain sensor for automatic wiper control: Circuit modelling and implementation. Sensing Technology (ICST), 2013 Seventh International Conference on, IEEE. Ju, J. H., et al. (2015). "Real-Time Driver’s Biological Signal Monitoring System." Sensors and Materials 27(1): 51-59. Kaptein, N., et al. (1996). "Driving simulator validity: Some considerations." Transportation Research Record: Journal of the Transportation Research Board(1550): 30-36. Kato, H. and T. Matsuki (1990). "Raindrop sensor using electric double layers." Sensors and Actuators B: Chemical 1(1): 308-311. Kim, H., et al. (2011). Acquisition of pedestrian trajectory using on-board monocular camera. Intelligent Transportation Systems (ITSC), 2011 14th International IEEE Conference on, IEEE. Kimura, K., et al. (2007). Estimation of driver inattention to forward objects using facial direction with application to forward collision avoidance systems. Proc of Fourth International Driving Symposium on Human Factors in Driver Assessment, Training and Vehicle Design. King, D. J., et al. (1998). An algorithm for detecting heavy-truck driver fatigue from steering wheel motion. The 16th ESV Conference Proceedings. Kondyli, A., et al. (2014). Comparative Analysis of Driving Maneuvers Using 3D Body Posture Data. Proceedings of the 5th International Conference on Applied Human Factors Ergonomics AHFE. Krajewski, J., et al. (2009). Steering wheel behavior based estimation of fatigue. Proceedings of the Fifth International Driving Symposium on Human Factors in Driver Assessment, Training and Vehicle Design. Kuehn, M., et al. (2009). Benefit estimation of advanced driver assistance systems for cars derived from real-life accidents. ESV Konferenz, Paper. Lal, S. K. L. and A. Craig (2001). "A critical review of the psychophysiology of driver fatigue." Biological psychology 55(3): 173-194. Larue, G. S., et al. (2011). "Driving performance impairments due to hypovigilance on monotonous roads." Accident Analysis & Prevention 43(6): 2037-2046. Lee, J. D., et al. (2002). Comparison of Driver Braking Responses in a High Fidelity Driving Simulator and on a Test Track.

75
Liebner, M., et al. (2013). Generic driver intent inference based on parametric models. Intelligent Transportation Systems-(ITSC), 2013 16th International IEEE Conference on, IEEE. Lin, H.-Y., et al. (2012). Lane departure and front collision warning using a single camera. Intelligent Signal Processing and Communications Systems (ISPACS), 2012 International Symposium on, IEEE. Lin, Y., et al. (2007). "An intelligent noninvasive sensor for driver pulse wave measurement." Sensors Journal, IEEE 7(5): 790-799. McCall, J. C. and M. M. Trivedi (2007). "Driver behavior and situation aware brake assistance for intelligent vehicles." Proceedings-ieee 95(2): 374. McCall, J. C., et al. (2005). Lane change intent analysis using robust operators and sparse Bayesian learning. 2005 IEEE Computer Society Conference on Computer Vision and Pattern Recognition (CVPR'05)-Workshops, IEEE. McHugh, M. L. (2012). "Interrater reliability: the kappa statistic." Biochemia medica 22(3): 276-282. Mehler, B., et al. (2011). A comparison of heart rate and heart rate variability indices in distinguishing single task driving and driving under secondary cognitive workload. Proc Driving Symposium on Human Factors in Driver Assessment. Neale, V. L., et al. (2005). "An overview of the 100-car naturalistic study and findings." National Highway Traffic Safety Administration, Paper(05-0400). Nicolaou, M. A., et al. (2012). "Output-associative rvm regression for dimensional and continuous emotion prediction." Image and Vision Computing 30(3): 186-196. Nourbakhsh, N., et al. (2012). Using galvanic skin response for cognitive load measurement in arithmetic and reading tasks. Proceedings of the 24th Australian Computer-Human Interaction Conference, ACM. Obradovic, D., et al. (2007). "Fusion of sensor data in Siemens car navigation system." Vehicular Technology, IEEE Transactions on 56(1): 43-50. Oehl, M., et al. (2011). Improving human-machine interaction–a non invasive approach to detect emotions in car drivers. Human-Computer Interaction. Towards Mobile and Intelligent Interaction Environments, Springer: 577-585. Papadelis, C., et al. (2007). "Monitoring sleepiness with on-board electrophysiological recordings for preventing sleep-deprived traffic accidents." Clinical Neurophysiology 118(9): 1906-1922. Park, S. and T. B. Sheridan (2004). "Enhanced human-machine interface in braking." Systems, Man and Cybernetics, Part A: Systems and Humans, IEEE Transactions on 34(5): 615-629. Pascale, A., et al. (2012). "Wireless sensor networks for traffic management and road safety." Intelligent Transport Systems, IET 6(1): 67-77. Peden, M., et al. (2004). World report on road traffic injury prevention, World Health Organization Geneva. Persson, N., et al. (2001). Low tire pressure warning system using sensor fusion, SAE Technical Paper.
76
Reimer, B., et al. (2006). "Using self-reported data to assess the validity of driving simulation data." Behavior Research Methods 38(2): 314-324. Rigas, G., et al. (2011). "Towards driver's state recognition on real driving conditions." International Journal of Vehicular Technology 2011. Rigas, G., et al. (2012). "Real-time driver's stress event detection." Intelligent Transportation Systems, IEEE Transactions on 13(1): 221-234. Roman, B., et al. (2001). Fatigue indicators of drowsy drivers based on analysis of physiological signals. Medical Data Analysis, Springer: 62-68. Saradadevi, M. and P. Bajaj (2008). "Driver fatigue detection using mouth and yawning analysis." International Journal of Computer Science and Network Security 8(6): 183-188. Schmidt, K., et al. (2014). "A mathematical model for predicting lane changes using the steering wheel angle." Journal of safety research 49: 85. e81-90. Shi, Y., et al. (2007). Galvanic skin response (GSR) as an index of cognitive load. CHI'07 extended abstracts on Human factors in computing systems, ACM. Skog, I. and P. Händel (2009). "In-car positioning and navigation technologies—A survey." Intelligent Transportation Systems, IEEE Transactions on 10(1): 4-21. Sun, Y., et al. (2011). An in-vehicle physiological signal monitoring system for driver fatigue detection. 3rd International Conference on Road Safety and Simulation. Tang, B., et al. (2014). Obtain a simulation model of a pedestrian collision imminent braking system based on the vehicle testing data. Intelligent Transportation Systems (ITSC), 2014 IEEE 17th International Conference on, IEEE. Tijerina, L., et al. (2005). "Eye glance behavior of van and passenger car drivers during lane change decision phase." Transportation Research Record: Journal of the Transportation Research Board(1937): 37-43. Tran, C. and M. M. Trivedi (2010). Towards a vision-based system exploring 3d driver posture dynamics for driver assistance: Issues and possibilities. Intelligent Vehicles Symposium (IV), 2010 IEEE, IEEE. Tran, C., et al. (2012). "Modeling and prediction of driver behavior by foot gesture analysis." Computer Vision and Image Understanding 116(3): 435-445. Trivedi, M. M., et al. (2007). "Looking-in and looking-out of a vehicle: Computer-vision-based enhanced vehicle safety." IEEE Transactions on Intelligent Transportation Systems 8(1): 108-120. Tso, G. K. F. and K. K. W. Yau (2007). "Predicting electricity energy consumption: A comparison of regression analysis, decision tree and neural networks." Energy 32(9): 1761-1768. Tsugawa, S. (2006). "Trends and issues in safe driver assistance systems: Driver acceptance and assistance for elderly drivers." IATSS research 30(2): 6-18. Vural, E., et al. (2007). Drowsy driver detection through facial movement analysis. Human–computer interaction, Springer: 6-18.

77
Wada, M., et al. (2003). "Development of advanced parking assistance system." Industrial Electronics, IEEE Transactions on 50(1): 4-17. Wang, Q., et al. (2006). Driver fatigue detection: a survey. Intelligent Control and Automation, 2006. WCICA 2006. The Sixth World Congress on, IEEE. Wierwille, W. W. and F. T. Eggemeier (1993). "Recommendations for mental workload measurement in a test and evaluation environment." Human Factors: The Journal of the Human Factors and Ergonomics Society 35(2): 263-281. Wijsman, J., et al. (2010). Trapezius muscle EMG as predictor of mental stress. Wireless Health 2010, ACM. Wilson, G. F. and R. D. O'Donnell (1988). "Measurement of operator workload with the neuropsychological workload test battery." Advances in Psychology 52: 63-100. Witten, I. H. and E. Frank (2005). Data Mining: Practical machine learning tools and techniques, Morgan Kaufmann. Wortelen, B., et al. (2013). Integrated simulation of attention distribution and driving behavior. Proceedings of the 22nd Annual Conference on Behavior Representation in Modeling and Simulation. Yang, G., et al. (2010). "A driver fatigue recognition model based on information fusion and dynamic Bayesian network." Information Sciences 180(10): 1942-1954. Yet, W. C. and U. Qidwai (2005). Intelligent surround sensing using fuzzy inference system. IEEE Sensors, 2005. Yu, H., et al. (2007). Vigilance estimation based on EEG signals. Proceedings of IEEE/ICME International Conference on Complex Medical Engineering. Zhao, C., et al. (2012). "Electroencephalogram and electrocardiograph assessment of mental fatigue in a driving simulator." Accident Analysis & Prevention 45: 83-90.