20-20 Technologies Fact Sheet Q4 2010
2
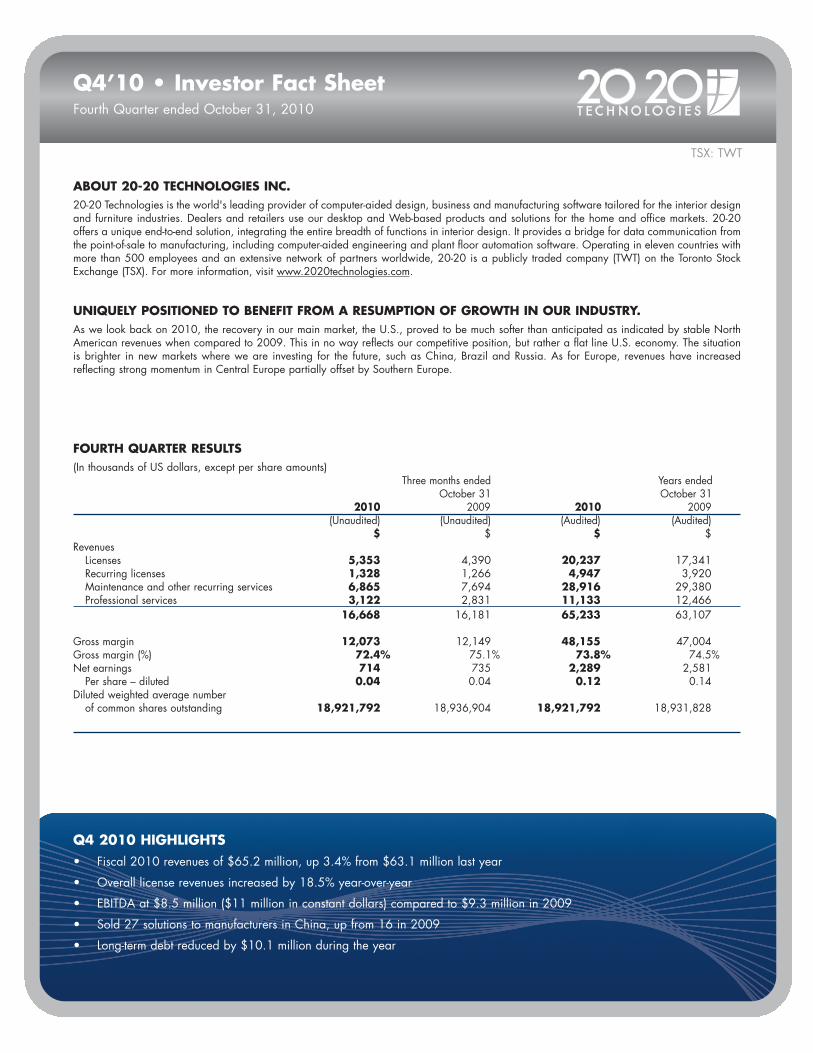
Q4’10 • Investor Fact Sheet Fourth Quarter ended October 31, 2010 TSX: TWT ABOUT 20-20 TECHNOLOGIES INC. 20-20 Technologies is the world's leading provider of computer-aided design, business and manufacturing software tailored for the interior design and furniture industries. Dealers and retailers use our desktop and Web-based products and solutions for the home and office markets. 20-20 offers a unique end-to-end solution, integrating the entire breadth of functions in interior design. It provides a bridge for data communication from the point-of-sale to manufacturing, including computer-aided engineering and plant floor automation software. Operating in eleven countries with more than 500 employees and an extensive network of partners worldwide, 20-20 is a publicly traded company (TWT) on the Toronto Stock Exchange (TSX). For more information, visit www.2020technologies.com . UNIQUELY POSITIONED TO BENEFIT FROM A RESUMPTION OF GROWTH IN OUR INDUSTRY. As we look back on 2010, the recovery in our main market, the U.S., proved to be much softer than anticipated as indicated by stable North American revenues when compared to 2009. This in no way reflects our competitive position, but rather a flat line U.S. economy. The situation is brighter in new markets where we are investing for the future, such as China, Brazil and Russia. As for Europe, revenues have increased reflecting strong momentum in Central Europe partially offset by Southern Europe. FOURTH QUARTER RESULTS (In thousands of US dollars, except per share amounts) Three months ended Years ended October 31 October 31 2010 2009 2010 2009 (Unaudited) (Unaudited) (Audited) (Audited) $ $ $ $ Revenues Licenses 5,353 4,390 20,237 17,341 Recurring licenses 1,328 1,266 4,947 3,920 Maintenance and other recurring services 6,865 7,694 28,916 29,380 Professional services 3,122 2,831 11,133 12,466 16,668 16,181 65,233 63,107 Gross margin 12,073 12,149 48,155 47,004 Gross margin (%) 72.4% 75.1% 73.8% 74.5% Net earnings 714 735 2,289 2,581 Per share – diluted 0.04 0.04 0.12 0.14 Diluted weighted average number of common shares outstanding 18,921,792 18,936,904 18,921,792 18,931,828 Q4 2010 HIGHLIGHTS • Fiscal 2010 revenues of $65.2 million, up 3.4% from $63.1 million last year • Overall license revenues increased by 18.5% year-over-year • EBITDA at $8.5 million ($11 million in constant dollars) compared to $9.3 million in 2009 • Sold 27 solutions to manufacturers in China, up from 16 in 2009 • Long-term debt reduced by $10.1 million during the year
-
Upload
20-20-technologies -
Category
Documents
-
view
213 -
download
0
description
20-20 Technologies Fact Sheet Q4 2010
Transcript of 20-20 Technologies Fact Sheet Q4 2010
Q4’10 • Investor Fact SheetFourth Quarter ended October 31, 2010
TSX: TWT
ABOUT 20-20 TECHNOLOGIES INC.20-20 Technologies is the world's leading provider of computer-aided design, business and manufacturing software tailored for the interior designand furniture industries. Dealers and retailers use our desktop and Web-based products and solutions for the home and office markets. 20-20offers a unique end-to-end solution, integrating the entire breadth of functions in interior design. It provides a bridge for data communication fromthe point-of-sale to manufacturing, including computer-aided engineering and plant floor automation software. Operating in eleven countries withmore than 500 employees and an extensive network of partners worldwide, 20-20 is a publicly traded company (TWT) on the Toronto StockExchange (TSX). For more information, visit www.2020technologies.com.
UNIQUELY POSITIONED TO BENEFIT FROM A RESUMPTION OF GROWTH IN OUR INDUSTRY.As we look back on 2010, the recovery in our main market, the U.S., proved to be much softer than anticipated as indicated by stable NorthAmerican revenues when compared to 2009. This in no way reflects our competitive position, but rather a flat line U.S. economy. The situationis brighter in new markets where we are investing for the future, such as China, Brazil and Russia. As for Europe, revenues have increasedreflecting strong momentum in Central Europe partially offset by Southern Europe.
FOURTH QUARTER RESULTS(In thousands of US dollars, except per share amounts)
Three months ended Years endedOctober 31 October 31
2010 2009 2010 2009(Unaudited) (Unaudited) (Audited) (Audited)
$ $ $ $Revenues
Licenses 5,353 4,390 20,237 17,341Recurring licenses 1,328 1,266 4,947 3,920Maintenance and other recurring services 6,865 7,694 28,916 29,380Professional services 3,122 2,831 11,133 12,466
16,668 16,181 65,233 63,107
Gross margin 12,073 12,149 48,155 47,004Gross margin (%) 72.4% 75.1% 73.8% 74.5%Net earnings 714 735 2,289 2,581
Per share – diluted 0.04 0.04 0.12 0.14Diluted weighted average number
of common shares outstanding 18,921,792 18,936,904 18,921,792 18,931,828
Q4 2010 HIGHLIGHTS• Fiscal 2010 revenues of $65.2 million, up 3.4% from $63.1 million last year
• Overall license revenues increased by 18.5% year-over-year
• EBITDA at $8.5 million ($11 million in constant dollars) compared to $9.3 million in 2009
• Sold 27 solutions to manufacturers in China, up from 16 in 2009
• Long-term debt reduced by $10.1 million during the year
5
10
15
20
25
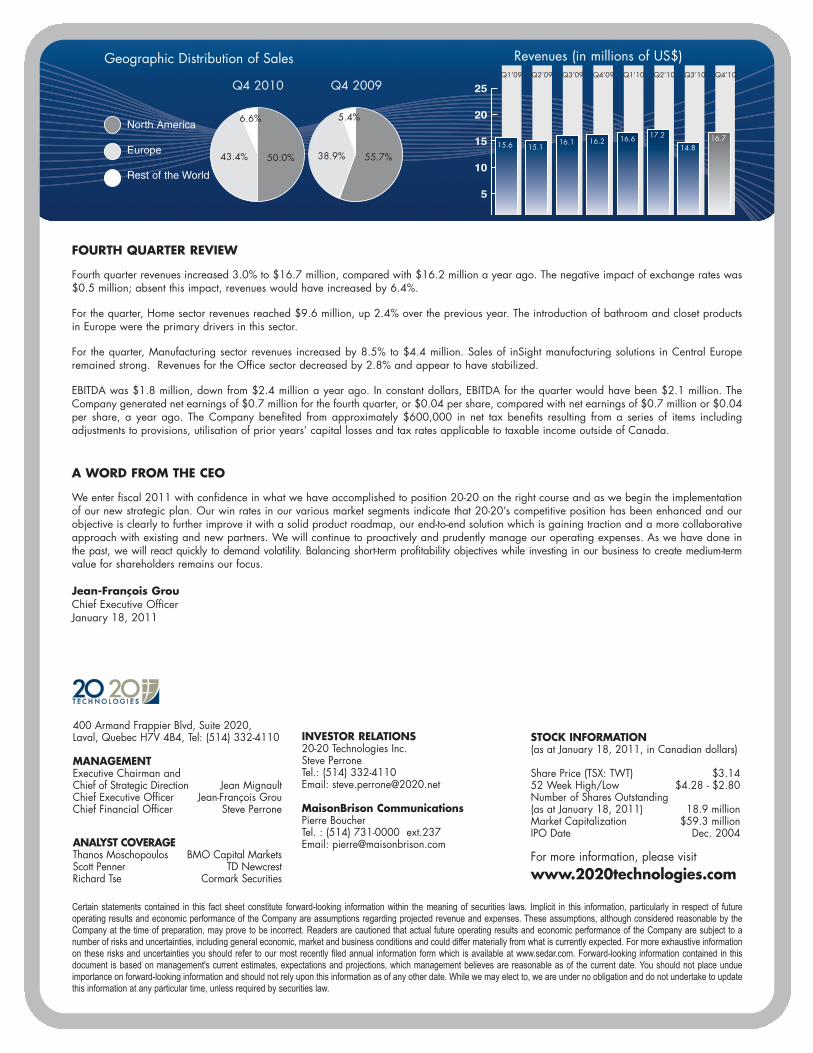
Revenues (in millions of US$)
50.0%43.4%
6.6%
55.7%38.9%
5.4%
Geographic Distribution of Sales
Q4 2010 Q4 2009Q1’09 Q2’09 Q3’09 Q4’09 Q1’10 Q2’10 Q3’10 Q4’10
North America
Europe
Rest of the World
15.6 15.116.1 16.2 16.6 17.2
14.816.7
FOURTH QUARTER REVIEW
Fourth quarter revenues increased 3.0% to $16.7 million, compared with $16.2 million a year ago. The negative impact of exchange rates was$0.5 million; absent this impact, revenues would have increased by 6.4%.
For the quarter, Home sector revenues reached $9.6 million, up 2.4% over the previous year. The introduction of bathroom and closet productsin Europe were the primary drivers in this sector.
For the quarter, Manufacturing sector revenues increased by 8.5% to $4.4 million. Sales of inSight manufacturing solutions in Central Europeremained strong. Revenues for the Office sector decreased by 2.8% and appear to have stabilized.
EBITDA was $1.8 million, down from $2.4 million a year ago. In constant dollars, EBITDA for the quarter would have been $2.1 million. TheCompany generated net earnings of $0.7 million for the fourth quarter, or $0.04 per share, compared with net earnings of $0.7 million or $0.04per share, a year ago. The Company benefited from approximately $600,000 in net tax benefits resulting from a series of items includingadjustments to provisions, utilisation of prior years’ capital losses and tax rates applicable to taxable income outside of Canada.
A WORD FROM THE CEO
We enter fiscal 2011 with confidence in what we have accomplished to position 20-20 on the right course and as we begin the implementationof our new strategic plan. Our win rates in our various market segments indicate that 20-20’s competitive position has been enhanced and ourobjective is clearly to further improve it with a solid product roadmap, our end-to-end solution which is gaining traction and a more collaborativeapproach with existing and new partners. We will continue to proactively and prudently manage our operating expenses. As we have done inthe past, we will react quickly to demand volatility. Balancing short-term profitability objectives while investing in our business to create medium-termvalue for shareholders remains our focus.
Jean-François GrouChief Executive OfficerJanuary 18, 2011
Certain statements contained in this fact sheet constitute forward-looking information within the meaning of securities laws. Implicit in this information, particularly in respect of futureoperating results and economic performance of the Company are assumptions regarding projected revenue and expenses. These assumptions, although considered reasonable by theCompany at the time of preparation, may prove to be incorrect. Readers are cautioned that actual future operating results and economic performance of the Company are subject to anumber of risks and uncertainties, including general economic, market and business conditions and could differ materially from what is currently expected. For more exhaustive informationon these risks and uncertainties you should refer to our most recently filed annual information form which is available at www.sedar.com. Forward-looking information contained in thisdocument is based on management's current estimates, expectations and projections, which management believes are reasonable as of the current date. You should not place undueimportance on forward-looking information and should not rely upon this information as of any other date. While we may elect to, we are under no obligation and do not undertake to updatethis information at any particular time, unless required by securities law.
400 Armand Frappier Blvd, Suite 2020,Laval, Quebec H7V 4B4, Tel: (514) 332-4110
MANAGEMENTExecutive Chairman andChief of Strategic Direction Jean MignaultChief Executive Officer Jean-François GrouChief Financial Officer Steve Perrone
ANALYST COVERAGEThanos Moschopoulos BMO Capital MarketsScott Penner TD NewcrestRichard Tse Cormark Securities
INVESTOR RELATIONS20-20 Technologies Inc.Steve PerroneTel.: (514) 332-4110Email: [email protected]
MaisonBrison CommunicationsPierre BoucherTel. : (514) 731-0000 ext.237Email: [email protected]
STOCK INFORMATION(as at January 18, 2011, in Canadian dollars)
Share Price (TSX: TWT) $3.1452 Week High/Low $4.28 - $2.80Number of Shares Outstanding(as at January 18, 2011) 18.9 millionMarket Capitalization $59.3 millionIPO Date Dec. 2004
For more information, please visitwww.2020technologies.com