20-2-01e Global Climate Risk Index 2020 · Global Climate Risk Index 2020 GERMANWATCH 1 Brief...
44
BRIEFING PAPER GLOBAL CLIMATE RISK INDEX 2020 Who Suffers Most from Extreme Weather Events? Weather-Related Loss Events in 2018 and 1999 to 2018 David Eckstein, Vera Künzel, Laura Schäfer, Maik Winges
Transcript of 20-2-01e Global Climate Risk Index 2020 · Global Climate Risk Index 2020 GERMANWATCH 1 Brief...

BRIEFING PAPER
GLOBAL CLIMATE RISK INDEX 2020
Who Suffers Most from Extreme Weather Events? Weather-Related Loss Events in 2018 and 1999 to 2018
David Eckstein, Vera Künzel, Laura Schäfer, Maik Winges

Global Climate Risk Index 2020 GERMANWATCH
1
Brief Summary
The Global Climate Risk Index 2020 analyses to what extent countries and regions have been affected by impacts of weather-related loss events (storms, floods, heatwaves etc.). The most recent data available— for 2018 and from 1999 to 2018 —were taken into account.
The countries and territories affected most in 2018 were Japan, the Philippines as well as Germany. For the period from 1999 to 2018 Puerto Rico, Myanmar and Haiti rank highest.
This year’s 15th edition of the Climate Risk Index clearly shows: Signs of escalating climate change can no longer be ignored – on any continent or in any region. Impacts from extreme weather events hit the poor-est countries hardest as these are particularly vulnerable to the damaging effects of a hazard and have a lower coping capacity and may need more time to rebuild and recover. The Climate Risk Index may serve as a red flag for already existing vulnerabilities that may further increase as extreme events will become more frequent or more severe due to climate change. The heatwaves in Europe, North America and Ja-pan also confirm: High-income countries are feeling climate impacts more clearly than ever before. Ef-fective climate change mitigation is therefore in the self-interest of all countries worldwide.
At this year’s Climate Summit in Madrid, the second review of the Warsaw International Mechanism for Loss and Damage will investigate whether the body fulfills its mandate to avert, minimise and address loss and damage and whether it is equipped to do so in the future. In that process, COP25 needs to debate the lack of climate finance to address loss and damage. Furthermore, the implementation of measures for adapting to climate change must be strengthened.
Imprint
Authors: David Eckstein, Vera Künzel, Laura Schäfer, Maik Winges
Contributors: Rixa Schwarz, Wanja Amling, Emma Opfer, Juan Carlos Zevallos Diaz
Editing: Joanne Chapman-Rose, Janina Longwitz
The Climate Risk Index is based on data from Munich RE. Germanwatch particularly thanks Petra Löw for her support.
Publisher: Germanwatch e.V. Office Bonn Office Berlin Dr. Werner-Schuster-Haus Kaiserstr. 201 Stresemannstr. 72 D-53113 Bonn D-10963 Berlin Phone +49 (0)228 / 60 492-0, Fax -19 Phone +49 (0)30 / 28 88 356-0, Fax -1
Internet: www.germanwatch.org Email: [email protected]
December 2019 Purchase order number: 20-2-01e ISBN 978-3-943704-77-8 This publication can be downloaded at: www.germanwatch.org/en/cri
This publication is financially supported by Bread for the World – Protestant Development Service. Germanwatch is responsi-ble for the content of this publication.
Comments welcome. For correspondence with the authors contact: [email protected]

Global Climate Risk Index 2020 GERMANWATCH
2
Content
How to Interpret the Global Climate Risk Index .................................................................... 3
Key Messages ....................................................................................................................... 4
1 Key Results of the Global Climate Risk Index 2020 ....................................................... 5
2 The Role of Climate Change in Extreme Weather Events ............................................ 10
3 Heatwaves Sweep the World ..................................................................................... 15
4 Addressing Climate Risks and Impacts: a Stocktake of 2019 Developments ............... 21
5 Methodological Remarks ........................................................................................... 23
6 References ................................................................................................................ 26
Annexes ............................................................................................................................. 36

Global Climate Risk Index 2020 GERMANWATCH
3
How to Interpret the Global Climate Risk Index
The Germanwatch Global Climate Risk Index is an analysis based on one of the most reliable data sets available on the impacts of extreme weather events and associated socio-economic data. The Germanwatch Climate Risk Index 2020 is the 15th edition of this annual analysis. Its aim is to contex-tualise ongoing climate policy debates – especially the international climate negotiations – looking at real-world impacts over the last year and the last 20 years.
However, the index must not be mistaken for a comprehensive climate vulnerability1 scoring. It rep-resents one important piece in the overall puzzle of climate-related impacts and the associated vul-nerabilities. The index focuses on extreme weather events but does not take into account important slow-onset processes such as rising sea-levels, glacier melting or more acidic and warmer seas. It is based on past data and should not be used as a basis for a linear projection of future climate im-pacts. More specifically, not too far-reaching conclusions should be drawn for the purpose of polit-ical discussions regarding which country or region is the most vulnerable to climate change. Also, it is important to note that the occurrence of a single extreme event cannot be easily attributed to anthropogenic climate change. Nevertheless, climate change is an increasingly important factor for changing the likelihood of the occurrence and the intensity of these events. There is a growing body of research that is looking into the attribution of the risk2 of extreme events to the influences of cli-mate change.3
The Climate Risk Index (CRI) indicates a level of exposure and vulnerability to extreme events, which countries should understand as warnings in order to be prepared for more frequent and/or more severe events in the future. Not being mentioned in the CRI does not mean there are no impacts occurring in these countries. Due to the limitations of the available data4, particularly long-term comparative data, including socio-economic data, some very small countries, such as certain small island states, are not included in this analysis. Moreover, the data only reflects the direct impacts (direct losses and fatalities) of extreme weather events, whereas, indirect impacts (e.g. as a result of droughts and food scarcity) are not captured. The results of this index must be viewed against the background of data availability and quality as well as the underlying methodology for their collec-tion. Data quality and coverage may vary from country to country as well as within countries. This has led to an underrepresentation of, for example, African countries when it comes to heatwaves. Finally, the index does not include the total number of affected people (in addition to the fatalities), since the comparability of such data is very limited.
1 According to IPCC (2014b) we define vulnerability as “the propensity or predisposition to be adversely affected. Vulnerability encompasses a variety of concepts and elements including sensitivity or susceptibility to harm and lack of capacity to cope and adapt”.
2 According to IPCC (2012) we define disaster risk as “the likelihood over a specified time period of severe alterations in the normal functioning of a community or a society due to hazardous physical events interacting with vulnerable social condi-tions, leading to widespread adverse human, material, economic, or environmental effects that require immediate emer-gency response to satisfy critical human needs and that may require external support for recovery.
3 See, for instance: American Meteorological Society 2018, Herring et al. (2018), Trenberth et al. (2018), Zhang et al. (2016); Hansen et al. (2016); Haustein et al. (2016) & Committee on Extreme Weather Events and Climate Change Attribution et al. (2016); Stott et al. (2015)
4 See also the Methodological Remarks in Chapter 5.
Global Climate Risk Index 2020 GERMANWATCH
4
Key Messages Japan, the Philippines and Germany are at the top of the list of the most affected countries
in 2018.
Between 1999 and 2018, Puerto Rico, Myanmar and Haiti were the countries most affected by extreme weather events.
Altogether, about 495 000 people died as a direct result of more than 12 000 extreme weather events globally and losses between 1999 and 2018 amounted to around US$ 3.54 trillion (in purchasing power parities).
Heatwaves were one major cause of damage in 2018. Of the ten most affected countries in 2018, Germany, Japan and India were suffering from extended periods of heat. Recent sci-ence has found a clear link between climate change and the frequency and severity of ex-treme heat. In Europe, for example, extreme heat spells are now up to 100 times more likely to occur than a century ago. Furthermore, due to a lack of data, the impacts of heatwaves, for example on the African continent, may be underrepresented.
In many cases (e.g. Puerto Rico), single exceptional disasters have such a strong impact that the countries and territories concerned also have a high ranking in the long-term in-dex. Over the last few years, another category of countries has been gaining relevance: Countries like Haiti, the Philippines and Pakistan that are recurrently affected by catastro-phes continuously rank among the most affected countries both in the long-term index and in the index for the respective year.
Of the ten most affected countries and territories in the period 1999 to 2018, seven were developing countries in the low income or lower-middle income country group, two were classified as upper-middle income countries (Thailand and Dominica) and one was an ad-vanced economy generating high income (Puerto Rico).
This year’s climate summit in Madrid needs to address the lack of additional climate fi-nance to help the poorest people and countries to address Loss and Damage. They are hit hardest by climate change impacts because they are more vulnerable to the damaging ef-fects of a hazard but have lower coping capacity. The climate summit needs to result in: a) a decision on how the need for support for vulnerable countries concerning future loss and damage is to be determined on an ongoing basis and b) the necessary steps to generate and make available financial resources to meet these needs. c) strengthening the imple-mentation of measures for adapting to climate change.

Global Climate Risk Index 2020 GERMANWATCH
5
1 Key Results of the Global Climate Risk Index 2020
People all over the world are facing the reality of climate change – in many parts of the world this is manifesting in an increased volatility of extreme weather events. Between 1999 and 2018, about 495 000 people died worldwide and losses of US$ 3.54 trillion (in PPP) were incurred as a direct re-sult of more than 12 000 extreme weather events. Slow-onset processes will add an additional bur-den in the future. The UNEP Adaptation Gap Report 2016 warns of increasing impacts and resulting increases in global adaptation costs by 2030 or 2050 that will likely be much higher than currently expected: “[...] two-to-three times higher than current global estimates by 2030, and potentially four-to-five times higher by 2050”.5 Costs resulting from residual risks or unavoidable loss and damage are not covered in these numbers. Current estimates of climate finance needs for residual loss and damage range between US$ 290 billion to US$ 580 billion in 2030 (Markandya/González-Eguino 2018).6 Similarly, the Intergovernmental Panel on Climate Change (IPCC) estimates in its recent Spe-cial Report on “Global Warming of 1.5°C” that the "mean net present value of the costs of damages from warming in 2100 for 1.5°C and 2°C (including costs associated with climate change-induced market and non-market impacts, impacts due to sea level rise, and impacts associated with large scale discontinuities) are US$ 54 trillion and US$ 69 trillion, respectively, relative to 1961–1990".7 This gives the indication that the gap between the necessary financing to deal with climate induced risks and impacts is even bigger than earlier projected. On the other hand, the report highlights the importance of enhanced mitigation action towards limiting a global temperature increase to well below 2°C or even to 1.5°C, which could avoid substantive costs and hardships.8
The Global Climate Risk Index (CRI) developed by Germanwatch analyses quantified impacts of extreme weather events9 – both in terms of fatalities as well as economic losses that occurred – based on data from the Munich Re NatCatSERVICE, which is considered worldwide as one of the most reliable and complete databases on this matter. The CRI examines both absolute and relative impacts to create an average ranking of countries in four indicating categories, with a stronger em-phasis on the relative indicators (see chapter “Methodological Remarks” for further details on the calculation). The countries ranking highest (figuring in the “Bottom 10”10) are the ones most im-pacted and should consider the CRI as a warning sign that they are at risk of either frequent events or rare, but extraordinary catastrophes.
The CRI does not provide an all-encompassing analysis of the risks of anthropogenic climate change, but should be seen as just one analysis explaining countries' exposure and vulnerability to climate-related risks based on the most reliable quantified data available – alongside other anal-yses.11 It is based on the current and past climate variability and – to the extent that climate change has already left its footprint on climate variability over the last 20 years – also on climate change.
5 UNEP 2016, p. xii 6 Their figures depend on the climate scenario, the discount rate, the assumed parameters of the climate model and the
socioeconomic model. The analysis is based on the case where equilibrium temperatures increase by 2.5–3.4 °C, implying some mitigation, but less than is required under the Paris accord. They note that uncertainties regarding these sources are very large and meaningful projections of residual damages in the medium to long-term are not possible
7 IPCC 2018a, p 153 8 Ibid. 2018a 9 Meteorological events such as tropical storms, winter storms, severe weather, hail, tornados, local storms; hydrological
events such as storm surges, river floods, flash floods, mass movement (landslide); climatological events such as freezing, wildfires, droughts.
10 The term "Bottom 10" refers to the 10 most affected countries in the respective time period. 11 See e.g. analyses of Columbia University; Maplecroft's Climate Change Vulnerability Index

Global Climate Risk Index 2020 GERMANWATCH
6
Countries Most Affected in 2018
Japan, the Philippines and Germany were the most affected countries in 2018 followed by Mada-gascar, India and Sri Lanka. Table 1 shows the ten most affected countries (Bottom 10) in 2018, with their average weighted ranking (CRI score) and the specific results relating to the four indicators analysed.
Table 1: The 10 most affected countries in 2018
Ranking 2018 (2017)
Country CRI score
Death toll
Deaths per 100 000 inhabitants
Absolute losses (in million US$ PPP)
Losses per unit GDP in %
Human Development Index 2018 Ranking12
1 (36) Japan 5.50 1 282 1.01 35 839.34 0.64 19
2 (20) Philippines 11.17 455 0.43 4 547.27 0.48 113
3 (40) Germany 13.83 1 246 1.50 5 038.62 0.12 5
4 (7) Madagascar 15.83 72 0.27 568.10 1.32 161
5 (14) India 18.17 2 081 0.16 37 807.82 0.36 130
6 (2) Sri Lanka 19.00 38 0.18 3 626.72 1.24 76
7 (45) Kenya 19.67 113 0.24 708.39 0.40 142
8 (87) Rwanda 21.17 88 0.73 93.21 0.34 158
9 (42) Canada 21.83 103 0.28 2 282.17 0.12 12
10 (96) Fiji 22.50 8 0.90 118.61 1.14 92
PPP = Purchasing Power Parities. GDP = Gross Domestic Product.
Japan (1) was hit by three exceptionally strong extreme weather events in 2018. From 6th to 8th of July, heavy rainfalls with more than 200 mm/day were measured, which is about twice as much rainfall as is usually experienced on the wettest day in Japan. The torrential rainfalls resulted in flash floods and mudslides, killing more than 200 people and leading to over 5 000 houses being dam-aged and the evacuation of 2.3 million people.13 Overall, the rainfalls caused damage of over US$ 7 billion. From mid-July to the end of August 2018, two-tiered high-pressure systems caused a severe heatwave that led to 138 fatalities and more than 70 000 people requiring hospitalization due to heat strokes and heat exhaustion.14 In the city of Kumagaya, temperatures of 41.1°C were reported – a national heat record in Japan.15 In September 2018, Typhoon Jebi made landfall on Japan, be-coming the most intense tropical cyclone in the country for over 25 years.16 Jebi broke several his-torical records for sustained winds in Japan, causing economic damage of over US$ 12 billion.17
Typhoon Mangkhut ploughed through the northern part of the Philippines (2) in September 2018 as a category 5 typhoon – the most powerful typhoon recorded worldwide in 201818. It reached top
12 UNEP 2018 13 World Weather Attribution 2018 14 The Japan Times 2018 15 The Strait Times 2018 16 The Guardian 2018d 17 The New York Times 2019b 18 CNN 2018a

Global Climate Risk Index 2020 GERMANWATCH
7
speeds of up to 270 kilometres per hour19 when it made landfall, affecting more than 250 000 people across the country. About 59 people were killed, most by landslides set off by the heavy rainfalls.20
Germany (3) experienced the hottest year since records began due to a severe heatwave.21 The pe-riod between April and July 2018 was the hottest ever recorded in Germany, with temperatures 2.9°C above average.22 Overall, the heatwave led to the death of 1 234 people. After heavy rainfalls in Jan-uary, only 61% of the usual amount of rain fell during summer, resulting in 70% of the soil being affected by drought in October 2018.23 Around 8 000 farmers were prompted to call for federal emer-gency relief worth around EUR 1 billion (US$ 1.18 billion) in order to compensate for their losses24, after a massive decline in harvest caused a total of EUR 3 billion (US$ 3.54 billion) in damage.25
In January 2018, Madagascar (4) was hit by Cyclone Ava, which made landfall on the eastern part of the island, where towns were flooded and buildings collapsed.26 Ava reached top speeds of 190 kilometres per hour and killed 51 people.27 It was followed by Cyclone Eliakim in March 2018 impact-ing more than 15 000 people, which included 17 deaths and nearly 6 300 being temporarily dis-placed.28 Cyclone Ava and Eliakim together were responsible for 70 000 people being forced to seek refuge.29
The yearly monsoon season, lasting from June to September, severely affected India (5) in 2018. The state of Kerala was especially impacted – 324 people died because of drowning or being buried in the landslides set off by the flooding,30 the worst in one hundred years. Over 220 000 people had to leave their homes, 20 000 houses and 80 dams were destroyed.31 The damage amounted to EUR 2.4 billion (US$ 2.8 billion).32 Furthermore, India’s east coast was hit by the cyclones Titli and Gaja in October and November 2018. With wind speeds of up to 150 kilometres per hour, cyclone Titli killed at least eight people and left around 450 000 without electricity.33
Sri Lanka (6) started the year 2018 with severe monsoon rains from 20th to 26th May affecting 20 districts, especially the south and west coast.34The provinces of Galle and Kalutara were the most affected. In Galle, 166mm of rain fell in 24 hours – usually the district has an average precipitation of 290mm in the full month of May.35. At least 24 people died, more than 170 000 people were affected36 and nearly 6 000 people were displaced.37
19 CNN 2018b 20 BBC 2018c 21 Deutscher Wetterdienst (DWD) 2019 22 Scinexx 2018 23 Frankfurter Allgemeine Zeitung 2018a 24 Deutsche Welle 2019b 25 Bayerische Landesbank 2019 26 Al Jazeera 2018 27 Le Monde 2018 28 OCHA 2018 29 Deutsche Welle 2019a 30 Zeit 2018 31 The Guardian 2018b 32 Frankfurter Allgemeine Zeitung 2018b 33 BBC 2018c 34 Ministry of Irrigation and Water Resources and Disaster Management 2018 35 FloodList 2018d 36 Disaster Management Centre of Sri Lanka 2018 37 FloodList 2018e

Global Climate Risk Index 2020 GERMANWATCH
8
Seasonal rains affected Kenya (7) and Rwanda (8) and other countries in East Africa.38 Between March and July 2018, Kenya39 experienced almost twice the normal rainfall of the wet season.40 Ken-ya's most important rivers in the central highlands overflowed affecting 40 out of 47 counties41 and causing the death of 183 people, injury of 97 and the displacement of 321 630 people42, as well as the loss of livelihoods and livestock.43 The heavy rains of March 2018 caused flooding along the Sebeya River in Rwanda (8). Approximately 25 000 people from 5 000 households were affected, and their homes were either destroyed or damaged by mud and overflow.44 The floods aggravated chol-era cases and resulted in an epidemic of the mosquito-borne chikungunya virus.45
Canada (9) started the year with extremely cold temperatures of -45.2°C and -48.2°C in the east, the lowest in 100 years.46 In May 2018, over 4 000 people were displaced because of flooding, which af-fected the southern region of British Colombia. Record highs in temperatures in April melted heavy snowpacks, which caused rivers to overflow.47 The same region suffered the worst wildfire season on record resulting in the evacuation of 16 000 people.48 2 117 wildfires burned 1 354 284 hectares,49 and caused smoke-filled skies in west Canada, making the air quality among the worst in the world.50 In July 2018, a severe heatwave reached Canada, killing 93 people in Quebec due to heat-related complications.51
Fiji (10) suffered the effects of three cyclones between February and April 2018. Cyclone Gita, with peak sustained winds of 126 kilometres per hour52, reached the South of Fiji causing US$ 1.23 million of damage and the evacuation of 288 people.53 Two weeks later, the Cyclone Josie and the severe flooding it caused, took the lives of eight people and almost 2 300 people were displaced54. Keni was last cyclone of the season was, making landfall in April. It affected Kadavu as a category 3 tropical cyclone55 and 8 935 people had to leave their homes. Overall, cyclones Keni and Josie affected around 150 000 people.56
38 World Weather Attribution 2018a 39 Rainfall totals in Nairobi at the five stations exceeded the normal amounts by two to three times in March and one to two
times in April (Kilavi et al. 2018) 40 Kilavi et.al. 2018 41 The Guardian 2018c 42 Kenya Red Cross 2018 43 UNICEF 2018 44 IFRC 2018. 45 The Guardian 2018c 46 The Weather Network 2018 47 FloodList 2018c 48 Daily Hive 2018 49 British Columbia Official Website 2018 50 BBC 2018a 51 Summer 2018 was the hottest on record in the Atlantic coast and in the south, the third-warmest summer on record (Gov-
ernment of Canada 2018) 52 Fiji Meteorological Services 2018 53 Fijian Broadcasting Corporation. 2018 54 FloodList 2018a 55 FloodList 2018b 56 Government of Fiji 2018

Global Climate Risk Index 2020 GERMANWATCH
9
Countries Most Affected in the Period 1999–2018
Puerto Rico, Myanmar and Haiti have been identified as the most affected countries57 in this twenty-year period. They are followed by the Philippines, Pakistan and Vietnam. Table 2 shows the ten most affected countries in the last two decades with their average weighted ranking (CRI score) and the specific results relating to the four indicators analysed.
Table 2: The Long-Term Climate Risk Index (CRI): The 10 countries most affected from 1999 to 2018 (annual averages)
CRI 1999-2018 (1998-2017)
Country CRI score
Death toll
Deaths per 100 000 inhabitants
Total losses in million US$ PPP
Losses per unit GDP in %
Number of events (total 1999–2018)
1 (1) Puerto Rico 6.67 149.90 4.09 4 567.06 3.76 25
2 (3) Myanmar 10.33 7 052.40 14.29 1 630.06 0.83 55
3 (4) Haiti 13.83 274.15 2.81 388.93 2.38 78
4 (5) Philippines 17.67 869.80 0.96 3 118.68 0.57 317
5 (8) Pakistan 28.83 499.45 0.30 3 792.52 0.53 152
6 (9) Vietnam 29.83 285.80 0.33 2 018.77 0.47 226
7 (7) Bangladesh 30.00 577.45 0.39 1 686.33 0.41 191
8 (13) Thailand 31.00 140.00 0.21 7 764.06 0.87 147
9 (11) Nepal 31.50 228.00 0.87 225.86 0.40 180
10 (10) Dominica 32.33 3.35 4.72 133.02 20.80 8
Compared to the CRI 2019, which considered the period from 1998 to 201758, there have been a few changes in the CRI ranking: while Puerto Rico remains at the top of the list, Myanmar and Haiti each move up one place to become one of the three most affected countries over the past two decades. These rankings are attributed to the aftermath of the exceptionally devastating events such as Hur-ricane Maria in Puerto Rico in 2017 and hurricanes Jeanne (2004) and Sandy (2016) in Haiti. Likewise, Myanmar was struck hard by Cyclone Nargis in 2008, which was responsible for an estimated loss of 140 000 lives as well as the property of approximately 2.4 million people.59 Honduras, which consist-ently featured among the three most affected countries in previous CRI rankings, falls out of the Bottom 10 due to the observation period of this year’s CRI edition starting in 1999 (Hurricane Mitch, which was in 1998, was the major extreme weather event which had significantly affected Honduras’ CRI score).60
57 Note: Puerto Rico is not an independent national state but an unincorporated territory of the United States. Nevertheless, based on its geographical location and socio-economic indicators Puerto Rico has different conditions and exposure to extreme weather events than the rest of the USA. The Global Climate Risk Index aims to provide a comprehensive and detailed overview of which countries and regions are particularly affected by extreme weather events. Therefore, Puerto Rico was considered separately in our analysis.
58 See Eckstein et al. 2018 59 See OCHA 2012 60 Nicaragua falls out of the Bottom 10 for the same reason.

Global Climate Risk Index 2020 GERMANWATCH
10
Particularly in relative terms, poorer developing countries are hit much harder. These results em-phasise the particular vulnerability of poor countries to climatic risks, despite the fact that the ab-solute monetary losses are much higher in richer countries. Loss of life, personal hardship and exis-tential threats are also much more widespread in low-income countries.
Exceptional Catastrophes or Continuous Threats?
The Global Climate Risk Index 2020 for the period 1999–2018 is based on average values over a twenty-year period. However, the list of countries featured in the long-term Bottom 10 can be di-vided into two groups: those that have a high ranking due to exceptional catastrophes and those that are continuously affected by extreme events.
Countries falling into the former category include Myanmar, where Cyclone Nargis in 2008 caused more than 95% of the damage and fatalities in the past two decades, and Puerto Rico, where more than 98% of the damage in both categories was caused by Hurricane Maria in 2017. With new super-latives like Cyclone Idai in March 2019 being the deadliest and costliest cyclone on record in the Indian Ocean, and one of the worst tropical cyclones to ever affect Africa and the Southern Hemi-sphere, it seems to be just a matter of time until the next exceptional catastrophe occurs.61 The se-vere 2017 hurricane season made 2017 the costliest year ever in terms of global weather disasters.62
Over the last few years, another category of countries has been gaining relevance: Countries like Haiti, the Philippines and Pakistan that are recurrently affected by catastrophes continuously rank among the most affected countries both in the long-term index and in the index for the respective year. Furthermore, some countries were still in the process of recovering from the previous year’s impacts. One example is the Philippines, which is regularly exposed to tropical cyclones such as Bopha 2012, Hayan 2013 and Mangkhut 2018, due to its geographical location.
The appearance of some European countries among the Bottom 30 countries63 can to a large extent be attributed to the extraordinary number of fatalities due to the 2003 heatwave, in which more than 70 000 people died across Europe. Although some of these countries are often hit by extreme events, the relative economic losses and the fatalities are usually relatively minor compared to the coun-tries' populations and economic power.
2 The Role of Climate Change in Extreme Weather Events
In its “Fifth Assessment Report” published in 2014, the Intergovernmental Panel on Climate Change (IPCC) has already predicted that risks associated with extreme events will continue to increase as the global mean temperature rises.64 Linking particular extreme weather events to human-induced and natural climate drivers remains a scientific challenge that attribution science tries to tackle. The field has recently taken huge leaps forward – even though gaps in knowledge and especially in data remain. In general, many studies conclude that “the observed frequency, intensity, and duration of some extreme weather events have been changing as the climate system has warmed”.65 Neverthe-less, it is not trivial to investigate the impact of climate change on a single weather event as different
61 New York Times 2019a, World Bank 2019 62 MunichRe 2018, see also CRI2019 for an in-depth chapter on tropical cyclones 63 The full rankings can be found in the Annexes. 64 IPCC 2014a, p.12 65 Committee on Extreme Weather Events and Climate Change Attribution et al. 2016, p. 2

Global Climate Risk Index 2020 GERMANWATCH
11
regional circumstances need to be taken into account and data might be very limited.66 Over the past few years, substantial research has been conducted on the attribution of extreme events to climate change, i.e. to what extend anthropogenic climate change has contributed to the events’ likelihood and strength.67 In the field known as Probabilistic Event Attribution (PEA), based on cli-mate model experiments, studies compare the probability of an extreme weather situation, in to-day’s world with human-caused greenhouse gas emissions, to a world without human induced cli-mate change.68 Due to methodological improvement, “fast track attribution” is now more feasible and can be undertaken within months of the event (as opposed to decades).69 Additionally, more knowledge is generated on how underlying factors contributing to extreme weather are influenced by global warming. For example, higher temperatures intensify the water cycle, leading to more droughts as well as floods due to drier soil and increased humidity.70 Of course, these approaches can only lead to statements about the change in probability of a certain event happening.
Considering this, the report “Explaining Extreme Events of 2017 From a Climate Perspective” offered new findings from 17 peer-reviewed analyses. The American Meteorological Society has published the report on an annual basis since 2012 in its bulletin, analysing selected extreme weather events. Out of the 146 research findings, 70% “identified a substantial link between an extreme event and climate change”.71 Again, “scientists have identified extreme weather events that they said could not have happened without warming of the climate through human-induced climate change.”72 Among others, one study concluded that the intense marine heatwaves in the Tasman Sea off Australia in 2017 and 2018 were “virtually impossible” without climate change.73 Another study took a closer look at the persistent spring to summer heatwave in Northeast China in 2017 and concluded that the likelihood of such temperatures increased by about one third due to anthropogenic climate change.74 For its part, the “Fourth Climate Assessment Report” (2018) considers, with a high level of confidence, a future increase in the frequency and intensity of extreme high temperature and pre-cipitation events as the global temperature increases as being “virtually certain”.75The data on the countries in the CRI 2020 show how destructive extreme precipitation can be – namely through the floods and landslides, which have hit many regions in South and South East Asia and Africa – regions which now feature in the Bottom 10. Extreme precipitation is expected to increase as global warm-ing intensifies the global hydrological cycle. Thereby, single precipitation events are expected to increase in intensity at a higher rate than global mean changes in total precipitation as outlined by Donat et al. (2016). Furthermore, those increases are expected in wet as well as dry regions.76 A study by Lehmann et al. (2015) strengthens the scientific link between record-breaking rainfall events since 1980 and rising temperatures. According to the scientists, the likelihood of a new extreme rain-fall event being caused by climate change reached 26% in 2010.77 A recent study by Blöschel et al. (2017) concludes that the timing of floods is shifting due to climate change. The research focuses on Europe and shows that floods occur earlier in the year, posing timing risks to people and animals. Flooding rivers affect more people worldwide than any other natural disaster and result in multi-billion dollars of damage annually.78 Nevertheless, the study is not fully able to single out human-
66 Hansen et al. 2016 67 Stott et al. 2015 68 Carbon Brief 2014 69 Haustein et al. 2016 70 WMO 2017 71 American Meteorological Society 2018, without page number 72 Ibid. 73 Perkins-Kirkpatrick et al 2018, p54 74 Wang et al. 2018 75 Wuebbles el al. 2017 76 Donat et al. 2016 77 Lehmann et al. 2015 78 Blöschl et al. 2017

Global Climate Risk Index 2020 GERMANWATCH
12
induced global warming as a cause – a problem researchers on extreme weather attribution are still facing.
Researchers explained that the sea surface temperature plays a key role in increasing storms, wind speeds and precipitation.79 Another study on this subject showed that the rainfall during storms like Hurricane Harvey in 2017 is equivalent to the amount of evaporation over the ocean and thus the corresponding cooling effect of tropical cyclones on sea temperature. It is still difficult to distinguish between natural variability and human-induced extremes, but the rising sea level, which is largely caused by climate change, is responsible for the increased intensity of floods, storms and droughts. For example, a study shows that torrential rains like those in 2016 in Louisiana, USA, are now 40% more likely than in pre-industrial times. The rainfall was increased because the storm was able to absorb abnormal amounts of tropical moisture on its way to the US coast, releasing three times the precipitation of Hurricane Katrina in 2005.80 Another example is a regional model used to analyse the occurrence of heatwaves in India, finding causalities regarding the 2016 heatwave and climate change. The model indicated that sea surface temperatures influence the likelihood of record-breaking heat.81 Other studies have found similar results. A publication regarding the 2015 Southern African droughts also found causalities with regards to sea surface temperatures causing reduced rainfall, and increased local air temperatures.82 Moreover, the above-mentioned study from 2018 concludes that Hurricane Harvey could not have produced such an enormous amount of rain with-out human-caused climate change.83
Furthermore, there is increasing evidence on the link between extreme El Niño events and global warming. Cai et al. (2018) found that the robust increase in the variability of sea surface tempera-tures is “largely influenced by greenhouse-warming-induced intensification of upper-ocean stratifi-cation in the equatorial Pacific, which enhances ocean-atmosphere coupling.”84 As a consequence, the frequency of strong El Niño events increases as well as extreme La Niña events. This finding is considered a milestone in climate research85 and strengthens past research in the field.86 In addition, the IPCC’s Special Report “Global Warming of 1.5°C” was published in October 2018. It aims to de-termine the difference in consequences of 1.5°C climate change compared to 2°C. In order to do so, it investigates the effects of past global warming of the same extent. It identifies trends of increasing intensity and frequency of weather extremes during the past 0.5°C global increase. Furthermore, it shows that, at least in some regions, the likelihood of droughts and heavy precipitation is higher based on a 2°C increase, compared to one of 1.5°C.87
Extreme weather events are not the only risks aggravated by the influence of climate change. In their latest reports, the IPCC (2019)88 focuses on the effect of climate change on, for example, the deserti-fication and degradation of land. It suggests that climate change will accelerate several desertifica-tion processes and that, in the future, the risks of desertification will increase. This has various im-plications, such as the loss of biodiversity and an increase in the likelihood of wildfires. Williams et al. (2019) conclude that this is because of the increasing vapour pressure deficit due to the warming climate.89
79 Trenberth et al. 2015; Zhang et al. 2016 80 Climate Central 2016a 81 Climate Central 2016b 82 Funk et al. 2016 83 Trenberth et al. 2018 84 Cai et al. 2018, p. 201. 85 Ham Y-G 2018 86 Cai et al. 2014, Cai et al. 2012, Yeh et al. 2009 87 IPCC 2018a 88 IPCC 2019 89 Williams et al 2019

Global Climate Risk Index 2020 GERMANWATCH
13
Climate Change is a Real Game Changer for Heatwaves
Interview with Friederike Otto, leading scientist in the field of event attribution and Acting Director of the Environmental Change Institute at the University of Oxford
How well can extreme weather events generally be attributed to climate change?
This is highly dependent on the type of extreme weather event and the region in which it occurs. Large-scale events are generally easier to attribute, since the climate models available to us are more suitable for that. The least uncertainty arises from large-scale precipitation events. In addition, the confidence of the results depends on the data availability. In the case of droughts, robust conclusions are possible if good observational data is available. While there is data on the lack of precipitation, unfortunately, quite often there is a lack of relevant data beyond that, e.g. on soil moisture. This is especially true for countries of the global South. Regarding tropical storms, the resolution of most state-of-the-art models is not high enough. We can however robustly attribute precipitation associated with hurricanes in the Atlantic Ocean. In contrast, it is much more difficult in other regions.
How strong (and how well measurable) is the influence on heatwaves?
Climate change is a real game changer. The probability of heatwaves has already changed by orders of magnitude in Europe and will do so in almost every region of the world. Nevertheless, extreme weather events always have multiple causes, urbanization and land use, for example, play a role here.
How strong (and how well measurable) is the influence on heavy rain?
Climate change essentially affects weather in two ways: Firstly, through the thermodynamic effect, in other words the warming of the atmosphere. Warmer air can absorb more water vapour. Hence, we ex-pect more extreme precipitation on a global average. The second effect is trickier. As we change the com-position of the atmosphere, so does the atmospheric circulation and thus where weather systems are created and how they move. This effect varies by region and season, which is why we need attribution research. One example: While we can generally say that tropical cyclones will bring more intense and higher amounts of precipitation, we do not know whether and how their frequency will change.
What are the greatest challenges for attribution science?
There are two bottlenecks. Firstly, there is a lack of observational data, which is essential to carry out valid research of meteorological events. In many regions of the world, meteorological stations are miss-ing. Without observational data, climate models cannot be evaluated. Secondly, the field of research is very small. There are too few people working on attribution and it is very difficult to acquire sufficient funding.
What advantages does it have that extreme weather events can be better attributed to climate change?
We currently know relatively little about what the concrete effects of climate change mean in time frames and on local scales where humans live and make decisions. Attribution science is important to under-stand what climate change actually means. Many adaptation measures are based on trends in observa-tional data. Yet, these trends have multiple causes. Limited resources for adaptation to climate change can only be used efficiently, if we know what the consequences of climate change are.

Figure 1: World Map of the Global Climate Risk Index 1998–2017
Source: Germanwatch and Munich Re NatCatSERVICE
Italics: Countries where more than 90% of the losses or deaths occurred in one year or event
© 2
019
Germ
anw
atch
Countries most affected by extreme weather events (1999-2018)
1 Puerto Rico
2 Myanmar
3 Haiti
4 Philippines
5 Pakistan
6 Vietnam
7 Bangladesh
8 Thailand
9 Nepal
10 Dominica
15
3 Heatwaves Sweep the World
A string of deadly heatwaves took its toll on millions around the world in 2018. Temperatures far above the long-term average were witnessed foremost in the Northern Hemisphere, wreaking havoc on human health, agriculture, ecosystems and infrastructure.90 As highlighted in Chapter 1, extreme heat caused a significant number of deaths in Japan and Germany as temperatures soared past 40°C.91 In California, Sweden, Russia and Greece heatwaves triggered the most destructive wildfires experienced in recent years with a high number of fatalities and significant damage92. In the UK and across Northern Europe extreme heat aggravated prolonged dry spells, leading to dire droughts. In India, temperatures of up to 50°C were measured, the extreme water stress was omnipresent. Due to the drought in the southern Indian state of Tamil Nadu and empty water reservoirs, Chennai, a city with over a million inhabitants, could only be supplied with water by trucks and trains. The water supplies for the population had to be accompanied by the police.
A heatwave, also referred to as an extreme heat event, is commonly described as a period of abnor-mally hot weather93, spanning at least five consecutive days with a temperature of 5°C above average.94 It typically forms when a high-pressure system shifts into a region and stalls. The system can force warm air downward, creating a ‘cap’ that traps air in one place as it prevents the hot air near the surface from rising. The effects of heatwaves may be less obvious at first glance compared to other natural disasters such as storms or flooding, however, heatwaves cost just as many lives. According to our index, a total of 2 928 people reportedly died in 2018 from heat-related impacts, compared to 3 622 fatalities caused by floods, and 2 463 fatalities due to severe storms. Further-more, with regard to overall losses, heat resulted in a total of US$ 60.42 billion (in PPP) in damage globally in 2018.
Heatwave Effects and Interactions with other Extreme Weather Events
Science suggests that periods of extreme heat will not only become more commonplace due to increasing global temperatures but will also interact with and exacerbate already existing risks such as droughts and extreme rainfall or floods.95
Warmer temperatures increase the evaporative demand, which, alongside concurrent shifts in pre-cipitation, amplify drought conditions. The converse also holds true. Conditions of drought can boost or curb heatwave temperatures.96 Like heatwaves, record droughts have made headlines in recent years, highlighting their devastating implications. Heatwave-fuelled droughts are being felt not only in industrialised countries like Germany, where record highs in 2018 caused widespread crop failure to the detriment of thousands of farmers97, but, first and foremost, in developing coun-tries, where those affected are poorly equipped to cope with severe climate conditions.
90 The New York Times 2018 91 New Scientists 2018 92 San Francisco Chronicle 2018 93 IPCC 2012a 94 Deutsche Welle 2018b 95 This chapter focuses on how heatwaves can exacerbate droughts. 96 Nature Climate Change 2018 97 Deutsche Welle 2019b

16
In Sweden, a heatwave followed an exceptionally dry and warm period in the summer of 2018, which resulted in the worst outbreak of forest fires on record, engulfing roundabout 50 forests98, equivalent to approximately 25 000 hectares, which destroyed almost 3 million cubic meters of wood99.
Over and above the interconnections with other extreme events, heatwaves also have a number of sectoral impacts.
Heatwaves and Health
Heatwaves affect human health worldwide, leading to increased morbidity and mortality100. The combination of heat and high humidity is particularly exhausting for the human body as it slows down the evaporation of sweat, the body’s cooling system.101 The effect of high heat on health mostly manifests itself in cardiological and respiratory diseases.102 The population groups especially affected are the elderly as well as those working outdoors or in non-cooled buildings.103 A special
98 The Local 2018 99 Forestry.com 2018 100 Anderson and Bell, 2011; Haines et al., 2006; Loughnan et al., 2010; Martiello and Giacchi, 2010; Zeng et al., 2016 101 Hajat et al 2010; Kjellstrom et al 2016; Kravchenko et al 2013 102 e.g. Bunker et al 2015 103 e.g. Bai et al., 2014, Yin and Wang, 2017
How Climate Change Affects Heatwaves
The latest attribution research states that CO2 emissions from human activities have doubled the likelihood of severe heat events in northern Europe (World Weather Attribution 2018). Stud-ies further show that large-scale heat events, such as the Northern Hemisphere heatwave in 2018, could occur every year if global temperatures were to climb to 2°C above the pre-industrial levels, or it could occur in two out of every three years in a 1.5°C scenario (Vogel et al. 2018, see further information on attribution science in chapter 2). Another study warns that if current greenhouse emission pathways remain unaltered, three out of four people on the planet could, by the year 2100, be exposed to more than 20 days per year of the heat and humidity linked to fatal heatwaves (Nature Climate Change 2017).
Climate science indicates that heatwaves often have a common trigger: profound recent changes to jet streams — strong winds at altitudes of around 10 kilometres above the earth’s surface which affects weather systems around the globe. Powered by differences in temperature between cooler polar regions and warmer air masses, circulating jet streams can be stalled due to changed conditions, leading to unusual weather patterns. While reinforcing cold snaps in one place, a jet stream can fan blasts of heat in another (Mann et al. 2018).
The IPCC’s Fifth Assessment Report confirms that the warming of the planet is already having an effect on jet streams and, hence, on global weather patterns: “It is likely that circulation fea-tures have moved poleward since the 1970s, involving a widening of the tropical belt, a poleward shift of storm tracks and jet streams and a contraction of the northern polar vortex. Evidence is more robust for the NH [Northern Hemisphere] (IPCC 2013).”
Evidence is also mounting that the warming Arctic, which is warming twice as fast as the rest of the planet, constitutes a major factor for why the polar jet stream keeps getting stalled (Popular Mechanics 2019). Recent heatwaves sweeping the Northern Hemisphere are largely attributed to the accelerated warming of the Arctic causing an altering of the polar jet stream, illustrating the increasing risk of heatwaves due to global warming (New Scientist 2018).
17
burden also lies on the poor and vulnerable, due to unevenly distributed access to proper health care. Inhabitants of cities are particularly in danger of suffering from the “urban heat island” effect, which enhances the intensity of heatwaves in cities. A lack of consideration in urban planning of rising temperatures, resulting in dense infrastructure, can lead to a temperature increase of up to 12°C in cities compared to rural environments, particularly at night.104
In the summer of 2003, anthropogenic climate change increased the risk of heat-related mortality in Central Paris by 70%, and by 20% in London, which experienced lower extreme heat. Out of the estimated 315 and 735 summer deaths attributed to the heatwave event in Greater London and Central Paris, respectively, 64 (±3) deaths were attributable to anthropogenic climate change in Lon-don, and 506 (±51) in Paris.105
Agriculture and Food Security
Combined heatwaves and drought can lead to severe harvest failures with major implications for agricultural producers and the food security of communities all over the world. Adverse-effects are not only felt directly where climate extremes occur, but also indirectly in that regions suffer from the repercussions of reduced exports and higher food prices.106 As highlighted in this year’s CRI’s Bottom 10, a European heatwave and drought in the summer of 2018 led to widespread harvest failures and a massive decline in agricultural productivity in many countries across the continent. Struggling to cope with the consequences, various national governments sought help from the European Com-mission.107 In Germany alone, some 8 000 farmers were prompted to call for federal emergency relief worth around EUR 1 billion (US$ 1.18 billion ) in order to be compensated for their losses,108 after a massive decline in harvest resulted in total damages of EUR 3 billion (US$ 3.54 billion).109 However, the countries most susceptible to heatwaves and prolonged drought – mainly in the global South – are often in a much more precarious situation as they cannot rely upon government support in the form of financial resources or technologies. Furthermore, many African countries are particularly drought-prone and are already subjected to desertification and other forms of land degradation, which negatively impacts agriculture and frequently spurs conflicts over subsistence crops, thus perpetuating food insecurity and the risk of hunger.110
Forestry
Heatwaves can have devastating effects on forests. Heat causes the soil to dry out as water increas-ingly evaporates and exacerbates the risk of forest fires.111 If a heatwave only lasts for a very limited time span, the trees are generally able to cope well with the high temperatures (>40 °C), if they have sufficient water sources.112 But frequently, heatwaves occur in combination with droughts. A devas-tating combination for forests as it has contributed to tree mortality worldwide.113 The negative ef-fects on trees are manifold. Trees cool their leaves evaporatively by transpiration, and the stem tis-sues convectively through heat transfer.114 Therefore, a lack of water hinders the cooling of the leaves and stem tissues, potentially leading to damage. Other negative effects include a reduction in tree growth and negative impacts on physiological processes such as reduced photosynthesis.115
104 United States Environmental Protection Agency 105 Mitchell et al. 2016 106 Global Food Security Programme 2015 107 Deutsche Welle 2018a 108 Deutsche Welle 2019b 109 Bayern LB 2019 110 UNFCCC 2007 111 Focus 2019 112 Teskey et al 2015 113 Allen et al. 2010 114 Kolb & Robberecht 1996 115 Teskey et al 2015

18
The impact of extreme heat and droughts does not often materialise directly. Damage usually oc-curs years after the event. Trees that have already been weakened by the direct impacts become more vulnerable in subsequent years to extreme events; insects and diseases then become the pri-mary causes of death.116
In the European heatwave of 2003, that was accompanied by a drought, another factor came to light: due to a 30% decline in gross primary production (biomass) across Europe, the forests in the region became a net source of CO2 (0.5 PgC per year) – rather than a carbon-sink, as in previous years.117
Heatwaves – a Global Threat
The occurrence of heatwaves is a global problem, both for countries in the global South and in the global North. The Intergovernmental Panel on Climate Change (IPCC) concludes that it is likely that [due to climate change] the frequency of heatwaves has increased in large parts of Europe, Asia and Australia.118 According to the IPCC’s special report on 1.5 degrees “the number of highly unusual hot days is projected to increase the most in the tropics”.119
The current figures on the effects of heatwaves on different parts of the world must, however, be viewed against the background of data availability and quality as well as the underlying methodol-ogy for their collection. For instance, the accurate attribution of a human loss to a particular extreme weather event faces certain methodological boundaries that data collectors have to work with (e.g. to determine whether the death of an elderly person during a heatwave is indeed the result of the extreme temperature or only due to the high age). Similarly, data quality and coverage may vary from country to country as well as within countries. Currently, many more studies have been con-ducted for developed countries, compared to developing countries.120 There are efforts to change this121, but the limited availability of data in developing countries is a barrier.122 A recent study by Campbell et al. (2018)123 found that heatwave and health impact research is not evenly distrib-uted across the globe. They highlight that regions most at risk from heatwaves and health impact are under-represented in the research (Campbell et al. 2018). These circumstances may cause coun-tries with large data gaps to appear less affected by heatwaves than they might be in reality. We also have to note that climate change disproportionately affects the poor. Many low-income urban res-idents live in precariously located informal settlements, characterised by poor-quality housing that is susceptible to extreme heat and they have less access to affordable healthcare. These factors make them both more exposed to heatwaves, and less able to deal with them when they occur.124
Looking at the results of the CRI 2020, four countries (Japan, Germany, India and Canada) of the Bottom 10 were especially affected by heatwaves. Below, a closer look is taken at the impacts of heatwaves as well as the related challenges in Europe and India.
European Heatwaves
In the summer of 2018, Europe suffered from heatwaves accompanied by a dry spell, which led to crop failure and numerous forest fires.125 July 2018 was the warmest July ever recorded in Northern
116 Allen et al. 2010, Gessler 2019 117 Ciais et al. 2005 118 IPCC 2014c 119 IPCC 2018 120 Otto et al. 2015 121 Climate Central 2019 122 Huggel et al. 2015 123 Campbell et al. 2018 124 C40 2019 125 Imbery et al. 2018b

19
Europe. With temperatures of up to 26°C, the Baltic Sea was warmer than ever before.126 In Germany 1 234 people died from the heat in 2018 and health risks were increased.127 Power plants had to reduce production or be shut down entirely in Sweden, France, Finland128 and Germany129 as low water levels of nearby rivers reduced the availability of cooling water for the power plants. Due to low water levels, barges could only operate at limited capacity, leading to fuel shortages and dis-ruption to production processes.130
Although Europe – especially France – has made progress in preventing heat fatalities by imple-menting better early warning systems,131 disruptions have still been significant. Partly because ad-aptation measures could not keep up with the rapid changes. As an example: While it is clear that houses must be equipped with better insulation to deal with extreme heat132 in Germany, less than 1% of residential buildings are being adapted annually.133 Furthermore, there was a lack of risk management. German farmers were not adequately prepared.134 In total, insurance experts esti-mate that only 0.2% of German farmland was covered by insurance against heat and drought.135 As a result, leading politicians are currently considering subsidies for insurance products.136 Being par-ticularly dependent on the jet stream, extreme heat during European summers is likely to occur more often and intensively in the future. In 2019, in Germany the heat record was broken yet again several times, raising it by 2.3°C to 42.6°C in just one summer.137
Indian Heatwaves
As highlighted in Chapter 1, India suffered from one of the longest ever recorded heatwaves in 2018, with hundreds of deaths138, when temperatures climbed to up to 48°C. Prolonged drought and re-sultant widespread crop failures, compounded by a water shortage, brought about violent riots and increased migration 139.
India is among those countries that were particularly affected by extreme heat in both 2018 and 2019. Since 2004, India has experienced 11 of its 15 warmest recorded years.140 Since 1992, an esti-mated 25 000 Indians have died as a result of heatwaves.141 Contributing factors include increasing temperatures, the "El Niño Modoki", an irregular El Niño in which the Central Pacific Ocean is warmer than the East Pacific, and the loss of tree cover, reducing shade as well as the moisture in the soil.142 India is particularly vulnerable to extreme heat due to low per capita income, social inequality and a heavy reliance on agriculture.143 The worst hit regions have also been among India's poorest. Ad-ditionally, a high number of people are working in areas such as agriculture and construction. A study by the International Labour Organization concludes that by 2030, India would lose 5.8% of its
126 Imbery et al. 2018b 127 Bundesärztekammer et al. 2019 128 Patel 2018 129 Vogel et al. 2019 130 Deutschlandfunk 2018; NT-V 2018 131 Watts et al. 2019 132 Salagnac 2007 133 Handelsblatt 2019; Climate Transparency 2019 134 Deutsche Welle 2019b 135 GDV – Gesamtverband der Deutschen Versicherungswirtschaft 201 136 Tagesspiegel 2019 137 FAZ 2019 138 Reuters 2018 139 Future Earth 2019 140 Earth observatory 2019 141 The Guardian 2018a 142 The Times of India 2019 143 IPCC. 2014c

20
working hours due to heat stress, which is equivalent to 34 million full-time jobs out of a total of 80 million worldwide.144
In response to the growing number of deaths from heatwaves, the Indian government began imple-menting countermeasures. Heat plans include a combination of public awareness campaigns, training for medical staff, reducing school days, building heat shelters for the homeless equipped with drinking water, free water distribution and simple policy changes.145
Adapting to and Coping with Heatwaves
To limit the negative impacts of more frequent and more severe heatwaves in the future, more am-bitious mitigation efforts are of utmost importance. Nevertheless, as outlined, today many regions of the world are already facing the dire consequences of these events. This calls for substantial ef-forts in two areas. Firstly, adaptation measures must be implemented to prevent or limit the damage heatwaves can cause. This has to be done with caution in order to prevent maladaptation – an intended adaptation measure that (unintendedly) increases vulnerability towards climate change and, hence, the risk of negative impacts, or that diminishes welfare.146 Secondly, coping strategies to deal with unavoidable consequences and to ensure swift reactions during and after heatwaves must be introduced and strengthened .
Adaptation and coping measures vary greatly by sector, since heatwaves manifest differently. Re-garding negative impacts on health, vulnerable people should be identified, approached and edu-cated, since they sometimes may not acknowledge their own risk factors.147 Heat preparedness plans and early warning systems can reduce fatalities significantly.148 By introducing clear com-munication structures, responsibilities and instructions for heat events, adverse health effects can be minimised.149 It is crucial to take into account different living conditions. Inhabitants of informal settlements are more susceptible to heat stress, creating yet another challenge for an already vul-nerable population.150 Furthermore, Infrastructure measures in urban areas should focus on reduc-ing the urban heat island effect by increasing tree coverage and creating green belts that allow winds to circulate. Furthermore, green roofs and lighter coloured pavements and buildings can re-flect some of the sun’s radiation.151 However, the widespread installation of air conditioning sys-tems has to be considered maladaptation. Not only do high electricity consumption and most cooling agents contribute to climate change, but the high demand for electricity puts further stress on electricity grids152 and the units’ thermal discharge heats up cities even more.153
There are many promising adaptation measures for agriculture and ensuring food security, such as the usage of more adapted crops, crop diversification and rotation, modifications to crop calendars, agroforestry and the usage of cover crops that provide shade for cash crops, reduce soil erosion and manage nutrient levels.154 Introducing irrigation farming to areas that used to rely purely on rainwater has to be well thought-out. It bears the risk of further increasing stress on water sup-plies and, hence, has to be considered a maladaptation in many cases. As agriculture is also a
144 ILO 2019 145 The Guardian 2018a 146 UNEP 2019 147 Carter 2018 148 Center for Climate and Energy Solutions 2019; Watts et al. 2019 149 WHO Europe 2008 150 NDRC 2013 151 Chandra 2019 152 Strohmayer 2019 153 Louis 2018 154 European Environment Agency 2019

21
major contributor to climate change, it is all the more important that farming practices which are low in greenhouse gas emissions be employed.
There are two strategies deal with forest heat stress. Buffering measures aim at preventing and curbing disturbances, for example preventing the spread of invasive species that benefit from heat stress, setting up firefighting reservoirs and building access roads for heavy machinery. This ap-proach cannot prevent heat stress but can help with the associated consequences such as the afore-mentioned spread of vermin and fire. In many cases, it is only effective for a limited time span. More-over, it often involves intense management and is therefore costly. In the long-run, increased resil-ience can only be achieved by facilitating an ecosystem shift by, for example, introducing ge-netic diversity and a large spectrum of forest types. Reducing non-climatic stressors, such as plant-ing monocultures, aids both strategies.155 Besides being carbon-sinks, forests are themselves ad-aptation measures. They regulate regional water supplies and temperature fluctuations and can therefore, among other things, alleviate the impacts of storms, flash floods and storm surges156 and reduce heat stress in urban environments.157
In principle, adaptation measures must be tailored to regional contexts. Not only does climate change manifest itself differently in every region of the world, but cultural rules and practices or strategies to deal with extreme weather and seasonal variability also vary greatly. Traditional farm-ers, for example, have developed several coping mechanisms like crop diversification, or informal risk sharing arrangements and banking systems.158 While in many cases these are or will not be suf-ficient going forwards, the existing mechanisms should be applied, strengthened or integrated wherever possible.159
Poor and vulnerable people are often more susceptible to climate change impacts. Moreover, ad-aptation measures themselves often entail distributional effects. This is why adaptation measures should especially support the poor and vulnerable and must avoid maintaining and enhancing social injustices and power imbalances.160
4 Addressing Climate Risks and Impacts: a Stocktake of 2019 Developments
The Climate Risk Index (CRI) 2020 clearly shows: Signs of escalating climate change can no longer be ignored – on any continent or in any region. In addressing the related climate risks and impacts, the year 2019 has been characterised less by political milestones but rather by initiatives for action and its further scientific underpinning. Above all, research on climate risks and concrete climate change impacts has made significant progress. Two Special Reports of the Intergovernmental Panel on Climate Change (IPCC), one on the Ocean and Cryosphere in a Changing Climate161 and the second on impacts of climate change on land 162 clearly show that both extreme weather
155 Pramova 2012 156 Pramova 2012 157 McDonald 2018 158 Hutfils 2019 159 Germanwatch 2019 160 UNEP 2019 161 IPCC 2019a 162 IPCC 2019b

22
events and slow onset processes have tended to be underestimated in the past and have al-ready caused devastating consequences worldwide today. Significant increases in the near future are predicted. The reports show, with a high level of confidence, that climate change, including in-creases in the frequency and intensity of extremes but also the shrinking cryosphere in the Arctic and high-mountain areas, has led to predominantly negative impacts on food security, water re-sources, water quality, livelihoods, health and well-being as well as on the culture of human socie-ties, particularly for indigenous peoples. The reports note that some impacts of climate-related changes challenge current governance efforts to develop and implement adaptation responses from local to global scales, and in some cases, push them to their limits. People with the highest exposure and vulnerability are often those with the lowest capacity to respond. Drawing an even more severe picture, a recent study by Climate Central concludes that rising sea levels are threat-ening to erase coastal mega-cities such as Bangkok, Shanghai and Mumbai. Around 150 million people are now living on land that will be below the high-tide line by the mid-century, based on moderate emission cuts.163
On a political level, addressing the need to ramp up climate action was the goal of the United Na-tions Climate Action Summit (UNSG) in New York. On 23rd September, UN Secretary-General António Guterres brought together national governments, their subnational and local counterparts, civil society and private businesses to, amongst others, advance global efforts to address and man-age the impacts and risks of climate change, particularly in those communities and nations, which are most vulnerable. One concrete outcome of the UNSG summit was a “Call for Action on Adapta-tion and Resilience”. It aims for progress in dealing with climate impacts through better adaptation and strengthened resilience.
Fostering implementation is also the goal of the Global Commission on Adaptation (GCA), which seeks to accelerate adaptation action and support. In early September 2019, it presented its flagship report, which concluded that investment of US$ 1.8 trillion in just five areas of adaptation during the upcoming decade could prevent US$ 7 trillion in losses and damages by 2050. Spending US$ 800 million per year on early warning systems alone would avoid losses of US$ 3 billion to US$ 16 billion per year. However, in 2017 only US$ 13.3 billion in public and private adaptation finance was provided and mobilised.164 Furthermore, that does not include any financing for loss and damage.165
Whether the UN summit or the GCA were and will contribute to increased resilience for vulnerable people, can only be determined in the upcoming years. However, the considerable lack of resilience financing points to the need for more encompassing, systematic and longer-term support in general. While presenting selected success stories as well as funding lighthouse projects adds a lot of value, it will not suffice if the international community does not provide the means to put those lessons learned to use across the world.
Resilience Agenda at Chilean COP25 in Madrid
Climate change-related losses and damages threaten livelihoods, food security, human security and sustainable economic development. However, climate change impacts hit the poorest countries hardest because they lack the economic and financial capacity to deal with the loss and damage. Those most affected are those least responsible for the cause of the climate crisis. So far, there is a lack of political and legal rules to determine how those responsible for climate change should pay for the consequences of their emissions. In the context of the UN climate negotiations, additional
163 Kulp et al. 2019 164 OECD 2019 165 Global Commission on Adaptation 2019

23
financial resources to help the poorest people and countries cope with loss and damage are lacking. During the forthcoming climate summit in Madrid one of the big issues therefore must be: How can developing countries be supported in dealing with increasing loss and damage? How can polluters, in particular, contribute to the costs?
The CRI 2020 clearly shows the devastating impacts of climate change induced extreme weather events. COP25 will put Loss and Damage prominently on the agenda as the body dealing with averting, minimizing and addressing Loss & Damage (the Warsaw International Mechanism for Loss and Damage – WIM) will be reviewed in Madrid for the second time. The review must identify successes but also gaps in the implementation in order to decide which crucial steps should be taken to make the WIM fit for purpose. The review should help to officially address the “elephant in the room”, namely the lack of climate finance to address loss and damage. One of the WIM’s tasks – “Enhancing action and support, including finance, technology and capacity-building” – has not been implemented sufficiently yet, even the space for debates itself is lacking while at the same time, needs and affectedness are rising. The review therefore needs to assess:
a) how the mechanism can effectively assist vulnerable countries in dealing with loss and damage;
b) whether the WIM is able to meet the needs of vulnerable countries in dealing with future loss and damage based on best available science, taking into account the latest IPCC re-ports; and
c) how financial resources can be generated and made available to meet these needs.
Regarding adaptation, COP25 uses a similar implementation approach as the UN Climate Action Summit. Accordingly, adaptation is one of the initiatives the COP Presidency launched under the topic "Time to Act". However, some important negotiation issues remain on the agenda, such as the National Adaptation Plans (NAPs). This is a particularly interesting item, since the first NAP cycle will end in 2020. Developing countries should have completed a NAP process by then and have a respec-tive plan in place. At present, however, there are only 13 countries worldwide, which have submitted a NAP and the process has turned out to be highly complex and challenging, especially for the least developed countries. More support, in terms of finance and capacity building through strong partnerships, is required in that regard in order to prepare those countries for the effects of climate change that do not possess the capacity to do so on their own and in order to share successful ap-proaches.
5 Methodological Remarks
The presented analyses are based on the worldwide data collection and analysis provided by Mu-nich Re’s NatCatSERVICE. “The information collated by MunichRe, the world’s leading re-insurance company, can be used to document and perform risk and trend analyses on the extent and intensity of individual natural hazard events in various parts of the world.”166 Broken down by countries and territories, Munich Re collects the number of total losses caused by weather events, the number of deaths, the insured damages and the total economic damages. The last two indicators are stated in million US$ (original values, inflation adjusted).
In the present analysis, only weather-related events – storms, floods as well as temperature ex-tremes and mass movements (heat and cold waves etc.) – are incorporated. Geological incidents like earthquakes, volcanic eruptions or tsunamis, for which data are also available, are not relevant
166 MunichRe NatCatSERVICE

24
in this context as they do not depend on the weather and therefore are not possibly related to cli-mate change. To enhance the manageability of the large amount of data, the different categories within the weather-related events were combined. For single case studies on particularly devastat-ing events, it is stated whether they concern floods, storms or another type of event.
It is important to note that this event-related examination does not allow for an assessment of con-tinuous changes of important climate parameters. For instance, a long-term decline in precipitation that was shown in some African countries as a consequence of climate change cannot be displayed by the CRI. Nevertheless, such parameters often substantially influence important development fac-tors like agricultural outputs and the availability of drinking water.
Preparing an index requires the analysis of a vast amount of data. Thus, data availability and quality play an important role as well as the underlying methodology for their collection. For instance, the accurate attribution of a human loss to a particular extreme weather event faces certain methodo-logical boundaries that data collectors have to work with (e.g. to determine whether the death of an elderly person during a heatwave is indeed the result of the extreme temperature or due to the high age alone). Similarly, data quality and coverage may vary from country to country as well as within countries. A recent study by Campbell et al. (2018) found that heatwave and health impact research is not evenly distributed across the globe. They highlight that “regions most at risk from heatwaves and health impact are under-represented in the research.”167 The data analysed for the CRI rely on scientific best practice and methodologies used are constantly evolving with the view of ensuring the highest degree of accuracy, completeness and granularity.
Although certainly an interesting area for analysis, the present data do not allow for comprehensive conclusions about the distribution of damages below the national level. The respective data quality would only be sufficient for a limited number of countries. The island of Réunion, for example, would qualify for a separate treatment but data are insufficient.
Analysed Indicators
For the examination of the CRI, the following indicators were analysed:
1. number of deaths, 2. number of deaths per 100 000 inhabitants, 3. sum of losses in US$ in purchasing power parity (PPP) as well as 4. losses per unit of gross domestic product (GDP).
For the indicators 2–4, economic and population data primarily provided by the International Mon-etary Fund were taken into account. It must be added, however, that especially for small (e.g. Pacific Small Island Developing States) or extremely politically unstable countries (e.g. Somalia), the re-quired data are not always available in sufficient quality for the entire time period observed. Those countries needed to be omitted from the analyses.
The CRI 2020 is based on the loss figures of 181 countries from the year 2018 and the period 1999 to 2018. This ranking represents the most affected countries. In each of the four categories ranking is used as a normalisation technique. Each country's index score has been derived from a country's average ranking in all four indicating categories, according to the following weighting: death toll, 1/6; deaths per 100 000 inhabitants, 1/3; absolute losses in PPP, 1/6; losses per GDP unit, 1/3.
167 Campbell et al. 2018
25
For example, in the Climate Risk Index for 1999-2018, Bangladesh ranks 9th in fatalities among all countries analysed in this study, 37th in Fatalities per 100 000 inhabitants, 17th in losses and 40th in losses per unit GDP (see Annexes, Table 4). Hence, its CRI Score is calculated as follows:
CRI Score = 9 x 1/6 + 37 x 1/3 + 17 x 1/6 + 40 x 1/3 = 30.00
Only six countries have a lower CRI Score for 1999-2018, hence Bangladesh ranks 7th in this index cate-gory (see Table 2).
The Relative Consequences Also Depend on Economic and Population Growth
Identifying relative values in this index represents an important complement to the otherwise often dominating absolute values because it allows for analysing country specific data on damages in relation to real conditions and capacities in those countries. It is obvious, for example, that for richer countries like the USA or Japan damages of one billion US$ cause much less economic conse-quences than for the world’s poorest countries, where damages in many cases constitute a substan-tial share of the annual GDP. This is being backed up by the relative analysis.
It should be noted that values, and hence the rankings of countries regarding the respective indicators do not only change due to the absolute impacts of extreme weather events, but also due to economic and population growth or decline. If, for example, population increases, which is the case in most of the countries, the same absolute number of deaths leads to a relatively lower assessment in the fol-lowing year. The same applies to economic growth. However, this does not affect the significance of the relative approach. Society’s ability of coping with damages through precaution, mitigation and disaster preparedness, insurances or the improved availability of means for emergency aid, generally grows along with increasing economic strength. Nevertheless, an improved ability does not neces-sarily imply enhanced implementation of effective preparation and response measures. While abso-lute numbers tend to overestimate populous or economically capable countries, relative values give more prominence to smaller and poorer countries. In order to consider both effects, the analysis of the CRI is based on absolute (indicators 1 and 3) as well as on relative (indicators 2 and 4) scores. Being double weighted in the average ranking of all indicators generating the CRI Score, more emphasis and therefore higher importance is given to the relative losses.
The Indicator “Losses in Purchasing Power Parity” Allows for a More Compre-hensive Estimation of How Different Societies are Actually Affected
The indicator “absolute losses in US$” is identified by purchasing power parity (PPP) because using this figure expresses more appropriately how people are actually affected by the loss of US$ 1 than by using nominal exchange rates. Purchasing power parity is a currency exchange rate, which per-mits a comparison of, for instance, national GDPs, by incorporating price differences between coun-tries. This means that a farmer in India can buy more crops with US$ 1 than a farmer in the USA with the same amount of money. Thus, the real consequences of the same nominal damage are much higher in India. For most countries, US$ values according to exchange rates must therefore be mul-tiplied by a factor bigger than one.
26
6 References
Al Jazeera. 2018. Cyclone Ava kills at least 29 in Madagascar. Available at https://www.aljazeera.com/news/2018/01/cyclone-ava-kills-29-madagascar-180109184951149.html (05 Nov 2019).
American Meteorological Society. 2018. Heatwaves, Droughts and Floods Among Recent Weather Ex-tremes Linked to Climate Change. New Studies Reveal Clear Ties between Today’s Extremes and Human Causes. Press Release. Available at https://www.ametsoc.org/index.cfm/ams/about-ams/news/news-releases/heatwaves-droughts-and-floods-among-recent-weather-extremes-linked-to-climate-change/ (05 Nov 2019).
American Red Cross. 2018. Hurricane Safety: Learn how to keep your home and family safe during a hur-ricane or typhoon. Available at www.redcross.org/get-help/how-to-prepare-for-emergen-cies/types-of-emergencies/hurricane.html (16 Nov 2018).
Allen, C.D., Macalady, A.K., Chenchouni, H., Bachelet, D., McDowell, N., Vennetier, M., Cobb, N. 2010. A global overview of drought and heatinduced tree mortality reveals emerging climate change risks for forests. Forest Ecology and Management 259, 660–684.
Anderson, B., Bell, M., 2011. Heat waves in the United States: mortality risk during heatwaves and effect modification by heat wave characteristics in 43 U.S. Communities. Environ. Health Perspect. 119 (2), 210–218.
Bai, L., Ding, G., Gu, S., Bi, P., Su, B., Qin, D., Xu, G., Liu, Q. 2014. The effects of summer temperature and heat waves on heat-related illness in a coastal city of China, 2011–2013. Environ. Res 132, 212–219.
Bayerische Landesbank. 2019. The summer heatwave and its effects on the economy. Available at https://www.bayernlb.com/internet/en/blb/resp/verantwortung_1/green_finance_1/wis-sen_1/hitzesommer___auswirkungen_auf_die_wirtschaft_1/hitzesommer.jsp (12 Nov 2019).
Bayern LB. 2019. The summer heatwave and its effects on the economy. Available at https://www.bay-ernlb.com/internet/en/blb/resp/verantwortung_1/green_finance_1/wissen_1/hitzesom-mer___auswirkungen_auf_die_wirtschaft_1/hitzesommer.jsp (07 Nov 2019).
BBC. 2018a. British Columbia wildfires: Smoky skies in western Canada. https://www.bbc.com/news/world-us-canada-45250919. (07 Nov 2019).
BBC. 2018b. Typhoon Mangkhut: 14 killed as storm batters Philippines. Available at https://www.bbc.com/news/world-asia-45532217 (06 Nov 2019).
BBC. 2018c. Cyclone Titli: Eastern India battered by deadly storm. Available at https://www.bbc.com/news/world-asia-india-45827150 (05 Nov 2019).
Blöschl, G., Hall, J., Paraijka, J., et al. 2017. Changing Climate Shifts Timing of European Floods. Science, 357, 588-590.
British Columbia Government. 2018. 2018 Wildfire Season Summary. Available at https://www2.gov.bc.ca/gov/content/safety/wildfire-status/about-bcws/wildfire-history/wildfire-season-summary. (08 Nov 2019).
Bundesärztekammer, Charité – Universitätsmedizin Berlin, Helmholtz Zentrum München, Hertie School, Potsdam-Institut für Klimafolgenforschung. 2019. The Lancet Countdown on Health and Climate Change. Policy Brief für Deutschland. Available at https://storage.googleapis.com/lancet-count-down/2019/11/Lancet-Countdown_Policy-brief-for-Germany_DEUTSCH_FINAL.pdf (27 Nov 2019)
Bunker, A., Ildenhain, J., Vandenbergh, A., et al. 2015. Effects of air temperature on climate-sensitive mor-tality and morbidity outcomes in the elderly: a systematic review and meta-analysis of epidemio-logical evidence. EbioMedicine 6: 258–68.

27
Cai, W, Borlace, S., Lengaigne, M., Rensch, P. v., Collins, M., Vecchi, G., Timmermann, A., Santoso, A., McPhaden, M. J., Wu, L., England, M. H., Wang, G., Guilyardi, E., Jin, F. 2014. Increasing frequency of extreme El Niño events due to greenhouse warming. Nature Climate Change, 4, 111–116.
Cai, W, Wang, G, Santoso A., McPhaden M., Wu L., Jin, F-F., Timmermann, A., Collins, M., Vecchi, G., Lengaigne, M., England, M., Dommenget, D.,Takahashi, K., Guilyardi, E. 2015. Increased frequency of extreme La Niña events under greenhouse warming. Nature Climate Change, 5, 132-137.
Cai, W., Wang, G., Dewitte, B. Wu, L., Santoso, A., Takahashi, K., Yang, Y., Carréric, A.,McPhaden, M., 2018. Increased variability of eastern Pacific El Niño under greenhouse warming. Nature 564, 201–206. Available at https://doi.org/10.1038/s41586-018-0776-9 (11 Nov 2019).
Campbell, S., Remenyi, T., White, C., Johnston, F. 2018. Heatwave and health impact research: A global review. Available at https://www.sciencedirect.com/science/article/pii/S1353829218301205 (27 Nov 2019).
Carbon Brief. 2014. Attributing extreme weather to climate change in real-time. Available atwww.carbon-brief.org/attributing-extreme-weather-to-climate-change-in-real-time (16 Nov 2018).
Carter, S. 2018. Heatwaves could become a silent killer in African cities. Available at https://www.cli-matechangenews.com/2018/11/29/heatwaves-silent-killer-african-cities/ (17 Nov 2019).
Center for Climate and Energy Solutions. 2019. Heat Waves and Climate Change. Available at https://www.c2es.org/content/heat-waves-and-climate-change/ (07 Nov 2019).
Chandra, S. 2019. Indian Cities Are Becoming Urban Heat Islands https://www.citylab.com/environ-ment/2019/08/heat-wave-india-urban-island-effect-climate-global-warming/596371/ (17 Nov 2019).
Ciais, P., Reichstein, M.,Viovy, N., Granier, A., Ogee, J., Allard, V.,Valentini, R. 2005. Europe-wide reduction in primary productivity caused by the heat and drought in 2003. Nature 437, 529–533.
Climate Central. 2016a. Louisiana Precipitation 2016. Available at wwa.climatecentral.org/analyses/loui-siana-downpours-august-2016/ (16 Nov 2018).
Climate Central. 2016b. Heat Wave in India. Available at wwa.climatecentral.org/analyses/india-heat-wave-2016/ (16 Nov 2018).
Climate Central. 2019. Flooded Future: Global vulnerability to sea level rise worse than previously under-stood. Available at: https://climatecentral.org/pdfs/2019CoastalDEMReport.pdf
Climate Transparency. 2019. Brown to Green. The G20 Transition. Towards a Net-Zero Emissions Econ-omy. Available at https://www.climate-transparency.org/wp-content/uploads/2019/11/Brown-to-Green-Report-2019.pdf (15 Nov 2019).
Columbia University. 2012. Integrated Assessment OF Climate Change: Model Visualization and Analysis (MVA). Available at www.ciesin.columbia.edu/data/climate/ (16 Nov 2018).
Committee on Extreme Weather Events and Climate Change Attribution et al. 2016: Attribution of Extreme Weather Events in the Context of Climate Change. Available at: https://www.nap.edu/read/21852/chapter/1.
CNN. 2018a. Philippines lashed by Typhoon Mangkhut, strongest storm this year. Available at https://edi-tion.cnn.com/2018/09/14/asia/super-typhoon-mangkhut-ompong-wxc-intl/index.html (07 Nov 2019).
CNN. 2018b. Typhoon Mangkhut hits mainland China, lashes Hong Kong, dozens dead in Philippines. Available at https://edition.cnn.com/2018/09/16/asia/typhoon-mangkhut-china-hong-kong-intl/index.html (11 Nov 2019).
C40. 2019. Avoiding the climate change poverty trap. Available at https://www.c40.org/other/the-future-we-don-t-want-avoiding-the-climate-change-poverty-trap (27 Nov 2019).
Daily Hive. 2018. Top 10 Canadian Weather Stories. Available at https://dailyhive.com/calgary/top-10-ca-nadian-weather-stories-2018 (08 Nov 2019).
28
Deutsche Welle.2018a. Calls for farm support intensify as Europe struggles with heat wave, drought. Avail-able at https://www.dw.com/en/calls-for-farm-support-intensify-as-europe-struggles-with-heat-wave-drought/a-44902321 (24 Nov 2019)
Deutsche Welle. 2018b.The global heat wave thats been killing us. Available at https://www.dw.com/en/the-global-heat-wave-thats-been-killing-us/a-44699601 (27 Nov 2019).
Deutsche Welle. 2019a. Von Haiti bis Madagaskar: Vergessene Krisen. Available at https://www.dw.com/de/von-haiti-bis-madagaskar-vergessene-krisen/a-47571079-0 (05 Nov 2019).
Deutsche Welle. 2019b. After a year of record droughts, Germany's meteorological office sets up early warning system. Available at https://www.dw.com/en/after-a-year-of-record-droughts-germanys-meteorological-office-sets-up-early-warning-system/a-48062197 (07 Nov 2019).
Deutscher Wetterdienst (DWD). 2019. Pressemitteilung zur Klima-Pressekonferenz 2019 des DWD. Availa-ble at: https://www.dwd.de/DE/presse/pressemitteilungen/DE/2019/20190326_pressemittei-lung_klima_pk_news.html
Deutschlandfunk. 2019. Wie Unternehmen sich gegen Niedrigwasser rüsten. Available at https://www.deutschlandfunk.de/hitzesommer-wie-unternehmen-sich-gegen-niedrigwasser-ru-esten.766.de.html?dram:article_id=452485 (07 November 2019).
Disaster Management Centre of Sri Lanka. 2018. Sri Lanka Flood Situation update 28-05-2018 1200hrs. Available at http://www.dmc.gov.lk/index.php?option=com_content&view=article&id=113:sri-lanka-flood-situation-update-28-05-2018-1200hrs&catid=17&lang=en&Itemid=232 (7.11.2019)
Donat, M.G., Lowry, A.L., Alexander, L.V., O’Gorman, P.A. & Maher, N. 2016. More extreme precipitation in the world’s dry and wet regions. Nature Climate Change, 6, 508-513.
Earth observatory. 2019. Heatwave in India. Available at https://earthobservatory.nasa.gov/im-ages/145167/heatwave-in-india (27 Nov 2019).
Eckstein, D., Hutfils, M.-L., Winges, M. 2018. Global Climate Risk Index 2019. Available at https://ger-manwatch.org/en/16046 (07 Nov 2019).
European Environment Agency. 2015. Agriculture and climate change. Available at https://www.eea.eu-ropa.eu/signals/signals-2015/articles/agriculture-and-climate-change (07 Nov 2019).
European Environment Agency. 2019. Climate change adaptation in the agriculture sector in Europe. EEA report 04/2019. Available at https://www.eea.europa.eu/publications/cc-adaptation-agricul-ture/at_download/file (07 Nov 2019).
FAZ. 2018a. Dieser Sommer ist kein Grund zur Freude. Available at https://www.faz.net/aktuell/wis-sen/leidende-natur-oekologisch-steht-der-sommer-2018-auf-der-dunklen-seite-15844748.html?printPagedArticle=true#pageIndex_0 (6 Nov 2019).
FAZ. 2018b. Die schlimmste Flut seit 100 Jahren. Available at https://www.faz.net/aktuell/gesell-schaft/ungluecke/mehr-als-300-tote-in-indien-die-schlimmste-flut-seit-100-jahren-15744030.html (5 Nov 2019).
FAZ. 2019. Deutscher Wetterdienst bestätigt neuen Hitzerekord. Available at https://www.faz.net/ak-tuell/gesellschaft/deutscher-wetterdienst-bestaetigt-neuen-hitzerekord-von-42-6-grad-16303898.html (07 Nov 2019).
Fiji Metheorological Service. 2018. Media Release No. 35. Available at https://reliefweb.int/sites/re-liefweb.int/files/resources/HR35.pdf. (8 Nov 2019).
Fijian Broadcasting Corporation. 2019. TC Gita damage cost stands at $1.23. Available at https://www.fbcnews.com.fj/news/tc-gita-damage-cost-stands-at-1-23m/. (8.Nov 2019).
FloodList. 2018a. PM Warns of Constant Threat of Extreme Weather Events as Storm Josie Death Toll Rises. Available at http://floodlist.com/australia/fiji-pm-warns-of-constant-threat-extreme-weather-events-storm-josie-april-2018. (8 Nov 2019).

29
FloodList. 2018b. Thousands Displaced by Tropical Cyclone Keni. Available at http://floodlist.com/aus-tralia/fiji-tropical-cyclone-keni-april-2018. (8 Nov 2019).
FloodLIst. 2018c. Thousands Evacuated After Snowmelt Floods in British Columbia. Available at http://floodlist.com/america/canada-british-columbia-snowmelt-floods-may-2018 (27 Nov 2019).
FloodList. 2018d. Deadly Storm Dumps 350mm of Rain in 24 Hours. Available at http://flood-list.com/asia/sri-lanka-deadly-storm-floods-may-2018 (7 Nov 2019).
FloodList. 2018e. Sri Lanka – Floods and Storms Leave 9 Dead and 5,000 Displaced. Available at http://floodlist.com/asia/sri-lanka-floods-october-2018 (7 Nov 2019).
Focus. 2019."Die Wälder sind knochentrocken": Extreme Waldbrandgefahr in ganz Deutschland. Availa-ble at https://www.focus.de/wissen/natur/waldbrandgefahr-so-zerstoert-die-hitze-unsere-waelder-und-wiesen_id_10952924.html (24 Nov 2019).
Forestry.com. 2018. Forest fires in Sweden - huge areas burned in 2018. Available at https://www.for-estry.com/editorial/forest-fires-sweden/ (27 Nov 2019).
Funk, C.; Shukla, S.; Hoell, A., Livneh, B. 2016. Assessing the Contributions of East African and West Pacific Warming to the 2014 Boreal Spring East African Drought. Bull. Amer. Meteor. Soc., 97 (12), 75-80.
Future Earth. 2019. Issue brief Heatwave. Available at https://futureearth.org/wp-content/up-loads/2019/07/issuebrief_07_11.pdf (27 Nov 2019).
GDV – Gesamtverband der Deutschen Versicherungswirtschaft. 2019. Die Schäden sind schon da. Availa-ble at https://www.gdv.de/de/themen/news/-die-schaeden-sind-schon-da--45454 (11 Nov 2019).
Germanwatch. 2019. Climate risk insurance and informal-risk sharing. A Critical Literature Appraisal. Mu-nich Climate Insurance Initiative Discussion Paper. Forthcoming.
Gessler, A. 2019. Auswirkungen der Hitzewelle auf Wälder, Wasserressourcen und Landwirtschaft. Availa-ble at https://www.sciencemediacenter.de/alle-angebote/rapid-reaction/details/news/auswir-kungen-der-hitzewelle-auf-waelder-wasserressourcen-und-landwirtschaft/ (24 Nov 2019)
Global Food Security Programme. 2015. Extreme weather and resilience of the global food system. Avail-able at https://www.foodsecurity.ac.uk/publications/extreme-weather-resilience-global-food-sys-tem.pdf (24 Nov 2019).
Global Commission on Adaptation. 2019. Adapt Now: A Global Call for Leadership on climate Resilience. Global Center for Adaptation/ World Resources Institute: Rotterdam/Washington.
Government of Canada. 2018. Canada‘s Top weather stories of 2018. Available at https://www.can-ada.ca/en/environment-climate-change/services/top-ten-weather-stories/2018.html (8 Nov 2019).
Government of Fiji. 2018. Hon pm bainimarama's statement on cyclone assistance relief effort (care) for fiji. Available at https://www.fiji.gov.fj/Media-Centre/Speeches/HON-PM-BAINIMARAMA-S-STATE-MENT-ON-CYCLONE-ASSISTAN (08 Nov 2019).
Haines, A., Kovats, R.S., Campbell-Lendrum, D., Corvalan, C. 2006. Climate change and human health: impacts, vulnerability, and mitigation. Lancet 367 (9528), 2101–2109.
Hajat, S., O’Connor, M., Kosatsky, T. 2010. Health effects of hot weather: from awareness of risk factors to effective health protection. Lancet 375: 856–63.
Ham, Y.-G. 2018. El Niño events will intensify under global warming. Nature 564. 192-193. Available at https://www.nature.com/articles/d41586-018-07638-w#ref-CR3 (08 Nov 2019).
Handelsblatt. 2019. Druck auf die GroKo steigt, die energetische Gebäudesanierung steuerlich zu fördern. Handelsblatt. Available at https://www.handelsblatt.com/politik/deutschland/klimaschutz-druck-auf-die-groko-steigt-die-energetische-gebaeudesanierung-steuerlich-zu-foer-dern/24272310.html?ticket=ST-85870074-P2ZXOZD7VcfgG1A3FCNk-ap5 (07 Nov 2019).
Hansen, G., Stone, D., Auffhammer, M., Huggel, C., Cramer, W. 2016.Linking local impacts to changes in climate: a guide to attribution.Reg Environ Change 16, 527.

30
Haustein, K., Otto, F., Uhe, P., Allen, M., Cullen, H. 2016.Fast-track extreme event attribution: How fast can we disentangle thermodynamic (forced) and dynamic (internal) contributions? Geophysical Re-search Abstracts, 18, EGU2016-14875, EGU General Assembly 2016.
Herring, S. C., Christidis, N., Hoell, A., Kossin, J. P., Schreck, C. J. III, Stott, P. A., (Eds). 2018. Explaining Extreme Events of 2016 from a Climate Perspective. Bull. Amer. Meteor. Soc., 99 (1).
Huggel, C., Stone, D., Eicken, H., Hansen, G. 2015. Potential and limitations of the attribution of cli-mate change impacts for informing loss and damage discussions and policies. Clim Change 133:453–467.
Hutfils, M.-L. 2019. A Human Rights-based Approach to Climate Risk Insurance. Making Insurance-related Instruments for Climate Risk Management Beneficial to the Poor and Vulnerable. Germanwatch: Berlin/Bonn. Available at https://germanwatch.org/en/16050 (05 Nov 2019).
ILO. 2019. Working on a warmer planet: The impact of heat stress on labour productivity and decent work International Labour Office – Geneva. Available at https://www.ilo.org/wcmsp5/groups/public/---dgreports/---dcomm/---publ/documents/publication/wcms_711919.pdf (27 Nov 2019).
International Institute for Environment and Development. 2018. Introduction to community-based adap-tation to climate change. Available at https://www.iied.org/introduction-community-based-adap-tation-climate-change (16 Nov 2018).
Imbery, F., Friedrich, K., Haeseler, S., Koppe, C., Janssen, W., Bissolli, P. 2018, Vorläufiger Rückblick auf den Sommer 2018 – eine Bilanz extremer Wetterereignisse. Deutscher Wetterdienst: Offenbach a.M. Available at https://www.dwd.de/DE/leistungen/besondereereignisse/tempera-tur/20180803_bericht_sommer2018.pdf?__blob=publicationFile&v=10 (27 Nov 2019).
International Federation of Red Cross and Red Crescent Societies (IFRC). 2018. DREF Emergency Plan of Action (EPoA) Rwanda Floods. Available at https://reliefweb.int/sites/reliefweb.int/files/re-sources/MDRRW016do.pdf (07 Nov 2019).
IPCC. 2012a. Glossary of terms. Available at: https://archive.ipcc.ch/pdf/special-reports/srex/SREX-An-nex_Glossary.pdf (27 Nov 2019).
IPCC. 2012b. Managing the Risks of Extreme Events and Disasters to Advance Climate Change Adaptation. Special Report of the Intergovernmental Panel on Climate Change.IPCC. 2013. Climate Change 2013: The Physical Science Basis. Contribution of Working Group I to the Fifth Assessment Report of the Intergovernmental Panel on Climate Change.
IPCC. 2014a. Summary for policymakers. In: Climate Change 2014: Impacts, Adaptation, and Vulnerability. Part A: Global and Sectoral Aspects. Contribution of Working Group II to the Fifth Assessment Report of the Intergovernmental Panel on Climate Change.
IPCC. 2014b. Africa. In: Climate Change 2014: Impacts, Adaptation and Vulnerability. Part B: Regional As-pects. Contribution of Working Group II to the Fifth Assessment Report of the Intergovernmental Panel on Climate Change. p. 1202 ff.
IPCC. 2014c. Climate Change 2014 Synthesis Report. Available at https://www.ipcc.ch/site/assets/up-loads/2018/02/SYR_AR5_FINAL_full.pdf (20 Nov 2019).
IPCC. 2018a. IPCC Chapter 3: Impacts of 1.5ºC global warming on natural and human systems. In: Global Warming of 1.5 °C. Special Report of the Intergovernmental Panel on Climate Change.
IPCC. 2018b. Summary for Policymakers. In: Global Warming of 1.5 °C. Special Report of the Intergovern-mental Panel on Climate Change.
IPCC. 2019a. An IPCC Special Report on the Ocean and Cryosphere in a Changing Climate. Available at: https://www.ipcc.ch/site/assets/uploads/sites/3/2019/09/SROCC_SPM_HeadlineStatements.pdf
IPCC. 2019b. Climate Change and Land: An IPCC Special Report on climate change, desertification, land degradation, sustainable land management, food security, and greenhouse gas fluxes in terrestrial

31
ecosystems. Available at: https://www.ipcc.ch/site/assets/uploads/2019/08/3.-Summary-of-Head-line-Statements.pdf
Kenya Red Cross. n.d. Flood Victims In Isiolo County Have Their Houses Reconstructed. Available at https://www.redcross.or.ke/media-center-page?id=%27135%27. (07 Nov 2019).
Kilavi, M.; MacLeod, D., Ambani, M., Robbins, J., Dankers, R., Graham, R., Titley, H., Salih, A.A.M., Todd, M.C. 2018. Extreme Rainfall and Flooding over Central Kenya Including Nairobi City during the Long-Rains Season 2018: Causes, Predictability, and Potential for Early Warning and Actions. Atmosp-here.9. 472. pp.7
Kjellstrom, T., Briggs, D., Freyberg, C., et al. 2016. Heat, human performance and occupational health: a key issue for the assessment of global climate change impacts. Annual Review of Public Health 37: 97–112.
Kolb P.F., Robberecht R. 1996. High temperature and drought stress effects on survival of Pinus ponder-osa seedlings. Tree Physiology 16, 665–672.
Kravchenko, J., Abernethy, A., Fawzy, M., et al. 2013. Minimization of heatwave morbidity and mortality. American Journal of Preventive Medicine 44(3): 274–82.
Kulp, S., Strauss, B. 2019. New elevation data triple estimates of global vulnerability to sea-level rise and coastal flooding. Available at https://www.nature.com/articles/s41467-019-12808-z. (27 Nov 2019).
Le Monde. 2018. Le bilan du cyclone Ava à Madagascar s’élève à 51 morts. Available at https://www.lemonde.fr/climat/article/2018/01/15/le-bilan-du-cyclone-ava-a-madagascar-s-eleve-a-51-morts_5241747_1652612.html (07 Nov 2019)
Lehmann, J.; Coumou, D., Frieler, K. 2015.Increased record-breaking precipitation events under global warming. Climate Change, 132(4), 501-515.
Loughnan, M., Nicholls, N., Tapper, N. 2010. Mortality-temperature thresholds for ten major population centres in rural Victoria, Australia. Health Place 16 (6), 1287–1290.
Louis, K.-P. 2018. The World Wants Air-Conditioning. That Could Warm the World. New York Times. Avail-able at https://www.nytimes.com/2018/05/15/climate/air-conditioning.html (07 Nov 2019).
Mann, M.E., Rahmstorf, S., Kornhuber, K., Steinman, B.A., Miller, S.K., Petri, S., Coumou, D. 2018. Science Advances 4 (10) Availabale at https://advances.sciencemag.org/content/4/10/eaat3272 (20 Nov 2019).
Maplecroft. 2012. Climate Change Vulnerability Index. Available at www.maplecroft.com/about/news/ccvi.html (16 Nov 2018).
Martiello, M.A., Giacchi, M.V., 2010. High temperatures and health outcomes: a review of the literature. Scand. J. Public Health 38 (8), 826–837.
McDonald, R. I. 2018. Urban Heat Waves, Climate Change, Air Conditioning, and the Value of Urban For-ests for Shade: A Feedback Loop (abstract). American Geophysical Union, Fall Meeting 2018. Avail-able at https://ui.adsabs.harvard.edu/abs/2018AGUFMGC31G1326M/abstract (07 November 2019).
Ministry of Irrigation and Water Resources and Disaster Management Centre. 2018. Summary situation report Sri Lanka 28th may 2018 12:00hrs. Available at http://www.dmc.gov.lk/images/dmcre-ports/20180528_Sri_Lanka_Situation_Impact_1200hours_Final__1527495971.pdf (07 Nov 2019).
Mitchell, D., Heaviside, C., Vardoulakis, S., Huntingford, C., Masato, G., Guillod,B.P., Frumhoff, P., Bowery, A., Wallom, D., Allen, M. 2016. Attributing human mortality during extreme heat waves to anthropo-genic climate change. Environmental Research Letters 11 (7).
MunichRE. 2016. NatCatSERVICE. Downloadcenter for statistics on natural catastrophes. Available at www.munichre.com/en/reinsurance/business/non-life/natcatservice/index.html (27 Nov 2019).

32
Munich RE. 2017a. Hurrikan Maria: Mit jedem Tag mehr Schäden. Available at www.munichre.com/topics-online/de/climate-change-and-natural-disasters/natural-disas-ters/storms/hurricane-maria-2017.html (16 Nov 2018).
Munich RE. 2017b. Hurrikan Harvey: Sintflut überschwemmt Houston. Available at www.munichre.com/topics-online/de/climate-change-and-natural-disasters/natural-disas-ters/storms/hurricane-harvey-2017.html (16 Nov 2018).
Munich RE. 2018. Hurricanes cause record losses in 2017: The year in figures. Available at https://www.munichre.com/topics-online/en/climate-change-and-natural-disasters/natural-dis-asters/2017-year-in-figures.html (11 Nov 2019).
National Academies of Sciences, Engineering, and Medicine. 2016. Attribution of Extreme Weather Events in the Context of Climate Change. Washington, DC: The National Academies Press.
Nature Climate Change. 2018. Feeling the heat. Available at https://www.nature.com/articles/s41558-018-0169-y.pdf
NDRC. 2013. Rising Temperatures, Deadly Threat: Recommendations for Slum Communities in Ahmed-abad. NRDC Issue Brief March 2013. Natural Resources Defense Council: Washington D.C.
Neue Zürcher Zeitung. 2017. Peru kämpft gegen sintflutartige Regenfälle. Available at www.nzz.ch/panorama/kuesten-el-nino-peru-kaempft-gegen-sintflutartige-regenfaelle-ld.153881 (16 Nov 2018).
New Scientist. 2018. Warming Arctic could be behind heatwave sweeping northern hemisphere. Availa-ble at https://www.newscientist.com/article/2174889-warming-arctic-could-be-behind-heatwave-sweeping-northern-hemisphere/#ixzz64J7Ge2Yh (14 Nov 2019).
NT-V. 2018. Tankstellen geht der Sprit aus. Available at https://www.n-tv.de/wirtschaft/Tankstellen-geht-der-Sprit-aus-article20696504.html (07 Nov 2019).
OCHA. 2012. Myanmar: Natural Disasters 2002-2012. Available at http://reliefeb.int/sites/re-liefweb.int/files/resources/Myanmar-Natural%20Disasters-2002-2012.pdf (16 Nov 2018).
OCHA. 2018. Flash Update #3. Tropical storm hits Madagascar. Available at https://reliefweb.int/sites/re-liefweb.int/files/resources/ROSEA_180319_FlashUpdate3_TropicalStormEliakim_Madagascar.pdf (07 Nov 2019).
OECD. 2019. Climate Finance Provided and Mobilised by Developed Countries in 2013-17, OECD Publish-ing: Paris. Available at https://doi.org/10.1787/39faf4a7-en (07 Nov 2019).
Otto, F.E.L., Boyd, E., Jones, R.G., Cornforth, R.J., James, R., Parker, H.R., Allen, M.R. 2015. Attribution of extreme weather events in Africa: a preliminary exploration of the science and policy implications. Clim Change 132:531–543.
Patel, S. 2018. Intense Summer Heatwaves Rattle World’s Power Plants. Available at https://www.powermag.com/intense-summer-heatwaves-rattle-worlds-power-plants/ (07 Nov 2019).
Perkins-Kirkpatrick, S. E., King, A. D., Cougnon, E.A., Grosese, M.R., Oliver,E.C.J., N. J. Holbrook, S. C. Lewis, Pourasghar, F. 2018. The Role of Natural Variability and Anthropogenic Climate Change in the 2017/18 Tasman Sea Marine Heatwave.
Popular Mechanics. 2019. How Heat Waves Work (and Why They're Getting Worse). Available at https://www.popularmechanics.com/science/environment/a28638742/what-is-a-heat-wave/ (14 Nov 2019).
Pramova, E. 2012. Forests and adaptation in a nutshell. Available at https://www.wea-dapt.org/knowledge-base/forests-and-climate-change/forests-and-adaptation (17 Nov 2019).
Puerto Rico Climate Change Council (PRCCC). 2013. Puerto Rico’s State of the Climate 2010-2013: As-sessing Puerto Rico’s Social-Ecological Vulnerabilities in a Changing Climate. San Juan: Puerto Rico

33
Coastal Zone Management Program, Department of Natural and Environmental Resources, NOAA Office of Ocean and Coastal Resource Management.
Reuters. 2017. More rain and pain expected as Thai flood death toll rises to 40. Available at www.reu-ters.com/article/us-thailand-floods-idUSKBN14Z049(16 Nov 2018).
Reuters. 2018. In India's parched Bundelkhand, drought brings a tide of migration. Available athttps://news.trust.org/item/20180705064417-wk8ls/ (27 Nov 2019).
Salagnac, J.-L. 2007. Lessons from the 2003 Heat Wave. A French Perspective. Building Research & Infor-mation 35 (4), 450-457.
Scinexx. 2018. Hitzesommer 2018 brach Rekorde. Available at https://www.scinexx.de/news/geowis-sen/hitzesommer-2018-brach-rekorde/ (06 Nov 2019).
Stott, P.A., Christidis, N., Otto, F.E.L., Sun, Y., Vanderlinden, J., van Oldenborgh, J.G., Vautard, R., von Storch, H., Walton, P., Yiou, P., Zwiers, F.W. 2015. Attribution of extreme weather and climate-related events. WIREs Clim Change 2016, 7, 23–41.
Tagesspiegel. 2019. Die Politik denkt über Versicherungen für Bauern nach. Tagesspiegel. Available at https://www.tagesspiegel.de/wirtschaft/der-zweite-duerresommer-droht-die-politik-denkt-ueber-versicherungen-fuer-bauern-nach/24469444.html (11 Nov 2019).
Teskey, R., Wertin, T., Bauweraerts, I., Ameye, M., McGuire, M., Steppe, K. 2015. Review: Responses of tree species to heat waves and extreme heat events. Plant, Cell and Environment (2015) 38, 1699–1712.
The Guardian. 2018a. India slashes heatwave death toll with series of low-cost measures. Available at https://www.theguardian.com/world/2018/jun/02/india-heat-wave-deaths-public-health-measures (27 Nov 2019).
The Guardian. 2018b. Kerala floods: death toll rises to at least 324 as rescue effort continues. Available at https://www.theguardian.com/world/2018/aug/17/kerala-floods-death-toll-rescue-effort-india (8 Nov 2019).
The Guardian. 2018c. Lethal flash floods hit east African countries already in dire need. Available at https://www.theguardian.com/global-development/2018/may/08/deadly-flash-floods-east-af-rica-dire-need-kenya-rwanda-somalia (07 Nov 2019).
The Guardian. 2018d. Typhoon Jebi: Japan hit by strongest storm for 25 year. Available at https://www.theguardian.com/world/2018/sep/04/typhoon-jebi-japan-hit-by-strongest-storm-for-25-years (8 Nov 2019).
The Japan Times. 2018. Record 70,000 people rushed to hospitals since April 30 amid scorching Japan heat wave. Available at https://www.japantimes.co.jp/news/2018/08/07/national/science-health/record-70000-people-rushed-hospitals-since-april-30-amid-scorching-japan-heat-wave/#.XcvF80FCfGg (07 Nov 2019).
The Local. 2018. What you need to know about Sweden's historic wildfire outbreak. Available at https://www.thelocal.se/20180717/sweden-battles-most-serious-wildfire-situation-of-modern-times-heres-what-you-need-to-know (27 Nov 2019).
The New York Times. 2019a. Cyclone Idai May Be 'One of the Worst' Disasters in the Southern. Available at https://www.nytimes.com/2019/03/19/world/africa/cyclone-idai-mozambique.html (11 Nov 2019).
The New York Times. 2019b. Storm in Pacific Ocean on Path Toward Japan. Available at https://www.nytimes.com/2019/10/09/world/asia/japan-typhoon-hagibis.html (11 Nov 2019).
The Strait Times. 2018. Earthquakes, rains, heatwave, typhoon: Japan's brutal summer of 2018. Availa-ble at https://www.straitstimes.com/asia/east-asia/earthquakes-rains-heatwave-typhoon-ja-pans-brutal-summer-2018 (6 Nov 2019).

34
The Times of India. 2019. Study Shows Increase in Heatwave Conditions from Next Year. Available at https://weather.com/en-IN/india/news/news/2019-05-20-heatwave-el-nino-india-evapotranspi-ration-soil-el-nino-modoki-central (27 Nov 2019).
The Weather Network. 2018. Canada's most memorable weather moments of 2018. Available at https://www.theweathernetwork.com/news/articles/canadas-wildest-weather-moments-of-2018/120296. (8 Nov 2019).
The World Bank. 2019. Statement on High-Level Meeting on Humanitarian and Recovery Efforts Follow-ing Cyclone Idai. Available at https://www.worldbank.org/en/news/statement/2019/04/11/state-ment-on-high-level-meeting-on-humanitarian-and-recovery-efforts-following-cyclone-idai (11 Nov 2019).
Trenberth, K., Fasullo, J., Shepherd, T. 2015. Attribution of climate extreme events. Nature Climate Change, 5, 725-730.
Trenberth, K. E., Cheng, L., Jacobs, P., Zhang, Y., Fasullo, J. 2018. Hurricane Harvey links to ocean heat content and climate change adaptation. Earth’s Future, 6, 730–744.
UNEP. 2016. The Adaptation Finance Gap Report. Available at http://web.unep.org/adaptationgapreport/2016 (16 Nov 2018).
UNEP. 2018. Human Development Indices and Indicators 2018 Statistical Update. Available at www.hdr.undp.org/en/content/human-development-indices-indicators-2019-statistical-update (16 Nov 2018).
UNEP. 2019. Frontiers 2018/19. Emerging Issues of Environmental Concern. United Nations Environ-ment Programme: Nairobi.
UNFCCC. 2007. Climate Change: Impacts, Vulnerabilities and Adaptation in Developing Countries. Avail-able at https://unfccc.int/resource/docs/publications/impacts.pdf (24 Nov 2019)
UNICEF. 2018. Kenya Humanitarian Situation Report. Available at https://perma.cc/KNT5-GUW4 (07 Nov 2019).
United States Environmental Protection Agency. Heat Island Effect. Available at https://www.epa.gov/heat-islands (08 Nov 2019).
Vogel, M. M., Zscheischler, J., Wartenburger, R., Dee, D., Seneviratne, S. I. 2019. Concurrent 2018 Hot Ex-tremes across Northern Hemisphere due to Human-induced Climate Change. Earth's Future, 7, 692–703. Available at https://doi.org/10.1029/ 2019EF001189 (07 Nov 2019).
Wang, S., Yuan, X., Wu, R. 2018. Attribution of the Persistent Spring-Summer Hot and Dry Extremes Over Northeast China in 2017.
Watts, Nick et al. 2019. The 2019 report of The Lancet Countdown on Health and Climate Change: Ensur-ing that the Health of a Child Born Today is not Defined by a Changing Climate.
Williams, A.P., Abatzoglou, J.,A. Gershunov, A., Guzman-Morales, J.,Bishop, D.A., Balch, J.K. and Let-tenmaier, D.P. 2019. “Observed Impacts of Anthropogenic Climate Change on Wildfire in California”, Earth’s Future. Vol 7, pp. 892-910.
WHO Europe. 2008. Heat health Action Plans. WHO Regional Office for Europe: Copenhagen.
WMO. 2017. (Un)natural Disasters: Communicating Linkages Between Extreme Events and Climate Change. Available at https://public.wmo.int/en/resources/bulletin/unnatural-disasters-communi-cating-linkages-between-extreme-events-and-climate (16 Nov 2018).
World Weather Attribution. 2018a. Devastating rains in Kenya, 2018. Available at https://www.worldweatherattribution.org/devastating-rains-in-kenya/ (07 Nov 2019).
World Weather Attribution. 2018b. Extreme rainfall in Japan, 2018 –a quick look. Available at https://www.worldweatherattribution.org/a-quick-look-at-the-extreme-rainfall-in-japan/ (07 Nov 2019).

35
Wuebbles, D.J., Fahey, D.W., Hibbard, K.A., DeAngelo, B., Doherty, S., Hayhoe, K., Horton, R., Kossin, J.P.,. Taylor, P.C,. Waple, A.M, Weaver, C.P.. 2017. Climate Science Special Report: Fourth National Cli-mate Assessment, Volume I [Wuebbles, D.J., D.W. Fahey, K.A. Hibbard, D.J. Dokken, B.C. Stewart, and T.K. Maycock (eds.)]. U.S. Global Change Research Program, Washington, DC, USA, pp. 12-34.
Yeh, S., Kug, J., Dewitte, B., Kwon, M., Kirtman, B. 2009. El Niño in a changing climate. Nature 461, 511–514.
Yin, Q., Wang, J.F. 2017. The association between consecutive days' heat wave and cardiovascular disease mortality in Beijing, China. BMC Public Health 17.
Yuan, X., Wang, L., Wood, E.F. 2018. Anthropogenic Intensification of Southern African Flash Droughts as exemplified by the 2015&16 season. In: Herring, S. C., N. Christidis, A. Hoell, J. P. Kossin, C. J. Schreck III & P. A. Stott, Eds., 2018: Explaining Extreme Events of 2016 from a Climate Perspective. Bull. Amer. Meteor. Soc., 99 (1), 586–589.
Zeng, Q., Li, G.X., Cui, Y.S., Jiang, G.H., Pan, X.C. 2016. Estimating temperature-mortality exposure-re-sponse relationships and optimum ambient temperature at the multi-city level of China. Int. J. En-viron. Res. Public Health 13 (3).
Zhang, W.-Z., Lin, S., Jiang, X-M.. 2016. Influence of Tropical Cyclones on the Western north Pacific. Bull. Amer. Meteor. Soc., 97 (12), S131-S135.
ZEIT. 2018. Zahlreiche Tote in Indien nach starken Regenfällen. Available at https://www.zeit.de/gesell-schaft/zeitgeschehen/2018-08/monsunregen-indien-tote-ueberschwemmungen (05 Nov 2019).
... did you find this publication interesting and helpful?
You can support the work of Germanwatch with a donation to:
Bank fuer Sozialwirtschaft AG BIC/Swift: BFSWDE33BER IBAN: DE33 1002 0500 0003 212300
Thank you for your support!

Global Climate Risk Index 2020 GERMANWATCH
36
Annexes CRI = Climate Risk Index; GDP = gross domestic product; PPP = purchasing power parity
Table 3: Climate Risk Index for 2018
CRI Rank
Country CRI score
Fatalities in 2018 (Rank)
Fatalities per 100 000 inhab-itants (Rank)
Losses in mil-lion US$ (PPP) (Rank)
Losses per unit GDP in % (Rank)
125 Albania 108.00 102 87 124 124 109 Algeria 93.83 47 76 110 127
80 Angola 76.00 52 72 82 89 135 Antigua and Barbuda 125.00 115 115 135 135
40 Argentina 48.33 61 101 5 11 135 Armenia 125.00 115 115 135 135
43 Australia 49.50 62 86 11 26 49 Austria 56.00 88 89 20 25
135 Azerbaijan 125.00 115 115 135 135 135 Bahrain 125.00 115 115 135 135
98 Bangladesh 85.50 18 79 97 120 135 Barbados 125.00 115 115 135 135 130 Belarus 111.83 115 115 102 112
90 Belgium 81.83 102 112 39 63 135 Belize 125.00 115 115 135 135 101 Benin 88.00 77 77 109 94 135 Bhutan 125.00 115 115 135 135
59 Bolivia 63.50 71 66 62 58 129 Bosnia and Herzegovina 109.67 115 115 113 100 135 Botswana 125.00 115 115 135 135
91 Brazil 82.83 38 105 43 103 135 Brunei Darussalam 125.00 115 115 135 135 116 Bulgaria 101.00 115 115 85 88 135 Burkina Faso 125.00 115 115 135 135
25 Burundi 36.33 50 32 72 16 38 Cambodia 47.67 29 17 79 72
122 Cameroon 105.83 64 91 129 130 9 Canada 21.83 13 19 12 34
135 Cape Verde 125.00 115 115 135 135 73 Central African Republic 71.17 77 51 116 66
135 Chad 125.00 115 115 135 135 87 Chile 81.17 115 115 36 53 33 China 45.17 5 94 4 37 75 Chinese Taipei 72.33 53 65 55 98 53 Colombia 61.00 20 39 70 99
135 Comoros 125.00 115 115 135 135 96 Costa Rica 84.67 93 82 87 82
106 Côte d'Ivoire 89.50 46 55 125 128 126 Croatia 108.33 115 115 101 102
76 Cyprus 73.50 81 13 120 107 35 Czech Republic 46.83 71 63 28 28 68 Democratic Republic of Congo 69.83 24 69 91 83
135 Democratic Republic of Ti-mor-Leste
125.00 115 115 135 135
55 Denmark 61.33 93 88 33 33 31 Djibouti 44.67 93 27 81 20
135 Dominica 125.00 115 115 135 135 99 Dominican Republic 86.50 81 84 84 93
112 Ecuador 97.00 62 73 122 126 131 Egypt 113.67 115 115 93 122

Global Climate Risk Index 2020 GERMANWATCH
37
CRI Rank
Country CRI score
Fatalities in 2018 (Rank)
Fatalities per 100 000 inhab-itants (Rank)
Losses in mil-lion US$ (PPP) (Rank)
Losses per unit GDP in % (Rank)
30 El Salvador 44.33 71 49 49 24 135 Eritrea 125.00 115 115 135 135 108 Estonia 90.50 115 115 76 61 111 Eswatini 96.67 102 54 128 121
57 Ethiopia 62.83 26 70 63 74 10 Fiji 22.50 64 6 47 6
135 Finland 125.00 115 115 135 135 34 France 46.17 32 62 13 54
135 Gabon 125.00 115 115 135 135 113 Georgia 97.83 115 115 92 75
3 Germany 13.83 3 1 6 36 65 Ghana 68.33 22 24 108 116 11 Greece 23.67 14 4 38 41 70 Grenada 70.50 102 5 127 92 83 Guatemala 77.33 102 113 46 45
135 Guinea 125.00 115 115 135 135 37 Guinea-Bissau 47.50 55 7 112 52
135 Guyana 125.00 115 115 135 135 104 Haiti 88.67 81 85 111 85
45 Honduras 51.67 48 25 78 67 123 Hungary 107.17 81 81 134 133 135 Iceland 125.00 115 115 135 135
5 India 18.17 1 34 2 19 64 Indonesia 68.17 11 74 42 104 66 Iraq 68.50 41 58 64 95 81 Ireland 76.50 93 80 54 76 24 Islamic Republic of Afghani-
stan 36.00 15 21 61 49
60 Islamic Republic of Iran 64.83 48 100 21 60
106 Israel 89.50 60 41 131 132 21 Italy 33.67 28 56 8 27
128 Jamaica 109.50 115 115 118 97 1 Japan 5.50 2 2 3 12
50 Jordan 56.33 38 16 94 87 115 Kazakhstan 98.50 115 115 66 90
7 Kenya 19.67 12 23 26 17 135 Kiribati 125.00 115 115 135 135
81 Korea, Republic of 76.50 34 57 75 118 135 Kosovo 125.00 115 115 135 135
57 Kuwait 62.83 102 102 25 23 134 Kyrgyz Republic 117.50 102 106 133 129
22 Lao People's Democratic Re-public
35.50 26 8 69 51
44 Latvia 50.00 102 75 32 8 62 Lebanon 67.17 50 18 105 106 56 Lesotho 61.50 58 11 121 84
135 Liberia 125.00 115 115 135 135 135 Libya 125.00 115 115 135 135
19 Lithuania 29.33 77 28 23 10 95 Luxembourg 84.33 115 115 65 48
4 Madagascar 15.83 17 20 30 4 93 Malawi 83.67 77 96 95 69 97 Malaysia 84.83 45 61 96 123
118 Maldives 103.33 115 115 119 78 135 Mali 125.00 115 115 135 135 135 Malta 125.00 115 115 135 135

Global Climate Risk Index 2020 GERMANWATCH
38
CRI Rank
Country CRI score
Fatalities in 2018 (Rank)
Fatalities per 100 000 inhab-itants (Rank)
Losses in mil-lion US$ (PPP) (Rank)
Losses per unit GDP in % (Rank)
135 Marshall Islands 125.00 115 115 135 135 116 Mauritania 101.00 115 115 107 77
84 Mauritius 78.83 115 115 68 30 26 Mexico 37.67 10 44 14 57
135 Micronesia 125.00 115 115 135 135 135 Moldova 125.00 115 115 135 135
17 Mongolia 26.67 64 22 34 9 114 Montenegro 98.17 115 115 104 70 135 Morocco 125.00 115 115 135 135
54 Mozambique 61.17 56 78 71 42 48 Myanmar 53.83 20 43 59 79 85 Namibia 79.17 88 40 115 96 20 Nepal 29.67 8 10 56 47 62 Netherlands 67.17 81 99 24 50 46 New Zealand 53.17 88 68 37 29 52 Nicaragua 60.17 64 42 83 65 27 Niger 39.67 31 26 77 39 18 Nigeria 28.83 7 31 16 44
135 North Macedonia 125.00 115 115 135 135 94 Norway 84.00 102 104 48 73 13 Oman 24.33 71 30 9 3
100 Pakistan 87.83 19 90 90 119 92 Panama 83.33 75 37 117 117
135 Papua New Guinea 125.00 115 115 135 135 127 Paraguay 109.33 102 107 114 113 110 Peru 94.00 64 97 86 110
2 Philippines 11.17 4 14 7 14 41 Poland 49.00 42 60 22 55 72 Portugal 70.67 88 92 40 56
124 Puerto Rico 107.67 115 115 99 101 135 Qatar 125.00 115 115 135 135 135 Republic of Congo 125.00 115 115 135 135
28 Republic of Yemen 41.33 35 38 57 40 89 Romania 81.67 58 67 80 109 79 Russia 75.50 44 103 31 86
8 Rwanda 21.17 16 9 51 21 70 Samoa 70.50 115 115 74 2
103 Saudi Arabia 88.50 37 48 130 134 120 Senegal 104.50 115 115 100 91
61 Serbia 65.50 93 93 44 35 135 Seychelles 125.00 115 115 135 135 135 Sierra Leone 125.00 115 115 135 135 135 Singapore 125.00 115 115 135 135 102 Slovak Republic 88.33 64 36 132 131
51 Slovenia 57.83 93 52 58 46 29 Solomon Islands 43.17 88 12 103 22 47 South Africa 53.33 53 95 15 31
133 South Sudan 116.00 115 115 123 114 38 Spain 47.67 33 53 19 64
6 Sri Lanka 19.00 36 29 10 5 135 St. Kitts and Nevis 125.00 115 115 135 135 135 St. Lucia 125.00 115 115 135 135 135 St. Vincent and the Grena-
dines 125.00 115 115 135 135
42 Sudan 49.33 30 45 52 62 135 Suriname 125.00 115 115 135 135 105 Sweden 89.00 102 111 50 80

Global Climate Risk Index 2020 GERMANWATCH
39
CRI Rank
Country CRI score
Fatalities in 2018 (Rank)
Fatalities per 100 000 inhab-itants (Rank)
Losses in mil-lion US$ (PPP) (Rank)
Losses per unit GDP in % (Rank)
77 Switzerland 73.67 93 98 35 59 73 Tajikistan 71.17 75 64 88 68 68 Tanzania 69.83 42 71 73 81 67 Thailand 68.83 25 59 60 105
135 The Bahamas 125.00 115 115 135 135 135 The Gambia 125.00 115 115 135 135 135 Togo 125.00 115 115 135 135
15 Tonga 25.17 102 3 41 1 88 Trinidad and Tobago 81.33 115 115 67 38 35 Tunisia 46.83 56 47 45 43 85 Turkey 79.17 40 83 53 108
135 Tuvalu 125.00 115 115 135 135 14 Uganda 24.67 23 35 29 13
121 Ukraine 105.33 93 114 89 111 135 United Arab Emirates 125.00 115 115 135 135
78 United Kingdom 73.83 64 110 17 71 12 United States 23.83 6 50 1 18 23 Uruguay 35.67 81 46 27 7
135 Uzbekistan 125.00 115 115 135 135 31 Vanuatu 44.67 102 15 106 15
119 Venezuela 104.17 81 108 98 115 16 Vietnam 26.17 9 33 18 32
135 Zambia 125.00 115 115 135 135 132 Zimbabwe 114.50 93 109 126 125
Table 4: Climate Risk Index for 1999–2018
Exemplary calculation: Albania ranks 137th in fatalities among all countries analysed in this study, 130th in Fa-talities per 100 000 inhabitants, 114th in losses and 87th in losses per unit GDP. Hence, its CRI Score is calcu-lated as follows:
CRI Score = 137 x 1/6 + 130 x 1/3 + 114 x 1/6 + 87 x 1/3 = 114.17
CRI Rank Country CRI
score
Fatalities 1999-2018 (Rank)
Fatalities per 100 000 inhabitants 1999-2018 (Rank)
Losses in mil-lion US$ (PPP) 1999-2018 (Rank)
Losses per unit GDP in % 1999-2018 (Rank)
129 Albania 114.17 137 130 114 87 99 Algeria 92.50 35 66 84 152
103 Angola 97.00 53 69 101 145 47 Antigua and Barbuda 58.00 160 39 98 6 84 Argentina 79.50 62 116 23 80
157 Armenia 145.17 172 172 133 111 33 Australia 50.17 44 63 11 60 44 Austria 55.67 63 48 33 71
146 Azerbaijan 133.67 127 155 99 133 179 Bahrain 171.83 168 168 175 176
7 Bangladesh 30.00 9 37 17 40 151 Barbados 141.67 171 159 157 102 152 Belarus 142.00 109 134 143 166
55 Belgium 63.83 26 13 63 134 32 Belize 48.50 131 25 96 7
149 Benin 141.00 113 140 153 150 103 Bhutan 97.00 134 59 154 88
28 Bolivia 45.33 50 35 58 47

Global Climate Risk Index 2020 GERMANWATCH
40
CRI Rank Country CRI
score
Fatalities 1999-2018 (Rank)
Fatalities per 100 000 inhabitants 1999-2018 (Rank)
Losses in mil-lion US$ (PPP) 1999-2018 (Rank)
Losses per unit GDP in % 1999-2018 (Rank)
66 Bosnia and Herzegovina 70.17 125 115 40 13 145 Botswana 132.33 151 150 125 109
88 Brazil 83.17 21 108 16 123 175 Brunei Darussalam 169.17 168 154 179 180
67 Bulgaria 70.83 85 89 48 57 106 Burkina Faso 99.33 92 125 110 72
71 Burundi 73.67 81 82 119 39 12 Cambodia 35.33 40 34 52 26
147 Cameroon 133.83 87 135 138 154 95 Canada 88.17 76 133 15 86
155 Cape Verde 143.50 162 126 169 139 159 Central African Republic 149.33 139 151 167 144 110 Chad 100.83 106 128 105 69
93 Chile 87.83 83 121 36 83 43 China 55.50 5 104 2 59 41 Chinese Taipei 54.83 33 45 28 89 44 Colombia 55.67 24 49 32 90
140 Comoros 122.67 144 73 174 136 95 Costa Rica 88.17 94 74 97 95
153 Côte d'Ivoire 142.67 91 143 151 164 31 Croatia 48.33 55 19 65 66
144 Cyprus 129.67 150 101 146 140 85 Czech Republic 79.67 90 107 34 70
141 Democratic Republic of Congo 125.83 46 118 149 162
177 Democratic Republic of Timor-Leste
170.33 168 167 176 172
126 Denmark 112.83 147 162 44 81 64 Djibouti 69.50 113 31 140 51 10 Dominica 32.33 116 2 72 1 50 Dominican Republic 58.50 52 36 69 79
100 Ecuador 92.83 69 84 86 117 156 Egypt 143.67 77 158 121 174
25 El Salvador 42.50 65 41 54 27 122 Eritrea 109.17 164 170 107 22 158 Estonia 148.83 155 148 144 149 115 Eswatini 103.50 151 119 124 54
56 Ethiopia 64.67 29 91 53 62 13 Fiji 37.17 89 15 80 12
166 Finland 155.67 163 169 113 160 15 France 38.00 4 8 12 98
174 Gabon 167.33 155 153 181 181 102 Georgia 94.17 115 96 106 76
17 Germany 38.67 10 23 6 85 113 Ghana 102.50 56 81 115 141
82 Greece 78.83 71 70 50 106 21 Grenada 39.83 128 7 91 3 16 Guatemala 38.33 31 27 45 50
170 Guinea 161.33 132 161 172 171 124 Guinea-Bissau 111.33 140 103 158 82 120 Guyana 107.17 160 142 127 36
3 Haiti 13.83 15 4 42 9 42 Honduras 55.00 66 52 76 42 61 Hungary 69.00 59 47 59 101
177 Iceland 170.33 172 172 170 168 17 India 38.67 3 55 3 58 77 Indonesia 76.83 16 92 21 120
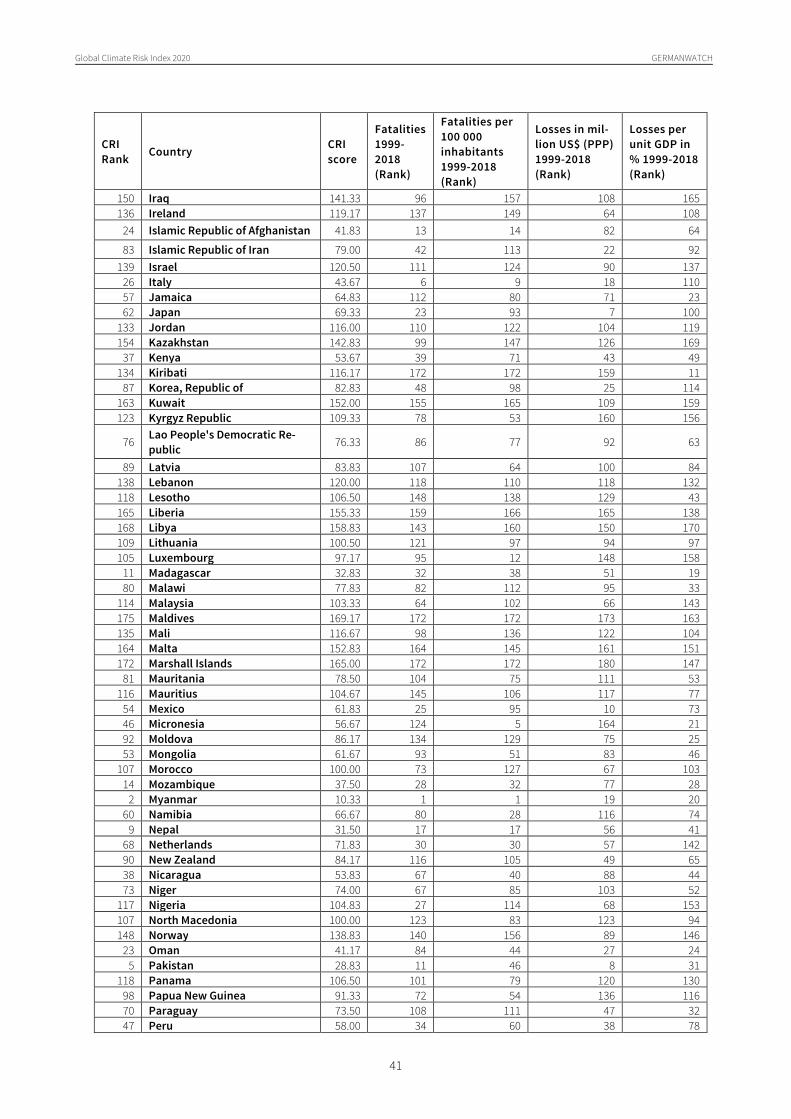
Global Climate Risk Index 2020 GERMANWATCH
41
CRI Rank Country CRI
score
Fatalities 1999-2018 (Rank)
Fatalities per 100 000 inhabitants 1999-2018 (Rank)
Losses in mil-lion US$ (PPP) 1999-2018 (Rank)
Losses per unit GDP in % 1999-2018 (Rank)
150 Iraq 141.33 96 157 108 165 136 Ireland 119.17 137 149 64 108
24 Islamic Republic of Afghanistan 41.83 13 14 82 64
83 Islamic Republic of Iran 79.00 42 113 22 92 139 Israel 120.50 111 124 90 137
26 Italy 43.67 6 9 18 110 57 Jamaica 64.83 112 80 71 23 62 Japan 69.33 23 93 7 100
133 Jordan 116.00 110 122 104 119 154 Kazakhstan 142.83 99 147 126 169
37 Kenya 53.67 39 71 43 49 134 Kiribati 116.17 172 172 159 11
87 Korea, Republic of 82.83 48 98 25 114 163 Kuwait 152.00 155 165 109 159 123 Kyrgyz Republic 109.33 78 53 160 156
76 Lao People's Democratic Re-public 76.33 86 77 92 63
89 Latvia 83.83 107 64 100 84 138 Lebanon 120.00 118 110 118 132 118 Lesotho 106.50 148 138 129 43 165 Liberia 155.33 159 166 165 138 168 Libya 158.83 143 160 150 170 109 Lithuania 100.50 121 97 94 97 105 Luxembourg 97.17 95 12 148 158
11 Madagascar 32.83 32 38 51 19 80 Malawi 77.83 82 112 95 33
114 Malaysia 103.33 64 102 66 143 175 Maldives 169.17 172 172 173 163 135 Mali 116.67 98 136 122 104 164 Malta 152.83 164 145 161 151 172 Marshall Islands 165.00 172 172 180 147
81 Mauritania 78.50 104 75 111 53 116 Mauritius 104.67 145 106 117 77
54 Mexico 61.83 25 95 10 73 46 Micronesia 56.67 124 5 164 21 92 Moldova 86.17 134 129 75 25 53 Mongolia 61.67 93 51 83 46
107 Morocco 100.00 73 127 67 103 14 Mozambique 37.50 28 32 77 28
2 Myanmar 10.33 1 1 19 20 60 Namibia 66.67 80 28 116 74
9 Nepal 31.50 17 17 56 41 68 Netherlands 71.83 30 30 57 142 90 New Zealand 84.17 116 105 49 65 38 Nicaragua 53.83 67 40 88 44 73 Niger 74.00 67 85 103 52
117 Nigeria 104.83 27 114 68 153 107 North Macedonia 100.00 123 83 123 94 148 Norway 138.83 140 156 89 146
23 Oman 41.17 84 44 27 24 5 Pakistan 28.83 11 46 8 31
118 Panama 106.50 101 79 120 130 98 Papua New Guinea 91.33 72 54 136 116 70 Paraguay 73.50 108 111 47 32 47 Peru 58.00 34 60 38 78

Global Climate Risk Index 2020 GERMANWATCH
42
CRI Rank Country CRI
score
Fatalities 1999-2018 (Rank)
Fatalities per 100 000 inhabitants 1999-2018 (Rank)
Losses in mil-lion US$ (PPP) 1999-2018 (Rank)
Losses per unit GDP in % 1999-2018 (Rank)
4 Philippines 17.67 7 16 9 29 78 Poland 77.17 43 88 30 107 19 Portugal 38.83 20 11 41 75
1 Puerto Rico 6.67 19 3 5 5 181 Qatar 173.67 172 172 168 179 162 Republic of Congo 151.50 130 123 177 178
74 Republic of Yemen 74.67 49 68 81 91 35 Romania 53.17 51 67 24 55 30 Russia 47.67 2 6 14 129
111 Rwanda 102.00 75 72 145 124 71 Samoa 73.67 155 57 141 16
112 Saudi Arabia 102.17 60 94 55 155 142 Senegal 129.50 102 139 135 131
69 Serbia & Montenegro & Kosovo 73.33 97 117 35 37 169 Seychelles 159.50 172 172 171 135
91 Sierra Leone 85.67 57 29 155 122 180 Singapore 172.17 172 172 163 177 121 Slovak Republic 108.00 119 120 79 105
40 Slovenia 54.33 79 26 73 61 65 Solomon Islands 70.00 128 33 156 35 79 South Africa 77.33 47 100 31 93
125 South Sudan 112.50 87 109 128 121 29 Spain 47.33 8 10 26 115 22 Sri Lanka 40.17 36 43 29 45
127 St. Kitts and Nevis 113.50 172 172 137 14 51 St. Lucia 59.33 142 24 132 17 52 St. Vincent and the Grenadines 59.83 148 21 139 15
101 Sudan 93.00 45 87 87 126 173 Suriname 166.00 164 152 178 175 142 Sweden 129.50 136 163 61 127
34 Switzerland 52.33 41 22 37 96 49 Tajikistan 58.17 74 65 85 30
130 Tanzania 114.33 70 132 102 125 8 Thailand 31.00 22 62 4 18
20 The Bahamas 39.67 122 18 60 10 86 The Gambia 81.00 103 50 147 68
160 Togo 149.67 126 146 166 157 75 Tonga 75.67 164 76 130 4
161 Trinidad and Tobago 150.17 153 137 152 161 130 Tunisia 114.33 105 131 93 113 132 Turkey 115.17 61 144 46 148 128 Tuvalu 113.67 172 172 162 2
62 Uganda 69.33 54 90 70 56 94 Ukraine 88.00 38 86 62 128
167 United Arab Emirates 158.33 145 164 131 173 58 United Kingdom 65.00 18 58 20 118 27 United States 44.17 12 78 1 48 97 Uruguay 88.33 120 99 78 67
171 Uzbekistan 162.00 154 171 142 167 38 Vanuatu 53.83 133 20 134 8 59 Venezuela 66.00 37 61 39 99
6 Vietnam 29.83 14 42 13 34 137 Zambia 119.67 100 141 112 112
36 Zimbabwe 53.33 58 56 74 38
Observing. Analysing. Acting.
For Global Equity and the Preservation of Livelihoods.
GermanwatchFollowing the motto of Observing. Analysing. Acting. Germanwatch has been actively promoting global equity and livelihood preservation since 1991. We focus on the politics and economics of the Global North and their worldwide consequences. The situation of marginalised people in the Global South is the starting point for our work. Together with our members and supporters, and with other actors in civil society, we strive to serve as a strong lobbying force for sustainable development. We aim at our goals by advocating for prevention of danger-ous climate change and its negative impacts, for guaran-teeing food security, and for corporate compliance with human rights standards.
Germanwatch is funded by membership fees, donations, programme funding from Stiftung Zukunftsfähigkeit (Foundation for Sustainability), and grants from public and private donors.
You can also help us to achieve our goals by becoming a member or by making a donation via the following ac-count:
Bank für Sozialwirtschaft AG. IBAN: DE33 1002 0500 0003 2123 00. BIC/Swift: BFSWDE33BER
For further information, please contact one of our offices
Germanwatch – Bonn Office Kaiserstrasse 201 D-53113 Bonn, Germany Phone: +49 (0)228 / 60492-0 Fax: +49 (0)228 / 60492-19
Germanwatch – Berlin Office Stresemannstr. 72 D-10963 Berlin, Germany Phone: +49 (0)30 / 2888 356-0 Fax: +49 (0)30 / 2888 356 -1
E-mail: [email protected]
or visit our website:
www.germanwatch.org


![Global Climate Risk Index 2016 [PDF, 850 KB]](https://static.fdocuments.net/doc/165x107/586e23c11a28ab3c168b9a90/global-climate-risk-index-2016-pdf-850-kb.jpg)