2 Vienna 2013 Marble provenance designation with Object ... · as a building stone, ... Marble...
10
Abstract The designation of marble provenance plays an important role in Cultural History, Archeology and Geosciences in general. In the multidisciplinary approach to explore marble provenance, petrography plays a key role. This paper presents a novel method for au- tomatic image analysis of marble micrographs: Object Based Image Analysis (OBIA), via the incorporation of petrographic expert knowledge, enables the reliable extraction of mineral grains and yields a wealth of quantitative shape and texture measures. A work flow is introduced for extracting mineral shape characteristics from marble micrographs, comprising data acquisition, pre-processing and Object Based Image Analysis. Therefore verifiable parameters and analysis supply marble provenance research particularly for multiple sample analysis in an efficient and timely manner. Die Bestimmung der Herkunft von Marmoren ist von großer Bedeutung für Kulturgeschichte, Archäologie und allgemein für die Geowissenschaften. Die Petrographie spielt im multidisziplinären Ansatz der Herkunftsbestimmung eine wichtige Rolle. In diesem Artikel wird eine neue Methode zur automatischen Bildanalyse von Marmor Dünnschliffen präsentiert: Objektbasierte Bildanalyse (OBIA) kann petrographisches Expertenwissen in den Analysevorgang einbeziehen und ermöglicht so, neben einer verlässlichen Extraktion von Mineralkörnern, die Darstellung einer Vielzahl von quantitativen Form- und Texturparametern. Es wird ein Arbeitsablauf zur Extraktion von Formparametern von Calcitkörnern aus Marmordünnschliffen vorgestellt: Datenerfas- sung, Datenvorverarbeitung und Objektbasierte Bildanalyse. Die Analyse liefert nachvollziehbare Ergebnisse und unterstützt dadurch besonders bei Mehrfachprobenauswertung die zeiteffiziente Herkunftsbestimmung von Marmoren. ___________________________________________________________ __________________ __________________________ 1. Introduction 1.1 Marble provenance and its matter for cultural history Throughout cultural history, marble has had great significance as a building stone, as decorative material and, in particular, as material for statues. Marble production and its use have been documented since the Neolithic (Cramer, 2004). Prein- dustrial quarrying of marble began in the Mediterranean coun- tries during the Bronze Age. Advanced skills, techniques and tools which presumably developed under Egyptian influence subsequently spread into surrounding regions; large scale marble quarrying was carried out by the Romans in present- Austrian Journal of Earth Sciences Vienna Volume 106/2 2013 KEYWORDS Object Based Image Analysis Provenance Analysis Micrographs Petrography Marble Marble provenance designation with Object Based Image Analysis: State-of-the-art rock fabric characterization from petrographic micrographs____________________________ 1) Interfaculty Department of Geoinformatics, University of Salzburg, Schillerstr. 30, 5020 Salzburg, Austria; 2) Department of Geography and Geology, University of Salzburg, Hellbrunnerstr. 34, 5020 Salzburg, Austria; 3) Institute of Archaeology, University of Innsbruck, Langer Weg 11, 6020 Innsbruck, Austria; *) Corresponding author, [email protected] Figure 1: Thin section micrographs (parallel polarizers) of marble samples highlighting some fabric features that are important in provenancing. Figure 1a: isotropic sample LAS13, Figure 1b: schistose sample SPE13. Note that the visibility of twin lamellae depends on the rotation of the thin section relative to the polarizing filters. Image length 0.75mm for both images, see text for details.__________________________________________ 1)*) 1) 2)3) 1) Peter HOFMANN , Robert MARSCHALLINGER , Michael UNTERWURZACHER & Fritz ZOBL
Transcript of 2 Vienna 2013 Marble provenance designation with Object ... · as a building stone, ... Marble...
Abstract
The designation of marble provenance plays an important role in Cultural History, Archeology and Geosciences in general. In the
multidisciplinary approach to explore marble provenance, petrography plays a key role. This paper presents a novel method for au-
tomatic image analysis of marble micrographs: Object Based Image Analysis (OBIA), via the incorporation of petrographic expert
knowledge, enables the reliable extraction of mineral grains and yields a wealth of quantitative shape and texture measures. A work
flow is introduced for extracting mineral shape characteristics from marble micrographs, comprising data acquisition, pre-processing
and Object Based Image Analysis. Therefore verifiable parameters and analysis supply marble provenance research particularly for
multiple sample analysis in an efficient and timely manner.
Die Bestimmung der Herkunft von Marmoren ist von großer Bedeutung für Kulturgeschichte, Archäologie und allgemein für die
Geowissenschaften. Die Petrographie spielt im multidisziplinären Ansatz der Herkunftsbestimmung eine wichtige Rolle. In diesem
Artikel wird eine neue Methode zur automatischen Bildanalyse von Marmor Dünnschliffen präsentiert: Objektbasierte Bildanalyse
(OBIA) kann petrographisches Expertenwissen in den Analysevorgang einbeziehen und ermöglicht so, neben einer verlässlichen
Extraktion von Mineralkörnern, die Darstellung einer Vielzahl von quantitativen Form- und Texturparametern.
Es wird ein Arbeitsablauf zur Extraktion von Formparametern von Calcitkörnern aus Marmordünnschliffen vorgestellt: Datenerfas-
sung, Datenvorverarbeitung und Objektbasierte Bildanalyse. Die Analyse liefert nachvollziehbare Ergebnisse und unterstützt dadurch
besonders bei Mehrfachprobenauswertung die zeiteffiziente Herkunftsbestimmung von Marmoren.
___________________________________________________________
__________________
__________________________
1. Introduction
1.1 Marble provenance and its matter for
cultural history
Throughout cultural history, marble has had great significance
as a building stone, as decorative material and, in particular,
as material for statues. Marble production and its use have
been documented since the Neolithic (Cramer, 2004). Prein-
dustrial quarrying of marble began in the Mediterranean coun-
tries during the Bronze Age. Advanced skills, techniques and
tools which presumably developed under Egyptian influence
subsequently spread into surrounding regions; large scale
marble quarrying was carried out by the Romans in present-
Austrian Journal of Earth Sciences ViennaVolume 106/2 2013
KEYWORDS
Object Based Image AnalysisProvenance Analysis
MicrographsPetrography
Marble
Marble provenance designation with Object Based Image Analysis: State-of-the-art rock fabric characterization from petrographic micrographs____________________________
1) Interfaculty Department of Geoinformatics, University of Salzburg, Schillerstr. 30, 5020 Salzburg, Austria;
2) Department of Geography and Geology, University of Salzburg, Hellbrunnerstr. 34, 5020 Salzburg, Austria;
3) Institute of Archaeology, University of Innsbruck, Langer Weg 11, 6020 Innsbruck, Austria;
*) Corresponding author, [email protected]
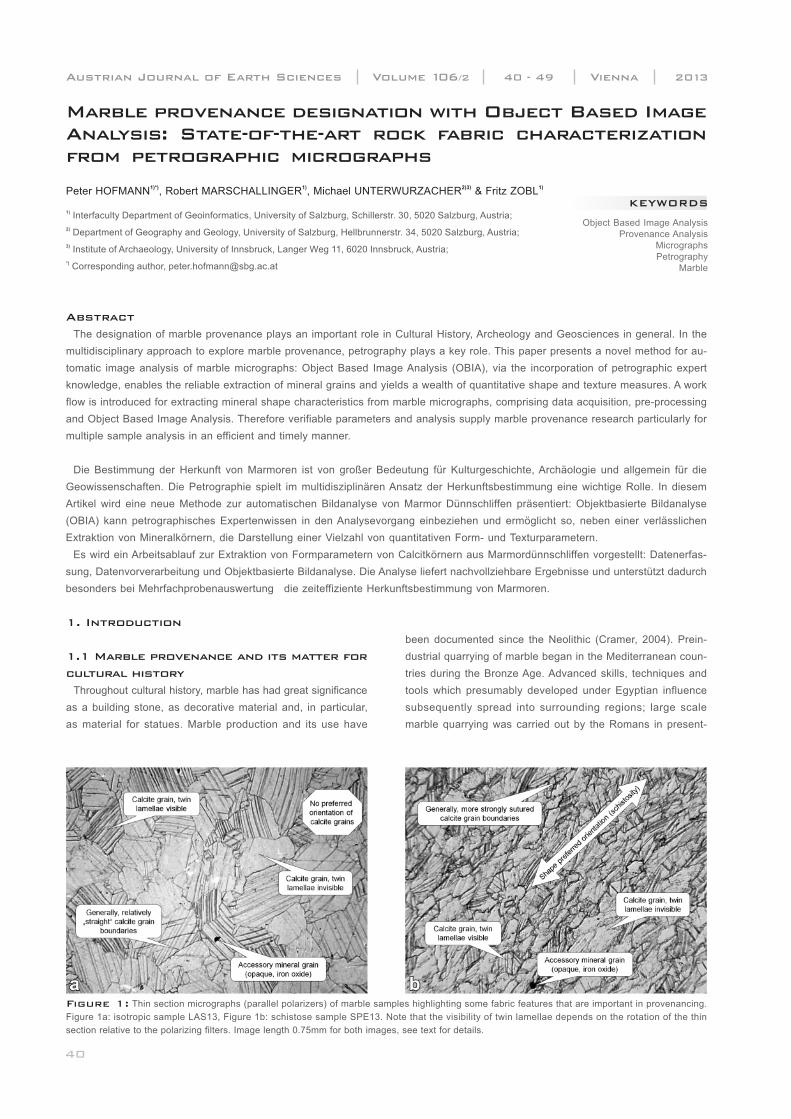
Figure 1: Thin section micrographs (parallel polarizers) of marble samples highlighting some fabric features that are important in provenancing.
Figure 1a: isotropic sample LAS13, Figure 1b: schistose sample SPE13. Note that the visibility of twin lamellae depends on the rotation of the thin
section relative to the polarizing filters. Image length 0.75mm for both images, see text for details.__________________________________________
1)*) 1) 2)3) 1)Peter HOFMANN , Robert MARSCHALLINGER , Michael UNTERWURZACHER & Fritz ZOBL

need to be considered. Furthermore the influence of sculptors,
their schools and studios, and their experience, together with
the origin of builders, political relationships, the importance of
the antique objects to the inhabitants and their financial status
are of vital interest (Cramer, 2004). Since these details are
often unknown, archaeologists and historians consider natural
Peter HOFMANN, Robert MARSCHALLINGER, Michael UNTERWURZACHER & Fritz ZOBL
day Greece, on the Greek Islands but also in Turkey (Cramer,
2004). Material from these quarries can be found in all parts
of the Roman Empire. While the provenance of marble used
in modern buildings is mostly well documented, this is rarely
the case for historical objects. This is particularly true for white
marbles that often look similar, especially from a macroscopic
point. Since mainly the pure marbles were extracted from the
quarries, characteristic colored zones within the quarries or
impurities within single blocks led to a negative selection of
these blocks. This is why marble provenance can only rarely
be designated by macroscopic criteria alone. On the other
hand, knowing the provenance of the material is of utmost im-
portance in archaeology. It helps identifying object together-
ness. Sample complexes, identified by stylistic criteria can be
verified. Results from provenance studies may prove the ex-
traction of material from a specific quarry at a specific time, it
may give an idea on economic relations and travel routes and
sometimes also on workshops and settlements.
The importance of Greek and Roman history has led many
natural scientists to an interest in these subjects, and it was
soon realised that natural sciences are able to provide addi-
tional information to assist with historical interpretations. Marble
samples from potentially used quarries and from archaeologi-
cal/historical objects were subject to comparative studies. The
first petrographic studies for provenance analysis by Lepsius
(1891) were soon followed by many others. Successful pro-
venance studies for classical marbles were published by Craig
and Craig (1972), who used stable isotopes of carbon and
oxygen. Intense sampling programmes followed in the suc-
ceeding years, with many different groups working on the pro-
venance of marbles (Herz, 1988; Gorgoni et al., 2002; Atta-
nasio, 2003; Lazzarini, 2004). Stable isotope studies initially
appeared to be a suitable method for differentiating marble
occurrences, but the more data accumulated, the broader the
isotopic clusters for single quarries and quarry areas were
shown to be. An increasing overlap in the data from different
areas was revealed.
Evidently, a bundle of marble characteristics have to be ta-
ken into account in provenance analysis for obtaining reliable
results. These include material-inherent parameters such as
petrography, mineralogy, geochemistry and isotopy of samp-
les and their possible quarry areas, as well as additional fea-
tures such as their Electron Paramagnetic Resonance (EPR
is a spectroscopic technique for studying materials with un-2+paired electrons. In marbles mainly the Mn peak in the spec-
trum can be significant. A detailed description of the method
and its use in provenancing marbles is given by Attanasio,
2003) and luminescence spectra. In addition, quarry-specific
criteria like the presence of voids, the block sizes, etc. need to
be included. The amount of quarrying, the time of quarrying,
logistic aspects (such as the distance from archaeological ob-
jects), multiple occurrences or quarries in the source region,
and the transport possibilities (navigable rivers, roads, etc.)
__________
_________________________________
1.2 Methods of provenance analysis
Figure 2: Comparing original micrograph stack and results of two-
level segmentation. Figure 2a: original image stack. Figure 2b: base le-
vel, MRS1. Figure 2c: top level, MRS 2. Segmentations created using
parameters from Table 1. Super imposed to all rotated cross polarized
images for reference._______________________________________

Marble provenance designation with Object Based Image Analysis: State-of-the-art rock fabric characterization from petrographic micrographs
Table 1: Parameters used for initial image segmentation.________________________________
Figure 3: Object hierarchy generated after image segmentation (here with three levels of segmen-
tation). Each higher-level object is connected with its sub-objects and vice versa. For higher-level
objects their inner structure can be analyzed by referring to their sub-objects at the next level below._
Table 2: Segmentation parameters for the re-segmentation of the base level (MRS 1)._________
sciences to assist in determining these important parameters.
It is this interdisciplinary aspect of provenance analysis that
makes it so important and exciting. In the field of provenance
analysis in most cases only a combination of the methods
mentioned above leads to a successful provenance determi-
nation. Apart from the use of stable isotopes of C and O men-
tioned above, grain size characteristics and particularly grain
size and morphological analyses of the carbonate grains gai-
ned from thin section analysis play a key role in provenancing
marbles. Using methods of Object Based Image Analysis
(OBIA) support an automated analysis of thin section images
and to incorporate domain expert knowledge. Moreover, OBIA
supports the automated delineation of single grains, to ana-
lyse their shape and interior fabric properties and finally to
deduce typical characteristics of the marble specimen suppor-
ting its determination of provenance. At this background the
paper demonstrates its application for thin section analysis.
In marble provenance analysis, petrography is an important
issue: the proportions of major minerals (calcite, dolomite) and
diverse accessory minerals (mostly quartz, micas, ore mine-
rals), associated grain sizes and grain shapes as well as fabric
characteristics like the abundance of preferred grain elonga-
tion or schistosity can identify a specific quarry or quarry sub-
area. Marble petrography – i.e., the mineralogical composition
and texture properties – can be conveniently derived from
_
2. Materials and methods
2.1 Thin section analysis of marbles
standard (30μm) petrographic thin sections using an optical
microscope (Tröger et al., 1982; Higgins, 2006).
Fig.1 shows typical micrographs of marble thin sections: Fig.
1a is a relatively isotropic sample, while Fig. 1b is anisotropic.
In the current context, the most important grain shape para-
meters are the maximum and the mean grain size of the carbo-
nate grains. Since thin section analysis infers the shape para-
meters of inherently three-dimensional mineral grains from
two-dimensional sections, the measures derived are only ap-
proximations. In consequence, only a large number of mea-
surements yields representative results: per thin section usu-
ally at least 100 long diameters of carbonate grains have to
be measured with the microscope. While this approach yields
quantitative results, there is no clear standard on gauging the
grain size. Going into more detail, also the geometric charac-
teristics of carbonate grains are of major interest: besides
grain size and shape, twinning types and the nature of grain
boundaries have been successfully used as provenance fac-
tors (Unterwurzacher et al., 2005). Grain boundaries can be
straight or sutured, with varying amount of suturing. Relying
on human observation alone, suturing can be at best described
in terms of fuzzy categories such as “straight, weakly sutured
or sutured”. Moreover, given that research groups rarely pro-
vide information on data acquisition procedures, the findings
of different researchers can be related with difficulties only.
Summing up, petrographic microscopy yields important pro-
venance indicators, but the purely human-based approach in-
volves non-documented expert knowledge and is time-con-
suming, subjective and error-prone. An experienced analyst
___________
__
needs approximately 1 hour for mea-
suring 100 grains. Classical, pixel-
based image analysis methods have
been adapted to petrographical mi-
crographs and successfully applied
in many fields of petrographic mi-
croscopy (Bons and Jessell, 1996;
Fueten, 1997; Obara and Kozusni-
kova, 2007). Unfortunately, purely
pixel-based image processing me-
thods do not cover extended analy-
sis of grain shapes like suturing or
grain neighborhood analysis, which
are of interest in the provenancing
of classical marbles.
The marble sample LAS3 origina-
tes from the Weisswasserbruch quar-
ry near the village of Laas (Northern
Italy). The Laas Marble District is one
of the most important marble occur-
rences of the Eastern Alps (e.g. Unter-
wurzacher and Obojes, 2012). LAS3
is a white calcitic marble consisting of
the rock forming mineral calcite and
____________
2.2 Marble sample

data is widely used to generate or update geo-datasets stored
in geo-information systems (“GIS”) (Benz et al., 2004; Lang,
2008). Due to the similarity of objects in OBIA with polygons
in GIS, OBIA has been regarded as the bridging element bet-
ween GIS and remote sensing (Blaschke, 2010). In fact, one
of the strengths of OBIA is to analyze image objects beyond
Peter HOFMANN, Robert MARSCHALLINGER, Michael UNTERWURZACHER & Fritz ZOBL
traces of accessory minerals, mostly quartz and iron oxides.
The marble is fine-grained with weakly sutured grain bounda-
ries. For later comparison with OBIA results, about 100 calcite
grains were manually measured in a LAS3 thin section. This
yielded a mean grain size of 0.7 mm and a maximum grain
size of 1.3 mm.
For image acquisition, a Zeiss Photomicroscope 1 with an
attached Sony Digital Imaging System (resolution 768*576
pixels, color depth 32bit) was used. The microscope is set up
for petrography, with two polarization filters and a rotary stage,
enabling the investigation with plan-polarized light as well as
with crossed (90°) polarizers.
To maximize the microscopic information input to OBIA, we
combined micrographs acquired at different rotations of the
polarization filters. This closely mimics a petrographer‘s ap-
proach to distinguishing minerals in thin section by comparing
different rotations of the thin section with respect to parallel
and crossed polarization filters. Practically, the procedure was
as follows: the microscope rotary stage with the attached
sample was step-wise rotated at increments of 20° and each
position was acquired in parallel polarized light and with 90°
crossed polarizers. Accordingly, from this procedure, a set of
36 images (e.g., each position with parallel and crossed pola-
rizers) was derived. To enable the analysis of all derived ima-
ges with OBIA, all images had to be co-registered first. That
is, each image was back-rotated and shifted to its original re-
lative position. For co-registration we used the images with a
rotation angle of 0° as reference images. All other images were
first turned back according to their rotation angle and then shif-
ted by individually determined affine transformation functions.
The reference points for these functions were selected semi-
automatically using the AutoSync module of the software
package Erdas Imagine (Erdas, 2011). The co-registered ima-
ges were used as input data for the following OBIA.
OBIA as a method for image analysis has been originally in-
troduced in remote sensing (e.g. Blaschke, 2010). Especially in
the light of steadily increasing spatial resolutions of remote sen-
sing platforms, classic methods of pixel based image proces-
sing yielded increasingly unsatisfying results. Object based ap-
proaches approved to be an alternative (Blaschke and Strobl,
2001). In contrast to pixel based approaches OBIA uses spa-
tially contiguous image objects as the building blocks for ima-
ge analysis. As a first step in OBIA, image objects are genera-
ted from the original image. For the generation of these image
objects, a range of so-called image segmentation methods is
available. In GIS-Science, image analysis of remote sensing
_____________________________________
__________________________
________
2.3 Image acquisition
2.4 Image stacking
3. Marble Petrography from thin sections
using OBIA
3.1 Object based image analysis (OBIA)
Figure 4: Results of growing and shrinking for enhancing grain
boundaries. Ellipses highlight areas with changes to borderlines. Figure
4a: after eliminating elongated objects. Figure 4b: after shrinking the
remaining objects. Figure 4c: after growing these back into generated
interspaces.
their spectral properties: following the initial image segmenta-
tion, the resulting image objects can be analyzed and merged
into new image objects based on shape properties and spatial
relationships (e.g., neighbourhoods, distances, shared bor-
ders). Additionally, spatial hierarchical relationships between
image objects can be considered, such as “being-part-of” or
“consists-of” relationships. Mostly, the initial image segmenta-
tion is only sub-optimal in terms of representing objects of in-
terest and it is necessary to stepwise enhance the initial seg-
mentation results by focusing on dedicated objects. Some-
times it may be necessary to re-assign objects according to
their changed properties. In consequence, OBIA is considered
as an iterative process, starting with global processing and
analysis steps and ending up with local operations (Baatz et al.,
2008). The so-called Definiens Cognition Network Technology
(“CNL”) is a programming environment integrated with the eCog-
nition® OBIA software. It enables to portray the abovemen-
tioned iterative processes, making OBIA flexible enough to be
applied in a wide range of image analysis fields, such as life
sciences and medical image analysis (Athelogou et al., 2007;
Haenschel et al., 2008). In the context of marble petrography,
OBIA allows to describe and analyse mineral grain shapes in
Marble provenance designation with Object Based Image Analysis: State-of-the-art rock fabric characterization from petrographic micrographs
objective and comparable manner. The following sections des-
cribe the technical implementation of automated carbonate
grain extraction with the eCognition® Software and aim at de-
monstrating the flexibility of the OBIA approach and its usabi-
lity in determining marble provenance.
In the first OBIA step, which is image segmentation, we used
the micrographs from all polarizations and rotation angles with
equal weighting. Due to the rectangular image outline and the
rotation of the specimen, peripheral areas of the image stack
have incomplete image coverage. These areas were marked
as background (Fig. 2a, b, c). According to the cutting angle
of grain borders and thin section surface, grain borders show
up differently: at some locations, grain borders are thicker
than one pixel while at other locations they might be hardly
visible. Consequently, treating interspaces between grains as
separate objects is sensible in generating contiguous grain
borders. For this purpose, a shrink-and-grow approach to ge-
nerate interspace-objects was sensible, especially at locations
where the grain border is hardly visible. To describe the diffe-
rent textures of the grains a two-level-segmentation is neces-
sary. That means, within the boundaries of the top-level-seg-
ments sub-objects need to be created, which can then act as
texture elements for their respective top-level-objects (see Fig.
3). In this particular case: delineating linear texture elements
of grains as contiguous sub-objects would establish the “be-
ing-part-of” relation between grains and those lines. By cha-
racterizing the grains according to density and orientation of
their linear texture elements, unwanted object borders within
single grains can be dissolved.
We focused on the central circular image area where data is
present in micrographs of all rotation angles. Peripheral areas
were marked as background and excluded from further analy-
sis on a quasi-pixel basis (bright translucent areas in Figs. 2,
4, 5 and 6), generated by the so-called chessboard segmen-
tation, producing objects of one pixel size (Trimble, 2011).
The central circular area was marked as “data” area and ac-
ted as the region of interest (ROI) for any further analysis. In-
side the ROI we continued our analysis by applying a two-
level top down segmentation strategy.
For this purpose we were applying the multi resolution seg-
mentation (MRS) as outlined by Baatz and Schäpe (2000): This
algorithm merges neighbouring pixels or objects by maximizing
within-object homogeneity and intra-object heterogeneity. The
maximum allowed local heterogeneity is defined through the
so-called scale parameter. The higher the scale parameter,
the larger the generated objects are. The scale parameter is
defined by the homogeneity of colour and shape. Both criteria
can be mutually weighted (w and w ), whereas the shape shape color
criterion itself is composed by differently weighted compact-
ness and smoothness. In this context, higher weighting com-
___________________
_________________________
___
___________________
3.2 Strategy for analyzing the marble thin
section
3.3 Developing a rule set using CNL
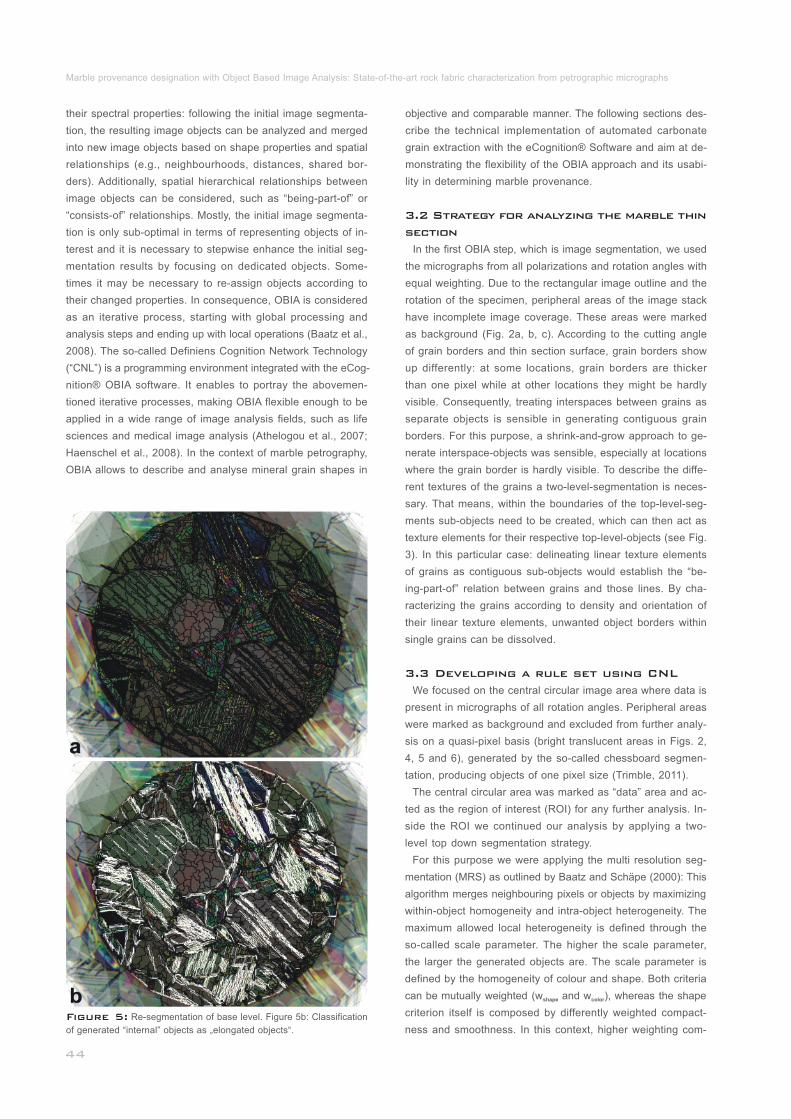
Figure 5: Re-segmentation of base level. Figure 5b: Classification
of generated “internal” objects as „elongated objects“.______________

Figure 7: Enhancing grain shape statistics by step-wise exclusion of bordering grains (dark). Figure 7a (left): Grains with relative border to back-
ground of more than 30%. Figure 7b (right): bordering to background at all.____________________________________________________________
Peter HOFMANN, Robert MARSCHALLINGER, Michael UNTERWURZACHER & Fritz ZOBL
a=1-λmax
λmin
pactness (w ) means the object border merely follows the comp
image contrast and thus can lead to more fringed outlines in
noisy images or areas. Using the parameters as depicted in
Table 1 for the MRS, initial image objects were generated as
outlined in Fig. 2c.
When segmenting an image with eCognition® a hierarchical
net of image objects can be generated, yielding the necessary
connections for describing neighbourhood and “being-part-of”
relations. In this hierarchical net of image objects, each sub-
object belongs to only one super-object and the outer border
of each super-object is identical to the outer borders of ist sub-
objects’ outer borders. (Benz et al., 2004; Fig.3). In our parti-
cular case only two initial segmentation levels were generated.
The initial segmentation results are depicted in Figure 2b (top-
level) and 5a (base-level).
After initial segmentation the grain borders were enhanced
by growing round-shaped objects with a border index bi of v
less-equal to 1.9 by two pixels into neighbouring objects with
a bi of more than 1.9 (Figure 4). The bi is defined by (Trim-v v
ble, 2011):
Equation (1)
With: P the object’s perimeter (border length), l the length, v BB
w the width of the object’s smallest enclosing rectangle.BB
bi describes how jagged an object is. The higher bi , the v v
more jagged an object is. In the next step, remaining elonga-
ted objects with an asymmetry a of more than 0.9 were dele-
ted. The asymmetry a of an object is defined as the square
root of the ratio between the minor and major axis of the ob-
ject’s minimum enclosing ellipse (Trimble, 2011):
Equation (2)
With: λ ,the length of the minor axis and λ the length of min max
the major axis of the smallest enclosing ellipse.
That means, the more elongated an object is, the closer a is
to 1 and the less elongated an object is, the closer its value is
___________________________________
_____________________________
___
__________
___________
to 0. Fig. 4a depicts the resulting segmentation. In the follo-
wing step the interspace between the objects has been gene-
rated as an explicit object class. This has been done by ap-
plying the so-called pixel-based object resizing algorithm as
implemented in eCognition using the shrinking mode (Trimble,
2013) for all remaining objects. The Class for new image ob-
jects then was the interspace. The Candidate Surface Tension
has been set in a way, that at border positions of an object
within a neighbourhood of 5x5 pixels (Box size in X and Y = 5)
the relative area of the object to shrink was less-equal to 20%
(Value = 0.2). The shrinking increment was limited to two pixels
(Number of cycles = 2). That is, at each border position fulfil-
ling the relative area constraint the objects of concern were
shrunk by two pixels (Fig. 4b).This conditional shrinking led to
more smoothed object borders than an equal shrinking. The
shrunk objects were finally grown into the generated interspa-
ces until the interspaces themselves disappeared (Fig. 4c).
So far, most of the individual carbonate grains could be deli-
neated. Some errors in subdividing individual grains still exis-
ted, however (e.g., Fig. 4c, leftmost ellipses). In order to ap-
proximate the linear textures of the grains, the base level was
__
Figure 6: Delineation of grains after texture-based merging.____
bi =v2(w +l )BB BB
Pv
xr =br +g +bx x x
bx
re-segmented using a MRS with the parameters as depicted
in Table 2.
This way, the top-level-objects with the enhanced borders
remain untouched but they contain high-resolution sub-objects
(Fig. 5a). For the intended texture analysis of top-level-objects,
the newly created objects at the base level were classified
according to their asymmetry. That is, objects at the base le-
vel were classified as “elongated objects” (objects outlined in
white, Fig. 5b) whenever their asymmetry was higher than 0.9.
Now each higher-level object refers to a number of explicitly
elongated sub-objects with different main directions. That is,
by referring to the density of “elongated objects” within a top-
level-object these objects can be labeled as being “elongated
textured”. In our case objects with more than 25% (area) of
elongated sub-objects were considered “elongated textured”.
Neighboring elongated textured image objects with similar ori-
entation of their sub-objects are likely to represent one single
grain with twin lamellae.
Finally, all neighboring objects on the top segmentation level
with a high proportion of blue in the crosspolarized images
were merged. The merging was done in order to dissolve in-
ner grain borders produced by their lamellae structures and
dis-connecting contiguous grain objects. The threshold for xmerging was defined by the feature “ratio blue x” (r ) which b
has been created using the mean gray values per object. It
describes the amount of the mean gray value per object in all
blue channels of all crosspolarized images in relation to the
mean gray values per object of all red and green channels of
all cross polarized images:
Equation (3)
______________________________
____________________________
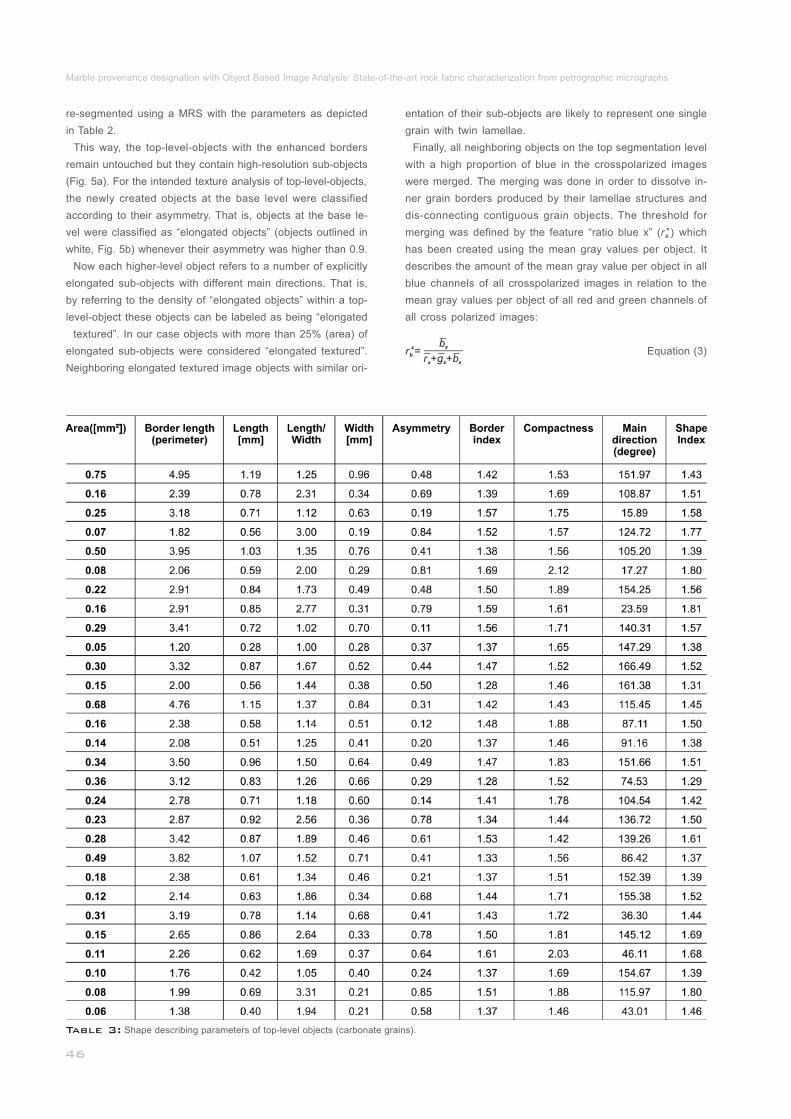
Marble provenance designation with Object Based Image Analysis: State-of-the-art rock fabric characterization from petrographic micrographs
Table 3: Shape describing parameters of top-level objects (carbonate grains)._______________________________________________________

rx
gx
bx
xrb
xrb
xrb
Peter HOFMANN, Robert MARSCHALLINGER, Michael UNTERWURZACHER & Fritz ZOBL
Table 4: Mean values of shape describing features for objects with different shared border length to “background”._________________________
With: the mean gray value within an object of the red chan-
nels of all cross polarized images; the mean gray value with-
in an object of the green channels of all cross polarized images;
the mean gray value within an object of the blue channels of
all cross polarized images;
That means, the higher the amount of the blue channels in
relation to the red and green channels of the cross polarized
images, the higher is. For the color mixing as displayed in
Figure 2, bluish objects have a relatively high value of ≥0.3,
since the sum of all color proportions must be at 1.0. Respec-
tively, the threshold for merging neighboring objects has been
set to ≥0.32. The result of texture-based merging is shown
in Fig. 6.
For an elaborated analysis of thin sections a statistical evalu-
ation of shape describing parameters of the delineated grains
is essential. In our case, the basis for statistical analysis of
marble sample LAS3 was the segmentation result displayed
in Figure 6. For a statistical characterization of the sample by 2grain shapes we used the following object features: area [mm ],
border length [mm], length [mm], width [mm], ratio of length to
width, main direction [degree], border index (equation (1)) and
asymmetry (equation (2)). In eCognition, all of them are gene-
rated automatically per object. That is, for each grain respec-
tive values are generated. Additionally, we included shape des-
cribing parameters in the statistical analysis: shape index si v
and compactness c . Both are already implemented in eCog-v
nition: (Trimble, 2011):
Equation (4)
With: P the object perimeter, A the object area. si descri-v v v
bes the smoothness of an object’s shape. The smoother an
object shape is, the lower si is. The compactness is similar to v
the border index, but its calculation is based upon the object
area. The higher c is, the less compact an object is.v
Equation (5)
With: A the object area, l the length, w the width of the object.v v v
Some of the segmented grains cross the border between
ROI and background. In consequence, including their shape
parameters would distort overall sample statistics. Defining ob-
jects as “cut” whose shared border to background is longer than
r x
g x
b x
_____________________________
r b
rb
rb
_______________________________
_______
3.4 Analysis of detected grains
30% of their overall border while objects below this threshold
are not significantly cut (Fig. 7a), reduced the sample size from
29 to 21 grain objects. Excluding all objects bordering to back-
ground would reduce the number of samples to 12 grain ob-
jects (Fig. 7b, Table 4).
Table 3 gives the shape parameters as mentioned above for
all segmented grains. Comparing the results on grain length
with that of 100 manual measurements of the same sample
shows only little deviation: the mean grain length from manual
measurement is at 0.7 mm (section 2.3) while the mean grain
length derived from OBIA is at 0.74 mm for all objects and
those being uncut by the border. For all grains including those
with a common border to background of < 30% of the whole
grain border, the mean length is at 0.78 mm (Table 4). The
maximum grain length determined by manual analysis is gi-
ven with 1.3 mm while in Table 3 the maximum grain length
determined with OBIA is at 1.19 mm.
While our approach is certainly just one among the nume-
rous recently available and promising methods, the results of
this OBIA feasibility study indicate clear advantages over the
manual approach and over conventional methods of petrogra-
phic image analysis. For an experienced expert the manual de-
termination of size for 100 grains can be estimated about 1 h.
Image acquisition time for 36 images per sample can be esti-
mated as approx. five minutes on a standard petrographic mi-
croscope. The results on maximum and average grain lengths
achieved with OBIA are consistent with the results of manual
measurements (section 2.3, Tables 3 and 4). Assuming the
developed OBIA rule set needs no manual adaptations, produ-
cing respective results for further similar specimen is a matter
of a few seconds per thin section on a standard PC. The seg-
mentation is transparent and easily adaptable to varying ima-
ging conditions (Hofmann, 2008). With OBIA, carbonate mine-
ral grains can be reliably represented as a hierarchy of grain
objects and sub-objects like inclusions, twin-lamellae etc. Once
grain objects have been extracted, characteristic grain shape
parameters can be automatically gauged. Further potentials for
OBIA in the field of thin section analysis are given by the ex-
tended shape-relevant measures like grain area, asymmetry
or border index of the grains as well as fabric-relevant para-
meters like the main anisotropy. Different types of minerals
_______________________________
____________________
4. Results
5. Conclusions
Av4si =v
Pv
Av
c =vl ∙wv v

Marble provenance designation with Object Based Image Analysis: State-of-the-art rock fabric characterization from petrographic micrographs
can be distinguished, enabling stratified statistical analysis
(Marschallinger and Hofmann, 2010). Summing up, OBIA is a
state-of-the-art method to deliver objective and traceable mi-
neral shape parameters from petrographic micrographs in a
highly automated manner. It is considered a powerful compo-
nent not only in the multidisciplinary toolbox for designating
marble provenance, but for automated petrographic (i.e. micro
texture) analysis from thin sections in general. Since the rule
set developed here can be reused, OBIA has the potential to
drastically accelerate thin section analysis.
Definiens Cognition Network Technology – A Novel Mul-
timodal Image Analysis Technique for Automatic Identification
and Quantification of Biological Image Contents. In: Frisch-
knecht, F., Shorte, S.L., (Eds.): Imaging Cellular and Molecu-
lar Biological Functions, Springer. Berlin, Heidelberg. pp. 407-
421.
Ancient white marbles: analysis and iden-
tification by paramagnetic resonance spectroscopy. L'Erma di
Bretschneider, Roma, pp. 1-283.
Progressing from
object-based to object-oriented image analysis. In: Blaschke,
Th., Lang, S., Hay, G.J. (Eds.): Object-Based Image Analysis.
Spatial Concepts for Knowledge-Driven Remote Sensing Ap-
plications. Springer. Berlin, Heidelberg, pp. 29–42.
Multiresolution segmentation: An
optimization approach for high quality multi-scale image seg-
mentation. In: Strobl, J., Blaschke, T., Griesebner, G. (Eds.):
Angewandte Geographische Informations –Verarbeitung, Wich-
mann: Karlsruhe; Volume XII,12–23.
Multi-resolution, object-oriented fuzzy analysis of re-
mote sensing data for GIS-ready information. In: ISPRS Jour-
nal of Photogrammetry & Remote Sensing, 239-258.
Object based image analysis for remote
sensing. In: ISPRS International Journal of Photogrammetry
& Remote Sensing 65 (1), 2-16.
What’s wrong with pixels? Some
recent developments interfacing remote sensing and GIS. GIS-
Zeitschrift für Geoinformationssysteme 6, 12–17.
Image Analysis of Microstruct-
ures in Natural and Experimental Samples. In: De Paor, D. G.
(Ed.): Structural Geology and Personal Computers. Pergamon,
pp. 135-166.
Greek Marbles: Determination
of Provenance by Isotopic Analysis, Science, 176, 401-403.
_______________
________________________
_________
_____________________
_______
_______________________
___________
_
References
Athelogou, M., Baatz, M., Binnig, G., Schäpe, A., Schmidt, G.,
2007.
Attanasio, D., 2003.
Baatz, M., Hoffmann, C. Willhauck, G., 2008.
Baatz, M., Schäpe, A., 2000.
Benz, U., Heynen, M., Hofmann, P., Lingenfelder, I., Willhauck,
G., 2004.
Blaschke, T., 2010.
Blaschke, T., Strobl, J., 2001.
Bons, P., Jessell, M.W., 1996.
Craig, H. and Craig, V., 1972.
Cramer, T., 2004.
Erdas, 2011.
Fueten, F., 1997.
Gorgoni, C., Lazzarini, L., Pallante, P., 2002.
Haenschel, C., Linden, D., Oertela, V., Rotarska-Jagiela, A.,
Schönmeyer, R., Vogeley, K. 2008.
Herz, N., 1988.
Higgins, D.D., 2006.
Hofmann, P., Strobl, J., Blaschke, T., 2008.
Lang, S., 2008.
Lazzarini, L., 2004.
Lepsius, R.,1891.
Marschallinger, R. and Hofmann, P., 2010.
Multivariate Herkunftsanalyse von Marmor
auf petrographischer und geochemischer Basis. http://opus.
kobv.de/tuberlin/volltexte/2004/742/pdf/cramer_thomas.pdf.
(last access: 05 May 2013).
Imagine AutoSync, http://www.erdas.com (last
access: 05 May 2013).
A computer-controlled rotating polarizer stage
for the petrographic microscope. Computers & Geosciences,
23/2, 203-208.
New archaeo-
metric data on «Rosso Antico» and other red marbles used in
antiquity. In L. Lazzarini (ed.), «ASMOSIA VI, Interdisciplinary
Studies in Ancient Stone», Padova, pp. 199-206.
The corpus callosum in
schizophrenia - volume and connectivity changes affect spe-
cific regions. NeuroImage, 39/4, 1522-1532.
The oxygen and carbon isotopic data base for
classical marble; in: Herz, N. and Waelkens, P., Classical Mar-
ble: Geochemistry, Technology, Trade, Kluwer Academic Pub-
lishers, pp. 305-314.
Quantitative Textural Measurements in
Igneous and Metamorphic Petrology. Cambridge University
Press, 265p.
A Method for adap-
ting global image segmentation methods to images of different
resolutions. In: Hay, G.J., Blaschke T. and Marceau D. (Eds).
GEOBIA 2008 – Pixels, Objects, Intelligence. GEOgraphic Ob-
ject Based Image Analysis for the 21st Century. University of
Calgary, Calgary Alberta, Canada, August 05-08. (International
Archives of the Photogrammetry, Remote Sensing and Spatial
Inf. Sciences Vol. XXXVIII-4/C1).
Object-based image analysis for remote sen-
sing applications: modeling reality – dealing with complexity.
In: Blaschke, T., Lang, S., Hay, G.J. (Eds.): Object-Based
Image Analysis. Spatial Concepts for Knowledge-Driven Re-
mote Sensing Applications. Springer, pp. 3-27.
Archaeometric aspects of white and colou-
red marbles used in antiquity: the state of the art. Periodico di
Mineralogia (2004), 73, 113-125.
Griechische Marmorstudien, Abhandlungen
Königl. Akademie der Wissenschaften, Phil.-Hist. Klasse 1890,
Berlin, 1-135.
The application of
Object Based Image Analysis to Petrographic Micrographs. In:
Mendez-Vilas, A. and Diaz, J. (Eds.): Microscopy: Science,
Technology, Applications and Education, Vol. 4, pp. 1526-1532.
Formatex Research Center.
___________________________
_______________________________
__________
______________
_________________________________
________________________
____________
_______________________
____________________________
Peter HOFMANN, Robert MARSCHALLINGER, Michael UNTERWURZACHER & Fritz ZOBL
Obara, B., Kozusnikova, A., 2007.
Trimble, 2011.
Tröger, W., Bambauer, H-U., Taborszky, F., Trochin, H., 1982.
Unterwurzacher, M. & Obojes, U., 2012.
Unterwurzacher, M., Pollerers, J., Mirwald, P.W., 2005.
Utilisation of the image ana-
lysis method for the detection of the morphological anisotropy
of cacite grains in marble. Computational Geosciences 11, 275-
281.
eCognition® Developer 8.64.1 Reference Book.
Trimble Germany.
Optische Bestimmung der Gesteinsbildenden Minerale, Teil 1
Bestimmungstabellen. Schweizerbart, Stuttgart, 188 p.
White marble from
Laas (Lasa), South Tyrol – its occurrence, use and petrogra-
phic-isotopical characterization. Austrian Journal of Earth
Sciences, 105/3, 26-37.
Prove-
nance study of marble artefacts from the Roman burial area of
Faschendorf (Carinthia, Austria). Archaeometry 47, 265-273.
______
______________________________
_
Received: 9 May 2013
Accepted: 10 October 2013
1)*) 1)Peter HOFMANN , Robert MARSCHALLINGER , Michael 2)3) 1)UNTERWURZACHER & Fritz ZOBL _________________
1)
2)
3)
*)
Interfaculty Department of Geoinformatics, University of Salzburg,
Schillerstr. 30, 5020 Salzburg, Austria;
Department of Geography and Geology, University of Salzburg, Hell-
brunnerstr. 34, 5020 Salzburg, Austria;
Institute of Archaeology, University of Innsbruck, Langer Weg 11,
6020 Innsbruck, Austria;
Corresponding author, [email protected]
________________________
________________________
___________________________________
________________