2 NoDerivatives 4.0 International ...
27
1 ©2016, Elsevier. Licensed under the Creative Commons Attribution-NonCommercial- 1 NoDerivatives 4.0 International http://creativecommons.org/about/downloads 2 3 4 brought to you by CORE View metadata, citation and similar papers at core.ac.uk provided by Kingston University Research Repository
Transcript of 2 NoDerivatives 4.0 International ...

1
©2016, Elsevier. Licensed under the Creative Commons Attribution-NonCommercial-1
NoDerivatives 4.0 International http://creativecommons.org/about/downloads 2
3
4
brought to you by COREView metadata, citation and similar papers at core.ac.uk
provided by Kingston University Research Repository

2
Determination of beryllium 5
concentrations in UK ambient air 6
7
Sharon L. Goddard a*, Richard J. C. Brown a and Baljit K. Ghatora b 8
* Corresponding author Sharon L. Goddard, E-Mail: [email protected] Tel.: +44 20 9
8943 6272; 10
a Environment Division, National Physical Laboratory, Teddington, Middlesex. UK.; 11
b School of Life Sciences, Pharmacy and Chemistry, Faculty of Science, Engineering and 12
Computing, Kingston University, Kingston, Surrey. UK. 13
14
Abstract 15
16 Air quality monitoring of ambient air is essential to minimise the exposure of the general population 17
to toxic substances such as heavy metals, and thus the health risks associated with them. In the UK, 18
ambient air is already monitored under the UK Heavy Metals Monitoring Network for a number of 19
heavy metals, including nickel (Ni), arsenic (As), cadmium (Cd) and lead (Pb) to ensure compliance 20
with legislative limits. However, the UK Expert Panel on Air Quality Standards (EPAQS) has highlighted 21
a need to limit concentrations of beryllium (Be) in air, which is not currently monitored, because of 22
its toxicity. The aim of this work was to analyse airborne particulate matter (PM) sampled onto filter 23
papers from the UK Heavy Metals Monitoring Network for quantitative, trace level beryllium 24
determination and compare the results to the guideline concentration specified by EPAQS. Samples 25
were prepared by microwave acid digestion in a matrix of 2 % sulphuric acid and 14 % nitric acid, 26
verified by the use of Certified Reference Materials (CRMs). The digested samples were then 27
analysed by Inductively Coupled Plasma Mass Spectrometry (ICP-MS). The filters from the UK Heavy 28
Metals Monitoring Network were tested using this procedure and the average beryllium 29
concentration across the network for the duration of the study period was 7.87 pg m-3. The highest 30
site average concentration was 32.0 pg m-3 at Scunthorpe Low Santon, which is significantly lower 31
than levels that are thought to cause harm. However the highest levels were observed at sites 32
monitoring industrial point sources, indicating that beryllium is being used and emitted, albeit at very 33
low levels, from these point sources. Comparison with other metals concentrations and data from 34
the UK National Atmospheric Emissions Inventory suggests that current emissions of beryllium may 35
be significantly overestimated. 36
Keywords: Air quality; heavy metals; beryllium 37
38
3
1. Introduction 39
Air quality is an area of increasing global concern, as emissions of pollutants, including heavy metals, 40
from anthropogenic sources such as the combustion of fossil fuels for power generation and 41
transport, or processes such as smelting or mining, continue to rise and public awareness of potential 42
health effects improves. Studies conducted by the World Health Organisation (WHO) show the 43
harmful effects of heavy metals exposure to human health (WHO, 2006 and 2012). These typically 44
include, among others, increased risk of cancer and neurotoxic diseases (WHO, 1980 and 1993). 45
In Europe, a whole raft of legislation has been adopted in order to minimise population exposure to 46
airborne pollutants such as heavy metals (European Commission (EC), 2015). European air quality 47
directives require member states to establish and maintain a system for monitoring concentrations 48
of heavy metals and other pollutants in ambient outdoor air (EC, 2015). The Air Quality Directive 49
2008/50/EC specifies a target value for ambient concentrations of lead and the Fourth Daughter 50
Directive 2004/107/EC specifies limit values for nickel, arsenic and cadmium. In the UK this 51
monitoring requirement is met by the UK Heavy Metals Air Quality Monitoring Network, operated by 52
the National Physical Laboratory (NPL) on behalf of the Department for the Environment, Food and 53
Rural Affairs (Defra), and from 2016 Defra and the Environment Agency (EA). The network consists of 54
samplers located at 25 different sites around the UK that pump ambient air through cellulose acetate 55
filters and collect the particulate matter (PM10 size fraction). The filters are then sent to the 56
laboratory at NPL, prepared by microwave digestion in acid, then analysed for heavy metals by 57
Inductively Coupled Plasma – Mass Spectrometry (ICP-MS) (Goddard et al., 2015). 58
Beryllium is not one of the metals currently monitored by the UK Heavy Metals Network because 59
there is no existing legislative requirement for it in ambient air. However, the Expert Panel on Air 60
Quality Standards (EPAQS) produced a report for the Department for Environment, Food and Rural 61
Affairs (Defra) (EPAQs, 2008), the purpose of which was to provide guideline levels of priority 62
pollutants, including beryllium, in ambient air ‘at which no or minimal effects on human health are 63
likely to occur’. Beryllium poisoning has been documented in workers handling all insoluble 64
beryllium-containing materials. Short-term, high concentration exposure can result in acute 65
pneumonitis, whereas chronic beryllium disease (CBD) or ‘berylliosis’, a form of interstitial lung 66
disease, can arise after long-term exposure. Both conditions can be fatal. The guideline level given for 67
beryllium in the report was 0.2 ng m-3 total particulate in the PM10 size fraction, as an annual average 68
(EPAQs, 2008). 69
The main sources of atmospheric airborne beryllium are anthropogenic: refineries, road traffic, 70
domestic and office heating, power stations and waste incinerators (which may be used for the 71
disposal of electrical items e.g. computers and mobile phones that contain beryllium) (EPAQs 2008). 72
Beryllium is also found in coal, therefore coal-fired power stations and coal slag used as an abrasive 73
in blasting paint will generate airborne beryllium (EPAQs 2008). 74 75
4
Beryllium is often used in alloys, particularly with copper or nickel, which are used for their high 76
strength and good electrical and thermal conductivities (Beryllium Science and Technology 77
Association, 2016).There are a wide variety of applications for copper-beryllium alloys, including 78
plastic injection and moulding inserts, springs and spring wiring, lightweight structural components 79
for the aerospace and defence industries, non-sparking tools for use in explosive environments, 80
electronic components (relays, switches, connectors), low wear bearings, automotive parts, and 81
telecommunications cables (Materion Corporation, 2015). Nickel-beryllium alloys are used in 82
mechanical and electrical springs that are required to work at high temperatures without deforming. 83
Applications include household oven controls, fire detection equipment, fire suppression sprinkler 84
systems, and in automotive engine and exhaust control systems (Beryllium Science and Technology 85
Association, 2016). 86
The highest ambient air levels of beryllium have been recorded near factories where beryllium is 87
processed or beryllium-containing products are manufactured (EPAQs 2008). Eisenbud et al. (1949), 88
found that within 212 m of a beryllium processing plant in Loraine, Ohio, USA, concentrations of 89
beryllium were measured as high as 460 ng m-3 , falling to 30 ng m-3 a mile (1.61 km) away. In 90
Czechoslovakia, ambient concentrations of up to 17 ng m-3 beryllium were measured in a town 91
located near two power plants burning coal with a high beryllium content (Bencko et al., 1980). 92
A study at a roadside location in Birmingham, UK (Harrison et al., 2003) monitored daily 93
concentrations of metals, including beryllium, in various particle size fractions. The mean beryllium 94
concentration found in PM10 was 0.05 ng m-3, with individual results ranging from 0.01 – 0.15 ng m-3 – 95
approaching the 0.2 ng m-3 limit recommended by EPAQs (EPAQS, 2008). To the best of the authors’ 96
knowledge, this is the only example of actual measurements of beryllium in UK ambient air to date. 97
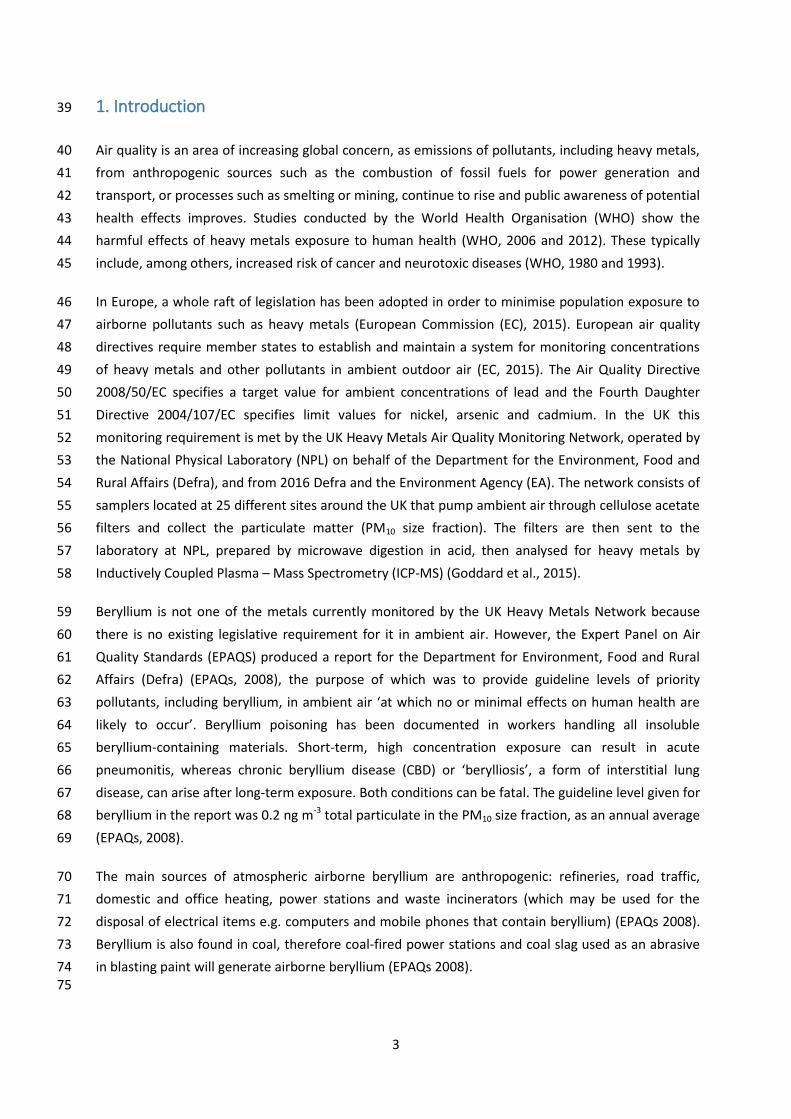
Figure 1 shows the UK emissions of beryllium from 1970 – 2013. In 1970 the total emissions were 98
0.043 kilotonnes, the majority of which was attributable to domestic combustion sources. By 2013, 99
road transport was the main contributory source to total emissions of 0.005 kilotonnes (NAEI, 2016). 100
5
101 Figure 1: UK beryllium emissions 1970 – 2013 (NAEI, 2016). 102
103
The aim of this work is to analyse filter samples from the UK Heavy Metals Air Quality Monitoring 104
Network for the concentration of beryllium in PM10, to establish levels across the UK in relation to the 105
EPAQs guideline level of 0.2 ng m-3. 106
In terms of analytical methodology, microwave assisted digestion using acids provides a fast and 107
efficient preparation technique for environmental samples requiring trace metals analysis that today 108
is considered routine (Sandroni, V. et al., 2003). Heating in closed vessel systems results in an 109
increase in pressure as the digestion acids evaporate and gases are produced by the decomposing 110
sample matter, thus increasing the boiling point of the reagents and aiding the rapid breakdown of 111
the sample matrix (Lamble and Hill, 1998). There are a number of digestion procedures documented 112
for beryllium in workplace air sampled onto filters in the literature (Ashley et al., 2005), (Brisson et 113
al., 2006) and (Oatts, 2012) on which the method in this paper was based. Instrumental analysis by 114
ICP-MS is a well-established technique for the determination of ultra-trace levels of metals, 115
including beryllium (Harrison et al., 2003), (Ashley et.al., 2005), so was employed in this study 116
to analyse the digested filter samples. 117
2. Experimental section 118
119

6
2.1 Test samples 120
Certified reference materials (CRMs) were chosen that most closely resembled the network samples 121
(PM on filters) in terms of sample media. The CRMs measured were NIST SRM 1944, a mixture of 122
marine sediment collected near urban areas in New York and New Jersey purchased from NIST 123
(National Institute of Standards and Technology, USA) and ‘Be from BeO on Filter Media’, produced 124
by High Purity Standards (HPS), USA, purchased from Greyhound Chromatography. This material 125
consists of mixed cellulose ester filters (37 mm diameter, 0.8 µm pores) spiked with a stock solution 126
prepared from NIST SRM 1877 (beryllium oxide (BeO) powder, prepared from high fired BeO). 127
The filter samples tested were sourced from the UK Heavy Metals Monitoring Network. The network 128
filter samples consist of PM10 from ambient air sampled onto cellulose ester filters (47 mm diameter, 129
0.8 µm pores, purchased from Pall Corporation). From each monitoring site, three to five months’ 130
worth of filters were tested, sampled between March and July 2016. As concentrations of heavy 131
metals in ambient air are not subject to significant seasonal variation (Goddard et al., 2015), 132
concentrations measured over this substantial proportion of the year should yield average 133
concentrations strongly indicative of an annual average. 134
135
2.2 Sample preparation 136
Samples were prepared by microwave acid digestion (Anton Paar Multiwave 3000). Sub-samples of 137
the reference material NIST 1944 were accurately weighed on a calibrated balance (Sartorius LA230S, 138
resolution 0.1 mg). The ‘Be from BeO on Filter Media’ reference material filters were digested 139
directly as whole filters. The network filter samples were cut into accurate portions using a template 140
and ceramic scissors. The sub-samples were then transferred to microwave vessels and the acid 141
mixtures added. From each monitoring site, three to five months’ worth of filters were tested. 142
The microwave program heated the samples to 220 °C for 60 minutes at up to 1400 W. The acids 143
used were 95 % H2SO4 (1 ml) and 70 % HNO3 (10 ml) resulting in a matrix of 2 % H2SO4, 14 % HNO3, as 144
recommended in studies by Ashley et al (2005), Brisson et al. (2006) and Oatts (2012). All 145
concentrated acids used were Analytical Reagent grade purchased from Fisher Scientific. Once 146
cooled, the digested solutions were transferred to a centrifuge tube and made up to 50 g in purified 147
water (18 MΩ quality, Elga Purelab Flex 2). The digested solutions of NIST 1944 were filtered prior to 148
analysis to remove particulate content. Cellulose filter papers of 90 mm diameter and 5-13 µm pores 149
(Fisher Scientific) were used. 150
151
The final solutions were then analysed for beryllium content using a PerkinElmer Elan 9000 ICP-MS. 152
Liquid argon (99.9999 % purity) was supplied by BOC Gases for the plasma gas. 153
154
2.3 ICP-MS analysis 155
156

7
The ICP-MS was optimised prior to analysis to ensure sufficient sensitivity and minimal oxide/doubly 157
charged ion formation. 158
A quality assurance (QA) solution containing a mid-range concentration of beryllium was repeatedly 159
analysed throughout the analytical sequence. The responses were plotted and the equation of the 160
polynomial line fitted was used to correct the responses of the calibration standards and samples for 161
drift, as in previous work (Brown et al., 2008). The stock beryllium solution, Be 1000 µg ml-1, was 162
sourced from Metlab Supplies. 163
The ICP-MS was calibrated by direct analysis of external calibration standards containing known 164
concentrations of beryllium, traceable to the NIST SRM 3100 series of mono-elemental solutions 165
(stock solution, Be 1000 µg ml-1, sourced from Metlab Supplies). Calibration curves were generated 166
from the measured responses of the calibration standards and used to interpolate the sample 167
concentrations using NPL’s XLGenline software which performs generalised least squares regression 168
(Smith, 2010). The calibration range encompassed the measured sample concentrations. The 169
calibration standards were prepared in a matrix of 2 % H2SO4, 14 % HNO3. All measurements were 170
blank corrected with the appropriate matrix blank. 171
172
2.4 Water soluble beryllium 173
Metals such as beryllium pose a significant health risk to humans and ecosystems if they are present 174
in a water soluble form, as they are more easily absorbed into biological systems (Williams et al., 175
2000). However, insoluble or low-solubility beryllium containing particles that are inhaled can be 176
transferred to the lymph nodes or pulmonary intersitium, where they can be retained for many years 177
until they are slowly solubilized, resulting in adverse health effects (Maier, 2002). 178
A selection of the UK Heavy Metals Network filters tested for total beryllium were also analysed to 179
obtain indicative concentrations of water soluble beryllium species. The filters were selected from 180
across the range of total beryllium concentrations measured initially. 181
Filters were cut accurately into portions using a template and ceramic scissors as before. The 182
portions for each sample were placed in a 50 mL centrifuge tube and 10 mL purified water (18.2 MΩ, 183
Elga Purelab Flex 2) was added. The solutions were then sonicated for 30 minutes at 50-60 Hz 184
(Fisherbrand S-Series Ultrasonic Cleaner). 185
After sonication, the filter and any dislodged particulate matter were removed from the sample 186
solution by filtration. The initial filtration was carried out using a 90 mm diameter cellulose filter 187
paper, pore size 5-13 µm (Fisher Scientific). The filtrate was then made up to 50 g with 2 % H2SO4, 14 188
% HNO3 acid matrix. The resulting solutions still contained some particulate matter, so they were 189
filtered again through 25 mm polypropylene membrane syringe filters, pore size 0.2 µm (VWR 190

8
International). These solutions were then analysed by ICP-MS and the data processed in the same 191
way as the acid digests for total beryllium. 192
193
3. Results and Discussion 194
195
3.1 Certified reference materials (CRMs) 196
197
The recoveries reported in Table 1 were obtained with the microwave program specified in section 198
2.2, using a 2 % H2SO4, 14 % HNO3 acid matrix. 199 200
Replicate Recovery %
NIST SRM 1944 (1.6 ± 0.3 mg/kg *)
Recovery % Be from BeO on Filter
Media (0.050 ± 0.001 µg/filter)
1 92.3 ± 10.2 103.9 ± 7.6
2 86.4 ± 9.3 106.4 ± 6.5
3 84.1 ± 8.1 -
4 90.7 ± 8.6 -
Table 1: Recoveries of NIST 1944 and Filter CRMs (with certified/reference values in brackets) 201 digested in 2 % H2SO4, 14 % HNO3. The recovery uncertainties are quoted to k=2. 202
* denotes the beryllium mass fraction in NIST 1944 is supplied as a reference value only. 203 204
205

9
3.2 Limits of Detection and Quantitation 206
207
Sixteen blank filters were analysed prior to any network filter samples. The resulting concentrations 208
were used to calculate the Limits of Detection and Quantitation (LOD and LOQ). 209
The instrumental LOD was calculated as three times the standard deviation of the filter blank 210
concentrations (pg g-1). This value was then corrected for the mass of sample solution, filter sub-211
sampling and a typical volume of air sampled to give the method LOD (pg m-3): 212
Calculation of the method LOD: 213
𝐿𝑂𝐷𝑚 =𝐿𝑂𝐷𝐼 ∙ 𝑚𝑆𝑆
𝑉𝑎𝑖𝑟𝐹𝑝
214 LODm = method LOD in (pg m-3); 215
LODI = instrumental LOD in (pg g-1); 216
mSS = mass of sample solution (g); 217
Fp = filter portion (i.e. 1, as whole filters were used for this test); 218
Vair = a typical volume of sampled air (m3) (i.e. 168 m3 for a typical weekly sample collected at 16.7 L 219
min-1). 220
221
The instrumental LOQ was calculated in a similar fashion, but multiplying the standard deviation of 222
the filter blank concentrations by a factor of ten, then substituting the instrumental LOQ into the 223
equation above to obtain the overall method LOQ. See Table 2 below for the instrumental (ICP-MS) 224
and overall method LODs and LOQs calculated. 225
226
Instrumental
pg g-1
Overall Method
pg m-3
LOD 3.46 1.13
LOQ 11.54 3.78
Table 2: Instrumental and Overall Method Limits of Detection and Quantitation (LOD and LOQ) 227
228
10
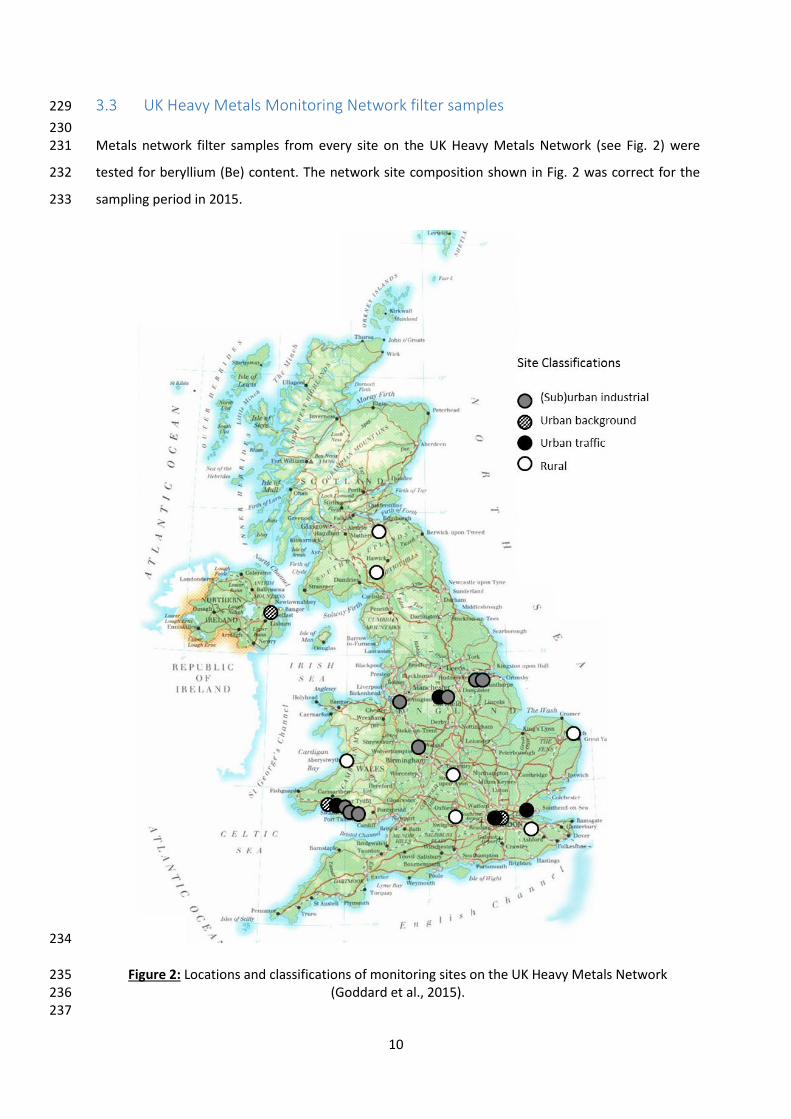
3.3 UK Heavy Metals Monitoring Network filter samples 229
230 Metals network filter samples from every site on the UK Heavy Metals Network (see Fig. 2) were 231
tested for beryllium (Be) content. The network site composition shown in Fig. 2 was correct for the 232
sampling period in 2015. 233
234
Figure 2: Locations and classifications of monitoring sites on the UK Heavy Metals Network 235 (Goddard et al., 2015). 236
237

11
The monitoring sites are classified according to their location in terms of description of the 238
surrounding area and immediate proximity to pollution emission sources as specified in Council 239
Directive 2008/50/EC and UK guidelines (Defra, 2015). 240
From each monitoring site, three to five months’ worth of filters were tested. The average ambient 241
concentrations of beryllium measured at all the sites are shown in Table 3. 242 243

12
244
Site Number Site Name Site Classification Average beryllium
concentration pg m-3
Uncertainty (k=2) pg m-3
Relative Uncertainty
(%)
59 ICI Weston Point (Sub)urban Industrial
5.99 1.53 26
69 Bilston Lane,
Walsall (Sub)urban Industrial
17.6 3.38 19
104 Port Talbot (Sub)urban Industrial
19.0 1.81 10
106 Scunthorpe Town (Sub)urban Industrial
11.1 1.52 14
107 Scunthorpe Low
Santon (Sub)urban Industrial
32.0 2.38 7
113 Pontardawe Tawe
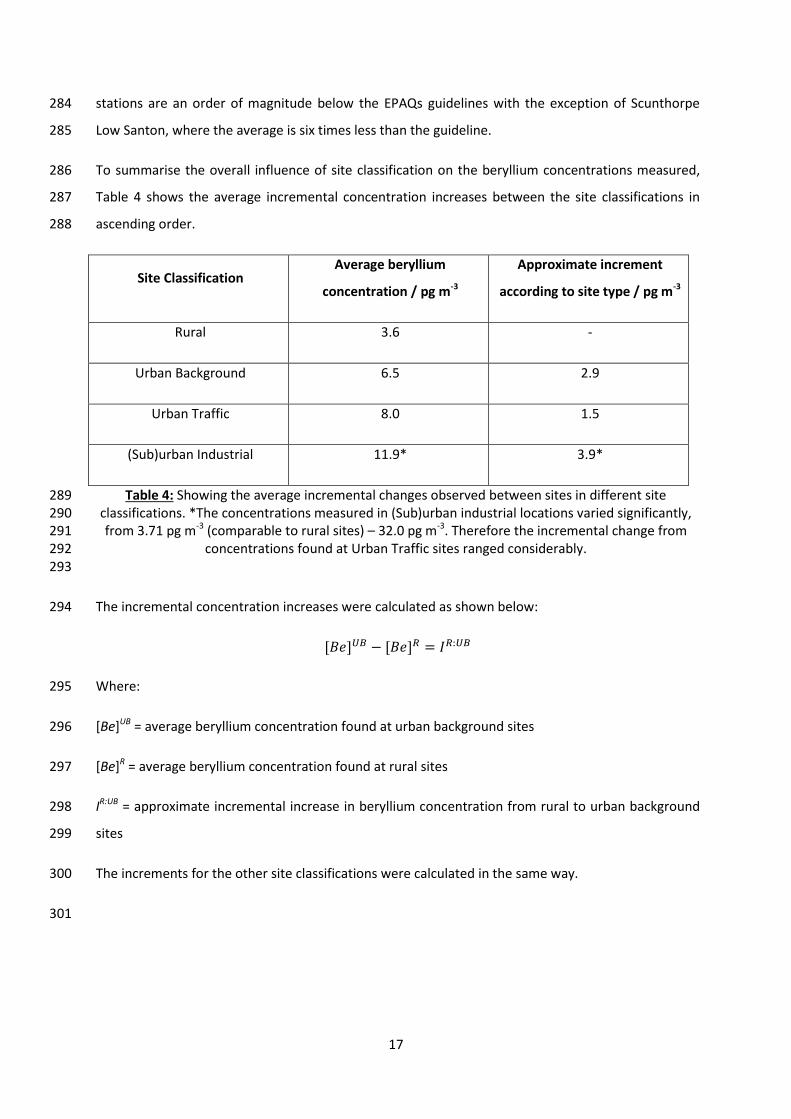
Terrace (Sub)urban Industrial
3.95 2.64 67
117 Sheffield Tinsley (Sub)urban Industrial 9.32 2.93 31
118# Sandvik Neath (Sub)urban Industrial 7.81 2.63 34
201# Pontardawe Leisure
Centre (Sub)urban Industrial
8.85 2.97 34
62 London
Westminster Urban Background 7.25 1.38 19

13
100 Swansea
Coedgwilym Urban Background 7.31 2.79 38
103 Belfast Centre Urban Background 3.91 1.25 32
110 Chadwell St. Mary Urban Background 7.43 1.61 22
119 Sheffield
Devonshire Green Urban Background 6.65 1.54 23
101 Swansea Morriston Urban Traffic 7.26 2.72 38
114 London Marylebone
Road Urban Traffic 8.77 1.87 21
115 Pontardawe Brecon
Road Industrial Suburban 3.71* 2.40 65
65 Eskdalemuir Rural 2.52* 1.39 55
202 Auchencorth Moss Rural 2.55* 1.45 57
203 Yarner Wood Rural 3.57* 1.43 40
204 Cwmystwyth Rural 3.03* 1.40 46
205 Harwell Rural 4.21 1.48 35
206 Heigham Holmes Rural 4.42 1.50 34
208 Detling Rural 3.81 1.44 38
209 Fenny Compton Rural 4.92 1.24 25
Network Average 7.87 1.95 33
Table 3: Average ambient concentrations of beryllium based on analysis of 3 -5 months’ worth of filters at each network monitoring site. 245
14
# The sites at Sandvik, Neath and Pontardawe Leisure Centre are operated independently of the network by Neath Port Talbot County Borough Council. 246 * Denotes concentrations < Limit of Quantitation (LOQ = 3.78 pg m-3). All concentrations were above the Limit of Detection (LOD = 1.13 pg m-3). 247
248

15
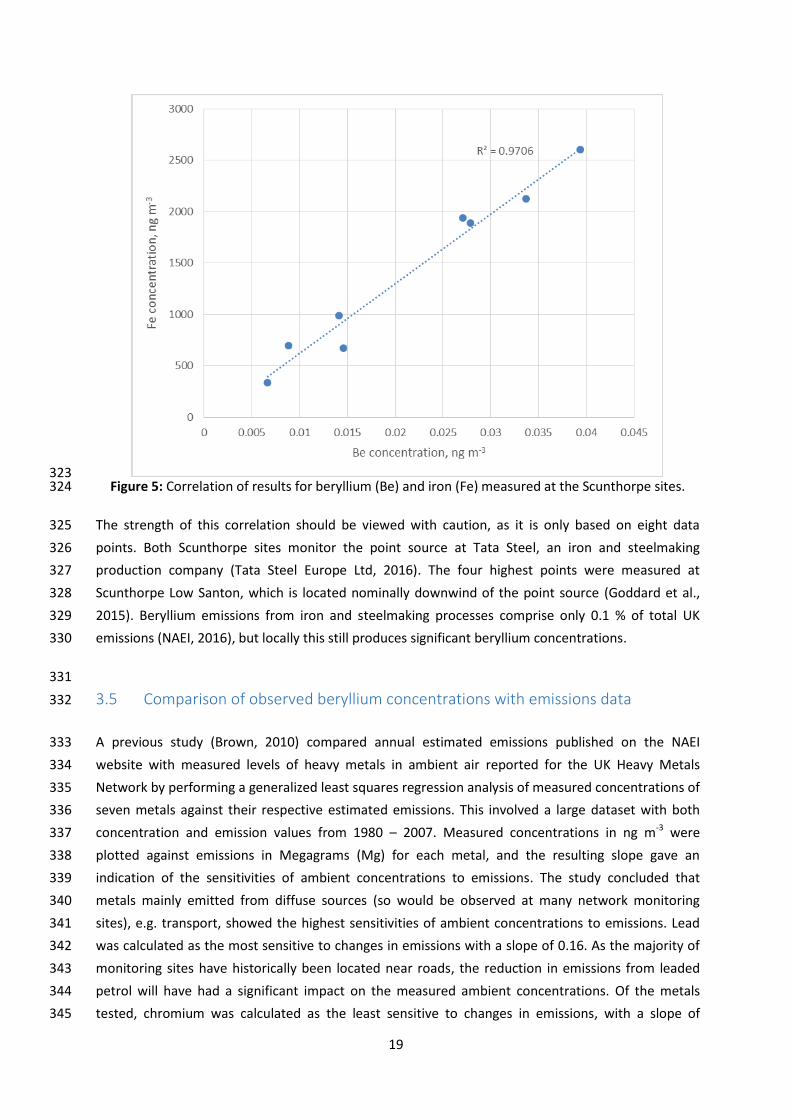
Distinct differences can be seen between results from sites of different classifications, see Fig. 3. 249
250 Figure 3: Ambient concentrations of beryllium at each network monitoring site with site classifications indicated.251

16
252 It is clear from Fig. 3 that the highest concentrations of beryllium were found at sites in the Urban 253
Industrial classification. These sites are located in urban areas exposed to industrial point sources 254
(Goddard et al., 2015). The difference between beryllium levels observed at Urban Industrial sites 255
and sites of other classifications suggests that some of the industrial point sources are producing 256
incrementally higher emissions of beryllium than in purely urban locations. Road traffic contributes a 257
significant source of beryllium emissions from combustion of DERV (diesel oil for road vehicles) from 258
cars, LGVs and HGVs (NAEI, 2016), and is used in automotive components (Beryllium Science and 259
Technology Association, 2016) which explains why the levels at Urban Traffic sites are higher than 260
levels at Rural sites. The only Industrial Suburban site, Pontardawe Brecon Rd., is located downwind 261
of a point source, hence the levels slightly above the Rural baseline. As would be expected, the 262
lowest concentrations of beryllium were measured at Rural sites. 263
The five Urban Industrial sites showing the highest average beryllium ambient concentrations were: 264
Scunthorpe Low Santon (32.0 pg m-3), Port Talbot (19.0 pg m-3); Bilston Lane, Walsall (17.6 pg m-3); 265
Scunthorpe Town (11.1 pg m-3) and Sheffield Tinsley (9.32 pg m-3). 266
The point source for the Port Talbot, Scunthorpe Town and Low Santon sites is Tata Steel, a steel 267
production company (Tata Steel Europe Ltd, 2016). Tata Steel produces structural components for 268
use in the automotive industry, a known area of application for beryllium metal (Materion 269
Corporation, 2015). 270
The point source for the site at Bilston Lane, Walsall is Brookside Metals, a company listed as 271
producing gunmetal, brass, bronze and other copper alloy ingots (Brookside Metals, 2016). The 272
measured concentrations suggest that the site may produce beryllium alloys such as copper-273
beryllium or nickel-beryllium. 274
The Sheffield Tinsley site is located downwind of the Outokumpu plant which produces stainless steel 275
(Outokumpu, 2016). The levels observed suggest the plant may be involved in processing beryllium 276
alloys, or producing components containing beryllium. 277
Of the two Urban traffic sites, the highest beryllium concentration was observed at London 278
Marylebone Road (8.77 pg m-3). The most likely source for sites in this classification is road traffic, in 279
particular for beryllium emissions, combustion of DERV (diesel oil for road vehicles) from cars, LGVs 280
and HGVs (NAEI, 2016). 281
While the levels found at these sites are the highest observed in this study, the averages are still 282
significantly below the EPAQs guideline level of 0.2 ng m-3 (EPAQs, 2008). The averages at all 283
17
stations are an order of magnitude below the EPAQs guidelines with the exception of Scunthorpe 284
Low Santon, where the average is six times less than the guideline. 285
To summarise the overall influence of site classification on the beryllium concentrations measured, 286
Table 4 shows the average incremental concentration increases between the site classifications in 287
ascending order. 288
Site Classification Average beryllium
concentration / pg m-3
Approximate increment
according to site type / pg m-3
Rural 3.6 -
Urban Background 6.5 2.9
Urban Traffic 8.0 1.5
(Sub)urban Industrial 11.9* 3.9*
Table 4: Showing the average incremental changes observed between sites in different site 289 classifications. *The concentrations measured in (Sub)urban industrial locations varied significantly, 290 from 3.71 pg m-3 (comparable to rural sites) – 32.0 pg m-3. Therefore the incremental change from 291
concentrations found at Urban Traffic sites ranged considerably. 292 293
The incremental concentration increases were calculated as shown below: 294
[𝐵𝑒]𝑈𝐵 − [𝐵𝑒]𝑅 = 𝐼𝑅:𝑈𝐵
Where: 295
[Be]UB = average beryllium concentration found at urban background sites 296
[Be]R = average beryllium concentration found at rural sites 297
IR:UB = approximate incremental increase in beryllium concentration from rural to urban background 298
sites 299
The increments for the other site classifications were calculated in the same way. 300
301

18
3.4 Correlation of Beryllium with other metals 302
The network samples are analysed for the following suite of heavy metals to meet the reporting 303
requirements of the Heavy Metals Network: vanadium (V), chromium (Cr), manganese (Mn), iron (Fe) 304
cobalt (Co), nickel (Ni), copper (Cu), zinc (Zn), arsenic (As), selenium (Se), cadmium (Cd) and lead (Pb) 305
(Goddard et al., 2015). The beryllium results obtained for the network samples were compared to the 306
results measured for the other metals to see if there were any correlations that could suggest shared 307
point sources. The datasets had outliers removed using Grubbs’ test for statistical outliers (Grubbs, 308
1969) before the correlations were calculated. 309
The highest correlation found using the whole dataset (outliers removed), although still not 310
particularly strong, was between the beryllium and lead results, giving an R2 of 0.5043 (see Fig. 4). 311
Other high correlations were with manganese: 0.4653 and vanadium: 0.3911. 312
313 Figure 4: Correlation of results for beryllium (Be) and lead (Pb) measured in network samples. 314
None of the calculated correlations are particularly high, but the scatter plot indicates a clear 315
relationship with lead. The lowest correlation was between beryllium and nickel, R2: 0.0008. In terms 316
of associations with similar point sources, beryllium, manganese and lead are all emitted by the 317
combustion of coal from industrial and domestic sources (NAEI, 2016). A significant proportion of 318
beryllium and vanadium emissions are attributed to road transport combustion of DERV (NAEI, 2016). 319
By comparison, none of these sources are associated with significant emissions of nickel. 320
At the two Scunthorpe monitoring sites, Scunthorpe Town and Scunthorpe Low Santon, a strong 321
correlation was observed between beryllium and iron, R2: 0.9706, see Figure 5 below. 322
19
323 Figure 5: Correlation of results for beryllium (Be) and iron (Fe) measured at the Scunthorpe sites. 324
The strength of this correlation should be viewed with caution, as it is only based on eight data 325
points. Both Scunthorpe sites monitor the point source at Tata Steel, an iron and steelmaking 326
production company (Tata Steel Europe Ltd, 2016). The four highest points were measured at 327
Scunthorpe Low Santon, which is located nominally downwind of the point source (Goddard et al., 328
2015). Beryllium emissions from iron and steelmaking processes comprise only 0.1 % of total UK 329
emissions (NAEI, 2016), but locally this still produces significant beryllium concentrations. 330
331
3.5 Comparison of observed beryllium concentrations with emissions data 332
A previous study (Brown, 2010) compared annual estimated emissions published on the NAEI 333
website with measured levels of heavy metals in ambient air reported for the UK Heavy Metals 334
Network by performing a generalized least squares regression analysis of measured concentrations of 335
seven metals against their respective estimated emissions. This involved a large dataset with both 336
concentration and emission values from 1980 – 2007. Measured concentrations in ng m-3 were 337
plotted against emissions in Megagrams (Mg) for each metal, and the resulting slope gave an 338
indication of the sensitivities of ambient concentrations to emissions. The study concluded that 339
metals mainly emitted from diffuse sources (so would be observed at many network monitoring 340
sites), e.g. transport, showed the highest sensitivities of ambient concentrations to emissions. Lead 341
was calculated as the most sensitive to changes in emissions with a slope of 0.16. As the majority of 342
monitoring sites have historically been located near roads, the reduction in emissions from leaded 343
petrol will have had a significant impact on the measured ambient concentrations. Of the metals 344
tested, chromium was calculated as the least sensitive to changes in emissions, with a slope of 345
20
0.0054. This was considered to be because the annual average concentrations were dominated by 346
emissions from a single point source, measured at just one monitoring site (Brown, 2010). Vanadium 347
was the next least sensitive with a slope of 0.015, and appeared to be an outlier when the proportion 348
of estimated transport-related emissions were plotted against the emission sensitivity ratio for each 349
metal. Vanadium had the second highest percentage of estimated transport emissions, yet the 350
second lowest emission sensitivity ratio. The study found that the NAEI had revised historical 351
vanadium emissions estimates downwards, which suggests overestimation of vanadium emissions 352
had previously been a problem (Brown, 2010). 353
For the current study, the median beryllium concentration in ng m-3 was ratioed against the total UK 354
beryllium emissions value in Megagrams (Mg) reported on the NAEI website (NAEI, 2016) for the year 355
2013 (the latest year for which data is available at time of publishing). The resulting ratio was: 356
0.0067 𝑛𝑔 𝑚−3
5.4106 𝑀𝑔= 0.0012 𝑛𝑔 𝑚−3𝑀𝑔−1
This value is less than that calculated for chromium and vanadium in the previous study (Brown, 357
2010), so could imply that measured ambient beryllium concentrations are relatively insensitive to 358
changes in emissions, indicating a higher proportion of emissions from industrial point sources. 359
However, according to the NAEI (2016), DERV from road traffic constitutes the largest single 360
contributory source of beryllium emissions. This contradiction may indicate a similar issue to that 361
observed with vanadium in the previous study, of an overestimation of beryllium emissions, 362
particularly from transport sources. In support of this, Figure 2 shows that beryllium concentrations 363
were significantly higher at sites monitoring industrial point sources than diffuse traffic sources. 364
To draw more definitive conclusions a larger dataset of concentration: emission ratios over a longer 365
time period would clearly be preferable, but as the only available concentrations from which to 366
calculate a ratio were from the present study, that was a limiting factor. Nonetheless, the amount of 367
sub-data contributing to the single ratio calculated is substantial, which gives confidence that the 368
value generated is suitable for comparison with the ratios calculated in the previous study (Brown, 369
2010). 370
371
3.6 Water soluble beryllium 372
A selection of the UK Heavy Metals Network filters tested for total beryllium were also tested for 373
indicative levels of water soluble beryllium species. 374
The indicative results obtained for water soluble beryllium are shown in Figure 6, along with the total 375
beryllium measured for the same sample for comparison. The sample IDs are in the format of: Site 376
number – Year sampled – Batch period of year sampled – Number of filters in batch. (Filters are 377
sampled weekly, then batched together into four-weekly batches for digestion and analysis. A year is 378
divided into 13 four weekly periods.) 379
21
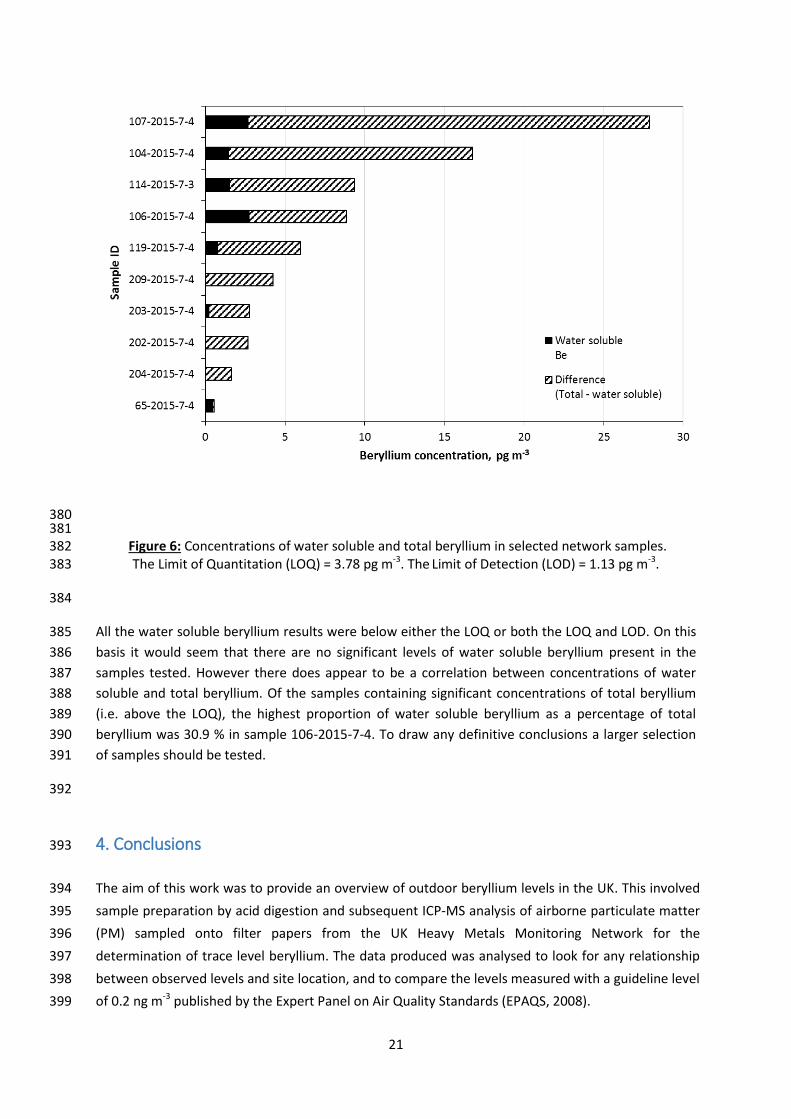
380 381
Figure 6: Concentrations of water soluble and total beryllium in selected network samples. 382 The Limit of Quantitation (LOQ) = 3.78 pg m-3. The Limit of Detection (LOD) = 1.13 pg m-3. 383
384
All the water soluble beryllium results were below either the LOQ or both the LOQ and LOD. On this 385
basis it would seem that there are no significant levels of water soluble beryllium present in the 386
samples tested. However there does appear to be a correlation between concentrations of water 387
soluble and total beryllium. Of the samples containing significant concentrations of total beryllium 388
(i.e. above the LOQ), the highest proportion of water soluble beryllium as a percentage of total 389
beryllium was 30.9 % in sample 106-2015-7-4. To draw any definitive conclusions a larger selection 390
of samples should be tested. 391
392
4. Conclusions 393
The aim of this work was to provide an overview of outdoor beryllium levels in the UK. This involved 394
sample preparation by acid digestion and subsequent ICP-MS analysis of airborne particulate matter 395
(PM) sampled onto filter papers from the UK Heavy Metals Monitoring Network for the 396
determination of trace level beryllium. The data produced was analysed to look for any relationship 397
between observed levels and site location, and to compare the levels measured with a guideline level 398
of 0.2 ng m-3 published by the Expert Panel on Air Quality Standards (EPAQS, 2008). 399
22
An average beryllium concentration obtained from filter batches sampled over the sampling period 400
was ascertained for each monitoring site on the network. All concentrations were significantly below 401
the EPAQs guideline level of 0.2 ng m-3. The average concentration across the network for the 402
duration of the study period was 7.87 pg m-3. The maximum average site concentration observed was 403
32.0 pg m-3 (0.032 ng m-3) at Scunthorpe Low Santon. 404
While the ambient beryllium concentrations were low, there were still noticeable links between 405
concentrations and site classification and location. The highest concentrations were observed at sites 406
in the (Sub)urban Industrial classification. The top five concentrations were found at Scunthorpe Low 407
Santon, Port Talbot; Bilston Lane, Walsall, Scunthorpe Town; and Sheffield Tinsley. All these sites are 408
located to monitor specific industrial point sources of emissions that are known to use or produce 409
metals or metal alloys (Goddard et al, 2015). Such industries have known applications for beryllium 410
(Brookside Metals, 2016), so are most likely to be the sources of the elevated beryllium levels. 411
Concentrations of heavy metals in ambient air are not considered subject to significant seasonal 412
variation (Goddard et al., 2015), therefore the average concentrations measured over the sampling 413
period of three to five months should be considered strongly indicative of an annual average. Even 414
so, it would be beneficial for potential future studies to analyse filters sampled over a longer time 415
period to give greater confidence in the conclusions drawn and establish any longer-term trends. 416
The network site locations are chosen to be representative of site classification specifications 417
(Goddard et al, 2015), not because high concentrations of beryllium are expected there. It is possible 418
that a site located to monitor a confirmed source of beryllium emissions would yield higher 419
concentrations than those observed from the existing network sites. Additionally, only two Urban 420
traffic sites are included in the network site configuration. As road transport is known to contribute 421
to a significant proportion of beryllium emissions (NAEI, 2016), and the roadside study in 422
Birmingham, UK (Harrison et al., 2003) found daily concentrations from 0.01 – 0.15 ng m-3 (EPAQS, 423
2008), further monitoring at roadside locations would be advantageous to gain a better 424
understanding of levels of beryllium emissions from transport. 425
The beryllium levels measured in the network samples were compared to levels of the other metals 426
reported in the same samples to meet the requirements of the Heavy Metals Network, to ascertain if 427
there were any correlations that could suggest shared point sources. The highest correlations found 428
were with lead, manganese and vanadium (using the whole dataset) and iron (at the two Scunthorpe 429
sites, monitoring the Tata iron and steelworks). Beryllium, manganese and lead are all emitted by the 430
combustion of coal from industrial and domestic sources (NAEI, 2016). A significant proportion of 431
beryllium and vanadium emissions are attributed to road transport combustion of DERV (diesel oil for 432
road vehicles) from cars, LGVs and HGVs (NAEI, 2016). Beryllium emissions from iron and steelmaking 433
processes comprise only 0.1 % of total UK emissions (NAEI, 2016), but locally this still produces 434
significant beryllium concentrations. 435
23
The median beryllium concentration observed in this study was compared to estimated beryllium 436
emissions (NAEI, 2016), to gain an insight into the nature of emissions sources. The ratio of 437
concentrations: emissions yielded a value indicative of industrial point sources contributing the 438
largest proportion of emissions. However the NAEI suggests the largest emission of beryllium are 439
from diffuse traffic sources. Similarly to previous observations for vanadium (Brown, 2010) this 440
indicates that emissions of beryllium may be overestimated by the NAEI, probably by at least an 441
order of magnitude. These observations should only be considered indicative, as the only available 442
concentrations from which to calculate a ratio were from the present study. 443
A selection of the UK Heavy Metals Network filters tested for total beryllium were also tested for 444
water soluble beryllium species, as these are more easily absorbed into biological systems and 445
therefore pose a significant health risk to humans and ecosystems (Williams et al., 2000). Conversely, 446
insoluble or low-solubility beryllium containing particles that are inhaled can also cause adverse 447
health effects as they are slowly solubilized over the course of many years (Maier, 2002). 448
All the water soluble beryllium results were below either the LOQ or both the LOQ and LOD, so on 449
that basis it seems that no significant levels of water soluble beryllium were present in the samples 450
tested. A correlation between concentrations of water soluble and total beryllium was apparent. Of 451
the samples containing significant concentrations of total beryllium, the highest proportion of water 452
soluble beryllium as a percentage of total beryllium was 30.9 %. To draw any definitive conclusions a 453
larger selection of samples should be tested. 454
Overall, the low beryllium concentrations measured at the network sites gives reassurance that 455
beryllium emissions are not likely to pose a significant problem for UK ambient air quality, even 456
though the highest levels were measured at sites monitoring industrial point sources, suggesting a 457
strong possibility that beryllium is being used at these facilities. Targeted monitoring at confirmed 458
industrial point sources (especially coal-fired power stations) and roadside locations would be 459
advantageous to establish potential hot-spots of beryllium emissions that would not have been 460
apparent at the existing network sites. 461
462

24
Acknowledgements 463
The funding of the Heavy Metals air quality networks by the UK Department for Environment, Food 464
and Rural Affairs, and the Optical, Gas and Particle Metrology Programme within the UK National 465
Measurement System by the UK Department for Business, Innovation and Skills are gratefully 466
acknowledged. 467 468
25
References 469
470
Ashley, K., Brisson, M. J.and Jahn S.D. (2005) Standard Methods for Beryllium Sampling and Analysis: 471
Availabilities and Needs, Journal of ASTM International, Vol. 2, No. 9. 472
Benko, V., Vasileva, E. V. and Symon, K. (1980). Immunological aspects of exposure to emissions from 473
burning coal of high beryllium content. Environ. Res. 22, 439-449. 474
Beryllium Science and Technology Association (2016) http://beryllium.eu/about-beryllium-and-475
beryllium-alloys/properties-of-beryllium/properties-of-beryllium-alloys/ (accessed 09/03/16) 476
Brisson, M. J. Ashley, K., Stefaniak, A. B., Ekechukwu, A. A. and Creek, K. L. (2006) Trace-level 477
beryllium analysis in the laboratory and in the field: state of the art, challenges and opportunities, J. 478
Environ. Monit., Vol. 8, pp 605-611. 479
Brookside Metals (2016) http://www.brooksidemetal.com/ (accessed 09/03/16) 480
Brown, R. J. C., Yardley, R. E., Muhunthan, D, Butterfield, D. M., Williams, M., Woods, P. T., Brown, 481
A.S. and Goddard, S.L. (2008) Twenty-five years of nationwide ambient metals measurement in the 482
United Kingdom: concentration levels and trends, Environ. Monit. Assess., Vol. 142, Issue 1, pp 127 - 483
140 484
Brown, R. J. C. (2010) Comparison of estimated annual emissions and measured annual ambient 485
concentrations of metals in the UK 1980 – 2007. J. Environ. Monit., Vol. 12, pp 665-671. 486
Defra (2015) http://uk-air.defra.gov.uk/networks/site-types (accessed 11/08/15) 487
EPAQs (2008) Consultation on guidelines for metals and metalloids in ambient air for the protection 488
of human health, May 2008, Defra. 489
Eisenbud, M. R.C. Wanta, C. Dustan, L.T. Steadman, W.B. Harris and B.S. Wolf. (1949). Non-490
occupational berylliosis. J. Ind. Hyg. Toxicol. 31, 282- 294. 491
European Commission (2015) Air Quality – Existing Legislation 492
http://ec.europa.eu/environment/air/quality/legislation/existing_leg.htm (accessed 18/11/15) 493
European Commission (2008) Council Directive 2008/50/EC of the European Parliament and of the 494
Council of 21 May 2008 on ambient air quality and cleaner air for Europe. Official Journal of the 495
European Union, L152_1, p 1–44. 496

26
European Commission (2005a). Council Directive 2004/107/EC of the European Parliament and of the 497
Council of 15 December 2004 relating to arsenic, cadmium, mercury, nickel and polycyclic aromatic 498
hydrocarbons in ambient air. Official Journal of the European Union, L023_3, p 3–16. 499
Goddard, S. L., Brown, R. J. C., Butterfield, D. M., McGhee, E. A., Robins, C., Brown, A.S, Beccaceci, S., 500
Lilley, A., Bradshaw, C. and Brennan, S. (2015) Annual Report for 2014 on the UK Heavy Metals 501
Monitoring Network, Queen’s Printer and Controller of HMSO, Teddington. 502
Grubbs, Frank (February 1969), Procedures for Detecting Outlying Observations in Samples, 503
Technometrics, 11(1), pp. 1-21. 504
Harrison, R. M., Tilling, R., Romero, M. S. C., Harrad, S. and Jarvis, K. (2003) A study of trace metals 505
and polycyclic aromatic hydrocarbons in the roadside environment, Atmos. Environ. Vol. 37, pp 2391-506
2402. 507
Lamble, K. J. and Hill, S. J. (1998) Critical review: Microwave digestion procedures for environmental 508
matrices, Analyst, Vol. 123 (103R–133R). 509
Maier, L. A. (2002). Genetic and exposure risks for chronic beryllium disease. Clin. Chest Med. 23, 510
827-839. 511
Materion Corporation (2015) http://beryllium.com/About-512
Beryllium/Beryllium%20in%20Action.aspx (accessed 09/03/16) 513
National Atmospheric Emissions Inventory (NAEI) (2016) http://naei.defra.gov.uk/ 514
Oatts, T. J., Hicks, C. E., Adams, A. R. and Ashley, K. (2012) Preparation, certification and 515
interlaboratory analysis of workplace air filters spiked with high-fired beryllium oxide, J. Environ. 516
Monitor. Vol. 14, pp 391-401. 517
Outokumpu (2016) http://www.outokumpu.com/en/Pages/default.aspx 518 519
Sandroni, V., Smith, C. M. and Donovan, A. (2003) Microwave digestion of sediment, soils and urban 520
particulate matter for trace metal analysis, Talanta, Vol. 60 pp 715-723 521
Smith, I.M. NPL Report MS 11, Software for determining polynomial calibration functions by 522
generalised least squares: user manual; NPL: Teddington, 2010. 523
Tata Steel Europe Ltd (2016) http://www.tatasteeleurope.com/en/ (accessed 09/03/16) 524
WHO (2006) IARC Monograph: Lead and Lead Compounds, IARC, Lyon. 525
WHO (2012) IARC Monograph: Cadmium and Cadmium Compounds, IARC, Lyon. 526

27
WHO (1980) IARC Monographs on the Evaluation of Carcinogenic Risk to Humans: Some Metals and 527
Metallic Compounds, Volume 23, IARC, Lyon. 528
WHO (1993) IARC Monographs on the Evaluation of Carcinogenic Risk to Humans: Beryllium, 529
Cadmium, Mercury, and Exposures in the Glass Manufacturing Industry, Volume 58, IARC, Lyon. 530
Williams, P.L. (Ed.), James, R. C. (Ed.) and Roberts, S. M. (Ed.) (2000) Principles of Toxicology: 531
Environmental and Industrial Applications 2nd Edition, John Wiley & Sons, Inc. 532 533