2 Literature Review on Demand Driven Supply Chain (DDSC)
24
2 Literature Review on Demand Driven Supply Chain (DDSC) 2.1 Demand Driven Supply Chain Concepts This chapter reviews the concepts of DDSC described in the literature and will support the identification of key DDSC components. Before defining the DDSC concept, it is very important to review the concept of Supply Chain Management, as it will serve as the foundation to build the DDSC concept. To that end, the Council of Supply Chain Management Professionals (CSCMP) defines Supply Chain Management as follow: “…Supply Chain Management encompasses the planning and management of all activities involved in sourcing and procurement, conversion, and all logistics management activities. Importantly, it also includes coordination and collaboration with channel partners, which can be suppliers, intermediaries, third party service providers, and customers. In essence, supply chain management integrates supply and demand management within and across companies…”. And the boundaries and relationships are also defined as: “…Supply chain management is an integrating function with primary responsibility for linking major business functions and business processes, within and across companies, into a cohesive and high-performing business model. It includes all of the logistics management activities noted above, as well as manufacturing operations, and it drives coordination of processes and activities, with and across marketing, sales, product design, finance, and information technology…” Based on this definition, it can be pointed out two key concepts responsible for the success of Supply Chain Management initiatives in manufacturing and service companies: Supply Management and Demand Management. Bayraktar et al. (2009) also confirm the importance of demand management. They tested a framework identifying the causal links among supply chain management and information systems practices in small and medium size companies in Turkey. They performed hypotheses tests that indicate that both supply chain management and information systems practices positively and PUC-Rio - Certificação Digital Nº 0511118/CA
Transcript of 2 Literature Review on Demand Driven Supply Chain (DDSC)
2
Literature Review on Demand Driven Supply Chain (DDSC)
2.1
Demand Driven Supply Chain Concepts
This chapter reviews the concepts of DDSC described in the literature and will
support the identification of key DDSC components.
Before defining the DDSC concept, it is very important to review the concept of
Supply Chain Management, as it will serve as the foundation to build the DDSC
concept. To that end, the Council of Supply Chain Management Professionals
(CSCMP) defines Supply Chain Management as follow:
“…Supply Chain Management encompasses the planning and management of all
activities involved in sourcing and procurement, conversion, and all logistics
management activities. Importantly, it also includes coordination and
collaboration with channel partners, which can be suppliers, intermediaries, third
party service providers, and customers. In essence, supply chain management
integrates supply and demand management within and across companies…”.
And the boundaries and relationships are also defined as:
“…Supply chain management is an integrating function with primary responsibility
for linking major business functions and business processes, within and across
companies, into a cohesive and high-performing business model. It includes all of
the logistics management activities noted above, as well as manufacturing
operations, and it drives coordination of processes and activities, with and across
marketing, sales, product design, finance, and information technology…”
Based on this definition, it can be pointed out two key concepts responsible for
the success of Supply Chain Management initiatives in manufacturing and
service companies: Supply Management and Demand Management.
Bayraktar et al. (2009) also confirm the importance of demand management.
They tested a framework identifying the causal links among supply chain
management and information systems practices in small and medium size
companies in Turkey. They performed hypotheses tests that indicate that both
supply chain management and information systems practices positively and
PU
C-R
io -
Cert
ific
ação D
igital N
º 0511118/C
A

15
significantly influence the operational performance of 203 manufacturing
companies considered in the analysis. One of the SCM practices identified was
“close partnership with customers” or deemed by demand chain management.
Emmet & Crocker (2006) stated that Supply Chain Management is strategic and
also operational. By strategic, he gives an example that a company located in
any one country needs to be thinking about global sourcing of raw material and
packaging, new markets across the world, as the success of the business will
ultimately depend on the success of this end-to-end supply chain of which the
company is only part.
On the other hand, the supply chain is also operational, because the end-to-end
supply chain concept has to work in practice, and this is all about getting supply
chain thinking and skill-sets into every level of management and supervision, and
into execution in every business function, in every player in the value chain. The
drive for change needs to come from the top senior management, and the
leadership of change to convert supply chain thinking into operational practice,
must be taken up as a boardroom responsibility.
Emmet & Crocker (2006) stated that Logistics and Supply Chain are new
concepts, emerging only in the 80s and 90s. He argues that supply has a
connotation of being a push system, and for many the word “demand chain” is
more meaningful, and that these concepts are being combined as “the Demand–
Driven Supply Chain” (DDSC). He also explains that chains are being replaced
by networks in an attempt to find new expressions to demonstrate how the
thinking and practice can move forward.
Hull (2005) states that in a demand driven chain, a customer activates flow by
ordering from the retailer, who reorders from the wholesaler, who reorder from
the manufacturer, who reorder raw materials from the suppliers. Orders flow
backward, up the chain, in this structure. The activator can be either actual
customer demand as shown in figure 2, or forecasted customer demand.
Figure 2 – Demand Driven Flow (Hull, 2005)
PU
C-R
io -
Cert
ific
ação D
igital N
º 0511118/C
A

16
AMR research report (2005) defines the term “Demand Driven Supply Network”
(DDSN) as a system of technologies and business processes that sense and
respond to real-time demand across a network of customers, suppliers, and
employees. The report also states that DDSN leaders are more demand sensing,
which means being able to understand market drivers that impact demand, have
more efforts for demand shaping, which means being able to influence the
demand through specific market activities like special promotions, and focus on a
profitable demand response.
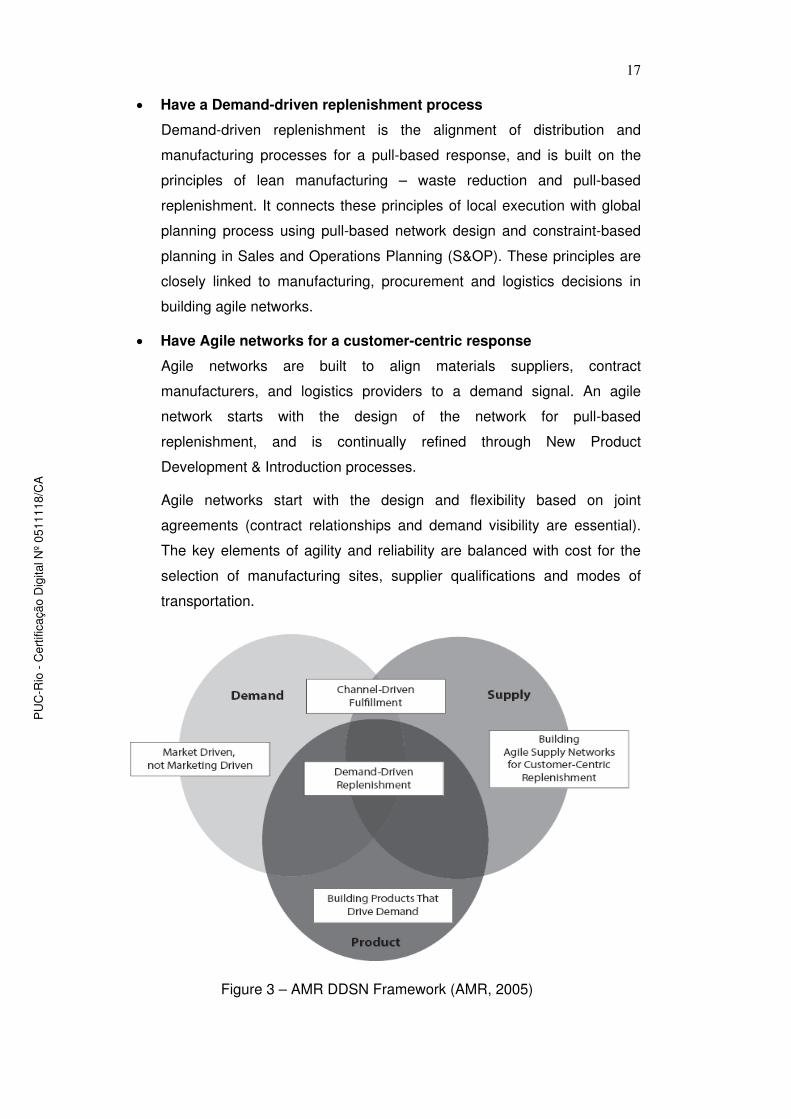
AMR proposes 5 cross-functional strategies to become DDSN. These strategies
are outlined on the AMR DDSN framework in figure 3:
• Being Market driven and not Marketing driven:
In Demand Driven Supply Chain companies, processes are built from the
outside-in, which means, they are based on a clear view of the customer,
what is important for them and the requirements for account profitability.
These companies become zealots on new product introductions and use
their supply networks to shape and respond to demand.
• Develop products that generate demand:
AMR argues that one of the successful factors of the AMR TOP 25 Supply
Chain companies is excellence in innovation. Being quick to market with
profitable products that are in high demand is a core competence of a
DDSN strategy. For DDSN leaders, innovation excellence is a key to
success, and it is infused into all supply chain processes. AMR research
shows that 75% of new products fail, and 42% of companies lack a
common set of internal standards for managing New Product
Development & Introduction process.
• Have a Channel-driven fulfillment process:
Channel-driven fulfillment is the redesign of order processes to become
demand driven, not order driven, and the supply chain strategy used is
based on service level agreement for pull-based replenishment to define
an order. Replenishment decisions are evaluated continuously for each
channel based on profitability and product placement goals. Supply chain
velocity and demand visibility are key elements for a successful execution
of channel driven.
PU
C-R
io -
Cert
ific
ação D
igital N
º 0511118/C
A
17
• Have a Demand-driven replenishment process
Demand-driven replenishment is the alignment of distribution and
manufacturing processes for a pull-based response, and is built on the
principles of lean manufacturing – waste reduction and pull-based
replenishment. It connects these principles of local execution with global
planning process using pull-based network design and constraint-based
planning in Sales and Operations Planning (S&OP). These principles are
closely linked to manufacturing, procurement and logistics decisions in
building agile networks.
• Have Agile networks for a customer-centric response
Agile networks are built to align materials suppliers, contract
manufacturers, and logistics providers to a demand signal. An agile
network starts with the design of the network for pull-based
replenishment, and is continually refined through New Product
Development & Introduction processes.
Agile networks start with the design and flexibility based on joint
agreements (contract relationships and demand visibility are essential).
The key elements of agility and reliability are balanced with cost for the
selection of manufacturing sites, supplier qualifications and modes of
transportation.
Figure 3 – AMR DDSN Framework (AMR, 2005)
PU
C-R
io -
Cert
ific
ação D
igital N
º 0511118/C
A
18
Ayers and Malmberg (2002) describe a Demand-Driven Supply Chain as one in
which the company is trying to shift from “build to forecast” to “build to order”
discipline. The Demand-Driven Supply Chain is one that derives the information
for production and inventory decisions from actual, real-time demand, and not
forecasts – even if the forecasts use past sales history as a basis. He also argues
that the property of being demand-driven is one of degree:
• Being “zero percent” demand-driven, means all production / inventory
decisions are based on forecasts, and so, all products available for sale to
the end user is there by virtue of a forecast. This could be the case of
fashion goods, where the designer may not know how buyers will react to
a new design, or the beverage industry, where products are produced
based on a given forecast.
• A “100 percent” demand-driven is one in which the order is received
before production begins. In this model, the commercial aircraft industry
comes close to this description.
Bowersox and Lahowchich (2008) describe that traditional supply chains have
been designed to operate in an anticipatory, or a “push mode”. The prevailing
distribution process is a time-consuming, forecast driven, volume oriented,
functionally centric consolidation process designed to “push” products to market
destinations in anticipation of future demand. The frequent result of this
anticipatory push process is far too much of the wrong inventory being pushed to
the wrong markets, and this missed alignment of inventory often results in firms
using incentives to entice consumers to buy products they have available to sell,
rather than providing the exact product the consumers desire to purchase.
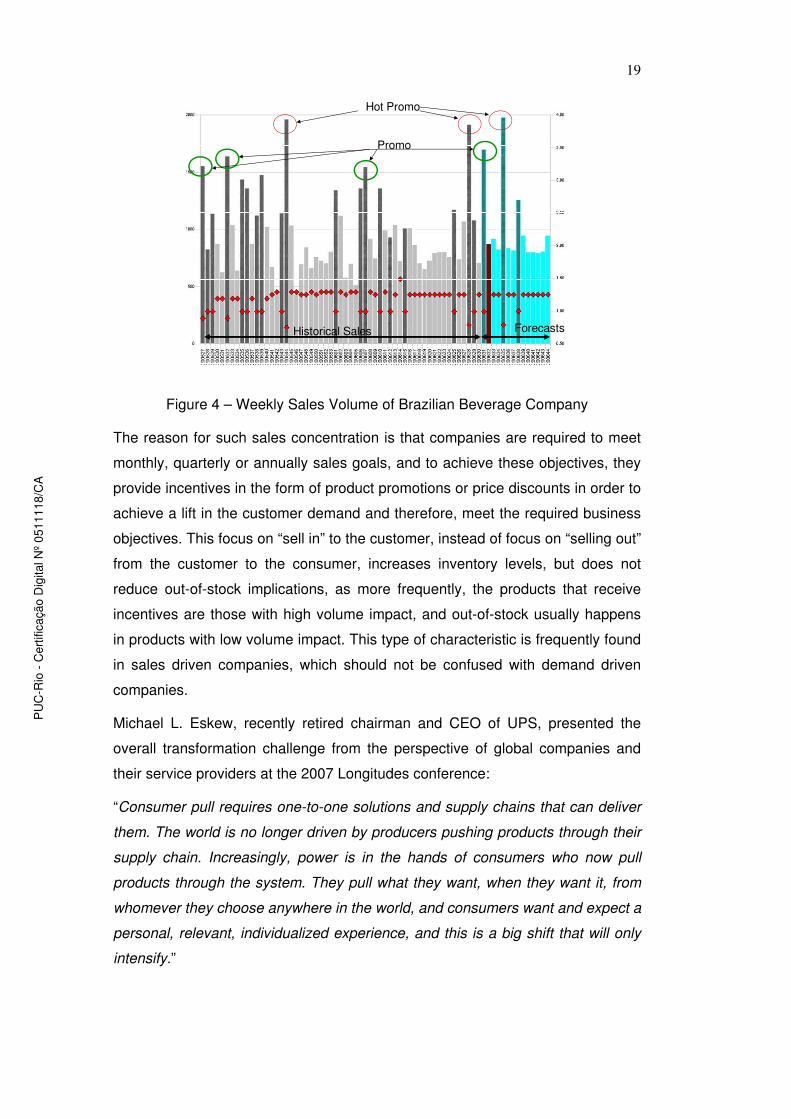
Throughout different industrial segments, business leaders and consultants had
difficulty explaining why, at the end of the week, or month, despite inventories
reaching high levels, out-of stocks were excessive. It is also difficult to fully
understand why 70 – 80% of trade sales of some consumer products like
beverage, food, disposable diapers, occur in the last week of the month or at the
end of the business quarter. The chart in figure 4 gives an example of the high
sales variability due to promotions faced by a beverage company in one region of
Brazil:
PU
C-R
io -
Cert
ific
ação D
igital N
º 0511118/C
A
19
Historical Sales Forecasts
Hot Promo
Promo
Figure 4 – Weekly Sales Volume of Brazilian Beverage Company
The reason for such sales concentration is that companies are required to meet
monthly, quarterly or annually sales goals, and to achieve these objectives, they
provide incentives in the form of product promotions or price discounts in order to
achieve a lift in the customer demand and therefore, meet the required business
objectives. This focus on “sell in” to the customer, instead of focus on “selling out”
from the customer to the consumer, increases inventory levels, but does not
reduce out-of-stock implications, as more frequently, the products that receive
incentives are those with high volume impact, and out-of-stock usually happens
in products with low volume impact. This type of characteristic is frequently found
in sales driven companies, which should not be confused with demand driven
companies.
Michael L. Eskew, recently retired chairman and CEO of UPS, presented the
overall transformation challenge from the perspective of global companies and
their service providers at the 2007 Longitudes conference:
“Consumer pull requires one-to-one solutions and supply chains that can deliver
them. The world is no longer driven by producers pushing products through their
supply chain. Increasingly, power is in the hands of consumers who now pull
products through the system. They pull what they want, when they want it, from
whomever they choose anywhere in the world, and consumers want and expect a
personal, relevant, individualized experience, and this is a big shift that will only
intensify.”
PU
C-R
io -
Cert
ific
ação D
igital N
º 0511118/C
A

20
As there are many definitions of Push vs. Pull systems, it is important to clear
define the two concepts, as they are keystone in the demand driven concept.
At the 2005 Aspen Institute Roundtable on Information Technology, 25 thought
leaders discussed the broad implications of push versus pull economies,
generating the following definitions:
• A push economy is the kind of economy that was responsible for mass
production in the 20th century, and is based on anticipating consumer
demand, and then, making sure that needed resources are brought
together at the right place, at the right time, for the right people. A
company forecasts demand, specifies in advance the necessary inputs,
regiments production procedures, and then pushes the final product into
the marketplace using standardized distribution channels and marketing;
• A pull economy is the kind of economy that appears to be materializing in
online environments, and is based on open, flexible production platforms
that use networking technologies to orchestrate a broad range of
resources. Instead of producing standardized products for mass markets,
companies use pull techniques to assemble products in customized ways
to serve local or specialized needs, usually in a rapid or more informal,
“on-the-fly processes”.
Hopp and Spearman (2003) provide a brief history of the Pull system and also a
more clear definition of strategic and tactical Pull system, as well as Push
system:
• Strategic Pull can be defined as establishing a takt time to set the output
of the production plant to be equal to demand
• Tactical Pull system is the one that explicitly limits the amount of work in
process that can be in the production system.
• By default, it is implied that a Push production system is the one that has
no explicit limit on the amount of work in process that can be in the
system.
The good news about this definition of Pull is that it implies that pull can be
implemented in a variety of ways. To illustrate this argument, Hopp and
Spearman (2003) give some examples of common systems found in industry
and how they should be classified in either Push or Pull, as detailed below:
PU
C-R
io -
Cert
ific
ação D
igital N
º 0511118/C
A

21
• MRP is a push system because releases are made according to a master
production schedule without regard to system status. Hence, no a priori
work in process (WIP) limit exists.
• MRP with a WIP constraint is a pull system.
• Classic Kanban is a pull system, as the number of kanban cards
establishes a fixed limit on WIP.
• Classic Base Stock System is a push system because there is no limit on
the amount of work in process in the system.
• Installation stock (Q,r) is a push system as it does not impose a limit on
the number of orders in the system.
They also argue that there are three primary logistical reasons for the improved
performance of pull systems:
• Less congestion – Comparison of an open queuing network with an
“equivalent” closed one shows that the average WIP is lower in the
closed network than the open network given the same throughput.
• Easier control – WIP is easier to control than throughput since it can be
observed directly.
• WIP Cap – The benefits of a pull environment owe more to the fact that
WIP is bounded than to the practice of “pulling” everywhere.
Ashayeri and Kampstra also provide a concise definition, as described below:
• PUSH – Node performs order planning for succeeding node. Control
information flow is in the same direction of goods flow.
• SEMI PUSH or PUSH – PULL – Succeeding node makes order request
for preceding node. Preceding node reacts by replenishing from stock that
is rebuilt every fixed period.
• PULL – Succeeding node makes order request for preceding node.
Preceding node reacts by producing the order, which involves all internal
operations, and replenishes when finished.
• SEMI PULL or PULL – PUSH – Succeeding node makes order request for
preceding node. Preceding node reacts by replenishing from stock that is
rebuilt immediately.
PU
C-R
io -
Cert
ific
ação D
igital N
º 0511118/C
A
22
Harrison (2003) describes 3 different supply chain strategies that a company can
implement:
• Push-based strategy in which production and distribution decisions are
based on long-term forecasted demand. In this case, it takes much longer
to the company to react to the changing marketplace. As the strategy
relies on forecasts, it is most of the time difficult to match supply and
demand.
• Pull-based strategy in which production and distribution are demand
driven, so that they are coordinated with true customer demand rather
than forecast. In this case, the company does not hold any inventory and
only produces to order. These systems are intuitively attractive since they
allow the company to eliminate inventory while responding to customer
demand. Unfortunately, it is very difficult to implement a pull based
strategy when lead times are so long, that it is impractical to react to
demand information. Similarly, it is frequently more difficult to take
advantage of economies of scale, since production and distribution
decisions are made in response to specific customer demand, and
therefore, batch production or efficient transportation modes, such as
truckloads, are hard to achieve.
The advantages and disadvantages of Push and Pull supply chain strategies
have led companies to look for a new supply chain strategy that exploits the best
of both worlds: The Hybrid Push-Pull supply chain strategy.
• Hybrid Push-Pull strategy in which some stages of the supply chain,
typically the initial stages, are operated in a Push-based manner, while
the remaining stages are operated in a Pull-based strategy, and the
interface between the Push-based stages and the Pull-based stages is
usually referred to as the “Push-Pull boundary”.
Harrison (2003) also argues that the challenge for the firms is to define which of
the three supply chain strategies described above is most appropriate for each
product. Figure 5 below provides a framework to match supply chain strategies
with products and industries. In the vertical axis, it is shown information on
uncertainty in customer demand, while the horizontal axis represents the
importance of economies of scale, either in production or distribution:
PU
C-R
io -
Cert
ific
ação D
igital N
º 0511118/C
A

23
Figure 5 – Matching Supply Chain Strategies with Products (Harrison, 2003)
Assuming everything else being equal, the higher the demand uncertainty, the
more the firm would prefer managing the supply chain based on realized
demand, that is, based on a Pull strategy. On the other hand, the smaller the
demand uncertainty, the more the firm would be interested in managing the
supply chain based on forecast, that is, based on a Push strategy. The same
logical is true for analyzing the economies of scale, that is, the higher the
importance of economies of scale in reducing cost, the more important is to
aggregate demand, and thus, the more important is to manage the supply chain
based on forecast.
Based on the framework illustrated in the figure 6, Harrison (2003) summarizes
when to use each one of the 3 supply chain strategies:
• Push based supply chain strategy, usually suggested for products with
small demand uncertainty, as the forecast will provide a good direction on
what to produce and keep in inventory, and also for products with high
importance of economies of scale in reducing costs.
• Pull based supply chain strategy, usually suggested for products with high
demand uncertainty and with low importance of economies of scales,
which means, aggregation does not reduce cost, and hence, the firm
would be willing to manage the supply chain based on realized demand.
• Hybrid Push – Pull strategy, usually suggested for products which
uncertainty in demand is high, while economies of scale are important in
reducing production and / or delivery costs. One good example of this
strategy is the furniture industry, where production strategy has to follow a
Pull-based strategy, since it is impossible to make production decisions
based on long-term forecasts. On the other hand, the distribution strategy
PU
C-R
io -
Cert
ific
ação D
igital N
º 0511118/C
A
24
needs to take advantage of economies of scale in order to reduce
transportation cost, using a Push-based strategy.
For a hybrid Push-Pull strategy, a second important decision is to define where to
locate the Push-Pull boundary in the supply chain. Harrison (2003) states that the
Push part is applied to the portion of the supply chain where demand uncertainty
is relatively small, and thus, managing this portion based on long-term forecast is
appropriate. On the other hand, the Pull part is applied to the portion of the
supply chain where uncertainty is high, and hence, it is important to manage this
part based on realized demand. One illustrative example is Dell, who
implemented the Push-Pull strategy by locating the boundary at the assembly
point.
Wanke et al. (2010) argue that the perception of logistics systems being complex
is confirmed by several authors, but it is not always clear what does it mean.
They defined complexity in logistics in terms of quantifiable scales and based on
the notion of numerous actors or parts that are interconnected and can be
captured by measures such as the company’s gross revenue, its number of
suppliers, active customers, number of employees, number of employees
involved in supply chain management, active stock keeping units (SKUs), number
of distribution centers, orders processed and new product launches per year.
They proposed that logistics complexity is a driver to define the way a company
manages and emphasizes the different supply chain objectives and decision
areas, and based on this, a contingency approach for supply chain management
is required, where different contextual conditions drive the way the supply chain
choices are made and management activities are performed, as opposed to a
best practice approach where there would be some universally applicable
principles that would be appropriate regardless of the particular conditions under
study.
Zeithaml et al. (1988) describe that the essential premise of the contingency
approach is that effectiveness, broadly defined as organizational adaptation and
survival can be achieved in more than one way. They give the example that there
is more than one way to organize effectively, and more than one leadership style
that can achieve organizational goals. The contingency approach therefore,
suggests that it can be observed wide variations in effectiveness, but that these
variations are not random. Effectiveness depends on the appropriate matching of
PU
C-R
io -
Cert
ific
ação D
igital N
º 0511118/C
A
25
contingency factors with internal organizational designs that can allow
appropriate responses to the environment.
One example of contingency approach applied to supply chain management
comes from Fisher (1997). He proposes a framework to define what is the best
supply chain for a company’s product. He argues that the first step in devising an
effective supply chain strategy is to consider the nature of the demand for the
products. To that end, many aspects are important, for example, product
lifecycle, demand predictability, product variety, and market standards for lead
time and service. He proposes to classify products on two categories: They are
either primarily Functional or primarily Innovative, as summarized below:
Functional Products:
¯ Product do not change much over time;
¯ Have stable and predictable demand;
¯ Long life cycles;
¯ Lower potential growth.
Innovative Products:
¯ Great variety of products;
¯ Increase unpredictability (volatile demand);
¯ Short life cycles;
¯ Higher potential growth.
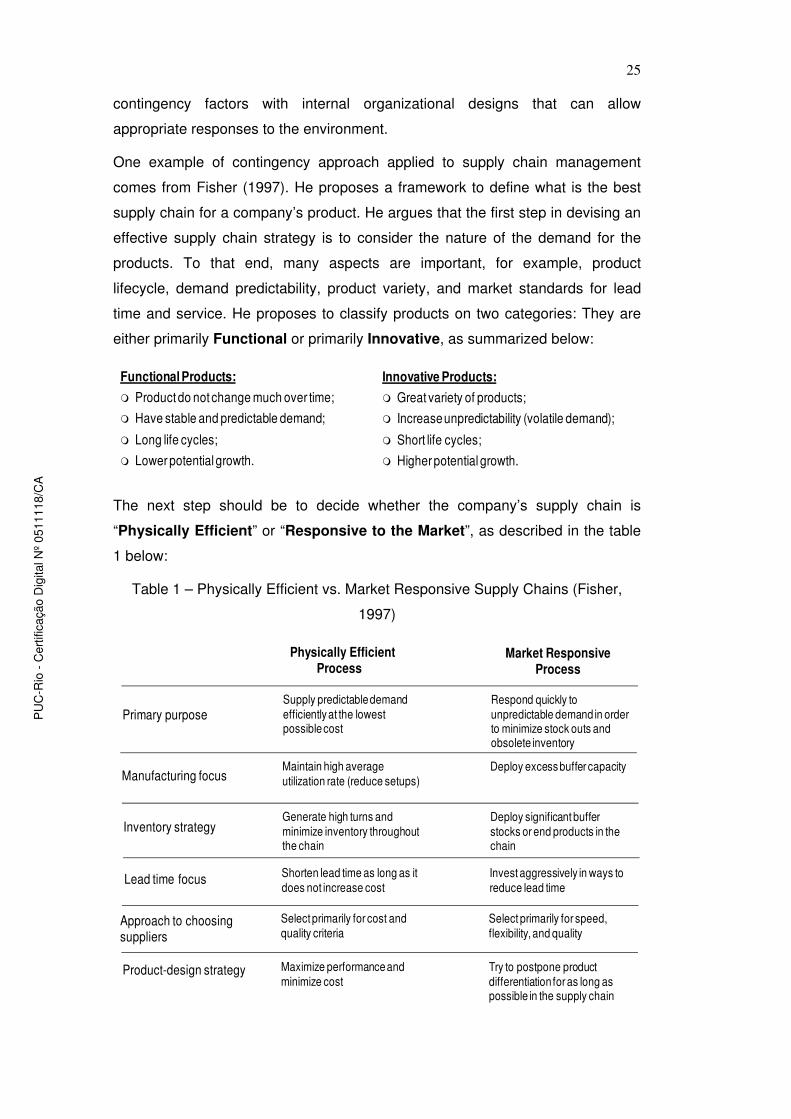
The next step should be to decide whether the company’s supply chain is
“Physically Efficient” or “Responsive to the Market”, as described in the table
1 below:
Table 1 – Physically Efficient vs. Market Responsive Supply Chains (Fisher,
1997)
Physically Efficient Process
Primary purpose
Manufacturing focus
Inventory strategy
Lead time focus
Approach to choosingsuppliers
Product-design strategy
Market Responsive Process
Supply predictable demand
efficiently at the lowest possible cost
Respond quickly to
unpredictable demand in order to minimize stock outs and obsolete inventory
Maintain high average
utilization rate (reduce setups)Deploy excess buffer capacity
Generate high turns and
minimize inventory throughout the chain
Deploy significant buffer
stocks or end products in the chain
Shorten lead time as long as it
does not increase cost
Invest aggressively in ways to
reduce lead time
Select primarily for cost and
quality criteriaSelect primarily for speed,
flexibility, and quality
Maximize performance and
minimize costTry to postpone product
differentiation for as long as possible in the supply chain
PU
C-R
io -
Cert
ific
ação D
igital N
º 0511118/C
A

26
After determining the nature of the product demand and the supply chain
priorities, managers can employ a matrix to formulate the ideal supply chain
strategy. Fisher proposes to plot the nature of the demand for each of the product
families and its supply chain priorities, in order to allow identify whether the
process used for supplying products is well matched to the product type, which
means, an efficient process for functional products and a responsive process for
innovative products. In figure 6, the author shows an example of the proposed
matrix applied to a practical case in the beverage industry:
Functional Products Innovative Products
Eff
icie
nt
Su
pp
ly C
ha
inR
es
po
nsiv
e
Su
pp
ly C
ha
in
Mismatch
Mismatch
Figure 6 – Example of Product and Supply Chains Applied to Beverage Industry
Ayers (2006) advocates that the Demand-Driven Supply Chain changes many of
the conditions that cause wasteful variation in supply chain production. He states
that, it is the foundation of the “lean” supply chain, and its implementation helps
establish the operating range for low-cost production supply chain.
He proposes a three-phase roadmap to implement the Demand-Driven Supply
Chain concept. The phases are listed and also illustrated in the figure 7:
1. Moving from long to short lead-times – Overall lead-time is composed
of individual cycle-times for multiple processes. This step involves
shortening the cycle-time at each step in the critical path processes from
the point of purchase to the start of production for the entire supply chain.
2. Replacing the batch with the flow model economics – Flow model
economics encompass low-cost ways to vary mix and volume. Lean
manufacturing is a discipline that has the same goals as flow economics.
Examples include “single minute exchange of dies” (SMED) in
PU
C-R
io -
Cert
ific
ação D
igital N
º 0511118/C
A

27
manufacturing, which will be specified in chapter 5, and mixing different
products on production lines. Batch picking for multiple customers in a
warehouse would represent a non-manufacturing example. A flow model
will synchronize supply chain steps and increase the overall supply chain
ability to respond to changes.
3. Basing decisions on actual demand rather than forecasts – This step
requires efficient sharing of information up and down the chain. An ideal
process is to have all supply chain partners with access to real time sales,
as well as, to the business rules to react based on demand signal.
Figure 7 – 3 Phases Roadmap for Implementing a DDSC (Ayers, 2006)
Evolution to a demand-driven supply chain will likely proceed in the order
proposed above. Shortening the lead-time is fundamental to changing batch
model economics. Basing decisions on demand comes after adopting the
economics of the flow model. Along the path, there is feedback to earlier steps.
For each phase in figure 8, there are 3 to 4 methodologies to be applied towards
a DDSC operation.
Another key concept related to Demand-Driven Supply Chains is the concept of
Agile. Christopher (2000) presents the concept of agility as a business wide
capability that embraces organizational structures, information systems, logistics
processes, being flexibility one of the key characteristics. He also identifies the 4
characteristics of an agile supply chain as market sensitive, network based,
process integration and virtual supply chains, being this last characteristic defined
as the information sharing network between buyers and suppliers.
PU
C-R
io -
Cert
ific
ação D
igital N
º 0511118/C
A

28
He explains the difference between agile and lean concepts. He defined Lean as
doing more with less, and explains that the term is often used in connection with
lean manufacturing to imply a zero inventory approach. However, there are
certain conditions where a lean approach to supply chain makes sense, in
particular where demand is predictable and the requirement for variety is low and
volume is high. The problem arises when attempting to implant the lean concept
into situations where demand is less predictable, the requirement for variety is
high and the volume at the individual SKU (Stock Keeping Unit) level is low,
which is the regular characteristics of several markets and products around the
world.
On the other hand, agility is defined as the ability of an organization to respond
rapidly to changes in demand, both in terms of volume and variety. The figure 8
summarizes the three critical dimensions – variety, variability (or predictability)
and volume – that determine which approach – agile or lean – should be
deployed.
Figure 8 – Characteristics of Agile and Lean Concepts (Christopher, 2000)
Christopher (2000) also states that to be truly agile, a supply chain must possess
4 distinguishing characteristics, being one of them Market sensitive, which
means that the supply chain is capable of reading and responding to real demand
or being demand-driven. The problem is that most organizations are forecast-
driven rather than demand-driven. In other words, because they have little direct
feed-forward from the marketplace by way of data on actual customer
requirements, they are forced to make forecasts based on past sales or
shipments, and convert these forecasts into inventory.
PU
C-R
io -
Cert
ific
ação D
igital N
º 0511118/C
A

29
One of the biggest barriers to agility is the way that complexity (product and
brand proliferation, organizational structure and management processes) tends to
increase as a company grows and expands its market coverage. The reduction of
complexity should be a major priority for Marketing and Logistics functional areas
to allow a company become agile.
Agarwal et al (2007) review the literature on supply chain agility, touching some
of the components of DDSC like lead time reduction, market sensitiveness, new
product introduction, and propose to apply Interpretive Structural Modeling (ISM)
to show the interrelationship of different 15 variables to supply chain agility.
Huang et al. (2009) propose an agile approach for supply chain modeling using a
generic label correcting (GLC) algorithm. The rough set theory, which is a
mathematical approach to manage vague and uncertain data or problems related
to information systems, indiscernible relations and classification, is applied to
reduce the complexity of data space when running the algorithm.
Ismail and Sharifi (2006) present a structured framework to provide a practical
approach for implementing agile supply chains (ASC), based on the concepts of
supply chain design and design for supply chain.
2.2
Methodologies for Assessing Demand Driven Supply Chain
In terms of methodologies to assess and identify company’s performance,
several articles show the importance of having a structured process in order to
improve performance overtime. However, when it is specifically related to
methods for assessing performance based on Demand Driven Supply Chain
(DDSC) concepts, the articles available do not meet the research criteria which is
to have a clear and practical framework to support companies identify their
current state based on DDSC concepts.
Dale and Ritchie (2000) argue that companies must have an appropriate
performance measurement system to be applied on a regular basis to identify
areas to be improved in order to establish a sustainable continuous improvement
process. They proposed to use self-assessment process, which can be defined
as a comprehensive, systematic and regular review of an organization’s activities
and results against a model of business excellence. The self-assessment will
PU
C-R
io -
Cert
ific
ação D
igital N
º 0511118/C
A
30
allow organizations to clearly discern its strengths and gaps, and define
improvement actions linked to the business planning process.
They state that there are some necessary criteria for a successful self-
assessment process:
• Gaining commitment and support from all levels of staff
• Action being taken from the previous self-assessment
• Incorporation of self-assessment into the business planning process
• Not allowing the process to be “added on” to employees existing workload
• Developing a framework for performance monitoring
In terms of benefits of the self-assessment, there are both immediate and long
term benefits:
Immediate benefits:
• Facilitates benchmarking, drives continuous improvement, encourages
employees involvement and ownership, provides visibility in direction,
raises understanding and awareness of quality related issues, develops a
common approach to continuous improvement across the company.
Long term benefits:
• Keeps costs down, improves business results, provides a disciplined
approach to business planning, increases the ability to meet and exceed
customers’ expectations.
Chin et al. (2003) also developed a knowledge-based expert self-assessment
(KES) training toolkit to measure and assess organizational performance based
on the evaluation criteria of the renowned business excellence model – The
Malcolm Baldrige National Quality Award (MBNQA).
The concept of self-assessment brings a valuable contribution to reduce
complexity, time and cost to apply the DDSC assessment framework on a global
basis, as each company should be able to self-assess its current state.
Salama et al (2009) review the importance of supply chain and operations audit
process which represents a fundamental step to support improvement projects.
They argue that the core element of audits is the diagnostic stage and that no
audit can be considered successful unless it really provides a thorough
understanding of how the constituent elements of an organization interact with
PU
C-R
io -
Cert
ific
ação D
igital N
º 0511118/C
A

31
one another (e.g. people, processes and technologies), that is the interactions
which constrain the system, and how these interactions are reflected on the
market-driven performance. The provided a very clear set of features and
requirements for an audit methodology that can be considered when developing
a DDSC assessment:
• Quick / Accurate – The methodology should be based on tools, steps and
an “engine” which were designed to deliver a result as accurate as
possible in the shortest time possible.
• Not invasive – The methodology should be built in order to require the
least possible effort from organization’s resource.
• Scalable – The methodology should be scalable
• Avoid bias / theoretically grounded – The methodology should be built in a
way to reduce possible bias in the diagnostic stage, while exploiting the
knowledge that people who daily work in an organization have on their
processes.
• Stimulate consensus building – The stimulation of consensus building can
be achieved in different ways. The most important are:
o Possible recycles in the diagnostic stage
o Empirical support of critical findings
o Quantification of value together with scenario analysis
• Transparent – All tools and steps used in the methodology should be
clearly described in all parts. No “secret engine” is behind the
methodology.
The proposed new audit methodology by Salama et al. (2009) were tested
through 3 European research initiatives, and also showed an example of a
master best practice relationship map for the demand management process.
Moon (2002) also provides direction on the importance of auditing process
related to sales forecasting. He states that sales forecasting audit process has
three objectives:
• Understand current status of forecasting practice (a company’s “as is”
state)
PU
C-R
io -
Cert
ific
ação D
igital N
º 0511118/C
A

32
• Visualize the goals of forecasting process improvement (the “should-be”
state)
• Develop a roadmap for achieving the goals (the “way forward”)
Trkman and McCormack (2009) describe that supply risk or supply disruptions is
emerging as a key challenge to supply chain management, and that the ability to
identify which supplier has greater potential of disruption is a critical step in
managing the frequency and impact of these disruptions.
Their contribution was to use the contingency theory approach to propose a new
method for the assessment and classification of suppliers based on their supply
chain characteristics, its structure and supplier’s attributes and performances,
modified by factors in the supplier’s specific environment namely exogenous and
endogenous uncertainty. The contingency approach is a value contribution to be
considered when developing the DDSC assessment framework as different
companies and industries can have different time and market requirements to
move or not to move towards DDSC.
Filho et al. (2010) developed a framework to measure safety culture in the
Brazilian oil and gas companies. They applied a 5 level safety culture maturity
model (e.g. pathological, reactive, bureaucratic, proactive and sustainable) using
5 dimensions (e.g. information, organizational learning, involvement,
communication and commitment) to identify current state of safety practices in
petrochemical companies.
A maturity model can be described as a structured collection of elements that
describe certain aspects of maturity in an organization, and aids in the definition
and understanding of the different organization processes. A maturity model can
be a valuable tool to describe the different maturity levels in the DDSC
assessment process.
One of the key objectives of DDSC is to reduce demand amplification as it brings
extra costs and inefficiencies like extra resource capacity, higher inventory levels,
etc. Taylor (2000) reviews the effect of demand amplification in the supply chain
and also proposes a practical approach to eliminate it through a 7 step process.
A pilot test was performed in UK automotive industry and showed an increase
from 70% to 100% on the composite measure of delivery to time along the supply
chain, and also a reduction of 30% in total supply chain inventory.
PU
C-R
io -
Cert
ific
ação D
igital N
º 0511118/C
A

33
Childerhouse et al. (2002) proposed a methodological framework to develop
focused demand chain strategy for each cluster of products commercialized by a
company. The methodology consists of 6 steps described below and has the
objective to define the best facility, production layout requirements and control
mechanisms for each specific product / service offered by the company.
• Step 1: Develop holistic demand chain strategy. This leads from
highlighting of core competencies and resources, and its primary purpose
is the identification of specific markets to be targeted plus the overall
corporate strategy
• Step 2: Identify specific product / service offering. These are tailored to
the target markets with emphasis placed on priorization of service, quality,
cost or lead times
• Step 3: Categorize demand chain types. Given the specific products and
their related service criteria, the DWV3 classification variables (duration of
lifecycle, time window for delivery, volume, variety and variability) are
used to categorize the products into clusters with similar characteristics.
Output is a clear definition of the requirements for each demand channel.
• Step 4: Identify facility requirements. Facilities need to be tailored to
achieve the desired objectives (e.g. products with high service level may
require distribution warehouses located near the marketplace).
• Step 5: Define production layout and control mechanisms (e.g. Kanban,
MRP, etc.)
• Step 6: Implement focused demand chains
The proposed methodology was applied to a UK lighting company and showed
several benefits like 75% reduction in product development time, 27% reduction
in manufacturing costs, and 95% reduction in delivery lead times.
Bowersox and Lahowchich (2008) propose a Responsive Supply Chain Business
Model and describe it as a “customer-facing organization and operational
strategy focusing the highest priority on providing exacting and sustainable
customer service”. They explain that the Responsive Supply Chain business
model represents a blend of six imperatives, or essential elements – 1)
Consumer connectivity, 2) Operational excellence, 3) Integrative management, 4)
Real-time responsiveness, 5) Leveraging networks, and 6) Collaboration, and
each of these 6 imperatives represents a firm’s unique supply chain DNA.
PU
C-R
io -
Cert
ific
ação D
igital N
º 0511118/C
A

34
Verdouw et al. (2010) analyzed the European fruit market and identified that fruit
supply does not sufficiently meet demand requirements. They proposed that the
fruit supply chains needed to become demand driven, that is, being able to
continuously match supply capabilities to changing demand requirements. In a
demand driven supply chain, all actors involved are sensitive and responsive to
demand information of the ultimate consumer and meet those varied and variable
demands in a timely and cost-effective manner. As a consequence, information
must be shared timely throughout the supply chain and the early alerted firms
have to respond quickly to changes in demand or supply, which imposes
stringent demands on the interoperability and flexibility of the enabling
information systems.
They presented a reference model for designing business processes in demand-
driven fruit supply chains. The model consists of a reference modeling framework
that defines process models at different levels of abstraction and includes a
method of how they can be composed from a repository of building blocks.
However, they did not provide any structured assessment approach to evaluate
different business segments / industries in light of demand driven supply chain
concepts.
Georgiadis et al. (2001) present a paper describing the design and
implementation of a demand driven freight transport application, but they focus
mainly in the IT system architecture of the solution, called ATLog (Attika Traffic
Logistics), not providing any direction on how to assess and determine a
company current state based on DDSC concepts.
Ayers and Malmberg (2002) touch very briefly DDSC concepts, providing a 4
stage maturity model to show how enablers of supply chain improvement support
the introduction of information technology to the supply chain, and one of these
elements is the demand-driven as illustrated in the figure 9 below. However, they
did not provide a detail maturity model and a robust methodology to assess a
supply chain, in order to determine its current state in terms of the demand driven
concepts.
PU
C-R
io -
Cert
ific
ação D
igital N
º 0511118/C
A

35
Figure 9 – Enablers of Supply Chain Improvement (Ayers and Malmberg, 2002)
Table 2 below provides a summary of the current literature review on assessing
DDSC:
Author Contribution
Dale and Ritchie (2000) Proposed to use self-assessment process to
evaluate company’s performance on a regular basis
as part of the continuous improvement process
Chin et al. (2003) Developed a knowledge-based expert self-
assessment (KES) training toolkit to measure and
assess organizational performance
Salama et al (2009) Review the importance of supply chain and
operations audit process
Moon (2002) Provides direction on the importance of auditing
process related to sales forecasting
Trkman and McCormack (2009) Argue that supply risk is one of key challenge to
supply chain management and propose a new
method for assessment and classification of
suppliers
PU
C-R
io -
Cert
ific
ação D
igital N
º 0511118/C
A

36
Filho et al. (2010) Developed a 5 level maturity model to measure
safety culture in the Brazilian oil and gas companies
Taylor (2000) Reviews the effect of demand amplification in the
supply chain and also proposes a 7 step process to
eliminate it
Childerhouse et al (2002) Proposed methodological framework to develop
focused demand chain strategy for each cluster of
product commercialized by a company
Bowersox and Lahowchich
(2008)
Propose a responsive supply chain business model
Verdouw et al (2010) Proposed a reference model for designing business
processes in demand driven fruit supply chain in
Europe
Georgiadis et al Describe the design and implementation of demand
driven freight transport application
Ayers and Malmberg (2002) Provide a 4 stage readiness model to show how
enablers of supply chain improvement support the
introduction of information technology to the supply
chain
In this thesis, it is proposed to define the components of DDSC, then develop a
structured methodology that will help companies assess their current state in light
of demand driven supply chain concepts and identify their current strengths and
gaps, and therefore, define a strategic plan to evolve and become more efficient
and competitive.
Based on the research presented so far, and to the best extent of our knowledge,
it can be seen that the proposed subject meets the originality criteria, as it could
not be found any paper that covers all the aspects proposed in this research, and
it also meets the relevance criteria, as there are extraordinary financial and
operational positive impacts that companies, which apply DDSC concepts, face in
their business results.
PU
C-R
io -
Cert
ific
ação D
igital N
º 0511118/C
A
37
2.3
Benefits of Demand Driven Supply Chain
Despite of the limited information available on the benefits of becoming demand
driven, two different studies provide a direction on the financial and operational
benefits companies can capture when implementing a demand driven supply
chain.
Based on internal benchmark data, AMR reports that the most advanced
demand-sensing companies have 15% less inventory, 17% better perfect order
performance, and 35% shorter cash-to-cash cycle time. In terms of top line
results, DDSC leaders have 10% higher revenue and 5% to 7% better profit
margins than their competitors. These extraordinary results captured by demand-
driven companies, show the importance of having a structured methodology for
assessing the current state against DDSC concepts, in order to help companies
evolve in the implementation of DDSC components and tactics.
Another reference comes from SAP Insight report (2006), which argues that
based on existing customer studies, analyst comments and industry pooling, the
implementation of DDSC can generate the following results:
Revenue: Increase fill rates (defined as cases delivered divided by cases
ordered) and reduce out-of-stocks by 3% to 10%
Operating cost:
• Increase production efficiencies by 1% to 5%
• Decrease freight costs by 5% to 15%
• Improve personnel productivity by 7% to 12%
• Reduce obsolescence and waste by 35% to 50%
Working capital:
• Reduce inventory levels by 7% to 15%
• Improve asset utilization by 10% to 15%
• Decrease cash-to-cash cycle by 10% to 30%
As it could be seen, there are great benefits on becoming DDSC, but the
question that most companies face is how to rapidly evolve from current state
in the direction of demand-driven supply chain.
PU
C-R
io -
Cert
ific
ação D
igital N
º 0511118/C
A