2 Keyindicatorstotrackcurrentprogressandfuture ...towards addressing climate change, cumulative...
7
In the format provided by the authors and unedited. Key indicators to track current progress and future ambition of the Paris Agreement Glen P. Peters 1 * , Robbie M. Andrew 1 , Josep G. Canadell 2 , Sabine Fuss 3 , Robert B. Jackson 4 , Jan Ivar Korsbakken 1 , Corinne Le Quéré 5 and Nebojsa Nakicenovic 6 1 Center for International Climate and Environmental Research—Oslo (CICERO), 0349 Oslo, Norway. 2 Global Carbon Project, CSIRO Oceans and Atmosphere, GPO Box 3023, Canberra, Australian Capital Territory 2601, Australia. 3 Mercator Research Institute on Global Commons and Climate Change, 10829 Berlin, Germany. 4 Department of Earth System Science, Woods Institute for the Environment, and Precourt Institute for Energy, Stanford University, Stanford, California 94305, USA. 5 Tyndall Centre for Climate Change Research, University of East Anglia, Norwich NR4 7TJ, UK. 6 International Institute for Applied Systems Analysis (IIASA), Schlossplatz 1, 2361 Laxenburg, Austria. *e-mail: [email protected] © 2017 Macmillan Publishers Limited, part of Springer Nature. All rights reserved. SUPPLEMENTARY INFORMATION DOI: 10.1038/NCLIMATE3202 NATURE CLIMATE CHANGE | www.nature.com/natureclimatechange 1
Transcript of 2 Keyindicatorstotrackcurrentprogressandfuture ...towards addressing climate change, cumulative...
In the format provided by the authors and unedited.
LETTERSPUBLISHED ONLINE: XXMONTH XXXX | DOI: 10.1038/NCLIMATE3202
Key indicators to track current progress and futureambition of the Paris AgreementGlen P. Peters1*, Robbie M. Andrew1, Josep G. Canadell2, Sabine Fuss3, Robert B. Jackson4,Jan Ivar Korsbakken1, Corinne Le Quéré5 and Nebojsa Nakicenovic6
Current emission pledges to the Paris Agreement appearinsu�cient to hold the global average temperature increaseto well below 2 ◦C above pre-industrial levels1. Yet, details aremissing on how to track progress towards the ’Paris goal’,inform the five-yearly ’global stocktake’, and increase theambition of Nationally Determined Contributions (NDCs). Wedevelop a nested structure of key indicators to track progressthrough time. Global emissions2,3 track aggregated progress1,country-level decompositions track emerging trends4–6 thatlink directly to NDCs7, and technology di�usion8–10 indicatesfuture reductions. We find the recent slowdown in globalemissions growth11 is due to reduced growth in coal use since2011, primarily in China and secondarily the United States12.The slowdown is projected to continue in 2016, with globalCO2 emissions from fossil fuels and industry similar to the2015 level of 36GtCO2. Explosive and policy-driven growthin wind and solar has contributed to the global emissionsslowdown, but has been less important than economic factorsand energy e�ciency. We show that many key indicators arecurrently broadly consistent with emission scenarios that keeptemperatures below 2 ◦C, but the continued lack of large-scalecarbon capture and storage13 threatens 2030 targets and thelonger-term Paris ambition of net-zero emissions.
Tracking progress of individual countries towards a collectiveglobal climate target requires a hierarchy of indicators spanningdifferent levels of detail and time periods (Fig. 1). At theaggregate level one could track global temperature, atmosphericconcentrations, and greenhouse gas (GHG) emissions2,3; CO2emissions are particularly relevant due to their dominant role inclimate policy and long-lasting effect in perturbing the climatesystem. Global CO2 emissions from fossil fuels and industry areprojected3 to be 36.4GtCO2 in 2016, approximately the same as in2014 and 2015, indicating that growth in global CO2 emissions hasstalled for the third year in a row11. Although this is a positive steptowards addressing climate change, cumulative emissions are stillrising and emissions need to rapidly decrease until they reach zeroto remain consistent with the Paris Agreement1.
More relevant for policy implementation is to track progressnationally to assess historical and future trends in emissions4–6,progress towards emission pledges14, and the adequacy of pledges toachieve global targets1. Chinese emissions grew at 10% yr−1 in the2000s, but have been largely stable since 2013, potentially indicatinga peak in emissions earlier than expected12. US emissions declinedfrom2007 to 2012 at over−2% yr−1 due to aweaker economy, a shift
from coal to gas, and growth in renewables15, but emissions havebeen relatively flat since 2012. EU emissions declined by−0.7% yr−1
from 2000 to 2010 and −2.2% yr−1 from 2011 to 2015, ensuringthe EU is on track to meeting its 2030 emission pledge. India hassustained emissions growth of 5–6% yr−1 over the past decade and,even with its NDC, is expected to have high future growth rates16.
It is not clear if the driving forces behind these global andcountry-level trends will be sustained. If the observed trends aredriven by strengthening of energy and climate policies, then goodprogress can be expected towards achieving the NDCs, with flex-ibility to raise mitigation ambitions. If the trends are largely dueto lingering economic weakness17, or other short-term factors, thenemissions growth may rebound18. Disentangling the factors causingshort-term changes in emissions is therefore critical, otherwise cur-rent or future policies may be inconsistent with emission pledges1.
The implementation of the Paris Agreement requires a consistentand harmonized approach to track progress at different levels ofdetail and over different time periods. The Kaya Identity is one suchapproach5, in which different components form an interconnectedand nested structure (Fig. 1, see Methods). Each component ofthe identity can be decomposed into measurable indicators directlyimpacted by energy and climate policy5, which themselves can befurther decomposed. Many countries already express their climatepolicies in terms of Kaya components, such as the energy intensityof Gross Domestic Product (GDP), or sub-components such as theshare of non-fossil energy in total energy use7.
The indicators in the top three layers of Fig. 1 are the outcomesof dynamics that occur at a more detailed level (bottom twolayers). The carbon intensity of fossil-fuel combustion (layer 3)can be reduced by substituting coal with natural gas or withCarbon Capture and Storage (CCS; layer 4). The share of fossilfuels in energy use (layer 3) can be decreased by replacing fossilfuels with renewables (layer 4). The diffusion of new technologiesmay require longer-term investments19, which may be tracked9 viaprivate and public investments16, price declines8, and deployment13(layer 5). More rapid technological progress would support anddrive increased ambition of country pledges.
We explore this nested structure using global and country-level data (Fig. 1). We focus on the Kaya-derived indicators: CO2emissions (layer 1); GDP, energy intensity of GDP (for example,energy efficiency), and CO2 per energy unit (layer 2); and CO2intensity of fossil fuels and share of fossil fuels in total energy use(layer 3). These indicators are the most relevant for the currentslowdown in CO2 emissions growth11, are important indicators in
1Center for International Climate and Environmental Research—Oslo (CICERO), 0349 Oslo, Norway. 2Global Carbon Project, CSIRO Oceans andAtmosphere, GPO Box 3023, Canberra, Australian Capital Territory 2601, Australia. 3Mercator Research Institute on Global Commons and ClimateChange, 10829 Berlin, Germany. 4Department of Earth System Science, Woods Institute for the Environment, and Precourt Institute for Energy, StanfordUniversity, Stanford, California 94305, USA. 5Tyndall Centre for Climate Change Research, University of East Anglia, Norwich NR4 7TJ, UK. 6InternationalInstitute for Applied Systems Analysis (IIASA), Schlossplatz 1, 2361 Laxenburg, Austria. *e-mail: [email protected]
NATURE CLIMATE CHANGE | ADVANCE ONLINE PUBLICATION | www.nature.com/natureclimatechange 1
© 2017 Macmillan Publishers Limited, part of Springer Nature. All rights reserved.
SUPPLEMENTARY INFORMATIONDOI: 10.1038/NCLIMATE3202
NATURE CLIMATE CHANGE | www.nature.com/natureclimatechange 1
2
14
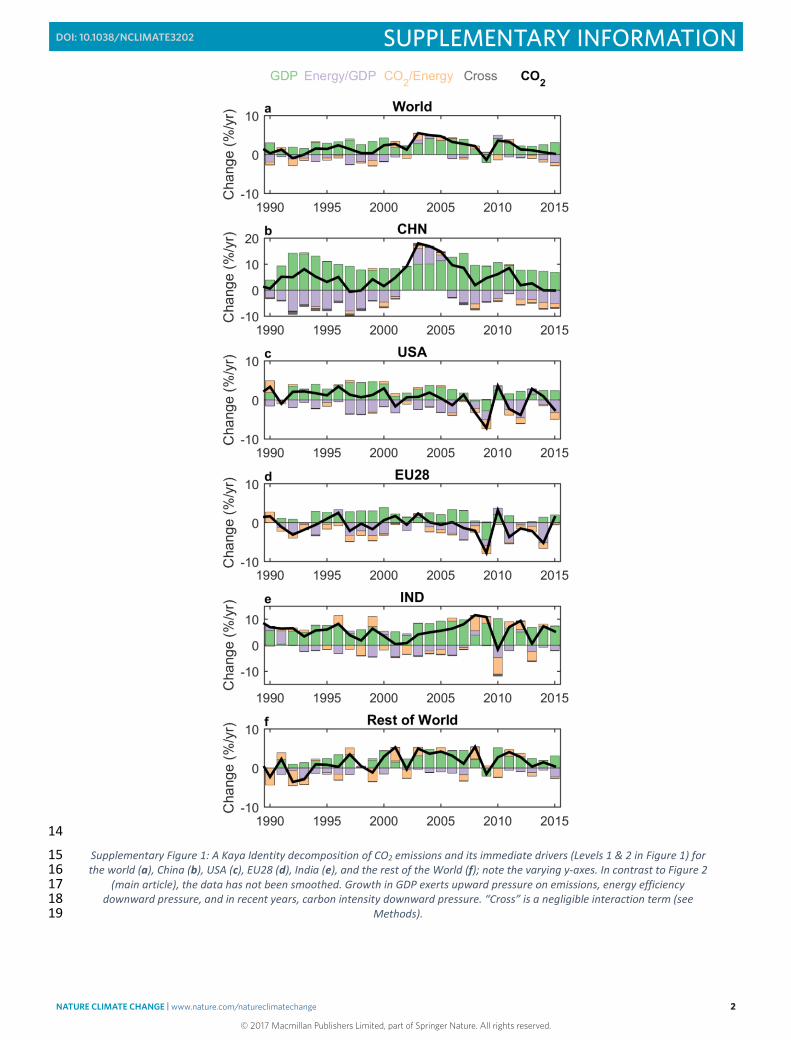
Supplementary Figure 1: A Kaya Identity decomposition of CO2 emissions and its immediate drivers (Levels 1 & 2 in Figure 1) for 15 the world (a), China (b), USA (c), EU28 (d), India (e), and the rest of the World (f); note the varying y-axes. In contrast to Figure 2 16
(main article), the data has not been smoothed. Growth in GDP exerts upward pressure on emissions, energy efficiency 17 downward pressure, and in recent years, carbon intensity downward pressure. “Cross” is a negligible interaction term (see 18
Methods). 19
20
© 2017 Macmillan Publishers Limited, part of Springer Nature. All rights reserved.
NATURE CLIMATE CHANGE | www.nature.com/natureclimatechange 2
SUPPLEMENTARY INFORMATIONDOI: 10.1038/NCLIMATE3202
3
21
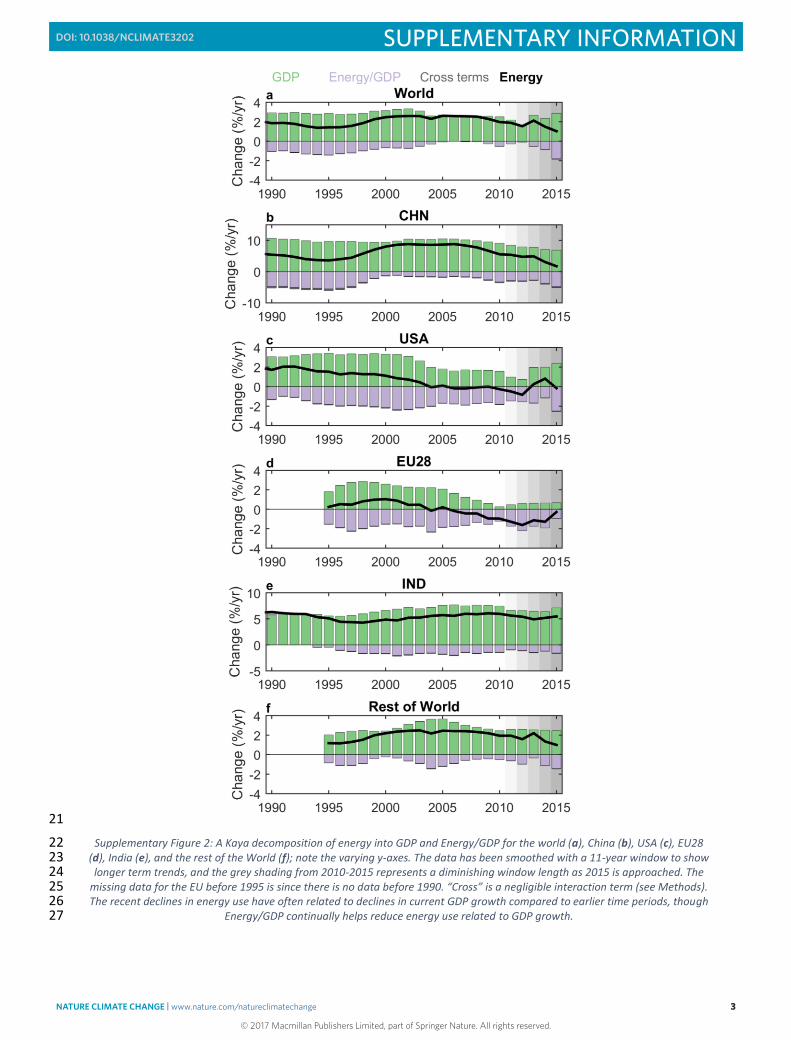
Supplementary Figure 2: A Kaya decomposition of energy into GDP and Energy/GDP for the world (a), China (b), USA (c), EU28 22 (d), India (e), and the rest of the World (f); note the varying y-axes. The data has been smoothed with a 11-year window to show 23 longer term trends, and the grey shading from 2010-2015 represents a diminishing window length as 2015 is approached. The 24
missing data for the EU before 1995 is since there is no data before 1990. “Cross” is a negligible interaction term (see Methods). 25 The recent declines in energy use have often related to declines in current GDP growth compared to earlier time periods, though 26
Energy/GDP continually helps reduce energy use related to GDP growth. 27
© 2017 Macmillan Publishers Limited, part of Springer Nature. All rights reserved.
NATURE CLIMATE CHANGE | www.nature.com/natureclimatechange 3
SUPPLEMENTARY INFORMATIONDOI: 10.1038/NCLIMATE3202
4
28
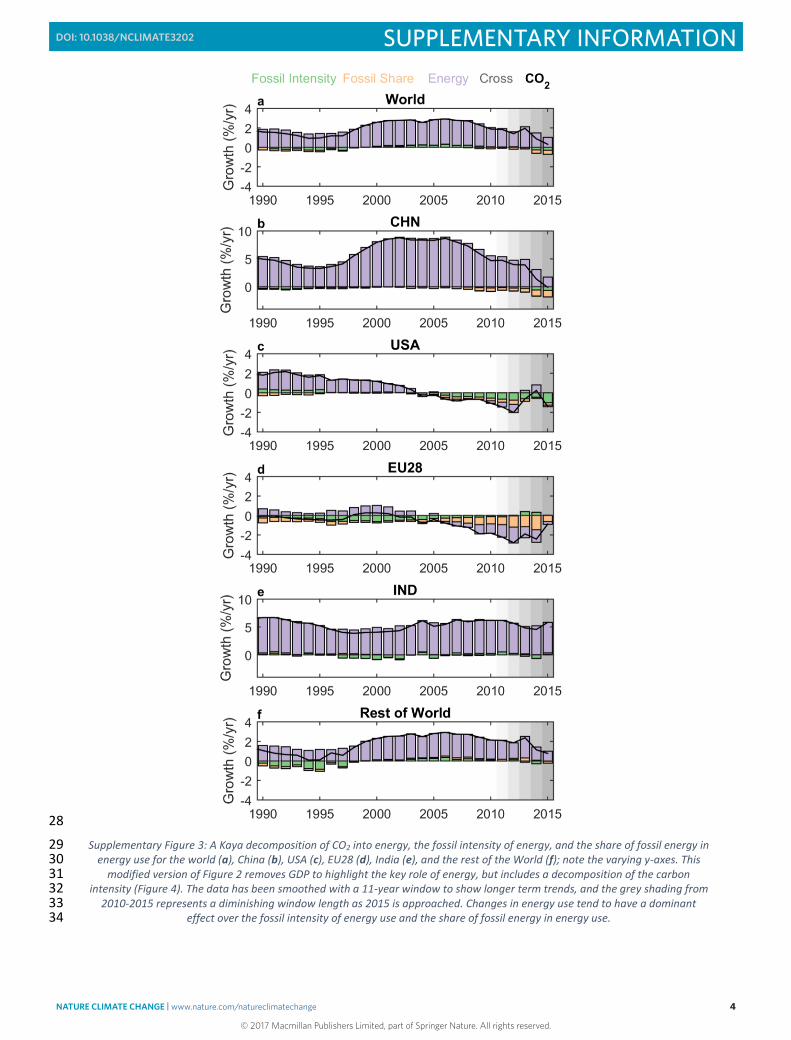
Supplementary Figure 3: A Kaya decomposition of CO2 into energy, the fossil intensity of energy, and the share of fossil energy in 29 energy use for the world (a), China (b), USA (c), EU28 (d), India (e), and the rest of the World (f); note the varying y-axes. This 30
modified version of Figure 2 removes GDP to highlight the key role of energy, but includes a decomposition of the carbon 31 intensity (Figure 4). The data has been smoothed with a 11-year window to show longer term trends, and the grey shading from 32
2010-2015 represents a diminishing window length as 2015 is approached. Changes in energy use tend to have a dominant 33 effect over the fossil intensity of energy use and the share of fossil energy in energy use. 34
35
© 2017 Macmillan Publishers Limited, part of Springer Nature. All rights reserved.
NATURE CLIMATE CHANGE | www.nature.com/natureclimatechange 4
SUPPLEMENTARY INFORMATIONDOI: 10.1038/NCLIMATE3202
5
36
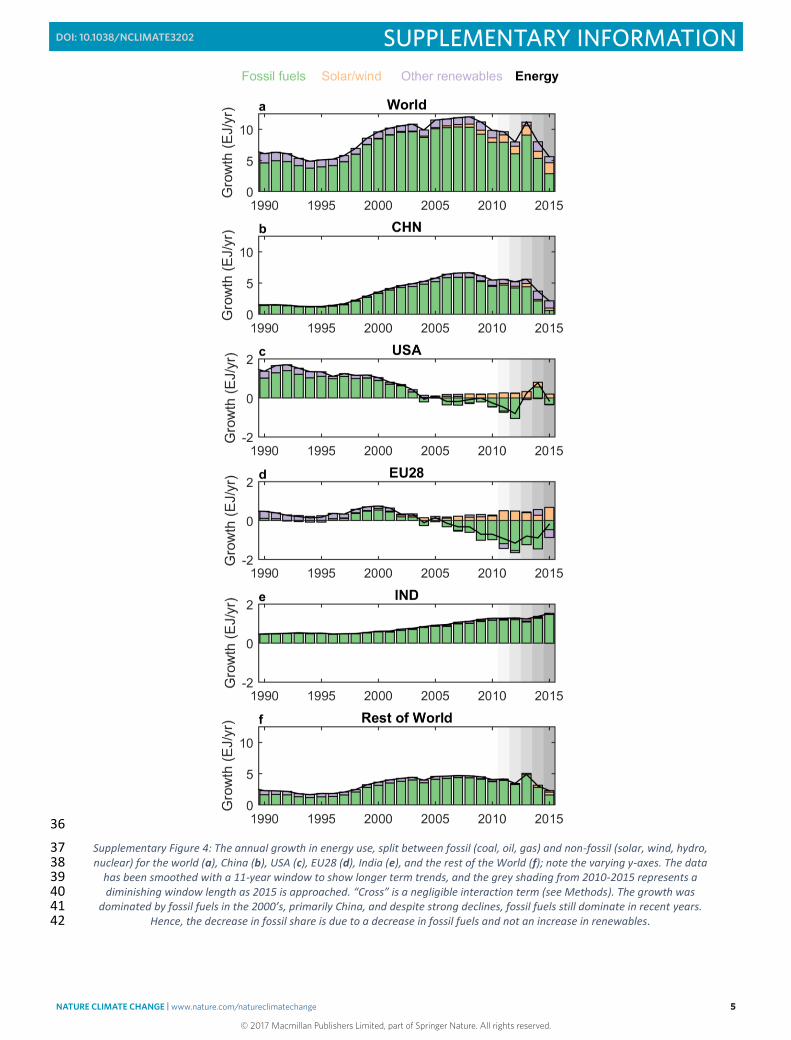
Supplementary Figure 4: The annual growth in energy use, split between fossil (coal, oil, gas) and non-fossil (solar, wind, hydro, 37 nuclear) for the world (a), China (b), USA (c), EU28 (d), India (e), and the rest of the World (f); note the varying y-axes. The data 38
has been smoothed with a 11-year window to show longer term trends, and the grey shading from 2010-2015 represents a 39 diminishing window length as 2015 is approached. “Cross” is a negligible interaction term (see Methods). The growth was 40
dominated by fossil fuels in the 2000’s, primarily China, and despite strong declines, fossil fuels still dominate in recent years. 41 Hence, the decrease in fossil share is due to a decrease in fossil fuels and not an increase in renewables. 42
43
© 2017 Macmillan Publishers Limited, part of Springer Nature. All rights reserved.
NATURE CLIMATE CHANGE | www.nature.com/natureclimatechange 5
SUPPLEMENTARY INFORMATIONDOI: 10.1038/NCLIMATE3202
6
44
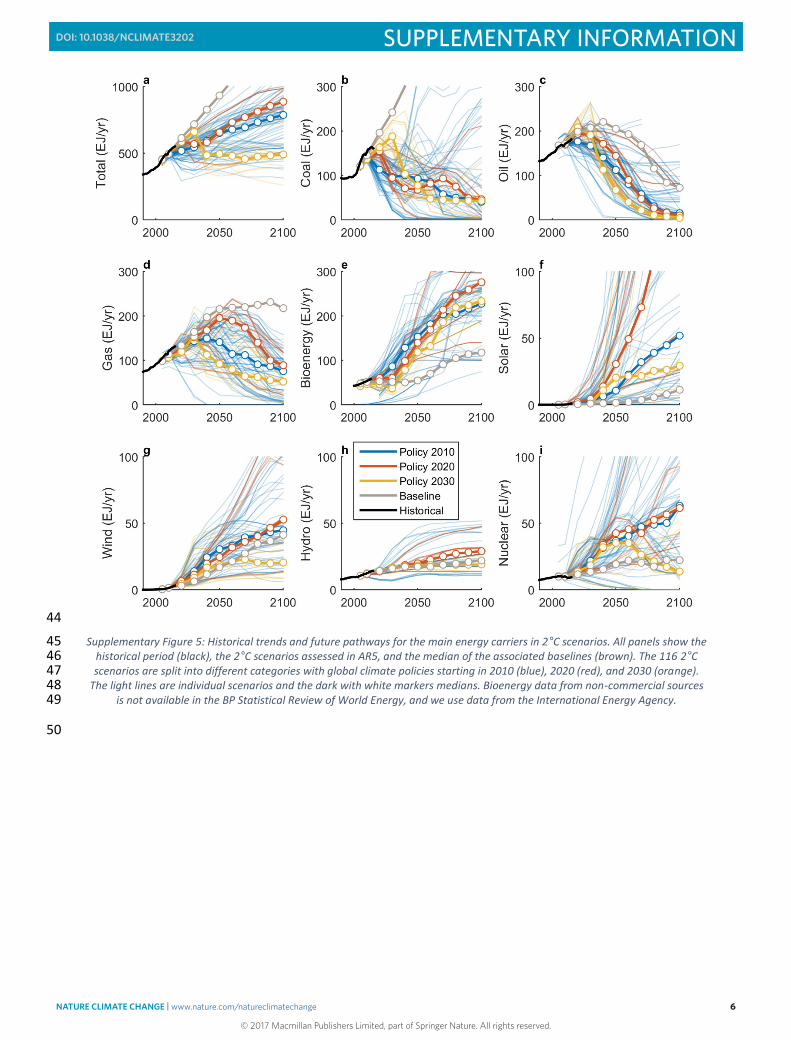
Supplementary Figure 5: Historical trends and future pathways for the main energy carriers in 2°C scenarios. All panels show the 45 historical period (black), the 2°C scenarios assessed in AR5, and the median of the associated baselines (brown). The 116 2°C 46 scenarios are split into different categories with global climate policies starting in 2010 (blue), 2020 (red), and 2030 (orange). 47
The light lines are individual scenarios and the dark with white markers medians. Bioenergy data from non-commercial sources 48 is not available in the BP Statistical Review of World Energy, and we use data from the International Energy Agency. 49
50
© 2017 Macmillan Publishers Limited, part of Springer Nature. All rights reserved.
NATURE CLIMATE CHANGE | www.nature.com/natureclimatechange 6
SUPPLEMENTARY INFORMATIONDOI: 10.1038/NCLIMATE3202
7
51
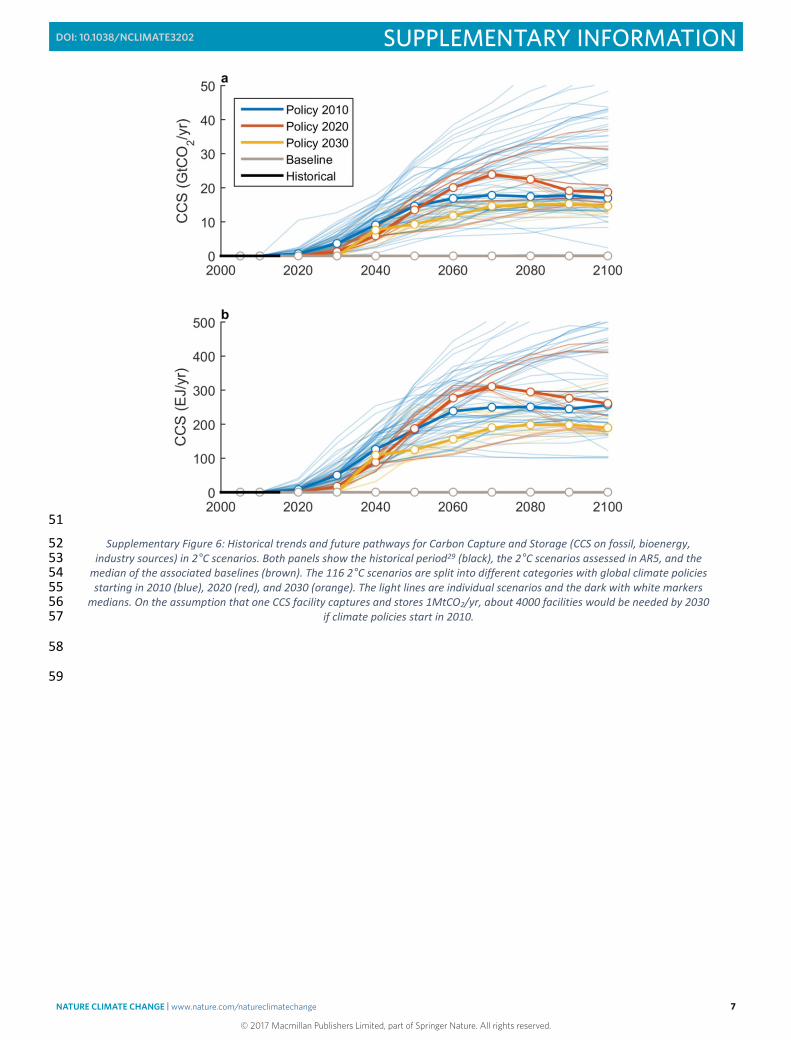
Supplementary Figure 6: Historical trends and future pathways for Carbon Capture and Storage (CCS on fossil, bioenergy, 52 industry sources) in 2°C scenarios. Both panels show the historical period29 (black), the 2°C scenarios assessed in AR5, and the 53
median of the associated baselines (brown). The 116 2°C scenarios are split into different categories with global climate policies 54 starting in 2010 (blue), 2020 (red), and 2030 (orange). The light lines are individual scenarios and the dark with white markers 55
medians. On the assumption that one CCS facility captures and stores 1MtCO2/yr, about 4000 facilities would be needed by 2030 56 if climate policies start in 2010. 57
58
59
© 2017 Macmillan Publishers Limited, part of Springer Nature. All rights reserved.
NATURE CLIMATE CHANGE | www.nature.com/natureclimatechange 7
SUPPLEMENTARY INFORMATIONDOI: 10.1038/NCLIMATE3202