2. Forest Cover - Forest Survey of India
16
Forest Cover
Transcript of 2. Forest Cover - Forest Survey of India
Forest Cover
Chapter
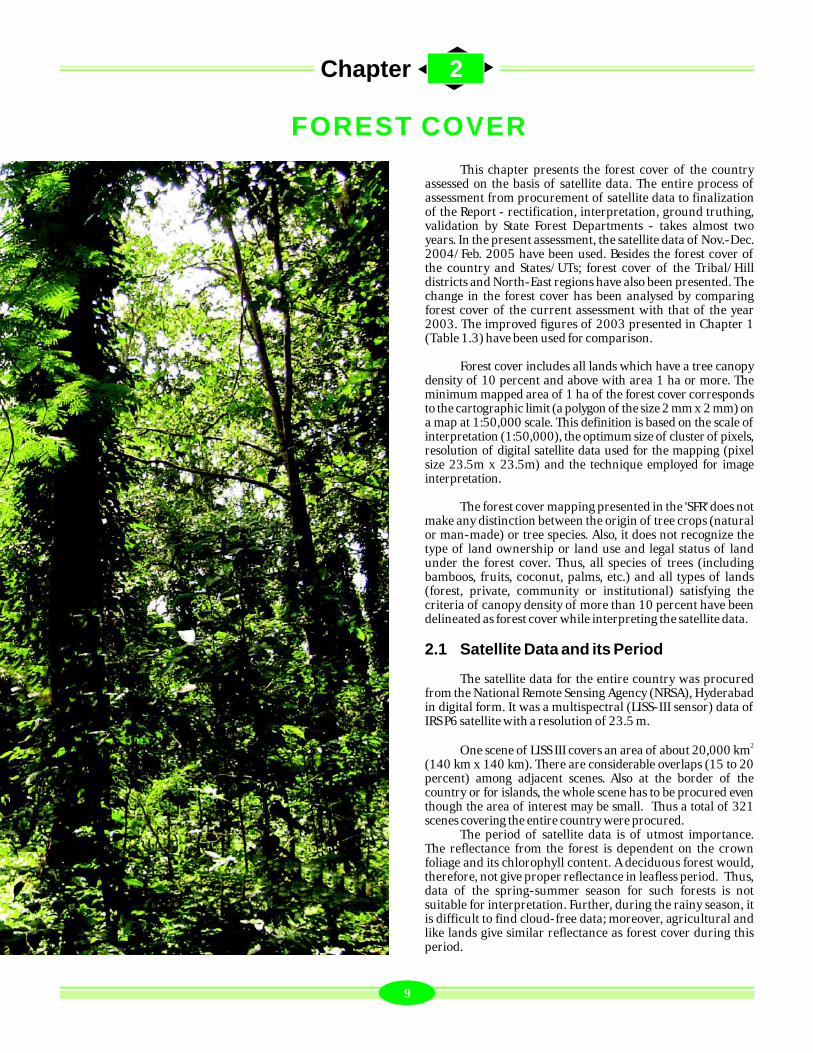
This chapter presents the forest cover of the country assessed on the basis of satellite data. The entire process of assessment from procurement of satellite data to finalization of the Report - rectification, interpretation, ground truthing, validation by State Forest Departments - takes almost two years. In the present assessment, the satellite data of Nov.-Dec. 2004/Feb. 2005 have been used. Besides the forest cover of the country and States/UTs; forest cover of the Tribal/Hill districts and North-East regions have also been presented. The change in the forest cover has been analysed by comparing forest cover of the current assessment with that of the year 2003. The improved figures of 2003 presented in Chapter 1 (Table 1.3) have been used for comparison.
Forest cover includes all lands which have a tree canopy density of 10 percent and above with area 1 ha or more. The minimum mapped area of 1 ha of the forest cover corresponds to the cartographic limit (a polygon of the size 2 mm x 2 mm) on a map at 1:50,000 scale. This definition is based on the scale of interpretation (1:50,000), the optimum size of cluster of pixels, resolution of digital satellite data used for the mapping (pixel size 23.5m x 23.5m) and the technique employed for image interpretation.
The forest cover mapping presented in the 'SFR' does not make any distinction between the origin of tree crops (natural or man-made) or tree species. Also, it does not recognize the type of land ownership or land use and legal status of land under the forest cover. Thus, all species of trees (including bamboos, fruits, coconut, palms, etc.) and all types of lands (forest, private, community or institutional) satisfying the criteria of canopy density of more than 10 percent have been delineated as forest cover while interpreting the satellite data.
2.1 Satellite Data and its Period
The satellite data for the entire country was procured from the National Remote Sensing Agency (NRSA), Hyderabad in digital form. It was a multispectral (LISS-III sensor) data of IRS P6 satellite with a resolution of 23.5 m.
2One scene of LISS III covers an area of about 20,000 km (140 km x 140 km). There are considerable overlaps (15 to 20
percent) among adjacent scenes. Also at the border of the country or for islands, the whole scene has to be procured even though the area of interest may be small. Thus a total of 321 scenes covering the entire country were procured.
The period of satellite data is of utmost importance. The reflectance from the forest is dependent on the crown foliage and its chlorophyll content. A deciduous forest would, therefore, not give proper reflectance in leafless period. Thus, data of the spring-summer season for such forests is not suitable for interpretation. Further, during the rainy season, it is difficult to find cloud-free data; moreover, agricultural and like lands give similar reflectance as forest cover during this period.
2
FOREST COVER
9
Chapter
This chapter presents the forest cover of the country assessed on the basis of satellite data. The entire process of assessment from procurement of satellite data to finalization of the Report - rectification, interpretation, ground truthing, validation by State Forest Departments - takes almost two years. In the present assessment, the satellite data of Nov.-Dec. 2004/Feb. 2005 have been used. Besides the forest cover of the country and States/UTs; forest cover of the Tribal/Hill districts and North-East regions have also been presented. The change in the forest cover has been analysed by comparing forest cover of the current assessment with that of the year 2003. The improved figures of 2003 presented in Chapter 1 (Table 1.3) have been used for comparison.
Forest cover includes all lands which have a tree canopy density of 10 percent and above with area 1 ha or more. The minimum mapped area of 1 ha of the forest cover corresponds to the cartographic limit (a polygon of the size 2 mm x 2 mm) on a map at 1:50,000 scale. This definition is based on the scale of interpretation (1:50,000), the optimum size of cluster of pixels, resolution of digital satellite data used for the mapping (pixel size 23.5m x 23.5m) and the technique employed for image interpretation.
The forest cover mapping presented in the 'SFR' does not make any distinction between the origin of tree crops (natural or man-made) or tree species. Also, it does not recognize the type of land ownership or land use and legal status of land under the forest cover. Thus, all species of trees (including bamboos, fruits, coconut, palms, etc.) and all types of lands (forest, private, community or institutional) satisfying the criteria of canopy density of more than 10 percent have been delineated as forest cover while interpreting the satellite data.
2.1 Satellite Data and its Period
The satellite data for the entire country was procured from the National Remote Sensing Agency (NRSA), Hyderabad in digital form. It was a multispectral (LISS-III sensor) data of IRS P6 satellite with a resolution of 23.5 m.
2One scene of LISS III covers an area of about 20,000 km (140 km x 140 km). There are considerable overlaps (15 to 20
percent) among adjacent scenes. Also at the border of the country or for islands, the whole scene has to be procured even though the area of interest may be small. Thus a total of 321 scenes covering the entire country were procured.
The period of satellite data is of utmost importance. The reflectance from the forest is dependent on the crown foliage and its chlorophyll content. A deciduous forest would, therefore, not give proper reflectance in leafless period. Thus, data of the spring-summer season for such forests is not suitable for interpretation. Further, during the rainy season, it is difficult to find cloud-free data; moreover, agricultural and like lands give similar reflectance as forest cover during this period.
2
FOREST COVER
9
The satellite data of the period October to December is therefore the most suitable for forest cover mapping of our country. During this period, deciduous trees, which largely constitute India's forests, bear adequate foliage. This enables capturing of true reflectance from the forests by the satellite sensors. While procuring the data, only those scenes were selected where cloud cover was less than 10 percent.
Data for most of the States & UTs pertained to the period from October to December 2004. Only in a few cases of North-East region and Andaman & Nicobar Islands, where availability of cloud-free data is difficult, the data period was extended up to February 2005.
2.2 Methodology
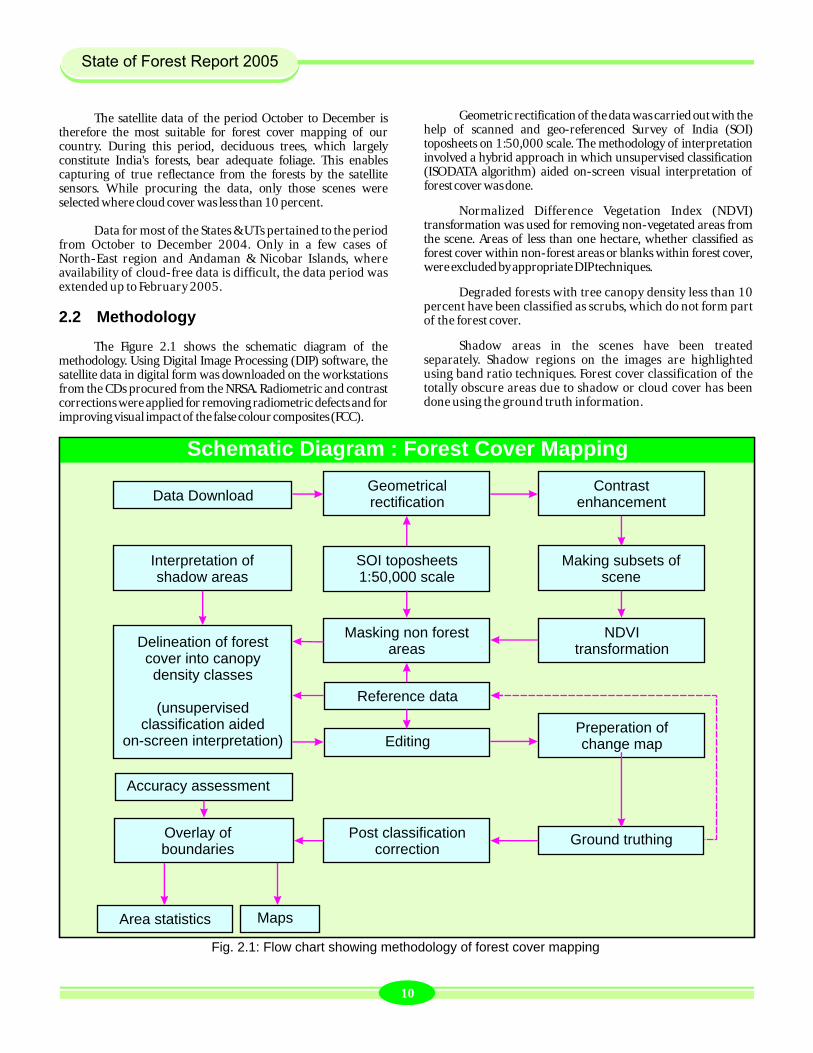
The Figure 2.1 shows the schematic diagram of the methodology. Using Digital Image Processing (DIP) software, the satellite data in digital form was downloaded on the workstations from the CDs procured from the NRSA. Radiometric and contrast corrections were applied for removing radiometric defects and for improving visual impact of the false colour composites (FCC).
Geometric rectification of the data was carried out with the help of scanned and geo-referenced Survey of India (SOI) toposheets on 1:50,000 scale. The methodology of interpretation involved a hybrid approach in which unsupervised classification (ISODATA algorithm) aided on-screen visual interpretation of forest cover was done.
Normalized Difference Vegetation Index (NDVI) transformation was used for removing non-vegetated areas from the scene. Areas of less than one hectare, whether classified as forest cover within non-forest areas or blanks within forest cover, were excluded by appropriate DIP techniques.
Degraded forests with tree canopy density less than 10 percent have been classified as scrubs, which do not form part of the forest cover.
Shadow areas in the scenes have been treated separately. Shadow regions on the images are highlighted using band ratio techniques. Forest cover classification of the totally obscure areas due to shadow or cloud cover has been done using the ground truth information.
Mangrove forests have characteristic tone and texture on the satellite image. Their presence on the coastal areas makes them even more conspicuous. They have been, therefore, separately classified.
Interpretation was then followed by extensive ground verification which took more than six months. All the necessary corrections were subsequently incorporated. Reference data collected through ground truth and field experience of the interpreter played an important role in delineating the forest cover patches and classifying them into three canopy density classes.
Sheet wise mosaic of districts and States/UTs was made using SOI and census data to compute district wise and State/UT wise forest cover. The final output of the forest cover mapping is in the raster format.
2.3 Accuracy Assessment
Accuracy assessment is an independent exercise under which randomly selected sample points on the satellite imagery were verified on the ground and tallied with interpreted data. In this assessment 4,291 points randomly distributed over the entire country were selected and the verification was done using field inventory data as well as high resolution satellite data (5.8 m) of these points. The detailed procedure has been described in Chapter 7 of this report. The error matrix presented in Table 7.1 reveals that out of the total 4,291 sampling points, the classification of 3,949 was correct. The overall accuracy level of the assessment therefore comes to 92.03%.
2.4 Limitations of Remote Sensing Technology
There are certain limitations of remote sensing based
areas without the help of collateral data or ground truth.
lGregarious occurrence of bushy vegetation and certain agricultural crops, such as sugarcane, cotton, lantana, etc., often poses problems in delineation of forest cover, as their reflectance is similar to that of tree canopy.
2.5 Forest Cover: 2005 Assessment
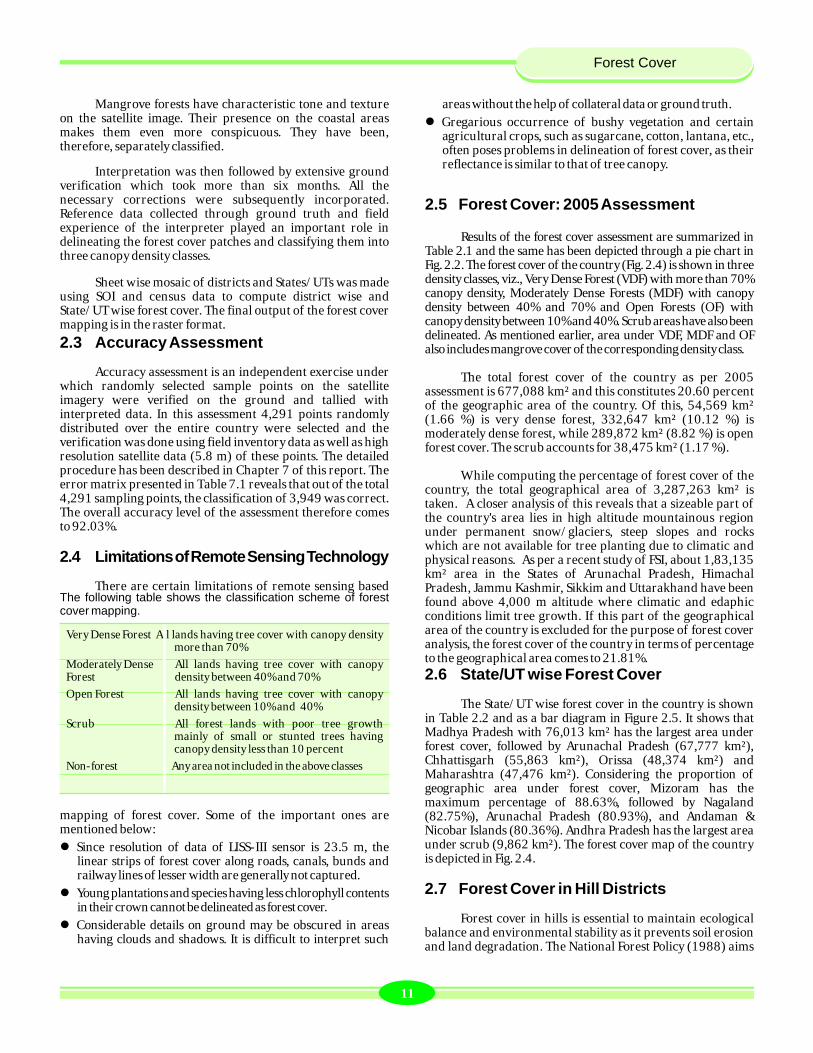
Results of the forest cover assessment are summarized in Table 2.1 and the same has been depicted through a pie chart in Fig. 2.2. The forest cover of the country (Fig. 2.4) is shown in three density classes, viz., Very Dense Forest (VDF) with more than 70% canopy density, Moderately Dense Forests (MDF) with canopy density between 40% and 70% and Open Forests (OF) with canopy density between 10% and 40%. Scrub areas have also been delineated. As mentioned earlier, area under VDF, MDF and OF also includes mangrove cover of the corresponding density class.
The total forest cover of the country as per 2005 assessment is 677,088 km² and this constitutes 20.60 percent of the geographic area of the country. Of this, 54,569 km² (1.66 %) is very dense forest, 332,647 km² (10.12 %) is moderately dense forest, while 289,872 km² (8.82 %) is open forest cover. The scrub accounts for 38,475 km² (1.17 %).
While computing the percentage of forest cover of the country, the total geographical area of 3,287,263 km² is taken. A closer analysis of this reveals that a sizeable part of the country's area lies in high altitude mountainous region under permanent snow/glaciers, steep slopes and rocks which are not available for tree planting due to climatic and physical reasons. As per a recent study of FSI, about 1,83,135 km² area in the States of Arunachal Pradesh, Himachal Pradesh, Jammu Kashmir, Sikkim and Uttarakhand have been found above 4,000 m altitude where climatic and edaphic conditions limit tree growth. If this part of the geographical area of the country is excluded for the purpose of forest cover analysis, the forest cover of the country in terms of percentage to the geographical area comes to 21.81%.
2.6 State/UT wise Forest Cover
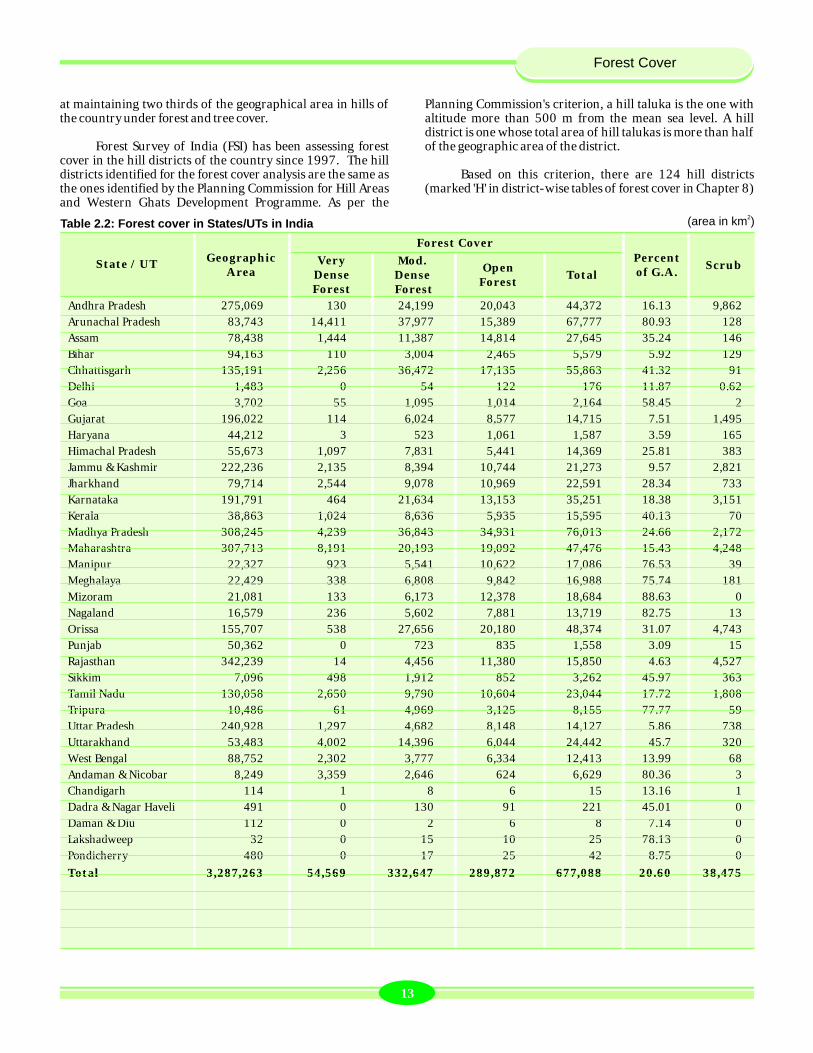
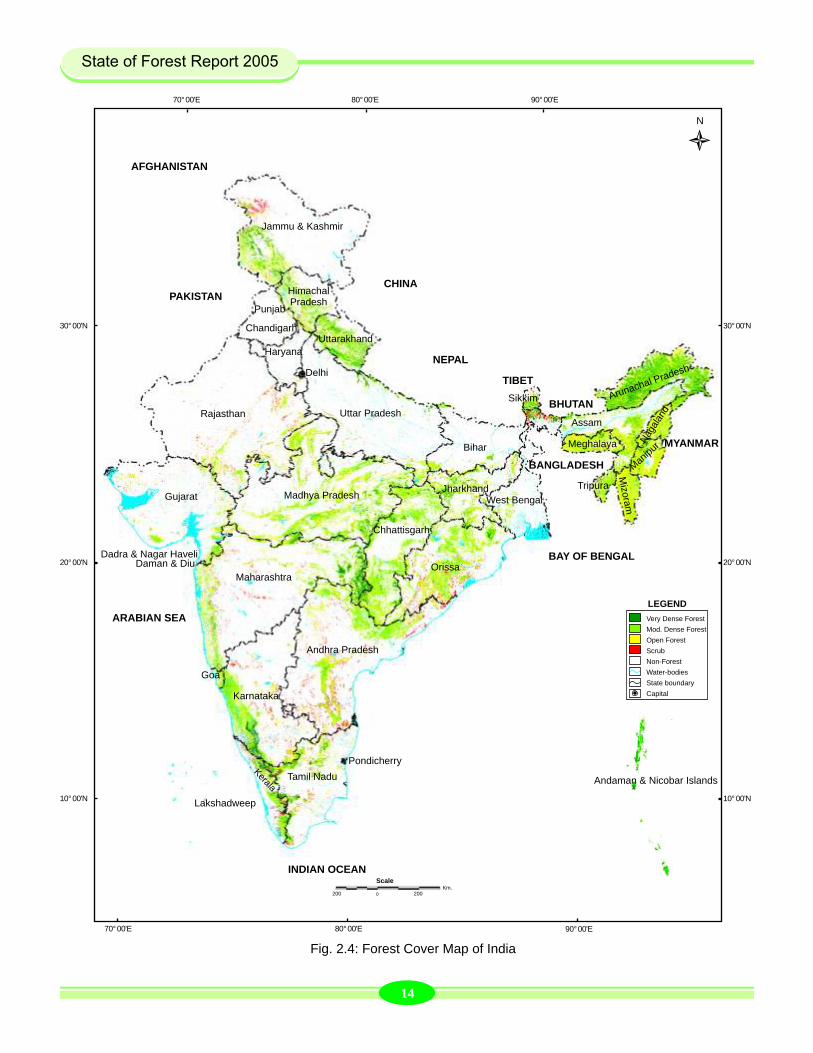
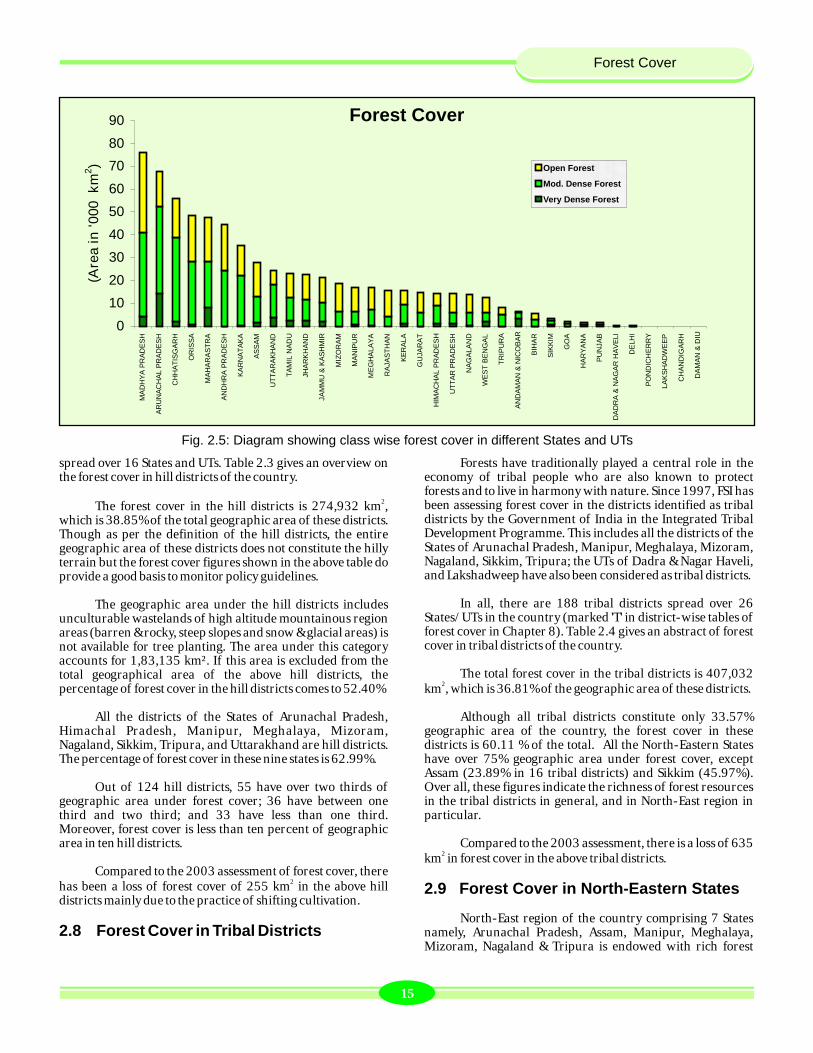
The State/UT wise forest cover in the country is shown in Table 2.2 and as a bar diagram in Figure 2.5. It shows that Madhya Pradesh with 76,013 km² has the largest area under forest cover, followed by Arunachal Pradesh (67,777 km²), Chhattisgarh (55,863 km²), Orissa (48,374 km²) and Maharashtra (47,476 km²). Considering the proportion of geographic area under forest cover, Mizoram has the maximum percentage of 88.63%, followed by Nagaland (82.75%), Arunachal Pradesh (80.93%), and Andaman & Nicobar Islands (80.36%). Andhra Pradesh has the largest area under scrub (9,862 km²). The forest cover map of the country is depicted in Fig. 2.4.
2.7 Forest Cover in Hill Districts
Forest cover in hills is essential to maintain ecological balance and environmental stability as it prevents soil erosion and land degradation. The National Forest Policy (1988) aims
Schematic Diagram : Forest Cover Mapping
Data DownloadGeometricalrectification
Contrastenhancement
Making subsets ofscene
NDVItransformation
Preperation ofchange map
Ground truthing
SOI toposheets1:50,000 scale
Masking non forestareas
Reference data
Editing
Post classificationcorrection
Interpretation ofshadow areas
Delineation of forestcover into canopydensity classes
(unsupervisedclassification aided
on-screen interpretation)
Accuracy assessment
Overlay ofboundaries
Area statistics Maps
Fig. 2.1: Flow chart showing methodology of forest cover mapping
The following table shows the classification scheme of forest cover mapping.
Very Dense Forest All lands having tree cover with canopy density more than 70%
Moderately Dense All lands having tree cover with canopy Forest density between 40% and 70%
Open Forest All lands having tree cover with canopy density between 10% and 40%
Scrub All forest lands with poor tree growth mainly of small or stunted trees having canopy density less than 10 percent
Non-forest Any area not included in the above classes
mapping of forest cover. Some of the important ones are mentioned below:
lSince resolution of data of LISS-III sensor is 23.5 m, the linear strips of forest cover along roads, canals, bunds and railway lines of lesser width are generally not captured.
lYoung plantations and species having less chlorophyll contents in their crown cannot be delineated as forest cover.
lConsiderable details on ground may be obscured in areas having clouds and shadows. It is difficult to interpret such
Forest Cover
1110
The satellite data of the period October to December is therefore the most suitable for forest cover mapping of our country. During this period, deciduous trees, which largely constitute India's forests, bear adequate foliage. This enables capturing of true reflectance from the forests by the satellite sensors. While procuring the data, only those scenes were selected where cloud cover was less than 10 percent.
Data for most of the States & UTs pertained to the period from October to December 2004. Only in a few cases of North-East region and Andaman & Nicobar Islands, where availability of cloud-free data is difficult, the data period was extended up to February 2005.
2.2 Methodology
The Figure 2.1 shows the schematic diagram of the methodology. Using Digital Image Processing (DIP) software, the satellite data in digital form was downloaded on the workstations from the CDs procured from the NRSA. Radiometric and contrast corrections were applied for removing radiometric defects and for improving visual impact of the false colour composites (FCC).
Geometric rectification of the data was carried out with the help of scanned and geo-referenced Survey of India (SOI) toposheets on 1:50,000 scale. The methodology of interpretation involved a hybrid approach in which unsupervised classification (ISODATA algorithm) aided on-screen visual interpretation of forest cover was done.
Normalized Difference Vegetation Index (NDVI) transformation was used for removing non-vegetated areas from the scene. Areas of less than one hectare, whether classified as forest cover within non-forest areas or blanks within forest cover, were excluded by appropriate DIP techniques.
Degraded forests with tree canopy density less than 10 percent have been classified as scrubs, which do not form part of the forest cover.
Shadow areas in the scenes have been treated separately. Shadow regions on the images are highlighted using band ratio techniques. Forest cover classification of the totally obscure areas due to shadow or cloud cover has been done using the ground truth information.
Mangrove forests have characteristic tone and texture on the satellite image. Their presence on the coastal areas makes them even more conspicuous. They have been, therefore, separately classified.
Interpretation was then followed by extensive ground verification which took more than six months. All the necessary corrections were subsequently incorporated. Reference data collected through ground truth and field experience of the interpreter played an important role in delineating the forest cover patches and classifying them into three canopy density classes.
Sheet wise mosaic of districts and States/UTs was made using SOI and census data to compute district wise and State/UT wise forest cover. The final output of the forest cover mapping is in the raster format.
2.3 Accuracy Assessment
Accuracy assessment is an independent exercise under which randomly selected sample points on the satellite imagery were verified on the ground and tallied with interpreted data. In this assessment 4,291 points randomly distributed over the entire country were selected and the verification was done using field inventory data as well as high resolution satellite data (5.8 m) of these points. The detailed procedure has been described in Chapter 7 of this report. The error matrix presented in Table 7.1 reveals that out of the total 4,291 sampling points, the classification of 3,949 was correct. The overall accuracy level of the assessment therefore comes to 92.03%.
2.4 Limitations of Remote Sensing Technology
There are certain limitations of remote sensing based
areas without the help of collateral data or ground truth.
lGregarious occurrence of bushy vegetation and certain agricultural crops, such as sugarcane, cotton, lantana, etc., often poses problems in delineation of forest cover, as their reflectance is similar to that of tree canopy.
2.5 Forest Cover: 2005 Assessment
Results of the forest cover assessment are summarized in Table 2.1 and the same has been depicted through a pie chart in Fig. 2.2. The forest cover of the country (Fig. 2.4) is shown in three density classes, viz., Very Dense Forest (VDF) with more than 70% canopy density, Moderately Dense Forests (MDF) with canopy density between 40% and 70% and Open Forests (OF) with canopy density between 10% and 40%. Scrub areas have also been delineated. As mentioned earlier, area under VDF, MDF and OF also includes mangrove cover of the corresponding density class.
The total forest cover of the country as per 2005 assessment is 677,088 km² and this constitutes 20.60 percent of the geographic area of the country. Of this, 54,569 km² (1.66 %) is very dense forest, 332,647 km² (10.12 %) is moderately dense forest, while 289,872 km² (8.82 %) is open forest cover. The scrub accounts for 38,475 km² (1.17 %).
While computing the percentage of forest cover of the country, the total geographical area of 3,287,263 km² is taken. A closer analysis of this reveals that a sizeable part of the country's area lies in high altitude mountainous region under permanent snow/glaciers, steep slopes and rocks which are not available for tree planting due to climatic and physical reasons. As per a recent study of FSI, about 1,83,135 km² area in the States of Arunachal Pradesh, Himachal Pradesh, Jammu Kashmir, Sikkim and Uttarakhand have been found above 4,000 m altitude where climatic and edaphic conditions limit tree growth. If this part of the geographical area of the country is excluded for the purpose of forest cover analysis, the forest cover of the country in terms of percentage to the geographical area comes to 21.81%.
2.6 State/UT wise Forest Cover
The State/UT wise forest cover in the country is shown in Table 2.2 and as a bar diagram in Figure 2.5. It shows that Madhya Pradesh with 76,013 km² has the largest area under forest cover, followed by Arunachal Pradesh (67,777 km²), Chhattisgarh (55,863 km²), Orissa (48,374 km²) and Maharashtra (47,476 km²). Considering the proportion of geographic area under forest cover, Mizoram has the maximum percentage of 88.63%, followed by Nagaland (82.75%), Arunachal Pradesh (80.93%), and Andaman & Nicobar Islands (80.36%). Andhra Pradesh has the largest area under scrub (9,862 km²). The forest cover map of the country is depicted in Fig. 2.4.
2.7 Forest Cover in Hill Districts
Forest cover in hills is essential to maintain ecological balance and environmental stability as it prevents soil erosion and land degradation. The National Forest Policy (1988) aims
Schematic Diagram : Forest Cover Mapping
Data DownloadGeometricalrectification
Contrastenhancement
Making subsets ofscene
NDVItransformation
Preperation ofchange map
Ground truthing
SOI toposheets1:50,000 scale
Masking non forestareas
Reference data
Editing
Post classificationcorrection
Interpretation ofshadow areas
Delineation of forestcover into canopydensity classes
(unsupervisedclassification aided
on-screen interpretation)
Accuracy assessment
Overlay ofboundaries
Area statistics Maps
Fig. 2.1: Flow chart showing methodology of forest cover mapping
The following table shows the classification scheme of forest cover mapping.
Very Dense Forest All lands having tree cover with canopy density more than 70%
Moderately Dense All lands having tree cover with canopy Forest density between 40% and 70%
Open Forest All lands having tree cover with canopy density between 10% and 40%
Scrub All forest lands with poor tree growth mainly of small or stunted trees having canopy density less than 10 percent
Non-forest Any area not included in the above classes
mapping of forest cover. Some of the important ones are mentioned below:
lSince resolution of data of LISS-III sensor is 23.5 m, the linear strips of forest cover along roads, canals, bunds and railway lines of lesser width are generally not captured.
lYoung plantations and species having less chlorophyll contents in their crown cannot be delineated as forest cover.
lConsiderable details on ground may be obscured in areas having clouds and shadows. It is difficult to interpret such
Forest Cover
1110
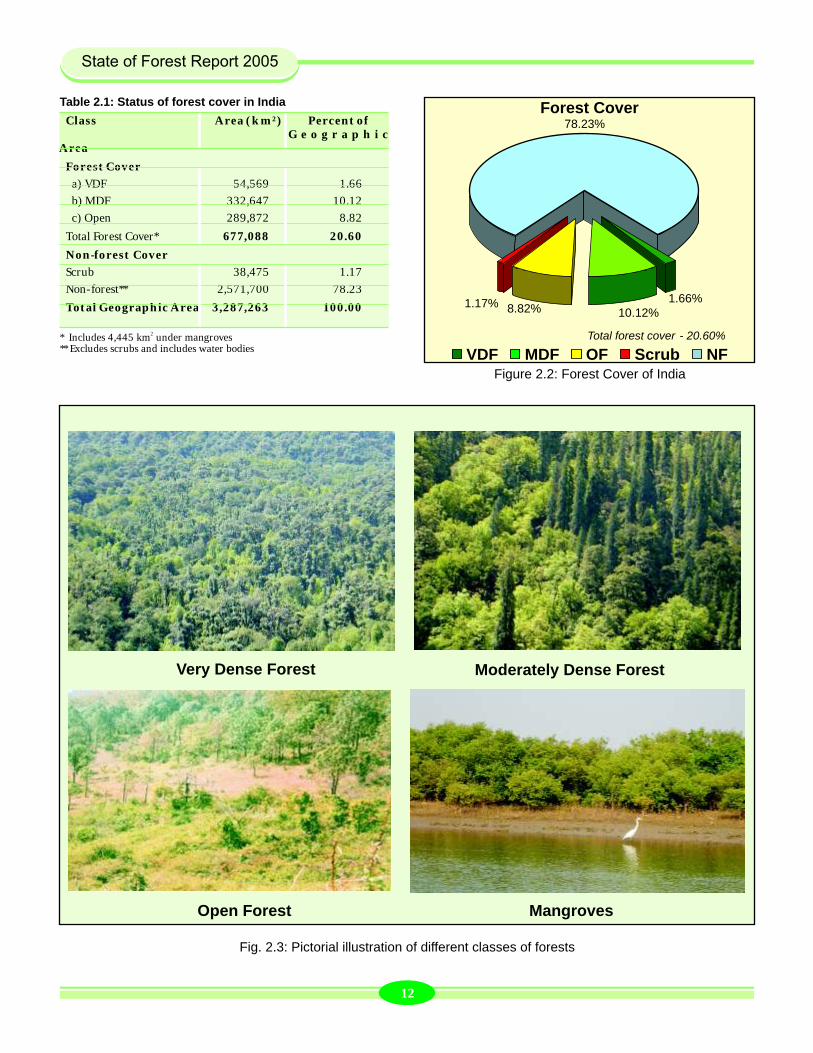
2* Includes 4,445 km under mangroves ** Excludes scrubs and includes water bodies
Class Area (km²) Percent of G e o g r a p h i c
Area
Forest Cover
a) VDF 54,569 1.66
b) MDF 332,647 10.12
c) Open 289,872 8.82
Total Forest Cover* 677,088 20.60
Non-forest Cover
Scrub 38,475 1.17
Non-forest** 2,571,700 78.23
Total Geographic Area 3,287,263 100.00
Table 2.1: Status of forest cover in India
Very Dense Forest Moderately Dense Forest
MangrovesOpen Forest
Fig. 2.3: Pictorial illustration of different classes of forests
at maintaining two thirds of the geographical area in hills of the country under forest and tree cover.
Forest Survey of India (FSI) has been assessing forest cover in the hill districts of the country since 1997. The hill districts identified for the forest cover analysis are the same as the ones identified by the Planning Commission for Hill Areas and Western Ghats Development Programme. As per the
Planning Commission's criterion, a hill taluka is the one with altitude more than 500 m from the mean sea level. A hill district is one whose total area of hill talukas is more than half of the geographic area of the district.
Based on this criterion, there are 124 hill districts (marked 'H' in district-wise tables of forest cover in Chapter 8)
Table 2.2: Forest cover in States/UTs in India
Andhra Pradesh 275,069 130 24,199 20,043 44,372 16.13 9,862
Arunachal Pradesh 83,743 14,411 37,977 15,389 67,777 80.93 128
Assam 78,438 1,444 11,387 14,814 27,645 35.24 146
Bihar 94,163 110 3,004 2,465 5,579 5.92 129
Chhattisgarh 135,191 2,256 36,472 17,135 55,863 41.32 91
Delhi 1,483 0 54 122 176 11.87 0.62
Goa 3,702 55 1,095 1,014 2,164 58.45 2
Gujarat 196,022 114 6,024 8,577 14,715 7.51 1,495
Haryana 44,212 3 523 1,061 1,587 3.59 165
Himachal Pradesh 55,673 1,097 7,831 5,441 14,369 25.81 383
Jammu & Kashmir 222,236 2,135 8,394 10,744 21,273 9.57 2,821
Jharkhand 79,714 2,544 9,078 10,969 22,591 28.34 733
Karnataka 191,791 464 21,634 13,153 35,251 18.38 3,151
Kerala 38,863 1,024 8,636 5,935 15,595 40.13 70
Madhya Pradesh 308,245 4,239 36,843 34,931 76,013 24.66 2,172
Maharashtra 307,713 8,191 20,193 19,092 47,476 15.43 4,248
Manipur 22,327 923 5,541 10,622 17,086 76.53 39
Meghalaya 22,429 338 6,808 9,842 16,988 75.74 181
Mizoram 21,081 133 6,173 12,378 18,684 88.63 0
Nagaland 16,579 236 5,602 7,881 13,719 82.75 13
Orissa 155,707 538 27,656 20,180 48,374 31.07 4,743
Punjab 50,362 0 723 835 1,558 3.09 15
Rajasthan 342,239 14 4,456 11,380 15,850 4.63 4,527
Sikkim 7,096 498 1,912 852 3,262 45.97 363
Tamil Nadu 130,058 2,650 9,790 10,604 23,044 17.72 1,808
Tripura 10,486 61 4,969 3,125 8,155 77.77 59
Uttar Pradesh 240,928 1,297 4,682 8,148 14,127 5.86 738
Uttarakhand 53,483 4,002 14,396 6,044 24,442 45.7 320
West Bengal 88,752 2,302 3,777 6,334 12,413 13.99 68
Andaman & Nicobar 8,249 3,359 2,646 624 6,629 80.36 3
Chandigarh 114 1 8 6 15 13.16 1
Dadra & Nagar Haveli 491 0 130 91 221 45.01 0
Daman & Diu 112 0 2 6 8 7.14 0
Lakshadweep 32 0 15 10 25 78.13 0
Pondicherry 480 0 17 25 42 8.75 0
Total 3,287,263 54,569 332,647 289,872 677,088 20.60 38,475
State / UT
2(area in km )
Geographic Area
Forest CoverPercent of G.A.
ScrubVery Dense Forest
Open Forest
Mod. Dense Forest
Total
Forest Cover
1312
VDF MDF OF Scrub NF
Forest Cover
1.66%10.12%8.82%1.17%
78.23%
Total forest cover - 20.60%
Figure 2.2: Forest Cover of India
spread over 16 States and UTs. Table 2.3 gives an overview on the forest cover in hill districts of the country.
2The forest cover in the hill districts is 274,932 km , which is 38.85% of the total geographic area of these districts. Though as per the definition of the hill districts, the entire geographic area of these districts does not constitute the hilly terrain but the forest cover figures shown in the above table do provide a good basis to monitor policy guidelines.
The geographic area under the hill districts includes unculturable wastelands of high altitude mountainous region areas (barren & rocky, steep slopes and snow & glacial areas) is not available for tree planting. The area under this category accounts for 1,83,135 km². If this area is excluded from the total geographical area of the above hill districts, the percentage of forest cover in the hill districts comes to 52.40%
All the districts of the States of Arunachal Pradesh, Himachal Pradesh, Manipur, Meghalaya, Mizoram, Nagaland, Sikkim, Tripura, and Uttarakhand are hill districts. The percentage of forest cover in these nine states is 62.99%.
Out of 124 hill districts, 55 have over two thirds of geographic area under forest cover; 36 have between one third and two third; and 33 have less than one third. Moreover, forest cover is less than ten percent of geographic area in ten hill districts.
Compared to the 2003 assessment of forest cover, there 2has been a loss of forest cover of 255 km in the above hill
districts mainly due to the practice of shifting cultivation.
2.8 Forest Cover in Tribal Districts
Forests have traditionally played a central role in the economy of tribal people who are also known to protect forests and to live in harmony with nature. Since 1997, FSI has been assessing forest cover in the districts identified as tribal districts by the Government of India in the Integrated Tribal Development Programme. This includes all the districts of the States of Arunachal Pradesh, Manipur, Meghalaya, Mizoram, Nagaland, Sikkim, Tripura; the UTs of Dadra & Nagar Haveli, and Lakshadweep have also been considered as tribal districts.
In all, there are 188 tribal districts spread over 26 States/UTs in the country (marked 'T' in district-wise tables of forest cover in Chapter 8). Table 2.4 gives an abstract of forest cover in tribal districts of the country.
The total forest cover in the tribal districts is 407,032 2km , which is 36.81% of the geographic area of these districts.
Although all tribal districts constitute only 33.57% geographic area of the country, the forest cover in these districts is 60.11 % of the total. All the North-Eastern States have over 75% geographic area under forest cover, except Assam (23.89% in 16 tribal districts) and Sikkim (45.97%). Over all, these figures indicate the richness of forest resources in the tribal districts in general, and in North-East region in particular.
Compared to the 2003 assessment, there is a loss of 635 2km in forest cover in the above tribal districts.
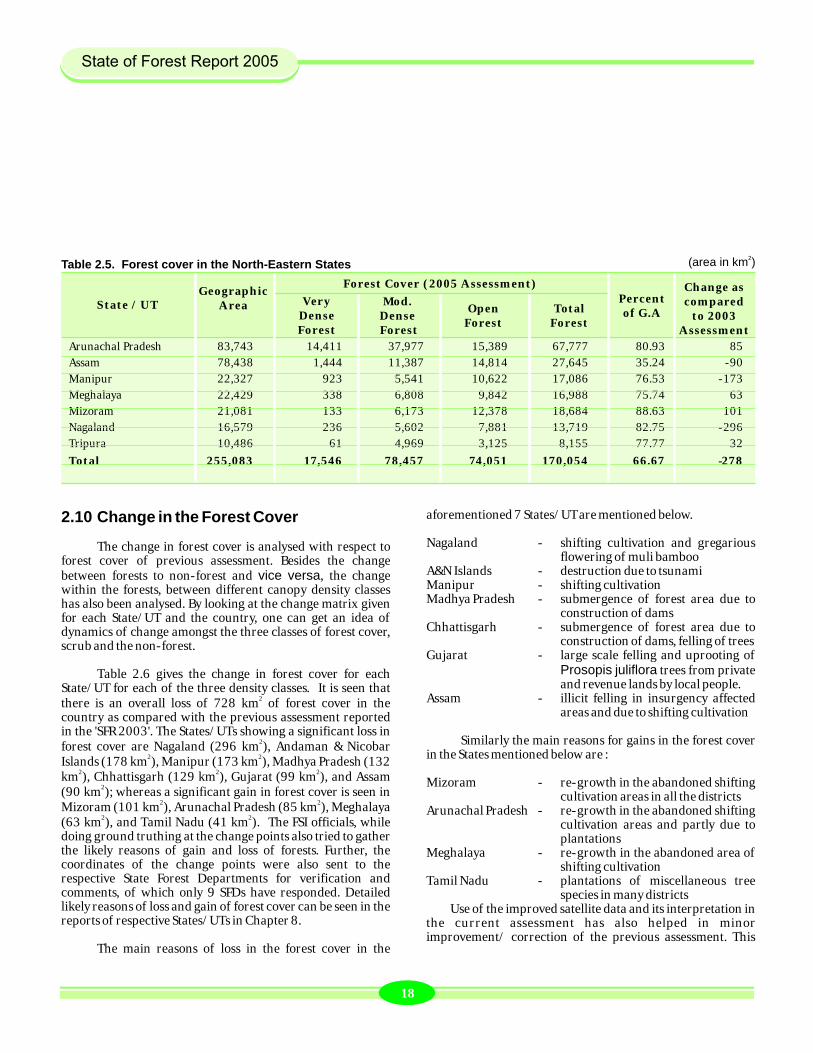
2.9 Forest Cover in North-Eastern States
North-East region of the country comprising 7 States namely, Arunachal Pradesh, Assam, Manipur, Meghalaya, Mizoram, Nagaland & Tripura is endowed with rich forest
Fig. 2.5: Diagram showing class wise forest cover in different States and UTs
Forest Cover
0
10
20
30
40
50
60
70
80
90
MA
DH
YA
PR
AD
ES
H
AR
UN
AC
HA
LP
RA
DE
SH
CH
HA
TIS
GA
RH
OR
ISS
A
MA
HA
RA
ST
RA
AN
DH
RA
PR
AD
ES
H
KA
RN
AT
AK
A
AS
SA
M
UT
TA
RA
KH
AN
D
TA
MIL
NA
DU
JH
AR
KH
AN
D
JA
MM
U&
KA
SH
MIR
MIZ
OR
AM
MA
NIP
UR
ME
GH
ALA
YA
RA
JA
ST
HA
N
KE
RA
LA
GU
JA
RA
T
HIM
AC
HA
LP
RA
DE
SH
UT
TA
RP
RA
DE
SH
NA
GA
LA
ND
WE
ST
BE
NG
AL
TR
IPU
RA
AN
DA
MA
N&
NIC
OB
AR
BIH
AR
SIK
KIM
GO
A
HA
RY
AN
A
PU
NJA
B
DA
DR
A&
NA
GA
RH
AV
ELI
DE
LH
I
PO
ND
ICH
ER
RY
LA
KS
HA
DW
EE
P
CH
AN
DIG
AR
H
DA
MA
N&
DIU
(Are
ain
'000
km
2) Open Forest
Mod. Dense Forest
Very Dense Forest
Fig. 2.4: Forest Cover Map of India
1514
Forest Cover
20°00'N
90°00'E
30°00'N
80°00'E70°00'E
90°00'E70°00'E
Andhra Pradesh
Arunachal Pradesh
Assam
Bihar
Chhattisgarh
Delhi
Haryana
MYANMAR
Himachal Pradesh
Jammu & Kashmir
Jharkhand
Karnataka
Kerala
Madhya Pradesh
Maharashtra
Man
ipur
Meghalaya
Orissa
Rajasthan
Tamil Nadu
Tripura
Uttar Pradesh
Uttarakhand
West Bengal
Andaman & Nicobar Islands
Dadra & Nagar Haveli
Lakshadweep
CHINA
NEPAL
TIBET
BHUTAN
PAKISTAN
ARABIAN SEA
INDIAN OCEAN
BAY OF BENGAL
BANGLADESH
Gujarat
Mizo
ram
Nag
alan
d
Goa
Daman & Diu
Pondicherry
AFGHANISTAN
80°00'E
20°00'N
10°00'N
30°00'N
10°00'N
Sikkim
Scale
0
Km.200 200
Very Dense Forest
Mod. Dense Forest
Open Forest
Scrub
Non-Forest
Water-bodies
State boundary
Capital
LEGEND
Punjab
Chandigarh
N
spread over 16 States and UTs. Table 2.3 gives an overview on the forest cover in hill districts of the country.
2The forest cover in the hill districts is 274,932 km , which is 38.85% of the total geographic area of these districts. Though as per the definition of the hill districts, the entire geographic area of these districts does not constitute the hilly terrain but the forest cover figures shown in the above table do provide a good basis to monitor policy guidelines.
The geographic area under the hill districts includes unculturable wastelands of high altitude mountainous region areas (barren & rocky, steep slopes and snow & glacial areas) is not available for tree planting. The area under this category accounts for 1,83,135 km². If this area is excluded from the total geographical area of the above hill districts, the percentage of forest cover in the hill districts comes to 52.40%
All the districts of the States of Arunachal Pradesh, Himachal Pradesh, Manipur, Meghalaya, Mizoram, Nagaland, Sikkim, Tripura, and Uttarakhand are hill districts. The percentage of forest cover in these nine states is 62.99%.
Out of 124 hill districts, 55 have over two thirds of geographic area under forest cover; 36 have between one third and two third; and 33 have less than one third. Moreover, forest cover is less than ten percent of geographic area in ten hill districts.
Compared to the 2003 assessment of forest cover, there 2has been a loss of forest cover of 255 km in the above hill
districts mainly due to the practice of shifting cultivation.
2.8 Forest Cover in Tribal Districts
Forests have traditionally played a central role in the economy of tribal people who are also known to protect forests and to live in harmony with nature. Since 1997, FSI has been assessing forest cover in the districts identified as tribal districts by the Government of India in the Integrated Tribal Development Programme. This includes all the districts of the States of Arunachal Pradesh, Manipur, Meghalaya, Mizoram, Nagaland, Sikkim, Tripura; the UTs of Dadra & Nagar Haveli, and Lakshadweep have also been considered as tribal districts.
In all, there are 188 tribal districts spread over 26 States/UTs in the country (marked 'T' in district-wise tables of forest cover in Chapter 8). Table 2.4 gives an abstract of forest cover in tribal districts of the country.
The total forest cover in the tribal districts is 407,032 2km , which is 36.81% of the geographic area of these districts.
Although all tribal districts constitute only 33.57% geographic area of the country, the forest cover in these districts is 60.11 % of the total. All the North-Eastern States have over 75% geographic area under forest cover, except Assam (23.89% in 16 tribal districts) and Sikkim (45.97%). Over all, these figures indicate the richness of forest resources in the tribal districts in general, and in North-East region in particular.
Compared to the 2003 assessment, there is a loss of 635 2km in forest cover in the above tribal districts.
2.9 Forest Cover in North-Eastern States
North-East region of the country comprising 7 States namely, Arunachal Pradesh, Assam, Manipur, Meghalaya, Mizoram, Nagaland & Tripura is endowed with rich forest
Fig. 2.5: Diagram showing class wise forest cover in different States and UTs
Forest Cover
0
10
20
30
40
50
60
70
80
90
MA
DH
YA
PR
AD
ES
H
AR
UN
AC
HA
LP
RA
DE
SH
CH
HA
TIS
GA
RH
OR
ISS
A
MA
HA
RA
ST
RA
AN
DH
RA
PR
AD
ES
H
KA
RN
AT
AK
A
AS
SA
M
UT
TA
RA
KH
AN
D
TA
MIL
NA
DU
JH
AR
KH
AN
D
JA
MM
U&
KA
SH
MIR
MIZ
OR
AM
MA
NIP
UR
ME
GH
ALA
YA
RA
JA
ST
HA
N
KE
RA
LA
GU
JA
RA
T
HIM
AC
HA
LP
RA
DE
SH
UT
TA
RP
RA
DE
SH
NA
GA
LA
ND
WE
ST
BE
NG
AL
TR
IPU
RA
AN
DA
MA
N&
NIC
OB
AR
BIH
AR
SIK
KIM
GO
A
HA
RY
AN
A
PU
NJA
B
DA
DR
A&
NA
GA
RH
AV
ELI
DE
LH
I
PO
ND
ICH
ER
RY
LA
KS
HA
DW
EE
P
CH
AN
DIG
AR
H
DA
MA
N&
DIU
(Are
ain
'000
km
2) Open Forest
Mod. Dense Forest
Very Dense Forest
Fig. 2.4: Forest Cover Map of India
1514
Forest Cover
20°00'N
90°00'E
30°00'N
80°00'E70°00'E
90°00'E70°00'E
Andhra Pradesh
Arunachal Pradesh
Assam
Bihar
Chhattisgarh
Delhi
Haryana
MYANMAR
Himachal Pradesh
Jammu & Kashmir
Jharkhand
Karnataka
Kerala
Madhya Pradesh
Maharashtra
Man
ipur
Meghalaya
Orissa
Rajasthan
Tamil Nadu
Tripura
Uttar Pradesh
Uttarakhand
West Bengal
Andaman & Nicobar Islands
Dadra & Nagar Haveli
Lakshadweep
CHINA
NEPAL
TIBET
BHUTAN
PAKISTAN
ARABIAN SEA
INDIAN OCEAN
BAY OF BENGAL
BANGLADESH
Gujarat
Mizo
ram
Nag
alan
d
Goa
Daman & Diu
Pondicherry
AFGHANISTAN
80°00'E
20°00'N
10°00'N
30°00'N
10°00'N
Sikkim
Scale
0
Km.200 200
Very Dense Forest
Mod. Dense Forest
Open Forest
Scrub
Non-Forest
Water-bodies
State boundary
Capital
LEGEND
Punjab
Chandigarh
N
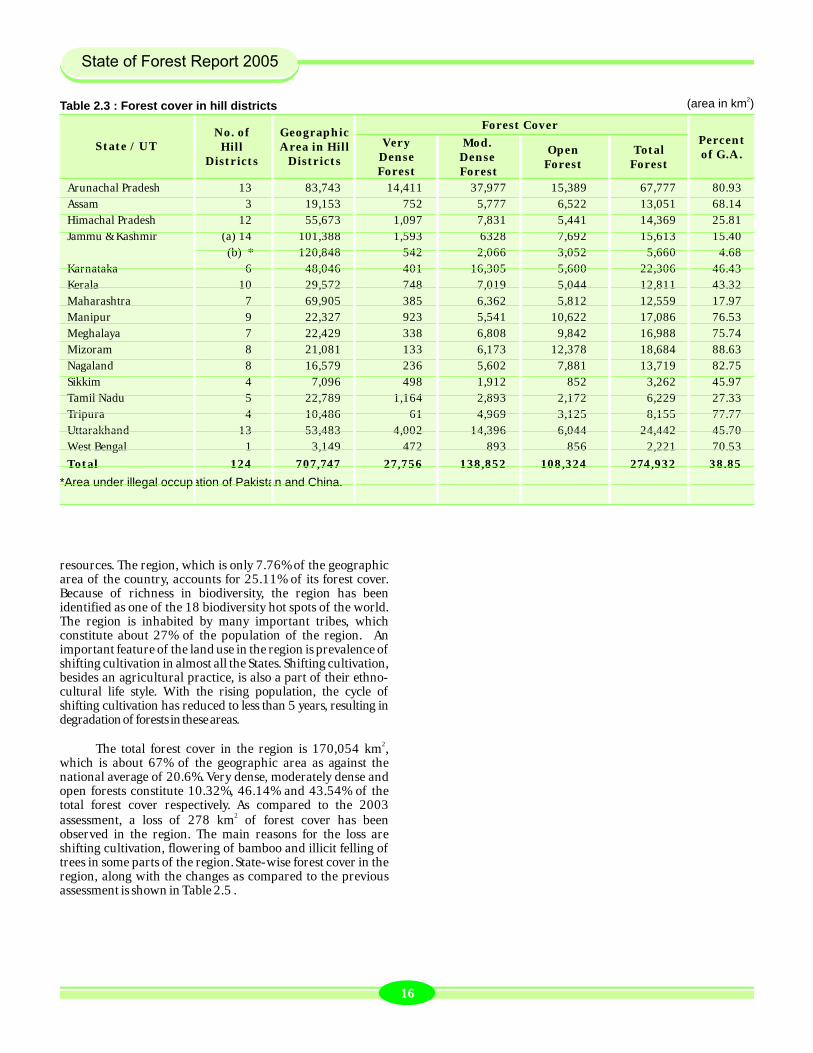
Table 2.4: Forest cover in tribal districts
Andaman & Nicobar 2 8,249 3,359 2,646 624 6,629 80.36
Andhra Pradesh 8 87,090 51 16,278 8,974 25,303 29.05
Arunachal Pradesh 13 83,743 14,411 37,977 15,389 67,777 80.93
Assam 16 50,137 639 4,561 6,778 11,978 23.89
Chhattisgarh 9 92,656 2,002 25,991 12,208 40,201 43.39
Dadra & Nagar Haveli 1 491 0 130 91 221 45.01
Daman & Diu 1 72 0 0.66 2.44 3.1 4.31
Gujarat 8 48,409 105 3,510 3,270 6,885 14.22
Himachal Pradesh 3 26,764 459 1,483 1,253 3,195 11.94
Jharkhand 8 44,413 1,552 5,804 6,281 13,637 30.70
Karnataka 5 26,597 246 8,394 3,555 12,195 45.85
Kerala 9 27,228 692 6,673 4,815 12,180 44.73
Lakshadweep 1 32 0 15 10 25 77.94
Madhya Pradesh 18 139,448 3,638 20,084 17,129 40,851 29.29
Maharashtra 11 138,272 6,701 11,545 10,769 29,015 20.98
Manipur 9 22,327 923 5,541 10,622 17,086 76.53
Meghalaya 7 22,429 338 6,808 9,842 16,988 75.74
Mizoram 8 21,081 133 6,173 12,378 18,684 88.63
Nagaland 8 16,579 236 5,602 7,881 13,719 82.75
Orissa 12 86,124 537 18,885 13,627 33,049 38.37
Rajasthan 5 38,218 0 2,323 3,952 6,275 16.42
Sikkim 4 7,096 498 1,912 852 3,262 45.97
Tamil Nadu 6 30,720 543 2,575 3,492 6,610 21.52
Tripura 4 10,486 61 4,969 3,125 8,155 77.77
Uttar Pradesh 1 7,680 366 502 446 1,314 17.11
West Bengal 11 69,403 2,285 3,683 5,827 11,795 16.99
Total 188 1,105,744 39,775 204,065 163,192 407,032 36.81
State / UT
2(area in km )
Geographic Area in Tribal
Districts
Forest CoverPercent of G.A.
Very Dense Forest
Open Forest
Mod. Dense Forest
No. ofTribal
DistrictsTotal
Forest
Forest Survey of India analyzed the forest cover of all the 28 Tiger Reserves (TRs) of the country and in their outer surrounds (10 km strip) using remote sensing and GIS. Forest cover based on satellite data of IRS-1C/1D (LISS III) of the years 1997, 2000 & 2002 have been used in the study. The change in forest cover was analysed for the period 1997-2002.
It was found that between 1997 and 2002, five TRs have shown increase in forest cover, 11 TRs have shown decrease, and 12 TRs have shown no change. Major losses in forest cover have occurred in Nameri, Buxa, Manas, Indravati, and Dampa TRs mainly due to socio-economic reasons and natural disasters.
Forest cover in the outer surrounds has increased in two TRs, decreased in 21 TRs and has not changed in five TRs. The total forest cover inside the TRs and
2 2outer surrounds has decreased by 94 km and 124 km respectively. The detailed report of the study may be obtained from FSI or from the National Tiger Conservation Authority.
Forest Cover Change in Tiger Reserves
resources. The region, which is only 7.76% of the geographic area of the country, accounts for 25.11% of its forest cover. Because of richness in biodiversity, the region has been identified as one of the 18 biodiversity hot spots of the world. The region is inhabited by many important tribes, which constitute about 27% of the population of the region. An important feature of the land use in the region is prevalence of shifting cultivation in almost all the States. Shifting cultivation, besides an agricultural practice, is also a part of their ethno-cultural life style. With the rising population, the cycle of shifting cultivation has reduced to less than 5 years, resulting in degradation of forests in these areas.
2The total forest cover in the region is 170,054 km , which is about 67% of the geographic area as against the
national average of 20.6%. Very dense, moderately dense and open forests constitute 10.32%, 46.14% and 43.54% of the
total forest cover respectively. As compared to the 2003 2assessment, a loss of 278 km of forest cover has been
observed in the region. The main reasons for the loss are shifting cultivation, flowering of bamboo and illicit felling of
trees in some parts of the region.State-wise forest cover in the region, along with the changes as compared to the previous assessment is shown in Table 2.5 .
Box 1.4
Table 2.3 : Forest cover in hill districts
Arunachal Pradesh 13 83,743 14,411 37,977 15,389 67,777 80.93
Assam 3 19,153 752 5,777 6,522 13,051 68.14
Himachal Pradesh 12 55,673 1,097 7,831 5,441 14,369 25.81
Jammu & Kashmir (a) 14 101,388 1,593 6328 7,692 15,613 15.40
(b) * 120,848 542 2,066 3,052 5,660 4.68
Karnataka 6 48,046 401 16,305 5,600 22,306 46.43
Kerala 10 29,572 748 7,019 5,044 12,811 43.32
Maharashtra 7 69,905 385 6,362 5,812 12,559 17.97
Manipur 9 22,327 923 5,541 10,622 17,086 76.53
Meghalaya 7 22,429 338 6,808 9,842 16,988 75.74
Mizoram 8 21,081 133 6,173 12,378 18,684 88.63
Nagaland 8 16,579 236 5,602 7,881 13,719 82.75
Sikkim 4 7,096 498 1,912 852 3,262 45.97
Tamil Nadu 5 22,789 1,164 2,893 2,172 6,229 27.33
Tripura 4 10,486 61 4,969 3,125 8,155 77.77
Uttarakhand 13 53,483 4,002 14,396 6,044 24,442 45.70
West Bengal 1 3,149 472 893 856 2,221 70.53
Total 124 707,747 27,756 138,852 108,324 274,932 38.85
*Area under illegal occupation of Pakistan and China.
State / UT
2(area in km )
Geographic Area in Hill
Districts
Forest CoverPercent of G.A.
Very Dense Forest
Open Forest
Mod. Dense Forest
No. ofHill
DistrictsTotal
Forest
Forest Cover
1716
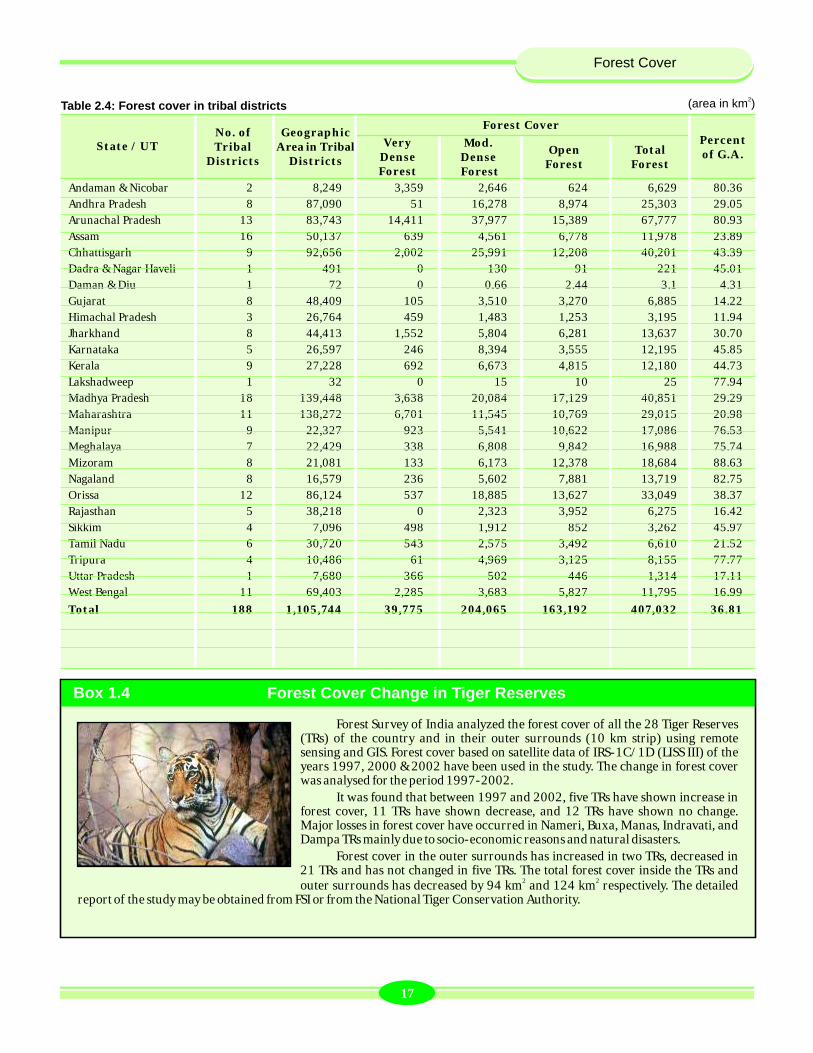
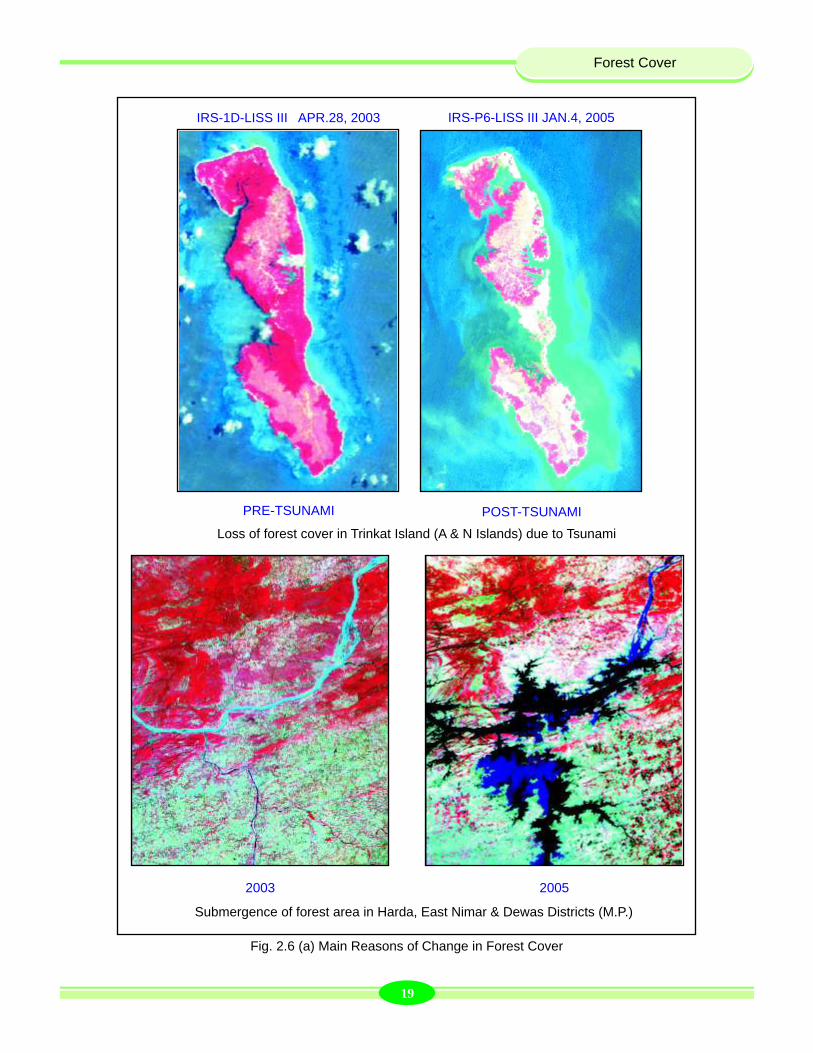
IRS-1D-LISS III APR.28, 2003
IRS-P6-LISS III JAN.4, 2005
PRE-TSUNAMI POST-TSUNAMI
Loss of forest cover in Trinkat Island (A & N Islands) due to Tsunami
Submergence of forest area in Harda, East Nimar & Dewas Districts (M.P.)
2003 2005
Fig. 2.6 (a) Main Reasons of Change in Forest Cover
Table 2.5. Forest cover in the North-Eastern States
Arunachal Pradesh 83,743 14,411 37,977 15,389 67,777 80.93 85
Assam 78,438 1,444 11,387 14,814 27,645 35.24 -90
Manipur 22,327 923 5,541 10,622 17,086 76.53 -173
Meghalaya 22,429 338 6,808 9,842 16,988 75.74 63
Mizoram 21,081 133 6,173 12,378 18,684 88.63 101
Nagaland 16,579 236 5,602 7,881 13,719 82.75 -296
Tripura 10,486 61 4,969 3,125 8,155 77.77 32
Total 255,083 17,546 78,457 74,051 170,054 66.67 -278
State / UT
2(area in km )
Forest Cover (2005 Assessment)Percent of G.A
Very Dense Forest
Open Forest
Mod. Dense Forest
Geographic Area Total
Forest
Change ascompared
to 2003Assessment
2.10 Change in the Forest Cover
The change in forest cover is analysed with respect to forest cover of previous assessment. Besides the change between forests to non-forest and vice versa, the change within the forests, between different canopy density classes has also been analysed. By looking at the change matrix given for each State/UT and the country, one can get an idea of dynamics of change amongst the three classes of forest cover, scrub and the non-forest.
Table 2.6 gives the change in forest cover for each State/UT for each of the three density classes. It is seen that
2there is an overall loss of 728 km of forest cover in the country as compared with the previous assessment reported in the 'SFR 2003'. The States/UTs showing a significant loss in
2forest cover are Nagaland (296 km ), Andaman & Nicobar 2 2Islands (178 km ), Manipur (173 km ), Madhya Pradesh (132
2 2 2km ), Chhattisgarh (129 km ), Gujarat (99 km ), and Assam 2(90 km ); whereas a significant gain in forest cover is seen in
2 2Mizoram (101 km ), Arunachal Pradesh (85 km ), Meghalaya 2 2(63 km ), and Tamil Nadu (41 km ). The FSI officials, while
doing ground truthing at the change points also tried to gather the likely reasons of gain and loss of forests. Further, the coordinates of the change points were also sent to the respective State Forest Departments for verification and comments, of which only 9 SFDs have responded. Detailed likely reasons of loss and gain of forest cover can be seen in the reports of respective States/UTs in Chapter 8.
The main reasons of loss in the forest cover in the
aforementioned 7 States/UT are mentioned below.
Nagaland - shifting cultivation and gregarious flowering of muli bamboo
A&N Islands - destruction due to tsunamiManipur - shifting cultivationMadhya Pradesh - submergence of forest area due to
construction of damsChhattisgarh - submergence of forest area due to
construction of dams, felling of treesGujarat - large scale felling and uprooting of
Prosopis juliflora trees from private and revenue lands by local people.
Assam - illicit felling in insurgency affected areas and due to shifting cultivation
Similarly the main reasons for gains in the forest cover in the States mentioned below are :
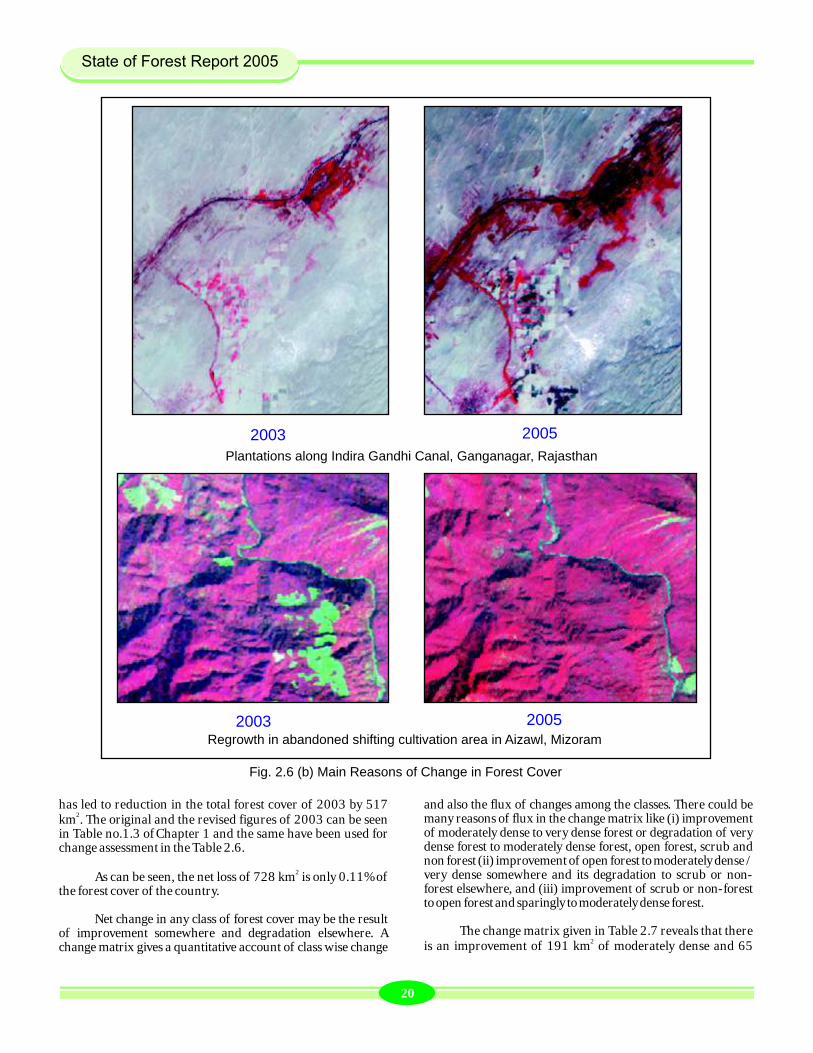
Mizoram - re-growth in the abandoned shifting cultivation areas in all the districts
Arunachal Pradesh - re-growth in the abandoned shifting cultivation areas and partly due to plantations
Meghalaya - re-growth in the abandoned area of shifting cultivation
Tamil Nadu - plantations of miscellaneous tree species in many districts
Use of the improved satellite data and its interpretation in the current assessment has also helped in minor improvement/ correction of the previous assessment. This
1918
Forest Cover
IRS-1D-LISS III APR.28, 2003
IRS-P6-LISS III JAN.4, 2005
PRE-TSUNAMI POST-TSUNAMI
Loss of forest cover in Trinkat Island (A & N Islands) due to Tsunami
Submergence of forest area in Harda, East Nimar & Dewas Districts (M.P.)
2003 2005
Fig. 2.6 (a) Main Reasons of Change in Forest Cover
Table 2.5. Forest cover in the North-Eastern States
Arunachal Pradesh 83,743 14,411 37,977 15,389 67,777 80.93 85
Assam 78,438 1,444 11,387 14,814 27,645 35.24 -90
Manipur 22,327 923 5,541 10,622 17,086 76.53 -173
Meghalaya 22,429 338 6,808 9,842 16,988 75.74 63
Mizoram 21,081 133 6,173 12,378 18,684 88.63 101
Nagaland 16,579 236 5,602 7,881 13,719 82.75 -296
Tripura 10,486 61 4,969 3,125 8,155 77.77 32
Total 255,083 17,546 78,457 74,051 170,054 66.67 -278
State / UT
2(area in km )
Forest Cover (2005 Assessment)Percent of G.A
Very Dense Forest
Open Forest
Mod. Dense Forest
Geographic Area Total
Forest
Change ascompared
to 2003Assessment
2.10 Change in the Forest Cover
The change in forest cover is analysed with respect to forest cover of previous assessment. Besides the change between forests to non-forest and vice versa, the change within the forests, between different canopy density classes has also been analysed. By looking at the change matrix given for each State/UT and the country, one can get an idea of dynamics of change amongst the three classes of forest cover, scrub and the non-forest.
Table 2.6 gives the change in forest cover for each State/UT for each of the three density classes. It is seen that
2there is an overall loss of 728 km of forest cover in the country as compared with the previous assessment reported in the 'SFR 2003'. The States/UTs showing a significant loss in
2forest cover are Nagaland (296 km ), Andaman & Nicobar 2 2Islands (178 km ), Manipur (173 km ), Madhya Pradesh (132
2 2 2km ), Chhattisgarh (129 km ), Gujarat (99 km ), and Assam 2(90 km ); whereas a significant gain in forest cover is seen in
2 2Mizoram (101 km ), Arunachal Pradesh (85 km ), Meghalaya 2 2(63 km ), and Tamil Nadu (41 km ). The FSI officials, while
doing ground truthing at the change points also tried to gather the likely reasons of gain and loss of forests. Further, the coordinates of the change points were also sent to the respective State Forest Departments for verification and comments, of which only 9 SFDs have responded. Detailed likely reasons of loss and gain of forest cover can be seen in the reports of respective States/UTs in Chapter 8.
The main reasons of loss in the forest cover in the
aforementioned 7 States/UT are mentioned below.
Nagaland - shifting cultivation and gregarious flowering of muli bamboo
A&N Islands - destruction due to tsunamiManipur - shifting cultivationMadhya Pradesh - submergence of forest area due to
construction of damsChhattisgarh - submergence of forest area due to
construction of dams, felling of treesGujarat - large scale felling and uprooting of
Prosopis juliflora trees from private and revenue lands by local people.
Assam - illicit felling in insurgency affected areas and due to shifting cultivation
Similarly the main reasons for gains in the forest cover in the States mentioned below are :
Mizoram - re-growth in the abandoned shifting cultivation areas in all the districts
Arunachal Pradesh - re-growth in the abandoned shifting cultivation areas and partly due to plantations
Meghalaya - re-growth in the abandoned area of shifting cultivation
Tamil Nadu - plantations of miscellaneous tree species in many districts
Use of the improved satellite data and its interpretation in the current assessment has also helped in minor improvement/ correction of the previous assessment. This
1918
Forest Cover
2 km of open forest to very dense forests. On the other hand, 2 there has been degradation of 121 km of very dense forest to
2 2 moderately dense, 23 km to open forest and 61 km to non-2forest resulting in a net increase of 51 km of very dense forest.
2Similarly, there is an improvement of 552 km of open forests,
2 25 km of scrub and 91 km of non-forest to moderately dense 2forest but there has also been degradation of 777 km of
2moderately dense forest to open forests, 19 km to scrub and 2 21,191 km to non-forest resulting in a net loss of 1,409 km of
moderately dense forest.
Andhra Pradesh 130 24,221 20,061 44,412 130 24,199 20,043 44,372 0 -22 -18 -40
Arunachal Pradesh 14,445 38,084 15,163 67,692 14.411 37,977 15,389 67,777 -34 -107 226 85
Assam 1,449 11,431 14,855 27,735 1.444 11,387 14,814 27,645 -5 -44 -41 -90
Bihar 80 3,034 2,459 5,573 110 3,004 2,465 5,579 30 -30 6 6
Chhattisgarh 2,256 36,720 17,016 55,992 2.256 36,472 17,135 55,863 0 -248 119 -129
Delhi 0 54 120 174 0 54 122 176 0 0 2 2
Goa 55 1,095 1,014 2,164 55 1,095 1,014 2,164 0 0 0 0
Gujarat 114 6,073 8,627 14,814 114 6,024 8,577 14,715 0 -49 -50 -99
Haryana 3 524 1,049 1,576 3 523 1,061 1,587 0 -1 12 11
Himachal Pradesh 1,097 7,831 5,431 14,359 1.097 7,831 5,441 14,369 0 0 10 10
Jammu & Kashmir 2,135 8,394 10,744 21,273 2.135 8,394 10,744 21,273 0 0 0 0
Jharkhand 2,544 9,076 10,949 22,569 2.544 9,078 10,969 22,591 0 2 20 22
Karnataka 464 21,638 13,144 35,246 464 21,634 13,153 35,251 0 -4 9 5
Kerala 1,024 8,637 5,934 15,595 1.024 8,636 5,935 15,595 0 -1 1 0
Madhya Pradesh 4,251 36,899 34,995 76,145 4.239 36,843 34,931 76,013 -12 -56 -64 -132
Maharashtra 8,201 20,221 19,092 47,514 8.191 20,193 19,092 47,476 -10 -28 0 -38
Manipur 930 5,595 10,734 17,259 923 5,541 10,622 17,086 -7 -54 -112 -173
Meghalaya 265 6,786 9,874 16,925 338 6,808 9,842 16,988 73 22 -32 63
Mizoram 133 6,522 11,928 18,583 133 6,173 12,378 18,684 0 -349 450 101
Nagaland 236 5,860 7,919 14,015 236 5,602 7,881 13,719 0 -258 -38 -296
Orissa 487 27,712 20,154 48,353 538 27,656 20,180 48,374 51 -56 26 21
Punjab 0 709 836 1,545 0 723 835 1,558 0 14 -1 13
Rajasthan 14 4,454 11,353 15,821 14 4,456 11,380 15,850 0 2 27 29
Sikkim 498 1,912 852 3,262 498 1,912 852 3,262 0 0 0 0
Tamil Nadu 2,650 9,788 10,565 23,003 2,650 9,790 10,604 23,044 0 2 39 41
Tripura 58 4,972 3,093 8,123 61 4,969 3,125 8,155 3 -3 32 32
Uttar Pradesh 1,297 4,682 8,148 14,127 1,297 4,682 8,148 14,127 0 0 0 0
Uttarakhand 4,002 14,409 6,049 24,460 4,002 14,396 6,044 24,442 0 -13 -5 -18
West Bengal 2,302 3,774 6,313 12,389 2,302 3,777 6,334 12,413 0 3 21 24
Andaman & Nicobar 3,397 2,777 633 6,807 3,359 2,646 624 6,629 -38 -131 -9 -178
Chandigarh 1 8 6 15 1 8 6 15 0 0 0 0
Dadra & Nagar Haveli 0 130 91 221 0 130 91 221 0 0 0 0
Daman & Diu 0 2 6 8 0 2 6 8 0 0 0 0
Lakshadweep 0 15 10 25 0 15 10 25 0 0 0 0
Pondicherry 0 17 25 42 0 17 25 42 0 0 0 0
Total 54,518 334,056 289,242 677,816 54,569 332,647 289,872 677,088 51 -1,409 630 -728
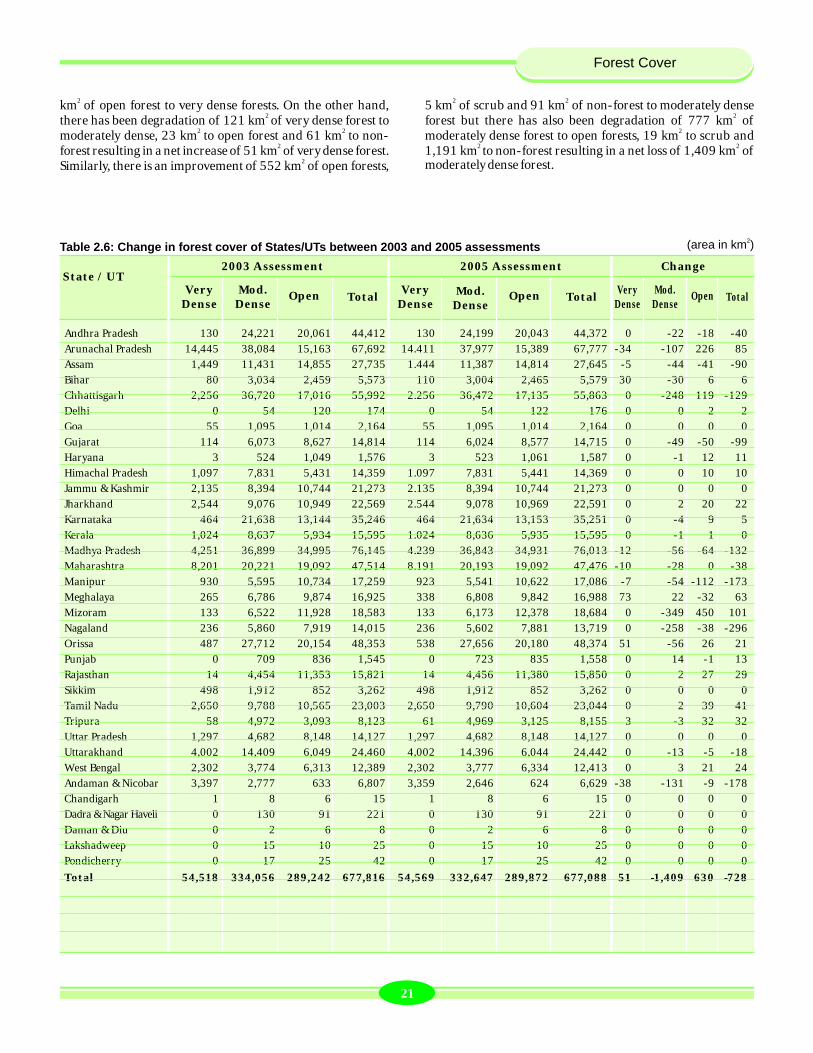
Table 2.6: Change in forest cover of States/UTs between 2003 and 2005 assessments2(area in km )
State / UT2003 Assessment
Very Dense
OpenMod.
DenseTotal
2005 Assessment Change
Very Dense
OpenMod. Dense
TotalVery
Dense Open
Mod. Dense
Total
Plantations along Indira Gandhi Canal, Ganganagar, Rajasthan
2003 2005
2003 2005Regrowth in abandoned shifting cultivation area in Aizawl, Mizoram
has led to reduction in the total forest cover of 2003 by 517 2km . The original and the revised figures of 2003 can be seen
in Table no.1.3 of Chapter 1 and the same have been used for change assessment in the Table 2.6.
2As can be seen, the net loss of 728 km is only 0.11% of the forest cover of the country.
Net change in any class of forest cover may be the result of improvement somewhere and degradation elsewhere. A change matrix gives a quantitative account of class wise change
Fig. 2.6 (b) Main Reasons of Change in Forest Cover
and also the flux of changes among the classes. There could be many reasons of flux in the change matrix like (i) improvement of moderately dense to very dense forest or degradation of very dense forest to moderately dense forest, open forest, scrub and non forest (ii) improvement of open forest to moderately dense / very dense somewhere and its degradation to scrub or non-forest elsewhere, and (iii) improvement of scrub or non-forest to open forest and sparingly to moderately dense forest.
The change matrix given in Table 2.7 reveals that there 2is an improvement of 191 km of moderately dense and 65
2120
Forest Cover
2 km of open forest to very dense forests. On the other hand, 2 there has been degradation of 121 km of very dense forest to
2 2 moderately dense, 23 km to open forest and 61 km to non-2forest resulting in a net increase of 51 km of very dense forest.
2Similarly, there is an improvement of 552 km of open forests,
2 25 km of scrub and 91 km of non-forest to moderately dense 2forest but there has also been degradation of 777 km of
2moderately dense forest to open forests, 19 km to scrub and 2 21,191 km to non-forest resulting in a net loss of 1,409 km of
moderately dense forest.
Andhra Pradesh 130 24,221 20,061 44,412 130 24,199 20,043 44,372 0 -22 -18 -40
Arunachal Pradesh 14,445 38,084 15,163 67,692 14.411 37,977 15,389 67,777 -34 -107 226 85
Assam 1,449 11,431 14,855 27,735 1.444 11,387 14,814 27,645 -5 -44 -41 -90
Bihar 80 3,034 2,459 5,573 110 3,004 2,465 5,579 30 -30 6 6
Chhattisgarh 2,256 36,720 17,016 55,992 2.256 36,472 17,135 55,863 0 -248 119 -129
Delhi 0 54 120 174 0 54 122 176 0 0 2 2
Goa 55 1,095 1,014 2,164 55 1,095 1,014 2,164 0 0 0 0
Gujarat 114 6,073 8,627 14,814 114 6,024 8,577 14,715 0 -49 -50 -99
Haryana 3 524 1,049 1,576 3 523 1,061 1,587 0 -1 12 11
Himachal Pradesh 1,097 7,831 5,431 14,359 1.097 7,831 5,441 14,369 0 0 10 10
Jammu & Kashmir 2,135 8,394 10,744 21,273 2.135 8,394 10,744 21,273 0 0 0 0
Jharkhand 2,544 9,076 10,949 22,569 2.544 9,078 10,969 22,591 0 2 20 22
Karnataka 464 21,638 13,144 35,246 464 21,634 13,153 35,251 0 -4 9 5
Kerala 1,024 8,637 5,934 15,595 1.024 8,636 5,935 15,595 0 -1 1 0
Madhya Pradesh 4,251 36,899 34,995 76,145 4.239 36,843 34,931 76,013 -12 -56 -64 -132
Maharashtra 8,201 20,221 19,092 47,514 8.191 20,193 19,092 47,476 -10 -28 0 -38
Manipur 930 5,595 10,734 17,259 923 5,541 10,622 17,086 -7 -54 -112 -173
Meghalaya 265 6,786 9,874 16,925 338 6,808 9,842 16,988 73 22 -32 63
Mizoram 133 6,522 11,928 18,583 133 6,173 12,378 18,684 0 -349 450 101
Nagaland 236 5,860 7,919 14,015 236 5,602 7,881 13,719 0 -258 -38 -296
Orissa 487 27,712 20,154 48,353 538 27,656 20,180 48,374 51 -56 26 21
Punjab 0 709 836 1,545 0 723 835 1,558 0 14 -1 13
Rajasthan 14 4,454 11,353 15,821 14 4,456 11,380 15,850 0 2 27 29
Sikkim 498 1,912 852 3,262 498 1,912 852 3,262 0 0 0 0
Tamil Nadu 2,650 9,788 10,565 23,003 2,650 9,790 10,604 23,044 0 2 39 41
Tripura 58 4,972 3,093 8,123 61 4,969 3,125 8,155 3 -3 32 32
Uttar Pradesh 1,297 4,682 8,148 14,127 1,297 4,682 8,148 14,127 0 0 0 0
Uttarakhand 4,002 14,409 6,049 24,460 4,002 14,396 6,044 24,442 0 -13 -5 -18
West Bengal 2,302 3,774 6,313 12,389 2,302 3,777 6,334 12,413 0 3 21 24
Andaman & Nicobar 3,397 2,777 633 6,807 3,359 2,646 624 6,629 -38 -131 -9 -178
Chandigarh 1 8 6 15 1 8 6 15 0 0 0 0
Dadra & Nagar Haveli 0 130 91 221 0 130 91 221 0 0 0 0
Daman & Diu 0 2 6 8 0 2 6 8 0 0 0 0
Lakshadweep 0 15 10 25 0 15 10 25 0 0 0 0
Pondicherry 0 17 25 42 0 17 25 42 0 0 0 0
Total 54,518 334,056 289,242 677,816 54,569 332,647 289,872 677,088 51 -1,409 630 -728
Table 2.6: Change in forest cover of States/UTs between 2003 and 2005 assessments2(area in km )
State / UT2003 Assessment
Very Dense
OpenMod.
DenseTotal
2005 Assessment Change
Very Dense
OpenMod. Dense
TotalVery
Dense Open
Mod. Dense
Total
Plantations along Indira Gandhi Canal, Ganganagar, Rajasthan
2003 2005
2003 2005Regrowth in abandoned shifting cultivation area in Aizawl, Mizoram
has led to reduction in the total forest cover of 2003 by 517 2km . The original and the revised figures of 2003 can be seen
in Table no.1.3 of Chapter 1 and the same have been used for change assessment in the Table 2.6.
2As can be seen, the net loss of 728 km is only 0.11% of the forest cover of the country.
Net change in any class of forest cover may be the result of improvement somewhere and degradation elsewhere. A change matrix gives a quantitative account of class wise change
Fig. 2.6 (b) Main Reasons of Change in Forest Cover
and also the flux of changes among the classes. There could be many reasons of flux in the change matrix like (i) improvement of moderately dense to very dense forest or degradation of very dense forest to moderately dense forest, open forest, scrub and non forest (ii) improvement of open forest to moderately dense / very dense somewhere and its degradation to scrub or non-forest elsewhere, and (iii) improvement of scrub or non-forest to open forest and sparingly to moderately dense forest.
The change matrix given in Table 2.7 reveals that there 2is an improvement of 191 km of moderately dense and 65
2120
Forest Cover
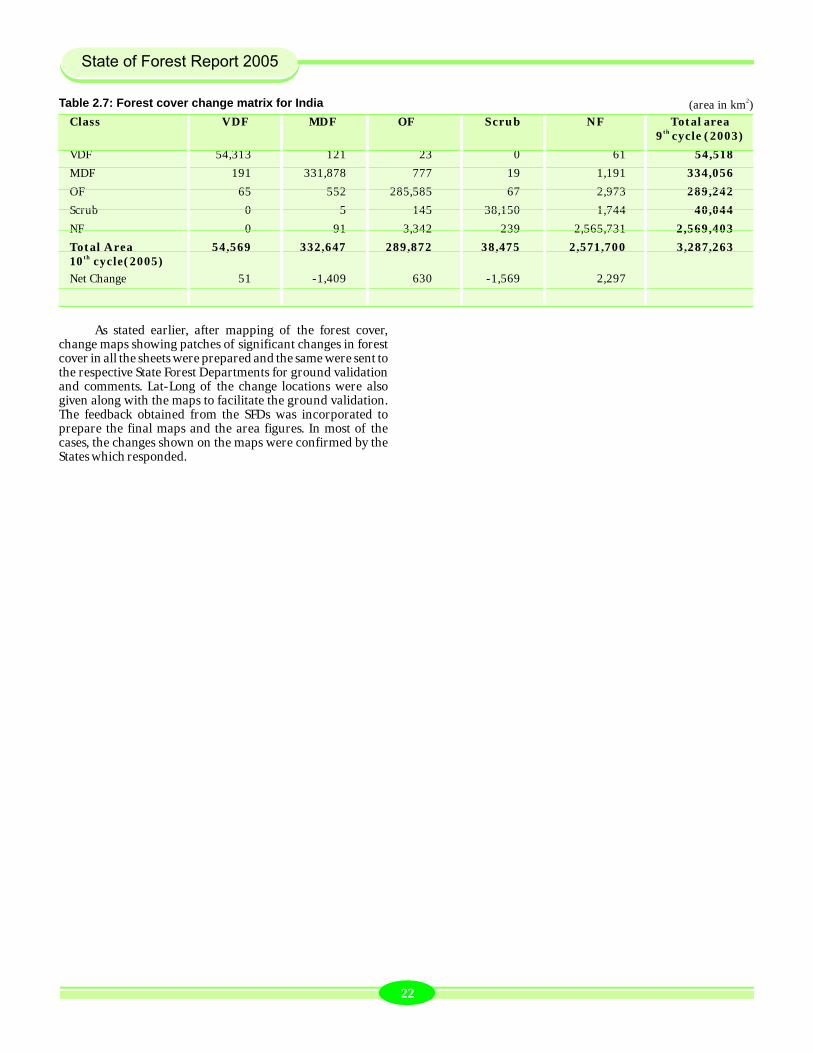
As stated earlier, after mapping of the forest cover, change maps showing patches of significant changes in forest cover in all the sheets were prepared and the same were sent to the respective State Forest Departments for ground validation and comments. Lat-Long of the change locations were also given along with the maps to facilitate the ground validation. The feedback obtained from the SFDs was incorporated to prepare the final maps and the area figures. In most of the cases, the changes shown on the maps were confirmed by the States which responded.
Class VDF MDF OF Scrub NF Total areath9 cycle (2003)
VDF 54,313 121 23 0 61 54,518
MDF 191 331,878 777 19 1,191 334,056
OF 65 552 285,585 67 2,973 289,242
Scrub 0 5 145 38,150 1,744 40,044
NF 0 91 3,342 239 2,565,731 2,569,403
Total Area 54,569 332,647 289,872 38,475 2,571,700 3,287,263th10 cycle(2005)
Net Change 51 -1,409 630 -1,569 2,297
Table 2.7: Forest cover change matrix for India 2(area in km )
22