
2 Experimental Conditions Sample Preparation · analytical advantages of chromatographic...
9
Transcript of 2 Experimental Conditions Sample Preparation · analytical advantages of chromatographic...
2 Therefore, it is essential that whisky producers use the available analytical technology to accurately and comprehensively characterize their products so that adulteration can be confidently identified and action taken to protect their product and brands. It may also be beneficial for whisky producers to chemically profile their products as part of their quality control procedures to enable comparison of different production batches and detection of any changes in the production process over time. This will help ensure that the whisky they bottle consistently contains the particular signature flavors and characteristics expected by the consumer.
Gas chromatography mass spectrometry (GC-MS) has been widely used to characterize whisky as it provides analytical advantages of chromatographic resolution, reproducibility, peak capacity, and, importantly, extensive spectral libraries to aid in identification of volatile and semi-volatile chemical constituents. In this proof-of-concept study, we seek to take advantage of the performance of the Thermo Scientific™ Q Exactive™ GC Hybrid Quadrupole-Orbitrap™ Mass Spectrometer for the profiling of whisky of different origins, ages and types. Another aim is to evaluate the application of a complete untargeted chemometric workflow using the Q Exactive GC system to detect and identify chemical components in whisky. It will also show the process of identifying chemical differences in whiskies of different origins. Samples were analyzed using a full scan non-targeted acquisition and high mass resolving power to obtain accurate mass measurements. This is important to enable elucidation of the elemental composition and discrimination of co-eluting and isobaric compounds. Fast scan speeds in combination with a high in-scan dynamic range and high sensitivity facilitates the detection of both low and high intensity components. These features in combination with unique software algorithms for automated deconvolution and sample comparison create a powerful solution for comprehensive characterization, quality control, and product brand protection.
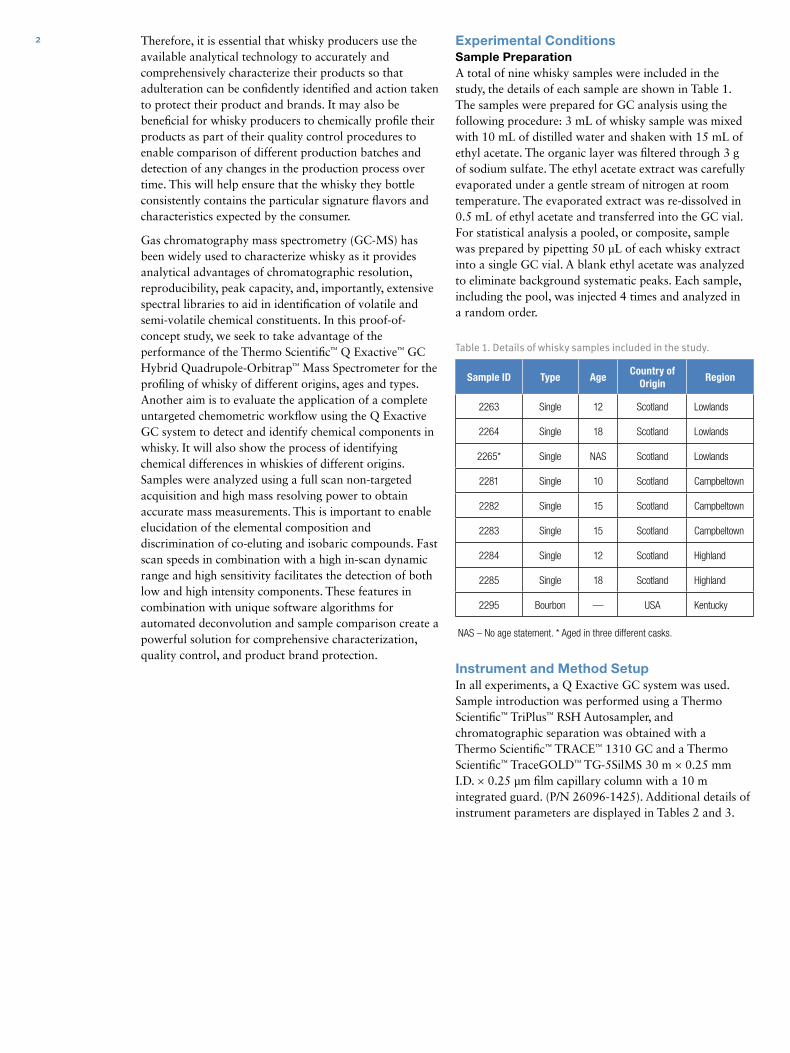
Experimental ConditionsSample PreparationA total of nine whisky samples were included in the study, the details of each sample are shown in Table 1. The samples were prepared for GC analysis using the following procedure: 3 mL of whisky sample was mixed with 10 mL of distilled water and shaken with 15 mL of ethyl acetate. The organic layer was filtered through 3 g of sodium sulfate. The ethyl acetate extract was carefully evaporated under a gentle stream of nitrogen at room temperature. The evaporated extract was re-dissolved in 0.5 mL of ethyl acetate and transferred into the GC vial. For statistical analysis a pooled, or composite, sample was prepared by pipetting 50 µL of each whisky extract into a single GC vial. A blank ethyl acetate was analyzed to eliminate background systematic peaks. Each sample, including the pool, was injected 4 times and analyzed in a random order.
Table 1. Details of whisky samples included in the study.
Sample ID Type AgeCountry of
OriginRegion
2263 Single 12 Scotland Lowlands
2264 Single 18 Scotland Lowlands
2265* Single NAS Scotland Lowlands
2281 Single 10 Scotland Campbeltown
2282 Single 15 Scotland Campbeltown
2283 Single 15 Scotland Campbeltown
2284 Single 12 Scotland Highland
2285 Single 18 Scotland Highland
2295 Bourbon — USA Kentucky
Instrument and Method SetupIn all experiments, a Q Exactive GC system was used. Sample introduction was performed using a Thermo Scientific™ TriPlus™ RSH Autosampler, and chromatographic separation was obtained with a Thermo Scientific™ TRACE™ 1310 GC and a Thermo Scientific™ TraceGOLD™ TG-5SilMS 30 m × 0.25 mm I.D. × 0.25 µm film capillary column with a 10 m integrated guard. (P/N 26096-1425). Additional details of instrument parameters are displayed in Tables 2 and 3.
NAS – No age statement. * Aged in three different casks.
3
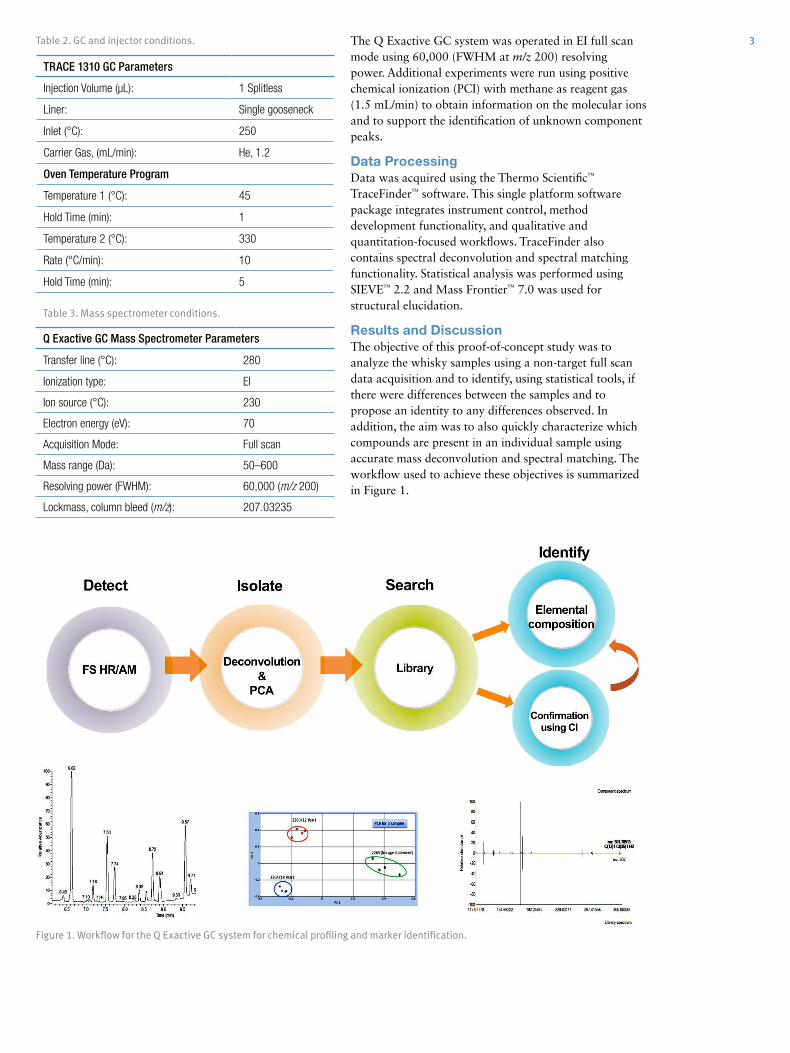
Figure 1. Workflow for the Q Exactive GC system for chemical profiling and marker identification.
Table 2. GC and injector conditions.
TRACE 1310 GC Parameters
Injection Volume (µL): 1 Splitless
Liner: Single gooseneck
Inlet (°C): 250
Carrier Gas, (mL/min): He, 1.2
Oven Temperature Program
Temperature 1 (°C): 45
Hold Time (min): 1
Temperature 2 (°C): 330
Rate (°C/min): 10
Hold Time (min): 5
Table 3. Mass spectrometer conditions.
Q Exactive GC Mass Spectrometer Parameters
Transfer line (°C): 280
Ionization type: EI
Ion source (°C): 230
Electron energy (eV): 70
Acquisition Mode: Full scan
Mass range (Da): 50–600
Resolving power (FWHM): 60,000 (m/z 200)
Lockmass, column bleed (m/z): 207.03235
The Q Exactive GC system was operated in EI full scan mode using 60,000 (FWHM at m/z 200) resolving power. Additional experiments were run using positive chemical ionization (PCI) with methane as reagent gas (1.5 mL/min) to obtain information on the molecular ions and to support the identification of unknown component peaks.
Data ProcessingData was acquired using the Thermo Scientific™ TraceFinder™ software. This single platform software package integrates instrument control, method development functionality, and qualitative and quantitation-focused workflows. TraceFinder also contains spectral deconvolution and spectral matching functionality. Statistical analysis was performed using SIEVE™ 2.2 and Mass Frontier™ 7.0 was used for structural elucidation.
Results and DiscussionThe objective of this proof-of-concept study was to analyze the whisky samples using a non-target full scan data acquisition and to identify, using statistical tools, if there were differences between the samples and to propose an identity to any differences observed. In addition, the aim was to also quickly characterize which compounds are present in an individual sample using accurate mass deconvolution and spectral matching. The workflow used to achieve these objectives is summarized in Figure 1.
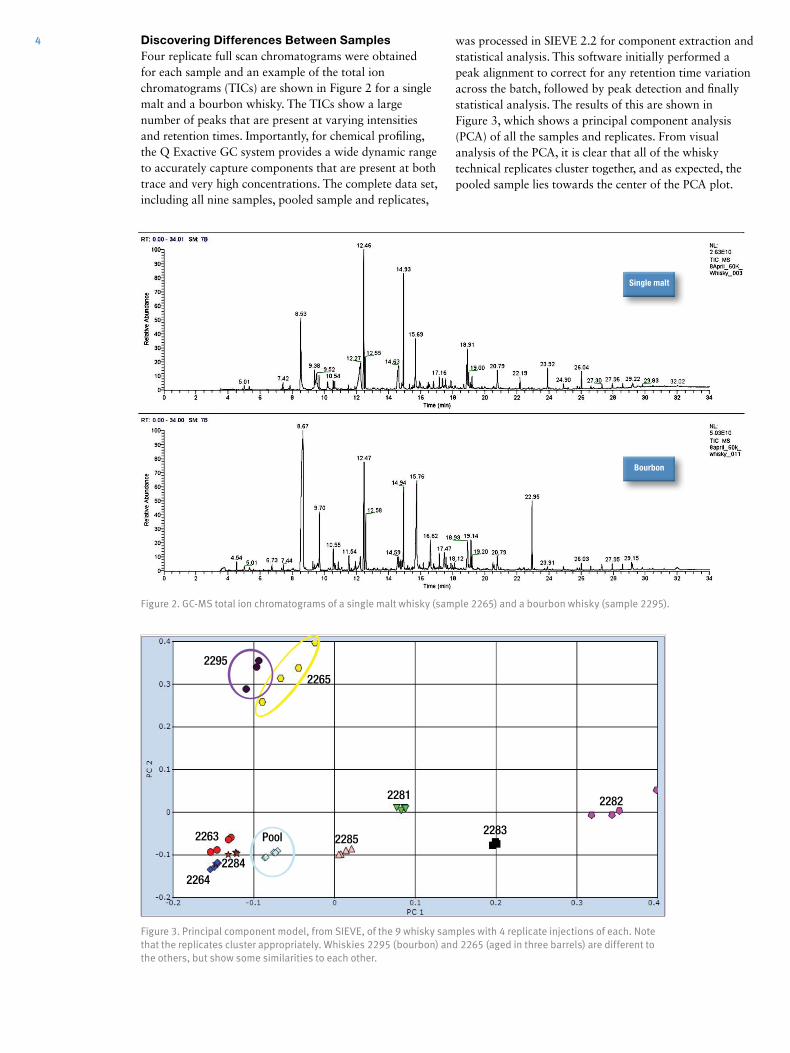
4 Discovering Differences Between SamplesFour replicate full scan chromatograms were obtained for each sample and an example of the total ion chromatograms (TICs) are shown in Figure 2 for a single malt and a bourbon whisky. The TICs show a large number of peaks that are present at varying intensities and retention times. Importantly, for chemical profiling, the Q Exactive GC system provides a wide dynamic range to accurately capture components that are present at both trace and very high concentrations. The complete data set, including all nine samples, pooled sample and replicates,
Figure 2. GC-MS total ion chromatograms of a single malt whisky (sample 2265) and a bourbon whisky (sample 2295).
Figure 3. Principal component model, from SIEVE, of the 9 whisky samples with 4 replicate injections of each. Note that the replicates cluster appropriately. Whiskies 2295 (bourbon) and 2265 (aged in three barrels) are different to the others, but show some similarities to each other.
was processed in SIEVE 2.2 for component extraction and statistical analysis. This software initially performed a peak alignment to correct for any retention time variation across the batch, followed by peak detection and finally statistical analysis. The results of this are shown in Figure 3, which shows a principal component analysis (PCA) of all the samples and replicates. From visual analysis of the PCA, it is clear that all of the whisky technical replicates cluster together, and as expected, the pooled sample lies towards the center of the PCA plot.
2282
2283
2281
2265
2295
Pool 2285 2263
2264 2284
Single malt
Bourbon
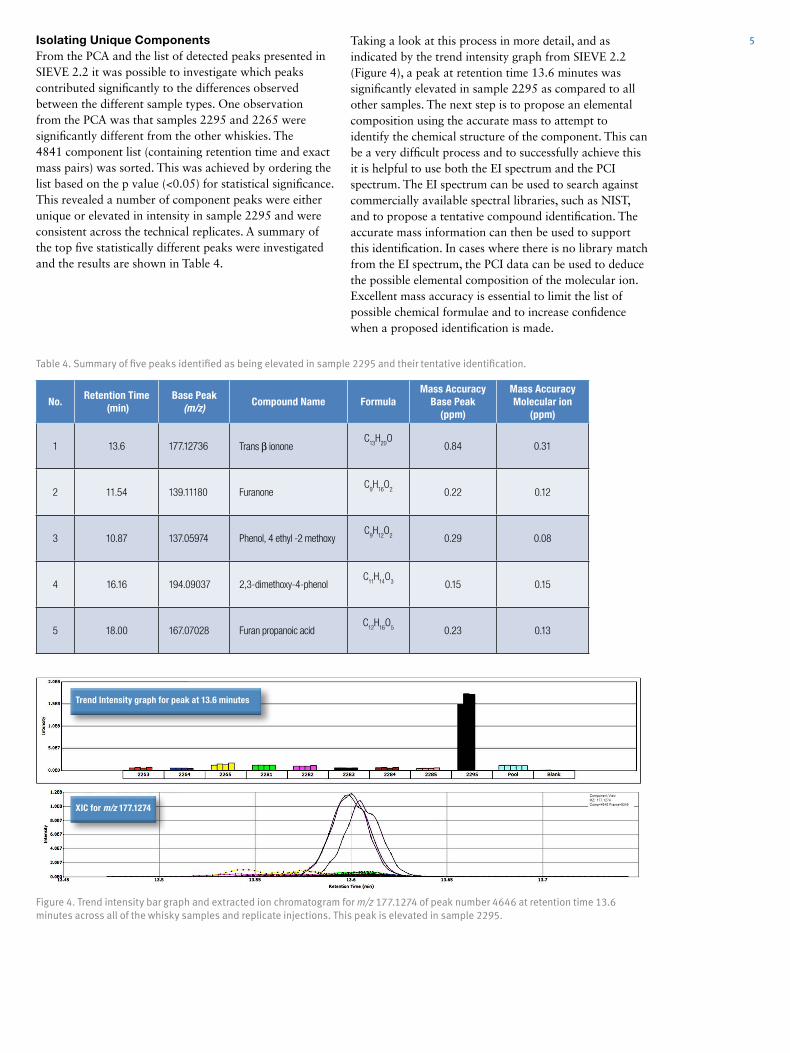
5Taking a look at this process in more detail, and as indicated by the trend intensity graph from SIEVE 2.2 (Figure 4), a peak at retention time 13.6 minutes was significantly elevated in sample 2295 as compared to all other samples. The next step is to propose an elemental composition using the accurate mass to attempt to identify the chemical structure of the component. This can be a very difficult process and to successfully achieve this it is helpful to use both the EI spectrum and the PCI spectrum. The EI spectrum can be used to search against commercially available spectral libraries, such as NIST, and to propose a tentative compound identification. The accurate mass information can then be used to support this identification. In cases where there is no library match from the EI spectrum, the PCI data can be used to deduce the possible elemental composition of the molecular ion. Excellent mass accuracy is essential to limit the list of possible chemical formulae and to increase confidence when a proposed identification is made.
Isolating Unique ComponentsFrom the PCA and the list of detected peaks presented in SIEVE 2.2 it was possible to investigate which peaks contributed significantly to the differences observed between the different sample types. One observation from the PCA was that samples 2295 and 2265 were significantly different from the other whiskies. The 4841 component list (containing retention time and exact mass pairs) was sorted. This was achieved by ordering the list based on the p value (<0.05) for statistical significance. This revealed a number of component peaks were either unique or elevated in intensity in sample 2295 and were consistent across the technical replicates. A summary of the top five statistically different peaks were investigated and the results are shown in Table 4.
No.Retention Time
(min)Base Peak (m/z) Compound Name Formula
Mass Accuracy Base Peak
(ppm)
Mass Accuracy Molecular ion
(ppm)
1 13.6 177.12736 Trans β iononeC
13H
20O
0.84 0.31
2 11.54 139.11180 FuranoneC
9H
16O
2 0.22 0.12
3 10.87 137.05974 Phenol, 4 ethyl -2 methoxyC
9H
12O
2 0.29 0.08
4 16.16 194.09037 2,3-dimethoxy-4-phenolC
11H
14O
3 0.15 0.15
5 18.00 167.07028 Furan propanoic acidC
12H
16O
5 0.23 0.13
Table 4. Summary of five peaks identified as being elevated in sample 2295 and their tentative identification.
Figure 4. Trend intensity bar graph and extracted ion chromatogram for m/z 177.1274 of peak number 4646 at retention time 13.6 minutes across all of the whisky samples and replicate injections. This peak is elevated in sample 2295.
Trend Intensity graph for peak at 13.6 minutes
XIC for m/z 177.1274
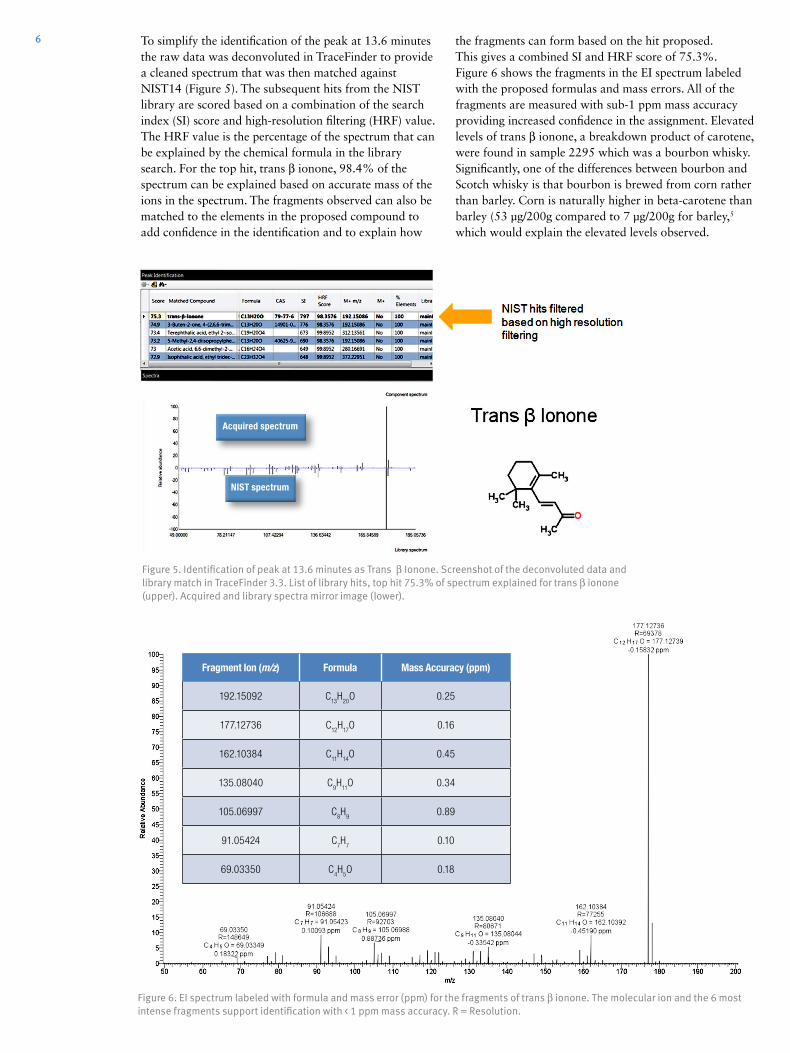
6 the fragments can form based on the hit proposed. This gives a combined SI and HRF score of 75.3%. Figure 6 shows the fragments in the EI spectrum labeled with the proposed formulas and mass errors. All of the fragments are measured with sub-1 ppm mass accuracy providing increased confidence in the assignment. Elevated levels of trans β ionone, a breakdown product of carotene, were found in sample 2295 which was a bourbon whisky. Significantly, one of the differences between bourbon and Scotch whisky is that bourbon is brewed from corn rather than barley. Corn is naturally higher in beta-carotene than barley (53 µg/200g compared to 7 µg/200g for barley,5
which would explain the elevated levels observed.
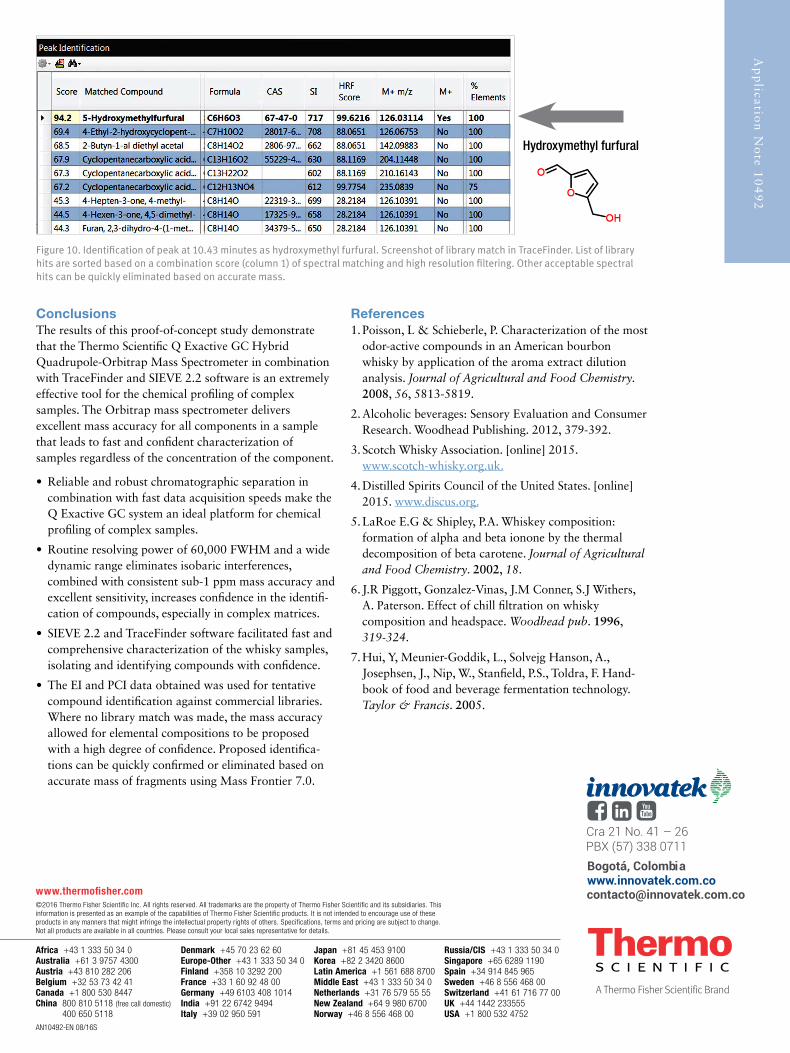
To simplify the identification of the peak at 13.6 minutes the raw data was deconvoluted in TraceFinder to provide a cleaned spectrum that was then matched against NIST14 (Figure 5). The subsequent hits from the NIST library are scored based on a combination of the search index (SI) score and high-resolution filtering (HRF) value. The HRF value is the percentage of the spectrum that can be explained by the chemical formula in the library search. For the top hit, trans β ionone, 98.4% of the spectrum can be explained based on accurate mass of the ions in the spectrum. The fragments observed can also be matched to the elements in the proposed compound to add confidence in the identification and to explain how
Figure 6. EI spectrum labeled with formula and mass error (ppm) for the fragments of trans β ionone. The molecular ion and the 6 most intense fragments support identification with < 1 ppm mass accuracy. R = Resolution.
Acquired spectrum
NIST spectrum
Fragment Ion (m/z) Formula Mass Accuracy (ppm)
192.15092 C13
H20
O 0.25
177.12736 C12
H17
O 0.16
162.10384 C11
H14
O 0.45
135.08040 C9H
11O 0.34
105.06997 C8H
90.89
91.05424 C7H
70.10
69.03350 C4H
5O 0.18
Figure 5. Identification of peak at 13.6 minutes as Trans β Ionone. Screenshot of the deconvoluted data and library match in TraceFinder 3.3. List of library hits, top hit 75.3% of spectrum explained for trans β ionone (upper). Acquired and library spectra mirror image (lower).
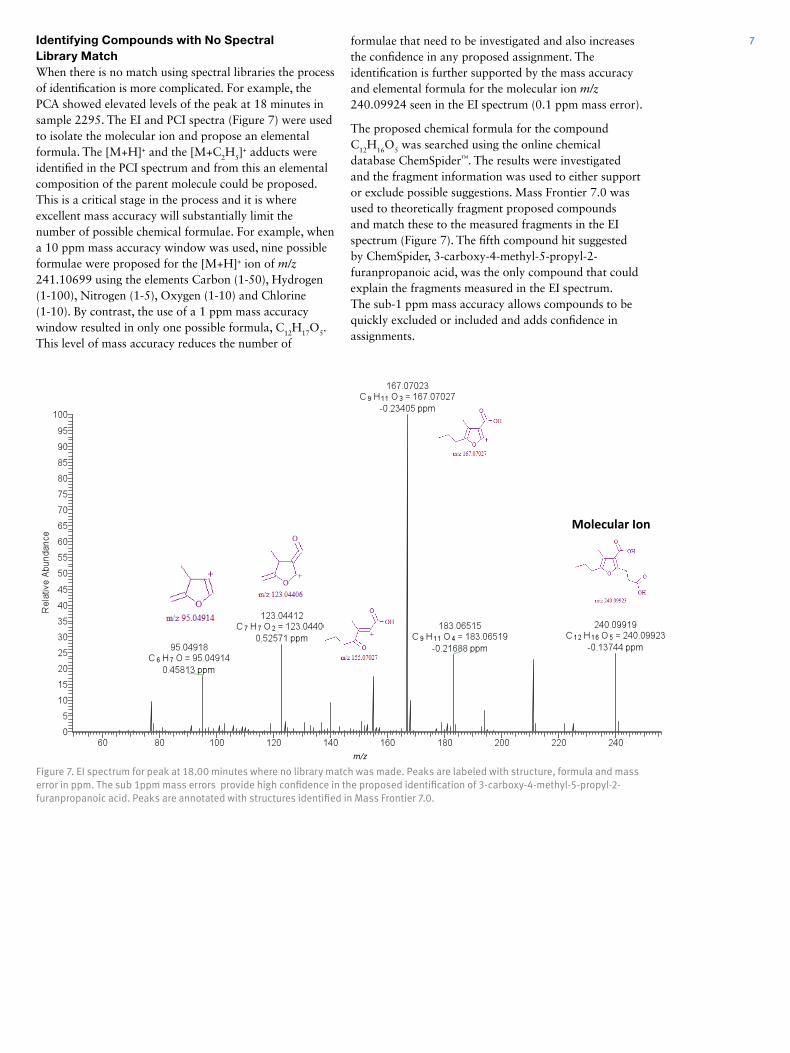
7Identifying Compounds with No Spectral Library MatchWhen there is no match using spectral libraries the process of identification is more complicated. For example, the PCA showed elevated levels of the peak at 18 minutes in sample 2295. The EI and PCI spectra (Figure 7) were used to isolate the molecular ion and propose an elemental formula. The [M+H]+ and the [M+C2H5]
+ adducts were identified in the PCI spectrum and from this an elemental composition of the parent molecule could be proposed. This is a critical stage in the process and it is where excellent mass accuracy will substantially limit the number of possible chemical formulae. For example, when a 10 ppm mass accuracy window was used, nine possible formulae were proposed for the [M+H]+ ion of m/z 241.10699 using the elements Carbon (1-50), Hydrogen (1-100), Nitrogen (1-5), Oxygen (1-10) and Chlorine (1-10). By contrast, the use of a 1 ppm mass accuracy window resulted in only one possible formula, C12H17O5. This level of mass accuracy reduces the number of
formulae that need to be investigated and also increases the confidence in any proposed assignment. The identification is further supported by the mass accuracy and elemental formula for the molecular ion m/z 240.09924 seen in the EI spectrum (0.1 ppm mass error).
The proposed chemical formula for the compound C12H16O5 was searched using the online chemical database ChemSpider™. The results were investigated and the fragment information was used to either support or exclude possible suggestions. Mass Frontier 7.0 was used to theoretically fragment proposed compounds and match these to the measured fragments in the EI spectrum (Figure 7). The fifth compound hit suggested by ChemSpider, 3-carboxy-4-methyl-5-propyl-2-furanpropanoic acid, was the only compound that could explain the fragments measured in the EI spectrum. The sub-1 ppm mass accuracy allows compounds to be quickly excluded or included and adds confidence in assignments.
Molecular Ion
m/z
Figure 7. EI spectrum for peak at 18.00 minutes where no library match was made. Peaks are labeled with structure, formula and mass error in ppm. The sub 1ppm mass errors provide high confidence in the proposed identification of 3-carboxy-4-methyl-5-propyl-2-furanpropanoic acid. Peaks are annotated with structures identified in Mass Frontier 7.0.
8
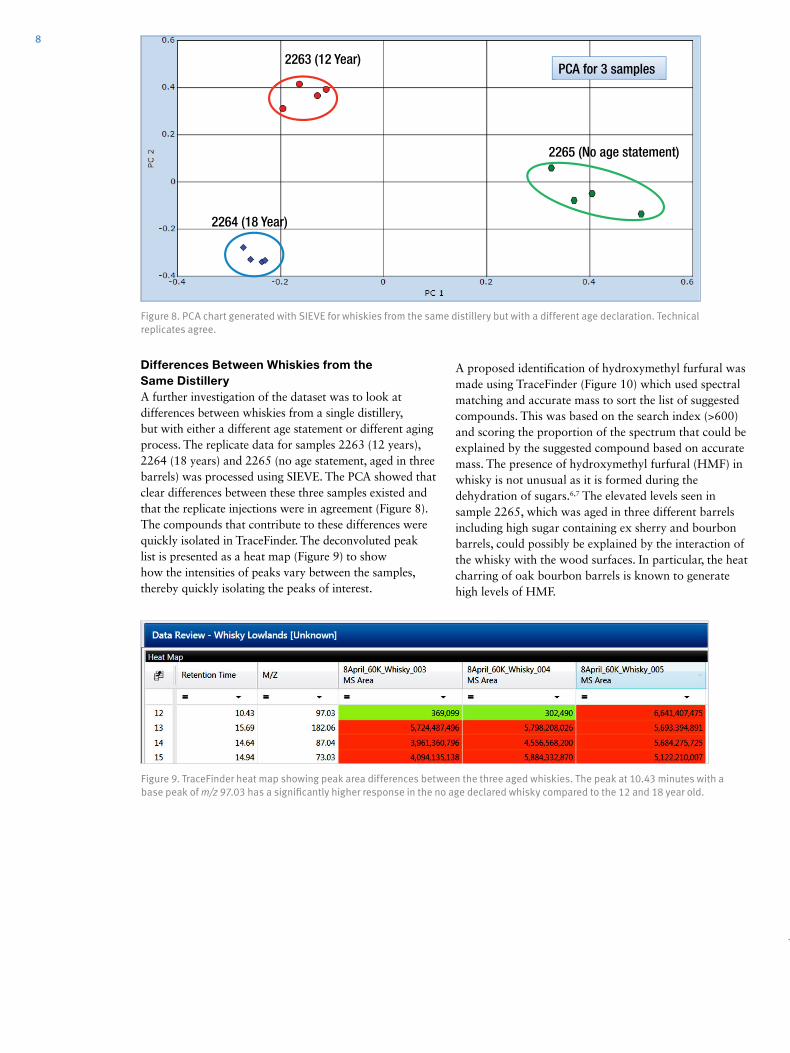
A proposed identification of hydroxymethyl furfural was made using TraceFinder (Figure 10) which used spectral matching and accurate mass to sort the list of suggested compounds. This was based on the search index (>600) and scoring the proportion of the spectrum that could be explained by the suggested compound based on accurate mass. The presence of hydroxymethyl furfural (HMF) in whisky is not unusual as it is formed during the dehydration of sugars.6,7 The elevated levels seen in sample 2265, which was aged in three different barrels including high sugar containing ex sherry and bourbon barrels, could possibly be explained by the interaction of the whisky with the wood surfaces. In particular, the heat charring of oak bourbon barrels is known to generate high levels of HMF.
Differences Between Whiskies from the Same DistilleryA further investigation of the dataset was to look at differences between whiskies from a single distillery, but with either a different age statement or different aging process. The replicate data for samples 2263 (12 years), 2264 (18 years) and 2265 (no age statement, aged in three barrels) was processed using SIEVE. The PCA showed that clear differences between these three samples existed and that the replicate injections were in agreement (Figure 8). The compounds that contribute to these differences were quickly isolated in TraceFinder. The deconvoluted peak list is presented as a heat map (Figure 9) to show how the intensities of peaks vary between the samples, thereby quickly isolating the peaks of interest.
Figure 9. TraceFinder heat map showing peak area differences between the three aged whiskies. The peak at 10.43 minutes with a base peak of m/z 97.03 has a significantly higher response in the no age declared whisky compared to the 12 and 18 year old.
2263 (12 Year)
2264 (18 Year)
2265 (No age statement)
PCA for 3 samples
Figure 8. PCA chart generated with SIEVE for whiskies from the same distillery but with a different age declaration. Technical replicates agree.