2 2018 · Investec integrated annual report 2018 1 Volume 1 Volume 2 Volume 3 Strategic report...
252
2018 Annual Report Investec strategic report incorporating governance, corporate responsibility and the renumeration report Volume 1
Transcript of 2 2018 · Investec integrated annual report 2018 1 Volume 1 Volume 2 Volume 3 Strategic report...

AInvestec integrated annual report 2018
Overview
of the year
(continued)
Presentation of financial information
2018
AR
| 2018
Investec strategic report incorporating governance, corporate responsibility and the renum
eration report
V.1
Specialist Banking | Asset Management | Wealth & Investment
Annual ReportInvestec strategic report
incorporating governance, corporate responsibility and
the renumeration reportVolume 1


1Investec integrated annual report 2018
Volume 1 Volume 2 Volume 3Strategic report incorporating governance, corporate responsibility and remuneration report
Risk disclosures Annual financial statements
The 2018 integrated annual report covers the period 1 April 2017 to 31 March 2018 and provides an overview of the Investec group.
This report covers all our operations across the various geographies in which we operate and has been structured to provide stakeholders with relevant financial and non‑financial information.

2 Investec integrated annual report 2018
We value feedback and invite questions and comments on our reporting. To give feedback or request hard copies of our reports, please contact our Investor Relations division.
Ongoing and statutory informationStatutory information is set out in volume three. In order to present a more meaningful view of the group’s performance, additional management information is presented on our ongoing businesses. This additional information excludes items that in management’s view could distort the comparison of performance between periods (for both current and historical information). This information is only set out in volume one of our integrated annual report.
Based on this principle, the following items have been excluded from underlying statutory profit (for both current and historical information where applicable) to derive ongoing operating profit:
• The results of the businesses sold in the 2015 financial year i.e. Investec Bank (Australia) Limited, Kensington Group plc and Start Mortgage Holdings Limited. These sales had a significant effect on the comparability of the group’s financial position and results
• The remaining legacy business (as set out on page 85).
This basis of presentation is consistent with the approach adopted for the year ended 31 March 2017.
A reconciliation between the statutory and ongoing income statement is provided on pages 73 and 74. All information in our annual report is based on our statutory accounts unless otherwise indicated.
Feedback
1 42 3 5
Audited information
Denotes information in the risk and remuneration reports that forms part of the group’s audited annual financial statements
Page references
Refers readers to information elsewhere in this report
Website
Indicates that additional information is available on our website: www.investec.com
Corporate responsibility
Refers readers to further information in our corporate responsibility report available on our website: www.investec.com
Reporting standard
Denotes our consideration of a reporting standard
Cross reference tools
For queries regarding information in this document
Investor RelationsTelephone (27) 11 286 7070 (44) 20 7597 5546
e-mail: [email protected]
Investor Relationswww.investec.com/en_za/welcome-to-investec/about-us/investor-relations.html
3Investec integrated annual report 2018
Contents
Overview of the yearOperational and strategic report 5
Highlights 9
About the Investec group 18
Our strategic focus 20
Our operational structure 23
Our operational footprint 24
Financial review 28
Divisional review
Group divisional structure 87
Asset Management 88
Wealth & Investment 95
Specialist Banking 102
Corporate governance and corporate responsibility
Corporate governance 116
Shareholder analysis 166
Corporate responsibility 171
Remuneration report
Remuneration report 185
Definitions 245
Corporate information 246

Overviewof the year

5Investec integrated annual report 2018
Overview
of the year
Operational and strategic report
Overview of financial performanceThe group achieved an increase in statutory operating profit of 1.4% to £607.5 million (2017: £599.1 million), a decrease of 3.5% on a currency neutral basis. Adjusted EPS increased 10.1% from 48.3 pence to 53.2 pence, a 4.1% increase on a currency neutral basis. Distributions to shareholders increased to 24.0 pence (2017: 23.0 pence) resulting in a dividend cover of 2.2 times (2017: 2.1 times).
The total legacy portfolio reduced from £476 million to £313 million through asset sales, redemptions and write-offs. This resulted in a loss before taxation on the legacy business of £93.5 million (2017: £64.6 million) with impairments on the legacy portfolio increasing from £54.3 million to £84.7 million reflecting an increase in impairments for accelerated exits anticipated to occur on certain legacy assets.
The ongoing business delivered a satisfactory performance with operating profit up 5.6% to £701.0 million (2017: £663.7 million). This is a 1.2% increase on a currency neutral basis.
Our geographic mix and diversity of revenue streams continued to support the sound balance of earnings generated between capital light businesses and capital intensive businesses. The group’s asset and wealth management businesses have generated substantial net inflows of £7.3 billion which, together with favourable market levels, supported higher average funds under management. Third party
assets under management increased 6.5% to £160.6 billion (31 March 2017: £150.7 billion), an increase of 6.2% on a currency neutral basis.
The banking businesses benefited from sound levels of corporate and private client activity driving strong loan book growth over the year. Customer accounts (deposits) increased 6.5% to £31.0 billion (31 March 2017: £29.1 billion), an increase of 5.9% on a currency neutral basis. Core loans and advances (excluding the legacy portfolio) increased 11.6% to £24.8 billion (31 March 2017: £22.2 billion), an increase of 11.0% on a currency neutral basis.
This supported growth in total ongoing operating income before impairment losses of 6.9% to £2 442.8 million (2017: £2 285.9 million) with the percentage of annuity income increasing to 76.3% of total operating income (2017: 72.0%). The ongoing cost to income ratio increased to 66.5% (2017: 65.8%) with total operating costs growing by 8.0% to £1 623.2 million (2017: £1 502.6 million) due to planned investment spend across the business.
Operating environmentWhile the global economy strengthened during the past year, Investec’s two core geographies experienced persistent economic uncertainty. In the UK, economic growth slowed as indecision around Brexit continued to impact corporate and consumer confidence. Inflation rose sharply, squeezing household spending power, and the country experienced its first hike in the bank rate in over a decade.
In the past year, sound growth in the
core earnings drivers for our three business
areas and solid client activity levels
supported underlying performance.
The group has continued to make
strategic investments to ensure it remains
competitive and relevant in the markets
in which it operates.
The progress made in achieving our strategic priorities, and the successful transitioning of leadership, gives us confidence in our strategy to invest for the long term.

6 Investec integrated annual report 2018
Overview
of the year
(continued)
Operational and strategic report
Total funds under management increased to £56.0 billion (31 March 2017: £54.8 billion). Operating margin was slightly down from 25.9% to 24.3% as the business continued to invest in digital platforms, IT infrastructure and compliance.
The operating profit for the South African business declined 2.1% in Rands with the increase in annuity fees earned offset by lower brokerage volumes. Progress continued to be made in attracting discretionary net inflows which amounted to R5.0 billion in the current year.
The UK and Other business experienced a 6.3% increase in operating profit with solid net inflows of £1.8 billion. The launch of Investec Click & Invest, a digital discretionary investment management service, was well received by the market and was ranked first place in an independent survey of the digital portfolio management market.
Despite continued market uncertainty, management remain comfortable with their strategy of investing for long-term sustainability focusing on providing a global investment offering and maintaining the highest standards of client service.
Specialist BankingThe ongoing business of Specialist Banking increased operating profit by 4.3% to £474.0 million (2017: £454.4 million).
The UK and Other businesses reported a 9.3% decrease in operating profit. Strong growth in net interest income was supported by loan book growth of 15.1% to £9.4 billion (31 March 2017: £8.1 billion) and a reduction in the cost of funding. This was offset by a decrease in non-interest revenue following particularly strong investment banking and client flow trading activity levels in the prior year. In line with the business’s current investment strategy to support franchise growth, IT infrastructure costs and headcount increased, notably for the continued build out of the private client banking offering. We will continue to focus on our strategy to be a high-tech and high-touch specialist bank. Expansion of our client offering through enhanced digital initiatives remains key, as does increasing our capital light activities. Having accelerated our strategy to run down the legacy portfolio, we expect this business to continue generating a sustainable level of recurring income as it focuses on deepening the franchise and expanding the growth-orientated client base.
The South African business reported an increase in operating profit in Rands of 6.9% supported by sound corporate and
private client activity levels as well as an increase in associate earnings from the IEP Group. This was partially offset by lower investment income. Core loans and advances increased 8.7% to R256.7 billion (31 March 2017: R236.2 billion) reflecting the consistent strategy to penetrate the existing client base and grow market share. The launch of Investec Life was particularly successful with over R1 billion in cover written in the first six months of the launch. We received recognition from a number of international awards and rankings, including top Private Banking group overall for South Africa for the sixth consecutive year by UK finance magazine’s Euromoney. The focus for the next year remains centred on client penetration, managing capital and liquidity, investing in digitalisation and the expansion of Investec for Business which is designed to deliver an integrated service offering to mid-market corporates.
Review of risksDespite the prevailing macro-economic conditions, the group was able to maintain sound asset performance and risk metrics throughout the year in review. Growth in the core loan book was diversified across select target markets with loan to values at conservative levels and asset margins broadly in line with the prior year. Our risk appetite continues to favour lower risk, income-based lending, with exposures well collateralised and credit risk taken over a short to medium term. The ongoing credit loss ratio remains at the lower end of our long-term average trend of 30bps to 40bps in both South Africa and the UK. We continue to stress our loan books against a number of macro-economic scenarios, and manage these risks accordingly. We are closely monitoring political developments with respect to Brexit and are equipped to adapt to a rapidly changing environment.
We continue to maintain appropriate capital and leverage ratios and ensure we have a high level of readily available, quality liquid assets. The group has always held capital comfortably in excess of regulatory requirements and all our banking subsidiaries meet current internal targets for total capital adequacy with leverage ratios remaining above our 6% minimum target. Cash and near cash balances remain strong and we exceed the Liquidity Coverage Ratio and Net Stable Funding Ratio requirements in both the UK and South Africa. We have continued to benefit from a reduction in our cost of funding in the UK, whilst net interest margins remained stable in South Africa.
The UK’s departure from the European Union remains one of the biggest uncertainties to the UK outlook although negotiations are progressing in line with the scheduled timetable.
Economic growth in South Africa remained subdued as a result of the poor macro environment and heightened political and policy uncertainties. This was worsened by successive downgrades by the three largest credit rating agencies, subdued demand for credit and low business and consumer confidence. Despite local sentiment, South Africa emerged from a technical recession in the second quarter and the country experienced its first interest rate cut since 2012. The transition to new leadership under President Cyril Ramaphosa has restored some confidence. We are encouraged to see that investment and economic growth are clear priorities on the national agenda which should support client activity for our businesses going forward.
Business performanceThere was a consistent contribution from all business activities during the period under review with Asset Management and Wealth & Investment contributing a combined 36.9% (2017: 36.2%) to group operating profit on an ongoing basis (excluding group costs).
Asset ManagementOperating profit in Asset Management increased by 8.0% to £178.0 million (2017: £164.8 million) benefiting from higher average funds under management driven by favourable market and currency movements and strong net inflows of £5.4 billion. Lower performance fees in South Africa negatively affected earnings. Total funds under management increased to £103.9 billion (31 March 2017: £95.3 billion).
It was pleasing to note that net flows were positive across all regions, largely driven by inflows from the Americas and Asia-Pacific regions supporting the business’s consistent strategic focus in those areas. While fundamental challenges to the industry persist, momentum remains positive and management are confident in their strategy to build a long-term intergenerational business.
Wealth & InvestmentWealth & Investment experienced an increase in operating profit of 5.7% to £98.6 million (2017: £93.2 million). The business benefited from higher average funds under management supported by higher equity market levels over the year and solid net inflows of £2.0 billion.

7Investec integrated annual report 2018
Overview
of the year
(continued)
Operational and strategic report
During the year, we continued to enhance our ratings systems and risk quantification models in preparation for the group’s implementation of IFRS 9 and the move to the Foundation Internal Ratings-Based (FIRB) approach to capital in South Africa. IFRS 9 has had a moderate impact on our capital ratios.
Meeting regulatory obligations and ensuring the safety of our clients’ wealth are key priorities for the group. We therefore continue to spend much time and effort managing our operational, reputational, conduct, recovery and resolution risks. Financial crime and cyber crime remain high priorities and we are continually strengthening our systems and controls in order to manage cyber risk, combat money laundering and prevent bribery and corruption. State capture in South Africa and the increase in corporate and audit scandals in South Africa and around the world has heightened the awareness around who we deal with and the process to ‘on-board’ clients. A significant amount of time and resources have been spent on training in this regard.
Board focus areasDuring the year, the board continued to engage with various stakeholders on a number of issues. These included strategy and corporate performance, executive succession, executive remuneration, governance and board composition.
Succession of the group’s long-serving executive management has been an ongoing focus area for the board for the past few years as part of the group’s orderly succession plan to move from founding members to the next generation of leadership. As chief executive officer and managing director, respectively, Stephen Koseff and Bernard Kantor will step down from their roles on 1 October 2018 and will continue to serve as executive directors until 31 March 2019 to provide support and advice to the incoming executive. Thereafter, they will continue to be available to staff and leadership as non-executive directors. The role of CEO will be jointly assumed by Fani Titi, who has been the chairman of the group since November 2011, and Hendrik du Toit, the founding chief executive officer of Investec Asset Management. Perry Crosthwaite, the group’s former senior independent non-executive director, became the chairman of the group on 15 May 2018. In addition, Glynn Burger, the group risk and finance director, will retire on 31 March 2019 but will remain available and willing to assist the new management team. Ciaran Whelan, who has held various senior
positions globally with the group over the past 30 years, will assume the role of group risk director while Kim McFarland, who has been with Investec Asset Management since December 1993, will take over as group finance and operations director from 1 April 2019.
Further changes to the board include Peter Thomas stepping down from the group board at the annual general meeting in August 2017. We thank Peter for his extraordinary dedication to the group since joining the board of Investec in 1981. At the same time, we welcomed to the board Philip Hourquebie who was appointed as a non-executive director. Philip brings a wealth of expertise in his longstanding position as the regional managing partner of EY Inc for Africa and more recently, Central and South East Europe.
In considering the composition of the board, we are mindful of a number of aspects including skills experience, knowledge, race and gender. We are focused on maintaining the necessary banking experience, appropriate regional balance between South African and non-South African board members and reaching our gender diversity target of 30% females on the board. The board has also played an integral role in encouraging and participating in diversity initiatives across all our operations.
One of the key topics of discussion with stakeholders over the past year was that of remuneration. We maintain our philosophy that, in order to employ and retain the highest calibre individuals, we need to reward them with industry competitive packages and long-term share incentives. It is also important to ensure there is clear alignment between remuneration and delivery of strategic priorities. The group is submitting a revised remuneration policy for approval by shareholders at the annual general meeting on 8 August 2018 and various issues raised by stakeholders have been incorporated into this policy. Where appropriate, we will be reducing the quantum of remuneration as well as simplifying the structure to ensure stronger alignment to strategy with relevant performance targets and measurements in place for monitoring.
Further to this, the group published its first gender pay gap report as required by legislation in the UK. We are comfortable that the group pays men and women equally for the same roles and that we have the appropriate practices in place to ensure fairness. Our gender pay gap occurs primarily because there is a lower proportion of women in senior leadership
and revenue-generating roles. We are dedicated to improving our position in line with our commitment to promoting diversity.
In addition to the regular agenda items discussed, the board has focused on a number of new regulations, policies and practices including IFRS 9, Markets in Financial Instrument Directive (MiFid) II, General Data Protection Regulation (GDPR), King IV and the Advanced Internal Ratings Based (AIRB) and FIRB approach to capital.
In light of prevailing market conditions, the board continued to assess the appropriateness of the business strategy of the group, in particular the strategy of the UK Specialist Bank, and we are comfortable with the progress made. As we start the new financial year, we are confident in our leadership to deliver on the group’s strategic priorities. The focus of the board remains on ensuring stability within the group and we believe the board has the appropriate balance of skills and expertise to ensure that the group is well governed, and that the interests of all stakeholders are well served.
Living in societyInvestec has a deeply-rooted tradition of active corporate citizenship and we are mindful of our responsibility to live in society and not off it. As a distinctive financial institution with specialist skills in lending and investing, Investec plays a critical role in funding a stable and sustainable economy that contributes to the upliftment of communities and is cognisant of the world’s limited natural resources.
Caring for our people is at the heart of Investec’s approach to corporate responsibility. We provide staff with a safe, healthy and stimulating work environment to ensure they are motivated and equipped to deliver exceptional service for our clients. As part of the move to our new London head office at 30 Gresham Street, we are providing staff with a learning environment that encourages collaboration and knowledge sharing among colleagues and business areas. We also invest in learning opportunities for our staff and, in the past year, we spent £22.5 million (2017: £22.9 million) on the learning and development of our people with the group learning and development spend at 1.9% of staff costs. This exceeds our target of a minimum of 1.5% for the group. We were pleased to be recognised as the second most attractive employer in South Africa by professionals and fourth by university students in the 2017 Universum Most Attractive Employer Awards.

8 Investec integrated annual report 2018
Overview
of the year
(continued)
Operational and strategic report
Our approach to corporate social investment (CSI) is to provide our beneficiaries with a ‘hand up’ instead of a ‘hand-out’. We believe this promotes lifelong skills that will transform their lives and, in turn, enable them to help others around them. In the UK, our flagship programme, the Beyond Business social enterprise incubator which we run in partnership with the Bromley by Bow Centre, won several awards recognising the community impact of this partnership. In South Africa, our flagship Promaths programme contributed to 4.8% and 5.0% of the country’s total mathematics and science distinctions respectively in the 2017 academic year. Since inception 12 years ago, Investec has funded over 7 000 previously disadvantaged learners through the programme with 84% having completed, or in the process of completing, tertiary education. This will go a long way towards helping us achieve our aim of creating economic participants who can contribute towards building and growing the economy of the country.
We remain committed to transformation in South Africa and fund a number of initiatives to create a more equitable society. Investec has been intimately involved in the CEO Initiative to, among other things, formulate the Youth Employment Service (YES) programme to address the unemployment issue among young people. At the launch of the programme by President Cyril Ramaphosa towards the end of March 2018, Investec committed to finding employment for approximately 1 200 youth annually for the next three years. We see this as an important investment in the transformation of our country and the future of the group.
Our sustainability efforts continue to be recognised, with Investec Limited now ranked as one of four industry leaders on the Dow Jones Sustainability Investment (DJSI) Emerging Markets index, and Investec plc one of 15 industry leaders on
the DJSI World index and one of nine in the DJSI Europe index. We were also included as a leader in the RobecoSam Sustainability Yearbook 2018, which recognises the world’s most sustainable companies, for moving the needle in ways that will help realise the United Nation’s Sustainable Development Goals (SDGs).
In this regard, we have seen increased interest in the role that the private sector can play in advancing the SDGs and Investec has committed to participate and collaborate with clients, investors and public stakeholders to support delivery of the SDGs. Through our various activities, the group contributes to a number of SDG targets and we have included the impacts, where relevant, throughout this report. One of the greatest environmental impacts we can have is to support the transition to a clean and energy-efficient global economy. Investec Power and Infrastructure has financed eight projects globally in the past year with an installed capacity of approximately 1 450MW of clean energy. Overall, clean energy comprises 88% of our total energy portfolio consisting of biomass, wind, waste, solar and hydro projects. This is the most meaningful way we can contribute to climate change and reduce the impact of our existence on the natural environment.
Strategy and outlookThe complexities of Brexit continue to cause uncertainty in the UK economy. While growth in South Africa was down in the first quarter of 2018 relative to the final quarter of 2017, the rest of the year should be positive due to a mix of investor confidence and a rebound in consumer spending. We will continue to focus on the growth levers available to improve our returns, including growing our client base and core revenue drivers, leveraging off our investment into the business, managing our liquidity and optimising our capital structure.
On behalf of the boards of Investec plc and Investec Limited.
Fani Titi Perry Crosthwaite Stephen Koseff Bernard KantorFormer chairman Chairman Chief executive officer Managing director
(References to ‘operating profit’ in the text above relates to operating profit before taxation, goodwill, acquired intangibles, non-operating items and after other non-controlling interests.)
The operating financial review provides an overview of our strategic position, performance during the financial year and outlook for the business. It should be read together with the sections that follow on pages 9 to 245 as well as volume two of our integrated annual report, which elaborate on the aspects highlighted in this review.
Looking forward, we believe that our strategic priorities, together with the diversity of our business model that has been built over many years, will ensure the group is favourably positioned to grow in core markets, supporting future growth and delivering value to all our stakeholders.
Closing remarks from Stephen and BernardWe have spent almost 40 years building a quality business that, in 1981, had less than £1 million of capital, and today has over £5.4 billion of capital. Our aim was to build a sustainable business, one that has been able to survive and thrive through all conditions, growing earnings from £0.16 million in 1981 to £491 million at the end of the 2018 financial year. We have had a client-focused approach, recognising the value in building committed long-term relationships and working with clients to build their wealth and, at the same time, creating value for shareholders.
This was only possible because of the many incredibly talented and entrepreneurial people who have worked with us through all these decades. People who work at Investec are generally characterised by an enduring enthusiasm, tenacity and desire to challenge the status quo in their efforts to meet clients’ expectations. It is this strongly embedded culture of uncompromising integrity in the pursuit of extraordinary performance that is ingrained in our DNA and will ensure that the Investec of today continues long after our departure.
Lastly, we leave a business that has a conscience and is conscious, not only of our duty to clients and shareholders, but also to the individuals within the business and the broader communities we serve. We are therefore proud and happy to hand over a solid, sustainable and caring organisation to the next generation of leaders, knowing that they are well-equipped to take the group from strength to strength.

9Investec integrated annual report 2018
Overview
of the year
Highlights
• The legacy portfolio reduced from £476 million at 31 March 2017 to £313 million through asset sales, redemptions and write-offs.
• The legacy business reported a loss before taxation of £93.5 million (2017: £64.6 million) reflecting an increase in impairments for accelerated exits anticipated to occur on certain legacy assets.
Solid client activity levels supporting underlying performance.
* Before goodwill, acquired intangibles, non-operating items, taxation and after other non-controlling interests.^ Before goodwill, acquired intangibles, non-operating items and after non-controlling interests and deduction of preference dividends.
Statutory financial performance
2017
£599.1mnOperating profit* increased 1.4% (decrease of 3.5% on a currency neutral basis)
2018
£607.5mn
2017
£434.5mnAdjusted attributable earnings^ increased 13.0% (increase of 6.9% on a currency neutral basis)
2018
£491.1mn
2017
48.3pAdjusted earnings per share^ increased 10.1% (increase of 4.1% on a currency neutral basis)
2018
53.2p 2017
23.0pDividends per share increased 4.3%
2018
24.0p
• The group’s asset and wealth management businesses have generated substantial net inflows of £7.3 billion, which together with favourable market levels has supported higher average funds under management.
• The banking businesses have benefited from sound levels of corporate and private client activity driving strong loan book growth over the year.
• The group has continued to invest into the business, positioning itself for further growth across its client franchise businesses and ensuring that it remains
competitive and relevant in the markets in which it operates.
• Impairments on the legacy portfolio have increased in anticipation of accelerated exits of certain assets in line with the group’s strategy of managing down this portfolio.
• Taking into account the abovementioned factors, the group has achieved satisfactory operating performance against a challenging backdrop in its two core geographies (refer to pages 34 to 39 for an economic overview of our operating environments), underpinned by sound growth in key earnings drivers and a solid recurring income base.
We continued to actively manage down the
UK legacy portfolio

10 Investec integrated annual report 2018
Overview
of the year
(continued)
Highlights(continued)
* Before goodwill, acquired intangibles, non-operating items, taxation and after other non-controlling interests.
^ Before goodwill, acquired intangibles, non-operating items and after non-controlling interests and deduction of preference dividends.
** Trends in these graphs are shown on a currency neutral basis using the closing Rand: Pound Sterling exchange rate applicable at 31 March 2018.
We have a diversified business model
We continued to grow our key earnings drivers
Funds under management increased 6.5% to £160.6 billion – an increase of 6.2% on a currency neutral basis
% contribution of operating pro�t* before taxation of the ongoing business
Specialist BankingWealth & InvestmentAsset Management
UK and OtherSouthern Africa
Percentage Percentage^^
1512 13 14 1716
0
20
40
60
80
100
0
20
40
60
80
100
1512 13 14 171618 18
£’billion
Wealth & Investment OtherAsset Management
1512 13 14 16 17
0
50
100
150
200
Funds under management**
18
£’billion Percentage
Customer accounts Core loans and advances to customers Loans and advances to customer deposits
0
5
10
15
20
25
30
35
0
20
40
60
80
100
120
151312 14 1716
Customer accounts (deposits) and loans ongoing business**
18
Satisfactory performance from the ongoing business
Customer accounts (deposits) increased 6.5% to £31.0 billion – an increase of 5.9% on a currency neutral basis
Core loans and advances increased 11.6% to £24.8 billion – an increase of 11.0% on a currency neutral basis
2017
£663.7mn2018
£701.0mn
Operating profit* increased 5.6% (increase of 1.2% on a currency neutral basis)
2017
£487.1mn2018
£566.2mn
Adjusted attributable earnings^ increased 16.2% (increase of 10.8% on a currency neutral basis)
2017
54.1p2018
61.3p
Adjusted earnings per share^ increased 13.3% (increase of 8.1% on a currency neutral basis)
2017
72.0%2018
76.3%
Annuity income as a % of total operating income
2017
0.29%2018
0.26%
Credit loss charge as a % of average gross core loans and advances
^^ Excluding group costs.

11Investec integrated annual report 2018
Overview
of the year
(continued)
Highlights
Operating costs increased reflecting: continued investment into IT and digital initiatives and higher headcount across divisions to support increased activity and growth strategies, notably the build out of the UK private client offerings. Cost growth in South Africa was somewhat offset by the pending acquisition of the South African head office building and the related provision no longer required.
Supporting growth in operating income
Costs increased largely due to planned investment across the business
Increase in impairments largely driven by accelerated exits anticipated in the legacy portfolio
£’million
0
500
1 000
1 500
2 000
2 500
Operating income
Operating costs
1513 14 18171612
Jaws ratio for the group ongoing business^
Number
0
2 000
4 000
6 000
8 000
10 000
Asset Management
Wealth & Investment
Specialist Banking
1512 13 14 1716
Headcount^^
18
* The trend for this line is shown on a currency neutral basis using the average Rand: Pound Sterling exchange rate applicable at 31 March 2018.
^ Trends in this graph are shown on a currency neutral basis using the average Rand: Pound Sterling exchange rate applicable at 31 March 2018.
** Refers to the remaining UK legacy business as well as group assets that were sold in the 2015 financial year.
^^ Permanent headcount and includes acquisitions.
£’million
0
100
200
300
400
UK legacy business and businesses sold**
Southern Africa
UK and other ongoing business
151312 14 1716
Impairments
18
£’million
Trading incomeInvestment and associate incomeOther fees and other operating income
Annuity fees and commissionsNet interest incomeTotal operating income on a currency neutral basis*
1512 13 14 1716 18
Total operating income ongoing business
0
500
1 000
1 500
2 000
2 500

12 Investec integrated annual report 2018
Overview
of the year
(continued)
Highlights
Resulting in a satisfactory performance from our ongoing business
Progress made on our financial targets
Ongoing Statutory
Target March 2018 March 2017 March 2018 March 2017
ROE (post-tax) 12% – 16% over a rolling five-year period 14.1% 14.2% 12.1% 12.5%
Adjusted^ EPS growth Target: 10% > UKPRI 13.3% 11.3% 10.1% 16.9%
Cost to income Target: < 65% 66.5% 65.8% 66.9% 66.3%
Dividend cover (times) Target: 1.7x – 3.5x n/a n/a 2.2x 2.1x
* Before goodwill, acquired intangibles, non-operating items, taxation and after other non-controlling interests.^ Before goodwill, acquired intangibles, non-operating items and after non-controlling interests and deduction of preference dividends.
£’million
0
20
40
60
80
100
120
140
160
180 178.0
1512 13 14 1716
Operating pro�t* – Asset Management
18
£’million
0
20
40
60
80
100
1512 13 14 1716
Operating pro�t* – Wealth & Investment
98.6
18
£’million
050
100150200250300350400450500
1512 13 14 1716
Operating pro�t* – Specialist Banking ongoing business
474.0
18

13Investec integrated annual report 2018
Overview
of the year
(continued)
Highlights
Note: Refer to page 65 for detailed definitions and explanations.
Percentage
Investec Bank Limited
Investec Limited
Investec Bank plc
Investec plc
0
3
6
9
12
15
18
As reported
15.514.6
16.615.4
10.9 10.211.9
10.9 10.211.9
11.0 11.0
Percentage
Investec Bank Limited
Investec Limited
Investec Bank plc
Investec plc
0
4
8
12
16
As reported
11.2 11.0
13.4 12.9
Percentage
Investec Bank Limited
Investec Limited
Investec Bank plc
Investec plc
0
4
8
12
16
Fully loaded As reported
7.5 7.18.6
7.7 7.58.6 8.4 8.5
Percentage
Investec Bank Limited
Investec Limited
Investec Bank plc
Investec plc
0
4
8
12
16
Fully loaded As reported
Capital adequacy ratios Tier 1 ratios
Leverage ratios Common equity tier 1 ratios
TargetTotal capital adequacy: 14.0% – 17.0%Common equity tier 1 ratio: > 10.0% Tier 1 ratio: > 11.0% Leverage ratio: > 6.0%
Maintained a sound balance sheet
Continue to focus on:• Maintaining a high level of readily
available, high-quality liquid assets targeting a minimum cash to customer deposit ratio of 25.0%, with the year-end ratio at 41.4%
• Diversifying funding sources
• Maintaining an appropriate mix of term funding
• Limiting concentration risk.
The intimate involvement of senior management ensures stringent management of risk and liquidity.
A well-established liquidity management philosophy remains in place.
The group’s loan to deposit ratios are as follows:
• Investec Limited: 77.4% (2017: 75.0%)
• Investec plc: 83.2% (2017: 78.2%).
Liquidity remains strong with cash and near cash balances amounting to £12.8 billion (2017: £12.0 billion).
Capital remained in excess of current regulatory requirements.
We are comfortable with our common equity tier 1 ratio target at a 10% level given the group’s significant capital light revenues, and leverage ratios for Investec Limited and Investec plc of 7.5% and 8.5% respectively.
The banking entities exceed the minimum regulatory requirements for the liquidity coverage ratio and the net stable funding ratio.
Sound capital and liquidity principles maintained

14 Investec integrated annual report 2018
Overview
of the year
(continued)
Highlights
Value added statement
£’00031 March
201831 March
2017
Net income generatedInterest receivable 2 491 009 2 230 765Other income 1 607 007 1 525 789Interest payable (1 730 611) (1 550 870)Other operating expenditure and impairments on loans (467 982) (439 962)
1 899 423 1 765 722Distributed as follows: Employees 795 420 757 390Salaries, wages and other benefitsCommunities 7 167 7 054Spend on corporate social initiativesGovernment 550 610 522 984Corporation, deferred payroll and other taxesShareholders 261 435 242 440Dividends paid to ordinary shareholders 227 908 216 602Dividends paid to preference shareholders 33 527 25 838Retention for future expansion and growth 284 791 235 854Depreciation 28 804 25 006Retained income for the year 255 987 210 848
Total 1 899 423 1 765 722
Investec’s corporate responsibility encompasses three key areas of people, planet and profit, including our contribution to the six capitals and our commitment to the Sustainable Development Goals (SDGs).
For Investec, corporate responsibility is about building our businesses to ensure we have a positive impact on the economic and social progress of communities and on the environment, while growing and preserving clients’ and stakeholders’ wealth based on strong relationships of trust. This commitment to corporate responsibility means integrating social, ethical and environmental considerations into our day-to-day operations. A key element of this is solid corporate governance that ensures sustainable management with a long-term vision.
For further information download the corporate responsibility report available on our website.
Contributing to society, macro-economic stability and the environment.
Human capital
We depend on the experience and proficiency of our people to perform and deliver superior client services.
Purpose and priorities ImpactProviding a safe and healthy work environment that values physical as well as psychological well-being
In the UK, we are progressing towards a more agile environment with flexible work encouraged where appropriate72% of employees in South Africa participated in employee wellness initiatives
Investing in our people and growing talent and leadership
Learning and development spend as a % of staff costs is 1.9% for the group (target of >1.5% for the group)Learning and development spend of £22.5 million (2017: £22.9 million)21 CAs graduated from the CA programme in the past year and were retained in our business
Retaining and motivating staff through appropriate remuneration and rewards structures
Voluntary staff turnover rate in South Africa is 8.8% and 8.4% in the UK5% of Investec shares are held by staff (excluding directors’ holdings)
Respecting and upholding human rights by entrenching a value-driven culture through the organisation that is supported by strong ethics and integrity
Participant to the United Nations Global Compact and remain committed to the 10 principles
Promoting diversity and equality at all levels of the group
49% female employees 20% females on the board (target of at least 30%)Made good progress towards the target of 33% females on the board by 2020, per Hampton-Alexander Review
For information on our BEE transformation refer to page 177.
People

15Investec integrated annual report 2018
Overview
of the year
(continued)
Highlights
Intellectual capital
We use our specialist financial skills and expertise to provide efficient solutions for clients and have a robust risk management process in place.
Purpose and priorities Impact
Maintaining a diversified portfolio of businesses that supports performance through varying economic cycles
Consistent contribution to the group’s performance from asset and wealth management businesses of 36.9% of operating profit (2017: 36.2%) on an ongoing basis (excluding group costs)
Annuity income as a percentage of ongoing operating income is 76.3% (2017: 72.0%)
Leveraging our expertise in risk management to protect value
Ongoing credit loss ratio remains at lower end of its long-term average trend at 0.26% (2017: 0.29%)
Ensure solid and responsible lending and investing activities
Trained 195 frontline consultants on environmental, social and governance (ESG) practices in South Africa and the UK
Social and relationship
capital
We leverage key stakeholder relationships to enhance our impact on society and the macro‑economy.
Purpose and priorities Impact
Building deep durable relationships with our clients and creating new client relationships
Customer accounts (deposits) up 6.5% since 31 March 2017
Investing in our distinctive brand and providing a high level of service by being nimble, flexible and innovative
Voted South Africa’s eighth most valuable brand
Unselfishly contributing to society through our corporate social investment (CSI) programmes
1.2% CSI spend as a % of operating profit (2017: 1.2%) (target of >1% for the group)
CSI spend of £7.2 million (2017: £7.1 million)
Contributing to the transformation of the financial sector in South Africa
Investec will be rated under the revised Financial Sector Code for the first time in 2018
Committed to youth employment in South AfricaOne of the first signatories to Youth Employment Service (YES) programme
People recognition
• Voted second most attractive employer by professionals and fourth by students in South Africa in the 2017 Universum awards
• Investec CEO, Stephen Koseff won the Lifetime Achievement Award presented by the 2018 African Banker Awards
• Winner of the Business of the Year award by Business Charity Awards 2017 (for Beyond Business)
• Winner of the Community Impact Award 2017 for our flagship programme the Beyond Business social enterprise incubator we run in partnership with Bromley by Bow Centre
• Winner of the National CSR Awards 2017, in the individual Community (Legacy) category Project Award (for Beyond Business)
• Winner of the Community Partners award in the Lord Mayor’s Dragon Awards 2017
• Reaccredited winner (for Beyond Business) in the Responsible Business Awards 2017
• Received the Financial Innovation Awards 2017 – Innovation in Sustainability or Social Responsibility Awards for our Invest for Success programme run in partnership with Arrival Education

16 Investec integrated annual report 2018
Overview
of the year
(continued)
Planet
Natural capital
We support the transition to a low‑carbon economy and believe we can make a meaningful impact in addressing climate change. We consider any meaningful activity that either reduces the negative impact on, or prolongs the life of, our planet.
Purpose and priorities Impact
Funding and participating in renewable energy 88% of our energy lending portfolio relates to clean energy
Limiting our direct operational carbon impactCarbon emissions reduced by 6.1% (Refer to our corporate responsibility report on our website for emission reduction targets)
Protecting biodiversity through various conservation activities
51% increase in number of children reached through our Coaching for Conservation programme (approximately 12 000 reached since 2013)
Investec Rhino Lifeline has supported the rescue of 70 rhino since 2012
Ensuring the security of natural resources in all our operations
R2.5 million spent on water initiatives to ensure continuation of business in our Cape Town office during the 2017/2018 drought
Planet recognition
• Investec group was awarded a B for the Carbon Disclosure Project (CDP) climate scoring
• Investec’s Energy Management System that covers 23 of our physical buildings in the UK, Ireland and Channel Islands was certified to the international energy standard ISO 50001
• In our UK head office, the Environment Management System retained the international environment standard ISO 14001
• Our UK head office, won the top prize – the Chairman’s Cup for its waste management processes in the Corporation of London’s Clean City Award Scheme for 2017
• The coordinator of the Investec Coaching for Conservation kids programme at Good Work Foundation won a silver in the Eco-Logic Awards in the category ‘Eco-Youth’
Highlights

17Investec integrated annual report 2018
Overview
of the year
(continued)
Profit
Financial capital We create sustained long‑term wealth by growing our core businesses.
Purpose and priorities Impact
Maintaining a balanced and resilient business model
Our capital light activities contributed 56% to group income
(target of > 50% of our income from capital light activities)
Maintaining a sound capital base and strong liquidity
Healthy capital and leverage ratios in excess of regulatory requirements (target a leverage ratio > 6%)
Cash and near cash to customer deposit ratio of 41.4% (target of > 25%)
Organically growing our businessAdjusted EPS* growth of 10.1% (2017: 16.9%) (target of 10% > UK PRI)
Focusing to improve the returns and operational efficiency
Group cost to income ratio 66.9% (target of < 65% in Pounds Sterling)
ROE of 12.1% overall group and 14.1% on an ongoing basis
(target of 12% – 16% over a rolling five‑year period in Pounds Sterling)
Creating value for shareholders4.3% increase in dividends per share
Dividend cover of 2.2 times (target of 1.7 – 3.5 times)
* Adjusted EPS is before goodwill, acquired intangibles, non-operating items and after non-controlling interests and deduction of preference dividends.
Technological capital
We deliver efficient and effective information technology to support our businesses and facilitate our digital strategy.
Purpose and priorities Impact
Aligning architecture across the group and reducing our application and data footprint
90% of all servers now virtualised reducing our data centre storage footprint in South Africa by 80%
Migration of the UK data centres to a fully hosted energy efficient environment reducing the energy footprint
Creating an international platform for clients with global access to products and services which is both high-tech and high-touch
Completed a number of enhancements to our digital capability
See page 22 for more information
Investing in technology to deliver exceptional client experience
Click & Invest successfully launched to market
Maintaining a cyber resilient strategy based on a threat-driven approach rather than a contemporary compliance-driven approach
Extensive simulations on various cyber threats were conducted during the period and we are comfortable with our procedures in place
All staff are required to do regular training on the prevention of cyber crime
Profit recognition
• Won the Best Digital Bank in South Africa and most Innovative Digital Bank in Africa in the Best Digital Bank Awards 2017
• Joint 1st Robo-Advisor for Click & Invest in the MyPrivateBanking Research Awards 2017
• Winner of the Online Personal Wealth Awards 2018 for best newcomer
Highlights

18 Investec integrated annual report 2018
Overview
of the year
About the Investec group
We strive to be a distinctive specialist bank and asset manager, driven by commitment to our core philosophies and values.
Who we are
Investec (comprising Investec plc and Investec Limited) is an international specialist bank and asset manager that provides a diverse range of financial products and services to a select client base.
Founded as a leasing company in Johannesburg in 1974.We acquired a banking licence in 1980 and were listed on the JSE Limited South Africa in 1986.
In July 2002, we implemented a dual listed companies (DLC) structure with linked companies listed in London and Johannesburg.A year later, we concluded a significant empowerment transaction in which our empowerment partners collectively acquired a 25.1% stake in the issued share capital of Investec Limited.
Since inception, we have expanded through a combination of substantial organic growth and a series of strategic acquisitions.Today, we have an efficient integrated international business platform, offering all our core activities in the UK and South Africa.

19Investec integrated annual report 2018
Overview
of the year
(continued)
About the Investec group
Distinctive performance• Outstanding talent – empowered,
enabled and inspired
• Meritocracy
• Passion, energy, stamina, tenacity
• Entrepreneurial spirit
Client focus• Distinctive offering
• Leverage resources
• Break china for the client
Cast-iron integrity• Moral strength
• Risk consciousness
• Highest ethical standards
Dedicated partnership• Respect for others
• Embrace diversity
• Open and honest dialogue
• Unselfish contribution to colleagues, clients and society
• Single organisation
• Meritocracy
• Focused businesses
• Differentiated, yet integrated
• Material employee ownership
• Creating an environment that stimulates extraordinary performance.
We are an international specialist bank and asset manager that provides a diverse range of financial products and services to a select client base in three principal markets, the UK and Europe, South Africa and Asia/Australia as well as certain other countries.Investec focuses on delivering distinctive profitable solutions for its clients in three core areas of activity namely, Asset Management, Wealth & Investment and Specialist Banking.
Our strategic goals and objectives are based on the aspiration to be recognised as a distinctive specialist bank and asset manager. This distinction is embodied in our entrepreneurial culture, which is balanced by a strong risk management discipline, client-centric approach and an ability to be nimble, flexible and innovative. We do not seek to be all things to all people and aim to build well-defined, value-added businesses focused on serving the needs of select market niches where we can compete effectively.
We valueOur philosophies What we do

20 Investec integrated annual report 2018
Overview
of the year
Our strategic focus
The Investec distinction
Our strategic goals and objectives are based on our aspiration to be recognised as a distinctive specialist bank and asset manager.
Client focused approach
• Clients are at the core of our business
• We strive to build business depth by deepening existing and creating new client relationships
• High level of service by being nimble, flexible and innovative.
Specialised strategy
• Serving select market niches as a focused provider of tailored structured solutions
• Enhancing our existing position in principal businesses and geographies through organic growth and select bolt-on acquisitions.
Strong culture
• Strong entrepreneurial culture that stimulates extraordinary performance
• Passionate and talented people who are empowered and committed
• Depth of leadership
• Strong risk awareness
• Material employee ownership.
Sustainable business
• Contributing to society, macro-economic stability and the environment
• Well-established brand
• Managing and positioning the group for the long term
• Balancing operational risk with financial risk while creating value for shareholders
• Cost and risk conscious.
Our long-term strategy is to build a diversified portfolio of businesses and geographies to support clients through varying markets and economic cycles. Since inception we have expanded through a combination of organic growth and strategic acquisitions.
In order to create a meaningful and balanced portfolio we need proper foundations in place which gain traction over time.
Our strategy
Our long‑term internationalisation strategy:• follow our customer base• gain domestic competence and critical mass in our chosen
geographies• facilitate cross-border transactions and flow.
We have a very deliberate and focused client strategy:• to leverage our unique client profile• to provide the best integrated solution supported by our
comprehensive digital offering.

21Investec integrated annual report 2018
Overview
of the year
(continued)
Our strategic focus
Fee and commission income Types of incomeNet interest, investment, associate
and trading income
Capital light activities Capital intensive activities
• Asset management
• Wealth management
• Advisory services
• Transactional banking services
• Property and other funds
• Lending portfolios
• Investment portfolios
• Trading income – client flows – balance sheet management
Contributed to group income
Contributed to group income
56% 44%
Our diversified and balanced business model supporting long‑term strategyBroadly defined, we operate across three areas of specialisation focused on well defined target clients:
We aim to maintain an appropriate balance between revenue earned from capital light activities and revenue earned from capital intensive activities.
This ensures that we are not over reliant on any one part of our businesses to sustain our activities and that we have a large recurring revenue base that enables us to navigate through varying cycles and supports our long-term strategy.
Private client (high net worth/high income)/charities/trusts
– Investment management services to external clients
– Investment management services – Independent financial planning advice
– Lending – Transactional banking – Deposit raising activities – Treasury and trading – Advisory – Investment activities
Operating completely independently
Corporate/institutional/government
Asset Management Specialist Banking Wealth & Investment
Investec Asset Management• Continue to improve our investment performance
• Maintain strong momentum in the Advisor business globally
• Grow our presence in the large markets, especially North America
• Evolve all our capabilities for the future, continue to scale Multi-Asset and Quality and build a compelling foundation for Alternatives.
Investec Wealth & Investment• Focus on investing in and developing our digital channel
including enhancements to our core service
• Coordinating and leveraging capabilities across businesses to enhance our services for clients
• Providing a global investment offering and building skills in alternative investment, fiduciary and tax
• Continually improving business processes.
Specialist Banking UK• Broaden client base by building franchise while deepening
client relationships
• Establishing a high-tech and high-touch domestically relevant bank to growth-orientated businesses
• Private Bank shift in focus from platform development to client acquisition.
Specialist Banking South Africa• Identify new sources of revenue across our existing client base
• Management of our liquidity ratios with an emphasis on retail funding initiatives
• Management of our capital to optimise returns
• Launch of Investec for Business to mid-market corporates.
Other objectives• Diversity and transformation remain a key focus
• Continually evolving the digital offering.
Our strategy (continued)

22 Investec integrated annual report 2018
Overview
of the year
(continued)
Our strategic focus
Integrated client strategyClients are at the core of our business and we strive to provide them with a high level of service by being nimble, flexible and innovative. In the past few years, we have created an international digital platform for clients with global access to products and services which is both high-tech and high-touch. Our integrated client strategy leverages off the natural linkages within the private client businesses and between the private client and corporate banking businesses, which are all centred around the client. We are continually enhancing and evolving our digital platform to ensure a seamless, integrated client service experience.
Investec Digital enables our clients to get a real-time consolidated view of their banking and investment accounts, locally and internationally, on one platform with one login. Through this consolidated global dashboard (Investec Online and the App), clients can access and transact on their banking and investment accounts across South Africa, the UK, Channel Islands and more, at no additional fees. To add value to clients’ daily banking and investment experience, we continue to enhance our digital capability through regular innovations.
Initiative Completed in past year
One Place – global platform
OnePlace mobile app ranked joint second place in the MyPrivateBanking awards
Rebuild of corporate platform Investec Dotcom
Enhancements to the Manage My Life toolset (for clients to manage non financial aspects of their life, legacy management)
Investec Life Limited (Investec Life) launched in October 2017 – more than R1 billion of life policies have been sold in the six months to 31 March 2018
Additional value added services (e.g.: pre-paid electricity)
Enhanced mobile payments
Personal portfolioSelf service financial management (e.g.: budgets, cash flow forecasting) – development completed and in testing phase
South African online portfolio manager
Included unit trusts from Wealth & Investment and Investec Asset Management
Enhanced capability on Tax Free Savings
UK online portfolio managerClick & Invest successfully launched to market – won Joint First Robo-Advisor award from MyPrivateBanking
Focus for the financial year ending 31 March 2019• Private client mobile app refresh
• Goal-based investing for South African private clients
• Business banking for South Africa and the UK
• Click & Invest Self Invested Personal Pensions (SIPPs)
• Open application interface (API) – allowing fintech ecosystem to utilise Investec’s digital API (services) and allowing Investec to access Fintech capability more easily – including a revised operating model to create API’s as a new channel for the group
• A unified digital interface for financial intermediaries.
Private client businesses
Corporate client businesses
Private Banking
Growth and creation of wealthBanking Property Finance Private Capital Retail
Private bankers Digital
Wealth & Investment
Management and preservation of wealthWealth Management Portfolio Management Stockbroking
Global client support centre
Investment managers
CorporateCorporate clients (including directors, employees)
Private Equity Investments
Manufacturer of funds
Retail structured savings products
Corporate bankers Digital
Businesses Channel of choice Strong links

23Investec integrated annual report 2018
Overview
of the year
Our operational structure
Investec Limited, which houses our Southern
African and Mauritius operations, has been listed in South Africa
since 1986.
Salient features of the DLC structure• Investec plc and Investec Limited are separate legal entities and listings, but are bound together by contractual agreements and
mechanisms
• Investec operates as if it is a single unified economic enterprise
• Shareholders have common economic and voting interests as if Investec plc and Investec Limited were a single company
• Creditors, however, are ring-fenced to either Investec plc or Investec Limited as there are no cross-guarantees between the companies.
During July 2002 Investec Group Limited (since renamed Investec Limited) implemented a dual listed companies (DLC) structure and listed its offshore business on the London Stock Exchange.
A circular on the establishment of our DLC structure was issued on 20 June 2002 and is available on our website.
In terms of our DLC structure, Investec Limited is the holding company of our businesses in Southern Africa and Mauritius, and Investec plc is the holding company of our non-Southern African businesses.
Operating structure
Our DLC structure and main operating subsidiaries as at 31 March 2018
Non‑Southern African operations
Southern African operations
Investec plc LSE primary listing
JSE secondary listingSharing agreement
Investec Limited JSE primary listing
NSX secondary listingBSE secondary listing
Investec BankLimited
Investec Asset Management
Holdings (Pty) Ltd
83%*
Investec Securities (Pty) Ltd
Investec Property Group
Holdings (Pty) Ltd
Investec Employee Benefits Holdings (Pty) Ltd
Investec Bank plc
Investec AssetManagement
Limited83%*
Investec Wealth & Investment
Limited
Investec Bank (Channel Islands) Limited
Investec Asset
Finance plc
Investec Holdings
(Australia) Limited
Investec Bank
(Switzerland) AG
Investec Irish
branch
All shareholdings in the ordinary share capital of the subsidiaries are 100%, unless otherwise stated.
* 17% held by senior management in the company (31 March 2017: 16%).^ 54.3% held by third party investors in the company together
with senior management of the business (31 March 2017: 55.0%).^^ Previously Investec Employee Benefits Limited.
Investec Bank
(Mauritius) Limited
Reichmans Holdings (Pty) Ltd
IEP Group (Pty) Ltd 45.7%^
Investec Import
Solutions (Pty) Ltd
Investec Life
Limited^^

24 Investec integrated annual report 2018
Overview
of the year
Our operational footprint
We have built a solid international platform, with diversified revenue streams and geographic diversity.
Southern Africa• Founded as a leasing company
in 1974
• Acquired a banking licence in 1980
• Listed on the JSE Limited South Africa in 1986
• In 2003 we implemented a 25.1% empowerment shareholding transaction
• Market leading position in all three of our core activities
• Fifth largest bank in the country
• Offices supporting the Southern African businesses include Botswana; Cape Town; Durban; East London; Johannesburg; Knysna; Mauritius; Namibia; Pietermaritzburg; Port Elizabeth; Pretoria; and Stellenbosch.
Operating profit* of the Southern African operations increased 9.1% to £408.1 million
Investec in total
Operating profit*67.2% Permanent
employees55.9%
Assets64.3%
NAV**57.3%
Total deposit book
Total net core loans
Total funds under management
£19.4bn £15.4bn
£53.9bn
COI^
ROE^
52.5%17.2%
Actual
As a % of the group
Operating profit*
£607.5mn
Assets
£57 617mn
NAV**
£3 750mn
Permanent employees
9 444
COI^ ROE^
66.9% 12.1%

25Investec integrated annual report 2018
Overview
of the year
(continued)
Our operational footprint
* Before goodwill, acquired intangibles, non-operating items, taxation and after other non-controlling interests.** NAV is tangible shareholders’ equity as calculated on page 64.^ COI is cost to income ratio. ROE is the post-tax return on adjusted average shareholders’ equity as calculated on pages 66 and 67.
UK and Other• In 1992 we made our first international acquisition, acquiring Allied Trust
Bank in London
• Since that date, we have expanded organically and through a number of strategic acquisitions
• Solid positioning in all three of our core activities
• Listed in London in July 2002 through the implementation of a dual listed companies structure
• Offices supporting the UK and Other businesses include Australia; Channel Islands; Hong Kong; India; Ireland; Luxembourg; North America; Singapore; Switzerland and 18 offices across the UK.
Operating profit* (statutory) of the UK operations decreased 11.4% to £199.4 million
Operating profit* (ongoing) of the UK operations increased 1.2% to £292.9 million
Total deposit book
Total net core loans
Total funds under management
£11.6bn £9.7bn
£106.6bn
Operating profit*32.8% Permanent
employees44.1%
Assets35.7%
NAV**42.7%COI^
ROE^
ROE^ongoing
78.0%6.9%10.9%
Actual
As a % of the group

26 Investec integrated annual report 2018
Overview
of the year
(continued)
Our operational footprint
Our three distinct business activities are focused on well-defined target clients.
Core client base and what we doOperates independently from Investec’s other businesses. Our sole focus is the provision of investment management services to our predominantly global institutional client base
Market positioning
Total funds under management# 1991: £0.4 billion 2018: £103.9 billionGood long-term investment performance with growing traction in our distribution channels
Core client base and what we do Provides investment management services and independent financial planning advice to private clients, charities and trusts
Market positioning
Total funds under management# 1997: £0.04 billion 2018: £56.0 billion UK: One of the top five players South Africa: Largest player
Core client base and what we doWe offer a broad range of services including lending, transactional banking, treasury and trading, advisory and investment activities. These services are aimed at government, institutional, corporate and high net worth and high-income clients
Market positioning
Global core loan portfolio: £25.1 billion^^
• Corporate and other clients: £10.9 billion
• Private clients: £14.2 billion^^
Global deposit book: £31.0 billion
Asset Management
Wealth & Investment
Specialist Banking

27Investec integrated annual report 2018
Overview
of the year
(continued)
Our operational footprint
Operating profit* of Asset Management increased 8.0% to £178.0 million
Operatingprofit*°
NAV**
Permanent employees
29.3%
3.0%
16.1%
£103.9bn#£59.1bn £44.7bn33.0%
91.0%Total funds under management
Segregated mandates
Mutual funds
Operating profit* of Wealth & Investment increased 5.7% to £98.6 million
Operatingprofit*°
NAV**
Permanent employees
16.2%
1.5%
17.8%
24.3%
38.7%
£35.6bnDiscretionary funds under management
Non-discretionary funds under management
£20.5bnTotal funds under management
£56.0bn#
Operating profit* (statutory) of Specialist Banking decreased 2.4% to £380.5 million
Operating profit* (ongoing) of Specialist Banking increased 4.3% to £474.0 million
* Before goodwill, acquired intangibles, non-operating items, taxation and after other non-controlling interests.** NAV is tangible shareholders’ equity as calculated on page 64.^ COI is cost to income ratio. ROE is the pre-tax return on adjusted average shareholders’ equity as calculated on page 68.^^ Including legacy assets of £0.3 billion as explained on page 85.° Contributions are larger than 100% due to group costs amounting to £49.6 million which are included in operating profit.# Refer to page 71 for further detail on funds under management.
Operatingprofit*°
NAV**
Permanent employees
62.6%
95.5%
66.1%
£31.0bnTotal deposit book
Total core loans
£25.1bnCOI^
ROE^
ROE ongoing^
61.2%10.2%13.1%
operating margin
ROE^
As a % of group
operating margin
ROE^
As a % of group
As a % of group

28 Investec integrated annual report 2018
Overview
of the year
Financial review
Investec operates under a DLC structure with primary listings of Investec plc on the London Stock Exchange and Investec Limited on the JSE Limited.
In terms of the contracts constituting the DLC structure, Investec plc and Investec Limited effectively form a single economic enterprise in which the economic and voting rights of ordinary shareholders of the companies are maintained in equilibrium relative to each other.
The directors of the two companies consider that for financial reporting purposes, the fairest presentation is achieved by combining the results and financial position of both companies.
Accordingly, the year-end results for Investec plc and Investec Limited present the results and financial position of the combined DLC group under International Financial Reporting Standards (IFRS), denominated in Pounds Sterling.
All references in this document to Investec or the group relate to the combined DLC group comprising Investec plc and Investec Limited.
Introduction
Exchange ratesOur reporting currency is Pounds Sterling. Certain of our operations are conducted by entities outside the UK. The results of operations and the financial position of our individual companies are reported in the local currencies of the countries in which they are domiciled, including South African Rands, Australian Dollars, Euros and US Dollars. These results are then translated into Pounds Sterling at the applicable foreign currency exchange rates for inclusion in our combined consolidated financial results. In the case of the income statement, the weighted average rate for the relevant period is applied and, in the case of the balance sheet, the relevant closing rate is used.
The following table sets out the movements in certain relevant exchange rates against Pounds Sterling over the year.
31 March 2018 31 March 2017
Currency per £1.00 Year end Average Year end Average
South African Rand 16.62 17.21 16.77 18.42
Australian Dollar 1.83 1.72 1.64 1.75
Euro 1.14 1.14 1.17 1.19
US Dollar 1.40 1.33 1.25 1.31
Exchange rates between local currencies and Pounds Sterling have fluctuated over the year. The most significant impact arises from the volatility of the Rand. The average Rand: Pound Sterling exchange rate over the year has appreciated by 6.6% and the closing rate has appreciated by 0.9% since 31 March 2017.
Results in Pounds Sterling
Actual as reported
Year to 31 March
2018
Actual as reported
Year to 31 March
2017
Actual as reported
% change
Neutral currency^
Year to 31 March
2018
Neutral currency
% change
Operating profit before taxation* (million) £608 £599 1.4% £578 (3.5%)
Earnings attributable to shareholders (million) £506 £442 14.3% £478 8.1%
Adjusted earnings attributable to shareholders** (million) £491 £435 13.0% £465 6.9%
Adjusted earnings per share** 53.2p 48.3p 10.1% 50.3p 4.1%
Basic earnings per share 51.2p 50.8p 0.8% 48.4p (4.7%)
Dividends per share 24.0p 23.0p 4.3% n/a n/a
* Before goodwill, acquired intangibles, non-operating items and after other non-controlling interests.** Before goodwill, acquired intangibles, non-operating items and after non-controlling interests. ^ For income statement items we have used the average Rand: Pound Sterling exchange rate that was applied in the prior year, i.e. 18.42.

29Investec integrated annual report 2018
Overview
of the year
(continued)
Financial review
Results in Pounds Sterling
Actual as reported
Actual as reported Actual as
Neutral currency^^ Neutral
at at reported at currency31 March
201831 March
2017%
change31 March
2018%
change
Net asset value per share 452.5p 431.0p 5.0% 454.0p 5.3%
Net tangible asset value per share 401.5p 377.0p 6.5% 403.0p 6.9%
Total equity (million) £5 428 £4 809 12.9% £5 403 12.4%
Total assets (million) £57 617 £53 535 7.6% £57 288 7.0%
Core loans and advances (million) £25 132 £22 707 10.7% £24 995 10.1%
Cash and near cash balances (million) £12 825 £12 038 6.5% £12 763 6.0%
Customer deposits (million) £30 987 £29 109 6.5% £30 815 5.9%
Third party assets under management (million) £160 576 £150 735 6.5% £160 138 6.2%
^^ For balance sheet items we have assumed that the Rand: Pound Sterling closing exchange rate has remained neutral since 31 March 2017.
The following table provides a comparison of the group’s results as reported in Pounds Sterling and the group’s results as translated into Rands.
Results in Pounds Sterling Results in Rands
Year to 31 March
2018
Year to 31 March
2017%
change
Year to 31 March
2018
Year to 31 March
2017 %
change
Operating profit before taxation* (million) £608 £599 1.4% R10 412 R10 885 (4.3%)
Earnings attributable to shareholders (million) £506 £442 14.3% R8 648 R8 025 7.8%
Adjusted earnings attributable to shareholders** (million) £491 £435 13.0% R8 395 R7 880 6.5%
Adjusted earnings per share** 53.2p 48.3p 10.1% 909c 875c 3.9%
Basic earnings per share 51.2p 50.8p 0.8% 875c 920c (4.9%)
Headline earnings per share 48.7p 48.2p 1.0% 833c 872c (4.5%)
Dividends per share 24.0p 23.0p 4.3% 432c 403c 7.2%
Results in Pounds Sterling Results in Rands
At 31 March
2018
At 31 March
2017 %
change
At 31 March
2018
At 31 March
2017%
change
Net asset value per share 452.5p 431.0p 5.0% 7 521c 7 228c 4.1%
Net tangible asset value per share 401.5p 377.0p 6.5% 6 674c 6 322c 5.6%
Total equity (million) £5 428 £4 809 12.9% R90 218 R80 638 11.9%
Total assets (million) £57 617 £53 535 7.6% R957 592 R897 749 6.7%
Core loans and advances (million) £25 132 £22 707 10.7% R417 695 R380 786 9.7%
Cash and near cash balances (million) £12 825 £12 038 6.5% R213 155 R201 877 5.6%
Customer deposits (million) £30 987 £29 109 6.5% R515 007 R488 149 5.5%
Third party assets under management (million) £160 576 £150 735 6.5% R2 661 492 R2 527 826 5.3%
* Before goodwill, acquired intangibles, non-operating items and after other non-controlling interests.** Before goodwill, acquired intangibles, non-operating items and after non-controlling interests.

30 Investec integrated annual report 2018
Overview
of the year
(continued)
Financial review
Ten‑year reviewSalient features*
For the year ended 31 March 2018 2017% change
2018 vs 2017 2016 2015 2014 2013 2012 2011 2010 2009
Income statement and selected returnsAdjusted earnings attributable to ordinary shareholders before goodwill, acquired intangibles and non-operating items (£’000) 491 062 434 504 13.0% 359 732 339 532 326 923 309 310 257 579 327 897 309 710 269 215Headline earnings (£’000) 449 647 434 425 3.5% 334 720 308 770 291 561 265 227 217 253 286 659 275 131 261 627Operating profit before goodwill, acquired intangibles, non-operating items and taxation (£’000)ø 607 505 599 121 1.4% 505 593 493 157 450 676 426 278 358 625 434 406 432 258 396 766Operating profit: Southern Africa (% of total)ø 67.2% 62.5% 63.8% 70.8% 66.0% 67.5% 80.7% 69.1% 67.2% 74.0%Operating profit: UK and Other (% of total)ø 32.8% 37.5% 36.2% 29.2% 34.0% 32.5% 19.3% 30.9% 32.8% 26.0%Cost to income ratio 66.9% 66.3% 66.4% 67.6% 67.6% 65.7% 64.7% 61.7% 57.8% 55.9%Staff compensation to operating income ratio# 47.5% 46.1% 47.0% 47.4% 46.3% 43.9% 43.0% 40.7% 36.1% 34.9%Return on average adjusted shareholders’ equity (post-tax) 12.1% 12.5% 11.5% 10.6% 10.0% 9.4% 7.8% 11.2% 13.5% 14.8%Return on average adjusted tangible shareholders’ equity (post-tax) 13.7% 14.5% 13.7% 12.7% 12.3% 11.7% 9.6% 13.2% 15.4% 17.4%Return on average risk-weighted assets 1.45% 1.45% 1.34% 1.25% 1.14% 1.06% 0.91% 1.23% 1.33% 1.36%Operating margin of the combined Asset Management and Wealth & Investment businesses 29.3% 30.1% 29.6% 30.4% 29.9% 29.1% 30.2% 33.6% nc** nc**Operating profit per employee (£’000) 61.2 64.1 (4.5%) 58.7 59.7 54.9 53.5 47.8 64.4 69.7 62.6Net interest income as a % of operating income 31.1% 29.7% 29.6% 32.4% 33.6% 35.2% 36.2% 34.9% 37.0% 46.6%Non-interest income as a % of operating income 68.9% 70.3% 70.4% 67.6% 66.4% 64.8% 63.8% 65.1% 63.0% 53.4%Annuity income as a % of total operating income 76.2% 72.0% 71.7% 74.2% 70.7% 68.6% 67.7% 62.3% 60.4% 70.0%Effective operational tax rate 9.6% 18.5% 19.1% 19.6% 17.1% 18.4% 18.1% 15.5% 20.6% 21.1%Balance sheetTotal capital resources (including subordinated liabilities) (£’million) 6 911 6 211 11.3% 4 994 5 219 5 355 5 693 5 505 5 249 4 362 3 762Total shareholders’ equity (including preference shares and non-controlling interests) (£’million) 5 428 4 809 12.9% 3 859 4 040 4 016 3 942 4 013 3 961 3 292 2 621Shareholders’ equity (excluding non-controlling interests) (£’million) 4 442 4 131 7.5% 3 360 3 501 3 572 3 661 3 716 3 648 2 955 2 297Total assets (£’million) 57 617 53 535 7.6% 45 352 44 353 47 142 52 010 51 550 50 941 46 572 37 365Net core loans and advances to customers (£’million) 25 132 22 707 10.7% 18 119 17 189 17 157 18 415 18 226 18 758 17 891 16 227Core loans and advances to customers as a % of total assets 43.6% 42.4% 40.0% 38.8% 36.4% 35.4% 35.4% 36.8% 38.4% 43.4%Cash and near cash balances (£’million) 12 825 12 038 6.5% 10 962 9 975 9 136 9 828 10 251 9 319 9 117 4 866Customer accounts (deposits) (£’million) 30 987 29 109 6.5% 24 044 22 615 22 610 24 461 25 344 24 441 21 934 14 573Third party assets under management (£’million) 160 576 150 735 6.5% 121 683 124 106 109 189 110 678 96 776 88 878 74 081 48 828Capital adequacy ratio: Investec plcº 15.4% 15.1% 15.1% 16.7% 15.3% 16.7% 17.5% 16.8% 15.9% 16.2%Capital adequacy tier 1 ratio: Investec plcº 12.9% 11.5% 10.7% 11.9% 10.5% 11.0% 11.6% 11.6% 11.3% 10.1%Common equity tier 1 ratio: Investec plc^^º 11.0% 11.3% 9.7% 10.2% 8.8% 8.8% 9.3% nd^ nd^ nd^
Leverage ratio: Investec plc – current^^º 8.5% 7.8% 7.0% 7.7% 7.4% nd^ nd^ nd^ nd^ nd^
Capital adequacy ratio: Investec Limitedº 14.6% 14.1% 14.0% 14.7% 14.9% 15.5% 16.1% 15.9% 15.6% 14.2%Capital adequacy tier 1 ratio: Investec Limitedº 11.0% 10.7% 10.7% 11.3% 11.0% 10.8% 11.6% 11.9% 12.0% 10.8%Common equity tier 1 ratio: Investec Limited^^º 10.2% 9.9% 9.6% 9.6% 9.4% 8.9% 9.3% nd^ nd^ nd^
Leverage ratio: Investec Limited – current^^º 7.5% 7.3% 6.9% 8.1% 7.8% nd^ nd^ nd^ nd^ nd^
Credit loss ratio (income statement impairment charge as a % of average gross core loans and advances) 0.61% 0.54% 0.62% 0.68% 0.68% 0.84% 1.12% 1.27% 1.16% 1.08%Defaults (net of impairments and before collateral) as a % of net core loans and advances to customers 1.17% 1.22% 1.54% 2.07% 2.30% 2.73% 3.31% 4.66% 3.98% 3.28%Gearing ratio (assets excluding assurance assets to total equity) 9.1x 9.5x 10.2x 9.4x 10.3x 11.6x 11.3x 11.3x 12.5x 13.0xCore loans to equity ratio 4.6x 4.7x 4.7x 4.3x 4.3x 4.7x 4.5x 4.7x 5.4x 6.2xLoans and advances to customers: customer deposits 79.6% 76.2% 73.6% 74.0% 72.0% 71.5% 67.8x 72.4% 76.2% 103.6%Salient financial features and key statisticsAdjusted earnings per share (pence) 53.2 48.3 10.1% 41.3 39.4 37.9 36.1 31.8 43.2 45.1 42.4Headline earnings per share (pence) 48.7 48.2 1.0% 38.5 35.8 33.8 31.0 26.8 37.7 40.1 41.2Basic earnings per share (pence) 51.2 50.8 0.8% 38.5 24.4 34.3 31.7 25.7 49.7 44.0 38.5Diluted earnings per share (pence) 49.8 48.8 2.0% 36.7 23.1 32.3 29.8 24.3 46.7 41.5 36.1Dividends per share (pence) 24.0 23.0 4.3 21.0 20.0 19.0 18.0 17.0 17.0 16.0 13.0Dividend cover (times) 2.2 2.1 2.0 2.0 2.0 2.0 1.9 2.5 2.8 3.3Net asset value per share (pence) 452.5 431.0 5.0% 352.3 364.9 376.0 384.2 392.0 416.0 364.0 308.8Net tangible asset value per share (pence) 401.5 377.0 6.5% 294.3 308.1 309.0 310.9 317.0 343.8 324.1 266.3Weighted number of ordinary shares in issue (million) 923.5 900.4 2.6% 870.5 862.7 862.6 856.0 809.6 759.8 686.3 634.6Total number of shares in issue (million) 980.6 958.3 2.3% 908.8 899.4 891.7 884.8 874.0 810.0 741.0 713.2Closing share price (pence) 550 544 1.1% 513 561 485 459 382 478 539 292Market capitalisation (£’million) 5 393 5 213 3.5% 4 662 5 045 4 325 4 061 3 340 3 872 3 993 2 083Number of employees in the group (including temps and contractors) 10 146 9 716 4.4% 8 966 8 254 8 258 8 151 7 781 7 237 6 123 5 951Closing ZAR:£ exchange rate 16.62 16.77 0.9% 21.13 17.97 17.56 13.96 12.27 10.88 11.11 13.58Average ZAR:£ exchange rate 17.21 18.42 6.6% 20.72 17.82 16.12 13.44 11.85 11.16 12.38 14.83* Refer to definitions on page 245.** Where nc is not comparable.^ Where nd is not previously disclosed.^^ The group’s expected Basel III ‘fully loaded’ numbers are provided on page 91 in volume two.º Investec Limited’s numbers have been reported in terms of Basel III since 31 March 2013, and Investec plc has been reporting in terms of Basel III since 31 March 2014. ø Before goodwill, acquired intangibles, non-operating items, taxation and after other non-controlling interests.# Staff compensation ratio has been calculated based on revised definition as per page 245 for financial years 2017 and 2018. Prior year numbers have not
been recalculated on this basis.

31Investec integrated annual report 2018
Overview
of the year
(continued)
Financial review
Ten‑year reviewSalient features*
For the year ended 31 March 2018 2017% change
2018 vs 2017 2016 2015 2014 2013 2012 2011 2010 2009
Income statement and selected returnsAdjusted earnings attributable to ordinary shareholders before goodwill, acquired intangibles and non-operating items (£’000) 491 062 434 504 13.0% 359 732 339 532 326 923 309 310 257 579 327 897 309 710 269 215Headline earnings (£’000) 449 647 434 425 3.5% 334 720 308 770 291 561 265 227 217 253 286 659 275 131 261 627Operating profit before goodwill, acquired intangibles, non-operating items and taxation (£’000)ø 607 505 599 121 1.4% 505 593 493 157 450 676 426 278 358 625 434 406 432 258 396 766Operating profit: Southern Africa (% of total)ø 67.2% 62.5% 63.8% 70.8% 66.0% 67.5% 80.7% 69.1% 67.2% 74.0%Operating profit: UK and Other (% of total)ø 32.8% 37.5% 36.2% 29.2% 34.0% 32.5% 19.3% 30.9% 32.8% 26.0%Cost to income ratio 66.9% 66.3% 66.4% 67.6% 67.6% 65.7% 64.7% 61.7% 57.8% 55.9%Staff compensation to operating income ratio# 47.5% 46.1% 47.0% 47.4% 46.3% 43.9% 43.0% 40.7% 36.1% 34.9%Return on average adjusted shareholders’ equity (post-tax) 12.1% 12.5% 11.5% 10.6% 10.0% 9.4% 7.8% 11.2% 13.5% 14.8%Return on average adjusted tangible shareholders’ equity (post-tax) 13.7% 14.5% 13.7% 12.7% 12.3% 11.7% 9.6% 13.2% 15.4% 17.4%Return on average risk-weighted assets 1.45% 1.45% 1.34% 1.25% 1.14% 1.06% 0.91% 1.23% 1.33% 1.36%Operating margin of the combined Asset Management and Wealth & Investment businesses 29.3% 30.1% 29.6% 30.4% 29.9% 29.1% 30.2% 33.6% nc** nc**Operating profit per employee (£’000) 61.2 64.1 (4.5%) 58.7 59.7 54.9 53.5 47.8 64.4 69.7 62.6Net interest income as a % of operating income 31.1% 29.7% 29.6% 32.4% 33.6% 35.2% 36.2% 34.9% 37.0% 46.6%Non-interest income as a % of operating income 68.9% 70.3% 70.4% 67.6% 66.4% 64.8% 63.8% 65.1% 63.0% 53.4%Annuity income as a % of total operating income 76.2% 72.0% 71.7% 74.2% 70.7% 68.6% 67.7% 62.3% 60.4% 70.0%Effective operational tax rate 9.6% 18.5% 19.1% 19.6% 17.1% 18.4% 18.1% 15.5% 20.6% 21.1%Balance sheetTotal capital resources (including subordinated liabilities) (£’million) 6 911 6 211 11.3% 4 994 5 219 5 355 5 693 5 505 5 249 4 362 3 762Total shareholders’ equity (including preference shares and non-controlling interests) (£’million) 5 428 4 809 12.9% 3 859 4 040 4 016 3 942 4 013 3 961 3 292 2 621Shareholders’ equity (excluding non-controlling interests) (£’million) 4 442 4 131 7.5% 3 360 3 501 3 572 3 661 3 716 3 648 2 955 2 297Total assets (£’million) 57 617 53 535 7.6% 45 352 44 353 47 142 52 010 51 550 50 941 46 572 37 365Net core loans and advances to customers (£’million) 25 132 22 707 10.7% 18 119 17 189 17 157 18 415 18 226 18 758 17 891 16 227Core loans and advances to customers as a % of total assets 43.6% 42.4% 40.0% 38.8% 36.4% 35.4% 35.4% 36.8% 38.4% 43.4%Cash and near cash balances (£’million) 12 825 12 038 6.5% 10 962 9 975 9 136 9 828 10 251 9 319 9 117 4 866Customer accounts (deposits) (£’million) 30 987 29 109 6.5% 24 044 22 615 22 610 24 461 25 344 24 441 21 934 14 573Third party assets under management (£’million) 160 576 150 735 6.5% 121 683 124 106 109 189 110 678 96 776 88 878 74 081 48 828Capital adequacy ratio: Investec plcº 15.4% 15.1% 15.1% 16.7% 15.3% 16.7% 17.5% 16.8% 15.9% 16.2%Capital adequacy tier 1 ratio: Investec plcº 12.9% 11.5% 10.7% 11.9% 10.5% 11.0% 11.6% 11.6% 11.3% 10.1%Common equity tier 1 ratio: Investec plc^^º 11.0% 11.3% 9.7% 10.2% 8.8% 8.8% 9.3% nd^ nd^ nd^
Leverage ratio: Investec plc – current^^º 8.5% 7.8% 7.0% 7.7% 7.4% nd^ nd^ nd^ nd^ nd^
Capital adequacy ratio: Investec Limitedº 14.6% 14.1% 14.0% 14.7% 14.9% 15.5% 16.1% 15.9% 15.6% 14.2%Capital adequacy tier 1 ratio: Investec Limitedº 11.0% 10.7% 10.7% 11.3% 11.0% 10.8% 11.6% 11.9% 12.0% 10.8%Common equity tier 1 ratio: Investec Limited^^º 10.2% 9.9% 9.6% 9.6% 9.4% 8.9% 9.3% nd^ nd^ nd^
Leverage ratio: Investec Limited – current^^º 7.5% 7.3% 6.9% 8.1% 7.8% nd^ nd^ nd^ nd^ nd^
Credit loss ratio (income statement impairment charge as a % of average gross core loans and advances) 0.61% 0.54% 0.62% 0.68% 0.68% 0.84% 1.12% 1.27% 1.16% 1.08%Defaults (net of impairments and before collateral) as a % of net core loans and advances to customers 1.17% 1.22% 1.54% 2.07% 2.30% 2.73% 3.31% 4.66% 3.98% 3.28%Gearing ratio (assets excluding assurance assets to total equity) 9.1x 9.5x 10.2x 9.4x 10.3x 11.6x 11.3x 11.3x 12.5x 13.0xCore loans to equity ratio 4.6x 4.7x 4.7x 4.3x 4.3x 4.7x 4.5x 4.7x 5.4x 6.2xLoans and advances to customers: customer deposits 79.6% 76.2% 73.6% 74.0% 72.0% 71.5% 67.8x 72.4% 76.2% 103.6%Salient financial features and key statisticsAdjusted earnings per share (pence) 53.2 48.3 10.1% 41.3 39.4 37.9 36.1 31.8 43.2 45.1 42.4Headline earnings per share (pence) 48.7 48.2 1.0% 38.5 35.8 33.8 31.0 26.8 37.7 40.1 41.2Basic earnings per share (pence) 51.2 50.8 0.8% 38.5 24.4 34.3 31.7 25.7 49.7 44.0 38.5Diluted earnings per share (pence) 49.8 48.8 2.0% 36.7 23.1 32.3 29.8 24.3 46.7 41.5 36.1Dividends per share (pence) 24.0 23.0 4.3 21.0 20.0 19.0 18.0 17.0 17.0 16.0 13.0Dividend cover (times) 2.2 2.1 2.0 2.0 2.0 2.0 1.9 2.5 2.8 3.3Net asset value per share (pence) 452.5 431.0 5.0% 352.3 364.9 376.0 384.2 392.0 416.0 364.0 308.8Net tangible asset value per share (pence) 401.5 377.0 6.5% 294.3 308.1 309.0 310.9 317.0 343.8 324.1 266.3Weighted number of ordinary shares in issue (million) 923.5 900.4 2.6% 870.5 862.7 862.6 856.0 809.6 759.8 686.3 634.6Total number of shares in issue (million) 980.6 958.3 2.3% 908.8 899.4 891.7 884.8 874.0 810.0 741.0 713.2Closing share price (pence) 550 544 1.1% 513 561 485 459 382 478 539 292Market capitalisation (£’million) 5 393 5 213 3.5% 4 662 5 045 4 325 4 061 3 340 3 872 3 993 2 083Number of employees in the group (including temps and contractors) 10 146 9 716 4.4% 8 966 8 254 8 258 8 151 7 781 7 237 6 123 5 951Closing ZAR:£ exchange rate 16.62 16.77 0.9% 21.13 17.97 17.56 13.96 12.27 10.88 11.11 13.58Average ZAR:£ exchange rate 17.21 18.42 6.6% 20.72 17.82 16.12 13.44 11.85 11.16 12.38 14.83* Refer to definitions on page 245.** Where nc is not comparable.^ Where nd is not previously disclosed.^^ The group’s expected Basel III ‘fully loaded’ numbers are provided on page 91 in volume two.º Investec Limited’s numbers have been reported in terms of Basel III since 31 March 2013, and Investec plc has been reporting in terms of Basel III since 31 March 2014. ø Before goodwill, acquired intangibles, non-operating items, taxation and after other non-controlling interests.# Staff compensation ratio has been calculated based on revised definition as per page 245 for financial years 2017 and 2018. Prior year numbers have not
been recalculated on this basis.

32 Investec integrated annual report 2018
Overview
of the year
(continued)
Financial review
Track record
pence
0
10
20
30
40
50
6053.2
17
Adjusted earnings per share
1509 10 11 12 13 14 16 18
£’million
0
100
200
300
400
500 491.1
Adjusted earnings attributable to ordinary shareholders before goodwill, acquired intangibles and non-operating items
171509 10 11 12 13 14 16 18
£’billion
0
5
10
15
20
25
30
35
Core loans Customer deposits
31.0
25.1
17
Core loans and customer deposits
1509 10 11 12 13 14 16 18
£’billion
0
50
100
150
200
160.6
Third-party assets under management
171509 10 11 12 13 14 16 18
* Currency neutral basis: calculation assumes that the group’s relevant closing exchange rates at 31 March 2018, as reflected on page 28, remain the same as those at 31 March 2017.
Up 10.1% to 53.2 pence Up 13.0% to £491.1 million
Core loans: up 10.7% to £25.1 billion since 31 March 2017 – an increase of 10.1% on a currency neutral basis*
Deposits: up 6.5% to £31.0 billion since 31 March 2017 – an increase of 5.9% on a currency neutral basis*
Up 6.5% to £160.6 billion since 31 March 2017 – an increase of 6.2% on a currency neutral basis*
Net inflows of £7.3 billion

33Investec integrated annual report 2018
Overview
of the year
(continued)
Financial review
* ROE is post-tax return on adjusted average shareholders’ equity as calculated on page 66.** Adjusted EPS before goodwill, acquired intangibles and non-operating items as defined on page 245.*** Investec Limited’s numbers have been reported in terms of Basel III since 31 March 2013, and Investec plc has been reporting in terms of Basel III since
31 March 2014.
Note:The numbers shown in the financial targets graphs on this page are for the years ended 31 March, unless otherwise stated.
Percentage
Target range:12% to 16%
0
3
6
9
12
15
18
ROE*
17
12.1
1509 10 11 12 13 14 16 18ROE
Percentage
0
10
20
30
40
50
60
70
80
SC COI COI target (below 65%)
66.9
47.5
1509 10 11 12 13 14 181716
Cost to income ratio (COI) and staff compensation to operating income ratio (SC)
pence
0
10
20
30
40
50
6053.2
EPS** DPS
24.0
1817
Adjusted earnings per share (EPS) and dividends per share (DPS)
1509 10 11 12 13 14 16
£’000 Percentage
0
1 000
2 000
3 000
4 000
5 000
6 000 5 428
0
5
10
15
20
25
30
1509 10 11 12 13 14 1716Investec Limited CAR*** Investec plc CAR***Total shareholders’ equity
Total shareholders’ equity and capital adequacy ratios (CAR)
18
Financial targets
We have set the following target over the medium to long term:
Group ROE: 12% to 16% over a rolling five-year period in Pounds Sterling
We have set the following target over the medium to long term:
Group COI ratio: less than 65% in Pounds Sterling
We intend to maintain a sufficient level of capital to satisfy regulatory requirements, as well as take advantage of opportunities that may arise in the financial services industry focusing on increasing our return on equity in the medium to long term. We target a capital adequacy ratio range of between 14% and 17% on a consolidated basis for Investec plc and Investec Limited, a minimum tier 1 ratio of 11% and a common equity tier 1 ratio above 10%. We also target a leverage ratio above 6.0%
In the medium to long term, we aim to achieve adjusted EPS growth of 10% in excess of UK inflation (in Pounds Sterling). We continually strive to build and maintain a sustainable business model. We intend to maintain a dividend cover of between 1.7 to 3.5 times based on earnings per share as defined above, denominated in Pounds Sterling
Target Target
Target Target
Refer to page 65 for our reported capital ratios.

34 Investec integrated annual report 2018
Overview
of the year
(continued)
Financial review
Our views
South Africa
persisted, a key driver of the lift in South Africa’s 2017 GDP growth, with equity markets reaching new highs globally as the world’s economic outlook brightened. Global risk-on remained a feature, and the lengthy bull market saw emerging markets experience strong foreign portfolio inflows, benefiting the Rand, while low bond yields in advanced economies and low volatility supported bourses globally.
However, the lengthy low volatility period in financial markets was broken early in 2018, with a correction that reflected sudden global risk-off as a steeper than previously anticipated rise in future US interest rates was factored into the markets on Federal Open Market Committee (FOMC) commentary. Subsequently, stock markets have recovered some lost ground, as the correction has proved welcome in an environment that was becoming overblown, where fears even of a financial crisis were building. The Rand saw substantial strength from the end of December 2017 on the election of Cyril Ramaphosa as leader of the African National Congress (ANC) and then as South African President, with a reduction of over R2.00/USD of the risk premium inherent in the domestic currency.
South Africa has lost ground on an institutional basis over the past 10 years, resulting in weaker economic growth and intense pressure on government finances. Indeed, the World Economic Forum’s (WEF) Global Competitiveness Survey, shows South Africa’s institutional ranking has dropped to 76th, from 39th in 2007/08. Major slippages occurred particularly in
The global economy continued to strengthen meaningfully on a broad basis as trade lifted, along with industrial production and confidence, while global lending conditions were favourable. This saw South Africa’s gross domestic product (GDP) growth reach 1.3% year-on-year in calendar year 2017 from 0.6% year-on-year in calendar year 2016 as global demand strengthened, while recovery from severe drought conditions also assisted notably. Interest rates remained accommodative in many economies, with South Africa experiencing its first interest rate cut since 2012. The upturn in the commodity cycle
South Africa’s GDP improved in 2017, assisted by a strengthening in global demand and a recovery from severe drought conditions in the northern provinces.
perceptions of auditing and reporting standards, efficacy of corporate boards, perceptions of minority shareholder rights, efficacy of the legal framework and in judicial independence. Additionally, irregular payments and bribes and favouritism in decisions of government officials were seen to have risen substantially, and public trust in politicians declined as the corruption and state capture infesting the country came to a head.
Key among the new President’s goals is to eradicate corruption and state capture, repair the financial health of the State-owned Entities (SOEs) and fiscal consolidation. President Ramaphosa’s cabinet reshuffle in early 2018 saw the key appointments of Nhlanhla Nene and Pravin Gordhan (as Finance and Public Enterprises Ministers respectively).
The closer working relationship between government, labour and business continues to bear fruit, with President Ramaphosa quick to point out the necessity of repairing investor confidence and business sentiment, in order to quicken economic growth via increased private sector fixed investment and job creation. Rapid, sustained, private sector led economic growth of 5% to 7% plus remains the key to reducing unemployment and inequality, and eliminating poverty in South Africa.
GDP per capita GDP per capita
Economic growth
1.3% 0.6%
R56 054R56 020
Economic growth
Calendar year 2017 Calendar year 2016
Calendar year 2017 Calendar year 2016
An overview of the operating environment impacting our business.

35Investec integrated annual report 2018
Overview
of the year
(continued)
Financial review
Our views
United Kingdom
UK economic expansion has slowed, weighed down by weak consumer spending and higher levels of inflation.
GDP per capita GDP per capita
Economic growth
1.8% 1.9%
£29 328£29 670
Economic growth
Quarterly GDP growth of 0.4% in the fourth quarter capped off full-year growth of 1.8% in calendar year 2017, the weakest annual expansion recorded since 2012. Weighing on growth was softer consumer spending amid the squeeze on household finances as inflation rose to a more than five-year high of 3.1% in November 2017. Inflation started to ease as the first quarter of 2018 drew to a close whilst an increase in wage growth, to the firmest seen since 2015, also started to reduce the squeeze for households. Still, the quarterly pace of GDP growth slowed to just 0.1% in the first quarter of 2018, according to early GDP estimates, with heavy snow a key contributing factor.
The UK’s departure from the European Union (EU) (Brexit) remained one of the biggest uncertainties to the UK outlook, even though negotiations progressed largely as planned along the scheduled timetable. In March 2018 the remaining 27 EU member states gave the green light for talks to shift to the future trading relationship after progress was made on the EU’s draft withdrawal treaty and a 21 month transition period was agreed.
On the monetary policy front, the first hike in Bank Rate in over 10 years was enacted in November 2017, lifting UK interest rates to 0.50%. The Bank of England appeared to remain on course to pursue a gradual path of policy tightening over the next few years, with rate setters signalling that further hikes are likely to be necessary to bring inflation back sustainably to the Bank’s 2% target. Governor Mark Carney is set to step down in June 2019 with his successor possibly to be announced in late 2018.
The November 2017 UK Budget was an expansionary exercise, with several measures aimed at improving affordability and supply in the housing market. The subsequent ‘Spring Statement’ was a much more subdued affair, with the Chancellor unveiling no new fiscal initiatives.
Calendar year 2017 Calendar year 2016
Calendar year 2017 Calendar year 2016

36 Investec integrated annual report 2018
Overview
of the year
(continued)
Financial review
An overview of the operating environment impacting our business (continued)
The annual reading of 2.3% was dragged down by a weak first three months of the year, with the three quarters that followed seeing annualised growth paces of around 3% each. At the start of 2018, the advance estimate of quarter one GDP growth pointed to a moderation from a 2.9% (seasonally adjusted) annualised pace to 2.3%. US tax reforms passed by Congress in December 2017 and a fiscally supportive two year spending bill agreed in February 2018, look set to bolster growth momentum over the period ahead.
Through 2017 the labour market continued to tighten with the unemployment rate having stood at 4.1% since October 2017, its lowest level since 2001. However despite the low level of the unemployment rate, pay growth showed little sign of a sharp move upward, having hovered in a range between 2.3% and 2.8% over the 12 months to March 2018.
The absence of a material upshift in pay growth and a period of relatively subdued inflation allowed the Federal Reserve to adjust its policy stance relatively slowly. The Federal Open Market Committee (FOMC) raised interest rates three times in 2017 whilst it enacted a further 25 basis point hike in March 2018, taking the Federal funds target rate range to 1.50% – 1.75%, having commenced its slow ‘normalisation’ process with its first post-crisis rate hike in December 2015.
Importantly the FOMC has also embarked on a process of reducing its Quantitative Easing (QE) holdings on its balance sheet; since October 2017 it has allowed holdings to roll-off up to a prescribed cap. The cap started at $10 billion per month in October, has risen slowly and will reach a maximum of $50 billion per month by the end of 2018. So far, markets have taken the Federal Reserve’s gradual process of policy normalisation in their stride, albeit with some concerns that a sharp step up in inflation, if realised, might force the Fed to raise rates more rapidly over the coming years. Since summer 2017, the Federal Reserve’s favoured Personal Consumption Expenditures (PCE) inflation measure has stood in the range 1.4% to 1.8% and has not shown a clear sign of a shift higher.
In US politics, the Trump administration achieved its first major legislative win as it passed its tax reform proposals in December 2017. That appeared to energise the administration, which has moved forward on other policy initiatives since. The President’s recent focus has been on addressing what he sees as inequalities in the US’s trade relationship, not least with China.
The US economy expanded by 2.3% in 2017.
Our views
United States

37Investec integrated annual report 2018
Overview
of the year
(continued)
Financial review
Growth momentum also broadened out through 2017 with recent laggards in the recovery story, particularly France and Italy, seeing a step-up in their growth rates. Growth momentum has continued into 2018, albeit with the pace of GDP growth having slowed from 0.7% (quarter-on-quarter) in the final three months of 2017 to 0.4% in the first quarter of 2018, according to early GDP estimates.
The Euro area labour market continued to tighten with the unemployment rate having slid to 8.5%, a touch below the nine-year pre-crisis average. Rising employment helped to bolster household spending, supporting growth momentum more broadly. Meanwhile, credit conditions remained supportive of the economic outlook, with borrowing costs for households and corporates remaining near record lows and credit availability improving.
The European Central Bank’s (ECB) interest rate stance has remained unchanged since March 2016. As such the main refinancing rate remained at 0.00% and the deposit rate at -0.40%. The monthly pace of ECB asset purchases was held at €60 billion per month as 2017 closed, with the bond
buying pace having stood at that level since April 2017. From January 2018 bond buys were at a lower €30 billion per month pace. The ECB is not set to bring its QE programme to an end until late 2018. It continued to judge that an ultra-loose policy stance remained appropriate, given that it continued to expect that inflation would take some time to return to its target of ‘below but close to 2%’; Euro area inflation averaged just 1.4% over the 12 months to March 2018.
European political events punctuated the period once more. No clear victor emerged from Italian elections in March 2018, however, three months of negotiations have led to the formation of a coalition government. Market sentiment has been unnerved by the agreement between the two populist parties given plans for large scale fiscal stimulus and a more combative approach to the EU. The solid Euro area economic growth backdrop, which drove views that the ECB will finally start to move away from its ultra-loose policy stance next year, provided a key source of support for the Euro over the past 12 months.
The Eurozone recovery solidified over the period with growth of 2.5% recorded in calendar year 2017, the strongest Euro area expansion pace since 2007.
Our views
Eurozone

38 Investec integrated annual report 2018
Overview
of the year
(continued)
Financial review
The MSCI World index ended 2017 20% up on year opening levels with the index continuing to climb right through to late January 2018. From that point a reappraisal of risk sentiment, amidst fears over the pace of central bank policy tightening, particularly at the Federal Reserve, saw a period of increased volatility. In addition, from early March, trade war worries increasingly became a concern. The MSCI World index closed the first quarter of 2018 8.1% off its January 2018 high. On Wall Street, the S&P500 was off to a similar extent.
European equity markets saw a more tentative and somewhat choppier path through 2017, ending the year 6% up on year opening levels after much intervening volatility, not helped by a string of high stake elections in the likes of France, Germany and the Netherlands and with an independence referendum (deemed illegal by the Spanish authorities) in Catalonia, Spain. At the start of 2018 European equity markets rose robustly amidst hopes of a more buoyant growth backdrop. The Eurostoxx 50 index rose 5% over the first three weeks of the year, but then turned sharply lower amidst the hit to the global risk backdrop that followed at the end of January.
The back end of 2017 saw a rally in South African domestic shares as the election of Cyril Ramaphosa as leader of the ANC led to renewed enthusiasm about the growth prospects for South Africa. There has so far been little hard evidence of a turnaround on the ground but longer-term growth forecasts have been revised up. While business confidence lifted in early 2018, it is not yet at levels that indicate a faster pace of business activity.
Global equity markets enjoyed a positive 2017 overall.
Our views
An overview of the operating environment impacting our business (continued)
Global stock markets

39Investec integrated annual report 2018
Overview
of the year
(continued)
Financial review
Operating environment The table below provides an overview of some key statistics that should be considered when reviewing our operational performance
As at 31 March
2018
As at31 March
2017 % change
Average over the
year 1 April 2017 to
31 March 2018
Market indicators
FTSE All share 3 894 3 990 (2.4%) 4 062
JSE All share 55 475 52 056 6.6% 56 405
S&P 2 641 2 363 11.8% 2 550
Nikkei 21 454 18 909 13.5% 20 977
Dow Jones 24 103 20 663 16.6% 22 923
Rates
UK overnight 0.44% 0.17% 0.31%
UK 10 year 1.35% 1.20% 1.27%
UK Clearing Banks Base Rate 0.50% 0.25% 0.35%
LIBOR – three month 0.71% 0.34% 0.41%
SA R186 7.99% 8.84% 8.63%
Rand overnight 6.76% 6.97% 6.81%
SA prime overdraft rate 10.00% 10.50% 10.32%
JIBAR – three month 6.87% 7.36% 7.16%
US 10 year 2.74% 2.39% 2.41%
Commodities
Gold US$1 324/oz US$1 245/oz 6.3% US$1 285/oz
Brent Crude Oil US$70/bbl US$53/bbl 32.1% US$58/bbl
Platinum US$936/oz US$940/oz (0.4%) US$948/oz
Macro‑economic
UK GDP (% change over the calendar year) 1.8% 1.9%
UK per capita GDP (calendar year, real value in Pounds at constant 2015 prices)* 29 670 29 328 1.2%
South Africa GDP (% change over the calendar year) 1.3% 0.6%
South Africa per capita GDP (calendar year, historical revised, real value in Rands at constant 2010 prices) 56 020 56 054 (0.1%)
Sources: Bureau For Economic Research, Bloomberg, IRESS, Johannesburg Stock Exchange, Macrobond, SARB Quarterly Bulletin, World Economic Forum.
* Population used in 2017 per capita GDP reflects estimated population as per the Office for National Statistics.

40 Investec integrated annual report 2018
Overview
of the year
(continued)
Financial review
We provide a wide range of financial products and services to a select client base in three principal markets, the UK and Europe, South
Africa and Asia/Australia. We are organised as a network comprising
three principal business divisions: Asset Management, Wealth &
Investment and Specialist Banking.
There are a number of key income drivers for our business which are discussed below and alongside.
Key income drivers
Asset Management
Wealth & Investment
Key income drivers Income impacted primarily by
Income statement – primarily reflected as
– Investment management fees levied as a percentage of assets under management
– Commissions earned for executing transactions for clients.
– Movement in the value of assets underlying client portfolios
– The level of investment activity undertaken on behalf of clients, which, in turn, is affected by, among other things, the performance of the global stock markets (which drives investment opportunities), the equity investment risk appetite of our clients, tax considerations and market liquidity.
– Fees and commissions.
Key income drivers Income impacted primarily by
Income statement – primarily reflected as
– Fixed fees as a percentage of assets under management
– Variable performance fees.
– Movements in the value of the assets underlying client portfolios
– Performance of portfolios against set benchmarks
– Net flows.
– Fees and commissions.

41Investec integrated annual report 2018
Overview
of the year
(continued)
Financial review
Key income drivers Income impacted primarily by
Income statement – primarily reflected as
– Lending activities. – Size of loan portfolio – Clients’ capital and infrastructural investments – Client activity – Credit spreads – Interest rate environment.
– Net interest income
– Fees and commissions
– Investment income.
– Cash and near cash balances. – Capital employed in the business and capital adequacy targets
– Asset and liability management policies and risk appetite
– Regulatory requirements
– Credit spreads
– Interest rate environment.
– Net interest income
– Trading income arising from balance sheet management activities.
– Deposit and product structuring and distribution.
– Distribution channels
– Ability to create innovative products
– Regulatory requirements
– Credit spreads
– Interest rate environment.
– Net interest income
– Fees and commissions.
– Investments made (including listed and unlisted equities; debt securities; investment properties)
– Gains or losses on investments
– Dividends received.
– Macro- and micro-economic market conditions
– Availability of profitable exit routes
– Whether appropriate market conditions exist to maximise gains on sale
– Attractive investment opportunities
– Credit spreads.
– Net interest income
– Investment income
– Share of post taxation profit of associates.
– Advisory services. – The demand for our specialised advisory services, which, in turn, is affected by applicable, regulatory and other macro- and micro-economic fundamentals.
– Fees and commissions.
– Derivative sales, trading and hedging.
– Client activity, including lending activity
– Market conditions/volatility
– Asset and liability creation
– Product innovation.
– Fees and commissions
– Trading income arising from customer flow.
– Transactional banking services. – Levels of activity
– Ability to create innovative products
– Appropriate systems infrastructure.
– Net interest income
– Fees and commissions.
Specialist Banking

42 Investec integrated annual report 2018
Overview
of the year
(continued)
Financial review
An overview of the principal risks relating to our operations
The most material and significant risks we face, which the board and senior management believe could have an impact on our operations, financial performance, viability and prospects are summarised briefly below with further details provided in volumes one and two of the integrated annual report. The board, through its various sub-committees, has performed a robust assessment of these principal risks. For additional information pertaining to the management and monitoring of these principal risks, see the references provided. Regular reporting of these risks is made to senior management, the executives and the board at the group risk and capital committee (GRCC) and board risk and capital committee (BRCC).
The group’s board approved risk appetite framework is provided on page 11 in volume two. The board recognises that, even with sound appetite and judgement, extreme events can happen which are completely outside of the board’s control. It is however, necessary to assess these events and their impact and how they may be mitigated by considering the risk appetite framework if necessary. It is policy to regularly carry out multiple stress testing scenarios which in theory test extreme, but plausible events and from that assess and plan what can be done to mitigate the potential outcome.
Principal risks Key mitigating actions Further information provided
Credit and counterparty risk
Credit and counterparty risk is defined as the risk arising from an obligor’s (typically a client or counterparty) failure to meet the terms of any agreement thereby resulting in a loss to the group.
• Independent credit committees exist in each geography where we assume credit risk. These committees operate under board-approved delegated limits, policies and procedures.
• There is a high level of executive involvement and non-executive review and oversight in the credit decision-making forums.
• Our credit exposures are to a select target market comprising high-income and high net worth individuals, established corporates, and medium-sized enterprises.
• Our risk appetite continues to favour lower risk, income-based lending, with exposures well collateralised and credit risk taken over a short to medium term.
• Investec has a limited appetite for unsecured debt, thus the credit risk mitigation technique most commonly used is the taking of collateral, with a strong preference for tangible assets.
• Portfolio reviews (including stress testing analyses) are undertaken on all material businesses, where the portfolios are analysed to assess any migration in portfolio quality, highlight any vulnerabilities, identify portfolio concentrations and make appropriate recommendations, such as a reduction in risk appetite limits or specific exposures.
Pages 16 to 49 in volume two.

43Investec integrated annual report 2018
Overview
of the year
(continued)
Financial review
Principal risks Key mitigating actions Further information provided
Country risk
Country risk refers to the risk of lending to a counterparty operating in a particular country or the risk inherent in sovereign exposure, i.e. the risk of exposure to loss caused by events in other countries. Country risk covers all forms of lending or investment activity whether to/with individuals, corporates, banks or governments.
• Exposures are only to politically stable jurisdictions that we understand and have preferably operated in before.
• There is little appetite for exposures outside of the group’s pre-existing core geographies or target markets.
• The legal environment should be tested, have legal precedent in line with OECD standards and have good corporate governance.
• In certain cases, we may make use of political risk insurance to mitigate exposure where deemed necessary.
Page 17 in volume two.
Investment risk
Investment risk in the banking book arises primarily from the group’s principal investments (private equity) and property investment activities, where the group invests in largely unlisted companies and select property investments, with risk taken directly on the group’s balance sheet.
• Independent credit and investment committees exist in each geography where we assume investment risk.
• Risk appetite limits and targets are set to limit our exposure to equity and investment risk.
• As a matter of course, concentration risk is avoided and investments are well spread across geographies and industries.
Pages 50 to 53 in volume two.

44 Investec integrated annual report 2018
Overview
of the year
(continued)
Financial review
Principal risks Key mitigating actions Further information provided
Market risk in the trading book
Traded market risk is the risk of potential changes in the value of the trading book as a result of changes in market risk factors such as interest rates, equity prices, commodity prices, exchange rates, credit spreads and the underlying volatilities where derivatives are traded.
• To manage, measure and mitigate market risk, we have independent market risk management teams in our core geographies where we assume market risk.
• The focus of our trading activities is primarily on supporting client activity. Our strategic intent is that proprietary trading should be limited and that trading should be conducted largely to facilitate clients in deal execution.
• Within our trading activities, we act as principal with clients or the market. Market risk, therefore, exists where we have taken on principal positions resulting from market-making, underwriting, investments and limited proprietary trading in the foreign exchange, capital and money markets. The focus of these businesses is primarily on supporting client activity.
• Measurement techniques used to quantify market risk arising from our trading activities include sensitivity analysis, value at risk (VaR), stressed VaR (sVaR), expected shortfall (ES) and extreme value theory (EVT). Stress testing and scenario analysis are used to simulate extreme conditions to supplement these core measures.
Pages 56 to 62 in volume two.
Liquidity risk
Liquidity risk refers to the possibility that, despite being solvent, we have insufficient capacity to fund increases in assets or are unable to meet our payment obligations as they fall due, in normal and stressed conditions. This includes repaying depositors or maturing wholesale debt. This risk arises from mismatches in the timing of cash flows, and is inherent in all banking operations and can be impacted by a range of institution-specific and market-wide events.
• Each geographic entity must be self-sufficient from a funding and liquidity standpoint.
• Our banking entities in South Africa and the UK are ring-fenced from one another and are required to meet the regulatory liquidity requirements in the jurisdictions in which they operate.
• We maintain a liquidity buffer in the form of unencumbered cash, government or rated securities (typically eligible for repurchase with the central bank), and near cash well in excess of the statutory requirements as protection against unexpected disruptions in cash flows.
• The maintenance of sustainable prudent liquidity resources takes precedence over profitability.
• We target a diversified funding base, avoiding undue concentrations by investor type, maturity, market source, instrument and currency.
• Stable customer deposits must fully fund our core loan book, with little reliance therefore placed on wholesale funding.
• The group does not rely on committed funding lines for protection against unforeseen interruptions to cash flow.
• The balance sheet risk management team independently monitors key daily funding metrics and liquidity ratios to assess potential risks to the liquidity position, which further act as early warning indicators of potential normal market disruption.
• Daily liquidity stress tests are carried out.
Pages 62 to 70 in volume two.

45Investec integrated annual report 2018
Overview
of the year
(continued)
Financial review
Principal risks Key mitigating actions Further information provided
Capital risk
The risk that we do not have sufficient capital to meet regulatory requirements or that capital is inefficiently deployed across the group.
• Both the Investec Limited and Investec plc groups undertake an approach to capital management that utilises both regulatory capital as appropriate to that jurisdiction and internal capital, which is an internal risk-based assessment of capital requirements.
• The determination of target capital is driven by our risk profile, strategy and risk appetite, taking into account the regulatory and market factors applicable to the group.
• At the most fundamental level, we seek to balance our capital consumption between prudent capitalisation in the context of the group’s risk profile and optimisation of shareholder returns.
• Our internal capital framework is designed to manage and achieve this balance.
• The framework has been approved by the board and is managed by the DLC capital committee, which is responsible for oversight of the management of capital on a regulatory and an internal capital basis.
Pages 78 to 91 in volume two.
Non‑trading interest rate risk
Non-trading interest rate risk, otherwise known as interest rate risk in the banking book, arises from the impact of adverse movements in interest rates on both net interest earnings and economic value of equity.
Non-trading interest rate risk in the banking book is an inherent consequence of conducting banking activities, and arises from the provision of retail and wholesale (non-trading) banking products and services.
• The daily management of interest rate risk in the banking book is centralised within the Central Treasury function of each geographic entity and is subject to local independent risk and Asset and Liability committee (ALCO) review.
• Together with the business, the treasurer develops strategies regarding changes in the volume, composition, pricing and interest rate characteristics of assets and liabilities to mitigate the interest rate risk and ensure a high degree of net interest margin stability over an interest rate cycle. These are presented, debated and challenged in the liability product and pricing forum and the ALCO.
• Each geographic entity has its own board approved non-trading interest rate risk policy and risk appetite, which dictates that long-term (>1 year) non-trading interest rate risk is materially eliminated. Where natural hedges between banking book items do not suffice to reduce the exposure within defined limits, interest rate swaps are used to transform fixed rate assets and liabilities into variable rate items.
• Non-trading interest rate risk is measured and analysed by utilising standard tools of traditional interest rate repricing mismatch and NPV sensitivity to changes in interest rate risk factors.
Pages 70 to 73 in volume two.

46 Investec integrated annual report 2018
Overview
of the year
(continued)
Financial review
Principal risks Key mitigating actions Further information provided
Operational risk
Operational risk is defined as the potential or actual impact to the group as a result of failures relating to internal processes, people, systems or from external events. The impacts can be financial as well as non-financial such as customer detriment, reputational or regulatory consequences.
Operational risk includes key aspects such as: cyber security; information security; financial crime; technology; outsourcing and process failure; business continuity; regulatory and compliance.
• An independent Group Operational Risk Management function ensures that operational risk policies and procedures are developed and applied consistently and effectively throughout the group.
• Business unit management, supported by operational risk managers who operate at a business unit level, are responsible for embedding and implementing operational risk practices and policies.
• Ensuring that personnel are adequately skilled at both a business unit and a group level.
Pages 74 to 77 in volume two.
Reputational and strategic risk
Reputational risk is damage to our reputation, name or brand. Reputational risk is often associated with strategic decisions made and also arises as a result of other risks manifesting and not being appropriately mitigated.
• We have various policies and practices to mitigate reputational risk, including strong values that are regularly and proactively reinforced.
• Strategic and reputational risk is mitigated as much as possible through detailed processes and governance/escalation procedures from business units to the board, and from regular, clear communication with shareholders, customers and all stakeholders.
• A disclosure and public communications policy has been approved by the board.
Page 77 in volume two.

47Investec integrated annual report 2018
Overview
of the year
(continued)
Financial review
Principal risks Key mitigating actions Further information provided
Conduct risk
Conduct risk means the risk that detriment is caused to the group, its customers, its counterparties or the market, as a result of inappropriate execution of business activities.
• Investec’s approach to conduct risk is driven by our values and philosophies, ensuring that Investec operates with integrity and puts the well-being of its clients at the heart of how the business is run.
• Investec ensures that its products and services are scrutinised and regularly reviewed to identify any issues early on and to make sure they are escalated for appropriate resolution and, where necessary, remedial action.
• Investec’s conduct risk policy aims to create an environment for consumer protection and market integrity within the business, supported with the right conduct risk management framework.
• Customer and market conduct committees exist in South Africa and the UK, with the objective of ensuring that Investec maintains a client-focused and fair outcomes-based culture.
Page 78 in volume two.
Compliance, governance and regulatory risk
The risks of changing legislation, regulation, policies, voluntary codes of practice and their interpretation in the markets in which we operate can have a significant impact on the group’s operations, business prospects, costs, liquidity and capital requirements.
• Investec remains focused on complying with the highest levels of compliance to professional standards and integrity in each of our jurisdictions. Our culture is a major component of our compliance framework and is supported by robust policies, processes and talented professionals who ensure that the interests of our customers and shareholders remain at the forefront of everything we do.
• We have independent compliance functions in each of our core operating jurisdictions, which ensure that the group implements the required processes, practices and policies to adhere to applicable regulations and legislation.
• A global compliance forum exists which establishes and standardises group standards where applicable.
Pages 94 and 95 in volume two.

48 Investec integrated annual report 2018
Overview
of the year
(continued)
Financial review
Principal risks Key mitigating actions Further information provided
Legal risk
Legal risk is the risk of loss resulting from any of our rights not being fully enforceable or from our obligations not being properly performed. This includes our rights and obligations under contracts entered into with counterparties.
• A legal risk forum is constituted in each significant legal entity within the group to ensure we keep abreast of developments and changes in the nature and extent of our activities, and to benchmark our processes against best practice.
• We have a central independent in-house legal team with embedded business unit legal officers where business volumes or needs dictate.
• This is supplemented by a pre-approved panel of third party firms to be utilised where necessary.
Page 78 in volume two.
Business risk
Business risk means the risk that external market factors create income volatility.
• The risk of loss caused by income volatility is mitigated through diversification of income sources, reducing concentration of income from any one type of business or geography and maintaining a flexible cost base.
• Group strategy is directed towards generating and sustaining a diversified income base for the group.
• In the instance where income falls we retain the flexibility to reduce costs (particularly variable remuneration), thereby maintaining a competitive cost to income ratio.
Pages 34 to 39.
Environmental (including climate change), social and economic risk
The risk that our lending and investment activities give rise to unintended environmental (including climate change), social and economic consequences.
• Investec has a holistic approach to corporate responsibility, which runs beyond recognising our own footprint on the environment, includes our many corporate social investment activities and is based on a broader responsibility to our environment and society.
• Accordingly, corporate responsibility risk considerations are considered by the credit committee and investment committee when making lending or investment decisions.
• There is also oversight by the social and ethics committee (a board committee) on social and environmental issues, including climate-related impact considerations.
Pages 171 to 183 and refer to our corporate responsibility report on our website.
People risk
The risk that we may be unable to recruit, retain and motivate key personnel.
• We focus on building a strong, diverse and capable workforce by providing a workplace that stimulates and rewards distinctive performance.
• We invest significantly in a number of opportunities for developing and upskilling employees, and in leadership programmes to develop current and future leaders of the group.
• Our internal people activities involve dedicated divisions such as Human Resources (HR) and Organisation Development (OD), which serve to supplement the ongoing people focus of our individual business units.
• The Investec careers and HR teams are mandated to enable the attraction, development and retention of talent who can perform in a manner consistent with our culture and values. OD acts to strengthen the culture of the business, ensure its values are lived, build capability and contribute to the long-term sustainability of the organisation.
Pages 175 to 180 and refer to our corporate responsibility report on our website.

49Investec integrated annual report 2018
Overview
of the year
(continued)
Financial review
Emerging and other risksIn addition to the principal risks outlined above, the risks below may have the potential to impact and/or influence our principal risks and consequently the operations, financial performance, viability and prospects of the group. A number of these risks are beyond the group’s control and are considered in our capital plans, stress testing analyses and budget processes, where applicable. These emerging risks are briefly highlighted below and should be read in the context of our approach to risk management and our overall group risk appetite framework (refer to volume two of the integrated annual report).
Additional risks and uncertainties not presently known to us or that we currently deem immaterial may in the future also negatively impact our business operations.
• Macro‑economic and geopolitical risks: The group is subject to inherent risks arising from general macro-economic and geopolitical conditions in the countries in which it operates, including in particular the UK and South Africa, as well as global economic and geopolitical conditions.
A macro-economic overview is provided on pages 34 to 39, and the impact of changes in the external environment during our financial year is discussed in the respective divisional sections on pages 94, 100, 101, 113 and 114.
• Fluctuations in exchange rates could have an adverse impact on the group’s results of operations: The group’s reporting currency is Pounds Sterling. Certain of our operations are conducted by entities outside the UK. The results of operations and the financial position of individual companies are reported in the local currencies of the countries in which they are domiciled, including Rand, Australian Dollars, Euros and US Dollars. These results are then translated into Pounds Sterling at the applicable foreign currency exchange rates for inclusion in the group’s financial statements. In the case of the income statement, the weighted average rate for the relevant period is applied and, in the case of the balance sheet, the relevant closing rate is used. Exchange rates between local currencies and Pounds Sterling have fluctuated substantially over the financial year.
Further information is provided on page 28.
• The group’s borrowing costs and its access to debt capital markets depend significantly on its credit ratings: Rating agencies have, in the past, altered their ratings of all or a majority of the participants in a given industry as a result of the risks affecting that industry. A reduction in the group’s respective banking entities long- or short-term credit ratings could increase their borrowing costs, limit their access to capital markets and trigger additional collateral requirements in derivative contracts and other secured funding arrangements.
Following downgrades to the South African Sovereign credit rating in April 2017, the foreign currency credit ratings of Investec Limited and Investec Bank Limited were downgraded, as no banking entity can typically have a foreign currency rating higher than the Sovereign rating of the country in which it operates. Conversely, rating upgrades and favourable changes in outlook were received by Investec Bank plc and Investec plc during the 2018 financial year. Further information is provided on page 7 in volume two.
• The financial services industry in which the group operates is intensely competitive: The financial services industry is competitive and the group faces substantial competition in all aspects of its business. The group has developed leading positions in many of its core areas of activity, but does not take competition lightly, and our strategic objectives continue to focus on building business depth; providing the best integrated solution to our clients; and leveraging our digitisation strategy in order to remain competitive.
Refer to pages 20 to 22 for further information.
• The group may be exposed to pension risk in relation to its UK operations: Pension risk arises from obligations arising from defined benefit pension schemes where the group is required to fund any deficit in the schemes. There is one remaining defined benefit pension scheme within the group at 31 March 2018, which is closed to new business.
During the year the second defined benefit scheme entered into a buy-out, with the assets and liabilities of the scheme being transferred to a third party insurer. Members now receive their pension from the third party insurer and Investec has no remaining liability relating to this scheme. Refer to pages 77 and 78 in volume two and pages 97 to 100 in volume three for further information.
Emerging risks which have continued to unfold and develop during the year, and which are included in our stress tests include:
• The UK’s exit from the European Union: On 23 June 2016 the UK voted to leave the European Union and the formal exit process commenced on 29 March 2017 when the UK triggered Article 50. Although negotiations between the UK and the European Union are still underway, the group faces certain risks associated with the UK’s decision to exit the European Union.
For example, the UK’s vote in favour of leaving the European Union may alter the legal framework applicable to the group’s European operations, including in relation to our current branch structure in Ireland and our ability to provide certain services from London to European clients.
Investec Bank plc, Investec Asset Management UK and Investec Wealth & Investment UK have each carried out a Brexit impact assessment, identified key risks and are taking measures to mitigate them which will allow the group to service European clients once the UK leaves the EU.

50 Investec integrated annual report 2018
Overview
of the year
(continued)
Financial review
The political events that unfolded in the year under review in South Africa, and the outlook for the Sovereign’s ratings: In the fiscal year under review South Africa experienced key credit rating changes, with downgrades from investment to sub-investment grade from both Standard & Poor’s and Fitch. These downgrades occurred on the marked deterioration in both public finances and the financial health of key State Owned Entities (SOEs), as well as persistent low economic growth and weak GDP per capita. The October 2017 Medium-Term Budget drove further downgrades from Standard & Poor’s (foreign and local currency long-term ratings) on a shift away from fiscal consolidation, with business and investor sentiment becoming very negative.
The back end of 2017 saw a rally in South African domestic shares as the election of Cyril Ramaphosa as leader of the ANC led to renewed enthusiasm about the growth prospects for South Africa. There has so far been little hard evidence of a turnaround on the ground but longer-term growth forecasts have been revised up. While business confidence lifted in early 2018, it is not yet at levels that indicate a faster pace of business activity. While the chance of further credit rating downgrades has diminished notably, there is still some risk, and no credit rating upgrades are expected in the coming year.
A key risk for South Africa is the extreme deterioration in many SOEs’ finances that are guaranteed by the state, while union wage demands risk putting South Africa’s spending cuts, and so its expenditure ceiling and fiscal consolidation at risk. Should South Africa not meet the fiscal consolidation it has outlined in its 2018 Budget the risk for sovereign rating downgrades would rise substantially again.
The group runs a number of stress scenarios which consider the impact of further sovereign rating downgrades on our business.
Further information is provided on page 34.

51Investec integrated annual report 2018
Overview
of the year
(continued)
Financial review
Statutory income statement analysisThe overview that follows will highlight the main reasons for the variance in the major category line items on the face of the statutory income statement during the year under review.
Further details on the key income drivers and significant variances in the various components of our operating income, expenses and profit can be found in the description of our principal businesses on pages 88 to 114.
Total operating incomeTotal operating income before impairment losses on loans and advances increased by 6.9% to £2 443.5 million (2017: £2 286.2 million).
£’00031 March
2018% of total
income31 March
2017% of total
income % change
Net interest income 760 398 31.1% 679 895 29.7% 11.8%
Net fees and commissions income 1 361 207 55.7% 1 271 524 55.6% 7.1%
Investment income 130 048 5.3% 136 203 6.0% (4.5%)
Share of post taxation profit of associates 46 823 1.9% 18 890 0.8% 147.9%
Trading income arising from customer flow 138 226 5.7% 158 001 6.9% (12.5%)
Trading income arising from balance sheet management and other trading activities (4 307) (0.2%) 8 218 0.4% (152.4%)
Other operating income 11 115 0.5% 13 483 0.6% (17.6%)
Total operating income 2 443 510 100.0% 2 286 214 100.0% 6.9%
The following table sets out information on total operating income before impairment losses on loans and advances by geography for the year under review.
£’00031 March
2018% of total
income31 March
2017% of total
income % change
UK and Other 1 380 219 56.5% 1 306 940 57.2% 5.6%
Southern Africa 1 063 291 43.5% 979 274 42.8% 8.6%
Total operating income before impairments 2 443 510 100.0% 2 286 214 100.0% 6.9%
The following table sets out information on total operating income before impairment losses on loans and advances by division for the year under review.
£’00031 March
2018% of total
income31 March
2017% of total
income % change
Asset Management 539 678 22.1% 497 990 21.8% 8.4%
Wealth & Investment 404 797 16.6% 360 569 15.8% 12.3%
Specialist Banking 1 499 035 61.3% 1 427 655 62.4% 5.0%
Total operating income before impairments 2 443 510 100.0% 2 286 214 100.0% 6.9%

52 Investec integrated annual report 2018
Overview
of the year
(continued)
Financial review
Net interest incomeNet interest income increased by 11.8% to £760.4 million (2017: £679.9 million) driven by robust levels of lending activity across the banking businesses and further supported by a reduction in the UK’s cost of funding. This was slightly offset by the roll off of higher yielding debt securities and increased subordinated debt in South Africa.
£’00031 March
201831 March
2017 Variance % change
Asset Management 5 471 5 118 353 6.9%
Wealth & Investment 10 744 11 968 (1 224) (10.2%)
Specialist Banking 744 183 662 809 81 374 12.3%
Net interest income 760 398 679 895 80 503 11.8%
A further analysis of interest income and interest expense is provided in the tables below.
UK and Other Southern Africa Total group
For the year to 31 March 2018£’000 Notes
Balance sheet value
Interest income
Balance sheet value
Interest income
Balance sheetvalue
Interest income
Cash, near cash and bank debt and sovereign debt securities 1 6 486 676 26 413 8 025 280 425 715 14 511 956 452 128
Core loans and advances 2 9 687 224 518 070 15 444 873 1 366 945 25 132 097 1 885 015
Private client 3 785 828 161 107 10 426 762 916 099 14 212 590 1 077 206
Corporate, institutional and other clients 5 901 396 356 963 5 018 111 450 846 10 919 507 807 809
Other debt securities and other loans and advances 610 316 54 927 641 096 43 794 1 251 412 98 721
Other interest-earning assets 3 – – 17 999 55 145 17 999 55 145
Total interest‑earning assets 16 784 216 599 410 24 129 248 1 891 599 40 913 464 2 491 009
Notes:1. Comprises (as per the balance sheet) cash and balances at central banks; loans and advances to banks; non-sovereign and non-bank cash placements;
reverse repurchase agreements and cash collateral on securities borrowed; sovereign debt securities; and bank debt securities.2. Comprises (as per the balance sheet) loans and advances to customers and own originated loans and advances to customers securitised.3. Comprises (as per the balance sheet) other securitised assets. No securitised assets are held at amortised cost outside of Southern Africa.
£2 443.5 million total operating income before impairments
% of total operating income before impairments
31.1%
55.7%
5.3%
1.9%
5.7%
(0.2%)
0.5%
31 March 2018
Net interest income
Net fee and commission income
Investment income
Share of post taxation pro�t of associates
Trading income arising from customer �ow
Trading income arising from balance sheet management and other trading activities
Other operating income
£2 286.2 million total operating income before impairments
29.7%
55.6%
6.0%
0.8%
6.9%
0.4%
0.6%
31 March 2017
Net interest income
Net fee and commission income
Investment income
Share of post taxation pro�t of associates
Trading income arising from customer �ow
Trading income arising from balance sheet management and other trading activities
Other operating income

53Investec integrated annual report 2018
Overview
of the year
(continued)
Financial review
UK and Other Southern Africa Total group
For the year to 31 March 2018£’000 Notes
Balance sheet value
Interest expense
Balance sheet value
Interest expense
Balance sheetvalue
Interest expense
Deposits by banks and other debt-related securities 4 3 712 857 (92 513) 2 591 437 (123 500) 6 304 294 (216 013)
Customer accounts (deposits) 11 624 157 (113 972) 19 363 016 (1 247 509) 30 987 173 (1 361 481)
Other interest-bearing liabilities 5 – – 136 812 (24 389) 136 812 (24 389)
Subordinated liabilities 579 673 (55 345) 903 314 (73 383) 1 482 987 (128 728)
Total interest‑bearing liabilities 15 916 687 (261 830) 22 994 579 (1 468 781) 38 911 266 (1 730 611)
Net interest income 337 580 422 818 760 398
Net interest margin (local currency) 2.11% 1.84%**
UK and Other Southern Africa Total group
For the year to 31 March 2017£’000 Notes
Balance sheet value
Interest income
Balance sheet value
Interest income
Balance sheetvalue
Interest income
Cash, near cash and bank debt and sovereign debt securities 1 5 621 557 33 255 8 260 231 398 053 13 881 788 431 308
Core loans and advances 2 8 620 742 471 547 14 086 395 1 188 974 22 707 137 1 660 521
Private client 3 454 366 151 645 9 413 110 798 380 12 867 476 950 025
Corporate, institutional and other clients 5 166 376 319 902 4 673 285 390 594 9 839 661 710 496
Other debt securities and other loans and advances 735 059 58 552 735 747 58 244 1 470 806 116 796
Other interest-earning assets 3 – – 10 336 22 140 10 336 22 140
Total interest‑earning assets 14 977 358 563 354 23 092 709 1 667 411 38 070 067 2 230 765
UK and Other Southern Africa Total group
For the year to 31 March 2017£’000 Notes
Balance sheet value
Interest expense
Balance sheet value
Interest expense
Balance sheetvalue
Interest expense
Deposits by banks and other debt-related securities 4 2 708 483 (87 872) 3 104 378 (118 225) 5 812 861 (206 097)
Customer accounts (deposits) 11 012 809 (130 419) 18 096 619 (1 087 496) 29 109 428 (1 217 915)
Other interest-bearing liabilities 5 – – 90 125 (13 050) 90 125 (13 050)
Subordinated liabilities 579 356 (55 883) 823 282 (57 925) 1 402 638 (113 808)
Total interest‑bearing liabilities 14 300 648 (274 174) 22 114 404 (1 276 696) 36 415 052 (1 550 870)
Net interest income 289 180 390 715 679 895
Net interest margin (local currency) 1.96% 1.86%**
Notes:1. Comprises (as per the balance sheet) cash and balances at central banks; loans and advances to banks; non-sovereign and non-bank cash placements;
reverse repurchase agreements and cash collateral on securities borrowed; sovereign debt securities; and bank debt securities.2. Comprises (as per the balance sheet) loans and advances to customers; and own originated loans and advances to customers securitised.3. Comprises (as per the balance sheet) other securitised assets. No securitised assets are held at amortised cost outside of Southern Africa.4. Comprises (as per the balance sheet) deposits by banks; debt securities in issue; repurchase agreements and cash collateral on securities lent.5. Comprises (as per the balance sheet) liabilities arising on securitisation of own originated assets; and liabilities arising on securitisation. No liabilities on
securitisation are held at amortised cost outside of Southern Africa.** Impacted by debt funding issued by the Investec Property Fund in which the group has a 26.75% interest (2017: 27.86%). Excluding this debt funding cost,
the net interest margin amounted to 1.99% (2017: 1.99%).

54 Investec integrated annual report 2018
Overview
of the year
(continued)
Financial review
Net fee and commission incomeNet fee and commission income increased by 7.1% to £1 361.2 million (2017: £1 271.5 million) supported by higher average funds under management and strong net inflows in the Asset Management and Wealth Management businesses, as well as a good performance from the South African banking businesses.
£’00031 March
201831 March
2017 Variance % change
Asset Management 537 134 484 872 52 262 10.8%
Wealth & Investment 382 463 343 708 38 755 11.3%
Specialist Banking 441 610 442 944 (1 334) (0.3%)
Net fee and commission income 1 361 207 1 271 524 89 683 7.1%
Further information on net fees by type of fee and geography is provided in the tables below.
For the year to 31 March 2018£’000
UK and Other
SouthernAfrica
Total group
Asset management and wealth management businesses net fee and commission income 652 137 267 460 919 597
Fund management fees/fees for assets under management 743 670 232 550 976 220
Private client transactional fees 54 629 42 348 96 977
Fee and commission expense (146 162) (7 438) (153 600)
Specialist Banking net fee and commission income 197 797 243 813 441 610
Corporate and institutional transactional and advisory services 192 579 216 216 408 795
Private client transactional fees 14 757 46 698 61 455
Fee and commission expense (9 539) (19 101) (28 640)
Net fee and commission income 849 934 511 273 1 361 207
Annuity fees (net of fees payable) 662 924 439 834 1 102 758
Deal fees 187 010 71 439 258 449
For the year to 31 March 2017£’000
UK and Other
SouthernAfrica
Total group
Asset management and wealth management businesses net fee and commission income 575 931 252 649 828 580
Fund management fees/fees for assets under management 639 100 224 498 863 598
Private client transactional fees 56 955 39 400 96 355
Fee and commission expense (120 124) (11 249) (131 373)
Specialist Banking net fee and commission income 227 932 215 012 442 944
Corporate and institutional transactional and advisory services 206 407 196 246 402 653
Private client transactional fees 29 684 37 298 66 982
Fee and commission expense (8 159) (18 532) (26 691)
Net fee and commission income 803 863 467 661 1 271 524
Annuity fees (net of fees payable) 581 895 383 355 965 250
Deal fees 221 968 84 306 306 274

55Investec integrated annual report 2018
Overview
of the year
(continued)
Financial review
Investment incomeInvestment income reduced by 4.5% to £130.0 million (2017: £136.2 million) as a result of a weaker performance from the unlisted investment portfolio in South Africa as well as the group’s investments in its listed property funds.
£’00031 March
201831 March
2017 Variance % change
Asset Management (15) 143 (158) (> 100.0%)
Wealth & Investment 10 551 2 269 8 282 > 100.0%
Specialist Banking 119 512 133 791 (14 279) (10.7%)
Investment income 130 048 136 203 (6 155) (4.5%)
Further information on investment income is provided in the tables below.
For the year to 31 March 2018£’000
UK and Other
SouthernAfrica
Total group
Realised 43 504 62 120 105 624
Unrealised^ 6 435 (15 769) (9 334)
Dividend income 10 171 18 107 28 278
Funding and other net related income/(costs) 8 405 (2 925) 5 480
Investment income 68 515 61 533 130 048
For the year to 31 March 2018£’000
Investment portfolio
(listed and unlisted equities)*
Debt securities
(sovereign, bank and
other)Investment properties
Other asset categories Total
UK and Other 62 106 8 509 (86) (2 014) 68 515
Realised 38 516 5 779 (86) (705) 43 504
Unrealised^ 13 419 2 730 – (9 714) 6 435
Dividend income 10 171 – – – 10 171
Funding and other net related income – – – 8 405 8 405
Southern Africa 11 832 7 338 39 499 2 864 61 533
Realised 41 070 7 338 12 580 1 132 62 120
Unrealised^ (42 529) – 26 919 (159) (15 769)
Dividend income 17 986 – – 121 18 107
Funding and other net related (costs)/income (4 695) – – 1 770 (2 925)
Total investment income 73 938 15 847 39 413 850 130 048
* Including embedded derivatives (warrants and profit shares).^ In a year of realisation, any prior period mark-to-market gains/(losses) recognised are reversed in the unrealised line item.

56 Investec integrated annual report 2018
Overview
of the year
(continued)
Financial review
For the year to 31 March 2017£’000
UK and Other
SouthernAfrica
Total group
Realised 50 335 51 070 101 405
Unrealised^ (9 271) 6 940 (2 331)
Dividend income 12 339 18 540 30 879
Funding and other net related income/(costs) 6 572 (322) 6 250
Investment income 59 975 76 228 136 203
For the year to 31 March 2017£’000
Investment portfolio
(listed and unlisted equities)*
Debt securities
(sovereign, bank and
other)Investment properties
Other asset categories Total
UK and Other 47 786 (3 344) 8 329 7 204 59 975
Realised 38 533 (8 482) 18 337 1 947 50 335
Unrealised^ (3 086) 5 138 (10 008) (1 315) (9 271)
Dividend income 12 339 – – – 12 339
Funding and other net related income – – – 6 572 6 572
Southern Africa 21 313 8 615 44 992 1 308 76 228
Realised 20 483 6 360 22 003 2 224 51 070
Unrealised^ (13 504) 2 255 22 989 (4 800) 6 940
Dividend income 18 102 – – 438 18 540
Funding and other net related (costs)/income (3 768) – – 3 446 (322)
Total investment income 69 099 5 271 53 321 8 512 136 203
* Including embedded derivatives (warrants and profit shares).^ In a year of realisation, any prior period mark-to-market gains/(losses) recognised are reversed in the unrealised line item.
Share of post taxation profit of associates Share of post taxation profit of associates of £46.8 million (2017: £18.9 million) primarily reflects earnings in relation to the group’s investment in the IEP Group Proprietary Limited (IEP Group).
Trading incomeTrading income arising from customer flow decreased by 12.5% to £138.2 million (2017: £158.0 million) as a consequence of lower volatility, relative to the elevated levels experienced in the prior year following the Brexit vote, as well as losses incurred in South Africa on Steinhoff (refer to page 63 for additional information). Trading income from other trading activities reflected a loss of £4.3 million (2017: £8.2 million income) predominantly impacted by currency volatility over the year.
Arising from customer flow
£’00031 March
201831 March
2017 Variance % change
Wealth & Investment 537 1 028 (491) (47.8%)
Specialist Banking 137 689 156 973 (19 284) (12.3%)
Trading income arising from customer flow 138 226 158 001 (19 775) (12.5%)

57Investec integrated annual report 2018
Overview
of the year
(continued)
Financial review
Arising from balance sheet management and other trading activities
£’00031 March
201831 March
2017 Variance % change
Asset Management (5 077) 2 213 (7 290) (>100.0%)
Wealth & Investment (150) 87 (237) (>100.0%)
Specialist Banking 920 5 918 (4 998) (84.5%)
Trading income arising from balance sheet management andother trading activities (4 307) 8 218 (12 525) (>100%)
Impairment losses on loans and advancesImpairments on loans and advances increased from £111.5 million to £148.6 million, largely reflecting an increase in impairments for accelerated exits anticipated to occur on certain legacy assets. The credit loss ratio on core loans and advances amounted to 0.61% (2017: 0.54%). Since 31 March 2017 gross defaults have increased from £476.0 million to £532.7 million largely due to a few specific defaults in the UK banking business. The percentage of default loans (net of impairments but before taking collateral into account) to core loans and advances amounted to 1.17% (31 March 2017: 1.22%). The ratio of collateral to default loans (net of impairments) remains satisfactory at 1.72 times (31 March 2017: 1.63 times).
Further information is provided on page 35 in volume two.
£’00031 March
201831 March
2017 Variance % change
UK and Other (106 085) (74 956) (31 129) 41.5%
Southern Africa (42 471) (36 498) (5 973) 16.4%
Total impairment losses on loans and advances (148 556) (111 454) (37 102) 33.3%
Impairment losses on loans and advances in home currency
Southern Africa (R’million) (726) (659) (67) 10.2%
Operating costsThe cost to income ratio amounted to 66.9% (2017: 66.3%). Our cost to income ratio will remain elevated as we continue to invest in a number of growth strategies across the businesses which should yield returns in the medium term. Total operating costs grew by 7.9% to £1 635.2 million (2017: £1 515.4 million) reflecting continued investment into IT and digital initiatives and higher headcount across divisions to support increased activity and growth strategies; notably the build out of the UK private client offerings in the Specialist Banking and Wealth & Investment businesses. Cost growth in South Africa was somewhat offset by the pending acquisition of the South African head office building and the related rental provision no longer required.
£’00031 March
2018
% of total operating
costs31 March
2017
% of total operating
costs % change
Staff costs (1 191 691) 72.9% (1 079 701) 71.2% 10.4%
– fixed (773 802) 47.3% (690 161) 45.5% 12.1%
– variable (417 889) 25.6% (389 540) 25.7% 7.3%
Business expenses (190 385) 11.6% (177 057) 11.7% 7.5%
Premises expenses (excluding depreciation) (59 442) 3.7% (80 083) 5.3% (25.8%)
Equipment expenses (excluding depreciation) (93 928) 5.8% (82 928) 5.5% 13.3%
Marketing expenses (70 911) 4.3% (70 625) 4.7% 0.4%
Depreciation and impairment of property, plant, equipment and software (26 383) 1.6% (22 837) 1.5% 15.5%
Depreciation on operating leased assets (2 421) 0.1% (2 169) 0.1% 11.6%
Total operating costs (1 635 161) 100.0% (1 515 400) 100.0% 7.9%

58 Investec integrated annual report 2018
Overview
of the year
(continued)
Financial review
The following table sets out certain information on total operating costs by geography for the year under review.
£’00031 March
2018
% of total operating
costs31 March
2017
% of total operating
costs % change
UK and Other (1 076 462) 65.8% (1 007 271) 66.5% 6.9%
Southern Africa (558 699) 34.2% (508 129) 33.5% 10.0%
Total operating costs (1 635 161) 100.0% (1 515 400) 100.0% 7.9%
The following table sets out certain information on total operating costs by division for the year under review.
£’00031 March
2018
% of total operating
costs31 March
2017
% of total operating
costs % change
Asset Management (361 633) 22.1% (333 166) 22.0% 8.5%
Wealth & Investment (306 232) 18.7% (267 326) 17.6% 14.6%
Specialist Banking (917 698) 56.2% (866 132) 57.2% 6.0%
Group costs (49 598) 3.0% (48 776) 3.2% 1.7%
Total operating costs (1 635 161) 100.0% (1 515 400) 100.0% 7.9%
£1 635.2 million total operating costs
% of total operating costs
72.9%
11.6%
3.7%
5.8%
4.3%
1.6%
0.1%
31 March 2018
Staff costs
Business expenses
Premises expenses
Equipment expenses
Marketing expenses
Depreciation and impairment of property, plant, equipment and software
Depreciation on operating leased assets
£1 515.4 million total operating costs
71.2%
11.7%
5.3%
5.5%
4.7%
1.5%
0.1%
31 March 2017
Staff costs
Business expenses
Premises expenses
Equipment expenses
Marketing expenses
Depreciation and impairment of property, plant, equipment and software
Depreciation on operating leased assets

59Investec integrated annual report 2018
Overview
of the year
(continued)
Financial review
Operating profit before goodwill, acquired intangibles, non‑operating items and after other non‑controlling interests
As a result of the foregoing factors, our operating profit before goodwill, acquired intangibles, non-operating items, taxation and after other non-controlling interests increased by 1.4% from £599.1 million to £607.5 million.
The following tables set out information on operating profit before goodwill, acquired intangibles, non-operating items, taxation and after other non-controlling interests by geography and by division for the year under review.
For the year to 31 March 2018 £’000
UK and Other
Southern Africa
Totalgroup % change % of total
Asset Management 103 918 74 127 178 045 8.0% 29.3%
Wealth & Investment 69 269 29 296 98 565 5.7% 16.2%
Specialist Banking 59 958 320 535 380 493 (2.4%) 62.6%
233 145 423 958 657 103 1.4% 108.1%
Group costs (33 789) (15 809) (49 598) (1.7%) (8.1%)
Total group 199 356 408 149 607 505 1.4% 100.0%
Other non-controlling interest – equity 52 288
Operating profit 659 793
% change (11.4%) 9.1% 1.4%
% of total 32.8% 67.2% 100.0%
For the year to 31 March 2017 £’000
UK and Other
Southern Africa
Totalgroup % change % of total
Asset Management 91 262 73 562 164 824 22.3% 27.5%
Wealth & Investment 65 190 28 053 93 243 8.8% 15.6%
Specialist Banking 104 604 285 226 389 830 17.8% 65.0%
261 056 386 841 647 897 17.5% 108.1%
Group costs (36 163) (12 613) (48 776) 6.5% (8.1%)
Total group 224 893 374 228 599 121 18.5% 100.0%
Other non-controlling interest – equity 35 201
Operating profit 659 360
% of total 37.5% 62.5% 100.0%

60 Investec integrated annual report 2018
Overview
of the year
(continued)
Financial review
Key income drivers in our core businesses The information below reflects our key income drivers in our core businesses.
Asset Management
Global business (in Pounds Sterling)31 March
201831 March
201731 March
201631 March
201531 March
201431 March
201331 March
2012
Operating margin 33.0% 33.1% 32.0% 34.2% 34.7% 34.5% 35.7%
Net inflows in funds under management as a % of opening funds under management 5.6% (0.8%) 4.1% 4.6% 3.7% 6.7% 8.8%
Average income yield earned on funds under management^ 0.54% 0.58% 0.55% 0.60% 0.60% 0.62% 0.62%
Wealth & Investment
Global business (in Pounds Sterling)31 March
201831 March
201731 March
201631 March
201531 March
201431 March
201331 March
2012
Operating margin 24.3% 25.9% 26.4% 25.2% 22.9% 20.3% 19.7%
Net organic growth in funds under management as a % of opening funds under management 3.6% 2.7% 4.5% 6.6% 3.5% 2.0% (5.3%)
Average income yield earned on funds under management^ 0.73% 0.72% 0.71% 0.72% 0.71% 0.66% 0.61%
UK and Other^^ (in Pounds Sterling)
Operating margin^^ 22.0% 23.5% 24.6% 22.7% 20.1% 17.3% 16.3%
Net organic growth in funds under management as a % of opening funds under management 5.0% 4.2% 4.5% 7.1% 5.1% 1.3% (7.4%)
Average income yield earned on funds under management^ 0.87% 0.85% 0.87% 0.89% 0.89% 0.86% 0.80%
South Africa (in Rands)
Operating margin 32.3% 33.8% 33.1% 35.1% 33.9% 31.3% 28.5%
Net organic growth in discretionary funds under management as a % of opening discretionary funds under management 4.6% 8.1% 10.4% 8.5% 13.6% 13.9% 8.7%
Average income yield earned on funds under management^* 0.49% 0.47% 0.45% 0.41% 0.41% 0.37% 0.39%
* A large portion of the funds under management are non-discretionary funds.^ The average income yield on funds under management represents the total operating income for the period as a percentage of the average of opening
and closing funds under management. This calculation does not take into account the impact of market movements throughout the period on funds under management or the timing of acquisitions and disposals during the respective periods.
^^ ‘Other’ comprises the Wealth operations in Switzerland, the Republic of Ireland, the Channel Islands, and Hong Kong. Excluding ‘Other’, Investec Wealth & Investment UK has an operating margin of 23.2% (2017: 26.8%).

61Investec integrated annual report 2018
Overview
of the year
(continued)
Financial review
Specialist Banking – statutory basis
Global business (in Pounds Sterling)31 March
201831 March
201731 March
201631 March
201531 March
201431 March
201331 March
2012
Cost to income ratio 61.2%* 60.6%* 60.1%* 63.1%* 63.2%* 63.1% 62.4%
ROE post-tax^ 9.2% 10.5% 10.1% 8.6% 7.9% 6.4% 5.1%
ROE post-tax (ongoing business)^ 11.7% 12.6% 13.0% 12.8% 11.9% – –
Growth in net core loans 10.7% 25.3% 5.4% 0.2%^^ (6.8%) 1.0% (2.8%)
Growth in risk-weighted assets 5.6% 22.2% 2.2% (4.9%)^^ (6.0%) 4.7% 1.5%
Defaults (net of impairments as a % of core loans) 1.17% 1.22% 1.54% 2.07% 2.30% 2.73% 3.31%
Credit loss ratio on core loans 0.61% 0.54% 0.62% 0.68% 0.68% 0.84% 1.12%
UK and Other# (in Pounds Sterling)
Cost to income ratio 76.9%* 74.8%* 73.4%* 78.9%* 72.5%* 69.0% 68.3%
ROE post-tax^ 3.2% 7.0% 5.5% 2.1% 3.6% 1.7% (1.8%)
ROE post-tax (ongoing business)**^ 8.5% 11.5% 11.4% 9.6% 10.9% – –
Growth in net core loans 12.4% 10.5% 10.5% (14.1%)^^ (0.3%) 6.6% 0.3%
Growth in risk-weighted assets 8.2% 8.4% 6.7% (15.5%)^^ 0.4% 7.7% 4.6%
Defaults (net of impairments as a % of core loans) 2.16% 1.55% 2.19% 3.00% 3.21% 3.75% 4.10%
Credit loss ratio on core loans 1.14% 0.90% 1.13% 1.16% 0.99% 1.16% 1.65%
Southern Africa (in Rands)
Cost to income ratio 47.1%* 46.9%* 46.5%* 47.2%* 51.0%* 55.5% 55.2%
ROE post-tax^ 12.8% 12.7% 15.1% 15.2% 12.5% 10.0% 9.6%
ROE post-tax (excluding investment activities)## 14.1% 15.3% 15.2% 14.8% – – –
Growth in net core loans 8.7% 8.4% 19.7% 16.1% 10.6% 10.2% 6.6%
Growth in risk-weighted assets 3.0% 6.2% 15.1% 8.3% 11.0% 16.5% 11.9%
Defaults (net of impairments as a % of core loans) 0.56% 1.02% 1.05% 1.43% 1.46% 1.89% 2.73%
Credit loss ratio on core loans 0.28% 0.29% 0.26% 0.28% 0.42% 0.61% 0.65%
^ Divisional ROEs are reported on a pre-tax basis. For the purpose of this calculation we have applied the group’s effective tax rate in its respective geographies to derive post-tax numbers. For 31 March 2018 in South Africa we have applied a ‘normalised’ tax rate of 18%. Capital allocated to the Specialist Bank as at 31 March 2018 was c.£1.5 billion in the UK and c.R35 billion in South Africa.
^^ Impacted by sale of assets.* Excludes group costs.** Further information is provided on pages 75 and 105.# Includes UK, other non-Southern African jurisdictions and the legacy businesses.## Refer to pages 109 and 110 for further information on the group’s investment activities in South Africa.
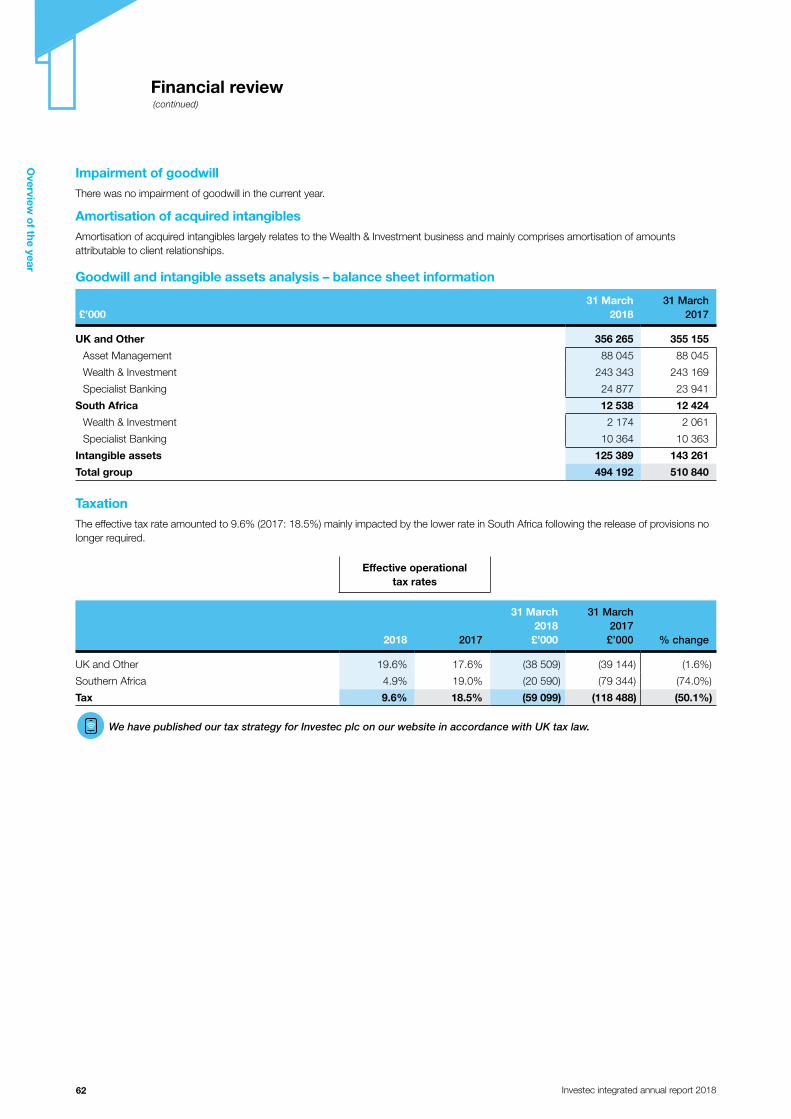
62 Investec integrated annual report 2018
Overview
of the year
(continued)
Financial review
Impairment of goodwillThere was no impairment of goodwill in the current year.
Amortisation of acquired intangiblesAmortisation of acquired intangibles largely relates to the Wealth & Investment business and mainly comprises amortisation of amounts attributable to client relationships.
Goodwill and intangible assets analysis – balance sheet information
£’00031 March
201831 March
2017
UK and Other 356 265 355 155
Asset Management 88 045 88 045
Wealth & Investment 243 343 243 169
Specialist Banking 24 877 23 941
South Africa 12 538 12 424
Wealth & Investment 2 174 2 061
Specialist Banking 10 364 10 363
Intangible assets 125 389 143 261
Total group 494 192 510 840
TaxationThe effective tax rate amounted to 9.6% (2017: 18.5%) mainly impacted by the lower rate in South Africa following the release of provisions no longer required.
Effective operational tax rates
2018 2017
31 March 2018 £’000
31 March 2017 £’000 % change
UK and Other 19.6% 17.6% (38 509) (39 144) (1.6%)
Southern Africa 4.9% 19.0% (20 590) (79 344) (74.0%)
Tax 9.6% 18.5% (59 099) (118 488) (50.1%)
We have published our tax strategy for Investec plc on our website in accordance with UK tax law.

63Investec integrated annual report 2018
Overview
of the year
(continued)
Financial review
Profit attributable to non‑controlling interestsProfit attributable to non-controlling interests mainly comprises:
• £23.8 million profit attributable to non-controlling interests in the Asset Management business (2017: £20.3 million)
• £52.6 million profit attributable to non-controlling interests in the Investec Property Fund Limited (2017: £59.9 million).
Earnings attributable to shareholdersAs a result of the foregoing factors, earnings attributable to shareholders increased from £442.5 million to £505.5 million.
Dividends and earnings per share
Information with respect to dividends and earnings per share is provided on pages 61 to 63 in volume three.
Statutory balance sheet analysisSince 31 March 2017:• Total equity increased by 12.9% to £5.4 billion largely due to an increase in retained earnings and the issuance of Additional Tier 1
securities during the year.
• Net asset value per share increased 5.0% to 452.5 pence and net tangible asset value per share (which excludes goodwill and intangible assets) increased by 6.5% to 401.5 pence.
• The return on adjusted average shareholders’ equity decreased from 12.5% to 12.1%.
Assets by geography
£57 617 million total assets
35.7%
64.3%
31 March 2018
UK and Other
Southern Africa
£53 535 million total assets
34.8%
65.2%
31 March 2017
UK and Other
Southern Africa
Additional informationOn 11 December 2017 the group released an announcement on the Johannesburg Stock Exchange in relation to its exposures to Steinhoff International Holdings NV (Steinhoff), its subsidiaries and related entities. Trading and investment losses incurred in respect of these exposures amounted to R220 million (approximately £13 million) in the current financial year, less than the estimate referred to in the December announcement. As noted in that announcement Investec has credit exposures largely to Steinhoff Africa Holdings Proprietary Limited subsidiaries and Steinhoff Africa Retail Limited, which represent a small portion of the group’s balance sheet. Based on the information currently available to the group, Investec is not expecting to suffer any losses on these exposures.

64 Investec integrated annual report 2018
Overview
of the year
(continued)
Financial review
Statutory net tangible asset value per share The group’s net tangible asset value per share is reflected in the table below.
£’00031 March
201831 March
2017
Shareholders’ equity 4 442 094 4 131 093
Less: perpetual preference shares issued by holding companies (216 343) (214 645)
Less: goodwill and intangible assets (excluding software) (475 922) (490 841)
Net tangible asset value 3 749 829 3 425 607
Number of shares in issue (million) 980.6 958.3
Treasury shares (million) (46.7) (49.7)
Number of shares in issue in this calculation (million) 933.9 908.6
Net tangible asset value per share (pence) 401.5 377.0
Net asset value per share (pence) 452.5 431.0
Statutory return on risk‑weighted assets The group’s return on risk-weighted assets is reflected in the table below.
31 March2018
31 March2017 Average
31 March2016 Average
Adjusted earnings attributable to ordinary shareholders before goodwill, acquired intangibles
and non‑operating items (£’000) 491 062 434 504 359 732
Investec plc risk-weighted assets (£’million) 14 411 13 312 13 862 12 297 12 805
Investec Limited risk-weighted assets^ (£’million) 20 366 19 667 20 016 14 626 17 146
Total risk‑weighted assets (£’million) 34 777 32 979 33 878 26 923 29 951
Return on average risk‑weighted assets 1.45% 1.45% 1.34%
^Investec Limited risk‑weighted assets (R’million) 338 484 329 808 334 146 309 052 319 430

65Investec integrated annual report 2018
Overview
of the year
(continued)
Financial review
Capital management and allocationWe hold capital in excess of regulatory requirements targeting a minimum common equity tier 1 capital ratio of 10% and a total capital adequacy ratio range of 14% – 17% on a consolidated basis for each of Investec plc and Investec Limited.
Further information is provided on pages 78 to 91 in volume two.
A summary of capital adequacy and leverage ratios
As at 31 March 2018Investec
plcº* IBPº*Investec
Limited*^ IBL*^
Common equity tier 1 (as reported) 11.0% 11.9% 10.2% 10.9%
Common equity tier 1 (‘fully loaded’)^^ 11.0% 11.9% 10.2% 10.9%
Tier 1 (as reported) 12.9% 13.4% 11.0% 11.2%
Total capital adequacy ratio (as reported) 15.4% 16.6% 14.6% 15.5%
Leverage ratio** – current 8.5% 8.6% 7.5%# 7.7%#
Leverage ratio** – ‘fully loaded’^^ 8.4% 8.6% 7.1%# 7.5%#
As at 31 March 2017Investec
plcº* IBPº*Investec
Limited*^ IBL*^
Common equity tier 1 (as reported) 11.3% 12.5% 9.9% 10.8%
Common equity tier 1 (‘fully loaded’)^^ 11.3% 12.5% 9.9% 10.8%
Tier 1 (as reported) 11.5% 12.5% 10.7% 11.1%
Total capital adequacy ratio (as reported) 15.1% 16.9% 14.1% 15.4%
Leverage ratio** – current 7.8% 8.2% 7.3%# 7.6%#
Leverage ratio** – ‘fully loaded’^^ 7.7% 8.2% 6.8%# 7.4%#
* Where: IBP is Investec Bank plc consolidated and IBL is Investec Bank Limited. The information for Investec plc includes the information for IBP. The information for Investec Limited includes the information for IBL.
** The leverage ratios are calculated on an end-quarter basis.º The capital adequacy disclosures follow Investec’s normal basis of presentation so as to show a consistent basis of calculation across the jurisdictions
in which the group operates. For Investec plc and IBP this does not include the deduction of foreseeable charges and dividends when calculating CET 1 capital as required under the Capital Requirements Regulation and European Banking Authority technical standards. The impact of this deduction totalling £65 million (31 March 2017: £60 million) for Investec plc and £18 million (31 March 2017: £34 million) for IBP would lower the CET 1 ratio by 45bps (31 March 2017: 45bps) and 13bps (31 March 2017: 28bps) respectively.
^ Investec Limited’s and IBL’s capital information includes unappropriated profits. If unappropriated profits are excluded from capital information, Investec Limited’s and IBL’s common equity tier 1 ratio would be 25bps and 13bps lower, respectively. At 31 March 2017, Investec Limited’s and IBL’s common equity tier 1 ratio would be 24bps and 13bps lower.
^^ The key difference between the ‘reported’ basis at 31 March 2018 and the ‘fully loaded’ basis is primarily relating to capital instruments that previously qualified as regulatory capital, but do not fully qualify under the CRD IV rules/South African Prudential Authority. These instruments continue to be recognised on a reducing basis in the ‘reported’ figures until 2022.
# Based on revised BIS rules.

66 Investec integrated annual report 2018
Overview
of the year
(continued)
Financial review
Return on equity by country and business – statutory
£’00031 March
201831 March
2017 Average31 March
2016 Average
Calculation of average shareholders’ equity
Ordinary shareholders’ equity 4 225 751 3 916 448 4 071 100 3 060 029 3 488 239
Goodwill and intangible assets (excluding software) (475 922) (490 841) (483 382) (503 996) (497 419)
Adjusted tangible shareholders’ equity 3 749 829 3 425 607 3 587 718 2 556 033 2 990 820
£’00031 March
201831 March
2017
Operating profit* 659 793 659 360
Non-controlling interests (76 105) (80 530)
Accrued preference dividends, adjusted for currency hedge (33 527) (25 838)
Revised operating profit 550 161 552 992
Taxation on operating profit before goodwill and acquired intangibles (59 099) (118 488)
Adjusted attributable earnings to ordinary shareholders* 491 062 434 504
Pre-tax return on average adjusted shareholders’ equity 13.5% 15.9%
Post-tax return on average adjusted shareholders’ equity 12.1% 12.5%
Pre-tax return on average adjusted tangible shareholders’ equity 15.3% 18.5%
Post-tax return on average adjusted tangible shareholders’ equity 13.7% 14.5%
Return on equity on an ongoing basis is provided on page 82.
* Before goodwill, acquired intangibles and non-operating items.

67Investec integrated annual report 2018
Overview
of the year
(continued)
Financial review
Return on equity by geography
£’000UK and
OtherSouthern
AfricaTotal
group
UK and Other
ongoing
Total operating profit 197 672 462 121 659 793 291 174
Tax on profit on ordinary activities (38 509) (20 590) (59 099) (56 858)
Non-controlling interests (13 079) (63 026) (76 105) (13 079)
Preference dividends paid (7 129) (26 398) (33 527) (7 129)
Profit on ordinary activities after taxation – 31 March 2018 138 955 352 107 491 062 214 108
Profit on ordinary activities after taxation – 31 March 2017 173 503 261 001 434 504 226 145
Ordinary shareholders’ equity – 31 March 2018 2 050 127 2 175 624 4 225 751 2 002 909
Goodwill and intangible assets (excluding software) (447 135) (28 787) (475 922) (447 135)
Tangible ordinary shareholders’ equity – 31 March 2018 1 602 992 2 146 837 3 749 829 1 555 774
Ordinary shareholders’ equity – 31 March 2017 1 991 697 1 924 751 3 916 448 1 934 784
Goodwill and intangible assets (excluding software) (459 245) (31 596) (490 841) (459 245)
Tangible ordinary shareholders’ equity – 31 March 2017 1 532 452 1 893 155 3 425 607 1 475 539
Average ordinary shareholders’ equity – 31 March 2018 2 020 912 2 050 188 4 071 100 1 968 847
Average tangible shareholders’ equity – 31 March 2018 1 567 722 2 019 996 3 587 718 1 515 657
Post‑tax return on average ordinary shareholders’ equity– 31 March 2018 6.9% 17.2% 12.1% 10.9%
Post-tax return on average ordinary shareholders’ equity – 31 March 2017 9.4% 16.0% 12.5% 12.6%
Post‑tax return on adjusted tangible shareholders’ equity – 31 March 2018 8.9% 17.4% 13.7% 14.1%
Post-tax return on adjusted tangible shareholders’ equity – 31 March 2017 12.5% 16.3% 14.5% 17.1%
Pre‑tax return on adjusted average ordinary shareholders’ equity– 31 March 2018 8.8% 18.2% 13.5% 13.8%
Pre-tax return on adjusted average ordinary shareholders’ equity – 31 March 2017 11.5% 20.8% 15.9% 15.5%
Pre‑tax return on average tangible ordinary shareholders’ equity – 31 March 2018 11.3% 18.5% 15.3% 17.9%
Pre-tax return on average tangible ordinary shareholders’ equity – 31 March 2017 15.3% 21.2% 18.5% 20.9%

68 Investec integrated annual report 2018
Overview
of the year
(continued)
Financial review
Return on equity by business*
£’000 Asset
Management Wealth &
Investment^ Specialist
Banking
Specialist Banking
ongoing**
Operating profit# 178 045 98 565 380 493 473 995
Notional return on regulatory capital 3 174 1 889 (5 063) (5 063)
Notional cost of statutory capital (3 442) (4 542) 7 984 7 984
Cost of subordinated debt (1 403) (1 147) 2 550 2 550
Cost of preference shares (790) (595) (32 142) (32 142)
Adjusted earnings – 31 March 2018 175 584 94 170 353 822 447 324
Adjusted earnings – 31 March 2017 162 399 88 734 370 917 435 509
Ordinary shareholders’ equity – 31 March 2018 199 416 235 181 3 632 104 3 584 886
Goodwill and intangible assets (excluding software) (88 045) (179 223) (49 604) (49 604)
Tangible ordinary shareholders’ equity – 31 March 2018 111 371 55 958 3 582 500 3 535 282
Ordinary shareholders’ equity – 31 March 2017 186 423 251 523 3 319 452 3 262 539
Goodwill and intangible assets (excluding software) (88 059) (191 707) (52 025) (52 025)
Tangible ordinary shareholders’ equity – 31 March 2017 98 364 59 816 3 267 427 3 210 514
Ordinary shareholders’ equity – 31 March 2016 171 629 246 302 2 483 048 2 413 028
Goodwill and intangible assets (excluding software) (89 194) (203 534) (52 220) (52 220)
Tangible ordinary shareholders’ equity – 31 March 2016 82 435 42 768 2 430 828 2 360 808
Average ordinary shareholders’ equity – 31 March 2018 192 920 243 352 3 475 777 3 423 712
Average ordinary shareholders’ equity – 31 March 2017 179 026 248 913 2 901 249 2 837 783
Average tangible shareholders’ equity – 31 March 2018 104 868 57 887 3 424 963 3 372 897
Average tangible shareholders’ equity – 31 March 2017 90 400 51 292 2 849 127 2 785 660
Pre‑tax return on adjusted average ordinary shareholders’ equity – 31 March 2018 91.0% 38.7% 10.2% 13.1%
Pre-tax return on adjusted average ordinary shareholders’ equity – 31 March 2017 90.7% 35.7% 12.8% 15.3%
Pre‑tax return on average tangible ordinary shareholders’ equity – 31 March 2018 167.4% 162.7% 10.3% 13.3%
Pre-tax return on average tangible ordinary shareholders’ equity – 31 March 2017 179.6% 173.0% 13.0% 15.6%
* The return on equity by business is based on the level of internal capital required by each business, inclusive of an allocation of any surplus capital held by the group. The operating profit is adjusted to reflect a capital structure that includes common equity, Additional Tier 1 capital instruments and subordinated debt.
^ Wealth & Investment is consistent with the group computation, except for an adjustment of £159.1 million between ordinary shareholders’ funds and goodwill, which represents historical accounting gains with a corresponding effective increase in goodwill and intangible assets. These gains were excluded from group adjusted earnings.
** Excluding the remaining UK legacy business as shown on page 85.# Before goodwill, acquired intangibles, non-operating items and after other non-controlling interests.

69Investec integrated annual report 2018
Overview
of the year
(continued)
Financial review
Number of employees
By division – permanent employees31 March
201831 March
2017
Asset Management
UK and international 497 478
Southern Africa^ 1 024 1 072
Total 1 521 1 550
Wealth & Investment
UK and Other 1 345 1 279
South Africa 340 321
Total 1 685 1 600
Specialist Banking
UK and Other 2 320 2 169
Southern Africa 3 918 3 710
Total 6 238 5 879
Total number of permanent employees 9 444 9 029
^ Includes Silica employees, its third party administration business.
By geography31 March
201831 March
201731 March
201631 March
201531 March
201431 March
2013
UK and Other 4 162 3 926 3 701 3 560 3 671 3 827
Southern Africa 5 282 5 103 4 720 4 199 3 986 3 748
Temporary employees and contractors 702 687 545 495 601 576
Total number of employees 10 146 9 716 8 966 8 254 8 258 8 151

70 Investec integrated annual report 2018
Overview
of the year
(continued)
Financial review
Statutory operating profit (before goodwill, acquired intangibles, non‑operating items, taxation and after other non‑controlling interests) per employeeOperating profit increased 1.4% to £607.5 million (2017: £599.1 million). Refer to the statutory income statement analysis on pages 51 to 63 for further information. Average headcount increased across divisions by 6.3% to 9 931 (2017: 9 341) to support increased activity and growth strategies; notably the build out of the UK private client offerings in the Specialist Banking and Wealth & Investment businesses.
By divisionAsset
ManagementWealth &
InvestmentSpecialist Banking
Number of employees – 31 March 2018 1 592 1 821 6 733
Number of employees – 31 March 2017 1 654 1 697 6 365
Number of employees – 31 March 2016 1 543 1 597 5 826
Average employees – year to 31 March 2018 1 623 1 759 6 549
Average employees – year to 31 March 2017 1 598 1 647 6 096
Operating profit* – year to 31 March 2018 (£'000) 178 045 98 565 380 493
Operating profit* – year to 31 March 2017 (£'000) 164 824 93 243 389 830
Operating profit per employee^ – year to 31 March 2018 (£’000) 109.7^^ 56.0 58.1
Operating profit per employee^ – year to 31 March 2017 (£’000) 103.1^^ 56.6 63.9
* Operating profit excluding group costs ^ Based on average number of employees over the year.^^ For Asset Management, operating profit per employee includes Silica, its third party administration business.
By geographyUK and
OtherSouthern
AfricaTotal
group
Number of employees – 31 March 2018 4 472 5 674 10 146
Number of employees – 31 March 2017 4 165 5 551 9 716
Number of employees – 31 March 2016 3 869 5 097 8 966
Average employees – year to 31 March 2018 4 318 5 613 9 931
Average employees – year to 31 March 2017 4 017 5 324 9 341
Operating profit – year to 31 March 2018 (£’000) 199 356 408 149 607 505
Operating profit – year to 31 March 2017 (£’000) 224 893 374 228 599 121
Operating profit per employee^ – year to 31 March 2018 46.2 72.7 61.2
Operating profit per employee^ – year to 31 March 2017 (£’000) 56.0 70.3 64.1
* Operating profit excluding group costs. ^ Based on average number of employees over the year.

71Investec integrated annual report 2018
Overview
of the year
(continued)
Financial review
Total third party assets under management
£’million31 March
201831 March
2017
Asset Management 103 862 95 287
UK and Other 69 371 61 379
Southern Africa 34 491 33 908
Wealth & Investment 56 048 54 773
UK and Other 36 923 35 555
Southern Africa 19 125 19 218
Specialist Banking 666 675
UK and Other 353 386
Southern Africa 313 289
160 576 150 735
A further analysis of third party assets under management
At 31 March 2018£’million
UK and Other
Southern Africa Total
Asset Management 69 371 34 491 103 862
Mutual funds 29 615 15 126 44 741
Segregated mandates 39 756 19 365 59 121
Wealth & Investment 36 923 19 125 56 048
Discretionary 28 638 6 936 35 574
Non-discretionary 8 285 12 189 20 474
Specialist Banking 353 313 666
106 647 53 929 160 576
At 31 March 2017£’million
UK and Other
Southern Africa Total
Asset Management 61 379 33 908 95 287
Mutual funds 23 399 15 848 39 247
Segregated mandates 37 980 18 060 56 040
Wealth & Investment 35 555 19 218 54 773
Discretionary 26 336 6 552 32 888
Non-discretionary 9 219 12 666 21 885
Specialist Banking 386 289 675
97 320 53 415 150 735

72 Investec integrated annual report 2018
Overview
of the year
(continued)
Financial review
Overview of our ongoing resultsIn order to present a more meaningful view of the group’s performance, additional management information is presented on the group’s ongoing businesses. This information is set out on pages 72 to 84.
The additional information presented on an ongoing basis excludes items that in management’s view could distort the comparison of performance between periods. Based on this principle, the remaining legacy business in the UK (as set out on page 85) has been excluded from underlying statutory profit to derive the group’s ongoing operating profit.
This basis of presentation is consistent with the approach adopted for the year ended 31 March 2017.
A reconciliation between the statutory and ongoing income statement is provided on pages 73 and 74.
All information in our annual report is based on our statutory accounts unless otherwise indicated.
Results in Pounds Sterling Results in Rand
Year to31 March
2018
Year to31 March
2017%
change
Year to31 March
2018
Year to31 March
2017%
change
Operating profit before taxation* (million) £701.0 £663.7 5.6% R12 022 R12 075 (0.4%)
Adjusted earnings attributable to shareholders** (million) £566.2 £487.1 16.2% R9 689 R8 849 9.5%
Adjusted earnings per share** 61.3p 54.1p 13.3% 1 049c 983c 6.7%
* Before goodwill, acquired intangibles, non-operating items and after other non-controlling interests.** Before goodwill, acquired intangibles, non-operating items and after non-controlling interests.
Consolidated summarised ongoing income statement
For the year to £’000
31 March 2018
31 March 2017 Variance % change
Net interest income 760 101 680 539 79 562 11.7%
Net fee and commission income 1 361 214 1 271 591 89 623 7.0%
Investment income 129 722 135 631 (5 909) (4.4%)
Share of post taxation profit of associates 46 823 18 890 27 933 >100%
Trading income arising from
– customer flow 138 244 158 006 (19 762) (12.5%)
– balance sheet management and other trading activities (4 326) 8 078 (12 404) (>100%)
Other operating income 11 038 13 158 (2 120) (16.1%)
Total operating income before impairment losses on loans and advances 2 442 816 2 285 893 156 923 6.9%
Impairment losses on loans and advances (63 890) (57 149) (6 741) 11.8%
Operating income 2 378 926 2 228 744 150 182 6.7%
Operating costs (1 623 210) (1 502 623) (120 587) 8.0%
Depreciation on operating leased assets (2 421) (2 169) (252) 11.6%
Operating profit before goodwill, acquired intangibles and non‑operating items 753 295 723 952 29 343 4.1%
Profit attributable to other non-controlling interests (52 288) (60 239) 7 951 (13.2%)
Profit attributable to Asset Management non-controlling interests (23 817) (20 291) (3 526) 17.4%
Operating profit before taxation 677 190 643 422 33 768 5.2%
Taxation (77 448) (130 438) 52 990 (40.6%)
Preference dividends accrued (33 527) (25 838) (7 689) 29.8%
Adjusted attributable earnings to ordinary shareholders 566 215 487 146 79 069 16.2%
Adjusted earnings per share (pence) 61.3 54.1 13.3%
Number of weighted average shares (million) 923.5 900.4
Cost to income ratio 66.5% 65.8%

73Investec integrated annual report 2018
Overview
of the year
(continued)
Financial review
Reconciliation from statutory summarised income statement to ongoing summarised income statement
Removal of:
For the year to 31 March 2018 £’000
Statutory as
disclosed^UK legacy business
Ongoing business
Net interest income/(expense) 760 398 297 760 101
Net fee and commission income/(expense) 1 361 207 (7) 1 361 214
Investment income 130 048 326 129 722
Share of post taxation profit of associates 46 823 – 46 823
Trading income/(losses) arising from
– customer flow 138 226 (18) 138 244
– balance sheet management and other trading activities (4 307) 19 (4 326)
Other operating income 11 115 77 11 038
Total operating income before impairment losses on loans and advances 2 443 510 694 2 442 816
Impairment losses on loans and advances (148 556) (84 666) (63 890)
Operating income/(loss) 2 294 954 (83 972) 2 378 926
Operating costs (1 632 740) (9 530) (1 623 210)
Depreciation on operating leased assets (2 421) – (2 421)
Operating profit/(loss) before goodwill, acquired intangibles and non‑operating items 659 793 (93 502) 753 295
Profit attributable to other non-controlling interests (52 288) – (52 288)
Profit attributable to Asset Management non-controlling interests (23 817) – (23 817)
Operating profit/(loss) before taxation 583 688 (93 502) 677 190
Taxation (59 099) 18 349* (77 448)
Preference dividends accrued (33 527) – (33 527)
Adjusted attributable earnings to ordinary shareholders 491 062 (75 153) 566 215
Adjusted earnings per share (pence) 53.2 61.3
Number of weighted average shares (million) 923.5 923.5
Cost to income ratio 66.9% 66.5%
* Applying the UK’s effective taxation rate of 19.6%.^ Refer to page 26 in volume three.

74 Investec integrated annual report 2018
Overview
of the year
(continued)
Financial review
Reconciliation from statutory summarised income statement to ongoing summarised income statement
Removal of:
For the year to 31 March 2017 £’000
Statutory as
disclosed^UK legacy business
Ongoing business
Net interest income/(expense) 679 895 (644) 680 539
Net fee and commission income/(expense) 1 271 524 (67) 1 271 591
Investment income 136 203 572 135 631
Share of post taxation profit of associates 18 890 – 18 890
Trading income/(losses) arising from
– customer flow 158 001 (5) 158 006
– balance sheet management and other trading activities 8 218 140 8 078
Other operating income 13 483 325 13 158
Total operating income before impairment losses on loans and advances 2 286 214 321 2 285 893
Impairment losses on loans and advances (111 454) (54 305) (57 149)
Operating income/(loss) 2 174 760 (53 984) 2 228 744
Operating costs (1 513 231) (10 608) (1 502 623)
Depreciation on operating leased assets (2 169) – (2 169)
Operating profit/(loss) before goodwill, acquired intangibles and non‑operating items 659 360 (64 592) 723 952
Profit attributable to other non-controlling interests (60 239) – (60 239)
Profit attributable to Asset Management non-controlling interests (20 291) – (20 291)
Operating profit/(loss) before taxation 578 830 (64 592) 643 422
Taxation (118 488) 11 950* (130 438)
Preference dividends accrued (25 838) – (25 838)
Adjusted attributable earnings to ordinary shareholders 434 504 (52 642) 487 146
Adjusted earnings per share (pence) 48.3 54.1
Number of weighted average shares (million) 900.4 900.4
Cost to income ratio 66.3% 65.8%
* Applying the group’s effective taxation rate of 18.5%.^ Refer to page 26 in volume three.
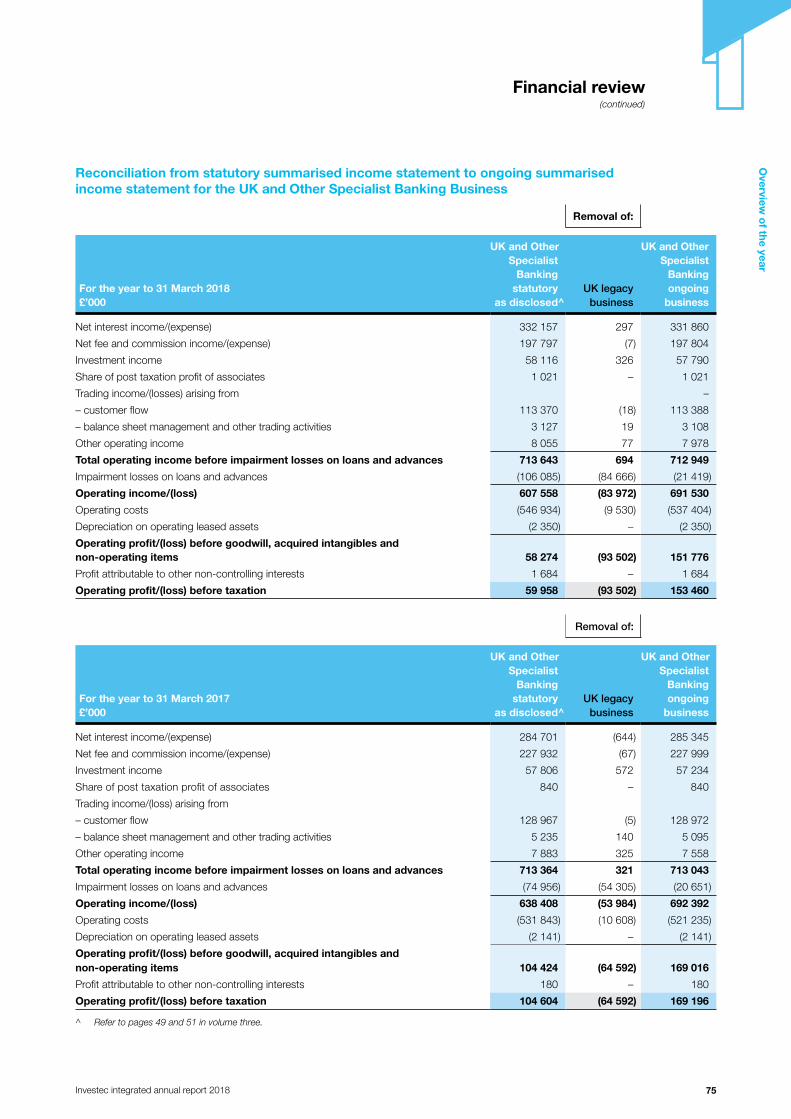
75Investec integrated annual report 2018
Overview
of the year
(continued)
Financial review
Reconciliation from statutory summarised income statement to ongoing summarised income statement for the UK and Other Specialist Banking Business
Removal of:
For the year to 31 March 2018 £’000
UK and OtherSpecialist
Banking statutory
as disclosed^UK legacy
business
UK and OtherSpecialist Bankingongoing
business
Net interest income/(expense) 332 157 297 331 860
Net fee and commission income/(expense) 197 797 (7) 197 804
Investment income 58 116 326 57 790
Share of post taxation profit of associates 1 021 – 1 021
Trading income/(losses) arising from –
– customer flow 113 370 (18) 113 388
– balance sheet management and other trading activities 3 127 19 3 108
Other operating income 8 055 77 7 978
Total operating income before impairment losses on loans and advances 713 643 694 712 949
Impairment losses on loans and advances (106 085) (84 666) (21 419)
Operating income/(loss) 607 558 (83 972) 691 530
Operating costs (546 934) (9 530) (537 404)
Depreciation on operating leased assets (2 350) – (2 350)
Operating profit/(loss) before goodwill, acquired intangibles and non‑operating items 58 274 (93 502) 151 776
Profit attributable to other non-controlling interests 1 684 – 1 684
Operating profit/(loss) before taxation 59 958 (93 502) 153 460
Removal of:
For the year to 31 March 2017 £’000
UK and OtherSpecialist
Banking statutory
as disclosed^UK legacy
business
UK and OtherSpecialist Bankingongoing
business
Net interest income/(expense) 284 701 (644) 285 345
Net fee and commission income/(expense) 227 932 (67) 227 999
Investment income 57 806 572 57 234
Share of post taxation profit of associates 840 – 840
Trading income/(loss) arising from
– customer flow 128 967 (5) 128 972
– balance sheet management and other trading activities 5 235 140 5 095
Other operating income 7 883 325 7 558
Total operating income before impairment losses on loans and advances 713 364 321 713 043
Impairment losses on loans and advances (74 956) (54 305) (20 651)
Operating income/(loss) 638 408 (53 984) 692 392
Operating costs (531 843) (10 608) (521 235)
Depreciation on operating leased assets (2 141) – (2 141)
Operating profit/(loss) before goodwill, acquired intangibles andnon‑operating items 104 424 (64 592) 169 016
Profit attributable to other non-controlling interests 180 – 180
Operating profit/(loss) before taxation 104 604 (64 592) 169 196
^ Refer to pages 49 and 51 in volume three.

76 Investec integrated annual report 2018
Overview
of the year
(continued)
Financial review
Segmental geographical and business analysis of operating profit before goodwill, acquired intangibles, non‑operating items, taxation and after other non‑controlling interests – ongoing business
For the year to 31 March 2018 £’000
UK and Other
Southern Africa
Total group
% change
% of total
Asset Management 103 918 74 127 178 045 8.0% 25.4%
Wealth & Investment 69 269 29 296 98 565 5.7% 14.1%
Specialist Banking 153 460 320 535 473 995 4.3% 67.6%
326 647 423 958 750 605 5.3% 107.1%
Group costs (33 789) (15 809) (49 598) 1.7% (7.1%)
Total group 292 858 408 149 701 007 5.6% 100.0%
Other non-controlling interest – equity 52 288
Operating profit 753 295
% change 1.2% 9.1% 5.6%
% of total 41.8% 58.2% 100.0%
For the year to 31 March 2017 £’000
UK and Other
Southern Africa
Total group
% change
% of total
Asset Management 91 262 73 562 164 824 22.3% 24.8%
Wealth & Investment 65 190 28 053 93 243 8.8% 14.0%
Specialist Banking 169 196 285 226 454 422 11.0% 68.5%
325 648 386 841 712 489 13.1% 107.3%
Group costs (36 163) (12 613) (48 776) 6.5% (7.3%)
Total group 289 485 374 228 663 713 13.7% 100.0%
Other non-controlling interest – equity 60 239
Operating profit 723 952
% of total 43.6% 56.4% 100.0%
A reconciliation of the UK and Other Specialist Banking’s operating profit: ongoing vs statutory basis
£’00031 March
201831 March
2017 % change
Total ongoing UK and Other Specialist Banking per above 153 460 169 196 (9.3%)
UK legacy remaining (93 502) (64 592) (44.8%)
Total UK and Other Specialist Banking per statutory accounts 59 958 104 604 (42.7%)

77Investec integrated annual report 2018
Overview
of the year
(continued)
Financial review
Ongoing segmental geographic analysis – summarised income statement
31 March 2018 31 March 2017
For the year to£’000
UK andOther
Southern Africa Total
UK andOther
Southern Africa Total
Net interest income 337 283 422 818 760 101 289 824 390 715 680 539
Net fee and commission income 849 941 511 273 1 361 214 803 930 467 661 1 271 591
Investment income 68 189 61 533 129 722 59 403 76 228 135 631
Share of post taxation profit of associates 1 436 45 387 46 823 2 349 16 541 18 890
Trading income/(loss) arising from
– customer flow 114 420 23 824 138 244 129 712 28 294 158 006
– balance sheet management and other trading activities (2 088) (2 238) (4 326) 8 531 (453) 8 078
Other operating income 10 344 694 11 038 12 870 288 13 158
Total operating income before impairment losses on loans and advances 1 379 525 1 063 291 2 442 816 1 306 619 979 274 2 285 893
Impairment losses on loans and advances (21 419) (42 471) (63 890) (20 651) (36 498) (57 149)
Operating income 1 358 106 1 020 820 2 378 926 1 285 968 942 776 2 228 744
Operating costs (1 064 582) (558 628) (1 623 210) (994 522) (508 101) (1 502 623)
Depreciation on operating leased assets (2 350) (71) (2 421) (2 141) (28) (2 169)
Operating profit before goodwill, acquired intangibles and non‑operating items 291 174 462 121 753 295 289 305 434 647 723 952
(Profit)/loss attributable to other non-controlling interests 1 684 (53 972) (52 288) 180 (60 419) (60 239)
Operating profit before goodwill, acquired intangibles and non‑operating items and after other non‑controlling interests 292 858 408 149 701 007 289 485 374 228 663 713
Profit attributable to Asset Management non-controlling interests (14 763) (9 054) (23 817) (11 807) (8 484) (20 291)
Operating profit before goodwill, acquired intangibles and non‑operating items and after non‑controlling
interests 278 095 399 095 677 190 277 678 365 744 643 422
Cost to income ratio 77.3% 52.5% 66.5% 76.2% 51.9% 65.8%

78 Investec integrated annual report 2018
Overview
of the year
(continued)
Financial review
Ongoing segmental business and geographic analysis – summarised income statement
Asset Management Wealth & Investment Specialist Banking Group costs
For the year to 31 March 2018£’000
UK andOther
Southern Africa Total
UK andOther
Southern Africa Total
UK andOther
Southern Africa Total
UK and Other
Southern Africa Total
Totalgroup
Net interest income 242 5 229 5 471 5 181 5 563 10 744 331 860 412 026 743 886 – – – 760 101
Net fee and commission income 355 230 181 904 537 134 296 907 85 556 382 463 197 804 243 813 441 617 – – – 1 361 214
Investment income (47) 32 (15) 10 446 105 10 551 57 790 61 396 119 186 – – – 129 722
Share of post taxation profit of associates – – – 415 1 416 1 021 45 386 46 407 – – – 46 823
Trading income/(loss) arising from
– customer flow – – – 1 032 (495) 537 113 388 24 319 137 707 – – – 138 244
– balance sheet management and other trading activities (5 189) 112 (5 077) (7) (143) (150) 3 108 (2 207) 901 – – – (4 326)
Other operating income 2 131 34 2 165 235 1 236 7 978 659 8 637 – – – 11 038
Total operating income before impairment losses on loans and advances 352 367 187 311 539 678 314 209 90 588 404 797 712 949 785 392 1 498 341 – – – 2 442 816
Impairment losses on loans and advances – – – – – – (21 419) (42 471) (63 890) – – – (63 890)
Operating income 352 367 187 311 539 678 314 209 90 588 404 797 691 530 742 921 1 434 451 – – – 2 378 926
Operating costs (248 449) (113 184) (361 633) (244 940) (61 292) (306 232) (537 404) (368 343) (905 747) (33 789) (15 809) (49 598) (1 623 210)
Depreciation on operating leased assets – – – – – – (2 350) (71) (2 421) – – – (2 421)
Operating profit/(loss) before goodwill, acquired intangibles and non‑operating items 103 918 74 127 178 045 69 269 29 296 98 565 151 776 374 507 526 283 (33 789) (15 809) (49 598) 753 295
Profit attributable to other non-controlling interests – – – – – – 1 684 (53 972) (52 288) – – – (52 288)
Operating profit/(loss) before goodwill, acquired intangibles, non‑operating items and after other non‑controlling interests 103 918 74 127 178 045 69 269 29 296 98 565 153 460 320 535 473 995 (33 789) (15 809) (49 598) 701 007
Profit attributable to Asset Management non-controlling interests (14 763) (9 054) (23 817) – – – – – – – – – (23 817)
Operating profit/(loss) before goodwill, acquired intangibles, non‑operating items and after non‑controlling interests 89 155 65 073 154 228 69 269 29 296 98 565 153 460 320 535 473 995 (33 789) (15 809) (49 598) 677 190
Cost to income ratio 70.5% 60.4% 67.0% 78.0% 67.7% 75.7% 75.6% 46.9% 60.5% n/a n/a n/a 66.5%

79Investec integrated annual report 2018
Overview
of the year
(continued)
Financial review
Ongoing segmental business and geographic analysis – summarised income statement
Asset Management Wealth & Investment Specialist Banking Group costs
For the year to 31 March 2018£’000
UK andOther
Southern Africa Total
UK andOther
Southern Africa Total
UK andOther
Southern Africa Total
UK and Other
Southern Africa Total
Totalgroup
Net interest income 242 5 229 5 471 5 181 5 563 10 744 331 860 412 026 743 886 – – – 760 101
Net fee and commission income 355 230 181 904 537 134 296 907 85 556 382 463 197 804 243 813 441 617 – – – 1 361 214
Investment income (47) 32 (15) 10 446 105 10 551 57 790 61 396 119 186 – – – 129 722
Share of post taxation profit of associates – – – 415 1 416 1 021 45 386 46 407 – – – 46 823
Trading income/(loss) arising from
– customer flow – – – 1 032 (495) 537 113 388 24 319 137 707 – – – 138 244
– balance sheet management and other trading activities (5 189) 112 (5 077) (7) (143) (150) 3 108 (2 207) 901 – – – (4 326)
Other operating income 2 131 34 2 165 235 1 236 7 978 659 8 637 – – – 11 038
Total operating income before impairment losses on loans and advances 352 367 187 311 539 678 314 209 90 588 404 797 712 949 785 392 1 498 341 – – – 2 442 816
Impairment losses on loans and advances – – – – – – (21 419) (42 471) (63 890) – – – (63 890)
Operating income 352 367 187 311 539 678 314 209 90 588 404 797 691 530 742 921 1 434 451 – – – 2 378 926
Operating costs (248 449) (113 184) (361 633) (244 940) (61 292) (306 232) (537 404) (368 343) (905 747) (33 789) (15 809) (49 598) (1 623 210)
Depreciation on operating leased assets – – – – – – (2 350) (71) (2 421) – – – (2 421)
Operating profit/(loss) before goodwill, acquired intangibles and non‑operating items 103 918 74 127 178 045 69 269 29 296 98 565 151 776 374 507 526 283 (33 789) (15 809) (49 598) 753 295
Profit attributable to other non-controlling interests – – – – – – 1 684 (53 972) (52 288) – – – (52 288)
Operating profit/(loss) before goodwill, acquired intangibles, non‑operating items and after other non‑controlling interests 103 918 74 127 178 045 69 269 29 296 98 565 153 460 320 535 473 995 (33 789) (15 809) (49 598) 701 007
Profit attributable to Asset Management non-controlling interests (14 763) (9 054) (23 817) – – – – – – – – – (23 817)
Operating profit/(loss) before goodwill, acquired intangibles, non‑operating items and after non‑controlling interests 89 155 65 073 154 228 69 269 29 296 98 565 153 460 320 535 473 995 (33 789) (15 809) (49 598) 677 190
Cost to income ratio 70.5% 60.4% 67.0% 78.0% 67.7% 75.7% 75.6% 46.9% 60.5% n/a n/a n/a 66.5%

80 Investec integrated annual report 2018
Overview
of the year
(continued)
Financial review
Ongoing segmental business and geographic analysis – summarised income statement
Asset Management Wealth & Investment Specialist Banking Group costs
For the year to 31 March 2017£’000
UK andOther
Southern Africa Total
UK andOther
Southern Africa Total
UK andOther
Southern Africa Total
UK and Other
Southern Africa Total
Totalgroup
Net interest income 111 5 007 5 118 4 368 7 600 11 968 285 345 378 108 663 453 – – – 680 539
Net fee and commission income 308 084 176 788 484 872 267 847 75 861 343 708 227 999 215 012 443 011 – – – 1 271 591
Investment income – 143 143 2 169 100 2 269 57 234 75 985 133 219 – – – 135 631
Share of post taxation profit of associates – – – 1 509 – 1 509 840 16 541 17 381 – – – 18 890
Trading income/(loss) arising from
– customer flow – – – 740 288 1 028 128 972 28 006 156 978 – – – 158 006
– balance sheet management and other trading activities 3 221 (1 008) 2 213 215 (128) 87 5 095 683 5 778 – – – 8 078
Other operating income/(loss) 5 312 332 5 644 – – – 7 558 (44) 7 514 – – – 13 158
Total operating income before impairment losses on loans and advances 316 728 181 262 497 990 276 848 83 721 360 569 713 043 714 291 1 427 334 – – – 2 285 893
Impairment losses on loans and advances – – – – – – (20 651) (36 498) (57 149) – – – (57 149)
Operating income 316 728 181 262 497 990 276 848 83 721 360 569 692 392 677 793 1 370 185 – – – 2 228 744
Operating costs (225 466) (107 700) (333 166) (211 658) (55 668) (267 326) (521 235) (332 120) (853 355) (36 163) (12 613) (48 776) (1 502 623)
Depreciation on operating leased assets – – – – – – (2 141) (28) (2 169) – – – (2 169)
Operating profit/(loss) before goodwill, acquired intangibles and non‑operating items 91 262 73 562 164 824 65 190 28 053 93 243 169 016 345 645 514 661 (36 163) (12 613) (48 776) 723 952
Profit attributable to other non-controlling interests – – – – – – 180 (60 419) (60 239) – – – (60 239)
Operating profit/(loss) before goodwill, acquired intangibles, non‑operating items and after other non‑controlling interests 91 262 73 562 164 824 65 190 28 053 93 243 169 196 285 226 454 422 (36 163) (12 613) (48 776) 663 713
Profit attributable to Asset Management non-controlling interests (11 807) (8 484) (20 291) – – – – – – – – – (20 291)
Operating profit/(loss) before goodwill, acquired intangibles, non‑operating itemsand after non‑controlling interests 79 455 65 078 144 533 65 190 28 053 93 243 169 196 285 226 454 422 (36 163) (12 613) (48 776) 643 422
Cost to income ratio 71.2% 59.4% 66.9% 76.5% 66.5% 74.1% 73.3% 46.5% 59.9% n/a n/a n/a 65.8%

81Investec integrated annual report 2018
Overview
of the year
(continued)
Financial review
Ongoing segmental business and geographic analysis – summarised income statement
Asset Management Wealth & Investment Specialist Banking Group costs
For the year to 31 March 2017£’000
UK andOther
Southern Africa Total
UK andOther
Southern Africa Total
UK andOther
Southern Africa Total
UK and Other
Southern Africa Total
Totalgroup
Net interest income 111 5 007 5 118 4 368 7 600 11 968 285 345 378 108 663 453 – – – 680 539
Net fee and commission income 308 084 176 788 484 872 267 847 75 861 343 708 227 999 215 012 443 011 – – – 1 271 591
Investment income – 143 143 2 169 100 2 269 57 234 75 985 133 219 – – – 135 631
Share of post taxation profit of associates – – – 1 509 – 1 509 840 16 541 17 381 – – – 18 890
Trading income/(loss) arising from
– customer flow – – – 740 288 1 028 128 972 28 006 156 978 – – – 158 006
– balance sheet management and other trading activities 3 221 (1 008) 2 213 215 (128) 87 5 095 683 5 778 – – – 8 078
Other operating income/(loss) 5 312 332 5 644 – – – 7 558 (44) 7 514 – – – 13 158
Total operating income before impairment losses on loans and advances 316 728 181 262 497 990 276 848 83 721 360 569 713 043 714 291 1 427 334 – – – 2 285 893
Impairment losses on loans and advances – – – – – – (20 651) (36 498) (57 149) – – – (57 149)
Operating income 316 728 181 262 497 990 276 848 83 721 360 569 692 392 677 793 1 370 185 – – – 2 228 744
Operating costs (225 466) (107 700) (333 166) (211 658) (55 668) (267 326) (521 235) (332 120) (853 355) (36 163) (12 613) (48 776) (1 502 623)
Depreciation on operating leased assets – – – – – – (2 141) (28) (2 169) – – – (2 169)
Operating profit/(loss) before goodwill, acquired intangibles and non‑operating items 91 262 73 562 164 824 65 190 28 053 93 243 169 016 345 645 514 661 (36 163) (12 613) (48 776) 723 952
Profit attributable to other non-controlling interests – – – – – – 180 (60 419) (60 239) – – – (60 239)
Operating profit/(loss) before goodwill, acquired intangibles, non‑operating items and after other non‑controlling interests 91 262 73 562 164 824 65 190 28 053 93 243 169 196 285 226 454 422 (36 163) (12 613) (48 776) 663 713
Profit attributable to Asset Management non-controlling interests (11 807) (8 484) (20 291) – – – – – – – – – (20 291)
Operating profit/(loss) before goodwill, acquired intangibles, non‑operating itemsand after non‑controlling interests 79 455 65 078 144 533 65 190 28 053 93 243 169 196 285 226 454 422 (36 163) (12 613) (48 776) 643 422
Cost to income ratio 71.2% 59.4% 66.9% 76.5% 66.5% 74.1% 73.3% 46.5% 59.9% n/a n/a n/a 65.8%

82 Investec integrated annual report 2018
Overview
of the year
(continued)
Financial review
Return on equity – ongoing basis
£’00031 March
201831 March
2017 Average31 March
2016 Average
Calculation of average shareholders’ equity
Ordinary shareholders’ equity 4 178 533 3 859 535 4 019 034 2 990 009 3 424 772
Goodwill and intangible assets (excluding software) (475 922) (490 841) (483 382) (503 996) (497 419)
Adjusted tangible shareholders’ equity 3 702 611 3 368 694 3 535 652 2 486 013 2 927 353
£’00031 March
201831 March
2017
Operating profit* 753 295 723 952
Non-controlling interests (76 105) (80 530)
Accrued preference dividends, adjusted for currency hedge (33 527) (25 838)
Revised operating profit 643 663 617 584
Taxation on operating profit before goodwill and acquired intangibles (77 448) (130 438)
Adjusted attributable earnings to ordinary shareholders* 566 215 487 146
Pre-taxation return on average adjusted shareholders’ equity 16.0% 18.0%
Post-taxation return on average adjusted shareholders’ equity 14.1% 14.2%
Pre-taxation return on average adjusted tangible shareholders’ equity 18.2% 21.1%
Post-taxation return on average adjusted tangible shareholders’ equity 16.0% 16.6%
* Before goodwill, acquired intangibles and non-operating items.

83Investec integrated annual report 2018
Overview
of the year
(continued)
Financial review
An analysis of core loans and advances to customers and asset quality by geography – ongoing business
UK and Other Southern Africa Total group
£’00031 March
201831 March
201731 March
201831 March
201731 March
201831 March
2017
Gross core loans and advances to customers 9 412 611 8 169 901 15 531 184 14 158 547 24 943 795 22 328 448
Total impairments (38 434) (25 356) (86 311) (72 152) (124 745) (97 508)
Specific impairments (37 357) (12 393) (47 848) (52 689) (85 205) (65 082)
Portfolio impairments (1 077) (12 963) (38 463) (19 463) (39 540) (32 426)
Net core loans and advances to customers 9 374 177 8 144 545 15 444 873 14 086 395 24 819 050 22 230 940
% change of net core loans and advances to customers since March 2017 15.1% 9.6% 11.6%
Average gross core loans andadvances to customers 8 791 256 7 706 123 14 844 866 12 258 560 23 636 122 19 964 683
Total income statement charge for impairments on core loans and advances (21 198) (20 690) (40 788) (36 580) (61 986) (57 270)
Gross default loans and advancesto customers 157 203 34 166 172 086 215 633 329 289 249 799
Specific impairments (37 357) (12 393) (47 848) (52 689) (85 205) (65 082)
Portfolio impairments (1 077) (12 963) (38 463) (19 463) (39 540) (32 426)
Defaults net of impairmentsbefore collateral held 118 769 8 810 85 775 143 481 204 544 152 291
Collateral and other credit enhancements 130 498 25 948 213 776 259 057 344 274 285 005
Net default loans and advances to customers (limited to zero) – – – – – –
Ratios:
Total impairments as a % of gross core loans and advances to customers 0.41% 0.31% 0.56% 0.51% 0.50% 0.44%
Total impairments as a % of gross default loans 24.45% 74.21% 50.12% 33.46% 37.88% 39.03%
Gross defaults as a % of gross core loans and advances to customers 1.67% 0.42% 1.11% 1.52% 1.32% 1.12%
Defaults (net of impairments) as a % of net core loansand advances to customers 1.27% 0.11% 0.56% 1.02% 0.82% 0.69%
Net defaults as a % of net core loansand advances to customers – – – – – –
Credit loss ratio (i.e. income statement impairment charge on core loans as a % of average gross core loans and advances) 0.24% 0.27% 0.28% 0.29% 0.26% 0.29%

84 Investec integrated annual report 2018
Overview
of the year
(continued)
Financial review
A reconciliation of core loans and advances: statutory basis and ongoing basisRemoval of:
Statutory as disclosed^
UK Legacy business
Ongoing business
31 March 2018 (£’000)
Gross core loans and advances to customers 25 370 248 426 453 24 943 795
Total impairments (238 151) (113 406) (124 745)
Specific impairments (137 711) (52 506) (85 205)
Portfolio impairments (100 440) (60 900) (39 540)
Net core loans and advances to customers 25 132 097 313 047 24 819 050
31 March 2017 (£’000)
Gross core loans and advances to customers 22 906 165 577 717 22 328 448
Total impairments (199 028) (101 520) (97 508)
Specific impairments (136 177) (71 095) (65 082)
Portfolio impairments (62 851) (30 425) (32 426)
Net core loans and advances to customers 22 707 137 476 197 22 230 940
^ Refer to page 35 in volume two.

85Investec integrated annual report 2018
Overview
of the year
(continued)
Financial review
The legacy business in the UK Specialist Bank comprises:• Assets put on the bank’s books pre-2008 where market conditions post the financial crisis materially impacted the business model
• Assets written prior to 2008 with very low/negative margins
• Assets relating to business we are no longer undertaking.
Legacy business – overview of results Since 31 March 2017 the group’s legacy portfolio in the UK has continued to be actively managed down from £476 million to £313 million through asset sales, redemptions and write-offs. The total legacy business over the period reported a loss before taxation of £93.5 million (2017: £64.6 million) reflecting an increase in impairments for accelerated exits anticipated to occur on certain legacy assets. Total net defaults in the legacy book amounted to £90 million (31 March 2017: £125 million).
An analysis of assets within the legacy business
£’million
31 March 2018
Total net assets
(after impairments)
31 March 2018 Total
balance sheet
impairments
31 March 2017
Total net assets
(after impairments)
31 March 2017 Total
balance sheet
impairments
Private Bank Irish planning and development assets 12 1 18 9
Other Private Bank assets 301 112 458 93
Total legacy assets 313 113 476 102
Performing 223 – 351 –
Non-performing 90 113* 125 102*
* Included in balance sheet impairments is a group portfolio impairment of £60.9 million (31 March 2017: £30.4 million).
£’million
08 13 14 15 16 17 18
4 856
2 615
2 185
695 583 476 313
Other Private Bank assets
Private Bank Irish planning and development assets
Other corporate assets and securitisation activities0
1 000
2 000
3 000
4 000
5 000
Total UK legacy assets

Divisionalreview

87Investec integrated annual report 2018
Divisio
nal review
Group divisional structure
Our strategic goals and objectives are motivated by the desire to develop an efficient and integrated business on an international scale through the active pursuit of clearly established core competencies in our principal business areas. Our core philosophy has been to build well-defined, value-added businesses focused on serving the needs of select market niches where we can compete effectively.
We seek to maintain an appropriate balance between revenue earned from operational risk businesses and revenue earned from
financial risk businesses. This ensures that we are not over reliant on any one part of our business to sustain our activities and that we have a large recurring revenue base that enables us to navigate through varying cycles and to support our long-term growth objectives.
Our current strategic objectives include increasing the proportion of our non-lending revenue base which we largely intend to achieve through the continued strengthening and development of our Wealth and Asset Management businesses.
Investec is a focused specialist
bank and asset manager striving
to be distinctive in all that it does.
What we doEquitiesFixed IncomeMulti-AssetAlternatives
Where we operateAfricaAmericasAsia PacificUKEurope
What we doPortfolio managementStockbrokingAlternative investmentsInvestment advisory servicesElectronic trading servicesRetirement portfolios
Where we operateSouth AfricaUKEuropeHong KongMauritius
What we doPrivate Banking activitiesCorporate and Institutional Banking activitiesInvestment activitiesProperty activitiesGroup Services and Other activities
Where we operateSouthern AfricaUK EuropeAustraliaMauritiusHong KongIndia USA
Asset Management Wealth & Investment Specialist Banking
Specialist Banking Asset Management
Wealth & Investment
Integrated global management structureGlobal roles
As at 31 March 2018Chief executive officer Stephen Koseff^^ Managing director Bernard Kantor^^
From 1 October 2018*Joint chief executive officers Fani Titi Hendrik du Toit
Executive director Hendrik du Toit Group risk and finance director Glynn Burgerø
From 1 April 2019*Group risk director Ciaran Whelan Group finance and operations director Kim McFarland
Human resources and organisational development Marc Kahn
Corporate governance and compliance Bradley Tapnack
Group finance Nishlan Samujh
Share schemes and company secretarial Les Penfold
Group marketing Malcolm Fried
Group investor relations Ursula Nobrega
South Africa Glynn Burger Richard Wainwright
United Kingdom David van der Walt Steve Elliott
Hendrik du Toit^
SU
PP
OR
T S
TRU
CTU
RE
S
GE
OG
RA
PH
ICA
L B
US
INE
SS
LE
AD
ER
S
Ciaran Whelan**David van der Walt
Steve Elliott
* Subject to regulatory approval as per the group’s announcement made on 6 February 2018.** As from 1 April 2018 Richard Wainwright has replaced Ciaran Whelan as joint head of the Specialist Bank.^ Per the group’s announcement made on 6 February 2018, John Green and Mimi Ferrini will be deputy CEOs of Investec Asset Management from
1 April 2018, and from 1 October 2018 will become joint CEOs of the business.^^ Stephen Koseff and Bernard Kantor will become non-executive directors of the group on 1 April 2019.ø Glynn Burger will retire as a group executive director on 31 March 2019.
For further information on the management succession changes announced by the group on 6 February 2018, refer to pages 121 and 122.

88 Investec integrated annual report 2018
Divisio
nal review
Asset management
Global executive committee*at 31 March 2018
Chief executive officer Hendrik du Toit
Chief operating officer Kim McFarland
Global head of client group John Green
Co-chief investment officer Domenico (Mimi) Ferrini
Co-chief investment officer John McNab
Annual highlights
Net flows of
£5.4 billion(2017: £(0.6) billion)
Assets under management
£103.9 billion(2017: £95.3 billion)
Operating margin
33.0%(2017: 33.1%)
Operating profit before non-controlling interests increased
by 8.0% to
£178.0 millioncontributing 29.3% to group profit
Our value proposition• Organically build an independent global
platform from an emerging market base
• Independently managed entity within the Investec group
• Competitive investment performance in chosen specialities
• Global approach to:
– Investing
– Client base
– Operations platform
• Institutional and advisor focus
• Unique and clearly understood culture
• Stable and experienced leadership.
It all began in South Africa in 1991. After more than twenty-seven years, we have grown to become a successful global investment management firm from the emerging markets. We continue to develop an owner culture and are committed to building a long-term intergenerational business.
Our investment team, of over 200 investment professionals, applies clear investment philosophies and processes across multiple asset classes. Our client group is organised across five geographically defined units serving our clients around the globe. These teams are supported by our global investment and operational structure.
At Investec Asset Management, we believe in investing in a better tomorrow. We want to assist people around the globe to retire with dignity or meet their financial objectives by offering
specialist, active investment expertise. We are a patient, organic, long-term business offering organically-developed investment
capabilities through active segregated mandates or mutual funds to sophisticated clients. Our clients include some of
the world’s largest private and public sector pension funds, financial institutions, corporates, foundations, central banks and
intermediaries serving individual investors. Our business is to manage our clients’ investments to the highest standard possible
by exceeding their investment and client service expectations.
* This information reflects the Investec Asset Management global executive committee before the changes announced on 6 February 2018.

89Investec integrated annual report 2018
Divisio
nal review
(continued)
Asset management
Net flows by geography
Financial years to 31 March 2017 and 31 March 2018Note: The net flows exclude a historic low value cash plus account which is subject to volatile net flows.
Where we operate
£(718) mn
£243 mn
£2 670 mn
20182017
Americas
£61 mn
Europe(including UK)
£1 393 mn
Africa
£1 006 mn
£(1 308) mn
£1 444 mn
Asia Paci�c(including Middle East)
What we do
United Kingdom AmericasAfrica Asia Pacific Europe
Equities Fixed Income Multi-Asset Alternatives
– Long-only Equity
– Credit
– Sovereign
– Money Market
– Global solutions
– Income solutions
– Commodities
– Private equity
– Real estate
– Infrastructure debt
Client groups
Global operations platform
Investments
Organisational structure

90 Investec integrated annual report 2018
Divisio
nal review
(continued)
Asset management
* Before goodwill, acquired intangibles, non-operating items, taxation and after other non-controlling interests.** As calculated on page 68, based on regulatory capital requirements.
Operating profit*
0
20
40
60
80
100
29.3%
70.7%
Remainder of group
Asset Management
17 18
Permanent employees
0
20
40
60
80
100
16.1%
83.9%
Ordinary shareholders’ equity**
0
20
40
60
80
100
4.9%
95.1%
17 18 17 18
March
Financial analysis
27.5%
72.5%
17.2%
82.8%
5.0%
95.0%
£’billion £’million
Assets under management (LHS)
Operating pro�t (RHS)0
20
40
60
80
100
120
Mar
17
Mar
15
Mar
16
Mar
97
Mar
98
Mar
99
Mar
00
Mar
01
Mar
02
Mar
03
Mar
04
Mar
05
Mar
06
Mar
07
Mar
08
Mar
09
Mar
10
Mar
11
Mar
12
Mar
13
Mar
14
Mar
18
0
50
100
150
200103.9178.0
Historical �nancial performance

91Investec integrated annual report 2018
Divisio
nal review
(continued)
Asset management
Income statement analysis
£’00031 March
201831 March
2017 Variance % change
Net interest income 5 471 5 118 353 6.9%
Net fee and commission income 537 134 484 872 52 262 10.8%
Investment income (15) 143 (158) (> 100.0%)
Trading income arising from balance sheet management and other trading activities (5 077) 2 213 (7 290) (> 100.0%)
Other operating income 2 165 5 644 (3 479) (61.6%)
Total operating income 539 678 497 990 41 688 8.4%
Operating costs (361 633) (333 166) (28 467) 8.5%
Operating profit before goodwill, acquired intangibles, non-operating items, taxation and before non-controlling interests 178 045 164 824 13 221 8.0%
Profit attributable to Asset Management non-controlling interests** (23 817) (20 291) (3 526) 17.4%
Operating profit before goodwill, acquired intangibles, non-operating items, taxation and after non-controlling interests 154 228 144 533 9 695 6.7%
UK and Other 89 155 79 455 9 700 12.2%
Southern Africa 65 073 65 078 (5) –
Operating profit before goodwill, acquired intangibles, non-operating items, taxation and after non-controlling interests 154 228 144 533 9 695 6.7%
Selected returns and key statistics
Ordinary shareholders’ equity* 199 416 186 423 12 993 7.0%
ROE (pre-tax)* 91.0% 90.7%
Return on tangible equity (pre-tax)* 167.4% 179.6%
Operating margin 33.0% 33.1%
Operating profit per employee (£’000)*^ 172.3 168.6 3.7 2.2%
* As calculated on pages 68 and 70, based on regulatory capital requirements.** Earnings after tax attributable to non-controlling interests includes the portion of earnings attributable to the 17% shareholding in the business by
employees (31 March 2017: 16%).^ Operating profit per employee excludes Silica, our third party administration business.
The variance in operating profit over the year can be explained as follows:• Rising markets, a weaker Sterling and strong net inflows increased our net fee and commission income in the period to £537.1 million.
• Against this backdrop, our operating profit before non-controlling interests increased by 8.0%.
• Performance fees decreased over the period under review from £28.0 million to £18.4 million.

92 Investec integrated annual report 2018
Divisio
nal review
(continued)
Asset management
Assets under management and flows
£’million
AUM31 March
2018 Net flows
Markets/foreign
exchange movements
AUM31 March
2017
Equities 45 496 4 583 2 049 38 864
Fixed Income 27 307 (215) 422 27 100
Multi-Asset 20 810 1 212 658 18 940
Alternatives 2 876 (288) (315) 3 479
Third party funds on advisory platform 7 373 71 398 6 904
Total 103 862 5 363 3 212 95 287
44%
26%
20%
3%
7%
31 March 2018
Equities
Fixed Income
Multi-asset
Alternatives
Third party funds on advisory platform
Assets under management by asset class
41%
28%
20%
4%
7%
31 March 2017
Equities
Fixed Income
Multi-asset
Alternatives
Third party funds on advisory platform
Investment performance
All of our investment capabilities are managed with the simple aim of delivering performance which meets or exceeds our clients’ expectations around agreed, well defined risk and return parameters.
We measure our investment performance relative to peer groups and against benchmarks over one, three, five and 10 year periods, and since inception.
Our long-term track record remains competitive.
Note: The assets under management and flows exclude a historic low value cash plus account that is subject to volatile flows.

93Investec integrated annual report 2018
Divisio
nal review
(continued)
Asset management
* For ‘since inception’, performance is shown only for portfolios that are older than 12 months.
Source: Calculated by Investec Asset Management, returns from StatPro, capability weighted. Performance to 31 March 2018.
Note: Outperformance/(underperformance) is calculated as the sum of the total market values for individual portfolios that have positive active returns (negative active returns) on a gross basis expressed as a percentage of total assets under management. Our percentage of fund outperformance is reported on the basis of current AUM and therefore does not include terminated funds. Total assets under management exclude double-counting of pooled products and third party assets administered on our South African platform. Benchmarks used for the above analysis include cash, peer group averages, inflation and market indices as specified in client mandates or fund prospectuses. For all periods shown, market values are as at the period end date.
15%
Percentage
Underperformance
Outperformance
31%
69%
37%
63%68%
32%
84% 85%
1 year 3 year(annualised)
5 year(annualised)
10 year(annualised)
Since inceptionannualised*
0
20
40
60
80
100
Overall �rm investment performance
16%
Performance to 31 March 2018. Fund performance and ranking as per Morningstar data using primary share classes net of fees. Peer group universes are either IA, GIFS or ASISA sectors as classified by Morningstar. Cash or cash-equivalent funds are excluded from charts.
Mutual funds investment performance
43%
15%
29%
13%
One year
First quartile
Second quartile
Third quartile
Fourth quartile
34%
24%
29%
13%
Three year
First quartile
Second quartile
Third quartile
Fourth quartile
30%
37%
21%
12%
Five year
First quartile
Second quartile
Third quartile
Fourth quartile
68%
23%
5%
4%
Ten year
First quartile
Second quartile
Third quartile
Fourth quartile
• 2018 Raging Bull Award for Top Management Company of the Year and Offshore Management Company of the Year
• Winner of Insurance Asset Risk Awards 2018 Emerging Market Manager
• Winner of Private Equity Africa Awards 2017 Credit Investor of the Year
• Winner of Global Investor Awards 2017 Emerging Markets Manager of the Year
Independent recognition

94 Investec integrated annual report 2018
Divisio
nal review
(continued)
Asset management
Q. How has the operating environment impacted your business over the past financial year? The global political environment remains uncertain. Notwithstanding this, markets have remained buoyant, thus supporting growth in our assets under management. The fundamentals for long-term growth in the asset management industry remain strong: the growing need for retirement savings and the growing wealth of developing economies are expanding the global pool of long-term savings – the key growth driver for our industry. These factors are expected to increase global assets under management from c. $85 trillion in 2016 to c. $145 trillion by 2025. (Source: PricewaterhouseCoopers)
There are however multiple challenges facing our industry. These include the risk of a market correction, growing regulatory scrutiny, technological advancements and the need to justify value for money (especially against passive strategies). The result is fee pressure, rising fixed costs and increased investment in technology – in summary, a more competitive market in which excellence continues to be rewarded but mediocrity punished.
One of the responses to the increased competitiveness of the asset management industry is consolidation in the market. In 2017, we saw deals that were motivated by expanding product range, increasing distribution footprint, cost synergies and adapting in response to the regulatory environment. However, Investec Asset Management remains firmly committed to its path of long-term organic growth.
Q. What have been the key developments in your business over the past financial year?Positive net inflows of £5.4 billion for the last 12 months and competitive investment performance were the highlights for the year. Our net flows were positive across all regions, largely driven by inflows from the Americas and Asia-Pacific regions. Our Advisor net flows were significant, in all regions, over the year.
Beyond our financial results, we have been devoting time to clarify our purpose and our impact as a global business, including owning the sustainability agenda. We want to ensure that we are responsible and sustainable in all our activities. We have a motivated and energetic team with a long-term orientation, which is organically built around, and focused on, excellence. Investment performance and clients are always our priority.
Following the announcement of the succession plan at Investec Group, transition planning at Investec Asset Management is well underway. We have an orderly and well-executed transition in progress which will be completed by the end of the first half of the 2019 financial year. I am confident that my successors, John Green and Mimi Ferrini, will take Investec Asset Management to new heights during their tenure as Joint CEOs.
Q. What are your strategic objectives in the coming financial year?Our fundamental strategic objectives and principles remain unchanged: we want to assist people around the globe to retire with dignity or to meet their financial objectives. We do this by offering organically developed investment capabilities through active
segregated mandates or mutual funds to sophisticated clients. We operate globally in both the Institutional and Advisor space through five geographically defined client groups and have an approach to growth that is driven by sensible medium to long-term investment performance.
Over the coming financial year, we will endeavour to deliver competitive investment performance, scale our Multi-Asset and Quality capabilities and grow our presence in large markets, with a particular focus on North America, while maintaining the strong momentum we have in the Advisor market. We continue to evolve all our investment capabilities for the future, including building a compelling foundation for Alternatives.
Since the conclusion of the previous financial year, we have achieved positive momentum in respect of both inflows and investment performance. However, we are aware of the fundamental challenges that face our industry, and the possibility of a market correction. We recognise the need to offer value for money to our clients, and be able to explain how this value is delivered. We believe value is a combination of active long-term alpha, appropriate and relevant products, combined with a compelling service and pricing proposition.
Q. What is your outlook for the coming financial year?At Investec Asset Management, we always think about the long term. We are organically building a long-term intergenerational business and as such concentrate less on short-term outcomes. We believe that we have created a sustainable, competitive long-term business and remain committed to being an active investment manager. We believe that the opportunity for growth in our industry over the next five years is substantial. Our momentum is positive and we are confident about our future.
Hendrik du Toit
Chief executive officer
Questions and answers

95Investec integrated annual report 2018
Divisio
nal review
Wealth & Investment
Investec Wealth & Investment offers its clients comfort in its scale, international reach and
depth of investment processes. Investec Wealth & Investment is one of the UK’s leading private
client investment managers and the largest in South Africa.
Global headSteve Elliott
UK head Jonathan Wragg
South Africa head Henry Blumenthal
Switzerland head Peter Gyger
Ireland head Eddie Clarke
Annual highlights
Net flows of
£2.0 billion(2017: £1.2 billion)
Assets under management
£56.0 billion(2017: £54.8 billion)
Operating margin
24.3%(2017: 25.9%)
Operating profit before non-controlling interest
increased by 5.7% to
£98.6 millioncontributing 16.2% to group profit
Our value proposition• Investec Wealth & Investment has been
built via the acquisition and integration of businesses and organic growth over a long period of time
• Well-established platforms in the UK, South Africa, Switzerland, Republic of Ireland and Guernsey
• The business has five distinct channels: direct, intermediaries, charities, international and digital
• Strategy to internationalise within jurisdictions where the Investec group already has an established business
• Focus is on organic growth in our key markets and enhancing our range of services for the benefit of our clients.
The business specialises in wealth management, portfolio management, private office and stockbroking services for individuals, families, trusts and charities.
Investec Wealth & Investment is one of the UK’s leading private client investment managers, the largest in South Africa, has a significant European presence and is developing its operations internationally.
Further detail on the Wealth & Investment management structure is available on our website: www.investec.com

96 Investec integrated annual report 2018
Divisio
nal review
(continued)
Wealth & Investment
Where we operate
What we do
Investec Wealth & Investment South Africa provides portfolio management, wealth management and stockbroking services for private clients, charities, pension funds and trusts. Operating from eight offices across South Africa with R115.3 billion of discretionary and annuity managed assets and a further R202.6 billion of funds under various other forms of administration.
South Africa
The UK operation is conducted through Investec Wealth & Investment Limited. The other Wealth & Investment operations are conducted through Investec Bank Switzerland, Investec Wealth & Investment Ireland, Investec Wealth & Investment Channel Islands and in Hong Kong, through Investec Capital Asia Limited.
Over 1 300 staff operate from offices located throughout the above jurisdictions, with combined funds under management of £36.9 billion. Investec Wealth & Investment is one of the UK’s leading providers of private client investment management services.
Pensions and retirement
• Discretionary investment management for company pension and Self Invested Personal Pensions (SIPPs)
• Advice and guidance on pension schemes.
Financial planning
• Estate planning
• Retirement planning
• Bespoke advice and independent financial reviews.
Investment and savings
• Discretionary and advisory portfolio management services for private clients
• Specialist investment management services for charities, pension schemes and trusts
• Independent financial planning advice for private clients
• Specialist portfolio management services for international clients.
UK and Other
Brand well recognised
Established platforms and distribution in the UK, Switzerland, Republic of Ireland, Guernsey and Hong Kong
One of the UK’s leading private client investment managers
Proven ability to attract and recruit investment managers
Newly launched digital investment offering, Investec Click & Invest
UK and Other
Strong brand and positioning
Largest player in the South African market
Developing Wealth & Investment capability in Mauritius
South Africa and Mauritius

97Investec integrated annual report 2018
Divisio
nal review
(continued)
Wealth & Investment
Operating profit*
0
20
40
60
80
100
16.2%
83.8%
Remainder of group
Wealth & Investment
17 18
Permanent employees
0
20
40
60
80
100
17.8%
82.2%
Ordinary shareholders’ equity**
0
20
40
60
80
100
5.8%
94.2%
17 18 17 18
March
Financial analysis
15.6%
84.4%
17.7%
82.3%
6.7%
93.3%
£’million
0
10
20
30
40
50
60
70
80
90
100 98.6
17
Operating pro�t^ — track record
15141312111009 16 18
^ Trend reflects numbers as at the year ended 31 March. Amounts are shown before goodwill, acquired intangibles, non-operating items, taxation and after other non-controlling interests.
* Before goodwill, acquired intangibles, non-operating items, taxation and after other non-controlling interests.** As calculated on page 68, based on regulatory capital requirements.

98 Investec integrated annual report 2018
Divisio
nal review
(continued)
Income statement analysis
£’00031 March
201831 March
2017 Variance % change
Net interest income 10 744 11 968 (1 224) (10.2%)
Net fee and commission income 382 463 343 708 38 755 11.3%
Investment income 10 551 2 269 8 282 > 100.0%
Share of post taxation profit of associates 416 1 509 (1 093) (72.4%)
Trading income/(loss) arising from
– customer flow 537 1 028 (491) (47.8%)
– balance sheet management and other trading activities (150) 87 (237) (> 100.0%)
Other operating income 236 – 236 100.0%
Total operating income 404 797 360 569 44 228 12.3%
Operating costs (306 232) (267 326) (38 906) 14.6%
Operating profit before goodwill, acquired intangibles, non-operating items, taxation and after other non-controlling interests 98 565 93 243 5 322 5.7%
UK and Other 69 269 65 190 4 079 6.3%
Southern Africa 29 296 28 053 1 243 4.4%
Operating profit before goodwill, acquired intangibles, non-operating items, taxation and after other non-controlling interests 98 565 93 243 5 322 5.7%
Selected returns and key statistics
Ordinary shareholders’ equity* 235 181 251 523 (16 342) (6.5%)
ROE (pre-tax)* 38.7% 35.7%
Return on tangible equity (pre-tax)* 162.7% 173.0%
Operating margin 24.3% 25.9%
Operating profit per employee (£’000)* 56.0 56.6 (0.6) (1.1%)
* As calculated on pages 68 and 70, based on regulatory capital requirements.
The variance in operating profit over the year can be explained as follows:• The UK and Other business benefited from higher average funds under management supported by higher equity market levels over the
year and solid net inflows of £1.8 billion. In addition, a one off gain of £10.0 million was earned on the sale of the business’s holding in the Irish Stock Exchange.
• The South African business posted an operating profit of R503 million, a decrease of 2.1% (in Rand terms) over the prior year. An increase in annuity fees earned was offset largely as a result of lower brokerage volumes. Progress continued to be made in attracting discretionary net inflows amounting to R5.0 billion in the current year.
• Operating costs increased as the business globally continued to invest in its digital platforms, IT and compliance areas and in recruiting experienced investment managers. Headcount increased by 5.3% from 31 March 2017 to 31 March 2018.
Analysis of key earnings drivers (funds under management)
£’million31 March
201831 March
2017 % change
UK and Other 36 923 35 555 3.8%
Discretionary 28 638 26 336 8.7%
Non-discretionary and other 8 285 9 219 (10.1%)
South Africa 19 125 19 218 (0.5%)
Discretionary and annuity assets 6 936 6 552 5.9%
Non-discretionary and other 12 189 12 666 (3.8%)
Total 56 048 54 773 2.3%
Wealth & Investment

99Investec integrated annual report 2018
Divisio
nal review
(continued)
UK and Other: analysis of key drivers (funds under management and flows)
Funds under management
£’million31 March
201831 March
2017 % change
Investec Wealth & Investment Limited (UK) 33 206 31 866 4.2%
Discretionary 27 346 25 393 7.7%
Non-discretionary 5 860 6 473 (9.5%)
Other 3 717 3 689 0.8%
Discretionary 1 292 943 37.0%
Non-discretionary 2 425 2 746 (11.7%)
Total 36 923 35 555 3.8%
Further analysis of the Investec Wealth & Investment Limited UK business
Funds under management and flows
£’billion31 March
201831 March
2017 % change
At the beginning of the year 31.87 27.11
Inflows 4.28 3.53
Outflows (2.50) (2.19)
Market adjustment^ (0.25) 3.71
Transfers^^ – (0.05)
Disposals* (0.19) (0.24)
At the end of the year 33.21 31.87 4.2%
MSCI WMA Private Investor Balanced Index (at year end) 1 527 1 536 (0.6%)
Underlying rate of net organic growth in total funds under management** 5.6% 4.9%
% of total funds managed on a discretionary basis 82.4% 79.7%
^ Impact of market movement and relative performance.^^ Reflects the transfer of clients between jurisdictions.* Reflects the disposal of funds relating to certain non-core operations.** Net organic inflows less outflows (excluding acquired inflows and exceptional outflows) as a percentage of opening funds under management.
South Africa: analysis of key drivers (funds under management and flows)
Funds under management
R’billion31 March
201831 March
2017 % change
Discretionary and annuity assets 115 287 109 869 4.9%
Non-discretionary 202 589 212 412 (4.6%)
Total 317 876 322 281 (1.4%)
Net inflows at cost over the year
R’million31 March
201831 March
2017
Discretionary and annuity assets 5 020 8 335
Non-discretionary (1 640) (8 597)#
Total 3 380 (262)
# Included an outflow of R4.9 billion of assets transferred to our specialised securities division not included in Wealth & Investment assets.
Wealth & Investment

100 Investec integrated annual report 2018
Divisio
nal review
(continued)
Q. How has the operating environment impacted your business over the past financial year? In the UK, the year has presented significant challenges for investors, with numerous events and concerns in the political and economic environment testing investors’ nerve. These include general elections in the UK and Europe, tensions over North Korea, the prospect of tighter monetary policy across a number of regions and the uncertainty of the Brexit negotiations. Despite these uncertainties, equity indices remained buoyant for the most part. Gains made during the latter part of the 2017 financial year were sustained for the majority of the 2018 financial year, with markets reaching record highs. This remained the case until markets fell back towards the end of the financial year, leaving them marginally lower than where they started the year.
Given this backdrop, our challenge has been to manage the risks presented by the political and economic uncertainties, and the resulting volatility, whilst ensuring our clients remain positioned to benefit from the periods of market progress. Our well established research capability and investment process, and the close relationships we maintain with our clients, have served us well as we navigated through these challenges. Although markets fell back towards the end of the financial year, their higher average level for the year overall has had a positive impact on the performance of the business.
It is also pleasing that, despite the focus that has had to be applied to the preparation for regulatory change, the UK business has continued to deliver strong net organic growth in funds under management. Our strategy of seeking to attract experienced and high-calibre investment managers who share our client-centric culture has contributed positively to the overall growth that has been achieved during the year.
Changes in the regulatory landscape have also been a dominant theme and will continue to be so in the coming year. The second Markets in Financial Instruments Directive (MiFID II) took effect on 3 January 2018 and is the single biggest regulatory change the industry has faced for some time. Preparing the business for the new regulations has required substantial resources. In addition, the new General Data Protection Regulation (GDPR) requirements came into effect in May 2018 and present a further significant change to the way businesses are required to manage data. We recognise the benefits these regulatory changes seek to achieve but also acknowledge the impact the changes have on both clients and businesses and the continuing level of resources needed to bed down the changes that have taken place and to prepare for the changes yet to come.
In South Africa the equity market has proven to be challenging, impacting brokerage volumes. An increase in volatility during the fourth quarter of the financial year has also had an impact on market returns.
On the other hand, the transition to a new leadership under President Cyril Ramaphosa has restored some confidence among investors by staving off the previously likely downgrade by rating agencies. A more stable Rand and lower inflation meant that the South African Reserve Bank was able to cut interest rates in March 2018 and this should provide some support for domestic equities. We have seen an increase in discretionary flows and increased appetite for some of our offshore products.
Q. What have been the key developments in your business over the past financial year?In June, the UK business launched its new digital discretionary investment management service, Investec Click & Invest. The service has received a positive reaction from the marketplace following its launch, attracting favourable media interest and being ranked first place in an independent survey of the digital portfolio management market. It was particularly pleasing that the survey highlighted outstanding performance in the areas of portfolio management and client coaching, being areas in which we have sought to differentiate the Click & Invest service from its peers. We are continuing to invest in further development to enhance and expand the service as the business establishes itself in this new and exciting sector of the marketplace.
Wealth & Investment
Steve Elliott
Global head
Questions and answers

101Investec integrated annual report 2018
Divisio
nal review
(continued)
In South Africa we continued to increase our digital offering across the proposition chain – from enhanced reporting and access, to domestic and global portfolio information and data. Our international offering remained a key focus and is one we believe is a core differentiator in the South African market.
We continue to source investments for distribution in all asset classes including alternative investments which play an important role in diversifying investment portfolios and are proving popular with high net worth clients.
Investec continues to gain global recognition as a leader in wealth management and private banking. Investec Wealth & Investment and Private Bank have been awarded, for the sixth year in a row by Euromoney and the fifth year in a row by the FT in London, the accolade as Best Private Bank and Wealth Manager in South Africa. The awards once again endorse the strategy of delivering banking and investments, locally and internationally, to our clients, in One Place.
Q. What are your strategic objectives in the coming financial year?We believe the digital delivery of services will be central to the future investment management landscape. We will therefore continue to invest in and develop our digital channel, along with digital enhancements to our core service, so that we are well positioned to meet the needs of the increasing number of clients who prefer some or all of their service delivered digitally.
In South Africa, our clients are internationally mobile individuals who want to access investments in a high-touch, high-tech manner and this understanding underpins our strategic initiatives, as we strive to remain the investment manager of choice. We will continue to focus on leveraging our efforts with the Private Bank to ensure ongoing enhancement of our offering of an integrated banking and investment solution, both locally and internationally.
Furthermore, we understand that a global view of investment means understanding the complexities that go with it. As investment managers it is our job to identify opportunities in a complex world and to help navigate the complexities on our clients’ behalf. To this end we continue to build our skills in areas like alternative investments, fiduciary and tax, while developing technological solutions to expand our offering.
Regulation and compliance will remain a key focus for the business globally. In the UK in particular, over the coming year we will seek to assist clients with the changes resulting from MiFID II and continue our preparations for GDPR.
Our strategic priorities continue to include a number of initiatives that are driven by our desire to deliver continuous improvement to our client service and business processes. This reflects our focus on growing organically, which can only be achieved by maintaining high standards of client service.
Q. What is your outlook for the coming financial year?Considerable achievements have been made during the year, including the successful launch of Click & Invest, adapting to significant regulatory change and the continuing achievement of strong discretionary net organic growth.
Whilst many of the uncertainties which the business and investors have faced over the last year will remain a feature of the coming year, we believe that our global investment strategy and asset allocation processes, together with the strength of our core businesses and our continuing investment for the future, will position us well.
Wealth & Investment

102 Investec integrated annual report 2018
Divisio
nal review
Specialist Banking
Global heads at 31 March 2018David van der WaltCiaran Whelan*
UK headsDavid van der WaltCiaran Whelan
South Africa headRichard Wainwright
Annual highlights
Operating profit (ongoing)
up 4.3% to
£474.0 million
Operating profit (statutory)
down 2.4%
£380.5 million
ROE (pre-tax) (ongoing)
13.1%(2017: 15.3%)
ROE (pre-tax) (statutory)
10.2%(2017: 12.8%)
Loans and advances (statutory)
£25.1 billionCustomer deposits (statutory)
£31.0 billion
Our value proposition• High-quality specialist banking solution
to corporate and private clients with leading positions in selected areas
• Provide high-touch personalised service – ability to execute quickly
• Ability to leverage international, cross-border platforms
• Well positioned to capture opportunities between the developed and the emerging world – internationally mobile
• Strong ability to originate, manufacture and distribute
• Balanced business model with good business depth and breadth.
Our specialist teams are well positioned to provide services for both personal and business needs across Corporate and Institutional Banking, Investment and Private Banking activities.
Specialist expertise delivered with dedication
and energy.
Further detail on the Specialist Banking management structure is available on our website: www.investec.com
* As from 1 April 2018 Richard Wainwright has replaced Ciaran Whelan as joint head of the Specialist Bank.

103Investec integrated annual report 2018
Divisio
nal review
(continued)
Specialist Banking
Private Banking activities
Transactional banking and foreign exchange
Lending
Deposits
Investments
– Southern Africa
– UK and Europe
Investment activities
Principal investments
Property investment fund management
– Southern Africa
– UK and Europe
– Australia
– Hong Kong
Corporate and Institutional banking
Treasury and trading servicesSpecialised lending, funds and debt capital markets
Institutional research sales and trading
Advisory
– Southern Africa
– UK and Europe
– Australia
– Hong Kong
– India
– USA
Corporates/government/institutional clientsHigh income and high net worth private clients
What we do
North America
Distribution platform
India
Established a presence in 2010
Facilitates the link between India, UK and South Africa
South Africa
Strong brand and positioning
Leading position in corporate, institutional and private client banking activities
UK and Europe
Brand well established
Sustainable business on the back of client activity
Mauritius
Established in 1997
Focus on corporate, institutional and private client banking activities
Hong Kong
Investment activities
Distribution platform
Australia
Experienced local teams in place with industry expertise
Focus is on entrenching position as a boutique operation
Where we operate

104 Investec integrated annual report 2018
Divisio
nal review
(continued)
* Before goodwill, acquired intangibles, non-operating items, taxation and after other non-controlling interests.** As calculated on page 68, based on regulatory capital requirements.
^ Trend reflects numbers as at the year ended 31 March. Amounts are shown before goodwill, acquired intangibles, non-operating items, taxation and after other non-controlling interests.
£’million
0
50
100
150
200
250
300
350
400
Operating pro�t^ — track record (statutory)
1715141312111009 16
380.5
18
Operating profit*
0
20
40
60
80
100
62.6%
37.4%
Remainder of Investec group
Specialist Banking
Permanent employees
0
20
40
60
80
100
66.1%
33.9%
Ordinary shareholders’ equity**
0
20
40
60
80
100
89.3%
10.7%
Financial analysis
17 18 17 18 17 18
March
65.1%
34.9%
65.1%
34.9%
88.3%
11.7%
Specialist Banking

105Investec integrated annual report 2018
Divisio
nal review
(continued)
Income statement analysis
£’00031 March
201831 March
2017 Variance % change
Net interest income 744 183 662 809 81 374 12.3%Net fee and commission income 441 610 442 944 (1 334) (0.3%)Investment income 119 512 133 791 (14 279) (10.7%)Share of post taxation profit of associates 46 407 17 381 29 026 > 100.0%Trading income arising from – customer flow 137 689 156 973 (19 284) (12.3%)– balance sheet management and other trading activities 920 5 918 (4 998) (84.5%)Other operating income 8 714 7 839 875 11.2%Total operating income before impairment on loans and advances 1 499 035 1 427 655 71 380 5.0%Impairment losses on loans and advances (148 556) (111 454) (37 102) 33.3%Operating income 1 350 479 1 316 201 34 278 2.6%Operating costs (915 277) (863 963) (51 314) 5.9%Depreciation on operating leased assets (2 421) (2 169) (252) 11.6%Operating profit before goodwill, acquired intangibles, non-operating items, taxation and before non-controlling interests 432 781 450 069 (17 288) (3.8%)Profit attributable to non-controlling interests (52 288) (60 239) 7 951 (13.2%)Operating profit before goodwill, acquired intangibles, non-operating items, taxation and after other non-controlling interests 380 493 389 830 (9 337) (2.4%)
UK and Other 59 958 104 604 (44 646) (42.7%)Ongoing^ 153 460 169 196 (15 736) (9.3%)Legacy remaining^ (93 502) (64 592) (28 910) 44.8%
Southern Africa 320 535 285 226 35 309 12.4%Operating profit before goodwill, acquired intangibles, non-operating items, taxation and after other non-controlling interests 380 493 389 830 (9 337) (2.4%)
Selected returns and key statisticsOrdinary shareholders’ equity** 3 632 104 3 319 452 312 652 9.4%
Southern Africa 2 113 691 1 868 797 244 894 13.1%Ongoing UK and Other 1 471 195 1 393 742 77 453 5.6%Remaining Legacy 47 218 56 913 (9 695) (17.0%)
Statutory ROE (pre-tax)** 10.2% 12.8%Ongoing ROE (pre-tax) ** 13.1% 15.3%
Southern Africa 15.6% 16.4%Ongoing UK and Other 10.6% 13.9%
Southern Africa excluding investment activities ROE (pre-tax)# 17.2% 19.6%Cost to income ratio 61.2% 60.6%
Operating profit per employee (£’000)** 58.1 63.9 (5.8) (9.1%)
^ Detailed income statement provided on page 75.** As calculated on pages 68 and 70, based on regulatory capital requirements.# Refer to analysis on pages 109 and 110.
The variance in the operating profit in the UK ongoing business over the year can be explained as follows:• Net interest income increased by 16.3% driven by robust levels of lending activity and a reduction in the cost of funding.
• Net fee and commission income decreased by 13.2% largely as a result of less investment banking activity following a strong prior year.
• Investment income increased 1.0% with gains from the debt securities portfolio and lower write downs of an investment in the Hong Kong portfolio offset by less realisations in the UK investment portfolio.
• Trading income from customer flow decreased 12.1% as a consequence of lower volatility relative to the elevated levels experienced in the prior year following the Brexit vote.
• As a result of the foregoing factors, total operating income was flat relative to the prior year.
• Impairments increased 3.1%, however, the credit loss ratio reduced to 0.24% (2017: 0.27%). Further information is provided on page 83.
• Operating costs increased 3.1% reflecting continued investment into IT and digital initiatives and higher headcount to support increased activity and growth strategies; notably the build out of the private client banking offering. This was partially offset by lower variable remuneration.
Specialist Banking

106 Investec integrated annual report 2018
Divisio
nal review
(continued)
The variance in the operating profit in Southern Africa over the year can be explained as follows:Note: The analysis and variances described below for the South African Specialist Banking division are based on the Rand numbers reported.
• The Specialist Banking division reported operating profit before taxation of R5 466 million (2017: R5 117 million).
• Net interest income increased by 2.9%. Sound levels of lending activity was somewhat offset by the roll off of higher yielding debt securities and increased subordinated debt.
• Net fee and commission income increased by 7.8% supported by continued growth and activity levels in the private banking client base as well as a good performance from the corporate businesses.
• Investment income decreased by 18.8% as a result of a weaker performance from the unlisted direct investment portfolio as well as the group’s investments in its listed property funds. The bank’s client-driven private equity portfolio performed well.
• Trading income arising from customer flow decreased by 13.1% as a consequence of losses incurred on Steinhoff (refer to page 63 for additional information).
• Trading income from other trading activities reflected a loss predominantly impacted by foreign currency translation.
• As a result of the foregoing factors, total operating income increased by 4.7%.
• Impairments increased, however, the credit loss ratio reduced to 0.28% (2017: 0.29%), remaining at the lower end of its long-term average trend. Further information is provided on page 105.
• Costs increased 5.1% reflecting continued investment into IT and digital initiatives and higher headcount to support increased activity and growth strategies; partly offset by the pending acquisition of the South African head office building and the related rental provision no longer required.
Analysis of key earnings drivers
Net core loans and advances
£’million Home currency (million)
31 March2018
31 March2017 % change
31 March2018
31 March2017 % change
UK 9 687 8 621 12.4% £9 687 £8 621 12.4%
Southern Africa 15 445 14 086 9.6% R256 702 R236 225 8.7%
Total 25 132 22 707 10.7%
9 687£’million
United Kingdom
17
0
2 000
4 000
6 000
8 000
10 000
Net core loans and advances
1510 11 12 13 14 1609 18
R’million
Southern Africa
256 702
0
50 000
100 000
150 000
200 000
250 000
300 000
171509 10 11 12 13 14 16 18
Trend reflects numbers as at the year ended 31 March.
Specialist Banking

107Investec integrated annual report 2018
Divisio
nal review
(continued)
Trend reflects numbers as at the year ended 31 March.
Total deposits
£’million Home currency (million)
31 March2018
31 March2017 % change
31 March2018
31 March2017 % change
UK 11 624 11 013 5.5% £11 624 £11 013 5.5%
Southern Africa 19 363 18 096 7.0% R321 823 R303 470 6.0%
Total 30 987 29 109 6.5%
11 624£’million
United Kingdom
R’million
Southern Africa
0
2 000
4 000
6 000
8 000
10 000
12 000 321 823
0
50 000
100 000
150 000
200 000
250 000
300 000
350 000
17
Total deposits
1511 12 13 14 16 171509 0910 10 11 12 13 14 1618 18
Specialist Banking

108 Investec integrated annual report 2018
Divisio
nal review
(continued)
An analysis of net core loans over the period Refer to further information on pages 42 to 45 in volume two.
Net core loans – Southern Africa
R’million31 March
201831 March
2017 % change
Lending collateralised by property 40 297 40 332 (0.1%)Commercial real estate 36 512 36 375 0.4%
Commercial real estate – investment 32 694 33 521 (2.5%)Commercial real estate – development 3 043 1 868 62.9%Commercial vacant land and planning 775 986 (21.4%)
Residential real estate 3 785 3 957 (4.3%)
Residential real estate – development 2 995 2 619 14.4%Residential real estate – vacant land and planning 790 1 338 (41.0%)
High net worth and other private client lending 133 238 117 743 13.2%Mortgages 67 966 61 330 10.8%High net worth and specialised lending 65 272 56 413 15.7%Corporate and other lending 83 806 78 476 6.8%Acquisition finance 13 982 13 225 5.7%Asset-based lending 7 057 5 788 21.9%Fund finance 4 909 5 548 (11.5%)Other corporates and financial institutions and governments 47 884 43 914 7.2%Asset finance 2 678 2 697 (0.7%)
Small ticket asset finance 2 225 2 142 3.9%Large ticket asset finance 453 555 (18.4%)
Project finance 6 641 6 414 3.5%Resource finance 655 890 (26.4%)Portfolio impairments (639) (326) 96.0%Total net core loans 256 702 236 225 8.7%
Net core loans – UK and Other
£’00031 March
201831 March
2017 % change
Lending collateralised by property 1 934 296 1 893 121 2.2%Commercial real estate 1 118 080 1 158 847 (3.5%)
Commercial real estate – investment 940 092 924 770 1.7%Commercial real estate – development 140 222 146 100 (4.0%)Commercial vacant land and planning 37 766 87 977 (57.1%)
Residential real estate 816 216 734 274 11.2%
Residential real estate – investment 237 795 253 622 (6.2%)Residential real estate – development 514 080 438 687 17.2%Residential real estate – vacant land and planning 64 341 41 965 53.3%
High net worth and other private client lending 1 913 432 1 592 671 20.1%Mortgages 1 479 499 1 227 640 20.5%High net worth and specialised lending 433 933 365 031 18.9%Corporate and other lending 5 901 473 5 178 338 14.0%Acquisition finance 1 530 815 1 309 335 16.9%Asset-based lending 354 872 333 731 6.3%Fund finance 1 030 450 861 140 19.7%Other corporates and financial institutions and governments 650 312 718 760 (9.5%)Asset finance 1 846 144 1 481 601 24.6%
Small ticket asset finance 1 377 753 1 055 528 30.5%Large ticket asset finance 468 391 426 073 9.9%
Project finance 483 427 463 958 4.2%Resource finance 5 453 9 813 (44.4%)Portfolio impairments (61 977) (43 388) 42.8%Total net core loans 9 687 224 8 620 742 12.4%
Specialist Banking

109Investec integrated annual report 2018
Divisio
nal review
(continued)
Additional information on the group’s South African investment portfolio
31 March 2018
Asset analysis£’million
Income analysis£’million
Asset analysis
R’million
Income analysisR’million
IEP Group 372 45 6 180 766
Equity investments^ 127 1 2 103 16
Property investments* 252 14 4 186 245
Total equity exposures 751 60 12 469 1 027
Associated loans and other assets 33 1 545 21
Total exposures on balance sheet 784 61 13 014 1 048
Debt funded 368 (28) 6 105 (486)
Equity 416 – 6 909 –
Total capital resources and funding 784 13 014
Operating profit before taxation** 33 562
Taxation (2) (33)
Operating profit after taxation 31 529
Risk-weighted assets 2 828 47 003
Ordinary shareholders’ equity held on investment portfolio – 31 March 2018 416 6 909
Ordinary shareholders’ equity held on investment portfolio – 31 March 2017 398 6 670
Average ordinary shareholders’ equity held on investment portfolio – 31 March 2018 407 6 790
Post-tax return on adjusted average ordinary shareholders’ equity –31 March 2018 7.6%
* The group’s investment holding of 26.75% in the Investec Property Fund and 15.07% in the Investec Australia Property Fund.^ Does not include equity investments residing in our corporate and private client businesses.** Further analysis of operating profit before taxation:
£’million Total
Net interest expense (62)
Net fee and commission income 87
Investment income 18
Share of post taxation profit of associates 45
Trading and other operating losses (1)
Total operating income before impairment losses on loans and advances 87
Impairment losses on loans and advances –
Operating income 87
Operating costs (1)
Operating profit before goodwill, acquired intangibles and non-operating items 86
Profit attributable to other non-controlling interests (53)
Operating profit before taxation 33
Specialist Banking

110 Investec integrated annual report 2018
Divisio
nal review
(continued)
Additional information on the group’s South African investment portfolio
31 March 2017
Asset analysis£’million
Income analysis£’million
Asset analysis
R’million
Income analysisR’million
IEP Group 323 16 5 413 303
Equity investments^ 130 – 2 177 (1)
Property investments* 260 22 4 361 399
Total equity exposures 713 38 11 951 701
Associated loans and other assets 36 2 612 36
Total exposures on balance sheet 749 40 12 563 737
Debt funded 351 (24) 5 893 (446)
Equity 398 – 6 670 –
Total capital resources and funding 749 12 563
Operating profit before taxation** 16 291
Taxation (3) (53)
Operating profit after taxation 13 238
Risk-weighted assets 2 510 42 099
Ordinary shareholders’ equity held on investment portfolio – 31 March 2017 398 6 670
Ordinary shareholders’ equity held on investment portfolio – 31 March 2016 301 6 354
Average ordinary shareholders’ equity held on investment portfolio – 31 March 2017 349 6 512
Post-tax return on adjusted average ordinary shareholders’ equity –31 March 2017 3.7%
Post-tax return on adjusted average ordinary shareholders’ equity – 31 March 2016 14.7%
Post-tax return on adjusted average ordinary shareholders’equity – 31 March 2015 15.1%
* The group's investment holding of 27.86% in the Investec Property Fund and 16.57% in the Investec Australia Property Fund.^ Does not include equity investments residing in our corporate and private client businesses.** Further analysis of operating profit before taxation:
£’million Total
Net interest expense (52)
Net fee and commission income 80
Investment income 35
Share of post taxation profit of associates 16
Trading and other operating losses (5)
Total operating income before impairment losses on loans and advances 74
Impairment losses on loans and advances –
Operating income 74
Operating costs (2)
Operating profit before goodwill, acquired intangibles and non-operating items 72
Profit attributable to other non-controlling interests (56)
Operating profit before taxation 16
Specialist Banking

111Investec integrated annual report 2018
Divisio
nal review
(continued)
Specialist Banking
Additional information on the UK Specialist Banking costs
£’million
March 17 March 18Investment into Private Bank Banking business
Cost analysis — March 2018 vs March 2017
Cost to income ratio: 74.8%
Actual operating costs March 2017: £13.1m £11.2m £507.5m = £531.8m
Actual operating costs March 2018: £23.2m £11.8m £511.9m = £546.9m
Actual operating costs Sept 2017: £12.4m £6.6m £241.0m = £260.0m
72.0% 76.9%
Actual ̂ Adjusted* Actual ̂
Double Premises Specialist Banking normalised costs
Statutory UK Specialist Bank
500
510
520
530
540
550
560
531.8
Bulk of investment completed by FY18 after which costs
�atten and remain in the base
Double premises costs now in the base
Costs up 0.9% in the year
10.1 0.64.4 546.9
* Adjusted to exclude the investment into the Private Bank Banking business and double premises costs incurred in the year to 31 March 2018 as reflected above.
^ Refer to pages 49 and 51 in volume three.

112 Investec integrated annual report 2018
Divisio
nal review
(continued)
Specialist Banking
£’000 Percentage
Total costs Cost to income ratio
0
100 000
200 000
300 000
400 000
500 000
600 000
11 12 13 14 15 1716 18
0102030405060708090
Total costs
Percentage
Total costs Cost to income ratio
0
1 000
2 000
3 000
4 000
5 000
6 000
7 000
R’million
Total costs
11 12 13 14 15 1716 18
0
10
20
30
40
50
60
£’000
0
10 000
20 000
30 000
40 000
50 000
11 12 13 14 15 1716
Impairments
18
00.1
0.2
0.3
0.4
0.5
0.6
0.7
0.8
Percentage
Impairments Credit loss ratio
0100200300400500600700800900
1 000
R’million
11 12 13 14 15 1716
Impairments
18
00.1
0.2
0.3
0.4
0.5
0.6
0.7
0.8
Impairments Credit loss ratio
Percentage
UK Specialist Bank ongoing Southern Africa Specialist Bank ongoing
Total operating income
11 12 13 14 15 1716
£’000
Other operating income Customer �ow trading income
Investment and associate income Net interest incomeNet fees
0
100 000
200 000
300 000
400 000
500 000
600 000
700 000
18
Total operating income
11 12 13 14 15 1716
R’million
0
2 000
4 000
6 000
8 000
10 000
12 000
14 000
Other operating income Customer �ow trading income
Investment and associate income Net interest incomeNet fees
18
£’000
0
40 000
80 000
120 000
160 000
200 000
11 12 13 14 15 1716
Net pro�t before tax ROE post tax
0
4
8
12
16
20
Percentage
Net pro�t before tax and ROE
18
0
1 000
2 000
3 000
4 000
5 000
6 000
R’million
Net pro�t before tax ROE post tax
11 12 13 14 15 1716
Net pro�t before tax and ROE (including theinvestment portfolio)*
18
0
5
10
15
20
Percentage
* Refer to pages 109 and 110.
Trends in the above graphs are for the year ended 31 March, unless otherwise stated.

113Investec integrated annual report 2018
Divisio
nal review
(continued)
Specialist Banking
Q. How has the operating environment impacted your business over the past financial year? The past year saw continued uncertainty around Brexit and with the knock on impact on confidence levels, mid-market M&A and equity capital markets activity was subdued.
Lower volatility reduced client hedging and trading activity, particularly when compared to the elevated levels in the previous year following the Brexit vote.
Both corporate and private clients remained active during the year, driving solid loan growth.
Regulation has been a key theme in the financial services industry with various new regulations being implemented in 2018. We have run a number of regulatory projects over the year to ensure operational readiness and business model resilience.
Q. What have been the key developments in your business over the past financial year?The private banking business has continued to focus on the build-out of its UK platform with the bulk of its incremental investment having completed in the current financial year. The business has already seen positive progress with a substantial number of new-to-bank, key high net worth clients on-boarded over the past year and growth in the mortgage book.
In addition to this, the further development of the private banking proposition has now delivered a fully functional onshore and offshore banking business, coupled with the niche wealth-creating areas of structured property finance and private capital. These offerings, now all appropriately integrated, give high net worth clients the ability to
both bank with Investec on a daily basis, in a variety of on and offshore jurisdictions, as well as look to the firm for assistance, support and partnership in wealth-creating opportunities where they require capital.
The corporate business continued to generate a sound level of earnings across its franchise businesses. Strong loan growth was diversified across our lending businesses with notable activity levels in our asset finance, fund finance and corporate lending businesses.
We have successfully managed down our cost of funding over the year, while maintaining appropriate and conservative liquidity levels and without disrupting our funding channels. This together with combined loan book growth of 12.4% has resulted in a solid increase in our net interest income and a strong annuity base going into the coming year.
Q. What are your strategic objectives in the coming financial year?We will continue to focus on deepening our franchise and growing our client base across growth-orientated companies, institutional investors, the private equity community, wealthy entrepreneurs and high net worth clients.
In line with our strategy to be a high-tech and high-touch domestically relevant bank, a key focus has been around digital initiatives to expand our client offering. A specific focus will be on developing smart digital solutions and transactional products and services for businesses. This will be complementary to our strategy to grow our offering to this segment of the market.
The emphasis on increasing capital light activities within the bank will continue into the coming year. With this in mind, one of our focus areas is on expanding our funds and investment products business to allow us to create off-balance sheet solutions
that meet client needs while reducing capital intensity. We will do this by creating investment opportunities aligned to our specialist areas of expertise and our access to distinctive deal flow, particularly targeted at our institutional clients who already invest in our funds.
The investment into the private bank has created a scalable foundation which will allow us to focus on client acquisition and retention in the coming year – a shift from the current focus on platform development.
Q. What is your outlook for the coming financial year?Over the last few years, the specialist bank has generated a sustainable level of recurring income which we would expect to continue into the coming year, while at the same time remaining cautiously optimistic given the uncertain political backdrop and the potential impact on economic activity levels.
The strategy to accelerate the run down of the legacy portfolio, together with the completion of the bulk of the incremental investment into the private bank and the reduction in the double premises cost in the coming year, gives us a clear runway to grow our key franchise businesses.
David van der Walt and Ciaran Whelan
Geographical business leaders United Kingdom
Questions and answers

114 Investec integrated annual report 2018
Divisio
nal review
(continued)
Specialist Banking
Q. How has the operating environment impacted your business over the past financial year? The global economy saw positive momentum during the course of the year, whilst the South African environment remained volatile and uncertain particularly leading up to December 2017. Our clients however, have remained active and our international offering in our client segments remains a strategic advantage.
Q. What have been the key developments in your business over the past financial year?The Specialist Bank in South Africa reported results ahead of the prior period. This reflects our continued client focus and co-ordination across divisions and implementation of enhanced strategies to penetrate our existing client base and grow our market share. This together with the combined book growth of 8.7% has resulted in a strong increase in our net interest and annuity income.
Investment in our digital and technology platforms continues as we remain competitive in our client facing digital platform, while simultaneously focusing on efficiencies in our core infrastructure. We moved up from fourteenth to second place ranking for our mobile app as ranked by MyPrivateBanking Research, and were recently awarded ‘Best Digital bank in South Africa’ by Global Finance publication.
We were recognised by the Financial Times of London as the best Private Bank and Wealth Manager in South Africa for the fifth year running. This is testament to our continued efforts to offer our private clients an international, streamlined offering.
The launch of Investec Life has been particularly successful, with over R1 billion in cover written in the first six months of its launch in 2017. Investec Life’s approach to focus on simplification, personalisation and technical integration should continue to underpin growth in its business.
Q. What are your strategic objectives in the coming financial year?Building and developing our client franchises remains integral to the growth and development of our organisation. We are committed to optimising the client experience as part of our strategy to deepen our relationships with our core client base and offering them a broad spectrum of services and products.
Our strategic focus in South Africa remains the following:
• Grow market share in our niche businesses
• Identify new sources of revenue across our existing client base
• Manage our liquidity ratios with an emphasis on retail funding initiatives
• Manage our capital to optimise returns
• Invest in our technology platforms, including in increased digitalisation of products and services
• Launch Investec for Business which is designed to deliver an integrated service offering to mid-market corporates.
Q. What is your outlook for the coming financial year?We remain cautiously optimistic in light of the past year’s challenging political environment. Our strategy to identify new sources of revenue in order to remain relevant, together with our sustainable level of recurring income and the uplift in business confidence should continue to support momentum and reasonable levels of client activity in the Specialist Banking businesses.
Richard Wainwright
Geographical business leader Southern Africa
Questions and answers

Corporategovernance and corporate responsibility

Co
rpo
rate go
vernance and co
rpo
rate respo
nsibility
Corporate governance
116 Investec integrated annual report 2018
“Sound corporate governance is implicit in Investec’s values, culture, processes, functions and organisational structure. The board sets the tone from the top in the manner in which it conducts itself and oversees the structures and the framework for corporate governance”
Former chairman’s introductionDear Shareholder
Investec thrives on change, continually challenging the status quo and recognising that success depends on flexibility, innovation and enthusiasm in meeting the needs of our changing environment. In light thereof, I am pleased to announce that as part of the management succession plan, as announced by the board and as discussed in more detail below, I stepped down as chairman of the board on 15 May 2018. Perry Crosthwaite, the Investec group’s former senior independent non-executive director became chairman of the group on 15 May 2018. Perry Crosthwaite was appointed as non-executive director of the Investec Limited and Investec plc board in June 2010. Perry stepped down as chairman of the remuneration committee with Philip Hourquebie assuming the position on 1 April 2018. I am humbled to be continuing with the Investec group as joint chief executive officer with effect from 1 October 2018.
We present the annual corporate governance report for the year ended 31 March 2018, which describes our approach to corporate governance. For the purpose of this report, the boards of Investec plc and Investec Limited will be referred to as the board.
This year two chairman’s letters will be included in the report as a result of the management change implemented as indicated above.
From an outlook perspective, the past year was difficult to navigate as uncertainty in both South Africa and the UK remained. Corporate failures within all jurisdictions exacerbated this uncertainty. On a macro front the global economy experienced synchronised growth for the first time before the global financial crisis. The complexities of Brexit continue to cause uncertainty in the UK economy. While growth in South Africa was down in the first quarter of 2018 relative to the final quarter of 2017, the rest of the year should be positive due to a mix of investor confidence and a rebound in consumer spending.
Sound corporate governance is implicit in Investec’s values, culture, processes, functions and organisational structure. Our values require that directors and employees behave with integrity, displaying consistent and uncompromised moral strength in order to promote and maintain trust. We demand cast-iron integrity in all internal and external dealings, consistently and uncompromising displaying moral strength and behaviour.
We believe that open and honest dialogue is the appropriate process to test decisions, reach consensus and accept responsibility. We have adopted a multidimensional approach involving everyone in the organisation which incorporates challenge at every level as a defence mechanism against corruption and fraud. Creating fraud and ethics awareness throughout the organisation assists in influencing ethical behaviour.
The board oversees and monitors, on an ongoing basis, how the consequences of our organisation’s activities and outputs affect its status as a responsible corporate citizen. This oversight and monitoring is performed against measures and targets agreed with management in the workplace, economy, society and the environment.
Our group wide philosophy seeks to maintain an appropriate balance between the interests of all stakeholders, and is closely aligned to our culture and values which include risk consciousness, meritocracy, material employee ownership and an unselfish contribution to colleagues, clients and society.
We respect the dignity of all individuals and embrace diversity through openness and by the sincere, consistent and considerate manner in which we seek to interact.
The past year in focusIn an uncertain and volatile world, Investec’s culture and values continue to support the organisation in achieving its strategic objectives. The board has remained committed to the highest standards of integrity and ethical behaviour. Our client focus and entrepreneurial spirit have continued to be front of mind over the past year. The board and management have sought to develop a strategy for the group which is balanced in terms of managing the risks presented in these uncertain times and positioning for future opportunities as they arise.
Management successionThe board, working closely with the DLC nominations and directors’ affairs committee (nomdac), continued to drive and monitor succession planning. Succession of the group’s long-serving executive management has been an ongoing focus area for the board with the group’s initial announcement in this regard made in November 2015, with further announcements in February 2018 and May 2018. The details pertaining to the management succession will be addressed in more detail in the governance report.

(continued)
Corporate governance
Co
rpo
rate go
vernance and co
rpo
rate respo
nsibility
117Investec integrated annual report 2018
DiversityAt Investec, we are committed to attracting, developing and retaining a diverse team of talented people. A diverse workforce is vital to our ability to be an innovative organisation that is able to adapt and prosper in a fast changing world. Our recruitment strategies prioritise previously disadvantaged, female and disabled candidates where possible. We have various processes to encourage debate and dialogue around valuing diversity and difference.
To help us measure the pace of change, we have set a number of goals and targets. Investec is a member of the 30% Club in South Africa and the UK committing to a goal of 30% women on the board, and has made good progress towards the target of 33% female representation by 2020, per the Hampton-Alexander Review. Investec has signed up to the Women in Finance Charter in the UK, pledging to promote gender diversity by having a senior executive team member responsible and accountable for gender diversity and inclusion, setting internal targets for gender diversity at senior management levels, publishing progress annually against these targets, and linking the pay of senior executives to delivery against these gender diversity targets.
In addition, during the year we reported on our gender pay gap. We are confident that across our organisation men and women are paid equally for doing the same job. Our gender pay gap occurs primarily because there is a lower proportion of women in senior leadership and revenue-generating roles which attract higher market levels of pay. We are dedicated to improving our position in line with our commitment to promote diversity. We know that while we have worked to address greater representation of women, we have more to do. We have measures in place to improve this and we are committed to advancement and holding ourselves publicly accountable.
Having a diverse board and workplace is and remains important to the group bringing as it does the clear benefits of distinct and different outlooks, alternative viewpoints, and challenging mindsets.
Strategic initiativesThe board has continued to exercise leadership, integrity and judgement in pursuit of Investec’s strategic goals and objectives. In terms of positioning for future opportunities, the group has continued to invest into the business ensuring that it remains competitive and relevant in the markets in which it operates. Strategic initiatives were focused on improving the position and returns of the UK bank, reshaping the mid-market corporate offering in South Africa and improving economic returns across the group.
Board effectivenessThe board continues to regularly review its own effectiveness and therefore undertakes an evaluation of its performance and that of its committees and individual directors annually, with independent external input into the process every third year. The last board effectiveness review was conducted by an independent external facilitator in 2015. This year the board effectiveness review was internally facilitated.
The responses received from the review indicated that the board is satisfied with the various aspects in relation to the board and committee governance and functioning. Comments and scores received provided a sense that the board members were of the opinion that the board’s dynamic continued to strengthen and improve. Strengths highlighted in the comments in respect of board effectiveness indicated that the board is “increasingly more effective” and the board was settling down after a number of members joined the board.
Shareholder engagementDuring the past year, the board continued its shareholder consultations. The primary focus of these consultations was executive remuneration and succession, however, these consultations have also provided an opportunity to discuss governance and business strategy more broadly with shareholders. From a governance perspective, the dialogue centred on the composition of the board, while on remuneration, the discussion related to the new remuneration policy and appropriate linkage between pay and performance.
CompositionWith regard to the composition of the board, Peter Thomas stepped down from the board following the annual general meeting on 10 August 2017 and Philip Hourquebie was appointed to the board on 14 August 2017.
ConclusionI would like to thank the board for their dedication and the time spent with them during my time as chairman of the board. I would furthermore like to congratulate Perry Crosthwaite on his new appointment and wish him all the best in this new endeavour. The group will benefit from his continued contribution and dedication.
Fani TitiFormer chairman
12 June 2018

Co
rpo
rate go
vernance and co
rpo
rate respo
nsibility
(continued)
Corporate governance
118 Investec integrated annual report 2018
Chairman’s introductionDear Shareholder
As newly appointed chairman of the board I am pleased to provide you with our corporate governance report. It is a great honour to be appointed chairman of Investec.
The year aheadWe approach the year ahead with confidence in our leadership and strategy. Stability within the group and the orderly transition of leadership roles within the organisation has been and will continue to be a key area of focus for the board. The board will continue to motivate and lead our people to ensure long-term success, and to ensure that we operate from an agile and technologically-enabled platform.
In this continually changing environment, the board more than ever, needs to focus on its key strategic priorities. The board will also continue to ensure that Investec has the ability to react rapidly to the changing environment, and ensure that Investec’s strategic objectives remain valid.
ConclusionThe board congratulates the new executive team on their appointments. The board is confident that Fani Titi and Hendrik du Toit together with senior management, will continue to grow and build Investec’s core businesses and deliver the right outcomes for the group’s clients and stakeholders.
Over the following pages, you will find more detail of our governance framework, including who our board and management are, how they make decisions and what they have done over the past year in terms of their leadership, strategic direction and oversight of the organisation. We hope that this report, together with the integrated report and financial statements will provide you with an overview of how we are managing the group and looking after the interests of our stakeholders.
Perry CrosthwaiteChairman
12 June 2018

(continued)
Co
rpo
rate go
vernance and co
rpo
rate respo
nsibility
119Investec integrated annual report 2018
• Regulatory context 163
• Statement of compliance 163
• Other statutory information 163
• Board report 132
– DLC nominations and directors’ affairs committee report 140
– DLC social and ethics committee report 146
– DLC audit committee report 151
– DLC board risk and capital committee report 158
– DLC remuneration committee report 161
• Management committees 162
• Governance framework 120
• Board roles 123
• Director biographies 124
• Board composition 130
Corporate governance
Within this report you will find: Page
Who we are
What we did
How we comply

Co
rpo
rate go
vernance and co
rpo
rate respo
nsibility
(continued)
120 Investec integrated annual report 2018
Governance frameworkInvestec operates under a dual listed companies (DLC) structure and considers the corporate governance principles and regulations of both the UK and South Africa before adopting the appropriate standard for the group which also complies with requirements in both jurisdictions.
Who we areFrom a legal perspective, the DLC is comprised of:
• Investec plc – a public company incorporated in the UK and listed on the London Stock Exchange with a secondary listing on the Johannesburg Stock Exchange; and
• Investec Limited – a public company incorporated in South Africa and listed on the Johannesburg Stock Exchange, with secondary listings on the Namibia Stock Exchange and the Botswana Stock Exchange.
The boards of Investec plc and Investec Limited are identical in terms of their composition and board meetings are held jointly. The committee structure has been derived from the requirements of the UK Corporate Governance Code and the King IV Report on Corporate Governance, as well as the activities of the group.
Corporate governance
Stakeholders (employees, shareholders, government, regulatory bodies, clients, suppliers, communities)
Audit sub-committees
Investec plc and Investec Limited (INL) board of directors
Global forums/
committees
Deal forum/new product
forum
DLC social and ethics committee
Group investment committee
DLC board risk and capital committee
DLC audit committees
DLC nominations and directors’ affairs
committee
DLC remuneration committee
Audit and compliance implementation forums
Global credit committeeGlobal market risk forum
Group asset and liability committeesGroup operational risk committees
IT strategy committeeGlobal compliance forum
Global customer and conduct committee
Compliance
Internalaudit
DLC capital committees
Group legal risk forums
Policy executive risk review
forum
Review executive risk review
forum
Group risk and capital committee

(continued)
Co
rpo
rate go
vernance and co
rpo
rate respo
nsibility
121Investec integrated annual report 2018
Corporate governance
Management and board successionStephen Koseff (chief executive officer of the Investec group), Bernard Kantor (managing director (MD) of the Investec group) and Glynn Burger (risk and finance director of the Investec group) are part of the “founding members” of Investec and for almost 40 years, together with the board and the group’s senior management team, have steered the group to becoming an internationally recognised specialist bank and asset manager.
As part of the group’s succession plan and orderly transition from the founding members to the next generation of leadership, the following management and board succession changes have and shall be implemented subject to regulatory approval:
Investec Limited and Investec plc board – executive director changesStephen Koseff and Bernard Kantor will step down from their roles on 1 October 2018. From that date until 31 March 2019 they will continue to serve as executive directors and be available to provide support and advice to the incoming executives. As from 1 April 2019 they will become non-executive directors.
Glynn Burger, group risk and finance director, will retire on 31 March 2019. Glynn remains available and willing to assist in any capacity that the new management team require him for.
Fani Titi who has been a non-executive director on the Investec group board since January 2004 and chairman of the group since November 2011, and Hendrik du Toit the founding CEO of Investec Asset Management and an executive director of the group since December 2010, have been appointed as Joint CEO designates on 1 April 2018. On 1 October 2018 they will become joint CEOs of the group and will be held jointly accountable and responsible for the leadership and management of the Investec group. Hendrik will remain CEO of Investec Asset Management until 30 September 2018 to ensure an orderly transition in this business.
Kim McFarland, chief operating officer (COO) and chief financial officer (CFO) of Investec Asset Management since December 1993, will take over as group finance and operations director on 1 April 2019. Kim will continue with her duties as COO and CFO of Investec Asset Management until 31 March 2019 to support an orderly transition in this business.
Ciaran Whelan, who has held various senior positions globally with the Investec group over the past 30 years, and who is currently global joint head of the Specialist Bank and Global Head of Private Banking, will succeed Glynn Burger as director of risk on 1 April 2019. Ciaran will remain the global head of the Private Bank until 31 March 2019.
During the transition period Stephen, Bernard and Glynn will work closely with the new executive designates to ensure a smooth and orderly transition.
Investec Limited and Investec plc board – non-executive director changesFani Titi has stepped down as group chairman.
Perry Crosthwaite, the Investec group’s senior independent non-executive director has been appointed as chairman of the group on 15 May 2018. Perry Crosthwaite was appointed as a non-executive director of the board in June 2010. Perry’s biography follows later in this report.
Perry Crosthwaite has stepped down as chairman of the remuneration committee with Philip Hourquebie assuming the position on 1 April 2018. Philip was appointed as a non-executive director of the board in August 2017. Philip’s biography follows later in this report.
Zarina Bassa has been appointed as the group’s senior independent non-xecutive director on 1 April 2018. Zarina was appointed as a non-executive director of the board in November 2014. Zarina’s biography follows later in this report.
Chairman of Investec Bank Limited and Investec Bank plcFani Titi has stepped down as chairman of Investec Bank Limited with Khumo Shuenyane assuming this position on 15 May 2018. Khumo has been a director of Investec Bank Limited since August 2014.
Fani Titi has stepped down as chairman of Investec Bank plc with Brian Stevenson assuming this position on 15 May 2018. Brian has been a director of Investec Bank plc since September 2016.
Global divisional managementJohn Green and Mimi Ferrini became deputy CEOs of Investec Asset Management on 1 April 2018 and from 1 October 2018, will assume the roles of Joint CEOs of the business.
David van der Walt and Richard Wainwright remain CEOs of Investec Bank plc and Investec Bank Limited, respectively. David van der Walt will remain joint global head of the Specialist Bank together with Richard Wainwright who replaced Ciaran Whelan in this role on 1 April 2018.
Steve Elliott remains global head of Investec Wealth & Investment.
Nishlan Samujh, the current global group CFO, will remain in his role.

Co
rpo
rate go
vernance and co
rpo
rate respo
nsibility
(continued)
Corporate governance
122 Investec integrated annual report 2018
Timeline of board and management changes
Current changes Future changes
Philip Hourquebie
• Became chairman of DLC remuneration committee
Zarina Bassa
• Became group senior independent non-executive director
Perry Crosthwaite
• Stepped down as chairman of DLC remuneration committee
Richard Wainwright
• Became Joint Global Head of the Specialist Bank with David van der Walt
Ciaran Whelan
• Stepped down as Joint Global Head of the Specialist Bank but remains Global Head of the Private Bank
Fani Titi and Hendrik du Toit
• Appointed as Joint CEO designates
Fani Titi
• Stepped down as group, IBP* and IBL** chairman and chairman of DLC nomdac (15 May 2018)
Perry Crosthwaite
• Became chairman of Investec group (15 May 2018) and chairman of DLC nomdac
Brian Stevenson
• Became chairman of IBP* and chairman of IBP* nominations committee (15 May 2018)
Khumo Shuenyane
• Became chairman of IBL** (15 May 2018)
Stephen Koseff
• Will step down as group CEO (remains an executive director of Investec Limited and Investec plc)
Bernard Kantor
• Will step down as group MD (remains an executive director of Investec Limited and Investec plc)
Fani Titi and Hendrik du Toit
• Will assume Joint CEO roles
Mimi Ferrini and John Green
• Will become Joint CEOs of Investec Asset Management
Stephen Koseff and Bernard Kantor
• Will step down as executive directors of Investec Limited and Investec plc
Glynn Burger
• Will step down as group risk and finance director
Ciaran Whelan
• Will step down as Global Head of Private Bank
Stephen Koseff and Bernard Kantor
• Will join the group board (Investec Limited and Investec plc) as non-executive directors
Ciaran Whelan
• Will become group risk director
Kim McFarland
• Will become group finance and operations director
1 April 2018 15 May 2018 1 October 2018 31 March 2019 1 April 2019
* Investec Bank plc.** Investec Bank Limited.

(continued)
Corporate governance
Co
rpo
rate go
vernance and co
rpo
rate respo
nsibility
123Investec integrated annual report 2018
Board rolesThe key governance roles and responsibilities of the board are outlined below:
ChairmanChief executive officer and managing director/joint group CEOs Group risk and finance director
Fani Titi/Perry Crosthwaite effective from 15 May 2018
Stephen Koseff and Bernard Kantor up to 30 September 2018 Hendrik du Toit and Fani Titi effective from 1 October 2018
Glynn Burger
• Set the board agenda, ensuring that there is sufficient time available for discussion of all items
• Encourage open and honest dialogue between all board members
• Lead and manage the dynamics of the board, providing direction and focus
• Ensure that the board sets the strategy of the group and assist in monitoring progress towards achieving the strategy
• Perform director evaluations
• Serves as the primary interface with regulators and other stakeholders on behalf of the board
• Lead and manage the group within the authorities delegated by the board
• Execution of group strategy
• Ensuring Investec’s unique culture is embedded and perpetuated
• Development and growth of all Investec’s businesses
• Ensures that the group’s risk management processes are effective
• Leads and manages the group finance functions
• Provides the board with updates on the group’s financial performance
• Approval of the risk management plan
Senior independent director (SID) Non-executive directors Company secretaries
Perry Crosthwaite/Zarina Bassa effective from 1 April 2018
Zarina Bassa, Laurel Bowden, Cheryl Carolus, David Friedland, Philip Hourquebie, Charles Jacobs, Ian Kantor, Lord Malloch-Brown KCMG, Khumo Shuenyane, Peter Thomas*
* Resigned on 10 August 2017 from Investec Limited and Investec plc
David Miller and Niki van Wyk
• Address any concerns or questions from shareholders and non-executive directors
• Provide a sounding board to the chairman
• Lead the board in the assessment of the effectiveness of the chairman, or the relationship between the chairman and the CEO
• Available to act as trusted intermediary for non-executive directors if required to assist them to challenge and contribute effectively
• Bring unique perspectives to the boardroom to facilitate constructive dialogue on proposals
• Constructively challenge and contribute to assist in developing the group’s strategy
• Monitor the performance of management against their agreed strategic goals
• Ensure the effectiveness of internal controls and the integrity of financial reporting
• Contributes to board effectiveness through outside contacts and opinions
• Ensure succession is in place
• Manage risk
• Maintain the flow of information to the board and its committees and ensure compliance with board procedures
• Minute all board and committee meetings to record the deliberations and decisions taken therein
• Ensure that the board complies with relevant legislation and regulation, including Listings Requirements
• Maintaining the companies statutory registers
• Ensure good corporate governance is implemented and advise the chairman and board in that regard

Co
rpo
rate go
vernance and co
rpo
rate respo
nsibility
(continued)
Corporate governance
124 Investec integrated annual report 2018
Director biographies as at 31 March 2018Biographies of our directors are outlined below, including their relevant skills and experience, other principal appointments and any appointments to Investec’s DLC committees for the year under review.
Fani Titi, chairman, Investec Limited and Investec plcAge: 56
Qualifications: BSc (cum laude), BSc Hons (cum laude) in Mathematics, MA in Mathematics, MBA
Relevant skills and experienceFani Titi has been a member of the boards of Investec Limited and Investec plc since January 2004 and has been non-executive chairman of Investec Limited and Investec plc from November 2011. He has also been a member of the Investec Bank Limited board from July 2002, and has chaired its board from June 2007. He has been a member of the Investec Bank plc board from August 2011, and its chairman from August 2014. He has served on the board of Investec Asset Management from November 2013. Fani was a founding member of the private investment group Kagiso Trust Investments Limited (now Kagiso Tiso Holdings), and later cofounded and led the public offering of Kagiso Media Limited on the JSE Limited as its CEO. Fani was subsequently the founding executive chairman of the private investment firm the Tiso Group, which subsequently merged with Kagiso Trust Investments to form Kagiso Tiso Holdings. Fani stepped down from the Tiso Group in 2008 to concentrate his time on his duties at the Investec group, while also looking after his private investment portfolio. Fani has over two decades of investment banking experience, and has sat on the boards of different investee companies and JSE listed companies
Other principal appointmentsInvestec plc, Investec Limited, Investec Bank plc, IEP Group Proprietary Limited, Investec Asset Management Holdings Proprietary Limited, Investec Asset Management Limited and a number of Investec subsidiaries
CommitteesDLC remuneration*, DLC board risk and capital, DLC nominations and directors’ affairs (chairman)** and DLC social and ethics (chairman)**
Date of appointmentInvestec Limited and Investec plc 30 January 2004
* Resigned from DLC remuneration committee as at 23 February 2018** Resigned as chairman of the DLC nominations’ and directors’ affairs committee and social and ethics committee
Perry KO Crosthwaite, senior independent director (SID)Age: 69
Qualifications: MA (Hons) (Oxon) in modern languages
Relevant skills and experiencePerry was appointed chairman of Investec plc and Investec Limited on 15 May 2018. Perry was previously senior independent director of Investec plc and Investec Limited, a post he held from August 2014 to March 2018, having joined the boards of Investec plc and Investec Limited in June 2010. Perry is a former chairman of Investec Investment Banking and Securities and left the group on 31 March 2004
Perry has financial experience gained through a distinguished career in investment banking with over 30 years of experience as a director in the city of London. Perry has served as a non-executive director of Melrose Industries plc from July 2005 to May 2016, and was a founding member of Henderson Crosthwaite Institutional Brokers Limited, serving as its director from 1986 to 1998
Other principal appointmentsInvestec Holdings (Ireland) Limited (chairman) and Investec Capital and Investments (Ireland) Limited
CommitteesDLC nominations and directors’ affairs, DLC remuneration committee (chairman)*
Date of appointmentInvestec Limited 18 June 2010 Investec plc 18 June 2010
* Resigned as chairman of the DLC remuneration committee on 31 March 2018

(continued)
Corporate governance
Co
rpo
rate go
vernance and co
rpo
rate respo
nsibility
125Investec integrated annual report 2018
Stephen Koseff, group chief executive officerAge: 66
Qualifications: BCom, CA(SA), H Dip BDP, MBA
Relevant skills and experienceStephen joined Investec in 1980. He has diverse experience within Investec as chief accounting officer and general manager of banking, treasury and merchant banking
Other principal appointmentsInvestec Bank Limited, Investec Bank plc and a number of Investec subsidiaries, Bid Corporation Limited (chairman), IEP Group Proprietary Limited
CommitteesDLC board risk and capital, DLC social and ethics and DLC capital (chairman)
Date of appointmentInvestec Limited 6 October 1986 Investec plc 26 June 2002
Bernard Kantor group, managing directorAge: 68
Qualifications: CTA
Relevant skills and experienceBernard joined Investec in 1980. He has had varied experience within Investec as a manager of the trading division, marketing manager and chief operating officer
Other principal appointmentsInvestec Bank Limited, Investec Bank plc and a number of Investec subsidiaries, Phumelela Gaming and Leisure Limited (chairman) and IEP Group Proprietary Limited
CommitteesDLC board risk and capital, DLC social and ethics and DLC capital
Date of appointmentInvestec Limited 8 June 1987 Investec plc 19 March 2002
Glynn R Burger, group risk and finance directorAge: 61
Qualifications: BAcc, CA(SA), H Dip BDP, MBL
Relevant skills and experienceGlynn joined Investec in 1980. His positions within Investec have included chief accounting officer, group risk manager and joint managing director for South Africa
Other principal appointmentsInvestec Bank Limited and a number of Investec subsidiaries
CommitteesDLC board risk and capital and DLC capital
Date of appointmentInvestec Limited 3 July 2002 Investec plc 3 July 2002

Co
rpo
rate go
vernance and co
rpo
rate respo
nsibility
(continued)
Corporate governance
126 Investec integrated annual report 2018
Hendrik J du Toit, Investec Asset Management chief executive officerAge: 56
Qualifications: BCom Law, BCom (Hons) (cum laude), MCom (cum laude), MPhil (Cambridge)
Relevant skills and experienceAfter lecturing economics at the University of Stellenbosch, Hendrik joined the Investment division of Old Mutual from where he moved to Investec in 1991 to establish Investec Asset Management
Other principal appointmentsInvestec Asset Management Holdings Proprietary Limited and Investec Asset Management Limited as well as their subsidiaries and non-executive director of Naspers Limited. Over the past two years, Hendrik has also served on the Global Business Commission for Sustainable Development
CommitteesNone
Date of appointmentInvestec Limited 15 December 2010 Investec plc 15 December 2010
Zarina BM Bassa, independent non-executive directorAge: 54
Qualifications: BAcc, DipAcc, CA(SA)
Relevant skills and experienceZarina is a former partner of Ernst & Young Inc. She joined the Absa Group in 2002 and was an executive director and a member of the group’s executive committee, with accountability for private banking. She has previously chaired the South African Public Accountants’ and Auditors’ Board and the South African Auditing Standards Board, has been a member of the JSE GAAP Monitoring Panel and the Financial Service Board. Zarina has previously served as a non-executive director of Kumba Iron Ore Limited and Sun International Limited amongst other
Other principal appointmentsThe Financial Services Board, Oceana Group Limited, Yebo Yethu Limited, Vodacom Proprietary Limited and Woolworths Holdings Limited and various Investec subsidiaries including Investec Bank Limited, Investec Bank plc, Investec Life Limited
Zarina has been appointed as the senior independent director (SID) of Investec plc and Investec Limited effective from 1 April 2018
CommitteesDLC audit (chairman), Investec plc audit (chairman), Investec Limited, and Investec Bank Limited audit (chairman), Investec Bank plc audit, DLC remuneration, DLC nominations and directors affairs and DLC board risk and capital
Date of appointmentInvestec Limited 1 November 2014 Investec plc 1 November 2014
Laurel C Bowden, independent non-executive directorAge: 53
Qualifications: MBA (INSEAD), BSc Electronic Engineering, HND Eng
Relevant skills and experienceLaurel is a founding partner at 83 North UK LLP (a private equity business), where her areas of focus include internet, enterprise software and fintech. Laurel has over 15 years’ investment experience and has led investments in many leading European technology companies, including Just Eat, Qliktech and Hybris (acquired by SAP). She was previously a director at GE Capital in London
Other principal appointments83 North Limited, Bluevine Capital Inc, Ebury Partners Limited, iZettle AB, Celonis GmbH, Mirakl SAS, TIS GmbH, Wonga Group Limited, MotorK Limited, Workable Technology Limited (the majority of these are companies which Laurel serves on as a representative of 83 North)
CommitteesNone
Date of appointmentInvestec Limited 1 January 2015 Investec plc 1 January 2015

(continued)
Corporate governance
Co
rpo
rate go
vernance and co
rpo
rate respo
nsibility
127Investec integrated annual report 2018
Cheryl A Carolus, independent non-executive directorAge: 60
Qualifications: BA (Law), Honorary doctorate in Law
Relevant skills and experienceCheryl was the South African High Commissioner to London between 1998 and 2001 and was chief executive officer of South African Tourism
Other principal appointmentsDe Beers Consolidated Mines Limited, Gold Fields Limited (chairman), The IQ Business Proprietary Limited, Ponahalo Capital Proprietary Limited, executive chairperson of Peotona Group Holdings Proprietary Limited (chair) and director of a number of the Peotona group companies and International Crisis Group. Constitution Hill Education Trust (chairman) and WWF South Africa
CommitteesDLC social and ethics
Date of appointmentInvestec Limited 18 March 2005 Investec plc 18 March 2005
David Friedland, independent non-executive directorAge: 65
Qualifications: BCom, CA(SA)
Relevant skills and experienceDavid is a former partner of both Arthur Andersen and KPMG Inc. where he also served as head of audit and risk in the KPMG Cape Town office before leaving in March 2013
Other principal appointmentsInvestec Bank Limited, Investec Bank plc, The Foschini Group Limited, Pick n Pay Stores Limited and Pres Les Proprietary Limited
CommitteesDLC board risk and capital (chairman), DLC capital and DLC nominations and directors’ affairs
Date of appointmentInvestec Limited 1 March 2013 Investec plc 1 March 2013
Philip A Hourquebie, independent non-executive directorAge: 65
Qualifications: BAcc, BCom (Hons), CA(SA)
Relevant skills and experiencePhilip has been a longstanding Regional Managing Partner of two regions of Ernst & Young Inc. (Africa and Central and South East Europe, including Turkey). Philip left Ernst & Young in 2014. As a senior partner at Ernst & Young Inc., Philip’s background is in the advisory services in both the private and public sector. As an advisory partner and senior client service partner, he has worked, inter alia, with clients in financial services, mining, telecommunications, consumer products and retail, state-owned enterprises, government agencies and government departments at all three levels. Philip has also been a past chair of the board of South African Institute of Chartered Accountants (SAICA)
Other principal appointmentsAveng Limited and Investec Property Fund Limited
CommitteesDLC audit, Investec plc audit, Investec Limited and Investec Bank Limited audit, DLC remuneration (chairman*), DLC board risk and capital, DLC nominations and directors’ affairs*
Date of appointmentInvestec Limited 14 August 2017 Investec plc 14 August 2017
* Effective from 1 April 2018

Co
rpo
rate go
vernance and co
rpo
rate respo
nsibility
(continued)
Corporate governance
128 Investec integrated annual report 2018
Charles R Jacobs, independent non-executive directorAge: 51
Qualifications: LLB
Relevant skills and experienceCharles brings to the board a valuable combination of knowledge of the UK regulatory and corporate governance standards, global capital markets and M&A. Charles sits on the board of Fresnillo plc, a FTSE 100 company. Charles was elected as chairman and senior partner at the global law firm Linklaters LLP in October 2016, having been appointed a partner in 1999, and has over 27 years of experience of advising companies around the world, including in relation to their legal and regulatory requirements. Charles chairs the Linklaters Partnership Board and holds an LLB from Leicester University
Other principal appointmentsLinklaters LLP and Fresnillo plc (senior independent non-executive director and chairman of the remuneration committee)
CommitteesDLC remuneration
Date of appointmentInvestec Limited 8 August 2014Investec plc 8 August 2014
Ian R Kantor, non-executive directorAge: 71
Qualifications: BSc. Eng (Elec.), MBA
Relevant skills and experienceIan is co-founder of Investec, served as the chief executive of Investec Bank Limited until 1985 and was the chairman of Investec Holdings Limited. Ian is currently a non-executive director on the boards of Investec Asset Management Holdings Proprietary Limited and Investec Asset Management Limited
Other principal appointmentsChairman of Blue Marlin Holdings SA (formerly Insinger de Beaufort Holdings SA, in which Investec Limited indirectly holds an 8.3% interest)
CommitteesNone
Date of appointmentInvestec Limited 30 July 1980 Investec plc 26 June 2002
Lord Malloch-Brown KCMG, independent non-executive directorAge: 64
Qualifications: BA (Hons) (History), MA (Political Science)
Relevant skills and experienceLord Malloch-Brown is chairman of SGO Corporation Limited and Senior Advisor to the Eurasia Group, he was a UK government minister and member of the cabinet. Lord Malloch-Brown was formerly the deputy secretary-general of the United Nations as well as a vice president at the World Bank and head of United Nations Development Programme and a journalist at the Economist with wide ranging experience of boards
Other principal appointmentsSeplat Petroleum Development Company plc, ISquared Capital and Kerogen Capital
CommitteesDLC social and ethics (chairman)* and DLC nominations and director’s affairs
Date of appointmentInvestec Limited 8 August 2014 Investec plc 8 August 2014
* Effective from 1 April 2018

(continued)
Corporate governance
Co
rpo
rate go
vernance and co
rpo
rate respo
nsibility
129Investec integrated annual report 2018
Khumo L Shuenyane, independent non-executive directorAge: 47
Qualifications: BEcon, CA (England and Wales)
Relevant skills and experienceKhumo serves on the boards of a number of companies, in the Investec group. He is also a partner at Delta Partners, an advisory firm headquartered in Dubai focused on the telecoms, technology and digital sectors across emerging markets
Between 2007 and 2013 Khumo served as group chief mergers and acquisitions officer for MTN Group Limited and was a member of its group executive committee
Khumo was previously head of Principal Investments at Investec and was a member of Investec’s Corporate Finance division for a total of nine years
Prior to joining Investec in 1998, Khumo worked for Arthur Andersen in Birmingham (UK) and Johannesburg for six years from 1992. He qualified as a member of the Institute of Chartered Accountants in England and Wales in 1995
Other principal appointmentsInvestec Bank Limited (chairman)*, Investec Life Limited, Investec Specialist Investments (RF) Limited, Investec Asset Management Holdings Proprietary Limited and Investec Asset Management Limited
CommitteesDLC audit, Investec plc audit, Investec Limited and Investec Bank Limited audit and DLC board risk and capital, DLC nominations and directors’ affairs
Date of appointmentInvestec Limited 8 August 2014
Investec plc 8 August 2014
* Effective from 15 May 2018

Co
rpo
rate go
vernance and co
rpo
rate respo
nsibility
(continued)
Corporate governance
130 Investec integrated annual report 2018
Balance of non-executive and executive directors:
73%
27%
Non-executive
Executive
Non-independent non-executive directors 1Independent non-executives including chairman 10Executives 4
66.6% of board independent
Independence
Board compositionIndependenceAs at 31 March 2018, the board is compliant with Provision B.1.2 of the UK Corporate Governance Code in that at least half the board, excluding the chairman, comprises independent non-executive directors. The board is of the view that the chairman, Perry Crosthwaite, was considered independent on appointment.
As at 31 March 2018, the board is compliant with King IV in that the majority of non-executive directors are independent. A summary of the factors the board uses to determine the independence of non-executive directors are detailed below:
Relationships and associationsIan Kantor is the brother of Bernard Kantor, Investec’s managing director. Ian is also the founder and was previously chief executive officer of Investec. Accordingly, the board concluded that Ian could not be considered independent under the UK Corporate Governance Code and King IV.
Prior to joining the board on 1 March 2013, David Friedland was a partner of KPMG Inc. KPMG Inc. along with Ernst & Young Inc., are joint auditors of Investec Limited. The board concluded that, notwithstanding his previous association with KPMG Inc., David retains independence of judgement given he was never Investec Limited’s designated auditor or relationship partner and was not involved with its Investec account.
Philip Hourquebie has been a longstanding Regional Managing Partner of two regions of Ernst & Young Inc. (Africa and Central South East Europe, including Turkey) up to 2014. The board concluded that notwithstanding his previous association with Ernst & Young Inc. Philip retains independence of judgement as he was never Investec Limited’s designated auditor.
Charles Jacobs is the chairman and senior partner of the global law firm Linklaters LLP. Linklaters is currently one of Investec’s legal advisors. The board considers independence on an annual basis and again concluded that, notwithstanding this link, Charles retains independence of judgement. Charles does not form part of the Linklaters team that provides advice to Investec and he has not provided advice to Investec for over a decade. In addition, selection of legal advisors is not a board matter and is decided at the management level. If any decision were to be made at the board level regarding Linklaters, which has not happened to date, Charles would recuse himself in accordance with the provisions of the relevant Companies Act relating to directors’ interests. Charles plays no role in any team advising Investec. Where advice is provided by Linklaters to Investec, it is provided by separate Linklaters partners and not Charles. The legal fees paid to Linklaters have not been material either to Linklaters or Investec.
TenureThe board is also mindful of its responsibility to ensure that there remains an appropriate balance of skills and experience on the
board, and it is therefore of the view that the retention of certain members beyond nine years may in certain circumstances be beneficial in ensuring this balance and that orderly succession can take place.
The board follows a thorough process of assessing independence on an annual basis for each director. The board does not believe that the tenure of any of the current non-executive directors interferes with their independence of judgement and their ability to act in Investec’s best interest.
Accordingly, the board has concluded that Cheryl Carolus despite having been a director for more than nine years retains both financial independence and independence of character and judgement.
Notwithstanding the guidelines set out in the UK Corporate Governance Code, the board is of the view that Cheryl Carolus is independent of management and promote the interest of stakeholders. The balance of the executive and non-executive directors is such that there is a clear division of responsibility to ensure a balance of power, such that no one individual or group can dominate board processes or have unfettered powers of decision-making. The board believes that it functions effectively and evaluates its performance annually.
Attendance at creditDavid Friedland regularly attends credit committees of the group. The board considers his attendance at the committee to be desirable in terms of developing an understanding of the day-to-day issues facing the business.

(continued)
Corporate governance
Co
rpo
rate go
vernance and co
rpo
rate respo
nsibility
131Investec integrated annual report 2018
Terms of appointmentOn appointment, non-executive directors are provided with a letter of appointment. The letter sets out, among other things, duties, responsibilities and expected time commitments, details of Investec’s policy on obtaining independent advice and, where appropriate, details of the board committees of which the non-executive director will be a member. Investec has an insurance policy that insures directors against liabilities they may incur in carrying out their duties. On the recommendation of the nominations and directors’ affairs committee (nomdac), non-executive directors will be appointed for an expected term of nine years (three times three-year terms) from the date of their first appointment to the board.
Independent adviceThrough the senior independent director (SID) or the company secretaries, individual
directors are entitled to seek professional independent advice on matters related to the exercise of their duties and responsibilities at the expense of Investec. No such advice was sought during the 2018 financial year.
Company secretariesDavid Miller is the company secretary of Investec plc and Niki van Wyk is the company secretary of Investec Limited. The company secretaries are professionally qualified and have gained experience over a number of years. Their services are evaluated by board members during the annual board evaluation process. They are responsible for the flow of information to the board and its committees and for ensuring compliance with board procedures. All directors have access to the advice and services of the company secretaries whose appointment and removal are a board matter.
In compliance with the UK Corporate Governance Code, the King IV Code and the JSE Listings Requirements, the board has considered and is satisfied that each of the company secretaries is competent, has the relevant qualifications and experience and maintains an arm’s-length relationship with the board. In evaluating these qualities, the board has considered the prescribed role and duties pursuant to the requirements codified in the South African Companies Act of 2008 as amended, the UK Companies Act of 2006 and the listings and governance requirements as applicable.
In addition, the board confirms that for the period 1 April 2017 to 31 March 2018 neither of the company secretaries served as directors on the board nor did they take part in board deliberations and only advised on matters of governance, form or procedure.
Aspirational target: Per the Hampton-Alexander Review:
Good progress has been made
towards the target of 33% female
representation by 2020 which
continues to be a priority.
Board gender balance:
80%
20%
Male
Female
Geographical mix:
47%
47%
6%
South Africa
UK
Other
Diversity
Age:
40 – 50 7%51 – 60 40%61 and above 53%
Average length of service (years): for non-executive directors
UK Corporate Governance recommendation:Recommendation that non-executives should not serve longer than nine years from the time of their appointment.
Average tenure:
3
3
2
3
4
0 – 3 years
3 – 6 years
6 – 9 years
9 years plus – executive
9 years plus – non-executive
Tenure
4

Co
rpo
rate go
vernance and co
rpo
rate respo
nsibility
(continued)
Corporate governance
132 Investec integrated annual report 2018
Board reportRoleThe board seeks to exercise leadership, integrity and judgement in pursuit of Investec’s strategic goals and objectives to achieve long-term sustainability, growth and prosperity. In fulfilling this objective the board is responsible for:
• approving the group’s strategy
• acting as a focal point for, and custodian of corporate governance
• providing effective leadership on an ethical foundation
• ensuring the group is a responsible corporate citizen
• being responsible for the governance of risk, including risks associated with information technology
• ensuring the group complies with the applicable laws and considers adherence to non-binding rules and standards
• monitoring performance
• ensuring succession plan is in place.
The board
Meeting schedule and attendanceThe board meets at least six times annually, excluding the annual two-day board strategy session. For the period 1 April 2017 to 31 March 2018, four board meetings were held in the UK and four in South Africa, in line with the requirements of Investec’s DLC structure.
What we didFurthermore, during the year ended 31 March 2018, the board held one additional meeting each in the UK and South Africa, respectively. Unscheduled meetings are called as the need arises. Comprehensive information packs on matters to be considered by the board are provided to directors in advance of the meetings.
Key matters deliberated by our boardApart from standard and regular agenda items, such as report backs from each board committee and comprehensive reports from the CEO and financial director, discussions in relation to succession planning was of material importance for the group. The board remains focused on the group’s orderly transition plan to move from the founding members to the next generation of leadership.
The board focused on gender initiatives in the UK and South Africa and reviewed the headcount and revenue per employee within the organisation. Furthermore the new remuneration policy was considered.
The board complied with Investec’s policy regarding directors’ conflicts of interest and dealings with the group.
Performance of the bank in the UK, including digitalisation, and performance reviews of business were debated.
The board effectiveness review was considered and the strength and weaknesses highlighted and appropriate steps to address the weaknesses were identified.
The terms of references of board committees and the group policies were reviewed on an ad hoc basis.
The annual meeting with the South African Prudential Authority (previously known as the Banking Supervision Division of the South African Reserve Bank), to discuss strategy, performance, risk and the “flavour of the year” topics of International Financial Reporting Standards (IFRS 9) and effective risk data aggregation and risk reporting, was attended by board members.
During the course of the year the board received training in respect of the senior management and certificate regime, the Financial Conduct Authority (FCA) approach and topical matters including IFRS 9, Markets in Financial Instrument Directive (MiFID) II, Advanced Internal Rating Based (AIRB) approach and General Data Protection Regulation (GDPR) and King IV.

(continued)
Corporate governance
Co
rpo
rate go
vernance and co
rpo
rate respo
nsibility
133Investec integrated annual report 2018
How the board spent its time
Strategy formulation and monitoring of implementation
Finance and operations (including monitoring performance, capital and liquidity)
Governance, compliance and risk Other
25% 50% 20% 5%
Composition and meeting attendance
Board member sinceInvestec plc
(8 meetings in the year)Investec Limited
(8 meetings in the year)
Members during the year Independent Investec plc
Investec Limited
Eligible to attend Attended
Eligible to attend Attended
F Titi (former chairman)* On appointment 30 Jan 2004 30 Jan 2004 8 8 8 8
PKO Crosthwaite (chairman)** Yes 18 Jun 2010 18 Jun 2010 8 8 8 8
ZBM Bassa Yes 1 Nov 2014 1 Nov 2014 8 8 8 8
LC Bowden Yes 1 Jan 2015 1 Jan 2015 8 8 8 8
GR Burger Executive 3 Jul 2002 3 Jul 2002 8 8 8 8
CA Carolus Yes 18 Mar 2005 18 Mar 2005 8 8 8 8
HJ du Toit Executive 15 Dec 2010 15 Dec 2010 8 8 8 8
D Friedland Yes 1 Mar 2013 1 Mar 2013 8 8 8 8
PA Hourquebie*** Yes 14 Aug 2017 14 Aug 2017 6 6 5 5
CR Jacobs Yes 8 Aug 2014 8 Aug 2014 8 8 8 8
B Kantor Executive 19 Mar 2002 8 Jun 1987 8 8 8 8
IR Kantor No 26 Jun 2002 30 Jul 1980 8 8 8 8
S Koseff Executive 26 Jun 2002 6 Oct 1986 8 8 8 8
Lord Malloch-Brown KCMG Yes 8 Aug 2014 8 Aug 2014 8 8 8 8
KL Shuenyane Yes 8 Aug 2014 8 Aug 2014 8 8 8 8
PRS Thomas**** Yes 26 Jun 2002 29 Jun 1981 2 2 3 3
* F Titi stepped down as chairman of the board on 15 May 2018.** PKO Crosthwaite was appointed as chairman of the board on 15 May 2018.*** PA Hourquebie was appointed to the Investec boards with effect from 14 August 2017.**** PRS Thomas stepped down from the Investec boards with effect from 10 August 2017.

Co
rpo
rate go
vernance and co
rpo
rate respo
nsibility
(continued)
Corporate governance
134 Investec integrated annual report 2018
Board activities
Areas of focus What we did
Group strategy The board:
• formulated and monitored the implementation of its strategy
• provided constructive challenge to management
• monitored progress made with regard to agreed strategic initiatives
Group compliance, risk and corporate governance and audit
The board:
• received and reviewed compliance reports in order to confirm that the group meets all internal and regulatory requirements
• dialogued and approved the 2017/2018 risk appetite framework
• regularly assessed the group’s overall risk profile and emerging risk themes, receiving reports directly from the group risk manager and the chairman of the BRCC
• received reports on the group’s operational and technology capability, including specific updates on cyber risk capability and the strategy for technology and infrastructure services
• received reports in respect of specific risks monitored within the group including updates in respect of GDPR, Advanced Internal Rating Based (AIRB), Foundation Internal Rating Based (FIRB) and International Financial Reporting Standards (IFRS) 9
• considered and approved capital plans
• considered the impact of King IV, the JSE Listings Requirements and the revised UK Corporate Governance Code
• adopted the group Anti-Money Laundering (AML) and Counter Terrorism Financing (CFT) Policy
• approved the Recovery and Resolution Plans for the UK and South Africa
• considered and confirmed the independence of the non-executive directors having regard to factors that might impact their independence
• reviewed the Investec Bank plc and Investec Bank Limited’s revised corporate governance structures
• ensured the implementation of King IV
• considered auditor independence, appointment and monitoring of audit quality and related parties activities
Leadership The board:
• considered regular updates by the various committees including the remco, nomdac, the audit committee, social and ethics committee (SEC) and BRCC
• ensured that policies and behaviours set at board level are effectively communicated and implemented across the group
Effectiveness The board:
• considered the process for the 2018 board effectiveness review which took the form of a self-assessment followed by one-on-one meetings between the chairman and directors
• amended/added questions to the board effectiveness self-assessment regarding risk and audit, the presentation of projects to the boards, IT and succession planning
• noted that the 2018 effectiveness review showed good progress on those issues identified in the independently facilitated 2015 effectiveness review
• in light of the outcome of the board effectiveness review, finalised topics for directors’ development sessions

(continued)
Corporate governance
Co
rpo
rate go
vernance and co
rpo
rate respo
nsibility
135Investec integrated annual report 2018
Board activities continued
Areas of focus What we did
Remuneration The board:
• received a report from the remco chair at each meeting which covered a variety of topics including:
– regulatory developments pertaining to remuneration
• considered a communication plan for business to communicate their compliance with the UK Gender Pay Gap Reporting Requirements
• in conjunction with remco revised the new remuneration policy
Relations with stakeholders The board, in order to ensure satisfactory dialogue with shareholders, and to foster strong and open relationships with regulators, noted and discussed the key areas of feedback from these stakeholders, including feedback relating to:
• board refreshment and succession
• succession planning for the CEO, managing director and senior management
• remuneration of executive directors
• regular meetings and open dialogue with regulators
• improving returns across its businesses
Corporate citizenship The board discussed and monitored the various elements of good corporate citizenship including:
• the promotion of equality, the prevention of unfair discrimination and the reduction of corruption
• consideration of sponsorships, donations and charitable giving
• environmental, health and public safety, including the impact of the group’s activities and of its products and services
• consumer relationships including the group’s advertising, public relations and compliance with consumer protection laws
• labour and employment – the group’s standing in terms of the international labour organisation protocol on decent work and working conditions, employment relationships and its contribution towards the educational development of its employees
The board:
• satisfied itself that the Investec group’s standing and commitment to the various elements of good corporate citizenship remained in place and was actively enforced
• promoted the role Investec played in society
Subsidiary board and committee composition and governance
The board:
• discussed succession planning including an update on senior management succession
• received reports on the composition of the key subsidiaries of Investec plc and Investec Limited
• received reports on suggested changes to Investec Bank plc’s governance arrangements
• received reports from the nomdac at each meeting covering the matters within its delegated authority for review and consideration
• noted changes made to subsidiary boards on the recommendation of nomdac

Co
rpo
rate go
vernance and co
rpo
rate respo
nsibility
(continued)
Corporate governance
136 Investec integrated annual report 2018
Board activities continued
Areas of focus What we did
Financial results, liquidity, solvency and viability statement
The board:
• considered, reviewed and approved the financial results for the year ended 31 March 2018 for Investec plc and Investec Limited
• considered, reviewed and approved the financial results for the half year ended 30 September 2017
• assessed, confirmed and satisfied itself of the group’s viability statement (i.e. its ability to continue in operation and meet its liabilities taking into account the current position of the group, the board’s assessment of the group’s prospects and the principal risks it faces)
• confirmed that the group was liquid and that the solvency and liquidity test has been satisfied (i.e. a company satisfies the solvency and liquidity test at a particular time if, considering all reasonably foreseeable financial circumstances at that time: the assets of the company, as fairly valued, equal or exceed the liabilities of the company, as fairly valued; and it appears that the company will be able to pay its debts as they become due in the ordinary course of business for a period of:
– 12 months after date on which the test is considered; or
– in the case of a dividend, 12 months following the distribution)
• confirmed that adequate resources existed to support the group on a going concern basis and accordingly adopted the going concern concept
Management succession The board:
• considered matters relating to board succession and approved appointments to the board and board committees
• has and is ensuring the orderly transition from the founding members to the new generation in accordance with the agreed management succession plan
Marketing initiatives The board:
• received regular updates in respect of marketing initiatives within the group
Terms of reference and policies The board:
• reviewed and received regular updates in respect of the various committees terms and references and policies within the group

(continued)
Corporate governance
Co
rpo
rate go
vernance and co
rpo
rate respo
nsibility
137Investec integrated annual report 2018
Implementation of King IVThere have been significant corporate governance and regulatory developments, locally and internationally, since King III was issued in 2009, in South Africa which need to be taken into account. New global realities are testing the leadership of organisations on issues as diverse as inequality, globalised trade, social tensions, climate change, population growth, rapid technology and scientific advancements. In context of the above, the board has the challenge of steering the organisation to create value in a sustainable manner, to meet the needs of a growing population and the reality of dwindling natural resources.
The board welcomes the latest update of the King Code of Governance Principles, King IV, which was introduced to South Africa on 1 November 2016. Its outcomes driven approach to corporate governance corresponds with Investec’s commitment to consistent improvement and value creation.
The board has applied the King Code of Governance Principles (King III) throughout Investec since its inception. In line with the approach of King IV, this corporate governance review includes the board’s assessment, against the King IV principles applicable to Investec’s business, of the outcomes our approach to corporate governance has achieved. The board recognise that this is the first step in Investec’s King IV journey and will be spending time to further analyse Investec’s practices to support the various principles and outcomes in terms of King IV.
A gap analysis between King III and King IV was conducted. The board is satisfied that based on the outcome of the gap analysis performed that King IV has been complied with.
Consistent with King IV’s apply and explain approach to disclosure, Investec considers and applies the principles of corporate governance that are relevant to the group.
Below is a breakdown of the outcome of our endeavour to achieve good corporate governance in accordance with the principles of King IV:
King IV Principles
Leadership, ethics and corporate citizen
Principle 1
• The governing body should lead ethically and effectively
• The board is the governing body of Investec and committed to the good corporate governance principles as set out in King IV, the South African Companies Act, the JSE Listings Requirements, and the South African Banks Act and the UK Corporate Governance Code. Investec’s values of commitment, integrity, responsibility, innovation and connectivity guide the behaviour in the fulfilment of daily responsibilities and duties
• A governance framework is in place between Investec and its subsidiaries in terms of which committees of the board assume responsibility for these subsidiaries
Principle 2
• The governing body should govern the ethics of the organisation in a way that supports the establishment of an ethical culture
• The board sets the tone from the top in the manner in which it conducts itself and oversees the governance framework and structures. Investec operates under a DLC structure and therefore considers the corporate governance principles and regulations of both the UK and South Africa prior to adopting the appropriate standard for the group
• Investec’s code of ethics and business conduct guides the ethical behaviour of all Investec employees and directors. The code is published on the Investec intranet, and incorporated by reference in employee contracts, employee induction and training programmes
Principle 3
• The governing body should ensure that the organisation is and is seen to be a responsible corporate citizen
• The SEC has been tasked with the responsibility for monitoring the overall responsible corporate citizenship performance of Investec
• The board approves the strategy and priorities of Investec in accordance with its role of overseeing Investec’s conduct as a responsible corporate citizen. The board oversees and monitors how operations and activities of Investec affect its status as a responsible corporate citizen. This is measured against agreed performance targets, which contains both financial and non-financial measures, so that Investec’s core purpose and values, strategy and conduct are congruent with it being a responsible corporate citizen
Strategy, performance and reporting
Principle 4
• The governing body should appreciate that the organisation’s core purpose, its risks and opportunities, strategy, business model, performance and sustainable development are all inseparable elements of the value creation process
• The board is responsible for setting the strategy of the organisation. Strategy is discussed in depth at the annual board offsite. Senior management and executives present strategies to the board which the board in turn challenges and interrogates
• The monitoring and evaluation of the strategy is done by the combined boards of Investec plc and Investec Limited. A review of performance against strategic objectives is included in the board pack for each meeting

Co
rpo
rate go
vernance and co
rpo
rate respo
nsibility
(continued)
Corporate governance
138 Investec integrated annual report 2018
King IV Principles continued
Strategy, performance and reporting continued
Principle 5
• The governing body should ensure that reports issued by the organisation enables stakeholders to make informed assessments of the organisation’s performance and its short, medium and long-term prospects
• Investec’s integrated annual report is published annually and is available online and in printed form
• The board ensures that there are processes in place enabling complete, timely, relevant, accurate and accessible disclosures to stakeholders and monitors Investec’s communication with all stakeholders and disclosures made to ensure transparent and effective communication
• The DLC audit committee is tasked with the specific duty of considering whether the integrated annual report taken as a whole, was fair, balanced, and comprehensive and provided the information necessary for stakeholders to assess the group’s performance. Corporate governance disclosures in terms of UK and South African governance codes, the integrated annual report as well as annual financial statements are published on Investec’s website
Governing structures and delegation
Principle 6
• The governing body should serve as the focal point and custodian of corporate governance in the organisation
• The board sets the tone from the top in the manner in which it conducts itself and oversees the governance framework and structures. The board charter details the board’s role, matters specifically reserved for the board, delegation to the CEO, membership requirements and procedural conduct at board meetings, amongst other things
Principle 7
• The governing body should comprise the appropriate balance of knowledge, skills experience, diversity and independence for it to discharge its governance role and responsibilities objectively and effectively
• The board, with the assistance of nomdac, considers on an annual basis its composition in terms of balance of knowledge, skills, experience, diversity and independence and whether this enables it to effectively discharge its governance role and responsibilities objectively and effectively. The balance of executive and non-executive directors are such that there is a clear division of responsibility to ensure a balance of power. The board has more than one point of direct interaction with management
• Directors are required to submit, in writing, disclosures detailing any actual or potential conflict for consideration
Principle 8
• The governing body should ensure that its arrangements for delegation within its own structures promote independent judgement, and assist with balance of power and the effective discharge of its duties
• The board has retained specific matters for decision making by the board, as per the board charter. To achieve its objectives, the board, in terms of defined terms of reference, has delegated certain of its duties and functions to various committees, group forums and the CEO. Membership of the committees are as recommended in King IV and the UK Corporate Governance Code
Principle 9
• The governing body should ensure that the evaluation of its own performance and that of its committees, its chair and its individual members, support continued improvement in its performance and effectiveness
• The board continues to be committed to regularly evaluating its own effectiveness and that of its committees. The board undertakes an annual evaluation of its performance and that of its committees and directors, with independent external input into the process every third year
• The company secretaries’ performance is evaluated annually to ensure that there is an at arm’s length relationship with the board. The board is satisfied that the company secretaries and the function that they oversee is performing well
Principle 10
• The governing body should ensure that the appointment of, and delegation to, management contribute to role clarity and the effective exercise of authority and responsibilities
• The board appoints the CEO who has the necessary powers and mandate to manage the group and conduct the affairs of the group in his discretion and as he deems fit, save for matters specifically reserved for the board, as per the board charter or agreed by the board from time to time, dealt with and provided for in the formally adopted terms of reference of a board committee or other recognised group forum. The CEO is a regular invitee at nomdac.

(continued)
Corporate governance
Co
rpo
rate go
vernance and co
rpo
rate respo
nsibility
139Investec integrated annual report 2018
King IV Principles continued
Governance functional areas
Principle 11
• The governing body should govern risk in a way that supports the organisation in setting and achieving its strategic objectives
• Risk management is embedded into day to day operations and culture. The Investec BRCC is tasked by the board to ensure that all decisions of the board on risk management policies and procedures are implemented and monitored throughout Investec
• Independent risk management, compliance, financial control functions supplemented by internal audit, who reports independently to the audit committee, ensures the management of risk. Business strategy, risk appetite and effective capital utilisation underpin the economic value added (EVA) annual bonus allocation model
Principle 12
• The governing body should govern technology and information in a way that supports the organisation setting and achieving its strategic objectives
• The board delegates responsibility to management and monitors progress through the IT strategy committee. The information and technology management charter and the IT governance framework define the structure to govern and manage IT, which is a sub-committee of Investec plc and Investec Limited and enables the setting of technology and information directions. A set of IT and information risk policies are defined for the group and approved by the IT strategy committee
Principle 13
• The governing body should govern compliance with applicable laws and adopted, non-binding rules, codes and standards in a way that supports the organisation being ethical and good corporate citizen
• There were no material or repeated regulatory penalties, sanctions or fines for contraventions of, or non-compliance with, statutory obligations imposed on Investec or the board during the year
Principle 14
• The governing body should ensure that the organisation remunerates fairly, responsibly and transparently so as to promote the achievement of strategic objectives and positive outcomes in the short, medium and long term
• The remco assumes responsibility for the governance of remuneration and sets the direction for how remuneration should be approached. Investec’s overarching remuneration philosophy remains focused on employing and retaining the highest calibre individuals through the payment of industry competitive packages and long-term share awards, which ensure alignment with key stakeholders in Investec’s business
• Refer to page 185 remuneration philosophy
Principle 15
• The governing body should ensure that assurance services and functions enable an effective control environment, and that these support the integrity of information for internal decision-making and of the organisation’s external reports
• Attendance from external audit, internal audit, compliance and operational risk at audit committee enables an effective internal control environment to support the integrity of information used for internal decision-making and support the integrity of external reports. A combined assurance framework includes both coverage of significant risks and reporting of any issues raised relating to these risks
• An internal audit plan is presented annually for approval to the audit committee. The internal audit charter is reviewed every year. This charter defines the role and associated responsibilities and authority of internal audit, including addressing its role within combined assurance and the internal audit standards to be adopted
Stakeholders relations
Principle 16
• In its execution of its governance role and responsibilities, the governing body should adopt a stakeholder-inclusive approach that balances the needs, interests and expectations of material stakeholders in the best interests of the organisation over time
• Investec continually seeks to achieve an appropriate balance between risk and reward in our business, taking cognisance of all stakeholders’ interests
• The SEC has been tasked by the board to ensure a stakeholder-inclusive approach is followed
• The independence of appointed non-executive directors promote the interest of stakeholders. Investec’s reward programmes are administered to align directors’ and employees’ interests with those of all stakeholders and ensure the bank’s short, medium- and long-term success. Our EVA model ensures that risk and capital management are embedded in key processes at both a bank and transaction level, which form the basis of the bank’s performance related variable remuneration model, thus balancing the interests of all stakeholders. All users of capital operate within a strict philosophical framework that requires a balancing of risk and reward and that is designed to encourage behaviour in the interests of all stakeholders as opposed to just employees

Co
rpo
rate go
vernance and co
rpo
rate respo
nsibility
(continued)
Corporate governance
140 Investec integrated annual report 2018
DLC nominations and directors’ affairs committee reportThe DLC nomdac, is pleased to present its report for the year ended 31 March 2018. During the past financial year, the committee focused on executive succession planning, board composition and ongoing directors’ development.
The key objectives of the nomdac are designed to ensure the continued strengthening of the governance processes in the subsidiaries, not only for regulatory purposes, but also to enhance the effectiveness of the work performed by the boards.
At Investec, our culture and values are at the core of how we make decisions and how we are governed.
As such, the tone is set from the top and the board and committees alike live and demonstrate our values and integrity. In this respect, the nomdac’s continued work on refreshing the subsidiary boards and director development was to ensure that the boards were able to fulfil their mandates with particular focus on the long-term success of the entities.
The nomdac was always cognisant of the imminent executive management changes – with particular reference to the founding members. We deliberated and debated the new management structure of Investec extensively and concluded that the succession of the aforementioned executives should be from within the organisation and therefore, no help was sought from external recruitment agencies.
We are proud of our achievements and successes during the financial year. However, while we strive to improve our processes and functions, we take mistakes made from inside and outside the organisation – as opportunities to grow and develop. This approach will undoubtedly encourage us to stay on top of our game and remain disciplined.
Finally, the nomdac would like to extend its congratulations to Perry Crosthwaite on his appointment as the chairman of nomdac. We also congratulate the new executive management appointed to various positions. We are confident that the group will benefit from their continued contribution.
Fani TitiFormer chairman, DLC nomdac
12 June 2018
“At investec, our culture and values are at the core of how we make decisions and how we are governed”
DLC nomdac
Fani TitiFormer chairman of the DLC nomdac
Key achievements in FY 2018
• Succession planning
Areas of focus in FY 2019
• Strengthening the governance processes in the subsidiaries
• Enhance the effectiveness of the work performed by the board

(continued)
Corporate governance
Co
rpo
rate go
vernance and co
rpo
rate respo
nsibility
141Investec integrated annual report 2018
DLC nominations and directors’ affairs committee reportWe are, pleased to report that Investec has entered a new era with the appointment of the new Joint CEOs, Fani Titi and Hendrik du Toit with effect from 1 October 2018. Leading up to the announcement of the new leadership, the nomdac was engaged in rigorous discussions around the new leadership of the organisation. Given Fani’s role in the new leadership, the succession discussions were led by myself as senior independent director. The nomdac and the boards have every confidence that both Fani Titi and Hendrik du Toit will continue to grow Investec from strength to strength.
As part of the handover, the newly appointed and outgoing CEOs will meet regularly over the next six months to ensure a smooth transition and minimal disruptions. This would ensure continuity and stability within the organisation.
The group remains optimistic and confident in the new leadership. We wish to acknowledge and thank Stephen Koseff and Bernard Kantor for their hard work, commitment and endless dedication to Investec. Through the years and under their leadership, Investec became a market leader in several territories. We also wish to thank Glynn Burger for his contribution to the success of Investec. We wish them the very best in their future endeavors.
Following the implementation of the new management succession plan Khumo Shuenyane will be joining nomdac as Investec Bank Limited’s representative, Philip Hourquebie as chairman of the remco and Lord Malloch-Brown as chairman of the SEC.
Going forward the nomdac will ensure the successful delivery of its mandate and strategic plans for the future.
Perry CrosthwaiteChairman DLC nomdac
12 June 2018

Co
rpo
rate go
vernance and co
rpo
rate respo
nsibility
(continued)
Corporate governance
142 Investec integrated annual report 2018
How the nomdac worksRoleThe nomdac is an essential part of the group’s governance framework to which the board has delegated the following key functions:
• identification and nomination of candidates for board vacancies, as and when they arise
• evaluation of the adequacy of the group’s corporate governance structure
• maintenance of the board directorship refreshment programme, which addresses succession planning
• consideration of other key matters relating to the election of directors, including the definition of key board roles, terms of appointment and regular review of the appropriateness of the boards’ composition
• succession planning
CompositionThe board has formed the opinion that the nomdac has the appropriate balance of knowledge and skills in order to discharge its duties. In particular, the majority of members are independent non-executive directors and all members have the relevant experience for them to be able to consider the issues that are presented to the committee.
Meeting schedule and attendanceIn terms of the approved terms of reference for the nomdac, meetings of the committee shall be held at least three times per annum and as and when required on an ad hoc basis. During the financial year ended 31 March 2018, the committee met on five occasions.
How the committee spent its time
Succession planning/composition of boards and committeesBoard effectiveness
Corporate governance and review of disclosures
Training and development
65% 15% 10% 10%
Composition and meeting attendanceDLC
(5 meetings in the year)
Members throughout the year Committee member sinceEligible to
attend Attended
F Titi (former chairman)* 9 Sept 2010 5 5
PKO Crosthwaite (chairman)** 16 Sept 2014 5 5
ZBM Bassa*** 1 April 2017 5 5
D Friedland*** 16 Sept 2014 5 5
PRS Thomas**** 9 Sept 2010 5 5
SE Abrahams***** 9 Sept 2010 1 1
* F Titi stepped down as chairman of nomdac on 15 May 2018. F Titi recused himself from all discussions in relation to the appointment of the joint chief executive officer of the group.
** PKO Crosthwaite was appointed as chairman of nomdac on 15 May 2018.*** In principle, it has been agreed that the chairs of the group’s key governance committees (audit, board risk and capital, remuneration committees and social
and ethics committees) be appointed to the nomdac. **** PRS Thomas was appointed to the committee as a representative of Investec Bank Limited.***** SE Abrahams as representative of Investec Bank Limited stepped down from nomdac at the Investec plc and Invested Limited AGM on 10 August 2017.

(continued)
Corporate governance
Co
rpo
rate go
vernance and co
rpo
rate respo
nsibility
143Investec integrated annual report 2018
SuccessionA key area of focus for the nomdac has been with regard to succession planning. The nomdac has conducted formal succession appraisals for all key positions, and continues to ensure that succession plans are in place that will allow the managing director and the CEO to hand over operational responsibilities and leadership of the group to the next generation of leaders.
With regard to succession of the chairman, the nomdac considered whether an external search consultancy or advertising should be used. It concluded that, with the significant leadership changes being implemented in 2018, providing stability and continuity was of great importance. The nomdac considers that the appointment of the previous senior independent director (SID), Perry Crosthwaite, enhances the effectiveness of the board, and brings a new chairman who has strength of character, independence of mind and also has considerable knowledge and experience of the group.
The nomdac considers succession planning both in terms of ensuring that there are named individuals able to step in and provide cover in the event of an immediate vacancy, and in terms of ensuring that the group is increasing the internal pool of talented and skilled individuals by providing opportunities for individuals to develop and grow within the organisation.
Investec’s approach to succession has been a successful one, the organisation has an excellent track record of developing talent and managing transition, and has never had a situation where it was unable to fill a key management position through internal resources.
Skills, knowledge and experienceThe nomdac continually monitors the composition of the current board and considers what attributes, skills and experience are necessary in order for the board to effectively discharge its responsibilities. The nomdac has overseen the programme of directors’ development to ensure that it includes training to keep directors up to speed with the latest relevant developments, including technology and cyber security.
IndependenceOpen and honest dialogue is part of Investec’s culture. Robust independent challenge is a critical component of how the board operates. Investec has always been an organisation that places value on substance over form, and the nomdac therefore considers all relevant circumstances regarding directors’ independence. However, its obligation is to ensure that directors, in fact demonstrate independence of character and judgement, and exhibit this in the boardroom by providing a challenge to the executive board members.
Nomdac considers tenure when considering independence, and when considering the composition of the board as a whole. The nomdac is mindful that there needs to be a balance resulting from the benefits brought on board by new independent directors, versus retaining individuals with valuable skills, knowledge, experience, and an understanding of Investec’s unique culture that has been developed over time. For this reason, Investec has, over a number of years, operated a structured board refreshment programme whereby longer-serving members of the board step down and are replaced with new non-executive directors.
The nomdac continues to challenge and assess the independence and performance of directors, regardless of tenure, however, after nine years’ service, non-executive directors are subjected to a rigorous test to establish whether they continue to demonstrate independence of character and judgement. Furthermore, all new appointments of non-executive directors are made for an initial period of three years with a clear understanding that they will be unlikely to serve for a period exceeding nine years.
There has been a significant amount of change and previous board effectiveness reviews clearly articulated the need to let these changes settle down before further changes to the composition of the board were considered.
DiversityThe nomdac, in considering the composition of the board, is mindful of all aspects of diversity. This includes gender, race, skills, experience and knowledge and a diversity policy as approved by the board.
At Investec we embrace differences as a strength within our company. Having a diverse board is a clear benefit, bringing with it distinct and different outlooks, alternative viewpoints, and challenging mindsets.
With regard to race and gender diversity, Investec is cognisant of the recommendations of the Hampton-Alexander Review and the JSE Listings Requirements pertaining to the setting of a policy and, targets for the representation of women and people of colour on the board, and has an aspirational target of 33% female representation by 2020. However, Investec is a meritocracy, and believes that targets should be achieved without the setting of formal quotas. We therefore recognise the need to create opportunities for talented individuals to move up through the organisation. To assist with this, Investec undertakes a number of diversity initiatives across the organisation which promotes female board representation.
Investec has signed up to the 30% Club in both South Africa and the UK, which promotes female board representation, and in the UK, the bank has signed up to the Women in Finance Charter, which commits the bank to support the progression of woman into senior roles through focusing on the execution pipeline and mid-tier level.
Subsidiary board compositionIn addition to considering the composition of the board, the nomdac reviewed the composition of a number of subsidiary boards including, Investec Bank plc, Investec Bank Limited, Investec Wealth & Investment Limited, Investec Securities Proprietary Limited, Investec Asset Management Limited and Investec Life Limited.
Related partiesInvestec has processes and policies in place to govern the review, approval and disclosure of related party transactions entered into with directors, management and staff. Nomdac reviewed key related party transactions during the year and ensured that the appropriate policies had been complied with.

Co
rpo
rate go
vernance and co
rpo
rate respo
nsibility
(continued)
Corporate governance
144 Investec integrated annual report 2018
Committee activities
Areas of focus What we did
Succession planning The committee:
• continually monitored, reviewed, discussed and assessed succession planning
• received a forward looking report on future succession
• implemented the appointment of:
– Fani Titi and Hendrik du Toit as the designate Joint CEOs of Investec
– Perry Crosthwaite as chairman of the Investec plc and Investec Limited boards
– Zarina Bassa was appointed as SID of the group
Subsidiary board composition The committee received reports on the composition of key subsidiaries of Investec plc and Investec Limited, including:
• Investec Bank plc
• Investec Bank Limited
• Investec Wealth & Investment Limited
• Investec Securities Proprietary Limited
• Investec Asset Management Limited
• Investec Life Limited
The committee:
• reviewed the composition of each of the key subsidiaries of Investec plc and Investec Limited
• considered any vacancies, new appointments or changes that would enhance the effectiveness of the boards, with particular regard to group oversight and governance of subsidiary companies with due regard to local regulatory or legal requirements and best practice, and ensuring an appropriate level of independent scrutiny at subsidiary level
• agreed on the following matters:
– appointment of Khumo Shuenyane as the chairman of Investec Bank Limited
– appointment of Brian Stevenson as the chairman of Investec Bank plc
– Ciaran Whelan would succeed Glynn Burger as director of risk on 1 April 2019
– Kim McFarland would succeed Glynn Burger as finance and operations director from 1 April 2019
Corporate governance The committee:
• considered the independence of Investec plc, Investec Limited’s and Investec Bank Limited’s non-executive directors, with particular regard to:
– directors who had served on the boards for a period longer than nine years
– factors that might impact their independence
– the directors contribution at board meetings and whether they in fact demonstrated independent challenge
• specifically considered the independence of Cheryl Carolus who had served on the boards for a period exceeding nine years and concluded that it was satisfied that she remained independent and should be regarded as an independent non-executive director
Board diversity The committee:
• considered the target for the representation of women on the board of Investec Bank Limited, Investec Bank plc, Investec Limited and Investec plc and confirmed its support of the 33% target by the end of 2020
• noted governance requirements that required certain regulated entities to adopt a board diversity policy and a target for female representation on the board
• approved amendments to its terms of reference in order to include these duties to ensure that Investec boards remained compliant

(continued)
Corporate governance
Co
rpo
rate go
vernance and co
rpo
rate respo
nsibility
145Investec integrated annual report 2018
Committee activities continued
Areas of focus What we did
Board effectiveness The committee:
• considered the process for the 2018 board effectiveness which took the form of a self-assessment followed by one-on-one meetings between the chairman and directors
• amended/added questions to the board effectiveness self-assessment regarding risk and audit, the presentation of projects to the boards, IT and succession planning
• noted that the 2018 effectiveness review showed good progress on those issues identified in the independently facilitated 2016 effectiveness review
Directors’ development The committee:
• considered dates and topics for future directors’ development training and identified the following key topics affecting the business including:
– UK Regulatory Requirements
– King IV
– amendments to the UK Corporate Governance Code
– senior managers and certificate regime
– Financial Conduct Authority (FCA) and topical subjects
– Markets and Financial Instruments Directive (MiFID) II
– cyber crime and IT governance
– cryptocurrency
– culture
– client asset sourcebook (CASS)
• considered the attendance of the subsidiary boards to the training sessions
• the subsidiary boards would be included in the training as necessary
Looking aheadThe nomdac will continue to focus on how to further develop senior management in order to support our succession plans as well as provide oversight to ensure orderly transition from founders to new appointees.
Furthermore, the nomdac will ensure the robustness of the board effectiveness programme, with due consideration and challenge and interrogation of the independence of those directors who have served for longer than nine years. The committee continuously looks forward to the challenges and opportunities that the group will face, and will continue to review the composition of the board to ensure that it is optimally structured to drive forward the strategy that will enable the group to succeed.
The nomdac will continue to focus on the composition of the board with respect to race and gender diversity (especially in light of the new requirements as set out in King IV regarding the adoption of a diversity policy).

Co
rpo
rate go
vernance and co
rpo
rate respo
nsibility
(continued)
Corporate governance
146 Investec integrated annual report 2018
DLC social and ethics committee report
“Investec lives in society and not off it”
DLC social and ethics committee
Fani TitiFormer chairman of the DLC SEC
Key achievements in FY 2018
• 1.2% CSI spend as a % of operating profit (March 2017: 1.2%) (target of >1%)
• Learning and development spend as a % of staff costs is 1.9% for the group (target of >1.5% for the group)
• One of the first signatories to Youth Employment Services (YES) programme
Areas of focus in FY 2019
• Oversight and coordination of group social, environmental and ethics matters
• Improved communication of the various group environmental, social and ethics efforts
• Intensify our engagement in South African society to support socio-economic development
• Strong focus on sustainable development goals (SDGs)
The DLC SEC is pleased to present its report for the 2018 financial year.
The SEC is a committee which assists both the Investec plc and Investec Limited boards in monitoring the group’s performance in terms of social, environmental and governance indicators. The report aims to explain how the SEC has discharged its duties across the group.
The environment in which the group operates has been challenging. We have seen the ethical behaviour of organisations and boards across all sectors of the economy being questioned and interrogated. At Investec, we aim to ensure that the tone set at board level is filtered across the organisation in order to drive ethical behaviour which is embedded in our culture.
We recognise that economic growth and societal transformation are vital to creating a sustainable future for all the communities in which we operate and that we play a meaningful role in enabling this. We have a number of projects in place that speak to youth employment, academic programmes and Corporate Social Investment (CSI) initiatives in all territories. Furthermore, the SEC considered the environmental impact that society, as a whole, was having on the environment. Please refer to the corporate responsibilty report on our website for comprehensive feedback on these activities.
Investec also recognises the contribution each employee makes towards the success of Investec. We aim to make the workplace a safe, non-biased environment in which each employee can flourish. The flat management structure at Investec is a mechanism which allows free and open discussions and enhances collaboration between divisions and employees. The committee reviewed our practices around creating a fair, diverse and inclusive working environment.
With this in mind, we placed focus on any race related matters, gender inequality and pay disparities.
We would like to congratulate Lord Malloch-Brown on his appointment as the new chairman of the SEC. We look forward to his valuable input to the committee.
Fani TitiFormer chairman, DLC SEC
12 June 2018

(continued)
Corporate governance
Co
rpo
rate go
vernance and co
rpo
rate respo
nsibility
147Investec integrated annual report 2018
DLC social and ethics committee reportDear Shareholder
Core to the objectives of the SEC are the values and principles of Investec and the desire to make a meaningful contribution to the world we live in. While our shareholders remain at the forefront of the board’s attention, our purpose is not only about driving profits. We strive to be a distinctive and relevant specialist bank and asset manager, demonstrating cast iron integrity, moral strength and behaviour which promotes trust. Our core values include unselfishly contributing to society, valuing diversity and respecting others. Outstandingly empowered talent, entrepreneurial spirit and regard for the planet are other qualities that align our culture and our approach to responsible business.
There is a strong focus on Sustainable Development Goals (SDGs) which tackle the world’s most pressing social, economic and environmental challenges and how companies align these 17 goals to their strategies. Investec undertook to establish a SDG forum which will drive the SDG agenda and monitor progress.
During the 2019 reporting period, the committee will continue to monitor Investec’s environmental and social responsibilities. We are extremely proud of some of the initiatives we have in place across various territories, which include but are not limited to, academic programmes, reducing our environmental footprint, and improving our environmental social governance (ESG) policies and practices.
I would like to thank Fani Titi for his contributions made to this committee and I look forward to my new role as the chairman of the SEC.
Lord Malloch-BrownChairman, DLC SEC
12 June 2018

Co
rpo
rate go
vernance and co
rpo
rate respo
nsibility
(continued)
Corporate governance
148 Investec integrated annual report 2018
How the SEC worksRoleOur commitment to corporate responsibility means integrating social, ethical and environmental considerations. For Investec, being a good corporate citizen is about building our businesses to ensure we have a positive impact on the economy and social progress of communities and on the environment, while growing and preserving clients’ and stakeholders wealth based on strong relationships and trust.
The SEC is an essential part of the group’s governance framework to which the board has delegated the monitoring of the group’s activities in relation to:
• social and economic development (including human rights)
• good corporate citizenship
• the Employment Equity Act and the Broad-Based Black Economic Empowerment Act
• ethical business practices
• improving our environmental social governance (ESG) policies and practices.
CompositionThe nomdac and the board have formed the opinion that the SEC has the appropriate balance of knowledge and skills in order to discharge its duties. In particular, the majority of members are independent non-executive directors and all members have the relevant knowledge and experience for them to be able to consider the issues that are presented to the committee.
Meeting schedule and attendanceIn terms of the approved terms of reference for the SEC, meetings of the committee shall be held quarterly, although the committee could determine that one of the scheduled meetings could be cancelled.
How the committee spent its timeDLC corporate responsibility Policy matters Employment matters Reputational risk
35% 25% 20% 20%
Composition and meeting attendance(4 meetings in the year)
Members throughout the year Committee member sinceEligible
to attend Attended
F Titi (former chairman)* 17 May 2012 4 4
Lord Malloch-Brown KCMG (chairman)** 8 August 2014 4 4
CA Carolus 17 May 2012 4 4
B Kantor 17 May 2012 4 4
S Koseff 17 May 2012 4 3
PRS Thomas*** 17 May 2012 4 3
* F Titi stepped down as chairman of the SEC on 1 April 2018.** Lord Malloch-Brown KCMG was appointed as chairman of the SEC on 1 April 2018.*** PRS Thomas is a representative of Investec Bank Limited.
The composition of the committee is in accordance with the requirements of section 72(8) of the South African Companies Act, 2008, as amended, and its associated regulations.
Other regular attendees• Head of sustainability and strategy• Head of organisational development• Head of human resources• Head of investor relations• Head of company secretarial and staff share schemes• Head of Wealth & Investment• Head of Investec Asset Management

(continued)
Corporate governance
Co
rpo
rate go
vernance and co
rpo
rate respo
nsibility
149Investec integrated annual report 2018
Committee activities
Areas of focus What we did
Social and economic development (including human rights)
The committee:
• monitored the group’s standing in terms of the goals and purposes of:
– the 10 principles set out under the United Nations Global Compact Principles (UNGC). The committee remained committed to the 10 principles of the UNGC with respect to human rights, labour, environment and anti-corruption
– the Organisation of Economic Co-Operation and Development (OECD) recommendations regarding corruption
• ensured that the Investec group and its subsidiaries adhere to the relevant laws in all its jurisdictions and strive to advance the United Nations (UN) principles within its sphere of influence
• submit a communication of progress to the UN Global Compact on an annual basis
Good corporate citizenship The committee:
• monitored various initiatives across the group
• discussed and monitored the various elements of good corporate citizenship
• satisfied itself that the group’s standing and commitment to the various elements of good corporate citizenship remained in place and was actively enforced
The South African Employment Equity Act
The committee:
• monitored Investec Limited and its subsidiaries’ compliance with the relevant legislation
• monitored progress made against Investec Limited’s employment equity plans
• engaged with the management of human resources to address challenges around matters such as diversity and employment equity targets
• engaged with members of the employment equity forum
• monitored and reviewed diversity across the group and considered any regulatory developments in this regard
• satisfied itself that the group did take the appropriate measures in order to comply with the relevant legislation
The South African Broad-Based Black Economic Empowerment Act
The committee:
• monitored Investec Limited and its subsidiaries’ compliance with the relevant legislation
• monitored Investec Limited’s empowerment rating and discussed with management how to improve the rating
• received and reviewed detailed information on recent developments with respect to the Department of Trade and Industry Codes, the Financial Sector Charter and the scorecards
• satisfied itself that the group did take the appropriate measures in order to comply with the legislation
• monitored complaints, if any, both internally and externally in respect of race-related matters, gender inequality and pay disparities
Contribution to the development of communities
The committee:
• monitored Investec Limited and its subsidiaries’ activities in contributing to the development of the communities in which its activities were predominantly conducted or within which its products and services are predominantly marketed
• received regular reports on the group’s corporate and social investment initiatives as well as the strategy and spend in respect thereof
• satisfied itself that the Investec group contributed to the development of communities

Co
rpo
rate go
vernance and co
rpo
rate respo
nsibility
(continued)
Corporate governance
150 Investec integrated annual report 2018
Committee activities continued
Areas of focus What we did
Talent retention and attraction of employees
The committee:
• agreed to the investment in learning and development opportunities for employees as well as individuals outside of the workplace
• received regular reports on the learning opportunities and development of employees and others outside of the workplace
Culture and ethics The committee:
• received regular reports on the group’s activities in respect of programmes offered to enhance its core values which included unselfishly contributing to society, valuing diversity and respecting others
• satisfied itself that the Investec group’s core values had a positive impact on the success and well-being of local communities, the environment and on overall macroeconomic stability
Reporting to shareholders of Investec plc and Investec Limited
The committee:
• reported to the shareholders on matters within its mandate on its activities on an annual basis by means of the annual reports and at the annual general meeting of both companies
• ensured that it complied with this principle
Looking aheadThe SEC will continue to monitor the economic, social and governance aspects of the organisation in accordance with best practice and statutory requirements in the jurisdictions the group operates in.

(continued)
Corporate governance
Co
rpo
rate go
vernance and co
rpo
rate respo
nsibility
151Investec integrated annual report 2018
DLC audit committee report
“Investec’s robust governance framework is supported by its open and honest culture which helps to ensure any issues are escalated in a timely manner”
DLC audit committee
Zarina BassaChairman of the DLC audit committee from 1 April 2017
Key achievements in FY 2018
• Implementation of IFRS 9
• Monitoring of audit quality, external audit and audit partner accreditation and results of quality reviews
• Putting into place additional local and international cross reviews to ensure both actual and perceived audit quality
Areas of focus in FY 2019
• IT risk and cyber security
• Business continuity
• Conduct
• Audit quality
• Auditor independence
• Monitoring and closing audit findings
• Related party processes and disclosures
I am pleased to present you with the report of the DLC audit committee, the Investec plc audit committee and the Investec Limited and Investec Bank Limited audit committees (the INL audit committee) for the financial year ended 31 March 2018. For the purposes of this report, the term audit committees will be used to refer to the DLC audit committee, Investec plc audit committee and INL audit committee collectively.
Over the following pages we will share with you some key information about the role and functioning of Investec’s audit committees. In addition to outlining the audit committees’ structure, we have included some insight into how decisions are made and where judgement should be applied to the significant issues addressed by the audit committees during the financial year. Information has been provided under the following headings, which align to the key functions of the audit committees:
• financial reporting
• external audit
• internal controls.
Committee performanceThe audit committees’ performance was considered as part of the board effectiveness process conducted during the financial year, which was carried out using an internal self-assessment questionnaire. This process did not identify any material areas of concern about the functioning of the audit committees.
Role of the chairThe role of the chairman of the audit committees requires regular meetings with the heads of internal audit, compliance, legal, tax, operational and IT risk, credit, finance, the group head of corporate governance as well as the lead external audit partner and senior management outside of formal committee meetings in order to maintain and develop an understanding of the group’s operations and the risks facing the business. These interactions are an essential part of the role of the chairman of the audit committees, as it provides an additional layer of assurance to gain comfort that these control functions are aligned in terms of their understanding of the risks facing the business and mitigation thereof.
The audit committees and the BRCC continue to be chaired by different independent non-executive directors. David Friedland chairs the BRCC. These committees have met all legal and regulatory requirements from a composition and independence perspective, and by so doing, provide an additional layer of independence between the said committees. Given the synergies and nature of matters considered by the committees, their membership is such that an element of commonality persists.

Co
rpo
rate go
vernance and co
rpo
rate respo
nsibility
(continued)
Corporate governance
152 Investec integrated annual report 2018
Looking aheadIn advancing the audit committees’ efforts of the prior year, focus will be centred on further embedding the principles of King IV, specifically those pertaining to IT governance and cyber security, as well as the implementation of IFRS 9 and issues relating to conduct. The impact of the anticipated changes to UK Corporate Governance Code, as proposed by the Financial Reporting Council (FRC), will also feature as a key consideration on the agendas of the audit committees. Additionally, attention will be paid to the macro and micro impact of recent political events from both a UK and South African perspective, including the negotiation of post-Brexit arrangements and the investigation into the capture of the South African state. The South African Banks Act and South African Companies Act, respectively, call for the audit committee to ensure that the appointed auditors remain independent. To this end and in keeping with the South African Prudential Authority communicated “flavour of the year” topics, the audit committee will continue to consider auditor independence and audit quality measures.
Zarina BassaChairman, audit committees
12 June 2018

(continued)
Corporate governance
Co
rpo
rate go
vernance and co
rpo
rate respo
nsibility
153Investec integrated annual report 2018
How the audit committees workRoleThe audit committees are an essential part of the group’s governance framework to which the board has delegated the following key functions:
• oversight of the group’s financial reporting process and risks
• managing the relationship with the group’s external auditor
• reviewing the group’s internal controls and assurance processes, including those of internal audit.
Structure of the audit committeesIn terms of Investec’s DLC structure, the Investec plc board has mandated authority to the Investec plc audit committee and the Investec Limited board has mandated authority to the INL audit committee to be the audit committees for those respective companies and their subsidiaries.
The DLC audit committee, has responsibility for audit-related matters that are common to both Investec plc and Investec Limited. In particular, the combined group annual financial statements and year-end and interim results are considered and recommended for approval to the board by the DLC audit committee, Investec Bank plc. Investec Asset Management and Investec Wealth & Investment independently conducted audit committees report into the Investec plc and INL audit committee. The DLC audit chair attends these audit committee meetings.
Composition and meeting attendanceThe audit committees are comprised entirely of independent non-executive directors who must meet predetermined skills, competency and experience requirements. The members’ continuing independence are assessed annually by the nomdac, which in turn make a recommendation on the members’ independence to the board. The nomdac and board have formed the opinion that the audit committees have the appropriate balance of knowledge and skills in order for them to discharge their duties. In particular, a majority of the members are chartered accountants and by virtue of their experience in the banking, financial services and audit sectors, members collectively have competence relevant to the sector in which the group operates. Further details of the experience of the members can be found in their biographies on pages 124 to 129.
Meeting schedule and attendanceDuring the financial year ended 31 March 2018, the DLC, Investec plc and INL audit committees each met four times, resulting in 12 meetings in aggregate. In addition, a number of specific meetings were convened to discuss external auditor quality, partner accreditation and independence. A further three meetings were convened to deliberate and conclude on IFRS 9.
DLC(4 meetings in the year)
Investec plc(4 meetings in the year)
Investec Limited(4 meetings in the year)
Members throughout the year
Committee member
sinceEligible
to attend AttendedEligible
to attend AttendedEligible
to attend Attended
ZBM Bassa 1 Nov 2014 4 4 4 4 4 4
LC Bowden* 1 Jan 2015 2 2 1 0 1 0
PA Hourquebie** 14 Aug 2017 2 2 3 3 3 3
KL Shuenyane 8 Aug 2014 4 4 4 4 4 4
PRS Thomas*** 17 May 2006 2 2 1 1 4 4
* LC Bowden stepped down from the audit committees with effect from 16 August 2017.** PA Hourquebie was appointed to the audit committees with effect from 14 August 2017.*** PRS Thomas stepped down from the DLC and plc audit committees with effect from 10 August 2017, but remains a member for the INL audit committee
representing Investec Bank Limited.
Other regular attendees• Chairman of the group• Chief executive officer of the group• Managing director of the group• Group risk and finance director of the group• Head of compliance• Head of IT• Head of operational risk• Head of internal audit• Head of finance• External auditors• Head of company secretarial and staff share schemes• Head of corporate governance • Head of legal• Head of tax• Chief operational officers

Co
rpo
rate go
vernance and co
rpo
rate respo
nsibility
(continued)
Corporate governance
154 Investec integrated annual report 2018
Audit committeesHow the committees spent their time
DLCFinancial reporting External audit matters Risk
management and internal controls
Other (including governance matters)
50% 35% 10% 5%
Investec plc Financial reporting External audit matters Internal audit matters Risk management
and internal controls (including BCP, IT risk and cyber security)
Other (including macro issues and reports from subsidiary committees)
25% 25% 25% 15% 10%
INLFinancial reporting External audit matters Internal audit matters Risk management
and internal controls (including BCP, IT risk and cyber security)
Other (including macro issues and reports from subsidiary committees)
20% 35% 25% 15% 5%
IBPFinancial reporting External audit matters Internal audit matters Risk management
and internal controls (including BCP, IT risk and cyber security)
Other (including macro issues and reports from subsidiary committees)
25% 25% 25% 15% 10%
The agenda and meeting schedule for the audit committees’ meetings was such that the Investec plc and INL audit committees spent more of their time throughout the annual cycle obtaining the required assurance of control and compliance functions, which in turn allows the DLC audit committee to focus on items which are within its mandate, including consideration of the annual financial statements and assessment of the external auditor.
Investec plc and Investec Limited board of directors
Investec plc audit committee
DLC audit committee
Investec Limited and Investec Bank Limited
audit committee
Responsible for all legal and regulatory requirements as
necessary under the UK legislation and listing rules – including the UK Disclosures Guidance and
Transparency Rules and the UK Corporate Governance Code, the
three pillars of Specialist Bank, Investec Asset Management and
Investec Wealth & Investment
Responsible for matters that are common to the Investec plc and
INL audit committee, including the combined group financial statements and results announcements, review of the independence and effectiveness of the external audit function, review of the going concern concept, group
viability statement, review of the finance function and finance director and
internal auditor effectiveness
Responsible for all legal and regulatory requirements as
necessary under South African legislation and listing rules –
including King IV
Subsidiaries and audit sub-committee
Assurance functions, including group compliance, group legal, group finance, tax, internal audit, external audit and group risk

(continued)
Corporate governance
Co
rpo
rate go
vernance and co
rpo
rate respo
nsibility
155Investec integrated annual report 2018
Financial reportingProcessThe audit committees’ primary responsibility in relation to the group’s financial reporting is to review with both management and the external auditor the appropriateness and accuracy of the half-year and annual financial statements.
In this process, amongst other matters, the audit committees consider:
• the appropriateness of accounting policies and practices and any areas of judgement
• significant issues that have been discussed with the external auditor
• the clarity of disclosures and compliance with financial reporting standards and other relevant financial and governance reporting requirements.
The audit committees receive reports from group finance and external audit at each of their quarterly meetings. The committee meetings afford the non-executive directors the opportunity to discuss with management the key areas of judgement applied and significant issues disclosed in the financial statements.
IFRS 9 implementationThe group adopted IFRS 9 on 1 April 2018. The audit committees have dedicated a substantial amount of time to understanding and challenging the IFRS 9 implementation programme. Three dedicated audit committee meetings, of a combined audit committee/BRCC, were convened to deliberate and conclude on IFRS 9.
Areas of judgement and significant issues The audit committees have assessed whether suitable accounting policies have been adopted and whether management has made appropriate judgements and estimates. The main areas of judgement that have been considered by the audit committees to ensure that appropriate rigour has been applied are outlined below.
All accounting policies can be found on pages 32 to 40 in volume three of the 2018 integrated annual report of Investec plc and Investec Limited.
Significant judgements and issues Committee review and conclusion
Impairments
• Determining the appropriateness of impairment losses requires the group to make assumptions based on management judgement
• Implementation of IFRS 9 and Day 1 adjustment
• the committee challenged the level of provisions made and the assumptions used to calculate the impairment provisions held by the group including assessing impairment experience against forecasts. Particular focus was given to the legacy portfolio and exposures which are affected by the current macro-economic environment
• certain members of the audit committee attend the BRCC where impairment provisions are also challenged at a more granular level. The BRCC has oversight of the governance process pertaining to impairments
• the committee was satisfied that the impairment provisions were appropriate
• one of the key developments in accounting policy during the year was the preparation for the implementation of the IFRS 9 impairment standard on 1 April 2018
• the audit committee received updates and challenged the group’s key judgements, scenarios and assumptions, in addition to the key features of the IFRS 9 impairment process and the impact on financial results, capital, stress testing and earnings volatility
• three dedicated audit committee meetings of a combined audit committee/BRCC were convened to conclude on IFRS 9
• the audit committee is satisfied that the group has worked with industry guidance and has taken note of the best practice recommendations which have been issued
Valuations
• The group exercises judgement in the valuation of complex/illiquid financial instruments, unlisted investments and embedded derivatives, particularly the level 3 instruments within the portfolio
• material individual positions, in particular the unlisted private equity investments, are challenged and debated by the committees with the most material noted as standing agenda items for each of the audit committees throughout the year
• the committee debated the portfolio valuation adjustment which was recorded to take into account macro-economic risks on the South African private equity portfolio
• at the year-end, prior to the audit committee meetings, the audit committee chair met with management and received a presentation on the material investments across the group including an analysis of the key judgements and assumptions used
• the audit committee approved the valuation adjustments proposed by management for the year ended 31 March 2018
Uncertain tax positions
• There are certain legacy structured transactions within Investec plc where there is uncertainty over the outcome of the tax positions and judgement is required over the calculation of the provision
• the audit committee receives regular updates on this topic from tax, group finance and legal to enable it to evaluate the appropriateness of the tax provision
• the audit committee analyses the judgements and estimates made and discusses the potential range of outcomes that might arise
• the committee confirmed the tax provisions and disclosures for the year end

Co
rpo
rate go
vernance and co
rpo
rate respo
nsibility
(continued)
Corporate governance
156 Investec integrated annual report 2018
Going concernOne of the key roles of the DLC audit committee is to review the going concern concept as presented by management and, if appropriate, make the necessary recommendation to the boards in this regard.
Whilst the liquidity and solvency of the Investec group is closely monitored on a daily basis by relevant individuals in the group’s risk management division, the DLC audit committee and board expressly consider the assumptions underlying the going concern of the Investec group as part of the annual financial results approval.
The following areas are considered in order to make this statement: • budgets and forecasts• profitability• capital• liquidity• solvency.
For the year ended 31 March 2018, the DLC audit committee recommended to the board that, based on its knowledge of the group, key processes in operation and enquiries, it is appropriate for the financial statements to be prepared on a going concern basis.
Fair, balanced and understandableAt the request of the board, the DLC audit committee has considered whether, in its opinion, the annual report and financial statements for the year ended 31 March 2018 are fair, balanced and understandable, and whether it provides the information necessary for shareholders to assess the group’s position and performance, business model and strategy.
In forming its opinion, the DLC audit committee has: • met with senior management to gain
assurance that the processes underlying the compilation of the annual financial statements were appropriate
• conducted an in-depth, critical review of the annual financial statements and, where necessary, requested amendments to disclosure.
As such, the DLC audit committee has formed the view that the annual report and financial statements for the year ended 31 March 2018 are fair, balanced and understandable.
External auditThe DLC audit committee has responsibility for reviewing the group’s relationship with its external auditors, including, considering audit fees, all Ernst & Young non-audit services and the independence and objectivity of the external auditors. In line with the conditions set out in section 94(8) of the South African Companies Act, and based on its assessment, using the criteria set out by King IV, the audit
committee confirms its satisfaction with the performance and quality of external audit, the external auditors and lead partners.
Auditor appointment Investec’s external auditors at the DLC level are Ernst & Young LLP and Ernst & Young Inc. (Ernst & Young). Ernst & Young and KPMG Inc. are joint auditors of the Investec Limited silo and Ernst & Young LLP are the auditors of the Investec plc silo. Ernst & Young have been the group’s auditors since Investec’s listing on the London Stock Exchange in 2002.
The DLC audit committee considers the re-appointment of the external auditors each year before making a recommendation to the board and shareholders. There will be a mandatory rotation for the 2025 audit and a competitive tender process will be conducted in advance of this time. See further information on re-election of auditors on page 157.
Auditor independence and objectivityThe DLC audit committee considers the independence of the external auditors on an ongoing basis. The external auditors are required to rotate the lead audit partner every five years and other senior audit staff every seven years. Partners and senior staff associated with the Investec audit may only be employed by the group after a cooling off period. The lead partners commenced their respective five-year rotation periods in 2014 and 2018 (Ernst & Young LLP: 1 July 2014 and Ernst & Young Inc: 31 January 2018).
Following due consideration, we continue to believe that the extent of audit cross reviews, both between the joint auditors on Investec Limited, of the additional cross reviews by the DLC auditors across the group supported by partner rotation, limitations on non-audit services including pre-approval of non-audit work and the confirmation of the independence of both Ernst & Young, KPMG Inc. and their respective audit teams are adequate safeguards to ensure that the audit process is both objective and effective.
The auditors have confirmed their independence and were requested to review and confirm the level of staff transactions with Investec, if any, to ensure that all auditors on the Investec audit meet the independence criteria.
Non-audit servicesThe audit committees have adopted a policy on the engagement of the external auditors to provide non-audit services. This policy, designed to safeguard auditor objectivity and independence, includes guidelines on permitted and non-permitted services and on services requiring specific approval by the audit committees. The audit committees review whether the level of non-audit fees could impact the independence of the auditors. This is monitored by reference to the level of fees paid for services, excluding services which
are required to be provided by the external auditors due to their office, against the fees paid for the audit of the group. Total audit fees paid to all auditors for the year ended 31 March 2018 were £13.6 million (2017: £10.1 million), of which £2.6 million (2017: £2.8 million) related to the provision of non-audit services.
The summary of the nature of these services is set out in note 8 Operating cost of volume three.
Total non-audit fees for each of the auditing firms were approved by the audit committee at least quarterly. Ernst & Young non-audit service fees were pre-approved by the chairman of the audit committee prior to commencing the work in line with Ernst & Young policy.
The decision to approve the engagement of the external auditor for the services noted above was due to factors including synergies and efficiencies relating to the audit work and their existing knowledge of Investec which allowed work to commence quality and with minimal disruption.
On the basis of the abovementioned policy and reviews, the audit committees were satisfied that the quantity and type of non-audit work undertaken throughout the year did not impair the independence of Ernst & Young LLP, Ernst & Young Inc. or KPMG Inc.
Working with the external auditorThe audit committees meet with the external auditors to review the scope of the external audit plan, budgets, the extent of non-audit services rendered and all other audit matters. The external auditors are invited to attend audit committee meetings and have access to the audit committees’ chairman.
The audit committees evaluated the effectiveness of the auditors through completion of a questionnaire which, amongst other things, assessed the audit partners, audit team and audit approach (planning and execution), during their presentations at audit committee meetings and ad hoc meetings held with the auditors throughout the year. Senior finance function executives also provided feedback to the audit committees.
Partner accreditation and audit qualityIn terms of the amended JSE Listings Requirements, external audit Partner Accreditation, which was previously done by the Independent Regulatory Board for Auditors (IRBA), is now the responsibility of the audit committee, together with a specific responsibility around audit quality. In this regard separate meetings were held by the audit committees with both Ernst & Young and KPMG. The following was covered:• transparency reports and reviews
by each of the two firms covering their client base, client acceptance and continuance processes, and the approach to clients, if any, that did not meet the client continuance criteria;

(continued)
Corporate governance
Co
rpo
rate go
vernance and co
rpo
rate respo
nsibility
157Investec integrated annual report 2018
• the independence processes of the firm, including partner reward and remuneration criteria;
• interrogation of international and local firm audit quality control processes;
• detailed profiles of all partners and managers on the Investec assignment, including their relevant audit experience, were reviewed;
• each firm was requested to provide details of their respective succession plans to provide the audit committee with assurance as to the partner rotation, transition and continuity process;
• the results of the last firm-wide reviews carried out by regulatory bodies, both IRBA in South Africa as well as international bodies such as the Public Company Accounting Oversight Board (PCAOB); and
• the results of the last individual partner quality reviews carried out by the regulator; internal firm-wide quality control reviews carried out in respect of each partner;
• an audit quality questionnaire was also completed by each member of the audit committee and management, the results of which were that a robust audit is in place.
Regarding the challenges experienced by KPMG Inc. in South Africa, in the context of the SARS report and the resultant external independent investigation by SAICA (Ntsebeza Enquiry), a number of processes were initiated to ensure and confirm audit quality, both actual and perceived:• separate audit committees and board
meetings were held to consider and conclude on the group’s approach to these matters;
• a number of meetings were held with KPMG leadership, both KPMG Inc. and KPMG International covering client acceptance and continuance, risk management, talent retention and continuity as well as our expectations of the international firm; and
• notwithstanding that the audit committee has been satisfied with the calibre and capability of the specific team engaged on Investec, KPMG was requested to put additional KPMG International file and technical reviews into place both for the interim and final audits.
The subsequent developments around KPMG and the VBS audit resulted in the audit committee requirement for the above-mentioned additional procedures being reconfirmed to KPMG Inc. and KPMG International, together with a request for independence reviews and confirmations in respect of all staff on the Investec engagement. Individual sessions with management, the internal auditors and each of the external auditors were undertaken as part of the year end audit committee meeting:
• partners from both Ernst & Young LLP and KPMG International attended the meeting to outline the enhanced and additional cross-reviews that had been undertaken and the results thereof, which had also been considered and reviewed by Ernst & Young Inc. the joint auditors of Investec Limited and by Ernst & Young LLP Inc., the DLC auditors;
• confirmations on independence by both firms were received; and
• assurance was received from KPMG Inc. and KPMG International that they were comfortable to sign off on the financial statements.
The committee concluded that it was satisfied that a robust audit process had been in place with deep levels of enhanced cross reviews by KPMG Inc., Ernst & Young Inc., KPMG International and Ernst & Young LLP.
Re-election of auditorsThe board and audit committee is recommending the re-election of Ernst & Young Inc. and KPMG Inc. as joint auditors of Investec Limited and Investec Bank Limited at its annual general meeting in August 2018. In addition the board and the audit committee is recommending the re-election of Ernst & Young LLP as auditors of Investec plc at its annual general meeting in August 2018.
Our decision to retain KPMG Inc. as one of our joint auditors in South Africa was not taken lightly. The board is concerned about the failures of KPMG’s internal controls and procedures as acknowledged by them. Of greater concern is the significant negative impact this has had on the country’s audit profession, individual lives and the South African economy. Investec is a company that is strongly committed to its core values which require Investec employees, clients, suppliers and service providers to uphold the highest standards of ethical behaviour. We require KPMG International to hold individuals and KPMG Inc. accountable for involvement in the above-mentioned events in South Africa.
In making the recommendation for re-election of Investec Limited’s and Investec Bank Limited’s auditors, the board and audit committee have taken into consideration the South African Companies Act and the South African Prudential Authority requirements with respect to joint auditors and mandatory firm rotation. In addition, the need to ensure stability within the South African financial system and the audit profession at a time of uncertainty and volatility in the country as a whole is important. The board expects KPMG International to support KPMG Inc. and restore and rebuild confidence in KPMG South Africa.
The board will continue to monitor the situation closely and demand that the quality of work performed by KPMG for the group is of a high standard.
Internal controlsThe Investec plc and INL audit committees have responsibility for assessing the adequacy of the group’s internal controls. To fulfil this responsibility, the Investec plc and INL audit committees receive regular reports from risk management, compliance and internal audit including a written opinion from internal audit on the risk management framework, internal controls and internal financial controls. Outlined below are some of the key areas of focus of the Investec plc and INL audit committees over the past year in terms of their ongoing assessment of the adequacy of the group’s internal controls.
Internal auditIn 2015, Grant Thornton were engaged to complete an external review on the effectiveness of the internal audit function. A recommendation of this review was to streamline the internal audit process and, in particular, reduce the number of lower level reviews. Since then, this has been a focus area for internal audit and an area of discussion at Investec plc and INL audit committee meetings. During the course of this year, challenge at committee meetings was centred on getting this balance right in terms of the number of audits, given the risk profile of business’ activities. Delivery of the internal audit plan in a timeous manner has been another key area of focus by the Investec plc and INL audit committees. Monitoring the completion and close out of overdue audit findings and the resourcing of the internal audit function has also been addressed. Based on its review and the above actions, the audit committees concluded that the internal audit function continued to be effective.
Risk management The Investec plc and INL audit committees receive regular reports from operational risk, information technology and compliance. During the course of the year, key topics that have been discussed and debated by the Investec plc and INL audit committees have been:
Business continuity
Consideration of the impact of the London office move in 2018 on the continuity of business operations
Information cyber security
Received and discussed the findings of a follow-up targeted attack simulation that was performed on Investec by an external provider
Regulatory compliance
Review and monitoring of results of regulatory compliance reviews

Co
rpo
rate go
vernance and co
rpo
rate respo
nsibility
(continued)
Corporate governance
158 Investec integrated annual report 2018
DLC board risk and capital committee report
“We believe that robust risk management systems and processes are in place to support the group strategy”
DLC board risk and capital committee
David FriedlandChairman of the DLC BRCC
Key achievements by FY 2018
• Review of successful targeted attack simulations to mitigate cyber crime risk
• Monitoring of progress of the AIRB project
• Monitoring of progress of RDARR Project
• Understanding and challenging the implementation of IFRS 9
Areas of focus by FY 2019
• Monitoring and continued mitigation of risks related to cyber crime and information security
• Monitoring of effective RDARR
• Effective risk data aggregation (fully compliant by 1 April 2018)
• Monitoring of Regulatory Developments:
– Twin Peaks
– FICA
• Impact of economic conditions on Investec
• The BRCC committee will adjust its meeting plan and focus in accordance with any new risks identified
• Monitoring and reviewing the progress made to migrate the wholesale portfolio from FIRB to AIRB
As the chairman of the board risk and capital committee (the BRCC), during the financial year ended 31 March 2018, I am pleased to present our report.
The role of the committee is to review, on behalf of the board, management recommendations on a range of risks facing the business. We perform this function by considering the risk reports presented and question that either no management action is required or that existing actions taken by management following discussion are appropriate.
During the year under review all risk and capital measures remained within the board-approved risk appetite despite a number of emerging economic and political risks which presented itself. Investec Limited continued to make progress on the move towards the Advanced Internal Ratings Based (AIRB) approach in order to measure credit risk. The committee was actively involved in reviewing the various models of the AIRB project and special meetings were held where the various models were presented to the committee for approval. Following interaction with the South African Prudential Authority, the Foundation Internal Rating Based (FIRB) approach will be adopted for the wholesale portfolios and the application for retail portfolios will remain AIRB, with the intention to mitigate the wholesale portfolios from FIRB to AIRB in the foreseeable future.
Subject to regulatory approval the completion of the AIRB project is due in 2018 and is expected to have a positive impact on Investec Limited’s capital ratios. Apart from the special meetings held to approve specific models, the committee regularly reviewed progress made on the timelines indicated in the AIRB and FIRB project plan. The committee reviewed and approved the capital plans for Investec Limited and Investec plc.
The committee monitored progress towards the full compliance with Investec Limited’s Risk Data Aggregation and Risk Reporting (RDARR) by March 2018.
As a committee, we gained comfort in the fact that a detailed review of the risk appetite limits was conducted by the executives in policy executive risk review committee (Policy ERRF), who recommended the risk appetite limits to the committee for approval. We reviewed the risk appetite limits and challenged the assumptions contained therein.
Reports to the committee focus on the key risk disciplines of credit, operational, legal, conduct, reputational, capital, liquidity, market and investment risk and cyber security. However, due to the dynamic nature of the business environment in which Investec operates, the committee is flexible to consider other matters of relevance as they arise. For example, the committee requested a number of ad hoc reports in order to adequately assess risks that are due to once off events.
At each board meeting, a report is presented on the key matters discussed at the committee and focus in accordance with any new risks identified.
Committee performance
Evaluation of the committee’s performance was conducted and no areas of concern in respect of the functioning of the committee were identified.
Role of the chair
During the year, meetings were held regularly with the heads of business, as well as heads of the risk disciplines outside of formal committee meetings in order to maintain and develop an understanding of the group’s operations and risks facing the business. These interactions are an essential part of the role of the chairman, as it provides an additional layer of assurance to help gain comfort that these risks that are reported to the committee accurately reflect the risks facing the business.
The audit committee has the primary role in providing assurance to the board that enterprise wide risks have been correctly identified and appropriate controls are in place. Therefore, the audit committee will rely on the output of the BRCC to give assurance as regards enterprise wide risk. As it is essential that there are some synergies in membership of the DLC audit committee and BRCC, common membership will be retained by Zarina Bassa, as the chair of the DLC audit committee, Philip Hourquebie and Khumo Shuenyane.
Looking forward
In the year ahead, the committee will continue to focus on matters related to the impact of economic conditions on Investec, effective risk data aggregation, the implementation of regulatory requirements such as Twin Peaks, Financial Intelligence Centre Act (FICA) and King IV, information security, cyber crime and risks associated with the fast pace of regulatory change faced by the business and assessing the impact of external factors on the group’s risk profile. Progress made towards to the AIRB project deadline will also be a regular agenda item.
The committee will continue to focus on the requirements in relation to the General Data Protection Regulations (GDPR) and the implementation of IFRS 9.
David FriedlandChairman, DLC BRCC
12 June 2018

(continued)
Corporate governance
Co
rpo
rate go
vernance and co
rpo
rate respo
nsibility
159Investec integrated annual report 2018
How the BRCC worksRoleThe BRCC is an essential part of the group’s governance framework to which the board has delegated the monitoring of the group’s activities in relation to a number of risks and capital management. The BRCC is the most senior risk management committee of the group and comprises executive and non-executive membership (the majority of whom are non-executive directors). It covers each material banking, wealth management and asset management subsidiary company within the wider group.
The BRCC has to ensure that all risks are identified and properly mitigated and managed. Good client and market conduct is paramount in all the group does and the BRCC ensures a robust culture supported by oversight and management information to evidence good practice.
The BRCC is also the appointed board committee to meet the requirements of the South African Banks Act 94 of 1990 and the Capital Requirements Regulation and Directive (CRR/CRD IV), adopted by the European Commission and implemented in the UK. This requires the board of directors of a bank and a holding company to appoint a risk and capital committee.
The nomdac and the board have formed the opinion that the BRCC has the appropriate balance of knowledge and skills in order to discharge its duties. In particular, the majority of members are independent non-executive directors, as required in terms of King IV, and all members have the relevant knowledge and experience for them to be able to consider the issues that are presented to the committee.
Meeting schedule and attendanceBRCC meets at least six times every year. During the year ended 31 March 2018, the BRCC met six times.
A combined BRCC/audit committee meeting was held to receive a status update on the IFRS 9 project.
How the committee spent its time
Other (including legal, operational, group insurance, conduct risk business continuity, cyber crime and IT) Capital Balance sheet risk Credit risk Market risk
25% 25% 20% 20% 10%
Composition and meeting attendance (6 meetings in the year)
Members during the yearCommittee
member sinceEligible to
attend Attended
D Friedland (chairman) 13 Sept 2013 6 6
SE Abrahams* 11 Mar 2011 6 5
ZBM Bassa 14 Nov 2014 6 6
GR Burger 11 Mar 2011 6 5
H Fukuda OBE** 13 Sept 2013 6 6
PA Hourquebie 17 Aug 2017 4 4
B Kantor 11 Mar 2011 6 5
S Koseff 11 Mar 2011 6 6
KL Shuenyane 16 Jan 2015 6 6
B Stevenson*** 4 Sept 2016 6 6
F Titi 11 Mar 2011 6 4
PRS Thomas**** 11 Mar 2011 6 6
* SE Abrahams is a representative of Investec Bank Limited.** H Fukuda is a representative of Investec Bank plc.*** B Stevenson is a representative of Investec Bank plc.**** PRS Thomas is a representative of Investec Bank Limited.
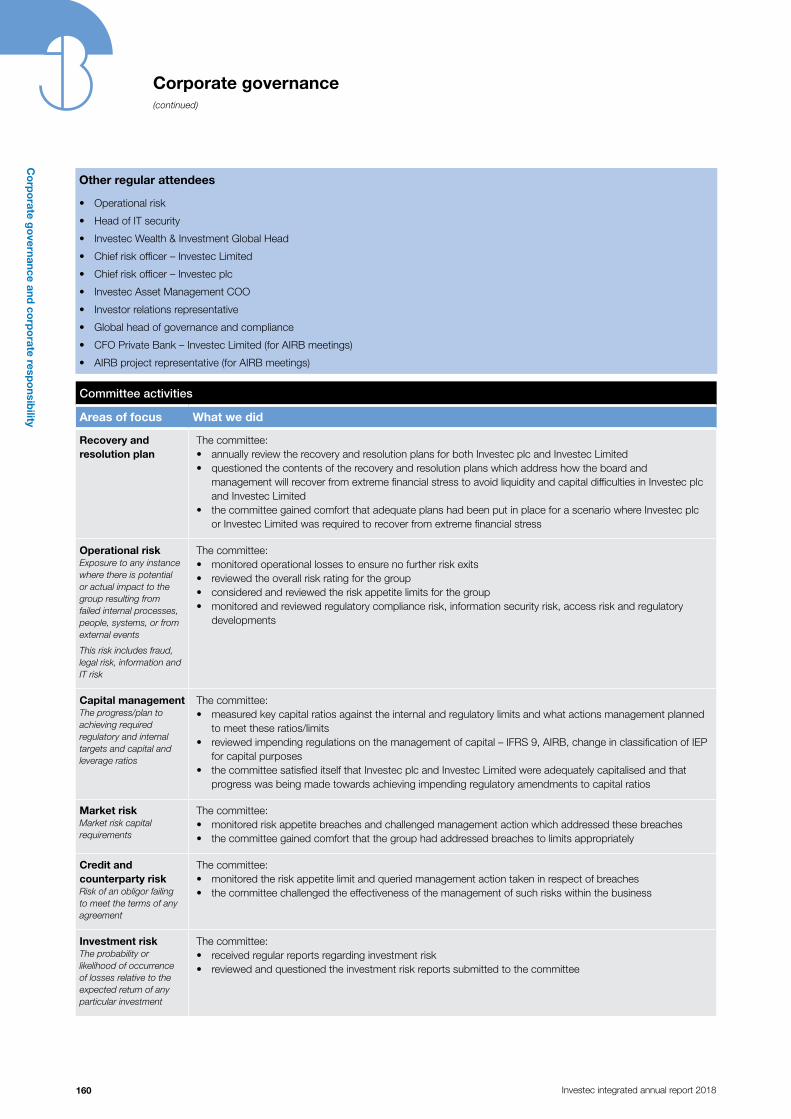
Co
rpo
rate go
vernance and co
rpo
rate respo
nsibility
(continued)
Corporate governance
160 Investec integrated annual report 2018
Other regular attendees
• Operational risk
• Head of IT security
• Investec Wealth & Investment Global Head
• Chief risk officer – Investec Limited
• Chief risk officer – Investec plc
• Investec Asset Management COO
• Investor relations representative
• Global head of governance and compliance
• CFO Private Bank – Investec Limited (for AIRB meetings)
• AIRB project representative (for AIRB meetings)
Committee activities
Areas of focus What we did
Recovery and resolution plan
The committee: • annually review the recovery and resolution plans for both Investec plc and Investec Limited• questioned the contents of the recovery and resolution plans which address how the board and
management will recover from extreme financial stress to avoid liquidity and capital difficulties in Investec plc and Investec Limited
• the committee gained comfort that adequate plans had been put in place for a scenario where Investec plc or Investec Limited was required to recover from extreme financial stress
Operational riskExposure to any instance where there is potential or actual impact to the group resulting from failed internal processes, people, systems, or from external events
This risk includes fraud, legal risk, information and IT risk
The committee:• monitored operational losses to ensure no further risk exits• reviewed the overall risk rating for the group• considered and reviewed the risk appetite limits for the group• monitored and reviewed regulatory compliance risk, information security risk, access risk and regulatory
developments
Capital managementThe progress/plan to achieving required regulatory and internal targets and capital and leverage ratios
The committee:• measured key capital ratios against the internal and regulatory limits and what actions management planned
to meet these ratios/limits• reviewed impending regulations on the management of capital – IFRS 9, AIRB, change in classification of IEP
for capital purposes• the committee satisfied itself that Investec plc and Investec Limited were adequately capitalised and that
progress was being made towards achieving impending regulatory amendments to capital ratios
Market riskMarket risk capital requirements
The committee:• monitored risk appetite breaches and challenged management action which addressed these breaches• the committee gained comfort that the group had addressed breaches to limits appropriately
Credit and counterparty riskRisk of an obligor failing to meet the terms of any agreement
The committee:• monitored the risk appetite limit and queried management action taken in respect of breaches• the committee challenged the effectiveness of the management of such risks within the business
Investment riskThe probability or likelihood of occurrence of losses relative to the expected return of any particular investment
The committee:• received regular reports regarding investment risk• reviewed and questioned the investment risk reports submitted to the committee

(continued)
Corporate governance
Co
rpo
rate go
vernance and co
rpo
rate respo
nsibility
161Investec integrated annual report 2018
Committee activities continued
Areas of focus What we did
Reputational riskRisk of damage to our reputation, name or brand
The committee:• monitored events which could potentially create reputational risk • gained comfort that reputational risk was mitigated as much as possible through detailed processes and
governance escalation procedures from business units to the board, and from regular, clear communication with all stakeholders
Conduct riskRisk that detriment caused to the bank, its customers, its counterparties or the market as a result of inappropriate execution of business activities
The committee:• reviewed and questioned the conduct risk report which is discussed at each meeting• challenged the effectiveness of the management of such risks within the business
Balance sheet risk Financial risks relating to our asset and liability portfolios, comprising market liquidity, funding, concentration, non-trading interest rate and foreign exchange, encumbrance and leverage risks
The committee:• reviewed a report which highlights bank activity, liquidity balances and key measures against thresholds
and limits• challenged the effectiveness of the management of such risks within the business
Business continuity riskStrategy to be able to function in the event of a disaster
The committee:• reviewed, challenged and debated reports which highlight processes in place to manage this risk• challenged the effectiveness of the management of such risk within the business
Cyber crime riskCyber crime risk is the risk the group is exposed to by criminal activities carried out by means of computers or the internet
The committee:• received regular reports regarding the cyber crime landscape, including lessons learnt from external cyber
attacks• received the targeted attack simulation results and ensured that any remediation required was completed• gained comfort that the management of cyber crime was given the necessary priority
DLC remuneration committee reportFor information on the decisions taken by the remuneration committee, refer to the remuneration report contained on pages 184 to 244.
(11 meetings in the year)
Members during the year Committee
member since Eligible to attendNumber of meetings
attended
PKO Crosthwaite (former chairman)* 2 Feb 2011 11 11
PA Hourquebie (chairman)** 14 Aug 2017 7 7
ZBM Bassa 10 Sept 2015 11 11
CR Jacobs 8 Aug 2014 11 10
F Titi*** 18 Sept 2013 10 10
* PKO Crosthwaite stepped down as chairman of the DLC remuneration committee with effect from 31 March 2018.** PA Hourquebie was appointed to the DLC remuneration committee with effect from 14 August 2017 and was appointed chairman with effect from
1 April 2018. PA Hourguebie recused himself from any discussions in relation to the remuneration of the chairman of the DLC remuneration committee.*** F Titi stepped down from the DLC remuneration committee with effect from 23 February 2018.
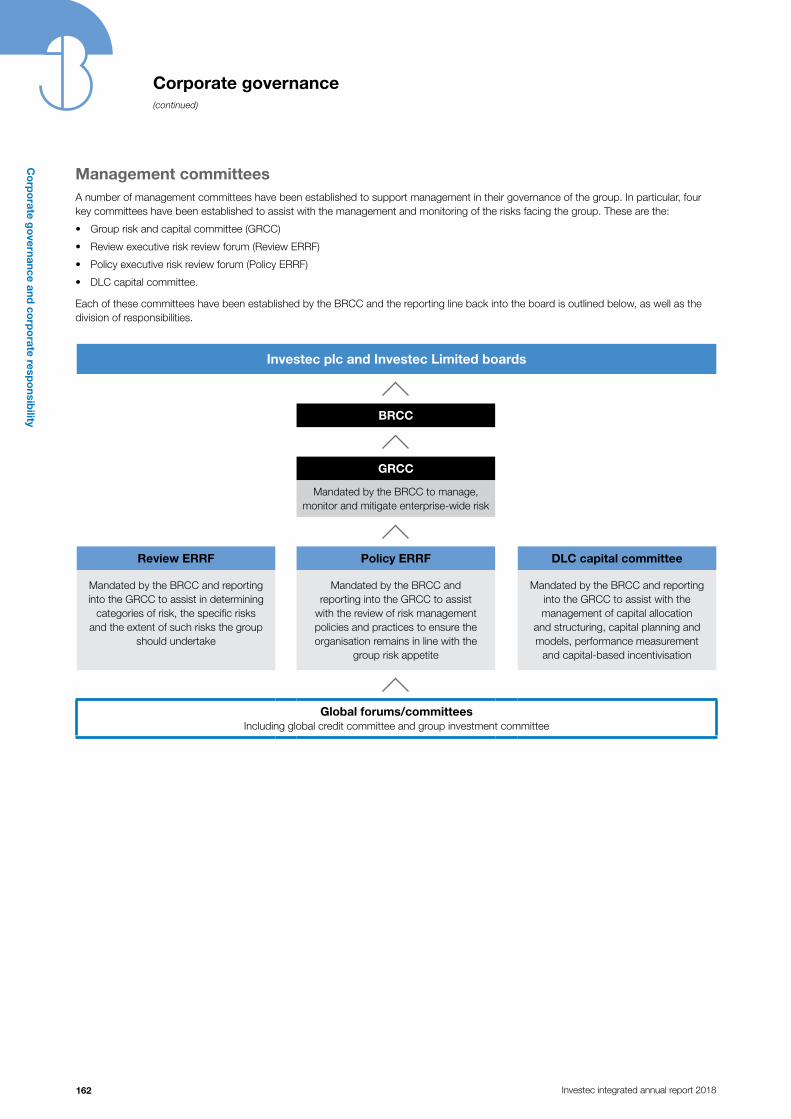
Co
rpo
rate go
vernance and co
rpo
rate respo
nsibility
(continued)
Corporate governance
162 Investec integrated annual report 2018
Management committeesA number of management committees have been established to support management in their governance of the group. In particular, four key committees have been established to assist with the management and monitoring of the risks facing the group. These are the:
• Group risk and capital committee (GRCC)
• Review executive risk review forum (Review ERRF)
• Policy executive risk review forum (Policy ERRF)
• DLC capital committee.
Each of these committees have been established by the BRCC and the reporting line back into the board is outlined below, as well as the division of responsibilities.
Investec plc and Investec Limited boards
BRCC
GRCC
Mandated by the BRCC to manage, monitor and mitigate enterprise-wide risk
Review ERRF Policy ERRF DLC capital committee
Mandated by the BRCC and reporting into the GRCC to assist in determining
categories of risk, the specific risks and the extent of such risks the group
should undertake
Mandated by the BRCC and reporting into the GRCC to assist
with the review of risk management policies and practices to ensure the organisation remains in line with the
group risk appetite
Mandated by the BRCC and reporting into the GRCC to assist with the management of capital allocation
and structuring, capital planning and models, performance measurement
and capital-based incentivisation
Global forums/committeesIncluding global credit committee and group investment committee

(continued)
Corporate governance
Co
rpo
rate go
vernance and co
rpo
rate respo
nsibility
163Investec integrated annual report 2018
Regulatory contextInvestec operates under a dual listed companies (DLC) structure which requires compliance with the principles contained in the South African King IV Code of Corporate Governance Principle (available at www.iodsa.co.za) and the April 2016 edition of the UK Corporate Governance Code (available at www.frc.org.uk).
We believe that sound corporate governance depends on much more than mere compliance with regulations. Good conduct and ethical practice is embedded in everything that we do at Investec. By acting in accordance with our values and principles, we believe that good governance is ensured.
Statement of complianceUK Corporate Governance Code
During the year ended 31 March 2018, Investec has complied with all the provisions of the UK Corporate Governance Code.
King IV
The board is of the opinion that, based on the practices and outcomes disclosed throughout this report, which were in operation during the year under review, the group has applied the King IV principles.
Further refinement required to our governance processes as a result of King IV will be made during the course of the year ahead and reported against in next year’s annual report.
Other statutory informationViability statement
In addition to providing a going concern statement, the board is required, in terms of the UK Corporate Governance Code, to make a statement with respect to the group’s viability (i.e. its ability to continue in operation and meet its liabilities) taking into account the current position of the group, the board’s assessment of the group’s prospects and the principal risks it
faces. Following confirmation by the BRCC (comprising a majority of non-executive directors, which includes members of the audit committees), the audit committees recommended the viability statement for board approval.
The board has identified the principal and emerging risks facing the group and these are highlighted on pages 49 and 50.
Through its various sub-committees, notably the audit committees, the GRCC, the BRCC and the management and GRCC capital committees, the board regularly carries out a robust assessment of these risks, and their potential impact on the performance, liquidity and solvency of the group. The activities of these board sub-committees and the issues considered by them are described in this governance section of this report.
Taking these risks into account, together with the group’s strategic objectives and the prevailing market environment, the board approved the overall risk appetite for the Investec group. The group’s risk appetite statement sets broad parameters relating to the board’s expectations around performance, business stability and risk management.
The board considers that prudential risk management is paramount in all it does. Protection of depositors, customers’ interests, capital adequacy and shareholder returns are key drivers. To manage the group’s risk appetite there are a number of detailed policy statements and governance structures in place. The board ensures that there are appropriate resources in place to manage the risks arising from running our business by having independent risk management, compliance, and financial control functions. These are supplemented by an internal audit function that reports independently to a non-executive audit committee chairman.
The board believes that the risk management systems and processes we have in place are adequate to support the group’s strategy and allow the group to operate within its risk appetite framework.
A review of the group’s performance/measurement against its risk appetite framework is provided at each BRCC meeting and at the main board meetings.
In terms of the South African Prudential Authority, the FCA and PRA requirements, the group is also required to meet regulatory standards with respect to capital and liquidity. In terms of these requirements, the group is required to stress its capital and liquidity positions under a number of severe stress conditions. Investec’s stress testing framework is well embedded in its operations and is designed to identify and regularly test the group’s key ‘vulnerabilities under stress’.
Scenario modelling and rigorous daily liquidity stress tests are performed to measure and manage the group’s respective banking entities’ liquidity positions such that payment obligations can be met under a wide range of company specific and market-driven stress scenarios. The objective is to have sufficient liquidity, in an acute stress scenario, to continue to operate for a minimum period as detailed in the board-approved risk appetite and as required by the regulators. The group’s risk appetite also requires each banking entity to maintain a minimum cash to customer deposit ratio of 25%, and ensure that the respective banking entities are not reliant on wholesale funding to fund core asset growth. Each banking entity is required to be fully self-funded. Our banking businesses in both the UK and South Africa exceed the regulatory requirements for the net stable funding ratio and liquidity coverage ratio. The group currently has £12.8 billion in cash and near cash assets, representing 41.4% of customer deposits.
The group develops annual capital plans that look forward over a three-year period. These plans are designed to assess the capital adequacy of the group’s respective banking entities under a range of economic and internal conditions, with the impact on earnings, asset growth, risk appetite and liquidity considered. The output of capital planning allows senior management and the board to make decisions to ensure
How we comply

Co
rpo
rate go
vernance and co
rpo
rate respo
nsibility
(continued)
Corporate governance
164 Investec integrated annual report 2018
that the group continues to hold sufficient capital to meet internal and regulatory capital targets over the medium term (i.e. three years). The group targets a minimum capital adequacy ratio of 14% to 17%, a common equity tier 1 ratio in excess of 10% and a leverage ratio in excess of 6% for each of its banking entities.
The parameters used in the capital and liquidity stresses are reviewed regularly, taking into account changes in the business environments and inputs from business units. A detailed ‘bottom-up’ analysis is performed in designing Investec’s specific stress scenarios. The group also incorporates the South African Prudential Authority and Bank of England (BoE) annual cyclical stress scenarios into its capital and liquidity processes. As the group’s banking entities are regulated separately and ring-fenced from one another, different stress scenarios apply across the respective banking entities and jurisdictions.
Both Investec Limited and Investec plc run a number of stress scenarios, some of which are briefly highlighted below.
Investec Limited:
• A scenario which incorporates a global economic slowdown, possibility of further South African sovereign credit rating downgrades, Rand weakness, depressed confidence and investment measures and where South Africa experiences a V-shaped recession and a commodity price slump
• A scenario where there is a sovereign crises, persistent government service outages, sub-investment grade South African sovereign credit ratings, partial loss of private sector property rights under state custodianship and a global recession.
Investec plc:
• The BoE’s annual cyclical stress scenario: this scenario incorporates a UK slowdown in GDP growth, a material slump in Pounds Sterling, increasing inflationary pressures which are combated by an increase in UK interest rates to 4%, in addition to a significant house price fall
• A scenario where there is a material stress on corporates and protracted weak global growth with low interest rates
• A scenario where there is increased political uncertainty and a domestic household shock incorporating a UK downturn, high UK interest rates and a UK housing market slump. In this scenario we assume that the international backdrop is benign with some slight negative spill over from the UK through various linkages to the Euro area, with Ireland most acutely exposed.
We also carry out ‘reverse stress tests’, i.e. those scenarios that would cause the group to breach its capital and liquidity requirements. These scenarios are considered highly unlikely, given the group’s strong liquidity position and sound capital and leverage parameters.
Furthermore, the group is required to have a recovery and resolution plan for both Investec plc and Investec Limited. The purpose of the recovery plans are to document how the board and senior management will ensure that the group recovers from extreme financial stress to avoid liquidity and capital difficulties in its separately regulated companies.
The capital and liquidity plans, stress scenarios, recovery and resolution plans and the risk appetite statement are reviewed at least annually. In addition, senior management hosts an annual three-day risk appetite process at which the group’s risk appetite framework is reviewed and modified to take into account risk experience and changes in the environment. Furthermore, strategic budget processes which focus on, amongst other things, the business and competitive landscape; opportunities and challenges; financial projections – take place within each business division at least annually. A summary of these divisional budgets, together with a consolidated group budget, is presented to the board during its strategic review process early in the year.
In assessing the group’s viability, the board has taken all of the abovementioned factors, documents and processes into consideration. The directors can confirm that they have a reasonable expectation that Investec will continue to operate and meet its liabilities as they fall due over the next three years. The board has used a three-year assessment period as this is aligned to the group’s medium-term capital plans which incorporate profitability, liquidity, leverage and capital adequacy projections
and include impact assessments from a number of stress scenarios. The board has assessed the group’s viability in its ‘base case’ and stress scenarios. Detailed management information therefore exists to provide senior management and the board sufficient and realistic visibility of the group’s viability over the next three years to 31 March 2021 under these various scenarios. In assessing the group’s viability, a number of assumptions are built into its capital and liquidity plans. In the stress scenarios these include, for example, dividend payments being reduced and asset growth being curtailed.
The viability statement should be read in conjunction with the following sections in the annual report, all of which have informed the board’s assessment of the group’s viability:
• Pages 5 to 85, which shows a strategic and financial overview of the business
• Pages 42 and 50, which provide detail on the principal and emerging risks the group faces
• Page 11 in volume two, which highlights information on the group’s risk appetite framework
• Page 6 to 8 and 12 to 16 in volume two, which provide an overview of the group’s approach to risk management, and the processes in place to assist the group in mitigating its principal risks
• Pages 8, 18, 53, 60, 63 and 82 in volume two which highlight information on the group’s various stress testing processes
• Pages 62 and 63 in volume two, which specifically focus on the group’s philosophy and approach to liquidity management
• Pages 78 to 83 in volume two which explain the group’s capital management framework.
This forward-looking viability statement made by the board is based on information and knowledge of the group at 12 June 2018. There could be a number of risks and uncertainties arising from (but not limited to) domestic and global economic and business conditions beyond the group’s control that could cause the group’s actual results, performance or achievements in the markets in which it operates to differ from those anticipated.
(continued)
Corporate governance
Co
rpo
rate go
vernance and co
rpo
rate respo
nsibility
165Investec integrated annual report 2018
Conflict of interest
Certain statutory duties with respect to directors’ conflict of interest are in force under the UK Companies Act and the South African Companies Act. In accordance with these Acts and the Articles of Association (Articles) of Investec plc and the Memorandum of Incorporation (MOI) of Investec Limited, the board may authorise any matter that otherwise may involve the directors breaching their duty to avoid conflicts of interest. The board has adopted a procedure, as set out in the Articles and MOI that includes a requirement for directors to submit, in writing, disclosures detailing any actual or potential conflict for consideration, and if considered appropriate, approval.
External directorships
Outside business interests of directors are closely monitored and we are satisfied that all of the directors have sufficient to effectively discharge their duties.
Dealings in securities
Dealings in securities are subject to the personal account dealing policy. The policy is based on regulatory guidance and industry practice and is updated to ensure compliance with applicable regulations and industry best practice.
The policy is designed to discourage speculative trading and highlight potential conflicts of interest between the interest of employees and the Investec group or any of its clients, shareholders or potential
shareholders. The UKLA’s Disclosure and Transparency Rules require us to disclose transactions in shares and related securities by all persons discharging management responsibilities and their “connected persons”. These include directors and senior executives of the group.
Staff are prohibited from dealing in all listed Investec securities during closed periods. Tradings are restricted in respect of all Investec Limited, Investec plc, Investec Property Fund Limited (IPF) and Investec Australia Property Fund Limited (IAPF) securities as well as any warrants, OTC and exchange traded derivatives on the said securities. Staff are restricted from exercising options through Investec Staff Share Schemes during closed periods.
The UK and South African Companies Acts require directors to disclose any direct or indirect material interest they have in contracts, including proposed contracts, which are of significance to the company’s business. Directors are required to make these disclosures at board meetings, and all disclosures made are recorded in the minutes of that meeting.
Staff are required to undertake not to use any personal hedging strategies to lessen the impact of a reduction in value of any share award or any vested shares which are subject to a retention period following any vesting date. Any breach of this condition will result in the lapse of any unvested proportion of such reward, unless the DLC remuneration committee determines otherwise.
Directors’ dealings
Directors dealings in the securities of Investec plc and Investec Limited are subject to a policy based on the Disclosure Guidance and Transparency Rules of the UKLA and the JSE Listings Requirements.
All directors’ and company secretaries dealings require the prior approval of the compliance division and the chairman, the senior independent director or the chairman of the audit committee.
All dealings of persons discharging management responsibilities require approval by line management, the compliance division and the chairman.
Report to shareholdersThis report to shareholders has been approved and authorised for issue to the shareholders of Investec plc and Investec Limited on 12 June 2018 and signed on its behalf by:
David MillerCompany secretary
Investec plc
Niki van WykCompany secretary
Investec Limited

Co
rpo
rate go
vernance and co
rpo
rate respo
nsibility
166 Investec integrated annual report 2018
Investec ordinary sharesAs at 31 March 2018 Investec plc and Investec Limited had 669.8 million and 310.7 million ordinary shares in issue respectively.
Spread of ordinary shareholders as at 31 March 2018Investec plc ordinary shares in issue
Number of shareholders Holdings
% of total shareholders
Number of shares in issue
% of issued share capital
16 451 1 – 500 54.5% 3 066 804 0.5%
5 148 501 – 1 000 17.1% 3 921 349 0.6%
5 789 1 001 – 5 000 19.2% 12 820 080 1.9%
870 5 001 – 10 000 2.9% 6 322 860 0.9%
1 034 10 001 – 50 000 3.4% 24 032 663 3.6%
275 50 001 – 100 000 0.9% 19 574 644 2.9%
615 100 001 and over 2.0% 600 100 295 89.6%
30 182 100.0% 669 838 695 100.0%
Investec Limited ordinary shares in issue
Number of shareholders Holdings
% of total shareholders
Number of shares in issue
% of issued share capital
3 655 1 – 500 44.6% 697 644 0.2%
1 286 501 – 1 000 15.7% 991 581 0.3%
1 759 1 001 – 5 000 21.4% 3 985 673 1.3%
378 5 001 – 10 000 4.6% 2 836 314 0.9%
626 10 001 – 50 000 7.6% 14 952 706 4.8%
181 50 001 – 100 000 2.2% 12 757 948 4.1%
317 100 001 and over 3.9% 274 500 878 88.4%
8 202 100.0% 310 722 744 100.0%
62.3%
8.0%
15.0%
1.9%
2.4%
10.4%
Investec Limited
South Africa
UK
USA and Canada
Rest of Europe
Asia
Other countries and unknown
Geographical holding by bene�cial ordinary shareholder as at 31 March 2018
52.7%
22.8%
14.5%
5.0%
1.8%
3.2%
Investec plc
South Africa
UK
USA and Canada
Rest of Europe
Asia
Other countries and unknown
Shareholder analysis

(continued)
Co
rpo
rate go
vernance and co
rpo
rate respo
nsibility
167Investec integrated annual report 2018
Largest ordinary shareholders as at 31 March 2018In accordance with the terms provided for in section 793 of the UK Companies Act 2006 and section 56 of the South African Companies Act, 2008, as amended, the group has conducted investigations into the registered holders of its ordinary shares (including nominee and asset management companies) and the results are as disclosed below.
Investec plc
Shareholder analysis by manager groupNumber of
shares % holding
1. Allan Gray (ZA) 71 494 791 10.7%
2. Coronation Fund Managers (ZA) 49 462 280 7.4%3. Public Investment Corporation (ZA) 40 553 224 6.1%4. BlackRock Inc (US & UK) 38 477 035 5.7%5. Old Mutual (ZA) 34 052 783 5.1%6. Prudential Group (ZA) 30 358 867 4.5%7. The Vanguard Group, Inc (US & UK) 20 537 935 3.1%8. Investec Asset Management* (ZA) 17 766 926 2.7%9. T Rowe Price Associates (UK) 17 073 903 2.5%
10. State Street Corporation (US & UK) 16 865 642 2.5%Cumulative total 336 643 386 50.3%
The top 10 shareholders account for 50.3% of the total shareholding in Investec plc. This information is based on a threshold of 20 000 shares. Some major fund managers hold additional shares below this, which may cause the above figures to be marginally understated.
* In custody, held on behalf of clients.
Investec Limited
Shareholder analysis by manager groupNumber of
shares % holding
1. Allan Gray (ZA) 38 471 349 12.4%
2. Public Investment Corporation (ZA) 35 492 302 11.4%3. Investec Staff Share Scheme (ZA) 14 674 608 4.7%4. Old Mutual (ZA) 13 123 570 4.2%5. BlackRock Inc (US & UK) 12 223 803 3.9%6. Sanlam Group (ZA) 10 554 623 3.4%7. The Vanguard Group, Inc (US & UK) 10 492 686 3.4%8. Coronation Fund Managers (ZA) 10 186 937 3.3%9. Dimensional Fund Advisors (UK) 8 276 719 2.7%
10. Entrepreneurial Development Trust (ZA) 5 547 362 1.8%Cumulative total 159 043 959 51.2%
The top 10 shareholders account for 51.2% of the total shareholding in Investec Limited. This information is based on a threshold of 20 000 shares. Some major fund managers hold additional shares below this, which may cause the above figures to be marginally understated.
Shareholder classification as at 31 March 2018
Number of Investec plc
shares % holding
Number of Investec
Limited shares % holding
Public* 644 874 220 96.2% 292 552 654 94.3%
Non-public 24 964 475 3.8% 18 170 090 5.7%Non-executive directors of Investec plc/Investec Limited 1 144 683 0.2% 325 –Executive directors of Investec plc/Investec Limited 10 651 547 1.6% 3 495 157 1.0%Investec staff share schemes 13 168 245 2.0% 14 674 608 4.7%
Total 669 838 695 100.0% 310 722 744 100.0%
* As per the JSE Listings Requirements.
Shareholder analysis

Co
rpo
rate go
vernance and co
rpo
rate respo
nsibility
(continued)
168 Investec integrated annual report 2018
Share statisticsInvestec plc
For the year ended 31 March
201831 March
201731 March
201631 March
201531 March
201431 March
201331 March
2012
Closing market price per share (Pounds Sterling)
– year ended 5.50 5.44 5.13 5.61 4.85 4.59 3.82
– highest 6.49 6.19 6.47 6.06 5.08 5.14 5.22
– lowest 4.61 4.19 4.03 4.91 3.66 3.10 3.18
Number of ordinary shares in issue (million)1 669.8 657.1 617.4 613.6 608.8 605.2 598.3
Market capitalisation (£’million)1 3 684 3 575 3 167 3 442 2 953 2 778 2 286
Daily average volumes of share traded (’000) 1 807 1 618 1 474 2 170 1 985 1 305 1 683
Price earnings ratio2 10.3 11.3 12.4 14.2 12.8 12.7 12.0
Dividend cover (times)2 2.2 2.1 2.0 2.0 2.0 2.0 1.9
Dividend yield (%)2 4.4 4.2 4.1 3.5 3.9 3.9 4.5
Earnings yield (%)2 9.7 8.9 8.1 7.0 7.8 7.9 8.3
Investec Limited
For the year ended 31 March
201831 March
201731 March
201631 March
201531 March
201431 March
201331 March
2012
Closing market price per share (Rands)
– year ended 92.28 91.46 109.91 100.51 84.84 64.26 47.16
– highest 105.62 112.11 121.90 107.35 85.04 69.89 57.36
– lowest 85.00 81.46 93.91 86.02 59.00 41.31 42.00
Number of ordinary shares in issue (million)3 310.7 301.2 291.4 285.7 282.9 279.6 276.0
Market capitalisation (R’million)3 90 486 87 646 99 886 90 388 75 652 56 857 41 232
Market capitalisation (£’million)3 5 393 5 213 4 662 5 045 4 325 4 061 3 340
Daily average volume of shares traded (’000) 1 031 1 149 963 739 810 980 1 033
1 The LSE only include the shares in issue for Investec plc, i.e. currently 669.8 million, in calculating market capitalisation, as Investec Limited is not incorporated in the UK.
2 Calculations are based on the group’s consolidated earnings per share before goodwill, acquired intangibles and non-operating items; and dividends per share as prepared in accordance with IFRS and denominated in Pounds Sterling.
3 The JSE have agreed to use the total number of shares in issue for the combined group, comprising Investec plc and Investec Limited, in calculating market capitalisation, i.e. currently a total of 980.6 million shares in issue.
Shareholder analysis

(continued)
Co
rpo
rate go
vernance and co
rpo
rate respo
nsibility
169Investec integrated annual report 2018
Investec preference sharesInvestec plc, Investec Limited and Investec Bank Limited have issued preference shares.
Spread of preference shareholders as at 31 March 2018
Investec plc preference shareholders
Number of shareholders Holdings
% of total shareholders
Number of preference
shares in issue
% of issued preference
share capital
50 1 – 500 14.0% 10 674 0.4%
48 501 – 1 000 13.5% 38 268 1.4%176 1 001 – 5 000 49.3% 342 895 12.4%30 5 001 – 10 000 8.4% 230 513 8.3%41 10 001 – 50 000 11.5% 910 794 33.1%9 50 001 – 100 000 2.5% 698 655 25.4%3 100 001 and over 0.8% 522 788 19.0%
357 100.0% 2 754 587 100.0%
Investec plc (Rand-denominated) perpetual preference shareholders
Number of shareholders Holdings
% of total shareholders
Number of preference
shares in issue
% of issued preference
share capital
52 1 – 500 52.0% 10 263 7.8%17 501 – 1 000 17.0% 13 741 10.5%26 1 001 – 5 000 26.0% 62 594 47.6%3 5 001 – 10 000 3.0% 18 849 14.3%2 10 001 – 50 000 2.0% 26 000 19.8%– 50 001 – 100 000 – – –– 100 001 and over – – –
100 100.0% 131 447 100.0%
Investec Limited perpetual preference shareholders
Number of shareholders Holdings
% of total shareholders
Number of preference
shares in issue
% of issued preference
share capital
1 083 1 – 500 18.8% 340 472 1.1%1 321 501 – 1 000 23.0% 1 089 913 3.4%2 470 1 001 – 5 000 43.0% 5 761 320 17.9%
431 5 001 – 10 000 7.5% 3 112 946 9.6%363 10 001 – 50 000 6.3% 7 080 709 22.0%44 50 001 – 100 000 0.8% 3 078 559 9.5%35 100 001 and over 0.6% 11 750 580 36.5%
5 747 100.0% 32 214 499 100.0%
Investec Limited redeemable preference shareholders
Number of shareholders Holdings
% of total shareholders
Number of preference
shares in issue
% of issued preference
share capital
44 1 – 500 59.5% 5 287 2.5%4 501 – 1 000 5.4% 3 228 1.5%
16 1 001 – 5 000 21.6% 36 726 17.2%3 5 001 – 10 000 4.0% 25 346 11.9%7 10 001 – 50 000 9.5% 142 348 66.9%– 50 001 – 100 000 – – –– 100 001 and over – – –
74 100.0% 212 935 100.0%
Shareholder analysis

Co
rpo
rate go
vernance and co
rpo
rate respo
nsibility
(continued)
170 Investec integrated annual report 2018
Investec Bank Limited perpetual preference shareholders
Number of shareholders Holdings
% of total shareholders
Number of preference
shares in issue
% of issued preference
share capital
760 1 – 500 21.2% 214 921 1.4%891 501 – 1 000 24.9% 774 482 5.0%
1 422 1 001 – 5 000 39.8% 3 390 214 22.0%256 5 001 – 10 000 7.2% 1 850 404 12.0%208 10 001 – 50 000 5.8% 3 962 169 25.6%21 50 001 – 100 000 0.6% 1 457 218 9.4%17 100 001 and over 0.5% 3 798 222 24.6%
3 575 100.0% 15 447 630 100.0%
Investec Bank Limited redeemable preference shareholders
Number of shareholders Holdings
% of total shareholders
Number of preference
shares in issue
% of issued preference
share capital
875 1 – 500 91.8% 110 916 32.5%49 501 – 1 000 5.2% 32 880 9.6%
20 1 001 – 5 000 2.1% 36 347 10.6%3 5 001 – 10 000 0.3% 17 249 5.1%5 10 001 – 50 000 0.5% 82 499 24.1%1 50 001 – 100 000 0.1% 61 826 18.1%– 100 001 and over – – –
953 100.0% 341 717 100.0%
Largest preference shareholders as at 31 March 2018 Shareholders holding beneficial interests in excess of 5.0% of the issued preference shares are as follows:
Investec plc perpetual preference sharesHargreave Hale Nominees Limited 13.1%
Investec plc (Rand-denominated) perpetual preference sharesPrivate individual 9.9%Private individual 9.9%Private individual 5.9%
Investec Limited perpetual preference sharesStandard Chartered Bank – Coronation Strategic Income fund 5.0%
Investec Limited redeemable preference sharesPrivate individual 21.9%Private individual 12.5%Private individual 8.2%Private individual 7.5%Private individual 6.9%Private individual 5.1%
Investec Bank Limited perpetual preference sharesThere were no shareholders holding beneficial interests in excess of 5.0% of the issued preference shares in Investec Bank Limited, as at 31 March 2018.
Investec Bank Limited redeemable preference sharesSaldanha Group Investments Proprietary Limited 18.1% Sirius Motor Corporation 5.9%
Shareholder analysis

Co
rpo
rate go
vernance and co
rpo
rate respo
nsibility
171Investec integrated annual report 2018
External recognition and group membershipsAlthough we are not driven by awards and recognition, Investec participates and has maintained its inclusion in the following world-leading indices. These indices have been designed objectively to measure the performance of companies that meet global-recognised corporate responsibility standards.
2018 2017 2016
Carbon Disclosure Project (CDP) (Investec is a member and Investec Asset Management is a signatory investor)
B A- A-
Code for Responsible Investing in South Africa (CRISA)
Signatory Signatory Signatory
Dow Jones Sustainability Investment Index* (score out of 100)
73 69 69
ECPI Index Constituent n/a n/a
FTSE4Good Index Included Included Included
FTSE/JSE Responsible Investment Index series Constituent Constituent Constituent
MSCI Global Sustainability Index Series (Investec plc) – Intangible value assessment (IVA) rating
AAA AAA AAA
STOXX Global ESG Leaders Indices Member Member Member
United Nations Global Compact Participant Active Active
United Nations Principles for Responsible Investment (UNPRI) Signatory Signatory Signatory
* Investec Limited ranked as one of four industry leaders on the DJSI Emerging Markets Index; Investec plc ranked as one of 15 industry leaders on the DJSI World and one of nine in the DJSI Europe indices.
Corporate responsibility business practices
Guided by our purpose to create sustained long-term wealth, we seek to be a positive influence in all our core businesses and in each of the societies in which we operate. We do this by empowering communities through entrepreneurship and education, and leveraging the value in our diversity. We recognise the challenges that climate change presents to the global economy and we support activities that either reduces the negative impact on, or prolongs the life of, our planet.
Our corporate responsibility philosophy
Investec as a responsible corporate citizen
Our culture and values demonstrate our belief that as an organisation we can and must have a positive impact on the success and well-being of communities local to our offices, the environment, and on overall macro-economic stability.
Our philosophy seeks to align the interests of shareholders and stakeholders over time, and provides the individual business units and regions with a basis from which to determine their own approach. The group’s philosophy is not intended to be mutually exclusive or exhaustive, but allows us to
concentrate, for now, on key focus areas. Deliberately not driven on a top-down basis, the executive maintains responsibility for oversight, direction, coordination and integration of our corporate responsibility efforts while the individual business units provide the key drivers behind our activities, in a manner that best makes sense to each.
Please refer to the website for Investec’s full corporate citizenship statement.
At Investec we recognise that, while our shareholders remain at the forefront, our purpose ultimately is not only about driving profits. We strive to be a distinctive specialist bank and asset manager, demonstrating cast-iron integrity, moral strength and behaviour which promotes trust. Our core values include unselfishly contributing to society, valuing diversity and respecting others. Outstanding and empowered talent, entrepreneurial spirit and regard for the planet are other qualities that align with the culture of our organisation and our approach to responsible business.
Aris Prepoudis, CEO, RobecoSam: “I congratulate Investec whole heartedly for being included in The Sustainability Yearbook 2018. The companies included in the Yearbook are the world’s most sustainable companies in their industry and are moving the ESG needle in ways that will help us realise the UN’s Sustainable Development Goals by 2030”
Corporate responsibility

Co
rpo
rate go
vernance and co
rpo
rate respo
nsibility
(continued)
172 Investec integrated annual report 2018
Communication and stakeholder engagementBuilding trust and credibility among our stakeholders is vital to good business
The board recognises that effective communication is integral in building stakeholder value and is committed to providing meaningful, transparent, timely and accurate financial and non-financial information to primary stakeholders as defined below. The purpose is to help these stakeholders make meaningful assessments and informed investment decisions about the group.
We endeavour to present a balanced and understandable assessment of our position by addressing material matters of significant interest and concern.
We seek to highlight the key risks to which we consider ourselves exposed and our responses to minimise the impact of these risks.
Another objective is to show a balance between the positive and negative aspects of our activities in order to achieve a comprehensive and fair account of our performance.
As a requirement of our DLC structure, we comply with the disclosure obligations contained in the applicable listing rules of the UK Listing Authority (UKLA) the Johannesburg Stock Exchange (JSE) and other exchanges on which our shares are listed, and with any public disclosure obligations as required by the UK regulators and the South African Prudential Authority (previously known as the Banking Supervision Division of the South African Reserve Bank).
We also recognise that from time to time we may be required to adhere to public disclosure obligations in other countries where we have operations.
The Investor Relations division has a day-to-day responsibility for ensuring appropriate communication with stakeholders and, together with the Group Finance and Company Secretarial divisions, ensures that we meet our public disclosure obligations.
We have a board-approved policy statement in place to ensure that we comply with all relevant public disclosure obligations and uphold the board’s communication and disclosure philosophy.
We engage regularly with our stakeholders listed below:
Employees Investors and shareholders Clients Rating agencies
• Communication policy
• Quarterly magazine
• Staff updates hosted by executive management
• Group and subsidiary fact sheets
• Tailored internal investor relations training
• Induction training for new employees
• Annual general meeting
• Four investor presentations
• Stock exchange announcements
• Comprehensive investor relations website
• Shareholder roadshows and presentations
• Regular meetings with investor relations team and executive management
• Annual meeting with investor relations team and group company secretarial, the chairman of the board, senior independent director and chairman of the remuneration committee
• Regular email and telephone communication
• Annual and interim reports
• Four investor presentations
• Regular email and telephone communications
• Comprehensive investor relations website
• Regular meetings with executive management
• Tailored presentations
• Annual and interim reports
• Client relationship managers in each business
• Four investor presentations
• Regular email and telephone communications
• Comprehensive investor relations website
• Regular meetings with investor relations team, group risk management and executive management
• Tailored presentations
• Tailored rating agency booklet
• Annual and interim reports
Government and regulatory bodies Equity and debt analysts Media Suppliers
• Active participation in a number of policy forums
• Response and engagement with all relevant bodies on regulatory matters
• Industry consultative bodies
• Four investor presentations
• Stock exchange announcements
• Comprehensive investor relations website
• Regular meetings with investor relations and executive management
• Regular email and telephone communications
• Annual and interim reports
• Regular email and telephone communications
• Stock exchange announcements
• Comprehensive investor relations website
• Regular meetings with investor relations and executive management
• Centralised negotiation process
• Ad hoc procurement questionnaires requesting information on suppliers’ environmental, social and ethical policies
Corporate responsibility
(continued)
Co
rpo
rate go
vernance and co
rpo
rate respo
nsibility
173Investec integrated annual report 2018
Macro-economic environment and sustainable returnsIts been a difficult operating environment in both South Africa and the UK with the volatility expected to continue. We have been investing for long-term growth which may result in having to sacrifice some short-term returns. Hence, the focus has been on building resilience and creating franchise value that generates appropriate long-term returns.
We will continue to focus on the growth levers available to improve our returns, including growing our client base and core revenue drivers, leveraging off of our investment into the business, managing our liquidity and optimising our capital structure. We believe that our strategic priorities, together with the diversity of our business model that has been built over many years, will ensure the group is favourably positioned to grow in core markets, supporting future growth and delivering value to all our stakeholders.
SuccessionSuccession of the group’s existing founder leaders has been an ongoing agenda item for most stakeholders over the past few years. In February 2018 we announced our succession plan which was well received by most stakeholders. It is acknowledged and accepted that the next year will be a time of transition as the previous leaders hand over and the next generation take up the helm as the new leadership of the group.
Executive remunerationThe updated executive remuneration policy will need to be voted in at our annual general meeting in August 2018. We have engaged extensively with shareholders to ascertain and incorporate their views on executive remuneration. Where appropriate, we will be reducing the quantum of executive remuneration as well as simplifying the structure to ensure stronger alignment to strategy with relevant targets and measurements in place for monitoring.
Board governanceThere has been heightened scrutiny on board governance in general, particularly as corporate and audit firm scandals have increased over the past year. Investec has spent a significant time on board refreshment and composition, ensuring that the structure and shape of the board is appropriate.
Risk appetiteRating agencies, in particular, are questioning if our risk appetite framework is relevant and appropriate given the volatile macro-economic environment. They are
less concerned that profitability may be lower and more interested in how we are managing asset quality, liquidity and capital in an unpredictable macro environment. We regularly review our risk appetite framework and are comfortable that we have robust risk management processes and systems in place.
Cyber crimeThe financial services industry is a highly attractive target for cyber criminals and with increased digitalisation comes heightened vulnerability. Investec’s cyber resilience strategy is based upon a threat-driven approach to cyber security, rather than the contemporary compliance-driven approach. Regular targeted attack simulations by specialist companies, against the group as a whole, is used to measure and improve our cyber defences. We also employ world class security professionals and believe that people, operating within a risk conscious culture, and not just technology, are key to maintaining resilience against security threats.
Gender and diversityStakeholders have been interested to find out how Investec is looking at various diversity issues, including gender and reporting on the gender pay gap as required by UK Companies Act. Investec signed up to the 30% Club in both South Africa and the UK committing Investec Limited and Investec plc to a target of 30% females on the board by 2020. Investec Bank plc and Investec Wealth & Investment UK have also signed up to the HM Treasury Women in Finance Charter which sets targets and links executive remuneration to deliverables.
Investec Asset Management has signed up as a founder member of The Diversity Project in the UK.
We also published our first gender pay gap report.
Transformation in South AfricaStakeholders have been concerned about the challenges facing South Africa with very slow economic growth, rising political uncertainty, downgrades of sovereign debt and low business and consumer confidence. Investec welcomed the positive sentiment and message at the State of the Nation Address by President Cyril Ramaphosa in February 2018 to eradicate state capture, corruption and restore investor confidence and rule of law. Investec has been intimately involved in the CEO Initiative to, among other things, formulate the Youth Employment Service (YES) programme to address the unemployment issue among young people.
Investec remains committed to black economic empowerment and over time achieving the targets set out in the revised Financial Sector Code (FS Code).
ReputationState capture in South Africa and corporate and audit scandals have heightened the awareness around who we deal with and what process is taken to ‘on-board’ clients. A significant amount of time and resources have been spent on anti-money laundering (AML) training with 98% of South African, UK and Australian banking employees having passed with an average of above 80% during the past financial year.
New regulations We have received a number of questions with respect to the regulatory and accounting frameworks in which we operate. The board has focused on a number of new regulations, policies and practices including IFRS 9, Markets in Financial Instrument Directive (MiFid) II, General Data Protection Regulation (GDPR), King IV and the Advanced Internal Ratings Based (AIRB) and FIRB approach to capital.
Non-financial reportingThere is increased expectations around social impacts and in particular non-financial benchmarking and reporting. The Financial Stability Board’s Task Force on Climate-related Financial Disclosures (TCFD) recommendations relating to the disclosure of various financial exposures to climate risk are gaining momentum. We acknowledge the TCFD recommendations that were released during the past financial year and have embarked on a process to understand the relevance of potential climate scenario’s for our business and will incorporate these recommendations in the 2019 financial reporting cycle.
We have also seen increased interest in the role that the private sector will play in advancing the United Nations Sustainable Development Goals (SDGs). Investec is committed to participate and collaborate with clients, investors and public stakeholders to support the delivery of the SDGs. Through our core activities, we contribute to a number of specific SDGs and targets and have included the intersections, where relevant, throughout this report. In South Africa, we are participating in an industry-wide initiative with the Bankers Association of South Africa (BASA) to review and map our business activities, products and programmes against the SDGs to assess where Investec, currently has the greatest contribution and to determine the potential opportunities to collaborate as a sector for maximum impact.
Key topics and concerns raised by stakeholders
Corporate responsibility

Co
rpo
rate go
vernance and co
rpo
rate respo
nsibility
(continued)
174 Investec integrated annual report 2018
Corporate responsibility
Responsibility Reporting Assurance
The social and ethics committee is responsible for monitoring the non-financial elements.
Refer to pages 146 to 150 for further information.
The mandate of this committee is to assist the board in monitoring the group’s performance in terms of social, environment and governance indicators.
We also have employees in each of the major geographies in which we operate who drive our corporate responsibility objectives.
Feedback on relevant corporate responsibility issues is provided to board members at board meetings.
Our approach to corporate responsibility is documented throughout this integrated annual report with further detail available in a more extensive corporate responsibility report on our website.
Our approach to reporting has followed guidance from the King Code of Governance Principles for South Africa (King IV) and in accordance with the Global Reporting Initiative’s (GRI) Standards core sustainability reporting guidelines.
An index of these indicators together with our response to each of them can be found in our separate corporate responsibility report on our website.
Investec Internal Audit performed a limited review of the quantitative and qualitative corporate responsibility information disclosed in the 2018 corporate responsibility report on our website.
KPMG has provided a limited assurance review for the environmental KPIs. For a better understanding of the scope of KPMG’s assurance process, refer to the 2018 corporate responsibility report on our website.
Investec’s corporate responsibility encompasses three key areas of people, planet and profit, including our contribution to the six capitals and our commitment to the Sustainable Development Goals (SDGs).
Key for SDGs
SDG 3
Good health and well-being
SDG 4
Quality education
SDG 5
Gender equality
SDG 6
Clean water and sanitation
SDG 7
Affordable and clean energy
SDG 8
Decent work and economic growth
SDG 9
Industry, innovation and infrastructure
SDG 11
Sustainable cities and communities
SDG 13
Climate action
SDG 15
Life on land
SDG 16
Peace, justice and strong institutions
SDG 17
Partnerships for the goals
Creating sustained long-term wealth while contributing to society, macro-
economic stability and the environment

(continued)
Co
rpo
rate go
vernance and co
rpo
rate respo
nsibility
175Investec integrated annual report 2018
Corporate responsibility
Our people
At Investec we position our culture as a strategic differentiator. We prize our flat structure and meritocratic approach and uphold an environment that encourages self-starters to drive their careers in line with business objectives. We employ passionate and talented people who are empowered and able to perform extraordinarily.
Our people strategy is to …
… attract, retain, develop and motivate people who can perform extraordinarily
… retain and drive performance through appropriate aspirational remuneration and reward structures
… ensure that performance management is motivational and constructive
We invest significantly in a number of opportunities for developing and upskilling employees, and in leadership programmes to enable current and future leaders of the group.
We reward people meaningfully for performance and contribution.
Our culture of open and honest dialogue promotes immediate and direct performance-related feedback between the leader and his or her team, to help individuals identify and address their development needs.
Learning and development spend as a % of staff costs is 1.9% for the group (target of >1.5% for the group)
5% of Investec shares are held by staff (excluding directors’ holdings) Voluntary staff turnover rate:
• South Africa: 8.8%• UK: 8.4%
All employees engage in some type of formal or informal performance discussion every year
Working at Investec
The policies and business practices of Investec are outlined in Becoming Acquainted with Investec (and regional equivalents) and in the compliance handbook (which are easily accessible to employees in all of Investec’s locations).These are intended to guide conduct and ensure our actions and attitudes reflect the group’s values and philosophies at all times.
Human rightsWe remain committed to the 10 principles of the United Nations (UN) Global Compact and support the international agenda to abolish human trafficking, slavery, forced and child labour including the legislated UK Modern Slavery Act 2015.
10 principles of the United Nations (UN) Global Compact
Freedom of associationWe fully support employees’ rights to freedom of association.
Zero trade unions
Whistle-blowing policy and protected disclosuresWe require employees to conduct all internal and external dealings with integrity, consistently and uncompromisingly displaying moral strength and behaviour which promotes trust.
Integrity and confidentiality are critical to our reputation and sustainability
Employee wellnessInvestec values the physical, financial and psychological health, welfare and safety of our people. We provide employees with bespoke employee assistance and wellness programmes.
72% employees in South Africa participated in one or more employee wellness initiatives (2017: 66%)

Co
rpo
rate go
vernance and co
rpo
rate respo
nsibility
(continued)
176 Investec integrated annual report 2018
Corporate responsibility
Learning and development
We invest significantly in a number of opportunities for the development and upskilling of our employees, and in leadership programmes to enable current and future leaders of the group.
External learningInvestec’s external learning includes public programmes, conferences, seminars and courses which provides employees with development opportunities to enable the acquisition of knowledge and skills necessary for career development within Investec.
Investec’s educational bursary scheme provides employees with focused educational opportunities to further their qualifications.
9.7% of full time South African employees granted bursaries in the last year (2017: 9.2%)
Internal learningThis includes general staff induction, bespoke induction for new learners, personal and interpersonal skills, technical and professional skills, leadership programmes, mentoring and coaching as well as our learnerships and chartered accountant (CA) trainee programmes.
21 qualified CAs completed the CA programme in the past year and all were retained in the business (239 graduated since inception)
Promoting equity and diversity in the workplace
A diverse workforce is essential to our ability to be an innovative organisation that is able to adapt and prosper in a fast changing world.
The group’s approach is to recruit and promote on the basis of aptitude and attitude, with the deliberate intent to build a diverse workforce and promote an inclusive workplace, appropriately and fully representative of the jurisdiction’s population. We endeavour to prevent and/or eliminate any form of discrimination based on gender, race, ethnicity, religion, age, disability, nationality and sexual preference. People with disabilities are an essential part of a diverse talent pool and are always considered, with every effort made to accommodate and facilitate an accessible environment. In the event of employees becoming disabled while in our employ, we are committed to ensuring their continued employment. We have various processes to encourage debate and dialogue around valuing diversity and difference. Emerging and established leaders are invited to participate in discussions with the executive leadership around all issues related to talent management and diversity. There have been three alleged incidents of discrimination reported in the past financial year, two of which have been reviewed through the appropriate internal grievance procedure and were subsequently dismissed by an independent chairman. The third alleged incident is under investigation at the time of writing this report.
Our diversity principles While we have actively tried to increase the diversity of our senior leadership, we recognise that across our organisation we have more work to do. That is why we have put together our own set of diversity principles to help define the framework for that journey.
• We believe in the importance and benefits of diversity and foster a culture that is supportive and inclusive of different perspectives and experiences
• As a global specialist bank and asset manager, diversity ensures that we represent the diversity of our global client base
• Our commitment to diversity is fundamentally about ‘doing the right thing’
• We are progressing towards a working environment that is more agile and responsive to the needs of all individuals, with flexible work arrangements encouraged where appropriate
• In terms of diversity, we commit to equal compensation on a like-for-like basis
• We will work proactively to rebalance our organisation in line with the societies in which we operate by empowering communities through entrepreneurship and education, and leveraging the value in our diversity
• We will measure and track progress annually
• We will work towards achieving our targets through concrete actions (refer to pages 239 and 240)
Refer to pages 238 to 240 for more details on our gender pay gap analysis.
49% female employees
20% females on our board Investec is a member of the 30% club in both the UK and South Africa committing to a goal of 30% women on the board and has made good progress towards the target of 33% female representation by 2020, per the Hampton-Alexander Review
Investec Bank plc and Investec Wealth & Investment UK have signed up to the UK HM Treasury Woman in Finance Charter
Investec Asset Management has signed up as a founder member of
The Diversity Project in the UK

(continued)
Co
rpo
rate go
vernance and co
rpo
rate respo
nsibility
177Investec integrated annual report 2018
Corporate responsibility
Transformation in South AfricaIn South Africa, Investec remains committed to black economic empowerment.
Our approach involves: • using our entrepreneurial expertise to foster the creation of new black entrepreneurial
platforms
• serving as a leading source of empowerment financing
• investing significantly in learning and development opportunities for both our employees as well as other South Africans
• encouraging internal transformation by bringing about greater representivity in our workplace
• continually striving to achieve greater representation at all levels of the business through the effective implementation of our employment equity plan.
YES initiativeThrough the CEO Initiative in South Africa, the Youth Employment Service (YES) programme, in partnership with a number of corporates, government and SMEs, has committed to finding employment opportunities for unemployed youth via paid internships. Investec CEO, Stephen Koseff, is a co-convenor of this initiative.
This initiative was launched in March 2018 and the first 20 youth were employed by Investec in partnership with the Sabi Sands Pfunanani Trust from 1 April 2018. Investec has committed to finding employment for approximately 1 200 youth annually for the next three years.
Khulasande Capital Partnership IIKhulasande Capital Partnership II was launched during the year as a partnership between Investec Limited and the Entrepreneurship Development Trust (EDT). Khulasande Capital is a black-owned and controlled private equity and investment vehicle that contributes to the broad-based South African society and economy. EDT is a charitable trust with black beneficiaries focusing on the development of the South African economy through educational and entrepreneurial activities.
Izandla Property FundThe Izandla Property Fund was launched in June 2017. Izandla Property is a majority black owned property company supported by Investec Property and Investec Property Fund. It aims to create value to fund the initiatives of the EDT, their majority shareholder, which is a broad-based charitable trust that focuses on educational and entrepreneurial initiatives, by accessing quality real estate assets and providing our property clients with a B-BBEE partner who will own, manage and develop their property assets. Investec Property will support Izandla Property with the skills, expertise and knowledge while Investec Property Fund will serve as the capital partner of Izandla Property.
Highlights for the year
• The appointment of Fani Titi as Joint CEO of Investec from 1 October 2018
• Investec will be rated under the revised Financial Sector Code (FS Code) for the first time in 2018
• Investec was one of the first signatories to the Youth Employment Service (YES) initiative
• R5 million initial capital allocated to set up the Promaths Bursary Fund in 2017 and a further R3 million allocated in the past financial year
• Khulasande Capital Partnership II was launched during the year
• Launched Izandla Property Fund
Although we are not driven by awards and recognition, we are proud to be recognised for our efforts.
• Voted second most attractive employer by professionals and fourth by students in South Africa in the 2017 Universum Awards
• Investec CEO, Stephen Koseff won the Lifetime Achievement Award presented by the 2018 African Banker Awards

Co
rpo
rate go
vernance and co
rpo
rate respo
nsibility
(continued)
178 Investec integrated annual report 2018
Our communities
Our Corporate Social Investment (CSI) endeavours are central to the group’s values of making an unselfish contribution to society, nurturing an entrepreneurial spirit, valuing diversity and respecting others, and underpin Investec’s aim of being a responsible corporate citizen. Our approach to CSI focuses on education, entrepreneurship and the environment. We believe this aligns with our purpose and is the most effective way to create opportunities for employment, wealth creation and stimulating socio-economic growth.
In keeping with our business model of independent, highly autonomous business units, supported by a strong centre, there is no single overriding approach to social investment within the group, although clear commonalities exist. Each of the regions has pursued social investment as deemed appropriate to their circumstances and where they are in the evolution of their business.
Wherever possible, we seek to collaborate with partners, so as to leverage resources and expertise and help ensure a lasting impact as well as long-term sustainability for our projects.
The active involvement of our people, through volunteering, remains at the core of our social investment strategy. We have many well-established
partnerships and volunteering initiatives to support these partners. Further, we make donations to charities in response to requests for assistance across all regions and business areas within the group. This allows us to allocate meaningful grants in areas which might not fall within our main focus areas.
Investec’s purpose is to create
and manage wealth
Shared valuefor all
stakeholders
Creating wealth requires a thriving
economy with active economic
participants
To become economically active, people need to be
educated and skilled
Educated and skilled people are able to get employment or create
their own business employing others (entrepreneurship)
Professionals and entrepreneurs become our clients or staff and partner
with us to create wealth
2018201720162015
Percentage
0
0.5
1.0
1.5
2.0
1.1 1.1 1.1 1.0
1.4
0.9 0.91.2
1.3
0.91.2
1.0
CSI spend as a % of operating pro�t*
Investec Limited Investec plc Investec group
* Before goodwill, acquired intangibles, non-operating items, taxation and after other non-controlling interests.
We target a minimum of 1.0% group CSI spend as a % of operating profit*
Corporate responsibility

(continued)
Co
rpo
rate go
vernance and co
rpo
rate respo
nsibility
179Investec integrated annual report 2018
High school Tertiary Workplace
• Promaths• High school bursaries
• Student bursaries• Teacher development
• Work readiness• Mentorship
EducationOur strategy in South Africa focuses on the support and empowerment of talented individuals within a defined continuum of interactions through school and university to the workplace.
EntrepreneurshipInvestec encourages the growth of young South African entrepreneurs. We support the Junior Achievement South Africa (JASA) 23 week long entrepreneurship academy programme for grade 11 learners. We also run a programme for young entrepreneurs to gain global exposure, network and support.
In the UK we partner with the Bromley by Bow Centre which focuses on economic regeneration in the London Borough of Tower Hamlets. In 2011 we became the sole funder of the centre’s Beyond Business programme.
Investec’s Liverpool office supports Young Enterprise, one of the UK’s leading enterprise and financial education charities, since 2014.
EnvironmentIn South Africa, we have two conservation programmes that focus on educating communities about conservation and the value of wildlife.
In the UK we support Trees for Cities, a charity which engages local communities and schools to plant trees, shrubs and to grow food, reconnecting urban areas with nature.
Our strategy in the UK focuses on partnerships with the following enterprises:
• Arrival Education
• La Mare De Carteret Primary School
• Morpeth Secondary School
• Marino College
Highlights for the year
81% of South Africa’s CSI spend was allocated to education
Promaths contributed 4.8% and 5.0% of South Africa’s mathematics and science distinctions respectively
R5 million initial capital allocated to set up the Promaths Bursary Fund in 2017 and a further R3 million allocated in the past financial year
20 learners (in Year 9) on the Morpeth Young Apprentice programme
Highlights for the year
55 entrepreneurs given global exposure through four sector specific trips abroad
Bromley by Bow: 86% of launched enterprises continue to trade beyond their third year
Highlights for the year
51% increase in number of children reached through our Coaching for Conservation programme (approximately 12 000 reached since 2012)
Five of our UK offices have volunteered with Trees for Cities, helping to deliver 14 urban community greening projects
Corporate responsibility

Co
rpo
rate go
vernance and co
rpo
rate respo
nsibility
(continued)
180 Investec integrated annual report 2018
VolunteeringThrough our staff volunteerism programme we support and encourage staff participation and engagement as we believe that far more can be achieved through our collective knowledge, expertise and influence than through cash donations alone. Our people play a pivotal role in our corporate social investment programmes giving selflessly of their time, money, goods and skills to support our communities.
>9 000 hours spent on volunteering (2017: >7 400 hours)
South Africa >4 700 hours (2017: >3 400 hours)
UK >4 400 hours (2017: >4 000 hours)
Although we are not driven by awards and recognition, we are proud to be recognised for our efforts.
• Winner of the Business of the Year award by Business Charity Awards 2017 (for Beyond Business)
• Winner of the Community Impact Award 2017 for our flagship programme the Beyond Business social enterprise incubator we run in partnership with Bromley by Bow Centre
• Winner of the National CSR Awards 2017, in the individual Community (Legacy)category Project Award (for Beyond Business)
• Winner of the Community Partners award in the Lord Mayor’s Dragon Awards 2017
• Reaccredited winner (for Beyond Business) in the Responsible Business Awards 2017
• Received the Financial Innovation Awards 2017 – Innovation in Sustainability or Social Responsibility Awards for our Invest for Success programme that we run in partnership with Arrival Education
• The coordinator of the Investec Coaching for Conservation kids programme at Good Work Foundation won a silver in the Eco-Logic awards in the category ‘Eco-Youth’
Corporate responsibility

(continued)
Co
rpo
rate go
vernance and co
rpo
rate respo
nsibility
181Investec integrated annual report 2018
1513 14 181716
Emissions per average employee for the group
7.318.03
8.44 8.20
6.237.05
0
2
4
6
8
10
1513 14 181716
Emissions per m2 of�ce space for the group
0
0.1
0.2
0.3
0.4
0.5
0.360.39
0.43 0.41
0.360.39
Year Year
Tonnes of CO2 Tonnes of CO2
Our planet
Investec’s environmental policy takes into account the challenges that climate change presents to the global economy and we consider any meaningful activity that either reduces the negative impact on, or prolongs the life of, our planet. We believe that as a niched specialised financial services organisation, and given our position in the developed and emerging worlds, we can make a meaningful impact in addressing climate change.
Direct operational impactIn recognising that we have a responsibility to understand and manage our wider carbon footprint, our approach is focused on limiting our direct operational impact and creating awareness to encourage positive sustainable behaviour. Acknowledging that we cannot continue consuming natural resources at the current rate, we are focusing on ways to ensure the security of natural resources in all our operations.
The key focus areas to reduce our carbon footprint include:
• reducing energy consumption
• reducing overall waste
• reducing water usage
• increasing waste recycling rates
• promoting sustainable travel
• promoting sustainable procurement.
Highlights for the year
• Group carbon emissions reduced by 6.1% (2017: 7.9%)
• Collaborated with the Entrepreneurship Development Trust and Innovation Africa to bring water to rural South Africa
Investec’s response to the Cape Town Day Zero water crisis:
• R2.5 million spent on water initiatives to ensure continuity of business
• Donated R400 000 for boreholes in the Khayelitsha community in the Cape
• Staff donated 105 250 litres of water from offices around South Africa to 152 identified care homes in the Cape to assist the disabled, mentally disabled and those with health risks
Although we are not driven by awards and recognition, we are proud to be recognised for our efforts.
• Investec group was awarded a B for the Carbon Disclosure Project (CDP) climate scoring
• Investec’s Energy Management System that covers 23 of our physical buildings in the UK, Ireland and Channel Islands was certified to the international energy standard ISO 50001
• Our UK head office, Environment Management System retained the international environment standard ISO 14001
• Our UK head office, won the top prize – the Chairman’s Cup for its waste management processes in the Corporation of London’s Clean City Award Scheme for 2017
Breakdown of group emissionsOver the past six years our intensity indicators have remained relatively constant. In 2015 we enhanced our data collection processes to cover a broader scope of our operations. Since then, in South Africa and the UK we have reduced our electricity consumption as a result of electricity reduction initiatives, even though our headcount increased. Travel emissions reduced due to a change in the emission factors and through continuous collaboration through video conferencing and effective leveraging of international teams.
Corporate responsibility

Co
rpo
rate go
vernance and co
rpo
rate respo
nsibility
(continued)
182 Investec integrated annual report 2018
Carbon footprint for the group
Assessment parameters
Consolidation approach: Operational control
Emission factor data source: DEFRA (2017), IEA and Eskom (for South African electricity)
Intensity ratio: Emissions per average employee
Emissions per office space m2
Independent assurance: Limited assurance provided by KPMG for the year ending 31 March 2017 and 31 March 2018
31 March 2018 31 March 2017
Units
Tonnes of CO2
equivalent
Consumptionin unit ofmeasure
Tonnes of CO2
equivalent
Consumptionin unit ofmeasure
Variance intonnes of CO2
equivalent Notes
Scope 1 2 168 1 710 26.8%
Energy Natural gas kWh 462 2 508 683 431 2 341 511 7.2%
LPG stationary L 24 16 055 36 23 978 (33.3%)
CO2 purchased kg 1 567 – 452 100.0%
Diesel L 44 17 113 268 102 395 (83.6%) 1
Refrigerant Refrigerant kg 1 433 884 766 404 87.1% 2
Employee travel Vehicle fleet km 204 1 100 363 209 1 092 169 (2.4%)
Scope 2 32 394 42 096 188 35 192 43 407 612 (8.0%)
Energy Electricity consumption kWh 32 394 42 096 188 35 192 43 407 612 (8.0%) 3
Scope 3 26 018 27 604 (5.7%)
Paper Paper consumption t 404 411 499 506 (19.0%)
Waste General waste t 18 53 15 47 20.0%
Employee travel Rail travel km 71 1 624 080 128 2 675 459 (44.5%)
Road business travel km 216 1 184 132 248 1 325 898 (12.9%)
Taxi km 36 217 033 32 175 321 12.5%
Commercial airlines km 25 273 83 234 230 26 682 75 891 968 (5.3%) 4
Total emissions 60 580 64 506 (6.1%)
No scope
Water Water consumption kl 108 108 115 372
Recycled waste Recycled waste t 869 794
Intensity
Emissions per average employee 6.23* 7.05*
Emissions per m² office space 0.36 0.39
Water consumption per average employee 11.11 12.60
1. Diesel consumption reduced significantly as less power outages were experienced.2. Refrigerant consumption in South Africa increased due to milk fridge’s installed in the pause areas thereby stopping 6 300 plastic milk bottles from going to
landfill every month.3. Energy consumption declined as a result of electricity reduction initiatives, despite a headcount increase.4. Travel emissions reduced due to a change in the emission factors and through continuous collaboration through video conferencing and effective leveraging
of international teams.* Includes permanent and temporary employees
For more information refer to our 2018 corporate responsibility report on our website.
Corporate responsibility

(continued)
Co
rpo
rate go
vernance and co
rpo
rate respo
nsibility
183Investec integrated annual report 2018
Green business impact
Investec has a holistic approach to environmental sustainability which is not limited to our daily operational activities. We recognise the opportunities that the Sustainable Development Goals (SDGs) holds and are evaluating key focused SDGs within our various core capabilities to have a long-term sustainable environmental contribution.
Our green business impact recognises the opportunities for our clients and businesses in cleaner and renewable energy sources, energy efficiency, protecting natural resources, responsible lending and investing and responsible property management.
Investec recognises the risks of climate change and is committed to support the transition to a clean and energy-efficient global economy. We believe that the widest and most positive influence Investec can have is to support our clients and stakeholders as they move as quickly and smoothly as possible towards a low-carbon economy.
An important aspect of our approach is a deliberate focus on financing infrastructure solutions that promote renewable energy and we have developed a strong expertise in this sector. In the US, Investec is recognised as the go-to funding source in the roof-top solar industry.
Investec has also provided capital investment to Engenie, a London-based company specialising in electric vehicle rapid charging, which will allow Engenie to reach its network target of 1 500 rapid chargers across the UK. This is an indication of how we are contributing to Sustainable Development Goal 11 (Sustainable Cities) and will significantly improve the pollution problem in the city of London.
Refer to our corporate responsibility report on our website for details on how our businesses are contributing to our environment.
Highlights for the year
• 88% of our energy lending portfolio is clean energy (which also features biomass, wind, waste, solar and hydro projects)
• Participated in £1.2 billion of renewable energy projects around the world
• Eight Investec funded projects have an installed capacity of approximately 1 450MW of clean energy
• Investec Property Fund implemented two rooftop solar projects for two malls in South Africa reducing both the cost of electricity and the demand from the country grid
• Trained 195 frontline staff on environmental, social and governance practices in South Africa and the UK
Protecting our environment
Investec recognises that a clean, resource-rich natural environment supports the growth of business and the economy and is vital for healthy communities.
Given Investec’s African heritage, we are passionate about ensuring the continued existence of a number of African species. We fund a number of biodiversity projects which help to ensure the sustainable existence of South Africa’s rich wildlife:
• Investec Rhino Lifeline was established in 2012 to respond to the rhino poaching crisis
• Support of BirdLife South Africa’s research of the environmental impact of renewable energy on the local birdlife in South Africa
• Support of the Endangered Wildlife Trust’s (EWT) Carnivore Conservation Programme and its research and monitoring of critically endangered African wild dogs in the Northern Kruger National Park (KNP)
• Sponsorship by Investec Asset Management of the Tusk Conservation Awards for the past six years
Highlights for the year
• 51% increase in number of children reached through our Coaching for Conservation programme (12 000 reached since inception in 2013)
• Supported the rescue of 70 rhino since 2012
• Renewed our EWT wild dog sponsorship with wild dog populations in the KNP increasing 46% since 2012 (Investec supported since 2013)
Corporate responsibility

Remunerationreport

Remuneration report
Rem
uneration rep
ort
185Investec integrated annual report 2018
Statement by the outgoing and incoming chairs of the remuneration committeeOn behalf of the board remuneration committee (the committee) we are pleased to present the report on directors’ remuneration for the 2018 financial year. This report was compiled on behalf of the board remuneration committee and approved by the board.
Remuneration philosophy remains unchangedOur overarching remuneration philosophy has remained unchanged from prior years. We continue to maintain focus on employing and retaining the highest calibre individuals through the payment of industry competitive packages and long-term share awards, which ensure alignment with key stakeholders in our business.
Our incentive rewards continue to be distributed from pools of realised earnings generated in excess of targeted thresholds which reflect usage of risk-adjusted capital. This economic value-added model has been in operation for about 19 years and ensures that risk and capital management
form the basis for key processes at both a group and transaction level thus balancing the rewards between all stakeholders.
We recognise that financial institutions have to distribute the return from their enterprises between the suppliers of capital and labour and the societies in which they do business, the latter through taxation and corporate social responsibility activities. Our group wide remuneration philosophy seeks to maintain an appropriate balance between the interests of these stakeholders, and is closely aligned to our culture and values which include risk consciousness, meritocracy, material employee ownership and an unselfish contribution to colleagues, clients and society.
Diversity and inclusion, including gender pay gap reportingAt Investec we are committed to attracting and retaining a diverse team of people. A diverse workforce is essential to our ability to be an innovative organisation that is able to adapt and prosper in a fast changing world. We recognise the benefits of a diverse workforce being able to contribute alternative perspectives and challenge the status quo, which is integral to the Investec culture.
Gender pay gap legislation was introduced in the UK to encourage employers to make greater advances in addressing the disparity of earnings between men and women over their careers. The gender pay gap measures the difference between the average amounts men and women are paid across all of our employee categories. This is different from Equal Pay legislation in the UK which requires individuals to be paid equally for performing work of equal value. We would like to make clear that we give men and women equal pay for the same roles and have appropriate practices in place to ensure fairness, which are regularly reviewed by the committee.
We report on our gender pay gap on page 238. We are confident that across our organisation men and women are paid equally for doing the same job. Our gender pay gap occurs primarily because there is a lower proportion of women in senior leadership and revenue-generating roles which attract higher market levels of pay. We are dedicated to improving our position in line with our commitment to promote diversity. We know that while we have worked to address greater representation of women, we have more to do. We have measures in place to improve this and we are committed to advancement and holding ourselves publicly accountable.
Group performance metrics
Year ended 31 March
2018
Year ended 31 March
2017 % change
Adjusted earnings attributable to shareholders before goodwill, acquired intangibles, non-operating items and after non-controlling interests £491.1 million £434.5 million 13.0%
Adjusted earnings per share 53.2 pence 48.3 pence 10.1%
Dividends per share 24.0 pence 23.0 pence 4.3%
Return on equity 12.1% 12.5%
Annuity income as a % of total operating income 76.2% 72.0%
Return on average risk-weighted assets 1.45% 1.45%
Operating margin of the combined asset management and wealth and investment businesses 29.3% 30.1%
Total capital adequacy ratio, Investec plc 15.4% 15.1%
Total capital adequacy ratio, Investec Limited 14.6% 14.1%
Common equity tier 1 capital ratio, Investec plc 11.0% 11.3%
Common equity tier 1 capital ratio, Investec Limited 10.2% 9.9%
Leverage ratio, Investec plc 8.5% 7.8%
Leverage ratio, Investec Limited 7.5% 7.3%
Liquidity coverage ratio, Investec plc 306.0% 654.0%
Liquidity coverage ratio, Investec Limited 132.8% 136.5%
Net stable funding ratio, Investec plc 142.0% not disclosed
Net stable funding ratio, Investec Limited 109.3% not disclosed
Total shareholder return, Investec plc (Pounds Sterling) 5.4% 10.9%
Total shareholder return, Investec Limited (Rands) 4.7% (12.5%)
Variable remuneration pool £418 million £390 million 7.3%

(continued)
Remuneration report
Rem
uneration rep
ort
186 Investec integrated annual report 2018
Business context and outcomes for the year under reviewThe executive directors’ remuneration policy was approved at the 2015 annual general meeting. The policy remained in place and was applied for the 2018 financial year.
The committee continues to place great importance on ensuring that there is clear alignment between remuneration and delivery of the group’s key strategic objectives.
During the 2018 financial year the group achieved satisfactory operating performance against a challenging economic backdrop in its two core geographies.
The group’s performance against key metrics is shown in the table on the previous page.
In terms of the executive short-term incentive plan as approved by shareholders and reflected on pages 201 to 202, the remuneration committee approved an annual bonus of £2.023 million each for Stephen Koseff and Bernard Kantor, and £1.759 million for Glynn Burger. Stephen Koseff, Bernard Kantor and Glynn Burger receive 30% of their bonus in cash, 30% in shares upfront, with the balance deferred in shares. Malus and clawback arrangements apply to these awards.
Hendrik du Toit was awarded a bonus of £5.637 million, determined solely in relation to the performance of Investec Asset Management as set out on page 204. Hendrik du Toit invested approximately 20% of his bonus in Investec plc shares, to be held for three years.
The board agreed to recommend an inflationary increase in fees for the forthcoming year for the non-executive directors, with market linked adjustments for the chair and members of the audit committee.
Looking forward: our revised remuneration philosophyInvestec’s existing remuneration policy was last voted on by shareholders in 2015 and we are submitting a revised remuneration policy for approval by shareholders at the annual general meeting on 8 August 2018, as required by regulations. In summary, our proposed remuneration policy:
• Incorporates certain amendments which are intended to address the feedback previously received from shareholders
• Incorporates required regulatory changes
• Given the management succession announced in February 2018, it focuses on our remuneration arrangements within the year of transition.
The group’s succession plan has focused on ensuring a smooth transition from the “founders” (current CEO, managing director and group risk and finance director) of Investec to the next generation of leadership. The need to ensure a steady handover of knowledge and experience of our “founders” was considered critical in this succession plan. This has resulted in a phased transition “handover” time line from 1 April 2018 to 31 March 2019.
The board has ensured clear accountability of roles during this period. There is however, a focus on shared (and appropriate) accountability for the performance of the group during the transition period which is linked to remuneration to reflect this accountability.
The Joint CEO appointment is appropriate for our group structure and positioning and was a logical development for Investec. We operate under a dual listed companies structure with listings on the LSE and JSE, large businesses in both South Africa and the UK covering three businesses
(comprising banking, asset management and wealth management) with different regulatory environments.
Furthermore, the group will split the risk director and finance director role into two roles as requested by the regulators, with effect from 1 April 2019.
Further information on the group’s succession is provided on page 121.
The remuneration committee has considered all these matters in proposing its new remuneration policy whilst at the same time ensuring that total executive remuneration is not increased during this transition period.
The committee believes that the proposals it has included in its proposed remuneration policy address a number of matters previously raised by shareholders, notably:
1. Reduction in total compensation levels for executive directors:
• An approximate 30% reduction in total compensation levels is achieved using the proposed new fixed pay and short and long-term measures and metrics applied to 31 March 2018 performance.
2. Better alignment between pay awards and the performance of Investec:
• We are making changes to the short-term incentive measures and implementing tougher performance levels
• Financial measures performance weightings have been increased to 80% of the total in the determination of the short-term incentive
• In the long-term incentive tougher performance levels have been introduced for certain measures
• The remuneration committee will review the performance measures on an annual basis.
(continued)
Remuneration report
Rem
uneration rep
ort
187Investec integrated annual report 2018
3. Simplification in pay structures and the assessment of executive director performance:
• We are replacing the role based allowances for new executive directors with a single fixed pay award of cash and shares
• The short-term measures have been simplified and reduced from nine to six.
4. Treatment of unvested long-term incentive plan awards for departing executive directors:
• The departing CEO, managing director and group risk and finance director will have their unvested long-term incentive awards pro-rated to reflect their period of service relative to the performance periods of such awards
• The new policy will clarify that unvested long-term incentive awards will be pro-rated going forward.
Perry Crosthwaite Philip HourquebieChairman, DLC remuneration committee Chairman, DLC remuneration committee (to 31 March 2018) (from 1 April 2018)
12 June 2018 12 June 2018
We have engaged our largest shareholders and shareholder representative organisations to ensure that their views were taken into consideration in the determination of our proposed remuneration policy.
Whilst the committee proposes that the new remuneration policy remains in place for three years, the committee will keep the policy under review and assess its appropriateness, particularly in light of the executive management transition process.
We are seeking shareholder approval at the 2018 annual general meeting for:
• Our directors’ remuneration report for the year ended 31 March 2018 (pages 192 to 217)
• Our directors’ remuneration policy, commencing 1 April 2018 (pages 218 to 231)
• Our non-executive directors’ remuneration (pages 203 and 208)
Signed on behalf of the board

(continued)
Remuneration report
Rem
uneration rep
ort
188 Investec integrated annual report 2018
At a glanceSummary of key changes for Investec’s proposed remuneration policyThe new policy:
• incorporates certain amendments which are intended to address the feedback previously received from shareholders, and regulatory changes; and
• focuses on our remuneration arrangements within the year of transition given the management succession currently underway.
Reduction in total compensation levels for executive directors
• An approximate 30% reduction in total compensation levels (if the proposed new fixed pay and short- and long-term measures and metrics were applied to 31 March 2018 performance, see page 229)
Better alignment between pay awards and the performance of Investec
• Changes to short-term incentive measures and tougher performance levels that are expected to see a reduction in the short-term incentive on like-for-like historic performance
• Financial measures performance weighting increased to 80% of the total in the determination of the short-term incentive
• In the long-term incentive tougher performance levels introduced for certain measures
• Annual review of “achievement levels” to determine rewards at target, threshold and stretch performance
Simplification in pay structures and the assessment of executive director performance
• Replacement of fixed allowances for new executive directors with a single fixed pay award of cash and shares
• Short-term incentive financial measures for annual bonus awards reduced from five to three and non-financial measures simplified
Treatment of unvested long-term incentive awards for departing executive directors
• Unvested long-term incentive awards of the “founder” executive directors will be pro-rated to reflect their period of service, relative to the performance period of the award
• The new policy will clarify that unvested long-term incentive awards will be pro-rated going forward

(continued)
Remuneration report
Rem
uneration rep
ort
189Investec integrated annual report 2018
Navigating this reportTo help shareholders navigate the remuneration report, a brief summary of key content is set out below.
Where to find details of the key remuneration information Page/s
Compliance and governance statement 189
A summary of the remuneration decisions made during the year ended 31 March 2018 190
Annual report on directors’ remuneration 192
Statement of implementation of remuneration policy for the year ending 31 March 2019 193
Remuneration proposals for the new executive directors 194
Non-executive directors 203
Executive directors’ single total figure of remuneration (audited) 204
Executive short-term incentives – achievement of performance targets 205
Non-executive directors’ single total figure of remuneration (audited) 208
Directors’ shareholdings, options and long-term incentive awards (audited) 209
Shareholder dilution 214
Total shareholder return performance graph 215
CEO remuneration table and percentage change in CEO remuneration 216
Ratio of CEO remuneration to average remuneration of employees and relative importance of spend on remuneration 216
Statement of voting at 2017 annual general meeting 217
Additional remuneration disclosures (unaudited) 217
Directors’ remuneration policy for the year ending 31 March 2019 and subsequent years 218
Benchmarks 219
Impact of CRD IV on executive directors’ remuneration arrangements 219
Executive directors’ remuneration policy table 220
Remuneration table for incoming executive directors 223
How will executive directors’ performances be assessed? 226
Differences between the remuneration policy of the executive directors and the policy for all employees 226
Policy for the recruitment of new executive directors 226
Service contracts and terms of employment 227
Illustrative scenarios for executive remuneration 228
Proposed remuneration payout profile for Joint CEOs 229
Comparison of overall executive directors' compensation costs 229
Remuneration policy for non-executive directors 230
Shareholder and employee views 231
Diversity and inclusion, including gender pay gap reporting 238
Additional remuneration disclosures (unaudited) 241
Remuneration Code and Pillar III disclosures 241
Pillar III remuneration disclosures 243
2014 and Pillar III remuneration disclosure requirements.
The remuneration report comprises the annual statement from the committee chair, the directors’ remuneration policy that sets out our remuneration policy for the three years beginning 1 April 2018 and the differences between the future policy and the policy operated in the 2018 financial year and the annual report on remuneration that explains how the policy has been implemented in the 2018 financial year. The report also contains Pillar III disclosures as mandated by the UK’s PRA and the South African Prudential Authority (previously known as the Banking Supervision Division of the South African Reserve Bank), and a section covering gender pay gap reporting.
Executive directorsThe current executive directors whose remuneration is disclosed in this report are referred to as follows:
• Stephen Koseff – chief executive officer (CEO)
• Bernard Kantor – managing director (MD)
• Glynn Burger – group risk and finance director (GRFD)
• Hendrik du Toit – chief executive officer of Investec Asset Management (CEO of IAM).
Compliance and governance statementThe remuneration report complies with the provisions of Schedule 8 of the Large and Medium-sized Companies and Groups (Accounts and Reports) (Amendment) Regulations 2013, the UK Corporate Governance Code, the UK Companies Act 2006, the Rules of the UK Listing Authority, the UK Financial Conduct Authority rules, the PRA and FCA Remuneration Code, the South African King IV Code of Corporate Practice and Conduct, the South African Companies Act 2008, the JSE Limited Listings Requirements, the South African Notice on the Governance and Risk Management Framework for Insurers,

(continued)
Remuneration report
Rem
uneration rep
ort
190 Investec integrated annual report 2018
A summary of the remuneration decisions made during the year ended 31 March 2018Remuneration philosophyOur philosophy, which remains unchanged from prior years, is to:
• Employ the highest calibre individuals who are characterised by integrity, intellect and innovation and who adhere and subscribe to our culture, values and philosophies
• Strive to inspire entrepreneurship by providing a working environment that stimulates extraordinary performance, so that executive directors and employees may be positive contributors to our clients, communities and the group
• Provide staff share ownership through participation in our employee share schemes to align interests with those of our owners
• Continue to acknowledge the importance of the appropriate division of the returns generated by our business between our owners, our workforce and the societies in which we operate.
In summary, we estimate our total economic return has been divided between government through taxation, owners through dividends, communities through donations and investment and employees through total compensation as follows:
Percentage
41.8
29.0
13.8 15.0
0.4
Employees Government Shareholders Retention Communities
0
10
20
30
40
50
2018
Value add contribution
2017
The total cost of compensation is managed through staff compensation ratios which are reviewed regularly. The total staff compensation ratios are as follows:
Staff compensation ratios
Year ended 31 March
2018
Year ended 31 March
2017
Total for the group 47.5% 46.1%
Asset Management 46.3% 46.8%
Wealth & Investment 53.7% 54.0%
Specialist Banking 45.1% 43.9%
Outcomes for executive directors during the yearThe following table summarises awards made to executive directors for the year. A further breakdown of these awards can be found on page 204.
Total cash benefits, salary,
non-deferred bonus
Total deferred bonus*
Fixed allowance payable in
shares subject to retention^
Total remuneration not subject
to future performance conditions
Value of LTIPs awarded – not
vested and still subject to performance conditions^^
Value of LTIPs that
will be forfeited**
Total remuneration awarded in
current period***
£’00031 March
201831 March
201731 March
201831 March
201731 March
201831 March
201731 March
201831 March
201731 March
201831 March
201731 March
201831 March
201831 March
2017
CEO 1 694 1 639 809 773 1 000 1 000 3 503 3 412 1 480 1 480 (1 480) 3 503 4 892
MD 1 694 1 639 809 773 1 000 1 000 3 503 3 412 1 480 1 480 (1 480) 3 503 4 892GRFD 1 391 1 344 704 672 1 000 1 000 3 095 3 016 1 336 1 336 (1 336) 3 095 4 352CEO IAM 4 961 4 171 1 127 930 – – 6 088 5 101 – – – 6 088 5 101
^ 20% released each year for a period of five years.^^ As discussed on page 213, the awards were made on 31 May 2018 and the amount reflected in the table represents the number of awards made
multiplied by the grant share price. These awards vest in three to seven years and are still subject to performance conditions being met.* The bonuses for the CEO, MD and GRFD have an amount deferred as per the schedules on the next page while the CEO IAM invested approximately 20%
of his bonus in Investec plc shares to be held for three years.** On termination of employment outstanding long-term incentive awards will be pro-rated based on time served relative to the performance period of the
award. In this regard two-thirds of the 2018 award and one-third of the 2017 award will be forfeited.*** These are the figures for single remuneration figure purposes.

(continued)
Remuneration report
Rem
uneration rep
ort
191Investec integrated annual report 2018
The payment and deferral profile of the remuneration awarded to S Koseff (CEO) and B Kantor (MD) during the 2018 financial year is as follows:
Received in
£’000
Awarded in
2018
Currentyear
(2018) Year 1 Year 2 Year 3 Year 4 Year 5 Year 6 Year 7
Remuneration awarded in 2018 not subject to future performance conditions 3 503 1 694 294 294 324 324 324 124 125
Salary and benefits 480 480 – – – – – – –Fixed allowance payable in shares 1 000 – 200 200 200 200 200Short-term incentive 2 023 1 214 94 94 124 124 124 124 125
Long-term incentive awarded in 2018 still subject to future performance conditions 1 480 – – – 296 296 296 296 296Long-term incentive awarded in 2018 and 2017 that will be forfeited** (1 480) – – (99) (296) (296) (296) (296) (197)
Total remuneration 3 503 1 694 294 195 324 324 324 124 224
The payment and deferral profile of the remuneration awarded to GR Burger (GRFD) during the 2018 financial year is as follows:
Received in
£’000
Awarded in
2018
Currentyear
(2018) Year 1 Year 2 Year 3 Year 4 Year 5 Year 6 Year 7
Remuneration awarded in 2018 not subject to future performance conditions 3 095 1 392 291 291 304 304 304 105 104
Salary and benefits 336 336 – – – – – – –Fixed allowance payable in shares 1 000 – 200 200 200 200 200 – –Short-term incentive 1 759 1 056 91 91 104 104 104 105 104
Long-term incentive awarded in 2018 still subject to future performance conditions 1 336 – – – 267 267 267 267 268Long-term incentives awarded in 2018 and 2017 that will be forfeited** (1 336) – – (89) (267) (267) (267) (267) (179)
Total remuneration 3 095 1 392 291 202 304 304 304 105 193
** On termination of employment outstanding long-term incentive awards will be pro-rated based on time served relative to the performance period of the award. In this regard two-thirds of the 2018 award and one-third of the 2017 award will be forfeited.
Hendrik du Toit invested approximately 20% of his bonus in Investec plc shares, to be held for three years.

(continued)
Remuneration report
Rem
uneration rep
ort
192 Investec integrated annual report 2018
Annual report on directors’ remunerationThe Investec group aims to apply remuneration policies to executive directors and employees that are largely consistent across the group, but recognises that certain parts of the group are governed by local regulations that may contain more onerous requirements in certain respects.
Composition and role of the committeePerry Crosthwaite served as the chairman of the committee for the financial year ended 31 March 2018. Perry stepped down as the chairman with effect from 31 March 2018, and remains as a committee member. Philip Hourquebie succeeded Perry with effect from 1 April 2018. Philip joined the committee in August 2017. Fani Titi served as a member during the financial year, but stepped down with effect from 23 February 2018, in line with his new role as Joint CEO Designate and recused himself from discussions relating to the proposed directors’ remuneration policy. The other members of the committee are Charles Jacobs and Zarina Bassa.
Current members of the committee are deemed to be independent as discussed on page 133.
Two members of the committee are also members of the group’s board risk and capital committee and the group’s audit committee (as discussed on page 159), thus bringing risk and control mechanisms into the committee’s deliberations.
The committee’s principal responsibilities and objectives are to:
• Determine, develop and agree with the board, the framework for the remuneration of executive directors and executive management (comprising individuals discharging managerial responsibilities, who are the global heads of our core areas of activity and are members of our global operations forum)
• Commission and consider the results of an annual internal review of remuneration policy implementation
• Ensure that qualified and experienced management and executives are provided with appropriate incentives to encourage enhanced performance and are, in a fair and responsible manner, rewarded for their contribution to the success of the group and alignment with the corporate objectives and business strategy
• Review and approve the design of and determine targets and objectives for any performance-related remuneration schemes operated by the group and approve the aggregate annual payouts under such schemes
• Review and approve, within the terms of the agreed policy, the total individual remuneration packages of executive directors and persons discharging managerial responsibilities and Material Risk Takers including, where appropriate, bonuses, incentive payments and share scheme awards
• Review and approve, within the terms of the agreed policy, the total individual remuneration packages of members of the Internal Audit, Risk and Compliance functions as well as the company secretaries
• Oversee any major changes in our employee benefit structures
• Ensure that the recommendations and rules within the UK and South Africa pertaining to remuneration are adhered to, as appropriate.
The committee is authorised by the board to seek any information it requires from any employee in order to perform its duties.
The committee’s terms of reference are subject to annual review and are available on our website.
MeetingsThe remuneration committee met 12 times during the financial year. Each member attended all of the meetings that they were eligible to attend, with the exception of Charles Jacobs who attended 10.
The company secretary of Investec plc acts as the secretary. Executive directors do not attend meetings of the committee, unless invited or required to do so by the chairman of the committee. The chairman of the committee reports on the activities of the committee at each meeting of the board.
Advisers to the committee and the companyWhere appropriate, the committee has access to independent executive remuneration consultants. The selection of the advisers is at the discretion of the committee and Investec funds any expenses relating to their appointment.
During the financial year, the committee engaged the services of Korn Ferry as its principal advisers, which among other things reviewed and provided information on industry consultation papers, regulations and developments with respect to remuneration practices and our alignment to them. In addition, they continued to review and provide information on appropriate benchmarks, industry and comparable organisations’ remuneration practices. Their recommendations are valued in the ongoing review of our remuneration practices. Korn Ferry is a signatory to the UK Remuneration Consultants Group’s Code of Conduct and does not conduct any material work for the company other than for the committee. The committee, on an annual basis, formally evaluates the advice received from Korn Ferry to ensure that it is both objective and independent, and considers whether this service should be retained for the forthcoming year. Total fees paid to Korn Ferry for the year amounted to £23 904 (based on their standard hourly rates).
The company retained the services of PricewaterhouseCoopers to assist with the development of the proposed remuneration policy for executive directors. This information was also shared with the committee.
Certain specialist divisions within the group, for example, human resources and the staff shares schemes division, provide supporting information and documentation relating to matters that are presented to the committee. This includes, for example, comparative data and motivations for proposed salary, bonus and share awards. The variable remuneration pools are determined by our finance teams and subject to review as part of the audit process taking into account risk-adjusted capital requirements and after eliminating unrealised gains. The employees within these specialist divisions, which provide support to the committee, are not board directors and are not appointed by the committee.

(continued)
Remuneration report
Rem
uneration rep
ort
193Investec integrated annual report 2018
Statement of implementation of remuneration policy for the year ending 31 March 2019Executive directorsPending approval at the 2018 annual general meeting on 8 August 2018 the remuneration policy for the executive directors will be implemented for the year ending 31 March 2019 as follows:
Remuneration proposals for the current CEO, MD and GRFDIn terms of the group’s succession announcement made on 6 February 2018, Stephen Koseff (current CEO) and Bernard Kantor (current MD) will step down from these roles on 1 October 2018. They will remain executive directors until 31 March 2019. Glynn Burger will remain as the group’s GRFD until 31 March 2019.
Values and operation Changes, deferrals and performance targets
Base salary and benefits
• £480 000 for the CEO• £480 000 for the MD• £336 375 (i.e. R4 500 000 Rand portion and
£90 300 Pounds Sterling portion) for the GRFD• Benefits are funded by sacrificing a portion of
fixed pay
No change
Fixed allowance
• £1 000 000 for each of the three executive directors subject to CRD IV (CEO, MD and GRFD)
• An allowance granted in shares to ensure an appropriate mix between fixed and variable remuneration
• No change• Payable in shares• Vests on award• Retention period:
– Released over five years – 20% each year
STI (short-term incentive)
• Incentive pool for CEO, MD, GRFD:
– 0.23% each of adjusted operating profit for CEO and MD
– 0.20 % of adjusted operating profit for GRFD
– Subject to a maximum of 100%* of fixed remuneration
• New performance measures, as outlined on page 196 have been introduced• This will result in a reduction in quantum on a like-for-like historic performance
when comparing the proposed policy against the existing policy• The CEO and MD will waive their entitlement to a bonus for the second half of
the year, and their bonuses will be pro-rated to reflect this• The GRFD will receive a bonus for the full 2019 performance year• Performance against all of the measures will be tested at the end of the 2019
performance year• Malus and clawback provisions apply • Deferral period: 30% of bonus received upfront in cash; 30% received upfront in
shares; the remaining 40% is deferred• The 40% deferred amount is treated as follows: an amount that ensures 60%
of total variable remuneration (short-term incentive plus long-term incentive) is deferred over three to seven years, vests 20% per annum commencing on the third anniversary: with the balance deferred equally over one and two years
• All shares are subject to a 12 month retention period after vesting
LTI (long-term incentive)
• Annual award of 100% of aggregate fixed remuneration
• Paid entirely in shares
• Award for the 2018 performance period will be made in June 2018, with two-thirds being forfeited in line with our pro-rating policy (explained below)
• The CEO, MD and GRFD will waive entitlement to an award in respect of the 2019 performance year
• The award being granted in June 2018 and all unvested awards will be pro-rated for time served during the performance period
• Awards are subject to performance criteria as set out on pages 199 and 200• Deferral period: equal vesting over years three to seven, subject to 12 month
retention period• Malus and clawback provisions apply
* Cap defined in line with EBA discounting rules which allow, when 25% of variable remuneration is deferred over at least five years, a slightly higher cap than 2x fixed remuneration, depending on the length of deferral, inflation and interest rates. This is currently 244.2% of fixed remuneration. These limits will be in line with this cap.

(continued)
Remuneration report
Rem
uneration rep
ort
194 Investec integrated annual report 2018
Remuneration proposals for the new executive directorsIn terms of the group’s succession announcement made on 6 February 2018, Hendrik du Toit and Fani Titi have been appointed as Joint CEO designates with effect from 1 April 2018. Ciaran Whelan will assume the risk director role and Kim McFarland the group finance and operations director role with effect from 1 April 2019; these executive director roles will be remunerated at the same level as set out below. Further information on our succession plan is provided on page 121.
Values and operation Changes, deferrals and performance targets
Fixed pay
• Fixed pay award delivered equally in cash and shares• £1 332 000 for the Joint CEO designates (£666 000 in cash
and the balance in shares)• £1 066 000 for the other executive directors (£533 000 in cash
and the balance in shares)• Benefits are funded by sacrificing a portion of fixed pay and
comprise: – Pension contribution and/or allowance – Private medical insurance and other benefits in line with the
broader employee population
• 50% paid in cash monthly
• 50% delivered in shares which vest immediately, but are released in equal portions after one and two years
• Total fixed pay for the Joint CEO designates is 90% of the total fixed remuneration of the current CEO and managing director
• Total fixed pay for the other executive directors is 80% of the total fixed pay of the Joint CEO designates
STI (short-term incentive)
• Incentive pool for the Joint CEO designates – 0.23% each of adjusted operating profit
• Incentive pool for the other executive directors – 0.18% each of adjusted operating profit
• Subject to a maximum of 100%* of fixed remuneration
• New performance measures, as outlined on page 196 have been introduced
• This will result in a reduction in quantum on like-for-like historic performance when comparing the proposed policy against the existing policy
• Performance against all of the measures will be tested at the end of the 2019 performance year
• Malus and clawback provisions apply• Deferral period: 30% of bonus received upfront in cash; 30%
received upfront in shares; the remaining 40% is deferred• The 40% deferred amount is treated as follows: an amount
that ensures 60% of total variable remuneration (short-term incentive plus long-term incentive) is deferred over three to seven years, vests 20% per annum commencing on the third anniversary: with the balance deferred equally over one and two years
• All shares are subject to a 12 month retention period after vesting
LTI (long-term incentive)
• Annual award of 100% of aggregate fixed remuneration• Paid entirely in shares
• Award subject to performance criteria as set out on pages 199 and 200
• Deferral period: equal vesting over years three to seven, subject to 12 month retention period
• Malus and clawback provisions apply• The first award will be made in June 2019
* Cap defined in line with EBA discounting rules which allow, when 25% of variable remuneration is deferred over at least five years, a slightly higher cap than 2x fixed remuneration, depending on the length of deferral, inflation and interest rates. This is currently approximately 244.2% of fixed remuneration. These limits will be in line with this cap.

(continued)
Remuneration report
Rem
uneration rep
ort
195Investec integrated annual report 2018
An overview of key changes made in the proposed executive directors’ short-term incentive plan Investec aims to maintain an appropriate balance between revenue earned from capital light activities and revenue earned from capital intensive activities.
The group’s specialist banking business contributes approximately 60% to the group’s pre-tax operating profit; with the asset management and wealth and investment businesses contributing approximately 40%.
We believe our short-term incentive measures should thus appropriately reflect the mix of businesses and at the same time ensure that the group’s risks are appropriately managed.
As a result we are proposing the following changes to the short-term incentive plan:
• Performance measures have been reduced from nine to six (financial measures from five to three, and non-financial measures from four to three)
• A new financial measure will be used that reflects the operating margin of the combined asset management and wealth management businesses
• The multiplier at stretch performance has been reduced from 200% to 150%
• The financial measures weighting has been increased to 80%
• The non-financial measures and prudential measures weighting has been reduced from 40% to 20%
• New non-financial measures under the short-term incentive to include:
– Culture, values and co-operation related measures
– “ESG” related measures
– Prudential and risk management related measures
• The short-term incentive measures will now largely differ to those used under the long-term incentive.
Comparison of executive director’s proposed short-term incentive (STI) measures and weightings
Existing policy STI measures and weightings New proposed STI measures and weightings
15%
6.25%
6.25%
12.5%
25%
35%
Non-�nancial and prudential measures 40%
Non-�nancial and prudential measures20%
Non-�nancial measures*Culture, values and co-operation related measures
“ESG”** related measures
Prudential and risk management related measures
7%
5%
8%Net stable funding ratio
Liquidity coverage ratio
20%Operating margin of the combined Asset Management and Wealth Management business
30%Return on equity
30%Return on risk-weighted assets
Tier 1 capital adequacy
Return on equity
Return on risk-weighted assets
* Non-�nancial measures in existing policy equally weighted between: Culture and values; Franchise development; Governance and regulatory and shareholder relationships; Employee relationship and developments
** Where ESG refers to Environmental, Social and Governance related matters

(continued)
Remuneration report
Rem
uneration rep
ort
196 Investec integrated annual report 2018
Further details on the proposed executive directors’ short-term incentive plan:
• The total on-target short-term incentive pool** for the group executive director team (Joint CEOs*, financial director (FD) and group risk director (GRD)) is 0.82% of adjusted operating profit for the group; distributed 0.23% each to the Joint CEOs*; 0.18% each to the other new executive directors^.
• The short-term incentive pool is modified by a performance multiplier comprising weightings and performance scores relative to financial and non-financial measures.
• Weightings and score ranges for financial and non-financial measures are as follows:
Measure Weighting Score range Achievement levels
Financial measures 80% 0% – 150% Threshold (0%)Target (100%)
Stretch (150%)#
Non-financial measures 20% 0% – 150% Threshold (0%)Target (100%)
Stretch (150%)#
• Adjusted operating profit is defined as operating profit before taxation, goodwill, acquired intangibles and non-operating items and after non-controlling interests.
* In the management transition period the same sharing percentage as in the existing scheme applies to the current CEO and MD i.e. 0.23% and the GRFD sharing percentage remains the same as in the existing scheme at 0.20%.
** Our current remuneration policy sharing percentage for the “incentive pool” was set at 0.66% of adjusted operating profit (as defined above) for the CEO, MD and GRFD. There is a leverage multiplier of 180% in the existing scheme which effectively means that the sharing percentage was a minimum of 0.66% and a maximum of 1.18%. We are removing the leverage multiplier.
^ Remuneration set at 80% of the Joint CEOs.# Total short-term incentive is subject to a maximum regulatory cap. Cap defined in line with EBA discounting rules which allow, when 25% of variable
remuneration is deferred over at least five years, a slightly higher cap than 2x fixed remuneration (i.e. total variable pay to fixed pay), depending on the length of deferral, inflation and interest rates. This is currently 244.2% of fixed remuneration. These limits will be in line with this cap. Stretch achievement levels reduced from 200% to 150%.
Each financial and non-financial measure has set threshold levels below which no short-term incentive will be earned and stretch levels whereby the pool for short-term incentives earned will be increased, but to a level subject to the maximum regulatory cap. The committee believes that these stretch levels are demanding and will result in an incentive pool which will reflect actual performance and align the interests of the executive directors with the interests of shareholders. Achievement levels for the short-term incentive will be reviewed annually by the committee.
Proposed executive short-term incentive plan: financial measures, weightings and achievement levels for the year ending 31 March 2019The weightings for each financial measure for the year ending 31 March 2019 are as follows:
Measure Weighting
Financial measures 80%
Return on risk-weighted assets1 30%Return on equity2 30%Operating margin of the combined asset management and wealth and investment businesses3 20%
1. Return on risk-weighted assets is defined as adjusted earnings/average risk-weighted assets, where adjusted earnings are earnings attributable to ordinary shareholders after taxation, non-controlling interests and preference dividends, but before goodwill, acquired intangibles and non-operating items.
2. Return on equity is defined as adjusted earnings/average ordinary shareholders’ equity (excluding preference share capital).3. Operating margin is defined as the combined operating margin of the asset management and wealth and investment businesses.
The achievement levels for each of the financial measures which determine threshold, target and stretch performance are set by the committee following a careful and detailed review of our business strategy and goals, taking into account regulations and our risk appetite framework. Targets will be set by the committee based on a range of internal and external factors including public financial and non-financial targets, internal benchmarks and hurdles, and economic and market conditions. Achievement levels for the short-term incentive will be reviewed annually by the committee.

(continued)
Remuneration report
Rem
uneration rep
ort
197Investec integrated annual report 2018
Threshold, target and stretch performance levels for the financial measures set by the committee for the short-term incentive for the year ending 31 March 2019 are as follows:
Measure Weighting Achievement levels
Financial measures 80% Threshold (0%) Target (100%) Stretch (150%)
Return on risk-weighted assets 30% 1.3% 1.6% 1.8%Return on equity 30% 12.0% 14.0% 16.0%Operating margin of the combined asset management and wealth and investment businesses 20% 28.0% 30.0% 31.5%
Stretch achievement levels for all three measures are considered to be demanding:
• The group’s adjusted earnings for the year ended 31 March 2018 amounted to £491.1 million
• In order to achieve the stretch achievement level for return on risk-weighted assets, the group’s adjusted earnings for the year ended 31 March 2018 would have needed to be 24.2% larger at £610.0 million ceteris paribus
• In order to achieve the stretch achievement level for the return on equity, the group’s adjusted earnings for the year ended 31 March 2018 would have needed to be 32.4% higher at £650.0 million ceteris paribus
Proposed executive short-term incentive plan: non-financial measures, weightings and achievement levels for the year ending 31 March 2019The committee believes that it is appropriate to incentivise executive directors to attend to important matters on which the long-term performance of the company depends, but which cannot in any one performance period be directly linked to financial returns. Without a meaningful weighting and target score for non-financial measures, the executives would not be rewarded in any significant way for activities which the committee and the board regard as essential to the reputation, risk profile, capability and overall long-term sustainability of the company. The committee considers that both the short- and long-term incentive schemes should properly reflect the board's view of the proper balance of responsibilities for the executive directors.
The committee assesses achievement against objectives for the non-financial measures on a six-point scale and will award scores of 0 (0%) and 6 (150%) only in exceptional circumstances.
The areas of focus, weightings and objectives for the non-financial measures will be reviewed annually by the committee, and are as follows:
Measure Weighting Achievement levels
Non-financial measure 20% 0% 25% 50% 75% 100% 125% 150%1
Culture, values and co-operation related measures 7% 0 1 2 3 4 5 6“ESG” related measures 5% 0 1 2 3 4 5 6Prudential and risk management related measures 8% 0 1 2 3 4 5 6
1. The score range has been reduced from 0% to 200% to 0% to 150%.
Proposed executive short-term incentive plan: non-financial measures – areas of focus for the year ending 31 March 2019The committee has set the following areas of focus in respect of the non-financial performance conditions:
Areas of focus Factors to be assessed
Culture, values and co-operation related measures
• Management visible and proactive in demonstrating appropriate behaviour.
• Monitoring of the culture of the group.
• Management driving co-operation between the various geographic and business sectors of the group.
• Management driving co-operation between the executive director team and other senior management teams in the group.
• Quality of brand, development of client base and progress in building the firm.
• Acting with integrity, supporting the community, developing people and maintaining good relations with key stakeholders.
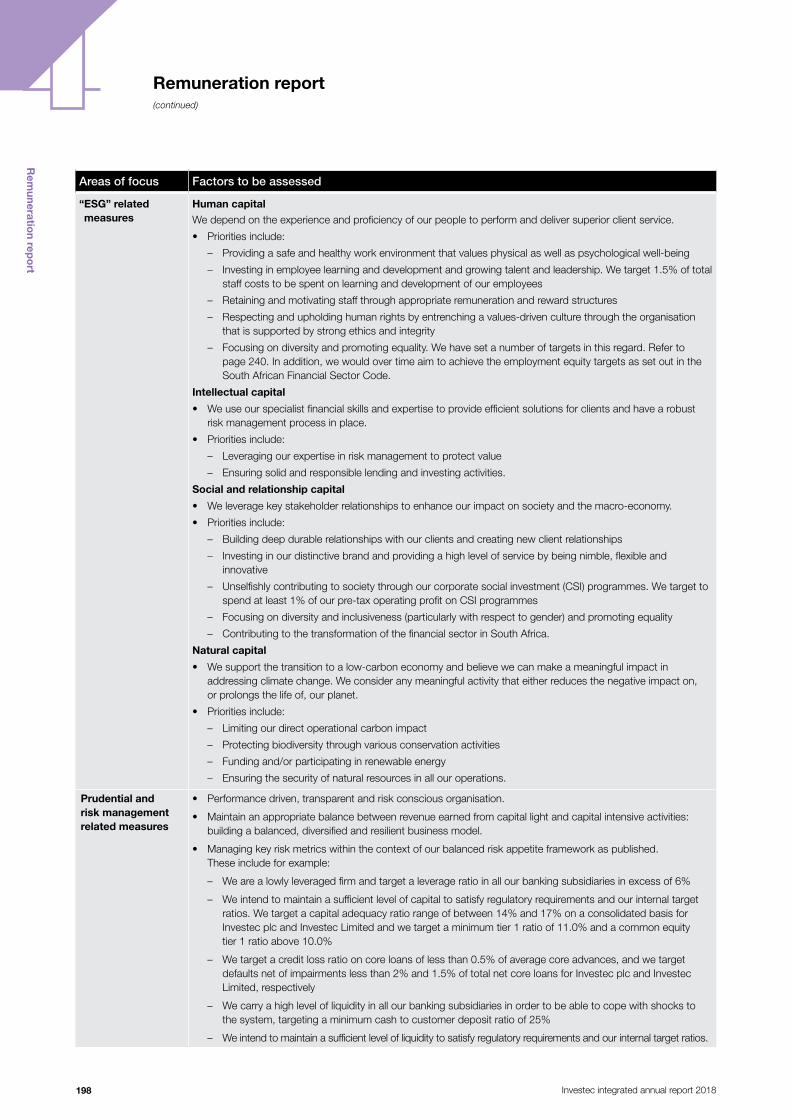
(continued)
Rem
uneration rep
ort
198 Investec integrated annual report 2018
Remuneration report
Areas of focus Factors to be assessed
“ ESG” related measures
Human capital
We depend on the experience and proficiency of our people to perform and deliver superior client service.
• Priorities include:
– Providing a safe and healthy work environment that values physical as well as psychological well-being
– Investing in employee learning and development and growing talent and leadership. We target 1.5% of total staff costs to be spent on learning and development of our employees
– Retaining and motivating staff through appropriate remuneration and reward structures
– Respecting and upholding human rights by entrenching a values-driven culture through the organisation that is supported by strong ethics and integrity
– Focusing on diversity and promoting equality. We have set a number of targets in this regard. Refer to page 240. In addition, we would over time aim to achieve the employment equity targets as set out in the South African Financial Sector Code.
Intellectual capital
• We use our specialist financial skills and expertise to provide efficient solutions for clients and have a robust risk management process in place.
• Priorities include:
– Leveraging our expertise in risk management to protect value
– Ensuring solid and responsible lending and investing activities.
Social and relationship capital
• We leverage key stakeholder relationships to enhance our impact on society and the macro-economy.
• Priorities include:
– Building deep durable relationships with our clients and creating new client relationships
– Investing in our distinctive brand and providing a high level of service by being nimble, flexible and innovative
– Unselfishly contributing to society through our corporate social investment (CSI) programmes. We target to spend at least 1% of our pre-tax operating profit on CSI programmes
– Focusing on diversity and inclusiveness (particularly with respect to gender) and promoting equality
– Contributing to the transformation of the financial sector in South Africa.
Natural capital
• We support the transition to a low-carbon economy and believe we can make a meaningful impact in addressing climate change. We consider any meaningful activity that either reduces the negative impact on, or prolongs the life of, our planet.
• Priorities include:
– Limiting our direct operational carbon impact
– Protecting biodiversity through various conservation activities
– Funding and/or participating in renewable energy
– Ensuring the security of natural resources in all our operations.
Prudential and risk management related measures
• Performance driven, transparent and risk conscious organisation.
• Maintain an appropriate balance between revenue earned from capital light and capital intensive activities: building a balanced, diversified and resilient business model.
• Managing key risk metrics within the context of our balanced risk appetite framework as published. These include for example:
– We are a lowly leveraged firm and target a leverage ratio in all our banking subsidiaries in excess of 6%
– We intend to maintain a sufficient level of capital to satisfy regulatory requirements and our internal target ratios. We target a capital adequacy ratio range of between 14% and 17% on a consolidated basis for Investec plc and Investec Limited and we target a minimum tier 1 ratio of 11.0% and a common equity tier 1 ratio above 10.0%
– We target a credit loss ratio on core loans of less than 0.5% of average core advances, and we target defaults net of impairments less than 2% and 1.5% of total net core loans for Investec plc and Investec Limited, respectively
– We carry a high level of liquidity in all our banking subsidiaries in order to be able to cope with shocks to the system, targeting a minimum cash to customer deposit ratio of 25%
– We intend to maintain a sufficient level of liquidity to satisfy regulatory requirements and our internal target ratios.

(continued)
Remuneration report
Rem
uneration rep
ort
199Investec integrated annual report 2018
Further details on the proposed executive directors’ long-term incentive plan• The long-term incentive plan comprises annual awards equal to a maximum of 100% fixed pay, paid entirely in shares with equal vesting
over years three to seven, subject to a 12 month retention period thereafter.
• Long-term incentive awards will be pro-rated for the period of service relative to the performance period of the award, should an executive director resign or retire prior to awards vesting (subject to good leaver principles).
• No changes have been made to the existing policy with the exception of adjusting achievement levels for return on risk-weighted assets and lowering the payouts for achieving stretch in the non-financial measures.
• The vesting of awards for the executive directors will be conditional on performance weighted as to financial and non-financial performance and measured against prescribed achievement levels.
• The number of shares awarded will be decreased or increased by a performance multiplier comprising weightings and achievement scores within score ranges for the financial and non-financial measures, as follows:
Measures Weighting Score rangeAchievement
levels*
Financial measures 75% 0% – 150% Threshold (0%)Target (100%)
Stretch (150%)
Non-financial measures 25% 0% – 150%** Threshold (0%)Target (100%)
Stretch (150%)2
* If stretch achievement levels for both the financial and non-financial measures are satisfied the number of shares vesting will be increased and capped at a maximum of 135% of the number of shares awarded at the time of grant.
** Stretch achievement level reduced from 200% to 150%.
Proposed executive long-term incentive plan: financial measures, weightings and achievement levels for the year ending 31 March 2019The achievement levels for each financial measure which determine threshold, target and stretch performance for the three-year performance period applicable to each annual award will be reviewed annually by the committee in advance of the award being made after a careful review of our business strategy and goals, taking into account regulations and our risk appetite framework. Targets will be set by the committee based on a range of internal and external factors including public financial and non-financial targets, internal benchmarks and hurdles, and economic and market conditions.
• The weightings for each of the financial measures are expected to remain constant going forward, but achievement levels will be reviewed annually.
• The awards will be tested over the three financial years preceding the first date of vesting against the achievement levels set on grant and the number of shares to be received will be determined by reference to the combined total which has been achieved.
• Threshold, target and stretch achievement levels for the financial measures for the year ending 31 March 2019 will be set as follows:
Measure Weighting Achievement levels
Financial measures 75% Threshold (0%) Target (100%) Stretch (150%)
Growth in tangible net asset value^ 40% 15% 30% 45%Return on risk-weighted assets^^ 35% 1.4% 1.7% 1.9%
^ The growth in tangible net asset value is expressed per share, based on neutral currency and after adding back dividends and will be measured cumulatively over the three financial years preceding the first date of vesting.
^^ Return on risk-weighted assets is defined as adjusted earnings/average risk-weighted assets, where adjusted earnings are earnings attributable to ordinary shareholders after taxation, non-controlling interests and preference dividends, but before goodwill, acquired intangibles and non-operating items, and will be measured over the three financial years preceding the first date of vesting by averaging the actual return on risk-weighted assets achieved for each of those three financial years.

(continued)
Remuneration report
Rem
uneration rep
ort
200 Investec integrated annual report 2018
Proposed executive long-term incentive plan: non-financial measures, weightings and achievement levels for the year ending 31 March 2019• The non-financial measures and associated objectives for the three-year performance period applicable to each annual award will be
reviewed annually by the committee, in advance of the award being made, taking into account the group’s strategic and operational objectives.
• The committee assesses achievement against objectives for the non-financial measures on a six-point scale and will award scores of 0 (0%) and 6 (150%) only in exceptional circumstances.
• The non-financial measures for the year ending 31 March 2019 are as follows:
Measure Weighting Achievement levels
Non-financial measures 25% 0% 25% 50% 75% 100% 125% 150%1
Culture and values 4% 0 1 2 3 4 5 6
Franchise development 13% 0 1 2 3 4 5 6
Governance and regulatory and shareholder relationships 4% 0 1 2 3 4 5 6
Employee relationship and development 4% 0 1 2 3 4 5 6
1. Score range reduced from 0% to 200% to 0% to 150%.
The areas of focus for the non-financial measures for the year ending 31 March 2019 will be as follows:
Culture and values Franchise development
Governance and regulatory and shareholder relationships
Employee relationship and development
• Management visible and proactive in demonstrating appropriate behaviour
• Performance-driven, transparent and risk-conscious organisation
• Acting with integrity, supporting the community, developing people and maintaining good relations with key stakeholders
• Continual monitoring of the culture of the group
• Quality of brand, development of client base, commitment to the community and progress in building the firm
• Delivering appropriate and sustainable products with high levels of service and responsiveness
• Environmental and other sustainability issues
• Maintaining open and transparent relations with regulators
• Regulators should have confidence that the firm is being properly governed and managed
• Shareholders should have confidence that the firm is being properly managed
• Succession and the development of the next generation
• Continued development of people – both on the job and extramurally
• Focus on diversity and inclusiveness (particularly with respect to gender) and promoting equality
• Transformation of the financial sector in South Africa

(continued)
Remuneration report
Rem
uneration rep
ort
201Investec integrated annual report 2018
Details on the executive directors’ short-term incentive plan: financial measures, weightings and achievement levels for the year ended 31 March 2018The financial measures which determined threshold, target and stretch performance under the short-term incentive and the achievement levels against each of the financial measures for the year ended 31 March 2018 are outlined on the next page. The threshold, target and stretch performance levels for the financial measures set by the committee, for the year ended 31 March 2018 are outlined below. Achievement levels for the year ended 31 March 2018 are shown on page 205.
Measure Weighting Achievement levels
Financial measure 85% Threshold (0%) Target (100%) Stretch (200%)
Return on risk-weighted assets1 35% 0.9% 1.2% 1.6%
Return on equity2 25% 9% 12% 15%
Tier 1 capital adequacy3 12.5% 9.5% 10.5% 12%
Liquidity cover ratio4 6.25% 115% 132.5% 162.5%
Net stable funding ratio4 6.25% 82% 89.5% 99.5%
1. Return on risk-weighted assets is defined as adjusted earnings/average risk-weighted assets, where adjusted earnings are earnings attributable to ordinary shareholders after taxation, non-controlling interests and preference dividends, but before goodwill, acquired intangibles and non-operating items.
2. Return on equity is defined as adjusted earnings/average ordinary shareholders’ equity (excluding preference share capital).3. Tier 1 capital adequacy condition is a blend of the underlying tier 1 capital adequacy ratios for Investec plc and Investec Limited (50% plc: 50% Limited).4. The liquidity measures (liquidity cover ratio and net stable funding ratio) are a blend of the underlying liquidity measures weighted by region (55% South Africa:
45% UK).
Measure South Africa UK
Geographical weighting 55% 45%
Liquidity cover ratio
Threshold 55% 150%
Target 65% 175%
Stretch 75% 225%
Net stable funding ratio
Threshold 65% 95%
Target 75% 100%
Stretch 85% 110%
Executive short-term incentive plan – non-financial measures, weightings and achievement levels for the year ended 31 March 2018The areas of focus, weightings and objectives for the non-financial measures for the year ended 31 March 2018 were assessed on a four-point scale as follows:
Measure Weighting Achievement levels
Non-financial measures 15% 0% 50% 100% 150% 200%
Culture and values 3.75% 0 1 2 3 4
Franchise development 3.75% 0 1 2 3 4
Governance and regulatory and shareholder relationships 3.75% 0 1 2 3 4
Employee relationship and developments 3.75% 0 1 2 3 4

(continued)
Remuneration report
Rem
uneration rep
ort
202 Investec integrated annual report 2018
• Franchise development
– Quality of brand, development of client base, commitment to the community and progress in building the firm
– Environmental and other sustainability issues.
• Governance and regulatory and shareholder relationships
– Maintaining open and transparent relations with regulators
– Regulators should have confidence that the firm is being properly governed and managed
– Shareholders should have confidence that the firm is being properly managed
– Delivering appropriate and sustainable products with high levels of service and responsiveness
• Employee relationship and development
– Succession and the development of the next generation
– Diversity and black economic empowerment initiatives and results
– Continued development of people – both on the job and extramurally.
Details on the executive directors’ long-term incentive plan for the year ended 31 March 2018The vesting of awards for the executive directors will be conditional on performance weighted as to financial and non-financial performance and measured against prescribed achievement levels.
The committee set the following areas of focus for the year ended 31 March 2018 in respect of the non-financial performance conditions:
• Culture and values
– Management visible and proactive in demonstrating appropriate behaviour
– Performance-driven, transparent and risk-conscious organisation
– Delivering appropriate and sustainable products with high levels of service and responsiveness
– Acting with integrity, supporting the community, developing people and maintaining good relations with key stakeholders
– Continual monitoring of the culture of the group.
The number of shares awarded will be decreased or increased by a performance multiplier comprising weightings and achievement scores within score ranges for the financial and non-financial measures, as follows:
Measure Weighting Score range Achievement levels
Financial measures 75% 0 – 150% Threshold (0%)
Target (100%)Stretch (150%)
Non-financial measures 25% 0 – 200% Threshold (0%)Target (100%)
Stretch (200%)
The number of shares which vest against both the financial and non-financial performance conditions depend on whether threshold (0%), target (100%) or stretch (150% or 200%) levels are achieved, with awards vesting on a linear basis between each level.
If the stretch achievement levels for both the financial and non-financial measures are satisfied, the number of shares vesting will be increased and capped at a maximum of 135% of the number of shares awarded at the time of grant.
Executive long-term incentive plan: financial measures, weightings and achievement levels for the year ended 31 March 2018Threshold, target and stretch achievement levels for the financial measures for awards made in relation to the year ended 31 March 2018 are as follows:
Measure Weighting Achievement levels
Financial measures 75% Threshold (0%) Target (100%) Stretch (150%)
Growth in tangible net asset value1 40% 15.0% 30.0% 45.0%
Return on risk-weighted assets2 35% 0.7% 1.2% 1.6%
1. The growth in tangible net asset value is expressed per share, based on neutral currency and after adding back dividends and will be measured cumulatively over the three financial years preceding the first date of vesting.
2. Return on risk-weighted assets is defined as adjusted earnings/average risk-weighted assets, where adjusted earnings are earnings attributable to ordinary shareholders after taxation, non-controlling interests and preference dividends, but before goodwill, acquired intangibles and non-operating items, and will be measured over the three financial years preceding the first date of vesting by averaging the actual return on risk-weighted assets achieved for each of those three financial years.
The awards will be tested over the three financial years prior to the first vesting. The number of shares to be received will be determined by reference to the combined total which has been achieved.

(continued)
Remuneration report
Rem
uneration rep
ort
203Investec integrated annual report 2018
Executive long-term incentive plan: non-financial measures, weightings and achievement levels for the year ended 31 March 2018The non-financial measures for awards made in relation to the year ended 31 March 2018 are as follows:
Measure Weighting Achievement levels
Non-financial measures 25% 0% 50% 100% 150% 200%
Culture and values 4% 0 1 2 3 4
Franchise development 13% 0 1 2 3 4
Governance and regulatory and shareholder relationships 4% 0 1 2 3 4
Employee relationship and development 4% 0 1 2 3 4
Non-executive directorsThe fee structure for non-executive directors for the period ending 31 August 2018 and 2019 is shown in the table below:
Non-executive directors’ remunerationPeriod ending 31 August 2018
As proposed by the board for the period from 1 September 2018 to 31 August 2019
Chairman’s total fee £435 000 per year £450 000 per year
Basic non-executive director fee £73 000 per year £75 000 per year
Senior independent director £10 000 per year £10 000 per year
Chairman of the DLC audit committee £65 000 per year £80 000 per year
Chairman of the DLC remuneration committee £46 000 per year £47 000 per year
Chairman of the DLC social and ethics committee – £30 000 per year
Chairman of the board risk and capital committee £45 000 per year £46 000 per year
Member of the DLC audit committee £19 000 per year £25 000 per year
Member of the DLC remuneration committee £17 000 per year £17 500 per year
Member of the DLC nominations and directors’ affairs committee
£12 500 per year £13 000 per year
Member of the DLC social and ethics committee £12 500 per year £13 000 per year
Member of the board risk and capital committee £15 000 per year £15 500 per year
Member of the Investec Bank plc board (also member of main board)
£14 000 per year £14 500 per year
Member of the Investec Bank plc board £56 000 £58 000 per year
Independent director of Investec Capital and Investments (Ireland) Limited
€50 000 per year €65 000 per year
Member of the Investec Bank Limited board (also member of main board)
R320 000 per year R340 000 per year
Member of the Investec Bank Limited board R470 000 R500 000 per year
Per diem fee for additional work committed to the group £2 000/R30 000 £2 000/R30 000
Note: Value-Added Tax (VAT), at the prevailing rate, where applicable, will be added to the above-mentioned fees to the extent they are paid in South Africa. Two binding general rulings were issued by the South African Revenue Service (SARS) in early 2017 confirming the South African Value-Added Tax (VAT) law that requires non-executive directors of companies to register for and charge VAT in respect of any directors’ fees earned for services rendered as a non-executive director that exceed the prescribed threshold. These rulings were effective 1 June 2017.

(continued)
Remuneration report
Rem
uneration rep
ort
204 Investec integrated annual report 2018
Executive directors’ single total figure of remuneration (audited) The table below provides a single total remuneration figure for each executive director over the financial period.
Executivedirectors
Salary£
Retire-ment
benefits£
Total other
taxablebenefits
£
Fixed allowance
£
Grossremune-
ration£
STI –upfront
cash andupfrontshares
£
STI – deferred
£
Totalremu-
nerationnot subject
to futureperfor-mance
conditions£
Value ofLTIP – not
vested and still
subject to perfor-mance
conditions£
Value ofexercised
LTIPs£
Value of LTIPs
that will be
forfeited
Total remune-
ration£
S Koseff (CEO)– 2018 396 174 73 845 9 981 1 000 000 1 480 000 1 213 737 809 158 3 502 895 1 480 000 – (1 480 000) 3 502 895– 2017 399 530 69 668 10 802 1 000 000 1 480 000 1 159 216 772 810 3 412 026 1 480 000 – – 4 892 026B Kantor(MD)
– 2018 425 636 38 614 15 750 1 000 000 1 480 000 1 213 737 809 158 3 502 895 1 480 000 – (1 480 000) 3 502 895– 2017 434 845 38 330 6 825 1 000 000 1 480 000 1 159 216 772 810 3 412 026 1 480 000 – – 4 892 026GR Burger (GRFD)– 2018 290 884 39 212 6 279 1 000 000 1 336 375 1 055 424 703 616 3 095 415 1 336 375 – (1 336 353) 3 095 437– 2017 292 493 36 652 7 164 1 000 000 1 336 309 1 008 014 672 008 3 016 331 1 336 309 – – 4 352 640HJ du Toit (CEO IAM)– 2018 440 950 – 10 481 – 451 431 4 509 600 1 127 400 6 088 431 – – 6 088 431– 2017 440 950 – 10 242 – 451 192 3 720 000 930 000 5 101 192 – – – 5 101 192
Salary and benefits• Gross remuneration of S Koseff and B Kantor (excluding the fixed allowance of £1 million) remained unchanged from the previous year at £480 000.
The gross remuneration for HJ du Toit largely remained the same as the prior year. The gross remuneration of GR Burger (excluding the fixed allowance of £1 million) is largely determined in Rands and converted into Pounds Sterling. In Rand terms GR Burger’s Rand-based gross remuneration remained unchanged at R4 500 000 and his Pound-based gross remuneration was £90 300.
• The executive directors receive other benefits which may include pension schemes; life, disability and personal accident insurance; medical cover; and fixed allowances, on similar terms to other senior executives. These amounts are funded out of gross remuneration.
• To ensure compliance with the requirements of CRD IV, the CEO, MD and GRFD have received fixed allowances, payable in shares. The fixed allowance of £1 million each to S Koseff, B Kantor and GR Burger was last year awarded in the form of 170 358 forfeitable Investec plc shares to each of the directors which vested immediately on award. These shares are, however, subject to a retention period in terms of which 20% of shares will be free from retention restrictions each year over a period of five years. The 170 358 Investec plc shares for each of the directors is included in their beneficial and non-beneficial interest holding on page 209.
• Retirement benefits: None of the directors belong to a defined benefit pension scheme and all are members of one of the defined contribution pension or provident schemes. The amounts reflected in the table above represent the contribution to these schemes payable by the company.
Short-term incentive (STI)• As in prior years, the remuneration for HJ du Toit for the year ending 31 March 2018 was determined and delivered in respect of his role as the CEO of IAM.
Accordingly the remuneration benefits due to him were subject to the remuneration policies, rules and regulations applicable to employees of IAM. He was not classified as a Material Risk Taker by PRA regulations and, as a result, his compensation arrangements were not affected by a cap on variable remuneration.
• IAM reported an increase in operating profit before non-controlling interest of 8.0% to £178.0 million. Assets under management amounted to £103.9 billion, with £5.4 billion in net flows.
• The CEO of IAM is entitled to a short term incentive of 1.85% of the earnings of IAM before variable compensation and tax. HJ du Toit has, however, regularly elected not to accept the full 1.85% of earnings of IAM before variable compensation and tax to which he was entitled. For the year ended 31 March 2018, the final year of his participation in this scheme, the full 1.85% amounting to £5.637 million was paid to HJ du Toit.
• In the prior financial year HJ du Toit had 20% of his bonus deferred into the IAM Deferred Bonus Plan as outlined on page 235. This year, given his transition to the Joint CEO designate role, he invested approximately 20% of his bonus in Investec plc shares, to be held for three years.
• His remuneration arrangements going forward will be fully aligned with the group and remuneration will be paid in accordance with the proposals set out on page 194.
• S Koseff, B Kantor and GR Burger are classified as PRA Material Risk Takers.• The annual bonus for the year ended 31 March 2018 for S Koseff, B Kantor and GR Burger was determined with reference to performance against financial
and non-financial measures as set out below and described in detail on pages 201 to 203.• Further information on the short-term incentives is set out on pages 201 to 203 and as discussed on page 193 a portion of bonuses are paid in cash and a
portion is deferred. The portion deferred is deferred in shares.
The determination of bonuses for the CEO, MD and GRFD are set out below:• The target short-term incentive pool available for the CEO, MD and GRFD for the year ended 31 March 2018 amounted to 0.66% of the group’s adjusted
operating profit, defined as operating profit before taxation, goodwill, acquired intangibles and non-operating items and after non-controlling interests. If the target performance conditions are achieved, distribution of the pool at target performance is as follows: 0.23% to the CEO, 0.23% to the MD and 0.20% to the GRFD.
• The pool is decreased or increased by a performance multiplier comprising weightings and achievement scores within score ranges for the financial and non-financial performance measures described in the table below. The maximum aggregate pool, if all financial and non-financial stretch levels are achieved, would be 180% of (adjusted operating profit x 0.66%), subject to the remuneration cap as approved by shareholders.
Long-term incentive awards• Long-term incentive awards were granted to S Koseff, B Kantor and GR Burger during the 2018 financial year. No LTIPs for S Koseff, B Kantor and GR Burger
vested in 2018.• On termination of employment outstanding long-term incentive awards will be pro-rated based on time served relative to the performance period of the
award. In this regard two-thirds of the 2018 award will be forfeited and one-third of the 2017 award.

(continued)
Remuneration report
Rem
uneration rep
ort
205Investec integrated annual report 2018
Executive short-term incentives – achievement of performance targets
The determination of the bonus for S Koseff and B Kantor is shown below:Adjusted operating profit at 31 March 2018 (£’000) 583 688
CEO/MD ‘incentive pool’ at 0.23% (£’000) 1 342
Maximum leverage at 180%, i.e. maximum potential bonus before application of the remuneration cap (£’000) 2 416
Maximum bonus subject to remuneration cap, whereby variable remuneration cannot exceed 244.2% of fixed remuneration (£’000)1 2 134
Achievement levels
Financial measures Weighting
Actual achieve-ment at
31 March 2018
Threshold 0%
Target 100%
Stretch 200%
Actual allocation achieved
£’000
Actualweighting achieved
% vs target
Return on risk-weighted assets 35% 1.45% 0.9% 1.2% 1.6% 763 162.4%
Return on equity 25% 12.1% 9% 12% 15% 343 102.1%Tier 1 capital adequacy 12.5% 12.0% 9.5% 10.5% 12.0% 330 196.7%LCR 6.25% 210.7% 115% 132.5% 162.5% 168 200.0%NSFR 6.25% 123.9% 82% 89.5% 99.5% 168 200.0%Total 85% 1 772 155.2%
1. The cap is calculated in line with EBA discounting rules which allow, when 25% of variable remuneration is deferred over at least five years, a slightly higher cap than 2x fixed remuneration, depending on the length of deferral, inflation and interest rates. It has been independently calculated at 244.2% for awards made in respect of the 2018 financial year.
The portion of the 2017 bonus ‘achieved’ for financial measures amounted to £1 707 000 (£758 000 for return on risk-weighted assets; £384 000 for return on equity; £233 000 for tier 1 capital adequacy; £166 000 for the LCR; and £166 000 for the NSFR).
Non-financial measures
Following an assessment of these measures (as described on pages 206 to 207) the remuneration committee decided to allocate an award of £251 715 (2017: £224 658) for performance against non-financial measures. A score of 3 (i.e. weighting of 150%) was awarded to the ‘culture and values’ category, a score of 2 (i.e. weighting of 100%) was awarded to the ‘franchise development’ category, a score of 1 (i.e. weighting of 50%) was awarded to the ‘Governance and regulator and shareholder relationships category’, and a score of 4 (i.e. weighting of 200%) was awarded to the ‘employee relationship and development category’. Further information is provided on pages 201, 202, 206 and 207.
Final bonus awarded to S Koseff and B Kantor
The results of the performance assessment against financial and non-financial measures (reflected above) yield a bonus of £2 022 895. The short-term incentive and long-term incentive combined are subject to a cap of 244.2% of fixed remuneration, as above, and the awards to S Koseff and B Kantor fall within that cap.1 The committee considered whether it is appropriate to apply malus and clawback to executive director awards and determined that neither malus or clawback should apply.
The determination of the bonus for GR Burger is shown below:Adjusted operating profit at 31 March 2018 (£’000) 583 688
GRFD ‘incentive pool’ at 0.20% (£’000) 1 167
Maximum leverage at 180%, i.e. maximum potential bonus before application of the remuneration cap (£’000) 2 101
Maximum bonus subject to remuneration cap whereby variable remuneration cannot exceed 244.2% of fixed remuneration (£’000)1 1 927
Achievement levels
Financial measures Weighting
Actual achieve-ment at
31 March 2018
Threshold 0%
Target 100%
Stretch 200%
Actual allocation achieved
£’000
Actualweightingachieved
vs % target
Return on risk-weighted assets 35% 1.45% 0.9% 1.2% 1.6% 663 162.4%
Return on equity 25% 12.1% 9% 12% 15% 298 102.1%Tier 1 capital adequacy 12.5% 12.0% 9.5% 10.5% 12.0% 287 196.7%LCR 6.25% 210.7% 115% 132.5% 162.5% 146 200.0%NSFR 6.25% 123.9% 82% 89.5% 99.5% 146 200.0%Total 85% 1 540 155.2%
1. The cap is calculated in line with EBA discounting rules which allow, when 25% of variable remuneration is deferred over at least five years, a slightly higher cap than 2x fixed remuneration, depending on the length of deferral, inflation and interest rates. It has been independently calculated at 244.2% for awards made in respect of the 2018 financial year.

(continued)
Remuneration report
Rem
uneration rep
ort
206 Investec integrated annual report 2018
The portion of the 2017 bonus achieved for financial measures amounted to £1 485 000 (£659 000 for return on risk-weighted assets; £333 000 for return on equity; £203 000 for tier 1 capital adequacy; £145 000 for the LCR; and £145 000 for the NSFR).
Non-financial measures
Following an assessment of these measures (as described below) the remuneration committee decided to allocate an award of £218 883 (2017: £195 355) for performance against non-financial measures. A score of 3 (i.e. weighting of 150%) was awarded to the ‘culture and values’ category, a score of 2 (i.e. weighting of 100%) was awarded to the ‘franchise development’ category, a score of 1 (i.e. weighting of 50%) was awarded to the ‘Governance and regulator and shareholder relationships category’, and a score of 4 (i.e. weighting of 200%) was awarded to the ‘employee relationship and development category’. Further information is provided on pages 201, 202, 206 and 207.
Final bonus awarded to GR Burger
The results of the performance assessment against financial and non-financial measures (reflected above) yield a bonus of £1 759 040. The short-term incentive and long-term incentive combined are subject to a cap of 244.2% of variable remuneration, and the bonus awarded to GR Burger falls within that cap. The committee considered whether it is appropriate to apply malus and clawback to executive director awards and determined that neither malus or clawback should apply.
An assessment of non-financial measuresThe following aspects were taken into consideration in the assessment of performance against the non-financial measures for the CEO, MD and GRFD.
Areas of focus as set out on page 200 Achievements during the year
Culture and values:
• Management visible and proactive in demonstrating appropriate behaviour
• Performance-driven, transparent and risk conscious organisation
• Delivering appropriate and sustainable products with high levels of service and responsiveness
• Acting with integrity, supporting the community, developing people and maintaining good relations with key stakeholders
• Continual monitoring of the culture of the group
• The executive have worked closely with the board to ensure a steady handover of knowledge and experience from the “founders” to the incoming executives
• The executives focused on ensuring that there was a strong pipeline of leaders in the organisation ready to take over from the “founders”
• The executive have engaged in activities with employees at all levels through, for example, management hosted breakfasts, management panels, induction presentations, and facilitating discussions on a number of aspects, including culture and values. The executive hosted and attended multiple functions with new and future leaders during the year
• Our Human Resources and Organisational Development divisions continued to actively work with the executive and our management teams to ensure our values are lived and entrenched into our day-to-day activities
Governance and regulatory and shareholder relationships:
• Maintaining open and transparent relations with regulators
• Regulators should have confidence that the firm is being properly governed and managed
• Shareholders should have confidence that the firm is being properly managed
• Delivering appropriate and sustainable products with high levels of service and responsiveness
• We have strong relationships with the governing bodies and regulators in all of the jurisdictions in which we operate
• The executive together with senior employees, the group chairman and the chairman of the remuneration committee meet regularly with shareholders and shareholder representative organisations. These engagements are important and contribute directly to decisions made by the remuneration committee
• The remuneration committee is mindful of the fact that some shareholders are unhappy with the relationship between company performance and the level of executive pay
• The executive worked with the remuneration committee and provided input to the drafting of the proposed new remuneration policy for executive directors
• Investec Limited continues to cooperate with the Competition Commission Authorities in South Africa with respect to their ongoing investigation into alleged collusion in relation to foreign exchange.

(continued)
Remuneration report
Rem
uneration rep
ort
207Investec integrated annual report 2018
Areas of focus as set out on page 200 Achievements during the year
Franchise development:
• Quality of brand, development of client base, commitment to the community and progress in building the firm
• Environmental and other sustainability issues
• We continue to receive very positive feedback from clients regarding our service
• We continued to grow our client base and invest in our franchise businesses
• Investec and Stephen Koseff have been very pro-active in South Africa in multi-party democracy and free enterprise
• Investec maintained its inclusion in a number of international sustainability indices
• Our core values include unselfishly contributing to society. During the year we spent £7.2 million on social investment initiatives (2017: £7.1 million), exceeding our target of at least 1% of pre-tax operating profit spent on such initiatives
• Our flagship educational initiative in South Africa, Promaths, continues to outpace the national average for Mathematics and Science
• The Financial Times of London has recognised Investec Private Banking and Wealth & Investment as the best private bank and wealth manager in South Africa – for the fourth consecutive year – at the Global Private Banking Awards
• Winner of the Business of the Year award by Business Charity Awards 2017 (for Beyond Business)
• Winner of the Community Impact Award 2017 for our flagship programme the Beyond Business social enterprise incubator we run in partnership with Bromley by Bow Centre
• Winner of the National CSR Awards 2017, in the individual Community (Legacy) category Project Award (for Beyond Business)
• Reaccredited winner (for Beyond Business) in the Responsible Business Awards 2017
• Received the Financial Innovation Awards 2017 – Innovation in Sustainability or Social Responsibility Awards for our Invest for Success programme run in partnership with Arrival Education
• Investec group was awarded a B for the CDP climate scoring
• Investec’s Energy Management System that covers 23 of our physical buildings in the UK, Ireland and Channel Islands was certified to the international energy standard ISO 50001
Employee relationship and development:
• Succession and development of the next generation
• Diversity and black economic empowerment initiatives and results
• Continued development of people – both on the job and extramurally
• The outgoing executive have worked closely with, and supported, the board with the transition to the new executive.
• The outgoing executive have ensured that a smooth and proactive transition has taken place
• Investec was voted the second most attractive employer by professionals in South Africa in the 2017 Universum Awards
• Investec is a member of the 30% Club in South Africa and the UK committing to a goal of 30% woman on the board, and has made good progress towards the target of 33% female representation by 2020, per the Hampton-Alexander Review
• Investec has signed up to the Women in Finance Charter in the UK, pledging to promote gender diversity by having a senior executive team member responsible and accountable for gender diversity and inclusion, setting internal targets for gender diversity at senior management levels, publishing progress annually against these targets, and linking the pay of senior executives to delivery against these gender diversity targets
• In South Africa, Investec remains committed to black economic empowerment. We remain committed to achieving greater representation at all levels of the business through the effective implementation of our employment equity plan.
• In 2018 we invested £22.5 million in the learning and development of our employees, compared to £22.9 million in the prior year, exceeding our target spend of at least 1.5% of staff costs
• The executive have supported the development of the Women in Business initiative, an initiative aimed at promoting the support and advancement of women in the workplace, while also focusing on supporting our female clients

(continued)
Remuneration report
Rem
uneration rep
ort
208 Investec integrated annual report 2018
Non-executive directors’ single total remuneration figure (audited) The table below provides a single total remuneration figure for each non-executive director over the financial period.
Name
Totalremuneration
2018 £
Totalremuneration
2017 £
Non-executive directors
F Titi (chairman) 430 850 425 000
ZBM Bassa 206 105 137 561
LC Bowden 79 000 90 000
CA Carolus 84 877 84 000
PKO Crosthwaite 242 133 221 627
D Friedland 226 913 310 861
PA Hourquebie1 75 299 –
CR Jacobs 89 377 88 500
IR Kantor 89 415 88 500
Lord Malloch-Brown KCMG 84 876 88 000
KL Shuenyane 123 337 133 149
PRS Thomas2 136 315 200 879
Total in Pounds Sterling 1 868 497 1 868 077
1. PA Hourquebie appointed on 14 August 2017.2. PRS Thomas resigned on 10 August 2017.
Payments to past directors and payments for loss of office (audited) No such payments have been made.

(continued)
Remuneration report
Rem
uneration rep
ort
209Investec integrated annual report 2018
Directors’ shareholdings, options and long-term incentive awards (audited) The company’s register of directors’ interests contains full details of directors’ shareholdings, options and long-term incentive awards. The tables that follow provide information on the directors’ shareholdings, options and long-term incentive awards for the year ended 31 March 2018.
Directors’ shareholdings in Investec plc and Investec Limited shares at 31 March 2018 (audited)
Beneficial and non-beneficial interest
Investec plc1
% of sharesin issue1 Investec
plc
Beneficial and non-beneficial interest
Investec Limited1
% of shares in issue1 Investec Limited
Name31 March
20181 April
201731 March
201831 March
20181 April
201731 March
2018
Executive directorsS Koseff2 5 936 212 5 295 775 0.9% 962 841 1 234 399 0.3%B Kantor2/3 1 507 271 1 164 359 0.2% 1 600 500 2 300 500 0.5%GR Burger2 3 208 064 3 488 675 0.5% 327 076 327 076 0.1%HJ du Toit – – – 604 740 604 740 0.2%Total number 10 651 547 9 948 809 1.6% 3 495 157 4 466 715 1.1%
Non-executive directorsF Titi (chairman) – – – – – –ZBM Bassa – – – – – –LC Bowden – – – – – –CA Carolus – – – – – –PKO Crosthwaite 115 738 115 738 – – – –D Friedland – – – – – –Philip Hourquebie – – – – – –CR Jacobs – – – – – –IR Kantor 1 009 045 1 009 045 0.2% 325 325 –Lord Malloch-Brown KCMG – – – – –KL Shuenyane 19 900 19 900 – – – –Total number 1 144 683 1 144 683 0.2% 325 325 –
Total number 11 796 230 11 093 492 1.8% 3 495 482 4 467 040 1.1%
The table above reflects holdings of shares by current directors.1. The number of shares in issue and share prices for Investec plc and Investec Limited over the period is provided on page 213.2. The beneficial and non-beneficial holdings of S Koseff, B Kantor and GR Burger, include 170 358 Investec plc shares which relate to the awards to each
of the directors of shares in respect of a £1 million fixed allowance on 8 June 2017 (as explained on page 220). These shares are, however, subject to a retention period in terms of which 20% of shares will be free from retention restrictions each year over a period of five years.
3. Bernard Kantor entered into a zero premium/cost option arrangement and purchased put options over 600 000 Investec Limited ordinary shares at a strike price of R100.00 per share and a call option over 600 000 Investec Limited ordinary shares at a strike price of R120.00 per share. 600 000 Investec Limited ordinary shares have been pledged as security with the writer of those options.
In addition, as outlined on page 213, awards were granted to S Koseff, B Kantor and GR Burger on 31 May 2018.
Directors’ interest in preference shares at 31 March 2018 (audited)
Investec plc Investec Limited Investec Bank Limited
Name31 March
20181 April
201731 March
20181 April
201731 March
20181 April
2017
Executive director
S Koseff 12 139 12 139 3 000 3 000 4 000 4 000
• The market price of an Investec plc preference share at 31 March 2018 was R88.00 (2017: R81.00).• The market price of an Investec Limited preference share at 31 March 2018 was R67.50 (2017: R75.00).• The market price of an Investec Bank Limited preference share at 31 March 2018 was R71.56 (2017: R82.00).

(continued)
Remuneration report
Rem
uneration rep
ort
210 Investec integrated annual report 2018
Directors’ interest in options at 31 March 2018 (audited) Investec plc shares
The directors do not have any interest in options over Investec plc shares.
Investec Limited shares
The directors do not have any interest in options over Investec Limited shares.
Directors’ interests in the Investec plc Executive Incentive Plan 2013 at 31 March 2018 (audited) Awards made in respect of the financial year ending 31 March 2013
Name
Number of Investec
plc shares awarded on
16 Sept 2013
Exerciseprice
Perform-ance
period
Perform-ance
conditionsmet (Y/N)
Additional shares
awarded for performance
conditions being met
Shares exercised during the
year to 31 March
2018
Balanceat
31 March2018
Periodexercisable
Retention period
S Koseff 600 000 Nil 1 April 2013 to 31 March
2016
Yes 204 617 603 462 201 155 75% was exercisable on 16 September
2017; and
A further six months after vesting date
25% is exercisable on 16 September
2018
A further six months after vesting date
B Kantor 600 000 Nil 1 April 2013 to 31 March
2016
Yes 204 617 603 462 201 155 75% wasexercisable on16 September
2017; and
A further six months after vesting date
25% is exercisable on 16 September
2018
A further six months after vesting date
GR Burger 600 000 Nil 1 April 2013to
31 March2016
Yes 204 617 603 462 201 155 75% is exercisable on 16 September
2017; and
A further six months after vesting date
25% on 16 September
2018
A further six months after vesting date
The Executive Incentive Plan 2013 and the awards made on 16 September 2013 were approved at the July 2013 annual general meeting in terms of which 600 000 nil cost options each were awarded to S Koseff, B Kantor and GR Burger.
The performance criteria in respect of these awards were met and detailed in Investec’s 2016 integrated annual report. These awards have now vested subject to the retention periods reflected above. These awards formed part of their variable remuneration in respect of the year ending 31 March 2013.
The value of shares exercised are not included in the single remuneration table on page 204, as they were included in these disclosures in the year the award was granted.

(continued)
Remuneration report
Rem
uneration rep
ort
211Investec integrated annual report 2018
Directors’ interests in the Investec plc Executive Incentive Plan 2013 at 31 March 2018 (audited) Long-term share awards granted in respect of the 2016 financial year
Name
Date of
grantExercise
price
Number of Investec plc shares at 1 April 2017
Conditional awards
made during the
year
Balance at
31 March 2018
Perform-ance period
Period exercisable
Retention period
Treatment on termination of
employment
S Koseff 2 June 2016
Nil 314 225 – 314 225 1 April 2016 to 31 March
2019
One third is exercisable on 2 June 2019;
one third on 2 June 2020 and the final
third on 2 June 2021 subject
to performance criteria being
met
A further six-month
retention after vesting date
Will be pro-rated based
on service over the
performance period,
relative to the performance period of the
award
B Kantor 2 June 2016
Nil 314 225 – 314 225 1 April 2016 to 31 March
2019
One third is exercisable on 2 June 2019;
one third on 2 June 2020 and the final
third on 2 June 2021 subject
to performance criteria being
met
A further six-month
retention after vesting date
Will be pro-rated based
on service over the
performance period,
relative to the performance period of the
award
GR Burger 2 June 2016
Nil 277 801 – 277 801 1 April 2016 to 31 March
2019
One third is exercisable on 2 June 2019;
one third on 2 June 2020 and the final
third on 2 June 2021 subject
to performance criteria being
met
A further six-month
retention after vesting date
Will be pro-rated based
on service over the
performance period,
relative to the performance period of the
award
The remuneration policy was approved at the August 2015 annual general meeting.
On 2 June 2016, 314 225 conditional awards were awarded to S Koseff and B Kantor, and 277 801 to GR Burger. These awards formed part of their variable remuneration in respect of the financial year ending 31 March 2016.
The performance criteria in respect of these awards are detailed on pages 202 and 203. Vesting starts at 0% for threshold performance. These awards have not yet vested. The face value at grant for these awards was equivalent to 100% of fixed remuneration and amounted to £1 480 000 for S Koseff and B Kantor, and £1 308 000 for GR Burger based on the share price for Investec plc at the time of grant.

(continued)
Remuneration report
Rem
uneration rep
ort
212 Investec integrated annual report 2018
Directors’ interests in the Investec plc Executive Incentive Plan 2013 at 31 March 2018 (audited) Long-term share awards granted in respect of the 2017 financial year
Name
Date of
grantExercise
price
Number of Investec plc
shares at 1 April 2017
Conditional awards
made during the
year
Balance at 31
March 2018
Perform-ance period
Period exercisable
Retention period
Treatment on termination of
employment
S Koseff 8 June 2017
Nil – 252 130 252 130 1 April 2017 to 31 March
2020
20% is exercisable on 8 June each year,
commencing on 8 June 2020 until
8 June 2024, subject to
performance criteria being
met
A further six-month
retention after vesting date
Will be pro-rated based
on service over the
performance period,
relative to the performance period of the
award, and accordingly
one third will be forfeited
B Kantor 8 June 2017
Nil – 252 130 252 130 1 April 2017 to 31 March
2020
20% is exercisable on 8 June each year,
commencing on 8 June 2020 until
8 June 2024, subject to
performance criteria being
met
A further six-month
retention after vesting date
Will be pro-rated based
on service over the
performance period,
relative to the performance period of the
award, and accordingly
one third will be forfeited
GR Burger` 8 June 2017
Nil – 227 651 227 651 1 April 2017 to 31 March
2020
20% is exercisable on 8 June each year,
commencing on 8 June 2020 until
8 June 2024, subject to
performance criteria being
met
A further six-month
retention after vesting date
Will be pro-rated based
on service over the
performance period,
relative to the performance period of the
award, and accordingly
one third will be forfeited
The remuneration policy was approved at the August 2015 annual general meeting.
On 8 June 2017, 252 130 conditional awards were awarded to S Koseff and B Kantor, and 227 651 to GR Burger. These awards formed part of their variable remuneration in respect of the financial year ending 31 March 2017. The value of these awards is reflected in the table on page 204.
The performance criteria in respect of these awards are detailed on pages 202 and 203. Vesting starts of 0% for threshold performance. These awards have not yet vested. The face value at grant for these awards was equivalent to 100% of fixed remuneration, and amounted to £1 480 000 for S Koseff and B Kantor, and £1 336 309 for GR Burger based on the average of the closing share price for Investec plc from 2 June 2017 to 7 June 2017.

(continued)
Remuneration report
Rem
uneration rep
ort
213Investec integrated annual report 2018
Directors’ interests in the Investec plc Executive Incentive Plan 2013 at 31 March 2018 (audited) Long-term share awards granted in respect of the 2018 financial year
Name
Date of
grantExercise
price
Number of Investec plc
shares at 1 April 2017
Conditional awards
made during the
year
Balance at 31
March 2018
Perform-ance
periodPeriod
exercisableRetention
period
Treatment on termination of
employment
S Koseff 31 May 2018
Nil – 264 759 264 759 1 April 2018 to 31 March
2021
20% is exercisable on 31 May each year,
commencing on 31 May 2021 until
31 May 2025, subject to
performance criteria being
met
A further six-month
retention after vesting date
Will be pro-rated based on service over the
performance period,
relative to the performance period of the
award, and accordingly two
thirds will be forfeited
B Kantor 31 May 2018
Nil – 264 759 264 759 1 April 2018 to 31 March
2021
20% is exercisable on 31 May each year,
commencing on 31 May 2021 until
31 May 2025, subject to
performance criteria being
met
A further six-month
retention after vesting date
Will be pro-rated based on service over the
performance period,
relative to the performance period of the
award, and accordingly two
thirds will be forfeited
GR Burger 31 May 2018
Nil – 239 066 239 066 1 April 2018 to 31 March
2021
20% is exercisable on 31 May each year,
commencing 31 May 2021 until 31 May
2025, subject to performance
criteria being met
A further six-month
retention after vesting date
Will be pro-rated based on service over the
performance period,
relative to the performance period of the
award, and accordingly two
thirds will be forfeited
The remuneration policy was approved at the August 2015 annual general meeting.
On 31 May 2018, 264 759 conditional awards were awarded to S Koseff and B Kantor, and 239 066 to GR Burger. These awards formed part of their variable remuneration in respect of the financial year ending 31 March 2018. The value of these awards is reflected in the table on page 204. The performance criteria in respect of these awards are detailed on pages 202 and 203. Vesting starts at 0% for threshold performance. These awards have not yet vested. The face value at grant for these awards was equivalent to 100% of fixed remuneration, and amounted to £1 480 000 for S Koseff and B Kantor, and £1 336 375 for GR Burger based on the share price for Investec plc at the time of grant.
The number of shares in issue and share prices for Investec plc and Investec Limited are provided below:Summary: Investec plc and Investec Limited share statistics
31 March 2018
31 March 2017
High over the year
Low over the year
Investec plc share price £5.50 £5.44 £6.49 £4.61
Investec Limited share price R92.28 R91.46 R105.62 R85.00Number of Investec plc shares in issue (million) 669.8 657.1Number of Investec Limited shares in issue (million) 310.7 301.2

(continued)
Remuneration report
Rem
uneration rep
ort
214 Investec integrated annual report 2018
Shareholder dilutionSummary of Investec’s share option and long-term incentive plans
EligibilityMaximum award per individual Vesting period
Options/shares
granted during the
year2
Total issued at 31 March 20183/4/5/6
Investec 1 Limited Share Incentive Plan – 16 March 2005 – Investec plc
• New and existing full-time employees
• Cumulative limit of 2 500 000 across all option plans
• Long-term incentive awards – Nil Cost Options:• Non-material Risk Takers: Vesting 75% end year four
and 25% end year five• Material Risk Takers: Vesting 75% end of three and
a half years and 25% at the end of four and a half years with six month retention
– 9 235 5060.94% of issued share capital of company
• New and existing full-time employees
• Excluding deferred bonus share awards
• Long-term share awards: forfeitable shares and Conditional Shares
• One third vesting at the end of years three, four and five for non-Material Risk Takers
5 486 220 8 655 1490.88% of issued share capital of company
• New and existing full-time employees
• In any financial year: 1x remuneration package1
• Market strike options: 25% vesting end of years two, three, four and five
94 650 281 2670.03% of issued share capital of company
Investec plc Executive Incentive Plan – 2013
• Executive management and Material Risk Takers
• Cumulative limit of 2 500 000 across all option plans
• Excluding deferred bonus share awards
• In any financial year: 1x remuneration package1
• Long-term share awards:• Junior Material Risk Takers: Vest one third at the end
of two, three and four years• FCA Designated Senior Managers: Vest one third at
the end of two, three and a half and five years• Risk Managers: Vest one third after two and a half,
three and a half and five years• Of prior year June awards, the first third vests in the
February after two years and nine months, the next third after three years and ten months and the final third after four years and three months
• PRA Designated Senior Managers: Vest 25% per annum from three to seven years
• All have a 12 month retention period thereafter, with the exception of Risk Managers who have a six month retention period
2 104 051 4 293 8660.44% of issued share capital of company
Investec Limited Share Incentive Plan – 16 March 2005 – Investec Limited
• New and existing full-time employees
• Cumulative limit of 2 500 000 across all option plans
• Long-term incentive awards: Nil Cost Options – 13 916 9681.42% of issued share capital of company• Vesting 75% at end year four and 25% at end year five
• New and existing full-time employees
• Excluding deferred bonus share awards
• Long-term share awards: forfeitable shares and Conditional shares
7 087 012 14 225 3691.45% of issued share capital of company• In any financial year:
1x remuneration package1
• Vesting one third at the end of years three, four and five
1. The limits for allocations to employees and executive management during a financial year may be exceeded if the directors determine that exceptional circumstances make it desirable that awards should be granted in excess of that limit.
2. This represents the number of awards made to all participants. For further details, see pages 57 and 58 in volume three. More details on the directors’ shareholdings are also provided in tables accompanying this report.
3. Dilution limits: Investec is committed to following the Investment Association principles of remuneration and accordingly, as from the date of the implementation of our DLC structure (29 July 2002), the maximum number of new shares which may be issued by the company under all of the share plans (in respect of grants made after July 2002) may not exceed 10% of the issued share capital of the company over a rolling 10-year period. We have, since our listing date, complied with both the 10% in 10 years guideline for discretionary and non-discretionary awards in aggregate as well as the 5% in 10 year guideline for discretionary awards. The committee regularly monitors the utilisation of dilution limits and available headroom to ensure that these guidelines are complied with. Shares issued in terms of the group’s deferred bonus scheme are paid for by the respective division at the time of the award and are not included in these dilution calculations as they have been issued for full value. The issued share capital of Investec plc and Investec Limited at 31 March 2018 was 669.8 million shares and 310.7 million shares, respectively.
4. The market price of an Investec plc share at 31 March 2018 was £5.50 (2017: £5.44), ranging from a low of £4.61 to a high of £6.49 during the financial year.5. The market price of an Investec Limited share at 31 March 2018 was R92.28 (2017: R91.46), ranging from a low of R85.00 to a high of R105.62 during
the financial year.6. The rules of these long-term incentive plans do not allow awards to be made to executive directors. The table above excludes details of the Investec plc
Executive Incentive Plan 2013 on pages 210 to 213.

(continued)
Remuneration report
Rem
uneration rep
ort
215Investec integrated annual report 2018
Directors’ remuneration – alignment of interests with shareholders (unaudited)Performance graph: total shareholder returnWe recognise that remuneration is an area of particular interest to shareholders and that in setting and considering changes to remuneration it is important that we take their views into account. Accordingly, a series of meetings are held each year with our major shareholders and shareholder representative groups. The remuneration committee chairman attends these meetings, accompanied by senior Investec employees and the group chairman. This engagement is meaningful and helpful to the committee in its work and contributes directly to the decisions made by the committee.
We have implemented a DLC structure, in terms of which we have primary listings in London and Johannesburg. The listing on the London Stock Exchange (LSE) took place on 29 July 2002. We have been listed in South Africa since 1986.
Schedule 8 of the UK Large and Medium-sized Companies and Groups (Accounts and Report) Regulations 2008 (as amended) requires this report to include a performance
graph of Investec plc’s total shareholder return (TSR) performance against that of a broad market index. A number of companies within the FTSE 350 General Finance Index conduct similar activities to us, although they do not necessarily have the same geographical profile. Nevertheless, to date this has been the most appropriate index against which to measure our performance on the LSE. Although we are not currently included in the FTSE 100, we were part of that index between 2010 and 2011 and we have included the total shareholder return of that index for illustrative purposes.
The graph below shows the cumulative shareholder return for a holding of our shares (in purple) in Pounds Sterling on the LSE, compared with the average total shareholder return of other members of the FTSE 350 General Finance Index and the FTSE 100 Index. It shows that, at 31 March 2018, a hypothetical £100 invested in Investec plc at 31 March 2009 would have generated a total return of £168 compared with a return of £320 if invested in the FTSE 350 General Finance Index and a return of £151 if invested in the FTSE 100 Index.
During the period from 1 April 2017 to 31 March 2018, the return to shareholders of Investec plc (measured in Pounds Sterling) and Investec Limited (measured in Rands) was 5.4% and 4.7%, respectively.
Source: Datastream
181716
Rebased to 100 (value £)
Investec plc (LSE listing) total shareholder return
Total shareholder return of the FTSE 350 General Finance index
Total shareholder return of the FTSE 100 index09 10 11 12 13 14 15
100
191
152
152
186
164
170
146
167 182
189
220
201
203
285
345
243
215
335
229
203
250
254
380
251
268
420
100
150
200
250
300
350
400
450
Total shareholder return
Performance graph
178
March
This compares to a 10.6% return for the FTSE 350 General Finance Index, a return of 0.2% for the FTSE 100 Index and a return of 11.0% for the JSE Top 40 Index.
The market price of our shares on the LSE was £5.50 at 31 March 2018, ranging from a low of £4.61 to a high of £6.49 during the financial year. The market price of our shares on the JSE Limited was R92.28 at 31 March 2018, ranging from a low of R85.00 to a high of R105.62 during the financial year.

(continued)
Remuneration report
Rem
uneration rep
ort
216 Investec integrated annual report 2018
Table of CEO remunerationIn addition, the table below provides an nine-year summary of the total remuneration of the CEO. For the purpose of calculating the value of the remuneration of the CEO, data has been collated on a basis consistent with the ‘single remuneration figure’ methodology as set out on page 204.
Year ended 31 March 2010 2011 2012 2013 2014 2015 2016 2017 2018
CEO single figure of total remuneration (£’000) 2 660 3 425 450 4 602 2 420 3 970 4 364 4 892 3 503
Salary, benefits, fixed allowance and bonus (£’000)* 2 660 3 425 450 1 950 2 420 3 970 2 884 3 412 3 503
Long-term incentives granted (value reflects share price multiplied by number of shares awarded at date of award)** (£’000) – – – 2 652 – – 1 480 1 480 1 480
Long-term incentives forfeited** – – – – – – – – (1 480)
% maximum of short-term incentive n/a^ n/a^ n/a^ n/a^ 50% 65% 95% 92% 95%
* The fixed allowance is granted in shares which are released over five years.** On termination of employment outstanding long-term incentive awards will be pro-rated based on time served relative to the performance period of the
award. In this regard two-thirds of the 2018 award will be forfeited and one-third of the 2017 award. Incentives awarded on 2 June 2016, 8 June 2017 and 31 May 2018 (as reflected in the March 2016, March 2017 and March 2018 information respectively) are still subject to performance conditions and have not yet vested.
^ Historically annual bonuses were not determined in terms of a formulaic approach where maximum and minimum awards could be derived.
Percentage change in the CEO’s remunerationThe table below shows how the percentage change in the CEO’s salary and annual bonus between 2017 and 2018 compares with the percentage change in each of those components of remuneration for Investec plc employees and Investec Limited employees.
Salary andbenefits
Annualbonus
CEO (in Pounds Sterling) 0.0% 4.7%
Increase in total costs for Investec plc employees (in Pounds Sterling) 9.0% 4.0%
Increase in total costs for Investec Limited employees (In Rands) 12.1% 8.2%
Ratio of CEO remuneration to average remuneration for all employees
Ratio of CEO remuneration to average remuneration for all employees1
CEO versus employees 27.15 times
1. Calculated as the CEO single figure of remuneration divided by the total personnel costs divided by the average headcount for the year.
Relative importance of spend on remunerationOur value-added statement is provided on page 14. In summary, the relative importance of remuneration and distributions to shareholders is shown below:
£’00031 March
201831 March
2017%
change
Group compensation costs 1 191 691 1 079 701 10.4%
– Fixed 773 802 690 161 12.1%
– Variable 417 889 389 540 7.3%
Dividends to shareholders 261 435 242 440 7.8%
– Ordinary shares 227 908 216 602 5.2%
– Preference shares 33 527 25 838 29.8%
(continued)
Remuneration report
Rem
uneration rep
ort
217Investec integrated annual report 2018
Statement of voting at 2017 annual general meetingThe combined results on each of the two remuneration resolutions passed at the 2017 annual general meetings of Investec plc and Investec Limited were as follows:
Number of votes cast
‘for’ resolution
% of votes ‘for’
resolution
Number of votes cast
‘against’ resolution
% of votes ‘against’
resolutionNumber of
abstentions
To approve the directors’ remuneration report 558 785 555 78% 158 582 833 22% 8 324 931
To approve the non-executive directors’ remuneration 710 110 316 98% 11 956 517 2% 3 626 365
Statement of voting at 2015 annual general meetingThe results of the resolution approving the current remuneration policy at the 2015 annual general meetings of Investec plc and Investec Limited were as follows:
Number of votes cast
‘for’ resolution
% of votes ‘for’
resolution
Number of votes cast
‘against’ resolution
% of votes ‘against’
resolutionNumber of
abstentions
To approve the directors’ remuneration policy 505 159 546 75% 167 830 111 25% 2 303 178
Additional remuneration disclosures (unaudited) South African Companies Act, 2008 disclosures In compliance with regulatory developments in South Africa, Investec Limited is required to disclose the remuneration of those individuals that are defined by the South African Companies Act, No 71 of 2008 (as amended), read together with the Companies Regulations 2011 (together the Act), as prescribed officers.
In keeping with the group’s integrated global management structure as well as the three distinct business activities of the group, i.e. Asset Management, Wealth & Investment and Specialist Banking, the prescribed officers for Investec Limited for the year ended 31 March 2018, as per the Act, are the following heads of the group’s three distinct business activities:
• Asset Management – Hendrik du Toit
• Wealth & Investment – Steve Elliott
• Specialist Banking – David van der Walt – Ciaran Whelan
Hendrik du Toit is one of the executive directors of Investec Limited and his remuneration is disclosed on page 204.
Steve Elliott is remunerated by Investec Wealth & Investment Limited (a UK domiciled company and subsidiary of Investec plc), and David van der Walt and Ciaran Whelan are employed by Investec Bank plc (a UK domiciled company and a subsidiary of Investec plc). As a result, they are not required to disclose their remuneration under the South African Companies Act.

(continued)
Remuneration report
Rem
uneration rep
ort
218 Investec integrated annual report 2018
Directors’ remuneration policy for the year ending 31 March 2019 and subsequent yearsThe directors’ remuneration policy was last approved by shareholders three years ago at the AGM in August 2015, and as such we are required to get approval from shareholders for our proposed policy at the AGM on 8 August 2018, as required by regulations.
In summary our proposed remuneration policy:
• Incorporates certain amendments which are intended to address the feedback previously received from shareholders; and
• Given the management succession it focuses on our remuneration arrangements within the year of transition.
We have consulted extensively with our key shareholders in drafting the proposed policy, and the committee believes that the proposals it has included in its proposed remuneration policy address a number of matters previously raised by shareholders, as outlined in the Statement by the remuneration committee chair on pages 185 to 187.
The committee believes that the proposed remuneration policy:
• Reduces the total remuneration paid to the new executive directors
• Introduces tougher performance targets that are weighted more towards financial measures
• Achieves a better and simpler alignment between executive remuneration and the performance of Investec
• Appropriately addresses the total level of remuneration paid in the succession transition period.
Whilst we are proposing a three year policy, the committee will keep the policy under review and assess its appropriateness, particularly in light of the executive management transition process.
Scope of our remuneration policyThe Investec group aims to apply remuneration policies to executive directors and employees that are largely consistent across the group, but recognises that certain parts of the group are governed by local regulations that may contain more onerous requirements in certain respects.
In those cases, the higher requirements are applied to that part of the group. This is relevant to Investec plc and its subsidiary companies that are subject to the PRA and FCA Remuneration Code (as a level 2 organisation as defined therein), and in particular in relation to Material Risk Takers. Additionally, where any aspect of our remuneration policy contravenes local laws or regulations, the local laws or regulations shall prevail.
The following Investec plc group entities are separately regulated by the PRA and/or FCA and as such maintain their own remuneration policies separate from the Investec group policy and in line with such entity’s own risk profile and business activities:
• Investec Asset Management Limited
• Investec Wealth & Investment Limited
• Investec Bank plc
Under the PRA and FCA Remuneration Code, Investec Bank plc is the only group entity which is classified as being level 2. It should be noted that our Asset Management and Wealth Management businesses have been classified as level 3 entities under the proportionality rules of the PRA and FCA Remuneration Code.
More details of the remuneration policies applied in each of our subsidiary companies can be found on pages 231 to 237.
Remuneration philosophyOur philosophy, which remains unchanged from prior years, is to employ the highest calibre individuals who are characterised by integrity, intellect and innovation and who adhere and subscribe to our culture, values and philosophies. We strive to inspire entrepreneurship by providing a working environment that stimulates extraordinary performance so that executive directors and employees may be positive contributors to our clients, their communities and the group.
Remuneration principlesRemuneration policies, procedures and practices, collectively referred to as the ‘remuneration policy’, are designed, in normal market conditions, to:
• Be in line with the business strategy, objectives, values and long-term interests of the Investec group
• Be consistent with and promote sound and effective risk management, and not encourage risk taking that exceeds the level of tolerated risk of the Investec group
• Ensure that payment of variable remuneration does not limit the Investec group’s ability to maintain or strengthen its capital base
• Target gross fixed remuneration (base salary and benefits including pension) at median market levels to contain fixed costs
• Ensure that variable remuneration is largely economic value added (EVA) – based and underpinned by our predetermined risk appetite and capital allocation
• Facilitate alignment with shareholders through deferral of a portion of short-term incentives into shares and long-term incentive share awards
• Target total compensation (base salary, benefits and incentives) to the relevant competitive market at upper quartile levels for superior performance.
Given our stance on maintaining a low fixed cost component of remuneration, our commitment to inspiring an entrepreneurial culture, and our risk-adjusted return on capital approach to EVA, we do not apply an upper limit on variable rewards other than in respect of Material Risk Takers (as discussed hereunder).
We reward employees generally for their contribution through:
• An annual gross remuneration package (base salary and benefits) providing an industry competitive package
• A variable short-term incentive related to performance (annual bonus)
• A long-term incentive (share awards) providing long-term equity participation
• Certain of our Material Risk Takers receive fixed monthly cash allowances (where appropriate for the role) and a commensurate reduction of variable short-term incentive.

(continued)
Remuneration report
Rem
uneration rep
ort
219Investec integrated annual report 2018
The existing CEO, MD and GRFD receive a fixed allowance in shares, as outlined in the table on page 204. The incoming executive directors will receive fixed pay, half of which will be delivered in shares, as outlined on page 223.
BenchmarksThe short-term incentive initially allocated to the CEO and pool (as reflected in our policy) was arrived at after benchmarking against the remuneration of: (i) chief executive officers, and (ii) groups of executive directors for a bespoke peer group (and sub-groups of South African and non-South African peers) comprising: Barclays Africa Group, Alliance Bernstein, Close Brothers Group, FirstRand, Julius Baer, Macquarie Group, Nedbank Group, Schroders, Standard Bank Group and Standard Life Aberdeen plc.
The levels of CEO profit share, the pool and total remuneration are more compatible with international reward levels than South African reward levels. The committee believes this is appropriate, given the complexity of Investec and the challenges involved in managing a group operating across three businesses in two core geographies.
The pool is decreased or increased by a performance multiplier comprising weightings and achievement scores within score ranges for the financial and non-financial performance measures (as discussed on pages 196 to 198).
Impact of CRD IV on executive directors’ remuneration arrangementsCRD IV is EU regulation that has been effective from 1 January 2014. The main feature of CRD IV that impacts directors’ remuneration at Investec is the application of a cap on variable remuneration that can be awarded to Material Risk Takers (including executive directors). At the 2014 annual general meeting, shareholders approved a maximum variable remuneration: fixed remuneration ratio of 2:1, which applied to variable remuneration awarded in respect of the 2015 performance year and thereafter.
This cap is defined in line with European Banking Authority (EBA) discounting rules which allow, when 25% of variable remuneration is deferred over at least five years, a slightly higher cap than 2:1, depending on the length of deferral, inflation and interest rates. This is currently 244.2% of fixed remuneration.

(continued)
Remuneration report
Rem
uneration rep
ort
220 Investec integrated annual report 2018
Executive directors’ remuneration policy table
The table below sets out the proposed remuneration policy for directors and explains each element and how it operates. This section of the report will be subject to a binding shareholder vote at our AGM on 8 August 2018.
Remuneration policy table for existing executive directors (current CEO, MD and GRFD) for the period to 31 March 2019In terms of the group’s succession announcement made on 6 February 2018, Stephen Koseff (current CEO) and Bernard Kantor (current MD) will step down from these roles on 1 October 2018. They will remain executive directors until 31 March 2019. Glynn Burger will remain as the group’s GRFD until 31 March 2019.
Purpose and link to strategy Operation
Maximum value and performance targets
Changes from prior year
Fixed remuneration
Salary
• To provide an industry competitive package so that we are able to recruit and retain the people that we need to develop our business
• Salaries reflect the relative skills and experience of, and contribution made by, the individual
• Salaries of executive directors are reviewed and set annually by the remuneration committee
• Salaries are benchmarked against relevant comparator groups.1
• Targeted at median market levels when compared with relevant comparator groups1
• Annual increases in salaries are referenced to the average increase awarded to other employees, unless the remuneration committee deems adjustments to be made relating to market factors
• None
Fixed allowances
• To provide competitive remuneration recognising the breadth and depth of the role
• Fixed allowance reviewed by the remuneration committee every three years or on a change of role
• Paid in shares
• Deferred over a five-year period with 20% being released each year
• £1 million per annum paid in shares • None
Benefits
• To provide a market competitive package
• Benefits are benchmarked against relevant comparator groups1
• Executive directors may elect to sacrifice a portion of their annual gross remuneration in exchange for benefits such as travel allowances and medical aid
• Benefits include: life, disability and personal accident insurance; medical cover; and other benefits, as dictated by competitive local market practices
• There is no maximum value but the value of benefits provided will generally be in line with market comparators
• None
Pension/provident
• To enable executive directors to provide for their retirement
• Executive directors participate in defined contribution pension/ provident schemes
• Only salaries, not fixed allowances or annual bonuses, are pensionable
• The individual can elect what proportion of fixed remuneration is allocated as their pension/provident contribution
• None
1. Refer to page 222.

(continued)
Remuneration report
Rem
uneration rep
ort
221Investec integrated annual report 2018
Executive directors’ remuneration policy table (continued)
Remuneration policy table for existing executive directors (current CEO, MD and GRFD) for the period to 31 March 2019 (continued)
Purpose and link to strategy Operation
Maximum value and performance targets
Changes from prior year
Variable remuneration
Short-term incentive
• Alignment with key business objectives
• Deferral structure provides alignment with shareholders
• Establishment of a short-term incentive pool-based on the group’s adjusted operating profit (AOP)2
• Receive 30% in cash immediately; 30% in upfront shares;
• The remaining 40% is deferred; of this portion, an amount that ensures 60% of total variable remuneration (short-term incentive plus long-term incentive) is deferred over three to seven years, vests 20% per annum commencing on the third anniversary
• The remaining portion vests equally after one and two years
• Shares must be retained for a period of 12 months after vesting
• Dividends and dividend equivalents are not earned on the deferred share portion
• The remuneration committee retains discretion to reduce the amount payable to ensure that incentives truly reflect performance and are not distorted by an unintended formulaic outcome
• Awards are subject to malus of unvested shares and clawback on the entire award
• Malus can be applied for up to seven years and clawback for up to 10 years after grant
• Based on a balanced scorecard of financial and non-financial performance measures with achievement levels that correspond with our short-term objectives3
• 80% based on financial measures comprising: – Return on risk-weighted assets
(30%); – Return on equity (30%); and
– Operating margin of the combined asset management and wealth and investment businesses (20%)
• 20% based on non-financial measures comprising: – Culture and values and
cooperation related measures (7%);
– “ESG” related measures (5%); and – Prudential and risk management
related measures (8%)• If target performance conditions
are achieved, distribution will be as follows: 0.23% of AOP to CEO; 0.23% of AOP to MD; and 0.2% of AOP to GRFD2
• The performance achievement level is 0% for threshold performance, 100% for target performance and 150% for stretch performance
• If all financial and non-financial stretch levels are met, up to 150% of the target may be awarded, subject to an overall maximum of variable remuneration (including LTIPs) being within the remuneration cap4
• The remuneration committee will review the achievement levels for the short-term incentive on an annual basis
• Performance measures reduced from nine to six; financial from five to three and non-financial from four to three
• A new financial measure that reflects the operating margin of the combined asset management and wealth and investment businesses has been introduced
• The weighting of the financial measures has been increased from 60% to 80%
• The non-financial and prudential measures have been reduced from 40% to 20%
• New non-financial measures have been included, comprising culture, values and cooperation related measures; “ESG” related measures; and prudential and risk management related measures
• The short-term incentive measures are now largely different to those used under the long-term incentive
2, 3, 4 Refer to page 222.

(continued)
Remuneration report
Rem
uneration rep
ort
222 Investec integrated annual report 2018
Executive directors’ remuneration policy table (continued)
Remuneration policy table for existing executive directors (current CEO, MD and GRFD) for the period to 31 March 2019 (continued)
Purpose and link to strategy Operation
Maximum value and performance targets
Changes from prior year
Long-term incentive
• Clear link between performance and remuneration
• Embeds alignment with shareholder returns
• Performance targets aligned with business objectives
• Non-financial measures take into account the group’s strategic and operational objectives
• Conditional awards of shares subject to performance conditions measured over three financial years
• Awards vest 20% per annum commencing on the third anniversary and ending on the seventh anniversary of grant
• Vested shares are subject to a further 12 month retention period
• Dividends and dividend equivalents are not earned on unvested shares
• Awards are subject to malus of unvested shares and clawback of vested shares
• Malus can be applied for up to seven years, and clawback for up to 10 years after grant
• The remuneration committee retains discretion to adjust the level of awards vesting to ensure that incentives truly reflect performance and are not distorted by an unintended formulaic outcome
• The existing executive directors have waived their rights to a long-term incentive award for the 2019 financial year given the succession transition
• Annual award of 100% of aggregate fixed remuneration
• Awards are subject to the following performance measures and weightings3: – Growth in tangible net asset value
per share (40%); – Return on risk-weighted
assets (35%); – Non-financial measures (25%)
• Targets for financial performance measures and non-financial measures will be set annually by the remuneration committee in advance of the award being made
• The performance achievement level is 0% for threshold performance, 100% for target performance and 150% for stretch performance
• If the stretch achievement levels for both the financial and non-financial measures are satisfied, the number of shares vesting will be increased and capped at a maximum of 135% of the number of shares awarded at the time of grant
• The non-financial measures assessment scale changes from a four point scale to a six point scale, and the maximum potential score reduces from 200% to 150% for both the financial and non-financial measures
• Clarification that all awards will be pro-rated based on time served relative to the performance period on termination of employment
Notes to the preceding table:
1. Peer group companies include Barclays Africa Group, Alliance Bernstein, Close Brothers Group, FirstRand, Julius Baer, Macquarie Group, Nedbank Group, Schroders, Standard Bank Group and Standard Life Aberdeen plc.
2. AOP defined as operating profit before taxation, goodwill, acquired intangibles and non-operating items and after non-controlling interests.3. The performance measures have been selected based on our business strategy and goals, taking into account regulations and our risk appetite
framework. Targets will be set by the committee based on a range of internal and external factors including public financial and non-financial targets, internal benchmarks and hurdles, and economic and market conditions.
4. Cap defined in line with EBA discounting rules which allow, when 25% of variable remuneration is deferred over at least five years, a slightly higher cap than 2x fixed remuneration (currently 244.2% of fixed remuneration dependent on interest rates and inflation). These limits will be in line with this EBA cap.

(continued)
Remuneration report
Rem
uneration rep
ort
223Investec integrated annual report 2018
Remuneration policy table for the incoming executive directors In terms of the group’s succession announcement made on 6 February 2018, Hendrik du Toit and Fani Titi have been appointed as Joint CEO designates with effect from 1 April 2018. Ciaran Whelan will assume the risk director role and Kim McFarland the group finance and operations director role with effect from 1 April 2019; these executive director roles will be remunerated at the same level as set out below. Further information on our succession plan is provided on page 121.
Purpose and link to strategy Operation
Maximum value and performance targets
Changes from prior year
Fixed remuneration
• To provide an industry competitive package so that we are able to recruit and retain the people that we need to develop our business
• The fixed remuneration reflects the relative skills and experience of, and contribution made by, the individual
• Delivery of half in shares to ensure alignment with shareholders
• Fixed pay award
• 50% delivered in cash, paid monthly
• 50% delivered in shares, which vest immediately but only released equally after one year and two years
• These share awards are made annually in early June each year
• The first awards for incoming executive directors will be made in August 2018 following shareholder approval of the remuneration policy
• Fixed remuneration is benchmarked against relevant comparator groups1
• Targeted at median market levels when compared with relevant comparator groups1
• Annual increases in salaries are referenced to the average increase awarded to other employees, unless the remuneration committee deems adjustments to be made relating to market factors
• Replacement of separate cash base salary and fixed allowance with single fixed pay
• Delivered half in cash and half in shares
• The total quantum for the Joint CEO designates is 90% of the salary and fixed allowance of the existing CEO and MD
• The total quantum for the other executive directors is 80% of fixed pay of the Joint CEO designates
Benefits
• To provide a market competitive package
• Benefits are benchmarked against relevant comparator groups1
• Executive directors may elect to sacrifice a portion of their annual gross remuneration in exchange for benefits such as travel allowances and medical aid
• Benefits include: life, disability and personal accident insurance; medical cover; and other benefits, as dictated by competitive local market practices
• There is no maximum value but the value of benefits provided will generally be in line with market comparators
• None
Pension/provident
• To enable executive directors to provide for their retirement
• Executive directors participate in defined contribution pension/ provident schemes
• Only the cash element of fixed remuneration, not annual bonuses, is pensionable
• The individual can elect what proportion of fixed remuneration is allocated as their pension/provident contribution
• None
1. Refer to page 225.

(continued)
Remuneration report
Rem
uneration rep
ort
224 Investec integrated annual report 2018
Executive directors’ remuneration policy table (continued)
Remuneration policy table for the incoming executive directors for the period to 31 March 2019 (continued)
Purpose and link to strategy Operation
Maximum value and performance targets
Changes from prior year
Variable remuneration
Short-term incentive
• Alignment with key business objectives
• Deferral structure provides alignment with shareholders
• Establishment of a short-term incentive pool-based on the group’s adjusted operating profit (AOP)2
• Receive 30% in cash immediately; 30% in upfront shares;
• The remaining 40% is deferred; of this portion, an amount that ensures 60% of total variable remuneration (short-term incentive plus long-term incentive) is deferred over three to seven years, vests 20% per annum commencing on the third anniversary
• The remaining portion vests equally after one and two years
• Shares must be retained for a period of 12 months after vesting
• Dividends and dividend equivalents are not earned on the deferred share portion
• The remuneration committee retains discretion to reduce the amount payable to ensure that incentives truly reflect performance and are not distorted by an unintended formulaic outcome
• Awards are subject to malus of unvested shares and clawback on the entire award
• Malus can applied for up to seven years and clawback for up to 10 years after grant
• Based on a balanced scorecard of financial and non-financial performance measures with achievement levels that correspond with our short-term objectives3
• 80% based on financial measures comprising:
– Return on risk-weighted assets (30%);
– Return on equity (30%); and
– Operating margin of the combined asset management and wealth and investment businesses (20%)
• 20% based on non-financial measures comprising:
– Culture and values and cooperation related measures (7%);
– ESG related measures 5%; and
– Prudential and risk management related measures (8%)
• If target performance conditions achieved, distribution will be as follows: 0.23% of AOP to each of the Joint CEO designates; 0.18% to each of the other executive directors2
• The performance achievement level is 0% for threshold performance, 100% for target performance and 150% for stretch performance
• If all financial and non-financial stretch levels are met, up to 150% of the target may be awarded, subject to an overall maximum of variable remuneration (including LTIPs) being within the remuneration cap4
• The remuneration committee will review the achievement levels for the short-term incentive on an annual basis
• Performance measures reduced from nine to six; financial from five to three and non-financial from four to three
• A new financial measure that reflects the operating margin of the combined asset management and wealth and investment businesses has been introduced
• The weighting of the financial measures has been increased from 60% to 80%
• The non-financial and prudential measures have been reduced from 40% to 20%
• New non-financial measures have been included, comprising culture, values and cooperation related measures, “ESG” related measures and prudential and risk management related measures
• The short-term incentive measures are now largely different to those used under the long-term incentive
2, 3, 4 Refer to page 225.

(continued)
Remuneration report
Rem
uneration rep
ort
225Investec integrated annual report 2018
Executive directors’ remuneration policy table (continued)
Remuneration policy table for the incoming executive directors for the period to 31 March 2019 (continued)
Purpose and link to strategy Operation
Maximum value and performance targets
Changes from prior year
Variable remuneration
Long-term incentive
• Clear link between performance and remuneration
• Embeds alignment with shareholder returns
• Performance targets aligned with business objectives
• Non-financial measures take into account the group’s strategic and operational objectives
• Conditional awards of shares subject to performance conditions measured over three financial years
• Awards vest 20% per annum commencing on the third anniversary and ending on the seventh anniversary of grant
• Vested shares are subject to a further 12 month retention period
• Dividends and dividend equivalents are not earned on unvested shares
• Awards are subject to malus of unvested shares and clawback of vested shares
• Malus can be applied for up to seven years, and clawback for up to 10 years after grant
• The remuneration committee retains discretion to adjust the level of awards vesting to ensure that incentives truly reflect performance and are not distorted by an unintended formulaic outcome
• These long-term incentive awards are made annually following the completion of the financial year
• Annual award of 100% of aggregate fixed remuneration
• Awards are subject to the following performance measures and weightings3:
– Growth in tangible net asset value per share (40%);
– Return on risk-weighted assets (35%);
– Non-financial measures (25%)
• Targets for financial performance measures and non-financial measures will be set annually by the remuneration committee in advance of the award being made
• The performance achievement level is 0% for threshold performance, 100% for target performance and 150% for stretch performance
• If the stretch achievement levels for both the financial and non-financial measures are satisfied, the number of shares vesting will be increased and capped at a maximum of 135% of the number of shares awarded at the time of grant
• The non-financial measures assessment scale changes from a four point scale to a six point scale, and the maximum potential score reduces from 200% to 150% for both the financial and non-financial measures
• Clarification that all awards will be pro-rated based on time served over the measurement period
Notes to the preceding table:1. Peer group companies include Barclays Africa Group, Alliance Bernstein, Close Brothers Group, FirstRand, Julius Baer, Macquarie Group, Nedbank
Group, Schroders, Standard Bank Group and Standard Life Aberdeen plc.2. AOP defined as operating profit before taxation, goodwill, acquired intangibles and non-operating items and after non-controlling interests.3. The performance measures have been selected based on our business strategy and goals, taking into account regulations and our risk appetite
framework. Targets will be set by the committee based on a range of internal and external factors including public financial and non-financial targets, internal benchmarks and hurdles, and economic and market conditions.
4. Cap defined in line with EBA discounting rules which allow, when 25% of variable remuneration is deferred over at least five years, a slightly higher cap than 2x fixed remuneration (currently 244.2% fixed remuneration dependent on interest rates and inflation). These limits will be in line with this EBA cap.

(continued)
Remuneration report
Rem
uneration rep
ort
226 Investec integrated annual report 2018
How will executive directors’ performances be assessed?
The short-term and long-term incentives are subject to performance conditions.
A detailed explanation of these performance measures is provided on pages 220 to 225.
The performance measures have been selected taking into account:
• Key stakeholders’ requirements (including shareholders and regulators) which were assessed through extensive consultations on the matter
• The preference of the committee and the board is for a range of financial and non-financial measures that ensure an appropriate balance between measures which drive profitability and prudential measures. In addition, the remuneration committee believes that it is right to include non-financial measures in determining levels of awards as directors should be incentivised to attend to important matters on which the long-term performance of the company depends, but which cannot in any one performance period be directly linked to financial returns.
Differences between the remuneration policy of the executive directors and the policy for all employeesWe apply consistent remuneration principles and philosophies across the whole employee population and are cognisant of these when considering executive directors’ remuneration. The quantum of salary and benefits paid to executive directors is benchmarked against appropriate comparator groups (as discussed on page 219), however, the annual increase in such remuneration is referenced to the average increase awarded to employees in South Africa and the UK, respectively. Although this has not been the case of late, the remuneration committee may, under certain circumstances, make adjustments outside these parameters, particularly in cases when there have been large adjustments in the comparator group referenced.
As is the case with other employees, the short-term incentive is performance-based, however, there are a number of specific performance criteria that apply in the case
of determining the annual bonus for the executive directors. Short-term incentives for executive directors and employees defined as Material Risk Takers are subject to deferral, malus and clawback requirements. The specific remuneration structural requirements of CRD IV are only applicable to the executive directors and to some employees in the UK Specialist Bank who are classified as Material Risk Takers.
More details of the approach to employee remuneration can be found on pages 231 to 237.
Policy for the recruitment of new executive directorsIt is intended that the approach to the recruitment of new executive directors will be in line with the current remuneration policy for executive directors as outlined above and below. However, the remuneration committee will consider levels of remuneration for new recruits that are competitive for the skills and experience of the individual being recruited. The treatment of each element of remuneration on recruitment will be as set out below.
Element Commentary Maximum value
Fixed pay Determined by market conditions, market practice and ability to recruitIf fixed pay below market level on recruitment or promotion, remuneration committee may realign fixed pay over transitional period with higher than normal increases
In line with policy
Pension In line with normal policy: these are agreed deductions from fixed pay 15% of salary
Other benefits Offered in line with normal policy: these are agreed deductions from fixed pay In line with policy
STI In line with normal policy 150% of fixed remuneration subject to remuneration cap*
LTIP In line with normal policy135% of fixed remuneration subject to remuneration cap*
Buy-outs The remuneration committee can buy out a bonus or incentive awards that the new executive director has forfeited as a result of accepting the appointment, subject to proof of forfeiture where applicableAs required by the PRA and FCA Remuneration Code, any award made to compensate for forfeited remuneration should be broadly no more generous than, and should aim to mirror the value, timing, form of delivery and performance adjustment (malus and clawback) conditions of the forfeited remuneration
* Cap defined in line with EBA discounting rules which allow, when 25% of variable remuneration is deferred over at least five years, a slightly higher cap than 2x fixed remuneration (currently 244.2% of fixed remuneration dependent on interest rates and inflation). These limits will be in line with this EBA cap.

(continued)
Remuneration report
Rem
uneration rep
ort
227Investec integrated annual report 2018
Service contracts and terms of employmentThe terms of service contracts and provision for compensation for loss of office for executive directors is set out below.
Executive directors
Indefinite service contracts of employment, terminable by either party with six months’ written notice
Fixed pay, benefits and pension payable for period of notice
No provision for compensation payable on early termination
Outstanding deferred short-term incentive shares or long-term incentive awards lapse on resignation or termination for gross misconduct
Deferred share awards may be retained if the director is considered a ‘good leaver’ (e.g. retirement with a minimum of 10 years’ service, disability or ill health)
On termination of employment outstanding long-term incentive awards may be retained if the director is considered a ‘good leaver’ and will be pro-rated based on time served relative to the performance period of the award
In the event of a takeover or major corporate event, the remuneration committee has the discretion to determine whether all outstanding awards vest at the time of the event or whether they continue in the same or revised form
Executive directors are required to build and maintain a shareholding of 200% of the cash element of fixed remuneration over a reasonable timeframe.
Executive directors are permitted to accept outside appointments on external boards or committees provided these are not deemed to interfere with the business of the company. Any fees earned by executives in this regard are forfeited to Investec.
Copies of the service contracts are available for inspection at the company’s registered office.
The terms of appointment for non-executive directors are set out below.
On appointment non-executive directors are provided with a letter of appointment. On the recommendation of the nominations and directors affairs’ committee (nomdac), non-executive directors will be appointed for an expected term of nine years (three times three-year terms) from the date of their first appointment to the board. No compensation is payable on termination of directorship. Copies of their letters of appointment are available for inspection at the company’s registered office.
How does executive directors’ remuneration change based on performance?Illustrative scenarios for the incoming executive directors’ remuneration
The charts on page 228 show the potential value of the remuneration arrangements under this policy in three performance scenarios:
• ‘Minimum’ – fixed remuneration only
• ‘At target’ – fixed remuneration and the ‘at target’ variable short-term annual incentive and ‘at target’ value of any long-term incentives that may be awarded
• ‘At stretch’ – fixed remuneration and the ‘stretch’ achievement levels that may be awarded for variable short-term annual incentive and ‘stretch’ value of any long-term incentives that may be awarded.
The scenarios do not reflect share price movement between award and potential vesting, nor are any dividends or dividend equivalents taken into account.
For the incoming executive directors based on the remuneration policy proposed for the year ending 31 March 2019:
• Fixed remuneration includes fixed pay, company pension contributions and benefits receivable (i.e. as proposed for the year ending 31 March 2019). Fixed remuneration is paid partly in cash and partly in shares
• Target variable short-term incentive is 0.23% each for the Joint CEO designates and 0.18% each for the other executive directors of adjusted operating profit (after total non-controlling interests) based on £583.7 million as reported for the financial year ended 31 March 2018 and maximum variable short-term incentive is 150% of target (subject to an overriding maximum in terms of
the remuneration cap as approved by shareholders and depending on the length of deferral, inflation and interest rates; the current maximum is variable remuneration of 244.2% of fixed remuneration)
• Target long-term incentive is equal to one times fixed remuneration. Maximum long-term incentive is 135% of target (subject to an overriding maximum in terms of the remuneration cap as approved by shareholders and depending on the length of deferral, inflation and interest rates; the current maximum is variable remuneration of 244.2% of fixed remuneration)

(continued)
Remuneration report
Rem
uneration rep
ort
228 Investec integrated annual report 2018
Minimum At target At stretch
£’000
0
1 000
2 000
3 000
4 000
5 000
6 000
Salary and bene�ts Long-term incentive Short-term incentive
4 006ˆ
5 144ˆ ˆ
1 332 1 332 1 332
1 3321 798
1 342
2 014
100% 33% 26%
33%35%
34%
39%
Illustrative payouts for the new Joint CEOs
Remuneration cap applied at £4 585kVariable pay cap* at a max of 244.2% of fixed pay
Fixed pay
Variable pay
Minimum At target At stretch
£’000
0
1 000
2 000
3 000
4 000
5 000
Salary and bene�ts Long-term incentive Short-term incentive
3 182ˆ
4 081ˆ ˆ
1 066 1 066 1 066
1 0661 439
1 050
1 576
100% 33% 26%
33%35%
34%
39%
Total compensation costs for New Executive Director (Risk DirecorDesigante) and Group Financial Director designate
Remuneration cap applied at £3 668kVariable pay cap* at a max of 244.2% of fixed pay
Fixed pay
Variable pay
Illustrative payouts for the Joint CEOsThe graph below illustrates the total remuneration at the target and stretch achievement levels for the Joint CEOs.
Illustrative payouts for the other incoming executive directorsThe graph below illustrates the total remuneration at the target and stretch achievement levels for the other incoming executive directors.
* Cap defined in line with EBA discounting rules which allow, when 25% of variable remuneration is deferred over at least five years, a slightly higher cap than 2x fixed remuneration, depending on the length of deferral, inflation and interest rates. This is currently 244.2% of fixed remuneration. These limits will be in line with this cap.
^ Based on operating profit earned at 31 March 2018 and assuming that the “at target” achievement level is achieved for each financial and non-financial measure in the proposed short-term and long-term schemes.
^^ Based on operating profit earned at 31 March 2018 and assuming that the “at stretch” achievement level is achieved for each financial and non-financial measure in the proposed short-term and long-term schemes.

(continued)
Remuneration report
Rem
uneration rep
ort
229Investec integrated annual report 2018
Proposed remuneration payout pro�le for Joint CEOs
33%of total
34%of total
33%of total
LTI
Fixed pay
STI
Equal to 100% of �xed pay. Paid entirely in shares.
Subject to performance criteria and malus and
clawback provisions
Max c.144% of �xed pay. Subject to performance
criteria and malus and clawback provisions
% of total remuneration received in each year
Equal vesting over years three to seven, subject to 12 month retention period
30% upfront in cash; 30% upfront in shares; remaining 40% deferred over period in line with UK pay regulations and 12 month retention
50% in cash; and 50% in shares vesting on award but released over two years
Base year i.e. current
ˆ Based on operating pro�t earned at 31 March 2018 and assuming that the “at target” achievement level is achieved for each �nancial and non-�nancial measure in the proposed short-term and long-term schemes.
*£4 006 482ˆ
shares
shares
cash
cash
shares
shares
shares
shares
shares
shares
0 +1 +2 +3 +4 +5 +6 +7
36.7% 11.6% 11.6% 8.0% 8.0% 8.0% 8.0% 8.1%
26.7% of total remuneration received in cash in base year; with 73.3% remaining remuneration deferred in shares
The graph below illustrates the timing of payments for each component of total reward.
Comparison of overall executive directors’ compensation costsThe tables below summarise the total spend for members of the executive board before, during and after the management succession transition period.
Year ended 31 March 2018
Total compensationUSING CURRENT
SCHEME£’000
Year ending 31 March 2019
Total compensationESTIMATE^^“AT TARGET
ACHIEVEMENT LEVELS”USING PROPOSED
SCHEME£’000
Year ending 31 March 2020
Total compensationESTIMATE^^“AT TARGET
ACHIEVEMENT LEVELS”USING PROPOSED
SCHEME£’000
CEO^ 4 983 Joint CEO 4 006 Joint CEO 4 006
MD^ 4 983 Joint CEO 4 006 Joint CEO 4 006
GRFD^ 4 431 Outgoing CEO 2 151 Director of risk 3 182
IAM CEO 6 088 Outgoing MD 2 151 Director of finance,
Total 20 485 GRFD 2 503 operations and IT 3 182
New executive director 3 182 Total 14 376
Total 17 999(-12% change from 2018)
(-30% change from 2018)
^ These amounts reflect remuneration prior to deducting the value of long-term incentives that will be forfeited, as explained on page 204. This is to ensure a like-for-like comparison.
^^ Based on operating profit earned for the year ended 31 March 2018 and assuming that the “at target” achievement level is achieved for each financial and non-financial measure in the proposed short-term incentive scheme.

(continued)
Remuneration report
Rem
uneration rep
ort
230 Investec integrated annual report 2018
Remuneration policy for non-executive directorsThe board’s policy is that fees should reflect individual responsibilities and membership of board committees. The increase in non-executive directors’ fees for the forthcoming year reflects current market conditions and additional time commitment required. Their fee structure covers the dual roles that the directors perform for the UK-listed Investec plc and the South African-listed Investec Limited boards and are awarded equally between the two companies. There are no proposed changes to the overall policy.
Purpose and link to strategy Operation Maximum value and performance targets
Non-executive directors’ remuneration
Fees
To provide industry competitive fees to attract non-executive directors with appropriate skills and experience
• Fees of non-executive directors are reviewed annually by the board taking into account market data and time commitment
• The fee structure covers the dual roles that the directors perform for the UK-listed Investec plc and the South African-listed Investec Limited boards
• In addition to fees for board membership, fees are payable to the senior independent director, and for chairmanship and membership of major DLC board committees, membership of the Investec Bank Limited and Investec Bank plc and other subsidiary company boards and for attendance at certain committee meetings
• Fee increases will generally be in line with inflation and market rates
• Aggregate fees payable by Investec plc are subject to an overall maximum of £1 million under the Investec plc articles unless specifically approved by shareholders
• Refer to page 203 for further information
Note: South Africa Value-Added Tax (VAT), at the prevailing rate, where applicable, will be added to the fees payable by Investec Limited. Two binding general rulings were issued by the South African Revenue Service (SARS) confirming the South African Value-Added Tax (VAT) law requires non-executive directors of companies to register for and charge VAT in respect of any directors’ fees earned for services rendered as a non-executive director that exceed the prescribed threshold with effect from 1 June 2017.
Fees are also payable for any additional time committed to the group, including attendance at certain other meetings.
There is no requirement for non-executive directors to hold shares in a group company. The group has left this choice to the discretion of each non-executive director.
The policy as described above will be taken into account in the recruitment of new non-executive directors.
Copies of the letters of appointment are available for inspection at the company’s registered office.
(continued)
Remuneration report
Rem
uneration rep
ort
231Investec integrated annual report 2018
Shareholder and employee viewsShareholder views in the consideration of executive directors’ remuneration arrangementsWe recognise that remuneration is an area of particular interest to shareholders and shareholder representative bodies, and that in setting and considering changes to remuneration, it is important that we take their views into account. Accordingly, we meet regularly with our major shareholders and shareholder representative groups. The remuneration committee chairman attends these meetings, accompanied by senior Investec employees and the group chairman. This engagement is meaningful and helpful to the committee in its work and contributes directly to the decisions made by the committee.
The remuneration committee and the board believe in effective and transparent communication with key stakeholders, and will continue to engage on matters that may arise and are of importance and/or concern to stakeholders.
Statement of consideration of employment conditions elsewhere in the groupThe remuneration policy of executive directors has been drawn up in line with our group wide remuneration philosophy and principles (refer below), subject to the requirements of CRD IV. The committee is mindful of the remuneration arrangements across the group.
Additional remuneration disclosures (unaudited)Remuneration policy and principles for employeesOur policy with respect to the remuneration of employees has remained unchanged during the year ending 31 March 2018. Investec Bank plc currently has 56 Material Risk Takers, of which a number receive a fixed monthly cash allowance where appropriate for the role.
All remuneration payable (salary, benefits and incentives) is assessed at a group, business unit and individual level. This framework seeks to balance both financial and non-financial measures of performance to ensure that the appropriate factors are considered prior to making awards, and
that the appropriate mix of cash and share-based awards are made.
We reward employees generally for their contribution through:
• An annual gross remuneration package (base salary and benefits) providing an industry competitive package
• A variable short-term incentive related to performance (annual bonus)
• A long-term incentive (share awards) providing long-term equity participation
• Certain of our Material Risk Takers receive fixed monthly cash allowances (where appropriate for the role) and a commensurate reduction of variable short-term incentive
• The CEO, MD and GRFD received a fixed allowance in shares, as outlined in the table on page 204.
• The incoming executive directors will receive a fixed pay award of cash and shares.
We consider the aggregate of the above as the overall remuneration package designed to attract, retain, incentivise and drive the behaviour of our employees over the short, medium and longer term in a risk-conscious manner. Overall, rewards are considered as important as our core values of work content (greater responsibility, variety of work and high level of challenge) and work affiliation (entrepreneurial feel to the company and unique culture) in the attraction, retention and motivation of employees.
We have a strong entrepreneurial, merit and values-based culture, characterised by passion, energy and stamina. The ability to live and perpetuate our culture and values in the pursuit of excellence in a regulated industry and within an effective risk management environment is considered paramount in determining overall reward levels.
The type of people the organisation attracts, and the culture and environment within which they work, remain crucial in determining our success and long-term progress. Our reward programmes are clear and transparent, designed and administered to align directors’ and employees’ interests with those of all stakeholders and ensure the group’s short-, medium- and long-term success. Our reward programmes also recognise potential in our people.
We target total compensation (base salary, benefits and incentives) to the relevant competitive market at upper quartile levels for superior performance.
Given our stance on maintaining a low fixed cost component of remuneration, our commitment to inspiring an entrepreneurial culture, and our risk-adjusted return on capital approach to EVA, we do not apply an upper limit on variable rewards other than in respect of executive directors and other Material Risk Takers (as discussed on page 219).
The fixed cost component of remuneration is, however, designed to be sufficient so that employees do not become dependent on their variable compensation as we are not contractually (and do not consider ourselves morally) bound to make variable remuneration awards. Investec has the ability to pay no annual bonuses and make no long-term incentive awards should the performance of the group or individual employees require this.
We do not pay remuneration through vehicles that facilitate avoidance of applicable laws and regulations.
Furthermore, employees must undertake not to use any personal hedging strategies or remuneration or liability-related contracts of insurance to undermine the risk alignment effects embedded in their remuneration arrangements. Group Compliance maintains arrangements designed to ensure that employees comply with this policy.
No individual is involved in the determination of his/her own remuneration rewards and specific internal controls and processes are in place to prevent conflicts of interest between Investec and its clients from occurring and posing a risk to the group on prudential grounds.
In summary, we recognise that financial institutions have to distribute the return from their enterprises between the suppliers of capital and labour and the societies in which they do business, the latter through taxation and corporate social responsibility activities. Our group wide remuneration philosophy seeks to maintain an appropriate balance between the interests of these stakeholders, and is closely aligned to our culture and values which include risk consciousness, meritocracy, material employee ownership and an unselfish contribution to colleagues, clients and society.
Determination of remuneration levelsQualitative and quantitative considerations form an integral part of the determination of overall levels of remuneration and total compensation for each individual.

(continued)
Remuneration report
Rem
uneration rep
ort
232 Investec integrated annual report 2018
Factors considered for overall levels of remuneration at the level of the group include:
• Financial measures of performance:
– Risk-adjusted EVA model
– Affordability.
• Non-financial measures of performance:
– Market context
– Specific input from the group risk and compliance functions.
Factors considered to determine total compensation for each individual include:
• Financial measures of performance
– Achievement of individual targets and objectives
– Scope of responsibility and individual contributions.
• Non-financial measures of performance
– Alignment and adherence to our culture and values
– The level of cooperation and collaboration fostered
– Development of self and others
– Attitude displayed towards risk consciousness and effective risk management
– Adherence to internal controls procedures
– Compliance with the group’s regulatory requirements and relevant policies and procedures, including treating customers fairly
– The ability to grow and develop markets and client relationships
– Multi-year contribution to performance and brand building
– Long-term sustained performance
– Specific input from the group risk and compliance functions
– Attitude and contribution to sustainability principles and initiatives.
Remuneration levels are targeted to be commercially competitive, on the following basis:
• The most relevant competitive reference points for remuneration levels are based on the scope of responsibility and individual contributions made
• The committee recognises that we operate an international business and compete with both local and international competitors in each of our markets
• Appropriate benchmark, industry and comparable organisations’ remuneration practices are reviewed regularly
• For employees generally, combinations of firms from the JSE Financial 15 and the FTSE 350 General Finance sector have offered the most appropriate benchmarks
• In order to avoid disproportionate packages across areas of the group and between executives, adjustments may be made at any extremes to ensure broad internal consistency. Adjustments may also be made to the competitive positioning of remuneration components for individuals, in cases where a higher level of investment is needed in order to build or grow or sustain either a business unit or our capability in a geography.
The following section outlines our remuneration policy in more detail for each element of total compensation as it applies to employees.
Gross remuneration: base salary and benefitsSalaries and benefits are reviewed annually and reflect the relative skills and experience of, and contribution made by, the individual. It is the group’s policy to seek to set base salaries and benefits (together known as gross remuneration) at median market levels when compared like for like with peer group companies.
The human resources division provides guidelines to business units on recommended salary levels for all employees within the organisation to facilitate the review. These guidelines include a strategic message on how to set salary levels that will aid Investec in meeting its objectives while remaining true to corporate values, and incorporate guidance on increasing levels to take account of the change in the cost of living over the year to ensure that salary levels always allow employees to afford a reasonable standard of living and do not encourage a reliance on variable remuneration.
Advisers are often engaged by either the human resources division or the business units to obtain general benchmark information or to benchmark specific positions to ensure that gross remuneration levels are market-driven and competitive so that levels of remuneration do not inhibit our ability to recruit the people we need to develop our business.
Benefits are targeted at competitive levels and are delivered through flexible and tailored packages. Benefits include pension schemes; life, disability and personal accident insurance; medical cover; and other benefits, as dictated by competitive local market practices. Only salaries, not annual bonuses or Material Risk Takers’ role based allowances, are pensionable.
Variable short-term incentive: annual bonusAll employees are eligible to be considered for a discretionary annual bonus, subject inter alia to the factors set out above in the section dealing with the determination of remuneration levels. The structure of short-term incentives varies between employees of our three operating divisions: Asset Management, Wealth & Investment and the Specialist Bank. This reflects differing regulatory requirements on the different legal entities and also differing competitive pressures in each distinct market.
Specialist Banking: variable short-term incentiveRisk-weighted returns form basis for variable remuneration levels
In our ordinary course of business we face a number of risks that could affect our business operations, as highlighted on pages 42 to 48.
Group risk management is independent from the business units and monitors, manages and reports on the group’s risk to ensure it is within the stated risk appetite as mandated by the board of directors through the board risk and capital committee (BRCC). The group monitors and controls risk exposure through credit, market, liquidity, operational and legal risk divisions/forums/committees.
Risk consciousness and management is embedded in the organisational culture from the initiation of transactional activity through to the monitoring of adherence to mandates and limits and throughout everything we do.
The BRCC (comprising both executive and non-executive directors) meets six times per annum and sets the overall risk appetite for the Investec group and determines the categories of risk, the specific types of risks and the extent of such risks which the group should undertake, as well as the mitigation of risks and overall

(continued)
Remuneration report
Rem
uneration rep
ort
233Investec integrated annual report 2018
capital management and allocation process. Senior members of the group’s risk management teams, who provide information for the meeting packs and present and contribute to the committee’s discussions, attend these meetings.
The DLC capital committee is a sub-committee of the BRCC and provides detailed input into the group’s identification, quantification and measurement of its capital requirements, taking into account the capital requirements of the banking regulators. It determines the amount of internal capital that the group should hold and its minimum liquidity requirements, taking into account all the associated risks plus a buffer for any future or unidentified risks. This measure of internal capital forms part of the basis for determining the variable remuneration pools of the various operating business units (as discussed above).
The policy executive risk review forum (Policy ERRF) and review executive risk review forum (Review ERRF), comprising members of the executive and the heads of the various risk functions, meet weekly. These committees responsibilities include approving limits and mandates, ensuring these are adhered to and that agreed recommendations to mitigate risk are implemented.
The bank’s central credit and risk forums provide transaction approval independent of the business unit on a deal-by-deal basis. The riskiness of business undertaken is evaluated and approved prior to initiation of the business through various central forums and committees, deal forum, credit committee, investment committee and new product forum and is reviewed and ratified at review ERRF and policy ERRF on a regular basis. These central forums provide a level of risk management by ensuring that risk appetite and various limits are being adhered to and that an appropriate interest rate and, by implication, risk premium is built into every approved transaction. The approval of transactions by these independent central forums ensures that every transaction undertaken by the group results in a contribution to profit that has already been subject to some risk adjustment.
Our EVA model as described in detail below is principally applied to realised profits against predetermined targets above risk and capital weighted returns. In terms of the EVA structure, capital is allocated based on risk and therefore the higher the risk, the
higher the capital allocation and the higher the hurdle return rate required. This model ensures that risk and capital management are embedded in key processes at both a group and transaction level, which form the basis of the group’s performance-related variable remuneration model, thus balancing the interests of all stakeholders.
Further, both the risk and compliance functions are also embedded in the operating business units and are subject to review by the internal audit and compliance monitoring teams. The risk and compliance functions also provide, on an exception-only basis, information relating to the behaviour of individuals and business areas if there has been evidence of non-compliance or behaviour which gives rise to concerns regarding the riskiness of business undertaken.
EVA model: allocation of performance-related bonus poolOur business strategy and associated risk appetite, together with effective capital utilisation, underpin the EVA annual bonus allocation model.
Business units share in the annual bonus pool to the extent that they have generated a realised return on their allocated risk-adjusted capital base in excess of their target return on equity. Many of the potential future risks that the firm may face are avoided through ensuring that the bonus pools are based on actual realised risk-adjusted profits.
The bonus pools for non-operating business units (central services and head office functions) are generated partly by a levy payable by operating businesses on their operating profit, and is supplemented by a discretionary allocation as determined by the executive directors, and agreed by the remuneration committee.
Our EVA model has been consistently applied for a period of about 19 years and encompasses the following elements:
• The profitability of each operating business unit is determined as if they are a stand-alone business. Gross revenue is determined based on the activity of the business, with arm’s length pricing applicable to inter-segment activity. Profits are determined as follows:
– Realised gross revenue (net margin and other income)
– Less: Funding costs
– Less: Impairments for bad debts
– Add back: Debt coupon or preference share dividends paid out of the business (where applicable)
– Less: Direct operating costs (personnel, systems, etc.)
– Less: Group-allocated costs and residual charges (certain independent group functions are provided on a centralised basis, with an allocation model applied to charge out costs incurred to business units. Costs allocated are based on the full operational costs for the particular central service area, inclusive of the variable remuneration cost of the central service. Allocation methodologies generally use cost drivers as the basis of allocation)
– Less: Profits earned on retained earnings and statutory held capital
– Add: Notional profit paid by centre on internal allocated capital
– Equals: Net profit
• Capital allocated is a function of both regulatory and internal capital requirements, the risk assumed within the business and our overall business strategy
• The group has always held capital in excess of minimum regulatory requirements, and this principle is perpetuated in our internal capital allocation process. This process ensures that risk and capital discipline is embedded at the level of deal initiation and incorporates independent approval (outside of the business unit) of transactions by the various risk and credit committees.
A detailed explanation of our capital management and allocation process is provided on pages 78 to 83 in volume two.
• Internal capital comprises the regulatory capital requirement taking into account a number of specified risks plus a capital buffer which caters, inter alia, for any unspecified or future risks not specifically identified in the capital planning process. The Investec group then ensures that it actually holds capital in excess of this level of internal capital
• Internal capital is allocated to each business unit via a comprehensive analysis of the risks inherent within that business and an assessment of the costs of those risks
• Hurdle rates or targeted returns are determined for each business unit based

(continued)
Remuneration report
Rem
uneration rep
ort
234 Investec integrated annual report 2018
on the weighted average cost of capital (plus a buffer for trading businesses to take into account additional risks not identified in the capital allocation process) applied to internal capital
• Targeted returns differ by business unit reflecting the competitive economics and shareholder expectation for the specific area of the business, and are set with reference to the degree of risk and the competitive benchmarks for each product line
• In essence, varying levels of return are required for each business unit reflecting the state of market maturity, country of operation, risk, capital invested (capital intensive businesses) or expected expense base (fee-based businesses)
• Growth in profitability over time will result in an increasing bonus pool, as long as it is not achieved at the expense of capital efficiency
• Target returns must be reflective of the inherent risk assumed in the business. Thus, an increase in absolute profitability does not automatically result in an increase in the annual bonus pool. This approach allows us to embed risk and capital discipline in our business processes. These targets are subject to annual review
• The group’s credit and risk forums provide transaction approval independent of the business unit on a deal-by-deal basis adding a level of risk consciousness to the predetermined (and risk-adjusted) capital allocation and required hurdle rates and thus ensure that each transaction generates a return that is commensurate with its associated risk profile.
In terms of our EVA process, if business and individual performance goals are exceeded, the variable element of the total remuneration package is likely to be substantially higher than the relevant target benchmark. This ensures that overall remuneration levels have the potential to be positioned at the upper quartile level for superior performance, in line with our overarching remuneration policy.
In circumstances where an operating business unit does not have an EVA pool (e.g. when it incurs a loss or when it is a start-up), the executive directors may consider a discretionary allocation to allow for a modest bonus for those staff who were expected to contribute to the longer-term interests of that business unit or the
group, despite the lack of EVA profits in the short term, e.g. control functions, support staff and key business staff.
It should be noted the salaries and proposed bonuses for employees responsible for risk, internal audit and compliance are not based on a formulaic approach and are independent of any revenues or profits generated by the business units where they work. The level of rewards for these employees are assessed against the overall financial performance of the group; objectives based on their function; and compliance with the various non-financial aspects referred to above.
Key elements of the bonus allocation process are set out below:
• A fixed predetermined percentage of any return in excess of the EVA hurdle accrues to the business units’ EVA pool
• A portion of the total EVA pool is allocated towards the bonus pool for central service and head office employees
• These bonus pools are reviewed regularly by the appropriate management and non-executive committees to ensure that awards are only paid when it is appropriate to do so, considering firm-wide performance against non-financial risk (both current and future) and compliance-based objectives and in order to ensure that the payment of such discretionary bonuses does not inhibit the group’s ability to maintain/raise its capital levels. All users of capital operate within a strict philosophical framework that requires a balancing of risk and reward and that is designed to encourage behaviour in the interests of all stakeholders as opposed to just employees
• The EVA pools are calculated centrally by the group’s finance function and subject to audit as part of the year-end audit process
• Line managers in each business unit will make discretionary bonus recommendations for each team member taking into consideration qualitative and quantitative criteria (as mentioned above)
• Bonus recommendations are then subject to an extensive geographic review involving human resources, local management and local remuneration committees
• Thereafter, these recommendations are subject to a global review by
executive management before the remuneration committee’s review and approval process.
The group remuneration committee specifically reviews and approves the individual remuneration packages of the executive directors, persons discharging managerial responsibilities, and Material Risk Takers. The committee also reviews the salaries and performance bonuses awarded to a number of other senior and higher paid employees across the group. In addition, the committee specifically reviews and approves the salaries and performance bonuses awarded to each employee within the Internal Audit, Compliance and Risk functions, both in the business units and in the central functions, ensuring that such packages are competitive and are determined independently of the other business areas. In making these decisions the committee relies on a combination of external advice and supporting information prepared internally by the group.
Deferral of annual bonus awards: other than Material Risk Takers within the Specialist BankAll annual bonus awards exceeding a predetermined hurdle level are subject to 60% deferral in respect of that portion that exceeds the hurdle level. The deferred amount is awarded in the form of: short term share awards vesting in three equal tranches over a period of approximately three years; or cash released in three equal tranches over a period of approximately three years. Where shares are being awarded to employees as part of the deferral of performance bonus awards, these are referred to as short-term share awards. The entire amount of the annual bonus that is not deferred is payable upfront in cash.

(continued)
Remuneration report
Rem
uneration rep
ort
235Investec integrated annual report 2018
Deferral of variable remuneration awards: UK Material Risk Takers within the Specialist Bank• Material Risk Takers include senior
management, risk takers, staff engaged in certain central functions and any other employees whose professional activities have a material impact on Investec’s risk profile within Investec plc
• Individual awards to Material Risk Takers are determined based on EVA pools in the same manner as is applicable to all staff (as set out above), and subject to the group remuneration policy and governance processes (also set out above)
• Annual bonus awards to Material Risk Takers (excluding executive directors who are employees of a separately regulated firm) and all annual bonus awards where total variable remuneration exceeds £500 000 are subject to 60% deferral
• All other annual bonus awards to Material Risk Takers are subject to 40% deferral
• The 40% not deferred in the former instance or the 60% not deferred in the latter instance will be awarded all in cash
• The upfront short-term share awards will vest immediately, but will only be released after a period of 12 months
• Variable remuneration awards for Material Risk Takers who are not exempted by the de minimis concession are subject to 40% deferral (60% if total variable remuneration exceeds £500 000) after taking into account the value of share awards granted to each staff member in the applicable financial year and which are included in deferred variable remuneration. The deferred portion of discretionary awards to Material Risk Takers will, at the election of the staff member, be made either entirely in the form of short-term share awards, or 50% in short-term share awards and 50% in cash
• All deferrals in the form of short-term share awards (being either 50% or 100% of such deferral) vest over periods of up to seven years and are then subject to an appropriate period of retention, being 12 months, for all Material Risks Takers, with the exception of Risk Managers, for which it is six months.
IAM: variable incentiveThe Investec Asset Management (IAM) remuneration committee is responsible for considering, agreeing and overseeing all elements of remuneration and the overall remuneration philosophy, principles and policy of IAM. The proposals from this committee are subject to final approval by the DLC remuneration committee.
IAM operates the following annual bonus schemes which may result in annual payments to employees:
• Annual Discretionary Cash Bonus Scheme (ADCBS) (all employees of IAM are currently eligible to be considered for a cash bonus payment under this scheme)
• Deferred Bonus Plan (DBOP)(participation in this scheme is determined on an annual basis at the discretion of IAM based on the roles of individual employees).
The percentage of profit allocated to the variable remuneration pool has been agreed (at a fixed participation rate) and approved by both the DLC and IAM remuneration committees. The same fixed participation rate has been applied consistently for many years. This structure has been a key contributor to the long-term success of IAM and encourages the staff to behave like owners. We believe in aligning the long-term interests of clients, shareholders and staff.
Individual annual bonus awards are approved by the IAM remuneration committee and the DLC remuneration committee annually.
Annual Discretionary Cash Bonus Scheme (ADCBS)Awards under the ADCBS are payable entirely in cash. The purpose of the cash bonus is to reward behaviour and effort against objectives and values, and retain key employees. The cash bonus pool determination is based on the profitability of IAM only. In principle, there would be no cash bonus payments should IAM be loss-making (although this would be reviewed where it was considered that bonus payments were necessary in order to retain staff and protect the business in the long-term even if the business had been loss-making in the short-term).
Management information is provided to the IAM remuneration committee to ensure that IAM’s financial results are put into the context of the risk appetite of the business
and the IAM remuneration committee is able to risk-adjust the cash bonus pool should they believe this is required given the risk taken and the overall financial results.
Deferred Bonus Plan (DBOP)As noted above, participation in the DBOP is determined on an annual basis at the discretion of IAM based on the roles of individual employees. The purpose of the DBOP is both to retain key employees and to provide better alignment of the interests with clients and to manage potential, currently unknown future risks.
The conditions for participation in the DBOP are approved by the IAM remuneration committee annually, based on the remuneration requirements in the year being considered. This will take into consideration local market remuneration practices and relevant and required regulations.
The DBOP awards are made in the form of investments into various funds managed by IAM and with specific allocations for the portfolio managers into their own funds. The deferral period is just over three years and awards are only paid out under specific listed conditions. The award does not accrue to the employee until the end of the deferral period and as such both the asset and liability remain on the balance sheet of IAM until that time. Employees forfeit their allocations if they resign or their employment terminates (other than at the discretion of IAM for redundancy, retirement, death or disability) prior to the vesting date.
Payments can only be made to participants prior to a scheduled vesting date with the consent of the IAM executive committee and ultimately by the IAM remuneration committee.
IAM’s governance processes, operating within the context of the broader Investec group’s processes, ensure robust oversight of reward and effective management of any potential conflicts of interest while reflecting the need to link remuneration decisions with IAM’s risk appetite.
The head of the IAM Risk Committee assesses the risk appetite, risk tolerance level and risk management for IAM and feeds her views into the remuneration decision-making process, including sending a risk report to the IAM remuneration committee for consideration when making remuneration decisions. IAM HR and Compliance are responsible for ensuring that remuneration processes are compliant with applicable regulations.

(continued)
Remuneration report
Rem
uneration rep
ort
236 Investec integrated annual report 2018
In addition, IAM HR and Compliance are responsible for ensuring that the IAM remuneration committee takes into consideration financial and non-financial criteria, risk and compliance reports, and any other relevant information in making decisions around remuneration.
The primary determinant of the variable compensation pool available for distribution is IAM’s own annual profit. There is an annual budget against which the business is measured.
The variable compensation pool is allocated to business divisions and then to individuals based on divisional performance and the individual’s performance. This ensures that staff are rewarded appropriately for meeting their objectives and keeping within the values of the business.
The oversight of conflicts of interest and the link between risk and reward is achieved through a combination of effective remuneration components, designed to incorporate risk and of the dual operation of the DLC remuneration committee and IAM remuneration committee in ensuring appropriate and, where necessary, independent oversight of both remuneration policy and outcomes.
Employee equity ownershipIn August 2013, 40 employees of IAM acquired a 15% stake in the IAM business, ultimately through a trust structure in which each employee owns a portion of the underlying trust assets. This stake has since increased to 18%. Each employee funded their portions through a combination of existing deferred compensation (for which vesting was accelerated), personal debt and personal cash. This structure locks in key talent and aligns employees’ interests with the interests of the firm as a whole, our shareholders and our clients.
Employees’ portion holdings are governed by the terms of a trust deed to which all portion holders have agreed. In summary, various pre-emption provisions apply to the transfer of employees’ portions. On leaving, an employee is required to offer their portions for sale (save in limited circumstances where part of the portion holding may be retained). Good leaver/bad leaver provisions apply to determine the price at which the portions must be offered for sale.
Hendrick du Toit and Kim McFarland are participants in the trust. Given the potential conflicts of interest inherent in this given their newly appointed executive roles, it is our intention that this situation is resolved by 30 September 2018.
Investec Wealth & Investment in the UK: variable short-term incentiveInvestec Wealth & Investment recognises Investec’s obligation to ensure that all businesses within the group satisfy their obligations under the PRA and FCA Remuneration Code. Wealth & Investment recognises that the policy, procedures and practices it has adopted should not conflict with the group’s obligations under the PRA and FCA Remuneration Code. The Wealth & Investment remuneration committee is responsible for considering, agreeing and overseeing all elements of remuneration and the overall remuneration philosophy and policy of Wealth & Investment within the context of the Investec group’s agreed remuneration philosophy and policy. The proposals from this committee are subject to final approval by the DLC remuneration committee.
Wealth & Investment operates the following performance-related discretionary remuneration plans:
• Core incentive plan – for those in client-facing roles and administrative staff who support them directly
• Bonus plan – for those in non-client-facing, central services and support functions
• Growth plan – for staff primarily in client-facing roles who generate income directly.
Funding is at the discretion of the remuneration committee. Under the core incentive plan, an incentive pool is derived from a formula that is directly related to the profitability of a team or business unit. The pool is distributed to the members of the team or business unit on a discretionary basis.
Funding for the bonus plan is related to the overall profitability of the Wealth & Investment business and is awarded to individuals on a discretionary basis.
The growth plan incentivises growth in revenues, net of the impact of market movements. Awards relate to performance for each year to 28 February, are payable in cash, and are deferred over a three-year period. Payments do not attract employer pension contributions.
Under the core incentive and bonus plans, awards relate to performance for the financial year ending 31 March. An interim payment on account of the annual award is considered at the half-year.
Non-financial performance is reviewed, and where individuals fall below the standards expected, awards may be deferred or forfeited, in part or in full. Payments are made entirely in cash and do not attract employer pension contributions. The award may be paid directly to the individual (subject to the deduction of income tax and national insurance) or, at Wealth & Investment discretion, as an additional employer pension contribution.
Wealth & Investment executive directors participate in the bonus plan, and where an individual’s role is primarily client-facing that director will also be eligible to participate in the core incentive and growth plans.
Investec Wealth & Investment South Africa: variable short-term incentiveAs there are no overriding regulatory requirements applicable to the business, the policies applicable to the Specialist Bank are applied to this business unit as set out on pages 232 to 234.
Other information on deferred awards and clawback provisions within the groupEmployees who leave the employment of Investec prior to vesting of deferred incentive awards will lose their deferred bonus short term share awards other than as a result of death and disability, subject to the group’s normal good leaver provisions and approval process in exceptional cases.
The deferred share awards for Material Risk Takers are subject to malus and clawback adjustments. The assessment of whether any malus adjustment should be made to an individual’s unvested award will be undertaken within the following framework:
• Where there is reasonable evidence of employee misbehaviour
• Where the firm or operating business unit suffers a material downturn in its financial performance
• Where the firm or business unit suffers a material failure of risk management.
In these cases, management and the remuneration committee will take into account the following factors in determining the extent (if any) to which the quantum of deferred awards should be subject to clawback:
• The extent to which the individual had control over the outcome
• Failure of internal control systems

Remuneration report
Rem
uneration rep
ort
237Investec integrated annual report 2018
(continued)
• The impact of the risk profile of the relevant member of the group or business unit
• Any violation of the group’s culture and values
• The long-term impact of the outcome on the group or relevant business unit
• External factors including market conditions
• Any other relevant factors.
Specifically for deferred bonus share awards, where profits used to determine the original EVA bonus are materially reduced after the bonus determination, the awards will be recalculated for such reduction and consideration given to clawback (if any) to the extent that the prior period’s EVA pool is reduced and the extent to which it affected each employee.
The deferred share awards of non-Material Risk Takers are subject to malus adjustments.
Long-term incentive: share awardsWe have a number of share option and long-term share incentive plans that are designed to align the interests of employees with those of shareholders and long-term organisational interests, and to build material share ownership over the long term through share awards. These share option and incentive plans are also used in appropriate circumstances as a mechanism for retaining the skills of key talent.
Awards are made in the form of forfeitable share awards for non-Material Risk Takers other than for countries where the taxation of such awards is penal. In these cases awards are made in the form of conditional awards or market strike options.
Awards are made in the form of conditional awards for Material Risk Takers.
In principle all employees are eligible for long-term incentives. Awards are considered by the remuneration committee and made only in the 42-day period following the release of our interim or final financial results in accordance with the Investment Association principles of remuneration. These awards comprise three elements, namely:
• ‘New starter’ awards are made based on a de facto non-discretionary basis using an allocation table linked to salary levels
• ‘General allocation’ awards are also de facto non-discretionary awards of the same quantum as new starter awards and are made to employees who have not had any other share award in a three-year period
• ‘Top up’ awards are made at the discretion of line management primarily to ensure multi-year performance and long-term value generation.
All proposed long-term incentive awards are recommended by business unit management, approved by the staff share executive committee and then the remuneration committee before being awarded. Awards of Investec plc forfeitable shares, or conditional shares where appropriate, are made to employees of Investec plc and awards of Investec Limited forfeitable shares for employees of Investec Limited. At IAM, long-term awards are only generally considered for employees who do not participate in the DBOP and/or the IAM equity ownership scheme.
Forfeitable shares for non-Material Risk Takers are subject to one-third vesting after approximately three, four and five years, which we believe is appropriate for our business requirements. Long-term incentive awards to Material Risk Takers are subject to performance conditions and to vesting over a period of two and a half to five years, or three to seven years, determined by regulatory requirements, and are then subject to a 12 month retention period, with the exception of Risk Managers, for which it is six months. The awards are forfeited on termination, but ‘good leaver’ discretion is applied in exceptional circumstances.
Retention is addressed through the long-term nature of awards granted, which provides an element of ‘lock-in’ for employees throughout the vesting period and allows for multi-year contribution to performance and brand building.
Other remuneration structures
Guaranteed variable remunerationGuaranteed variable remuneration comprises all forms of remuneration whose value can be determined prior to award. This includes, but is not limited to sign-on, buy-out and guarantee awards. Guaranteed variable awards will not be awarded, paid or provided to any individual within the group unless they are:
• Exceptional
• In the context of hiring new staff
• Limited to the first year of service.
The remuneration committee pre-approve all guaranteed awards above a defined threshold, and has oversight of all other guaranteed awards above a lower defined threshold.
Retention awardsInvestec only pays retention awards to serving staff in exceptional circumstances. In all such cases, human resources shall review proposed payments to ensure that they are in line with this policy and any other relevant regulation. Additionally, for Material Risk Takers and those above a particular threshold, the remuneration committee shall review and approve all proposed awards. Circumstances where the group will consider making retention awards include the case of a major restructuring of the company or any subsidiary or one of its business units (for instance in the start-up of a new business line, or the closure of a business line) where the retention of individuals is essential to the completion of the task. A valid business case for the retention of the individual must be presented in order for a retention award to be approved and the PRA should be notified prior to the retention award being made to Material Risk Takers, and should consider seeking guidance on the appropriateness of retention awards for certain individuals.
Severance awardsSeverance payments for the early termination of a contract are at executive management’s absolute discretion and must reflect performance achieved over time and be designed in a way that does not reward failure. Severance payments for Material Risk Takers shall be subject to approval by the DLC remuneration committee.
Discretionary extended pension benefits policyAll proposed extended pension payments made to employees upon reaching retirement will be reviewed by the remuneration committee for alignment with appropriate laws, policy and regulation.

(continued)
Remuneration report
Rem
uneration rep
ort
238 Investec integrated annual report 2018
Hourly and bonus pay gap
Investec plc Investec Limited
Mean % Median % Mean % Median %
Hourly gap 40.3 41.2 34.4 29.3
Bonus gap 73.9 74.1 73.3 34.1
Mean – The mean figure represents the difference between the average of men's and women's pay expressed as a percentage of the average male pay.Median – The median represents the difference between the midpoints in the ranges of men's and women's pay expressed as a percentage of the male midpoint.
Proportion receiving a bonusInvestec plc Investec Limited
Percentage Percentage
Male 82.3 78.1
Female 83.8 78.3
• We are progressing towards a working environment that is more agile and responsive to the needs of all individuals, with flexible work arrangements encouraged where appropriate
• In terms of diversity, we commit to equal compensation on a like-for-like basis
• We will work proactively to rebalance our organisation in line with the societies in which we operate by empowering communities through entrepreneurship and education, and leveraging the value in our diversity
• We will measure and track progress annually
• We will work towards achieving our targets through concrete actions (refer to pages 239 and 240).
Investec gender pay gap resultsThe Investec group’s (comprising Investec plc and Investec Limited) gender pay gap statistics are shown below.
The below data is based on a snapshot of hourly rates of pay in the pay period encompassing 5 April 2017, and bonuses paid during the 12 months to 5 April 2017.
The methodology utilised is based on the UK gender pay gap legislation but differs slightly where local practices dictate, and where required to more accurately reflect the gap at Investec.
Diversity and inclusion, including gender pay gap reporting
ForewordAt Investec, we are committed to attracting, developing and retaining a diverse team of people. A diverse workforce is essential to our ability to be an innovative organisation that is able to adapt and prosper in a fast changing world. We recognise the benefits of a diverse workforce being able to contribute alternative perspectives and challenge the status quo, which is integral to the Investec culture.
We seek to be a positive influence in all our core businesses and in each of the societies in which we operate. Embedded in our corporate responsibility philosophy is that we are an organisation that lives in society, not off it. We do this by empowering communities through entrepreneurship and education, and leveraging the value in our diversity. We believe that this will ensure the best outcome for all stakeholders. We want to be a company that does the right thing by its people and the places where we operate.
We are confident that across our organisation men and women are paid equally for doing the same job. Our gender pay gap occurs primarily because there is a lower proportion of women in senior leadership and revenue-generating roles which attract higher market levels of pay.
We are dedicated to improving this in line with our commitment to promoting diversity. We know that while we have worked to address greater representation of women, we have more to do. We have established targets and have the measures in place needed to meet these as set out in this report. We are committed to advancement and holding ourselves publicly accountable.
The details of our 2017 gender pay gap are set out below. We have published information for our three UK employing entities, Investec Bank plc; Investec Wealth & Investment UK and Investec Asset Management Limited as part of the UK government's requirements for all UK companies with over 250 employees to report their gender pay gap. This information is provided on our website. Further information for the Investec group is provided alongside.
What is the gender pay gap?Gender pay gap legislation was introduced in the UK to encourage employers to make greater advances in addressing the disparity of earnings between men and women over their careers. The gender pay gap measures the difference between the
average amounts men and women are paid across all of our employee categories.
This is different from Equal Pay legislation in the UK which requires individuals to be paid equally for performing work of equal value. We would like to make clear that we give men and women equal pay for the same roles and have appropriate practices in place to ensure fairness, which are regularly reviewed by our remuneration committee.
Our diversity principlesWhile we have actively tried to increase the diversity of our senior leadership, we recognise that across our organisation we have more work to do. That is why we have put together our own set of diversity principles to help define the framework for that journey. These apply across the global business and while this report is specifically about the Gender Pay Gap in the UK, our diversity principles apply to all our efforts, including transformation in South Africa.
• We believe in the importance and benefits of diversity and foster a culture that is supportive and inclusive of different perspectives and experiences
• As a global specialist bank and asset manager, diversity ensures that we represent the diversity of our global client base
• Our commitment to diversity is fundamentally about ‘doing the right thing’

(continued)
Remuneration report
Rem
uneration rep
ort
239Investec integrated annual report 2018
Proportion of men and women within each pay quartileEach quartile represents an equal number of employees
Investec plc
Upper
Upper middle
Lower middle
Lower
81%
69%
50%
38%
19%
31%
50%
62%
Male Female
Investec UK gender pay gap results The official UK gender pay gap results, required under the UK gender pay gap legislation are published on our website.
Why does Investec have a gender pay gap?The gender and bonus pay gaps are calculated on averages across the whole of an organisation and do not take into consideration factors such as the type of role and level of seniority. Our gender gap occurs primarily because there is a higher proportion of women in junior roles and a lower proportion of women in senior leadership, revenue-generating and client-facing roles. The pay levels and higher ratio
of variable to fixed remuneration for these senior roles magnifies the pay and bonus gaps. We are confident that men and women are paid fairly and equitably relative to their role, skills and experience, and this is central to our reward philosophy.
All of our employees are eligible to receive a discretionary bonus. Our reward structure is performance linked and gender-neutral by design. Employees are typically eligible for a bonus after a minimum period of employment has been completed. The key reason for differences between the percentage of men and women receiving a bonus is due to the timing of new hires and whether the minimum period of employment has been completed prior to our financial year end.
We acknowledge that we have a gender pay gap and are committed to making material progress in narrowing this gap. We are taking steps to achieve greater female representation in senior leadership and client facing roles within the organisation and are dedicated to reducing the gender pay and bonus differential over time.
How are we addressing our gender pay gap?Across our organisation we are committed to ensuring that women fulfil their career ambitions. We recognise that addressing the gender pay gap will take time, and we have established a number of initiatives in order to achieve our aspirational goals and targets.
Investec Limited
Upper
Upper middle
Lower middle
Lower
64%
43%
31%
43%
36%
57%
69%
57%
Male Female

Rem
uneration rep
ort
240 Investec integrated annual report 2018
(continued)
Remuneration reportRemuneration report
Commitment to our core values Our core philosophies value diversity and respect for individuals. We endeavour to prevent and/or eliminate any form of discrimination based on gender, race, religion, age and sexual preference. We support and respect the protection of internationally proclaimed human rights standards and welcome the legislated UK Modern Slavery Act 2015. We have various processes to encourage debate and dialogue around appreciating diversity and different cultures.
Gender balanced recruitment We are taking a proactive approach to ensure that we are able to attract as diverse a pool of candidates as possible. For example, we are committed to balanced and diversified shortlists for all open roles. We believe this gives us a better chance of hiring the best person for the role. We are working with both internal and external recruiters to ensure that shortlists and interview panels are appropriately balanced. We also work hard to ensure that our graduate recruitment focuses on building a diverse and balanced pipeline of talent for our business.
Learning and development We invest significantly in a number of opportunities for developing and upskilling employees and in leadership programmes to develop current and future leaders of the group. Investec’s HR learning and development team is mandated to develop and retain people who can perform extraordinarily in support of business objectives in a manner consistent with Investec’s culture and values. We support a number of external learning programmes and have developed many internal learning programmes.
We are creating ways to deliver mentoring across the group. Our aim is to support our colleagues, in particular, in shaping and progressing their careers. Investec Inspire is a network for women at Investec which enables the exchange of knowledge and experiences in order to improve the opportunities for career success.
Family-friendly policies and work practicesWe have a number of policies and practices that help to balance family needs. We are also progressing towards a more agile environment, with flexible work encouraged where appropriate.
Diversity awareness programmesWe are implementing a range of internal diversity awareness programmes. We have piloted our “Zebra Crossing” initiative for senior leaders and the Investec Inspire executive committee, and are extending it to a broader audience. The Zebra Crossing initiative explores the complexities of diversity at a personal, interpersonal and an institutional level. We want our people to think deeply about diversity and inclusion and understand how decisions and behaviours are driven.
Measurement and accountabilityTo help us measure the pace of change, we have set a number of goals and targets. The group has signed up to the 30% Club in both South Africa and the UK promoting female board representation. We also support the target of 33% female representation on the board by 2020, as oer the Hampton-Alexander Review. Having a diverse board is a clear benefit, bringing with it distinct and different outlooks, alternative viewpoints, and challenging mindsets
Each of our UK employing entities have adopted their own specific targets in order to reinforce our commitment to gender diversity:• Investec Bank plc and Investec Wealth & Investment UK have signed up to the Women in Finance Charter and in doing
so have committed to: having a senior executive team member responsible for diversity and inclusion; meeting set targets for diversity; publishing progress reports annually; and linking pay of senior executives to delivery of these targets
• Investec Asset Management have publically committed to achieving a target of 30% of women in senior leadership by 2023 and beyond
Experience shows that genuine progress can take longer to achieve than we might otherwise like. We believe that these measures are realistic. Progress against our objectives will be reviewed regularly by the relevant executive management and boards.

Rem
uneration rep
ort
241Investec integrated annual report 2018
Remuneration report
PRA and FCA Remuneration Code and Pillar III disclosures
In terms of the PRA’s Chapter on Disclosure Requirements and Part 8 of the Capital Requirements Regulation the bank in the UK is required to make certain quantitative and qualitative remuneration disclosures on an annual basis with respect to Material Risk Takers.
Material Risk Takers are defined as those employees (including directors) whose professional activities could have a material impact on the bank’s risk profile. A total of 56 individuals were Material Risk Takers in 2018.
The bank’s qualitative remuneration disclosures are provided on pages 185 to 237.
The information contained in the tables below sets out the bank’s quantitative disclosures in respect of Material Risk Takers for the year ended 31 March 2018.
Aggregate remuneration by remuneration type awarded during the financial year
Senior management
Other Material
Risk Takers Total
Fixed remuneration 14.9 10.7 25.6
– Cash 11.9 10.7 22.6
– Shares 3.0 – 3.0
Variable remuneration* 19.8 10.4 30.2
– Cash 4.8 3.0 7.8
– Deferred cash 1.3 1.7 3.0
– Deferred shares 5.4 2.3 7.7
– Deferred shares – long-term incentive awards** 8.3 3.4 11.7
Total aggregate remuneration and deferred incentives (£’million) 34.7 21.1 55.8
Number of employees*** 25 25 50
Ratio between fixed and variable pay 0.8 1.0 0.8
* Total number of employees receiving variable remuneration was 48.** Value represents the number of shares awarded multiplied by the applicable share price. These awards were made during the period but have not yet
vested. These awards are subject to performance conditions and vest over a period of two and a half to four and a half years, up to three to seven years, determined by regulatory requirements. They are also subject to a six or 12 month retention period after vesting.
*** This excludes non-executive directors.
Material Risk Takers received total remuneration in the following bands:
Numberof Material
Risk Takers
£800 000 – £1 200 000 10
£1 200 001 – £1 600 000 10
£1 600 001 – £2 000 000 3
£2 000 001 – £2 400 000 –
£2 400 001 – £2 800 000 –
£2 800 001 – £3 200 000 1
£3 200 001 – £3 600 000 1
£3 600 001 – £4 000 000 1
£4 000 001 – £4 400 000 –
£4 400 001 – £4 800 000 1
£4 800 001 – £5 200 000 2
> £5 200 001 –
(continued)

Rem
uneration rep
ort
242 Investec integrated annual report 2018
(continued)
Remuneration report
Additional disclosure on deferred remuneration
£’millionSenior
management
Other Material
Risk Takers Total
Deferred unvested remuneration outstanding at the beginning of the year 22.9 34.7 57.6
Deferred unvested remuneration adjustment – employees no longer Material Risk Takers and reclassifications (0.9) (0.4) (1.3)
Deferred remuneration awarded in year 15.0 7.4 22.4
Deferred remuneration reduced in year through performance adjustments – – –
Deferred remuneration reduced in year through malus and clawback adjustments^^ – – –
Deferred remuneration vested in year (4.7) (12.7) (17.4)
Deferred unvested remuneration outstanding at the end of the year 32.3 29.0 61.3
^^ All employees are subject to malus and clawback provisions as discussed on page 234. No remuneration was reduced for ex post implicit adjustments during the year.
£’millionSenior
management
Other Material
Risk Takers Total
Deferred unvested remuneration outstanding at the end of the year
– Equity 29.6 24.1 53.7
– Cash 2.7 4.9 7.6
32.3 29.0 61.3
£’millionSenior
management
Other Material
Risk Takers Total
Deferred remuneration vested in year
– For awards made in 2016 financial year 1.1 1.3 2.4
– For awards made in 2015 financial year 2.2 4.4 6.6
– For awards made in 2014 financial year 1.4 7.0 8.4
4.7 12.7 17.4
Other remuneration disclosures
£’millionSenior
management
Other Material
Risk Takers Total
Sign-on payments
Made during the year (£’million) – – –
Number of beneficiaries – – –
Severance payments
Made during the year (£’million) – 0.2 0.2
Number of beneficiaries – 1.0 1.0
Guaranteed bonuses
Made during the year (£’million) – – –
Number of beneficiaries – – –

Rem
uneration rep
ort
243Investec integrated annual report 2018
Remuneration report(continued)
Pillar lll remuneration disclosures
The bank in South Africa is required to make certain quantitative and qualitative remuneration disclosures on an annual basis in terms of the South African Prudential Authority’s Basel Pillar III disclosure requirements.
The bank’s qualitative remuneration disclosures are provided on pages 185 to 237.
The information contained in the tables below sets out the bank’s quantitative disclosures for the year ended 31 March 2018.
In the tables below senior management are defined as members of our South African general management forum, excluding executive directors. Material risk takers are defined as anyone (not categorised above) who is deemed to be responsible for a division/function (e.g. lending, balance sheet management, advisory and transactional banking activities) which could be incurring risk on behalf of the bank. Furthermore, financial and risk control staff are defined as everyone in central group finance and central group risk as well as employees responsible for Risk and Finance functions within the operating business units.
Aggregate remuneration by remuneration type awarded during the financial year
Senior management
Material risk
takers
Financial and risk control
staff Total
Fixed remuneration (all cash based and no portion is deferred) 50.6 50.8 198.3 299.7
Variable remuneration* 266.1 203.4 187.0 656.5– Cash 94.1 85.6 101.6 281.3– Deferred shares 59.7 52.2 10.0 121.9– Deferred cash 25.2 – – 25.2– Deferred shares – long-term incentive awards** 87.1 65.6 75.4 228.1Total aggregate remuneration and deferredincentives (R’million) 316.7 254.2 385.3 956.2
Number of employees 19 21 242 282
Ratio of fixed and variable pay 0.19 0.25 1.1 0.46
* Total number of employees receiving variable remuneration was 274.** Value represents the number of shares awarded multiplied by the applicable share price. These awards were made during the period but have not yet
vested. These vest one third at the end of years three, four and five.
Additional disclosure on deferred remuneration
R’millionSenior
management
Material risk
takers
Financial andrisk control
staff Total
Deferred unvested remuneration outstanding at the beginning of the year 462.0 424.9 199.9 1 086.8
Deferred unvested remuneration adjustment – employees that are no longer employed by the bank and reclassifications 77.0 (94.5) 118.8 101.3
Deferred remuneration awarded in year 172.0 117.8 85.4 375.2
Deferred remuneration reduced in year through performance adjustments – – – –
Deferred remuneration reduced in year through malus adjustments – – – –
Deferred remuneration vested in year (200.9) (123.2) (117.4) (441.5)
Deferred unvested remuneration outstanding at the end of the year 510.1 325.0 286.7 1 121.8
R’millionSenior
management
Material risk
takers
Financial andrisk control
staff Total
Deferred unvested remuneration outstanding at the end of the year
– Equity 433.1 325.0 286.7 1 044.8
– Cash 77.0 – – 77.0
510.1 325.0 286.7 1 121.8

(continued)
Remuneration report
244 Investec integrated annual report 2018
R’millionSenior
management
Materialrisk
takers
Financial andrisk control
staff Total
Deferred remuneration vested in year
– For awards made in 2017 financial year 23.4 14.7 1.5 39.6
– For awards made in 2016 financial year 22.2 15.7 2.7 40.6
– For awards made in 2015 financial year 67.3 45.4 30.6 143.3
– For awards made in 2014 financial year 79.3 43.7 75.2 198.2
– For awards made in 2013 financial year 8.7 3.7 7.4 19.8
200.9 123.2 117.4 441.5
Other remuneration disclosures: special payments
R’millionSenior
management
Materialrisk
takers
Financial andrisk control
staff Total
Sign-on payments
Made during the year (R’million) – 2.7 – 2.7
Number of beneficiaries – 1 – 1
Severance payments
Made during the year (R’million) 3.2 1.9 – 5.1
Number of beneficiaries 1 1 – 2
Guaranteed bonuses
Made during the year (R’million) – 2.7 – 2.7
Number of beneficiaries – 1 – 1
Rem
uneration rep
ort

245Investec integrated annual report 2018
Defi
nitions
Definitions
Adjusted earnings per ordinary share before goodwill, acquired intangibles and non-operating itemsRefer to page 61 in volume three
Adjusted shareholders’ equityRefer to calculation on page 66
Core loans and advancesNet loans and advances to customers plus net own originated securitised assets
Refer to calculation on page 35 in volume two
Cost to income ratioOperating costs divided by operating income (net of depreciation on leased assets). Depreciation on operating leased assets has been netted off against operating income
Dividend coverAdjusted earnings per ordinary share before goodwill and non-operating items divided by dividends per ordinary share
Earnings attributable to ordinary shareholders before goodwill, acquired intangibles and non-operating items (i.e. adjusted earnings)Refer to page 61 in volume three
Effective operational tax rateTax on profit on ordinary activities (excluding non-operating items) divided by operating profit (excluding share of post taxation profit of associates)
Market capitalisationTotal number of shares in issue (including Investec plc and Investec Limited) multiplied by the closing share price of Investec plc on the London Stock Exchange
Net tangible asset value per shareRefer to calculation on page 64
Non-operating itemsReflects profits and/or losses on termination, restructuring or disposal of group operations and acquisitions made
Operating profitOperating income less operating costs, impairment losses on loans and advances and depreciation on operating leased assets. This amount is before goodwill, acquired intangibles and non-operating items
Operating profit per employeeRefer to calculation on page 70
Annuity incomeNet interest income plus net annuity fees and commissions expressed as a percentage of total operating income
Return on average adjusted shareholders’ equityRefer to calculation on page 66
Return on average adjusted tangible shareholders’ equityRefer to calculation on page 66
Return on risk-weighted assetsAdjusted earnings divided by average risk-weighted assets
Risk-weighted assetsCalculated as the sum of risk-weighted assets for Investec plc and Investec Limited (converted into Pounds Sterling) as reflected on page 64
Staff compensation to operating income ratio*All staff compensation costs expressed as a percentage of operating income
Third party assets under managementIncludes third party assets under administration managed by the Wealth & Investment, Asset Management and Property businesses
Total capital resourcesIncludes shareholders’ equity, subordinated liabilities, Other Additional Tier 1 securities in issue and non-controlling interests
Total equityTotal shareholders’ equity including Other Additional Tier 1 securities in issue and non-controlling interests
Weighted number of ordinary shares in issueThe number of ordinary shares in issue at the beginning of the year increased by shares issued during the year, weighted on a time basis for the period during which they have participated in the income of the group less treasury shares. Refer to calculation on page 61 in volume three
* Investec Asset Management (IAM) operates schemes for staff whose bonuses are deferred into collective investment schemes that are managed by IAM. Any resulting profit or loss arising from these schemes is attributable to the employee in respect of whom the investment was made. As such, any rise or fall in the value of the assets held is offset to an equal but opposite degree by the change in the liability (expense) to the employee. Therefore the profit or loss on these investments and the corresponding expense to employees are offset in arriving at the staff compensation ratio for IAM and hence for the group as a whole.

246 Investec integrated annual report 2018
Co
rpo
rate inform
ation
Corporate information
Investec plc and Investec LimitedSecretary and registered office
Transfer secretaries in South AfricaComputershare Investor Services Proprietary LimitedRosebank Towers15 Biermann AvenueRosebank 2196PO Box 61051Marshalltown 2107Telephone (27) 11 370 5000
Sponsors
Investec Bank Limited100 Grayston DriveSandown Sandton 2196PO Box 785700 Sandton 2146
Directorate Refer to page 133.
Contact details For contact details for Investec offices internationally refer to pages 143 and 146 in volume three.
Investec plcDavid Miller30 Gresham StreetLondon EC2V 7QPUnited KingdomTelephone (44) 20 7597 4000Facsimile (44) 20 7597 4491
Investec LimitedNiki van Wyk100 Grayston DriveSandown Sandton 2196PO Box 785700 Sandton 2146Telephone (27) 11 286 7000Facsimile (27) 11 286 7966
Internet addresswww.investec.com
Registration number
Investec plcRegistration number 3633621
Investec LimitedRegistration number 1925/002833/06
AuditorsErnst & Young LLPErnst & Young Inc.
Registrars in the UKComputershare Investor Services plcThe PavilionsBridgwater RoadBristol BS99 6ZZUnited KingdomTelephone (44) 370 707 1077

247Investec integrated annual report 2018
No
tes
Notes

248 Investec integrated annual report 2018
No
tes
Notes