1H and 13C NMR signal assignment of synthetic (-)-methyl thyrsiflorin B acetate, (-)-thyrsiflorin C...
4
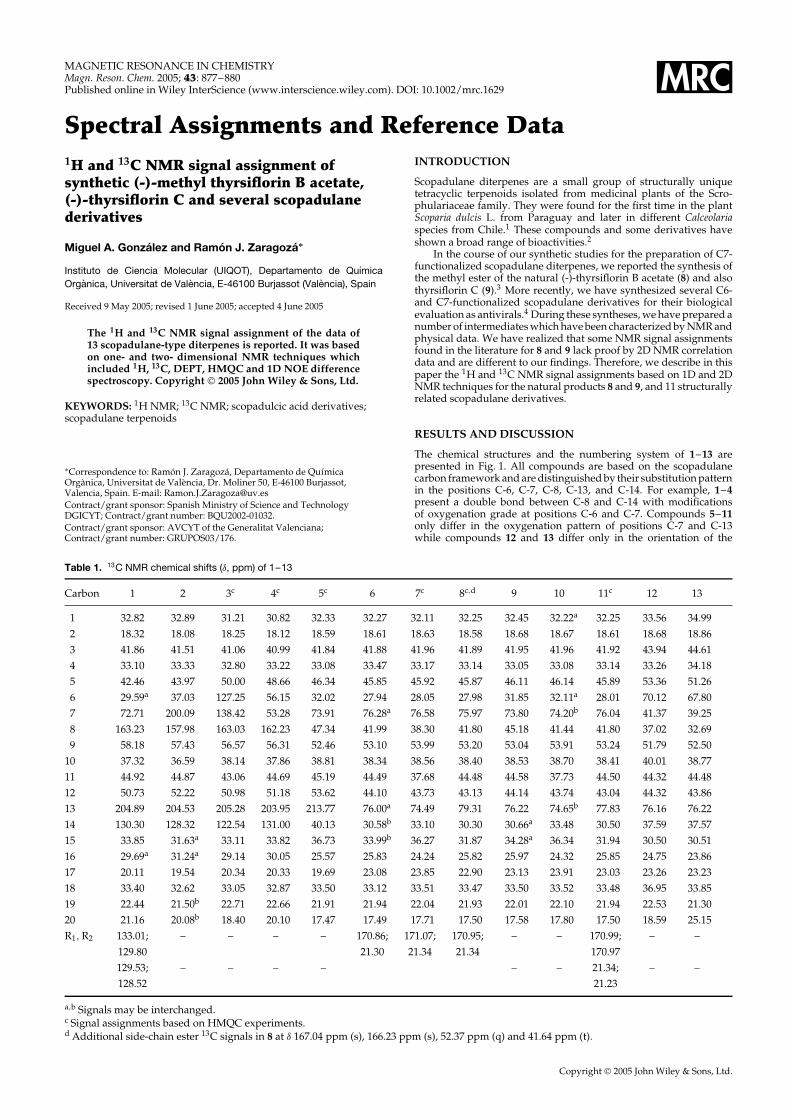
MAGNETIC RESONANCE IN CHEMISTRY Magn. Reson. Chem. 2005; 43: 877–880 Published online in Wiley InterScience (www.interscience.wiley.com). DOI: 10.1002/mrc.1629 Spectral Assignments and Reference Data 1 H and 13 C NMR signal assignment of synthetic (-)-methyl thyrsiflorin B acetate, (-)-thyrsiflorin C and several scopadulane derivatives Miguel A. Gonz ´ alez and Ram ´ on J. Zaragoz ´ a ∗ Instituto de Ciencia Molecular (UIQOT), Departamento de Qu´ ımica Org ` anica, Universitat de Val ` encia, E-46100 Burjassot (Val ` encia), Spain Received 9 May 2005; revised 1 June 2005; accepted 4 June 2005 The 1 H and 13 C NMR signal assignment of the data of 13 scopadulane-type diterpenes is reported. It was based on one- and two- dimensional NMR techniques which included 1 H, 13 C, DEPT, HMQC and 1D NOE difference spectroscopy. Copyright 2005 John Wiley & Sons, Ltd. KEYWORDS: 1 H NMR; 13 C NMR; scopadulcic acid derivatives; scopadulane terpenoids Ł Correspondence to: Ram ´ on J. Zaragoz´ a, Departamento de Qu´ ımica Org` anica, Universitat de Val` encia, Dr. Moliner 50, E-46100 Burjassot, Valencia, Spain. E-mail: [email protected] Contract/grant sponsor: Spanish Ministry of Science and Technology DGICYT; Contract/grant number: BQU2002-01032. Contract/grant sponsor: AVCYT of the Generalitat Valenciana; Contract/grant number: GRUPOS03/176. INTRODUCTION Scopadulane diterpenes are a small group of structurally unique tetracyclic terpenoids isolated from medicinal plants of the Scro- phulariaceae family. They were found for the first time in the plant Scoparia dulcis L. from Paraguay and later in different Calceolaria species from Chile. 1 These compounds and some derivatives have shown a broad range of bioactivities. 2 In the course of our synthetic studies for the preparation of C7- functionalized scopadulane diterpenes, we reported the synthesis of the methyl ester of the natural (-)-thyrsiflorin B acetate (8) and also thyrsiflorin C (9). 3 More recently, we have synthesized several C6- and C7-functionalized scopadulane derivatives for their biological evaluation as antivirals. 4 During these syntheses, we have prepared a number of intermediates which have been characterized by NMR and physical data. We have realized that some NMR signal assignments found in the literature for 8 and 9 lack proof by 2D NMR correlation data and are different to our findings. Therefore, we describe in this paper the 1 H and 13 C NMR signal assignments based on 1D and 2D NMR techniques for the natural products 8 and 9, and 11 structurally related scopadulane derivatives. RESULTS AND DISCUSSION The chemical structures and the numbering system of 1 – 13 are presented in Fig. 1. All compounds are based on the scopadulane carbon framework and are distinguished by their substitution pattern in the positions C-6, C-7, C-8, C-13, and C-14. For example, 1 – 4 present a double bond between C-8 and C-14 with modifications of oxygenation grade at positions C-6 and C-7. Compounds 5 – 11 only differ in the oxygenation pattern of positions C-7 and C-13 while compounds 12 and 13 differ only in the orientation of the Table 1. 13 C NMR chemical shifts (υ, ppm) of 1–13 Carbon 1 2 3 c 4 c 5 c 6 7 c 8 c,d 9 10 11 c 12 13 1 32.82 32.89 31.21 30.82 32.33 32.27 32.11 32.25 32.45 32.22 a 32.25 33.56 34.99 2 18.32 18.08 18.25 18.12 18.59 18.61 18.63 18.58 18.68 18.67 18.61 18.68 18.86 3 41.86 41.51 41.06 40.99 41.84 41.88 41.96 41.89 41.95 41.96 41.92 43.94 44.61 4 33.10 33.33 32.80 33.22 33.08 33.47 33.17 33.14 33.05 33.08 33.14 33.26 34.18 5 42.46 43.97 50.00 48.66 46.34 45.85 45.92 45.87 46.11 46.14 45.89 53.36 51.26 6 29.59 a 37.03 127.25 56.15 32.02 27.94 28.05 27.98 31.85 32.11 a 28.01 70.12 67.80 7 72.71 200.09 138.42 53.28 73.91 76.28 a 76.58 75.97 73.80 74.20 b 76.04 41.37 39.25 8 163.23 157.98 163.03 162.23 47.34 41.99 38.30 41.80 45.18 41.44 41.80 37.02 32.69 9 58.18 57.43 56.57 56.31 52.46 53.10 53.99 53.20 53.04 53.91 53.24 51.79 52.50 10 37.32 36.59 38.14 37.86 38.81 38.34 38.56 38.40 38.53 38.70 38.41 40.01 38.77 11 44.92 44.87 43.06 44.69 45.19 44.49 37.68 44.48 44.58 37.73 44.50 44.32 44.48 12 50.73 52.22 50.98 51.18 53.62 44.10 43.73 43.13 44.14 43.74 43.04 44.32 43.86 13 204.89 204.53 205.28 203.95 213.77 76.00 a 74.49 79.31 76.22 74.65 b 77.83 76.16 76.22 14 130.30 128.32 122.54 131.00 40.13 30.58 b 33.10 30.30 30.66 a 33.48 30.50 37.59 37.57 15 33.85 31.63 a 33.11 33.82 36.73 33.99 b 36.27 31.87 34.28 a 36.34 31.94 30.50 30.51 16 29.69 a 31.24 a 29.14 30.05 25.57 25.83 24.24 25.82 25.97 24.32 25.85 24.75 23.86 17 20.11 19.54 20.34 20.33 19.69 23.08 23.85 22.90 23.13 23.91 23.03 23.26 23.23 18 33.40 32.62 33.05 32.87 33.50 33.12 33.51 33.47 33.50 33.52 33.48 36.95 33.85 19 22.44 21.50 b 22.71 22.66 21.91 21.94 22.04 21.93 22.01 22.10 21.94 22.53 21.30 20 21.16 20.08 b 18.40 20.10 17.47 17.49 17.71 17.50 17.58 17.80 17.50 18.59 25.15 R 1 , R 2 133.01; – – – – 170.86; 171.07; 170.95; – – 170.99; – – 129.80 21.30 21.34 21.34 170.97 129.53; – – – – – – 21.34; – – 128.52 21.23 a,b Signals may be interchanged. c Signal assignments based on HMQC experiments. d Additional side-chain ester 13 C signals in 8 at υ 167.04 ppm (s), 166.23 ppm (s), 52.37 ppm (q) and 41.64 ppm (t). Copyright 2005 John Wiley & Sons, Ltd.
-
Upload
miguel-a-gonzalez -
Category
Documents
-
view
215 -
download
0
Transcript of 1H and 13C NMR signal assignment of synthetic (-)-methyl thyrsiflorin B acetate, (-)-thyrsiflorin C...
MAGNETIC RESONANCE IN CHEMISTRYMagn. Reson. Chem. 2005; 43: 877–880Published online in Wiley InterScience (www.interscience.wiley.com). DOI: 10.1002/mrc.1629
Spectral Assignments and Reference Data1H and 13C NMR signal assignment ofsynthetic (-)-methyl thyrsiflorin B acetate,(-)-thyrsiflorin C and several scopadulanederivatives
Miguel A. Gonzalez and Ramon J. Zaragoza∗
Instituto de Ciencia Molecular (UIQOT), Departamento de QuımicaOrganica, Universitat de Valencia, E-46100 Burjassot (Valencia), Spain
Received 9 May 2005; revised 1 June 2005; accepted 4 June 2005
The 1H and 13C NMR signal assignment of the data of13 scopadulane-type diterpenes is reported. It was basedon one- and two- dimensional NMR techniques whichincluded 1H, 13C, DEPT, HMQC and 1D NOE differencespectroscopy. Copyright 2005 John Wiley & Sons, Ltd.
KEYWORDS: 1H NMR; 13C NMR; scopadulcic acid derivatives;scopadulane terpenoids
ŁCorrespondence to: Ramon J. Zaragoza, Departamento de QuımicaOrganica, Universitat de Valencia, Dr. Moliner 50, E-46100 Burjassot,Valencia, Spain. E-mail: [email protected]/grant sponsor: Spanish Ministry of Science and TechnologyDGICYT; Contract/grant number: BQU2002-01032.Contract/grant sponsor: AVCYT of the Generalitat Valenciana;Contract/grant number: GRUPOS03/176.
INTRODUCTION
Scopadulane diterpenes are a small group of structurally uniquetetracyclic terpenoids isolated from medicinal plants of the Scro-phulariaceae family. They were found for the first time in the plantScoparia dulcis L. from Paraguay and later in different Calceolariaspecies from Chile.1 These compounds and some derivatives haveshown a broad range of bioactivities.2
In the course of our synthetic studies for the preparation of C7-functionalized scopadulane diterpenes, we reported the synthesis ofthe methyl ester of the natural (-)-thyrsiflorin B acetate (8) and alsothyrsiflorin C (9).3 More recently, we have synthesized several C6-and C7-functionalized scopadulane derivatives for their biologicalevaluation as antivirals.4 During these syntheses, we have prepared anumber of intermediates which have been characterized by NMR andphysical data. We have realized that some NMR signal assignmentsfound in the literature for 8 and 9 lack proof by 2D NMR correlationdata and are different to our findings. Therefore, we describe in thispaper the 1H and 13C NMR signal assignments based on 1D and 2DNMR techniques for the natural products 8 and 9, and 11 structurallyrelated scopadulane derivatives.
RESULTS AND DISCUSSION
The chemical structures and the numbering system of 1–13 arepresented in Fig. 1. All compounds are based on the scopadulanecarbon framework and are distinguished by their substitution patternin the positions C-6, C-7, C-8, C-13, and C-14. For example, 1–4present a double bond between C-8 and C-14 with modificationsof oxygenation grade at positions C-6 and C-7. Compounds 5–11only differ in the oxygenation pattern of positions C-7 and C-13while compounds 12 and 13 differ only in the orientation of the
Table 1. 13C NMR chemical shifts (υ, ppm) of 1–13
Carbon 1 2 3c 4c 5c 6 7c 8c,d 9 10 11c 12 13
1 32.82 32.89 31.21 30.82 32.33 32.27 32.11 32.25 32.45 32.22a 32.25 33.56 34.992 18.32 18.08 18.25 18.12 18.59 18.61 18.63 18.58 18.68 18.67 18.61 18.68 18.863 41.86 41.51 41.06 40.99 41.84 41.88 41.96 41.89 41.95 41.96 41.92 43.94 44.614 33.10 33.33 32.80 33.22 33.08 33.47 33.17 33.14 33.05 33.08 33.14 33.26 34.185 42.46 43.97 50.00 48.66 46.34 45.85 45.92 45.87 46.11 46.14 45.89 53.36 51.266 29.59a 37.03 127.25 56.15 32.02 27.94 28.05 27.98 31.85 32.11a 28.01 70.12 67.807 72.71 200.09 138.42 53.28 73.91 76.28a 76.58 75.97 73.80 74.20b 76.04 41.37 39.258 163.23 157.98 163.03 162.23 47.34 41.99 38.30 41.80 45.18 41.44 41.80 37.02 32.699 58.18 57.43 56.57 56.31 52.46 53.10 53.99 53.20 53.04 53.91 53.24 51.79 52.50
10 37.32 36.59 38.14 37.86 38.81 38.34 38.56 38.40 38.53 38.70 38.41 40.01 38.7711 44.92 44.87 43.06 44.69 45.19 44.49 37.68 44.48 44.58 37.73 44.50 44.32 44.4812 50.73 52.22 50.98 51.18 53.62 44.10 43.73 43.13 44.14 43.74 43.04 44.32 43.8613 204.89 204.53 205.28 203.95 213.77 76.00a 74.49 79.31 76.22 74.65b 77.83 76.16 76.2214 130.30 128.32 122.54 131.00 40.13 30.58b 33.10 30.30 30.66a 33.48 30.50 37.59 37.5715 33.85 31.63a 33.11 33.82 36.73 33.99b 36.27 31.87 34.28a 36.34 31.94 30.50 30.5116 29.69a 31.24a 29.14 30.05 25.57 25.83 24.24 25.82 25.97 24.32 25.85 24.75 23.8617 20.11 19.54 20.34 20.33 19.69 23.08 23.85 22.90 23.13 23.91 23.03 23.26 23.2318 33.40 32.62 33.05 32.87 33.50 33.12 33.51 33.47 33.50 33.52 33.48 36.95 33.8519 22.44 21.50b 22.71 22.66 21.91 21.94 22.04 21.93 22.01 22.10 21.94 22.53 21.3020 21.16 20.08b 18.40 20.10 17.47 17.49 17.71 17.50 17.58 17.80 17.50 18.59 25.15R1, R2 133.01; – – – – 170.86; 171.07; 170.95; – – 170.99; – –
129.80 21.30 21.34 21.34 170.97129.53; – – – – – – 21.34; – –128.52 21.23
a,b Signals may be interchanged.c Signal assignments based on HMQC experiments.d Additional side-chain ester 13C signals in 8 at υ 167.04 ppm (s), 166.23 ppm (s), 52.37 ppm (q) and 41.64 ppm (t).
Copyright 2005 John Wiley & Sons, Ltd.

878
Spectral Assignments and Reference Data
Tab
le2.
1H
NM
Rch
emic
alsh
ifts
(υ,p
pm
)of1
–13
12
3c4c
5c6
7c8c
910
11c
1213
H-1
1.50
–1.6
01.
50–1
.60
¾1.4
81.
38¾1
.47
¾1.4
01.
32–1
.50
¾1.4
0¾1
.40
1.40
¾1.4
1¾1
.40
¾1.4
0H
-21.
50–1
.70
1.50
–1.6
51.
50–1
.75
1.54
–1.7
51.
30–1
.55
1.30
–1.6
01.
38–1
.60
1.34
–1.6
11.
30–1
.60
1.30
–1.6
01.
30–1
.52
1.30
–1.6
01.
30–1
.60
H-3
˛¾1
.20
¾1.1
51.
221.
171.
111.
121.
101.
10¾1
.10
¾1.0
8¾1
.10
–d
–d
H-3
ˇ1.
50–1
.60
1.50
–1.6
0¾1
.50
¾1.5
3¾1
.41
¾1.4
01.
401.
40–
d–
d1.
38–
d–
d
H-5
¾1.2
5¾1
.25
2.04
1.50
1.06
¾1.0
11.
031.
02¾1
.00
–d
1.04
–d
–d
H-6
˛–
2.62
––
1.87
1.80
–1.9
01.
85¾1
.85
–d
–d
¾1.8
3–
4.30
H-6
ˇ1.
90–2
2.51
6.23
3.38
¾1.3
5–
d¾1
.37
¾1.3
3–
d–
d¾1
.34
3.90
–H
-7˛
––
––
3.53
4.68
4.67
4.71
3.41
3.36
4.72
–d
–d
H-7
ˇ5.
98–
6.18
3.58
––
––
––
––
d–
d
H-8
––
––
1.99
1.90
2.08
1.95
–d
–d
1.95
2.20
–d
H-1
1˛–
d1.
701.
761.
521.
691.
461.
541.
521.
42–
d1.
51–
d–
d
H-1
1ˇ¾1
.64
¾1.8
01.
581.
711.
40–
d1.
121.
08–
d–
d¾1
.06
–d
–d
H-1
3–
––
––
3.35
3.43
4.67
3.38
3.48
4.60
3.40
3.42
H-1
4˛–
––
–2.
11–
d¾1
.40
¾1.1
2–
d–
d¾1
.10
–d
–d
H-1
4ˇ6.
146.
645.
686.
272.
72¾2
.03
1.74
2.10
2.31
2.04
2.07
–d–d
H-1
5–
d–
d¾1
.68
¾1.7
01.
56–1
.75
–d
¾1.4
2¾1
.20,
1.80
–d
–d
¾1.2
0,1.
84–
d–
d
H-1
62.
302.
352.
202.
06¾2
.01
–d
¾1.7
3¾1
.83
¾1.8
0¾1
.80
¾1.7
9–
d–
d
H-1
60–
d–
d1.
401.
70¾1
.67
–d
¾1.4
2¾1
.43
–d
–d
¾1.4
2–
d–
d
H-1
71.
191.
241.
221.
201.
040.
991.
010.
940.
99a
1.02
a0.
921.
01a
1.02
H-1
80.
930.
961.
001.
110.
850.
81a
0.84
0.83
0.82
b0.
820.
841.
120.
94H
-19
0.89
0.89
0.95
1.08
0.83
0.79
a0.
830.
810.
81b
0.82
0.82
0.97
1.23
a
H-2
01.
001.
000.
951.
021.
000.
991.
061.
020.
97a
0.99
a1.
021.
03a
1.30
a
R1,
R2
7.40
–8.0
0–
––
–2.
022.
052.
04,3
.74,
3.36
––
2.03
,2.0
4–
–
a,b
Sign
als
may
bein
terc
hang
ed.
cSi
gnal
assi
gnm
ents
base
don
HM
QC
expe
rim
ents
.d
Sign
alno
tass
igne
d.
Copyright 2005 John Wiley & Sons, Ltd. Magn. Reson. Chem. 2005; 43: 877–880

879
Spectral Assignments and Reference Data
Tab
le3.
Sel
ecte
d1H
NM
Rsi
gnal
sof
1–
13:m
ultip
liciti
esan
dco
uplin
gco
nsta
nts
(J,H
z)
12
3a4a
5a6
7a8a
910
11a
1213
H-5
––
dd
;2.
5,1.
5br
sd
d;
12,2
.5–
dd
;12
.5,2
.5d
d;
12.5
,2.5
––
dd
;12
,2.5
––
H-6
˛–
dd
;19
,7–
–d
dd
;12
.5,5
.5,2
.5–
dd
d;
12.5
,5.5
,2.5
––
––
–br
s;W
h/2
D8
H-6
ˇ–
dd
;19
,12.
5d
d;
10,2
.5d
d;
4,2.
5–
––
––
––
dd
d;
11,1
0.5,
5.5
–
H-7
˛–
–d
d;
10,1
.5–
dd
d;
11,1
0.5,
5.5
dd
d;
11,1
0.5,
5.5
dd
d;
11,1
1,5.
5d
dd
;11
,11,
5.5
dd
d;
11,9
,5.5
dd
d;
11,1
0,5.
5d
dd
;11
,10.
5,5.
5–
–
H-7
ˇd
d;3
,3–
–d
;4–
––
––
––
––
H-8
––
––
––
dd
d;
11,1
1,5
dd
d;
11,1
1,5
––
dd
d;
11.5
,10.
5,5
––
H-1
1˛–
d;
11.5
d;1
1.5
d;1
1.5
d;1
2d
;12
brd
;11.
5d
;11
d;1
1.5
–d
;11.
5–
–
H-1
1ˇ–
–br
d;1
1.5
brd
;11.
5br
d;1
2–
brd
;11.
5br
d;1
1–
––
––
H-1
3–
––
––
dd
;10,
6br
s;W
h/2
D8
dd
;10
.5,6
dd
;10
.5,6
brs;
Wh/
2D
8d
dd
;10
.5,6
,1d
d;
10.5
,5.5
dd
;10
,6.5
H-1
4˛br
ss
ss
dd
;15
.5,1
1.5
––
––
––
––
H-1
4ˇ–
––
–d
d;
15.5
,6–
dd
d;
15,5
,2d
dd
;13
,6,5
dd
d;
13,6
,5d
dd
;14
,5,2
dd
d;
13,6
,5–
–
H-1
6d
dd
;12
.5,1
0,7
dd
d;
12.5
,12.
5,7
dd
d;
12.5
,10,
6.5
––
––
––
––
––
aSi
gnal
assi
gnm
ents
base
don
HM
QC
expe
rim
ents
.
Copyright 2005 John Wiley & Sons, Ltd. Magn. Reson. Chem. 2005; 43: 877–880

880
Spectral Assignments and Reference Data
Figure 1. Structures and numbering of the compounds investigated.
C-6 hydroxy group. Signal assignments of 13C NMR chemical shiftsare listed in Table 1. The 1H NMR chemical shifts are presented inTable 2; multiplicities and coupling constants of the most relevant 1HNMR signals are shown in Table 3. The obvious assignments werededuced from the corresponding 1H NMR, 13C NMR and DEPTspectra according to their chemical shifts and multiplicities. Theremaining signals were assigned with the aid of double resonanceexperiments, one-bond heteronuclear (1H,13C) multiple quantumcorrelation (HMQC) spectra, some 1D NOE difference experiments,and by comparison with literature data.5
The stereochemistry of the substituents located at positions C-6,C-7 and C-13 (1, 6–13) can be deduced from the coupling constantof the corresponding proton. For example, proton H-6 in 12 presentscoupling constants (J D 11, 10.5 and 5.5 Hz) in agreement withan axial disposition (˛� of this proton, whereas in 13 that protonsignal appears as a broad singlet with a W1/2 of 8 Hz indicating anequatorial orientation (ˇ�. In a similar manner, the stereochemistry
of the protons H-7 and/or H-13 can be deduced in 1 and 6–11.The stereochemistry of the epoxide in 4 was assigned by NOEdifference experiments, in particular, irradiation of the C-20 methylsignal gave NOE enhancements of the H-6, H-7 and H-19 signals,thereby confirming the ˛-orientation of the oxirane ring. From the13C NMR data, we can observe a �-effect on C-8 when there is anaxial substituent on C-6 or C-13. For example, the signal due to C-8 in7 and 10 is upfield (about 3.7 ppm to lower frequency) with respectto 6 and 9 respectively.
The 1H NMR and 13C NMR data of the synthetic derivatives8 and 9 were similar to those reported for the methyl ester ofthyrsiflorin B acetate and thyrsiflorin C respectively.1d,e However,our 1H NMR data of 8, specially the HMQC spectrum and NOEdifference experiments, indicated that the assignments of H-17 andH-20 as well as some 13C signal assignments had to be reversed. Webelieve that this contribution could be useful as a reference for theassignment and characterization of similar compounds.
EXPERIMENTAL
CompoundsAll the compounds were prepared as described previously.3,4
NMR spectroscopyAll NMR experiments 1–13 dissolved in CDCl3 were performed withVarian XL-300 and Varian 400 spectrometers operating at a protonfrequency of 299.95 MHz and 399.95 MHz respectively. Detailedexperimental parameters have been presented previously.5
AcknowledgementsThis work was supported by research funds provided by the SpanishMinistry of Science and Technology DGICYT (project BQU2002-01032) and by the AVCYT of the Generalitat Valenciana (referenceGRUPOS03/176). M. A. G. thanks the Spanish Ministry of Scienceand Technology for a research fellowship (Programa Ramon y Cajal).
REFERENCES
1. (a) Hayashi T, Kishi M, Kawasaki M, Arisawa M, Shimizu M,Suzuki S, Yoshizaki M, Morita N, Tezuka Y, Kikuchi T,Berganza LH, Ferro E, Basualdo I Tetrahedron Lett. 1987; 28: 3693;(b) Hayashi T, Kishi M, Kawasaki M, Arisawa M, Morita N J.Nat. Prod. 1988; 5: 360; (c) Hayashi T, Asano S, Mizutani M,Takeguchi N, Kojima T, Okamura K, Morita N J. Nat. Prod. 1991;54: 802; (d) Chamy MC, Piovano M, Garbarino JA, Miranda C,Gambaro V, Rodriguez ML, Ruiz-Perez C, Brito I Phytochemistry1991; 30: 589; (e) Chamy MC, Piovano M, Garbarino JA, Vargas C.Phytochemistry 1995; 40: 1751.
2. (a) Hayashi T Stud. Nat. Prod. Chem. 2000; 21: 689 (review);(b) Betancur-Galvis L, Zuluaga C, Arno M, Gonzalez MA,Zaragoza RJ. J. Nat. Prod. 2001; 64: 1318.
3. Arno M, Gonzalez MA, Marın ML, Zaragoza RJ. J. Org. Chem.2000; 65: 840.
4. Arno M, Betancur-Galvis L, Bueno-Sanchez JG, Gonzalez MA,Zaragoza RJ. Tetrahedron 2003; 59: 6455.
5. Arno M, Gonzalez MA, Marın ML, Zaragoza RJ. Magn. Reson.Chem. 2001; 39: 414.
Copyright 2005 John Wiley & Sons, Ltd. Magn. Reson. Chem. 2005; 43: 877–880