
1b Risk Analysis Method for Storage of Hazardous...
35
- 1 - ADVERTIMENT LA METODOLOGIA APLICABLE PER L’ANALISI DE RISC DELS MAGATZEMS ÉS LA INCLOSA EN LA VERSIÓ 3.2 DEL MANUAL BEVI APARTAT 8 PÀGINES 71 A 94. AQUEST DOCUMENT ES PODRÀ EMPRAR PER DEFECTE EN EL CAS EN EL QUAL EL MANUAL BEVI 3.2 NO CONCRETI ALGUN ASPECTE. RISK ANALYSIS METHOD FOR STORAGE OF HAZARDOUS MATERIALS 1. Introduction The risk analysis method is described for storage facilities in which hazardous materials, chemical waste materials or pesticides/herbicides are stored in packaging. A quantitative risk analysis needs not be carried out if no toxic materials have been stored and no toxic combustion products can be formed. This is the case if no materials have been stored with a LD50 (rat) < 25 mg/kg and one of the conditions below has been complied with: a) only chemicals have been stored that do not contain sulphur, nitrogen, chlorine, fluorine or bromine b) only the storage of watery inorganic acids and bases has occurred, unless toxic fumes can be released c) only the storage of inorganic salts occurs d) only the storage of non-flammable materials occurs e) combinations of a, b, c, and d. 2. Protection levels and risk to surroundings 2.1 Protection Levels of the storage facilities The following protection levels of are distinguished on the basis of the fire risk of stored material and the possible damage to the environment of any materials released: 1. (semi-) automatic extinguishing system or firefighting system with company fire brigade, fire detection, extinguishing agent collecting provision, preventive measures 2. fire detection, extinguishing agent collecting provision, preventive measures 3. preventive measures. 2.2 Risk to the Surroundings As the materials are stored in packaging, the amounts that can be involved simultaneously in case of an accident are limited. Accidents in which consequences for the area may occur are:
-
Upload
truongkhuong -
Category
Documents
-
view
213 -
download
0
Transcript of 1b Risk Analysis Method for Storage of Hazardous...

- 1 -
ADVERTIMENT LA METODOLOGIA APLICABLE PER L’ANALISI DE RISC DELS MAGATZEMS ÉS LA INCLOSA EN LA VERSIÓ 3.2 DEL MANUAL BEVI APARTAT 8 PÀGINES 71 A 94. AQUEST DOCUMENT ES PODRÀ EMPRAR PER DEFECTE EN EL CAS EN EL QUAL EL MANUAL BEVI 3.2 NO CONCRETI ALGUN ASPECTE.
RISK ANALYSIS METHOD FOR STORAGE OF HAZARDOUS MATERIALS 1. Introduction The risk analysis method is described for storage facilities in which hazardous materials, chemical waste materials or pesticides/herbicides are stored in packaging. A quantitative risk analysis needs not be carried out if no toxic materials have been stored and no toxic combustion products can be formed. This is the case if no materials have been stored with a LD50 (rat) < 25 mg/kg and one of the conditions below has been complied with: a) only chemicals have been stored that do not contain sulphur, nitrogen, chlorine,
fluorine or bromine b) only the storage of watery inorganic acids and bases has occurred, unless toxic
fumes can be released c) only the storage of inorganic salts occurs d) only the storage of non-flammable materials occurs e) combinations of a, b, c, and d. 2. Protection levels and risk to surroundings 2.1 Protection Levels of the storage facilities The following protection levels of are distinguished on the basis of the fire risk of stored material and the possible damage to the environment of any materials released: 1. (semi-) automatic extinguishing system or firefighting system with company fire
brigade, fire detection, extinguishing agent collecting provision, preventive measures 2. fire detection, extinguishing agent collecting provision, preventive measures 3. preventive measures. 2.2 Risk to the Surroundings As the materials are stored in packaging, the amounts that can be involved simultaneously in case of an accident are limited. Accidents in which consequences for the area may occur are:

- 2 -
1. The release and ignition of a flammable liquid.
The release and ignition of flammable liquids can cause injury in the immediate area. Direct ignition of the pool formed will result in a pool fire. Assuming a maximum pool surface of 1500 m2 and using the heat radiation model from the Yellow Book the heat intensity in the area has been calculated for xylene, methanol and benzene. It has been discovered that in cases of a pool fire a thermal intensity of 16.5 kW/m2 (corresponding to 1% lethal injury) can occur at distances of 30 m. When the released liquid is not directly ignited, evaporation can form a flammable gas cloud. The surface of the gas could corresponds to the area within which the gas concentration lies above the LEL (Lower Explosion Limit). For methanol the evaporation rate from a pool of 1500 m2 at an ambient temperature of 20 °C equals 0.65 kg/s. At wind speeds of 2 m/s the LEL will be reached for this source strength at a distance of 30 m. It is assumed that upon ignition, no lethal injury will occur outside the cloud. On the basis of the limited damage distances for heat radiation and gas cloud combustion, this contribution to the external risk of the storage of flammable liquids in packaging is considered negligible. The effect of the storage of flammable liquids in packaging on the creation of toxic combustion products is discussed in point 3.
2. The release of toxic liquids or powders. 3. A fire in the storage facility with the formation of toxic combustion products. Table 1 The physical effects and the possible contribution to the risk for the area of
accidents in a chemical storage facility. Accident Type Physical Effects Risk to Area Failed packaging: - toxic solid - toxic liquid
Powder dispersion pool formation/evaporation
Yes Yes
Fire Heat radiation Release and dispersal of non-combusted toxic products Release and dispersal of toxic combustion products
No Yes Yes
It can be concluded from Table 1 that the following accident types can contribute to area risk: − release of toxic solids − release of toxic liquids − fire

- 3 -
3. Release of products stored 3.1 Introduction 3.2 Release of Toxic Solids 3.2.1. Introduction Whenever the packaging of a solid fails, the content may be released, may become airborne and dispersed in the area. This scenario is only relevant if the particle size of the solid is such that the particulate matter can be carried off by the wind to the area. This means that this scenario applies only to powders. Solids of a larger shape, such as granules, pellets, crystalline compounds and the like will not contribute to the external risk when released. Solids are transported in various types of packaging (sacks, big bags, IBCs). The amount released will depend, among other things, on packaging size. In accordance with ADR, maximum packaging volumes have been set for road transport. For transports of toxic solids, a maximum packaging size of 400 kg for very toxic solids (these are solids with a LD50(oral, rat) ≤ 5 mg/kg) has been determined. Less toxic solids may be transported in IBCs. In such cases, packaging size does not exceed the maximum of 3 m3. 3.2.2. Source strength The source strength upon the release of powders is equal to the product of: - the content of the damaged packaging - the fraction of active substance - the fraction of the content being released from the packaging - the fraction of particles that are sufficiently small to be dispersed and inhaled. The fraction of active substance depends on the product. Pesticides/herbicides are often stored in formulas in which an active substance percentage of 10-20% is normal. Chemicals are often stored in their pure state; the active substance percentage will then be 100%. When calculating the risk, the actual value must be used. Upon damage, not the entire contents will be released. As for the fraction of particles that are released, this is assumed to be 10%. Only small particles are dispersed. In addition to this, only those particles with a diameter ≤10 μm can be inhaled and can therefore possible inflict damage upon exposure. Therefore, for this scenario it is assumed that the source strength of dispersing powder is equal to the amount with a particulate size smaller or equal to 10

- 4 -
μm. The fraction must be determined through means of an analysis or it must be indicated by the manufacturer. 3.2.3. Dispersion Upon dispersal of the powder released, it may be assumed that the powder with particles smaller than 10 μm will be dispersed in a Gaussian fashion. Any recirculation occurring due to the building is taken into consideration upon dispersion. 3.2.4. Probabilities It is in particular calamities of which the effects will be noticeable in the area that are considered when determining the probability of an accident scenario. In this respect, a calamity is the tearing of the packaging such that the wind gains purchase on its contents and the powder is dispersed in the area. However, when a packaging tears within the storage building, an accident scenario with damage outside the storage facility is not likely. This is why only accidents occurring outside are important. This comes down to accidents while transferring loads. This has been taken into consideration in determining the failure frequency of the various packagings. The failure frequency of the packagings concerned depends on the number of times that a packaging fails during load transfer. For example: due to a collision or due to careless positioning on the forklift truck and on the chance of leakage. One publication indicates a failure frequency for packed goods of 10-2 - 10-4 for each packaging handled (a handled packaging includes the full entry, storage and issue cycle). These values are applicable to standard packaging materials and for normal handling. Due to transport regulations (ADR) toxic materials must be transported in approved packagings. In addition, more attention is paid to the handling of hazardous materials than that of normal packed goods. It is for these reasons that a low failure rate with release of the contents is assumed for solid chemical materials, namely 10-5 for each packaging handled (sack, box, big bag, IBC). If sacks or drums have been affixed to a pallet using shrink wrapping or loops/bands the failure frequency will be applicable to each pallet. This means to say that the failure rate of a packaging is equal to 10-5 divided by the number of packagings on the pallet. The over all probability that a toxic solid will be released from a packaging is equal to the product of the failure rate (10-5/per packaging handled) and the average number of packagings handled annually in the facility. In doing so, the adjustment made for packagings that are affixed to a pallet by means of shrink wrapping or bands must be taken into consideration. 3.2.5. Sample Calculation The accident scenario that is worked out in this example is the failure of a packaging of 400 kg. It is assumed that the packaging is damaged due to improper handling and that its contents are partially released as a result: − The total contents of the packaging amounts to 400 kg. − This sample calculation assumes an active material content of 50%.

- 5 -
− 10% of the total contents shall be released. − The percentage of inhalable particles (smaller than 10 μm) is assumed to be 50%. These assumptions yield the following source strength:400 kg x 0.5 x 0.1 x 0.5 = 10 kg In calculating the probability of the scenario concerned occurring, the failure frequency of a big bag is used (10-5 per big bag handled). The number of handled big bags with toxic solids is set at 50 annually. Therefore, overall probability is 5·10-4 annually. 3.3 Release of Toxic Liquids 3.3.1. Introduction Whether and to what degree a material will contribute to the risk for the area depends on the concentration that shall occur in the area and on the toxicity of the material. The concentration is determined by the source strength and by the meteorological conditions. The source strength of the evaporating liquid depends on the evaporation rate from the pool. This is determined by the pool area and also depends on the ambient temperature and the vapour pressure of the liquid. For risk analyses a standard ambient temperature of 15 °C is often adhered to. A TNO report derives information on which combinations of vapour pressure and toxicity will still result in lethal injury with a probability of 1% at a distance of 100 m (weather class D5, temperature 20 °C). This data is included in Table 2. When the toxicity of a particular material is greater than or equal to the toxicity that is given for the vapour pressure concerned (meaning the LD or the LC value of the material is lower than the given value) the material may contribute to posing an external risk. Table 2. Relevant vapour pressure and toxicity criteria (boundary values) for
consideration in risk analysis. Vapour Pressure at 20 0C [bar]
LD50(oral, rat) [mg/kg] or LC01(person, 30 min) [mg/m3]
< 0.001 0.001 - 0.005 0.005 - 0.01 0.01 - 0.03 0.03 - 0.05 0.05 - 0.1 0.1 - 0.2 0.2 - 0.5
< 2.3 < 13 < 25 < 70 < 1.2 × 10² < 2.4 × 10² < 5.2 × 10² < 1.6 × 10³
Liquids are transported and stored in small packaging, drums, IBCs and in tanks of various dimensions. The maximum packing size for storage inside is an IBC of 3 m3. Materials with a LC50 of no more than 1000 ppm may be transported in packaging sizes of no more than 450 kg (barrels). This applies to most toxic liquids.

- 6 -
3.3.2. Source Strength To calculate the source strength as input in the dispersion model, the evaporation from the pool is determined on the basis of the pool area and the physical properties of the material (in particular the vapour pressure). The models from the Yellow Book can be used for this. 3.3.4. Probabilities A TNO report provides a frequency for complete failure for a liquid tank of 5 × 10⁻⁵ – 3 × 10⁻⁷ annually. As a rule of thumb, a liquid tank will be stronger than a drum or a vessel. On the other hand, a drum can be placed in an oversized vessel in case of an accident, which will restrict the outflow. Due to this consideration, the outflow frequency for drums is determined to be equal to 10-5 annually. The overall probability is provided by the product of the failure frequency concerned and the annual average number of packaging units available in the site. 3.3.5. Sample Calculation In the accident scenario it is assumed that 1 vessel and 2 vessels with 200 liters of acrolein fail. Upon the release of toxic liquids, a liquid pool is formed with a 5 mm thick layer and an area of 40 and 80 m2 respectively. With the aid of the evaporation model from the Yellow Book is has been calculated that the average evaporation of acrolein from the pool for A through D weather classes, representative wind speed of 5 m/s, will amount to 0.17 kg/s (1 vessel) and 0.34 kg/sec (2 vessels) for the duration of approx. 1000 sec. (all acrolein released has evaporated). For the E through F weather classes, representative wind speed of 2 m/s, average evaporation works out to 0.09 kg/s (failure of 1 vessel) or 0.18 kg/s (failure of 2 vessels). In calculating the probability of the scenario concerned occurring, the failure frequency of a liquid vessel of 10-5 per vessel handled is assumed. In addition to this, a scenario is being considered in which two vessels fail simultaneously (for example, this may be caused because the fork of the forklift truck punctures the vessels). A probability of failure that is 10 times smaller is used for this: 0.1 x 10-5 = 10-6. This probability of failure is multiplied with the number of acrolein vessels handled annually which is set to 100. The overall frequency of the occurrence of these scenarios amounts to: − Failure of 1 vessel: 9 x 10⁻⁴ annually. − Failure of 2 vessels simultaneously: 1 x 10⁻⁴ annually.

- 7 -
4. Fire 4.1. Introduction In this chapter the risk of a fire in a chemicals storage facility is dealt with. The risk of a fire in a chemicals storage facility is determined by: − the release of non-combusted solid material
During a fire, the stored materials can be emitted in an non-combusted state. If these materials are toxic, this could pose a risk to people in the area. The release of non-combusted material depends on the amount of material stored that is involved in the fire, the flash point of the material and the percentage of active material
− the creation of gaseous, toxic combustion products. Toxic combustion products like HCl, HF, HBr, SO2 and NO2 etc. are created during the fire if the stored chemicals are heterogeneous atoms like Cl, F, Br, S and N etc.
4.2. Risk Methodology for a Fire The risk of a fire in a chemicals storage facility is determined using a risk analysis methodology that is comparable to the risk analysis methodology for pesticide/herbicide storage. The characteristic of this methodology is that the risk of a fire is determined on the basis of different fire scenarios that have a certain chance of occurring. A fire scenario is characterized by the fire duration, the fire area and the burn rate. The burn rate depends on the composition of the materials stored and the amount of oxygen that is available during the fire. The composition of the stored material(s) co-determines the nature and the amount of the toxic combustion products formed. The general rule of thumb here is that the aspects that play a role during a fire influence each other in various ways. This is reflected in figure 1.

- 8 -
Figure 1. Fire Determining factors and their interrelationships. 4.2.1 Fire Scenarios Depending on the circumstances at the time of the fire (cause of the fire, materials stored, storage method etc.) fires in storage facilities can expand with a different speed into a larger fire. This can best be expressed by defining different fire scenarios for a fire in a particular storage facility that each have a certain chance of occurring. A fire scenario is defined by the following three factors: − fire duration − fire area (size of the fire) − ventilation rate (oxygen supply to the fire).
2. Substances - average structure formula - burning equation
1. Fire scenario - duration - area - ventilation rate
3. Burning rate
4. Source term - products formed - emmissions per kg substance burned - % active substance
5. Toxicity - NO2, SO2, HCl - non-combusted substance
7. Probability - fire frequency - protective system - weather conditions
6. Dispersion - weather conditions - effect areas
8. Risk - location - societal

- 9 -
Fire Duration On the one hand, fire duration is determined by the conditions during the fire and, on the other, by the fire fighting tactic applied. Section 4.3. deals with the influence of fire fighting in greater detail. In this study, it is assumed that the duration of the fire is equal to the time needed to extinguish the fire. Among other things, this depends on the method used to fight the fire. However, a limit is set for the duration of the fire that is equal to the assumed maximum exposure duration of people in the area, namely: 30 minutes. For non-fire -resistant buildings and fire fighting in which smoke hatches or other ventilation systems are applied, the maximum duration of exposure is 20 minutes as it is assumed that after that plume rise will occur. Once this effect has occurred, the smoke gasses from the fire will rise to great heights. Before they reach the surface of the earth again, they have been greatly diluted, making hazardous effects negligible. It is assumed here that the initial phase of a fire takes about approx. 20 minutes. No plume shall rise within this period because the combustion products are cooled by the building which has not yet been warmed up. During the course of the first half hour of the fire, the building will more or less gradually become damaged. It may be assumed that there will be a gradual transition from a situation without plume rise to one with plume rise. The effects of such a general change are however difficult to quantify. Therefore, it is assumed here that plume rise will not occur at all in the initial phase. Fire Area The size of the fire area is largely determined by the supply of oxygen and it is also dependent on the fire fighting system. On the basis of this data, a distribution of probability can be arrived at for a number of fire areas. Chapter 4.3. discusses this in greater detail. In determining the distribution of probability, it has been assumed that the fire surface’s maximum will equal the area for the storage space. However, calculations have shown that during an oxygen restricted fire (low ventilation rate) the maximum area of the fire will be 300 m2. Ventilation rate The course of a fire is co-determined by the amount of oxygen available. This is derived from the air that is present in the storage space and from the air that is supplied through the ventilation openings. The volume of air supply is expressed in the ventilation rate (number of times per hour that the air in the building is refreshed). The amount of kilograms per second that burn is particularly dependent on this. If sufficient oxygen is supplied, the evaporation of the fuel present during the fire (i.e. the burning product) will be the limiting factor. This evaporation is expressed in kg/m2.s and is thereby directly related to the fire area. This evaporation speed will for most chemicals not exceed 0.025 kg/m2.s (K1 en K2 solvents: 0.1 kg/m2.s maximum) and therefore corresponds to the maximum burn rate. If the evaporation speed determines the burn rate, the fire is

- 10 -
referred to as ‘area-restricted’. If too little oxygen is supplied to the fire to achieve this maximum burn rate, the fire is ‘oxygen-restricted’. It is recommended to realize a ventilation rate between 1 to 4 in a storage building. It is assumed that during a fire, the suction effect of the fire will cause the ventilation rate to reach 4 per hour. This is applicable to a standard building. Exceptions to this are: − The use of smoke hatches (for automatic hi-ex installations and for corporate fire
departments with inside access) such that ventilation is unrestricted (ventilation rate ∞).
− Upon use of an automatic gas extinguishing installation a gas-tight space is used and the ventilation rate is therefore zero.
− If it can be shown that special provisions have been made for the building to restrict ventilation in case of fire, a lower ventilation rate may be used.
4.2.2. Stored Materials The stored materials constitute the fuel for the fire. If very toxic materials are present in the storage (LD50rat,oral ≤ 25 mg/kg) they may pose a threat to the area when released. In addition, materials can form toxic combustion products when burnt. It is assumed that only materials containing the elements N, S, F, Cl or Br can contribute to the production of toxic combustion products. Compounds containing chlorine can in principle also form dioxins (PCDD/PCDFs) although earlier studies have shown that the amounts formed are so small as to pose no acute threat to the population in the area. All materials are subdivided into a category (category 0) for the emission of toxic combustion products (HCl, SO2, NO2). The stored very toxic materials from category0 are also sub-divided into (sub)category 1 to determine the emission of very toxic materials.
Category Description 0 All stored materials. 1 Highly toxic materials (LD50rat,oral ≤25 mg/kg).
To determine the burn rate and the emission of toxic combustion products and very toxic materials, the average structure formula of the stored materials will have to be determined. Determining the Average Structure Formula per Category The starting point for the formation of toxic combustion products selected in the Pesticide/herbicide study was the “average structure formula” of the stored materials. For example, the average structure formula contains the elements C, H, O, N, S, Cl, F and Br. It is assumed that the packaging materials, the solvents and other additives will burn as quickly as the chemicals. It is for this reason that we assume that the structure formula of the additives is the same as that of the chemicals. The numbers present of the various elements in the average structure formula for a category are determined as shown below from the amount (kmol) and the structure formulas of all the active materials stored.

- 11 -
ñ = Σ ni Ni / Σ Ni (4.1) in which: ñ = average number of atoms of an element in the average structure formula Ni = kmoles of particular material i
It is determined by multiplying the inventory of the stored amount (kg) of material i by the percentage of active material i and to divide it by the molar mass of material i.
ni = number of atoms of an element in the structure formula of material i. In addition, the average mol mass M of the stored materials in a category is determined from the total amount of kg stored in a category divided by the total amount of stored material moles ( = Σ Ni ).With the aid of formula 4.1., the following structure formula is determined for a category: Ca Hb Oc Xd Ne Sf Here X = Cl, Br, F and a, b, c,... are the average number of atoms A for the elements C, H, O,... as calculated with equation 4.1. Combustion Formula A combustion comparison is set up based on the average structure formula. In doing so, a quantitative conversion is assumed. Nitrogen is not quantitatively converted into NO2. A maximum 35% conversion of N into NO2 is assumed (see 4.2.4.1). The combustion formula appears as follows: Ca Hb Oc Xd Ne Sf + {a + (b-d)/4 + 0.35.e + f - c/2} O2 → a CO2 + (b-d)/2 H2O + d HX + 0.35.e NO2 + 0.325.e N2 + f SO2 (4.2) The amount of chemical material that can be burnt at a particular oxygen supply to the fire (burn rate, see:4.2.3.) and which emissions will occur (source strength, see: 4.2.4.) is derived from these combustionformulas. 4.2.3. Burn rate The burn rate is a measure of the amount of material that burns per unit of time. It is assumed here that the combustion is complete; smoldering fires are not taken into account. The burn rate depends on the amount of fuel present, in other words: the amount of oxygen required, and on the amount of oxygen available. Area Restricted Fire If the amount of oxygen available exceeds the amount of oxygen required, oxygen is not a restricting factor and the fire is an area restricted fire (see: 4.2.1). In that case, the

- 12 -
maximum burn rate per area unit will be equal to the evaporation speed of the material. For chemicals it is approx. 0.025 kg.s-1.m-2. The maximum burn rate is equal to the product of the evaporation speed and fire area A: Bmax = 0.025 x A [kg/s] (4.3) Oxygen Restricted Fire If the amount of oxygen available is smaller than the required amount of oxygen, the fire is oxygen restricted. Burn rate will then be determined on the basis of the amount of oxygen available. It is calculated as follows: mO2 = 0.2 (1 + 0.5 F) V / (24 x 1800) [kmol/s] (4.4) with: mO2 = available (or supplied) amount of oxygen [kmol/s] F = ventilation rate of the space (number of air changes per hour) V = volume of the space [m3] 0.2 = oxygen content of the air 24 = molar air volume [m3/kmol]; 1800 = oxygen supply period [s]. The required amount of oxygen (Z0) is equal to the term {a + (b-d)/4 + 0.35.e + f – c/2} from the combustion equation of the stored material(s) (4.2). The burn rate B in kg/s will then be equal to: B0 = mO2 x M / Z0 (4.5) with: B0 = burn rate of category 0 materials [kg/s] mO2 = available (or supplied) amount of oxygen [kmol/s] M = average molecule mass of the stored material(s) [kg/kmol] Z0 = required amount of oxygen for the combustion of 1 mole of the material(s) stored
[mol/mol].
Differentiation between Area Restricted vs. Oxygen Restricted Initially, the ventilation rate is considered in order to determine whether the fire is area restricted or oxygen restricted. If ventilation is unrestricted (F = ∞), the fire is always area restricted. When the ventilation rate is finite, the fire area will be restricted to a particular fire area. The fire will be oxygen restricted if the areas are larger. The transition point is determined by comparing Bmax with B0: − if Bmax ≤ B0 : area restricted − if Bmax > B0 : oxygen restricted

- 13 -
4.2.4. Source Strength of Toxic Combustion Products and Non-combusted very Toxic Materials
4.2.4.1. Formation of Toxic Combustion Products Toxic combustion products are formed during the fire if the stored chemicals contain heterogeneous atoms like N, S, Cl, F, Br, Mn, Zn and so on. Upon the formation of toxic combustion products, only the formation of NO2, SO2, HCl, HF and HBr will be considered. Analogous to the Green Book , it is assumed in doing so that the calculated formation of NO2 is indicative of the amount of nitrogen oxides formed in general (NOx) and also for the formation of any HCN. The toxicity of NO2 and that of HCN are comparable. The amount of toxic combustion products that is released is not only determined by the amount of material involved in the fire, but also on the degree to which NO2, SO2 and HCl (and/or HF and/or HBr) are formed. This in turn depends on the composition of the burning materials and on the conditions during the fire. For the conversion of S into SO2, Cl into HCl, F into HF and Br into HBr, it is assumed that conversion in a fire is 100% complete. In a separate study group for the conversion of N into NO2 during a fire, NOx formation, it has been agreed that the conversion of N into NO2 during a fire will be determined as indicated below. On the basis of literature research it has been determined that the actual conversion percentage from N to NOx is on average set to 10%. In order to take into account uncertainties upon the conversion of N to NOx (non-combusted initial products and other toxic components that can result from the combustion) an additional 25% is added to this. This means that in a fire in a storage shed containing chemicals and/or pesticides/herbicides a conversion percentage amounting to 35%, including the supplement, must be taken into account. If the actual conversion percentage from N to NOx is available in the literature, the actual conversion percentage, increased by the 25% supplement, can be taken into account in a quantitative risk analysis. No distinction is made between the conversion of N to NOx in a fire in heterogeneous and monotype storage. Table 3. Conversion Factors for Combustion Products
Element Combustion Product Conversion Factor C CO2 1 H H2O 1 Cl HCl 1 Br HBr 1 F HF 1 N NO2 0.35 S SO2 1

- 14 -
4.2.4.2. Emission of Non-combusted Toxic Product The amount of non-combusted material that is released during a fire depends greatly on the properties of the burning materials and on the conditions during the fire. Considering the current level of technology, a quantitative evaluation in this respect would go too far. This is why providing the following rules of thumb will suffice: − for materials with a flash point ≤100 ºC, 10% shall be released − for materials with a flash point > 100 ºC, 2% will be released. This rule of thumb is based on the fact that materials with a low flash point evaporate quickly and therefore burn less completely than materials with a low evaporation speed (high flash point). 4.2.4.3. Source Strength Introduction In addition to the above-mentioned conversions, the source strength of the various materials being released is determined by the burn rate (see 4.3.) and by the amount of the chemicals from the material category concerned in the fire. It is difficult to quantify exactly what part the various materials categories in a fire will play. Among other things, this depends on the flammability of the materials and the oxygen requirement for the combustion of the materials. This is why it is assumed that the part that a category plays in the fire is equal to the oxygen requirement for complete combustion of the materials in that category (formula 4.8). During a fire in a storage space, the packaging materials and the flammable formula components will also burn. For those chemicals that are formulated with non-flammable materials, the burn rate will be lower as not all chemicals will reach sufficiently high temperatures that will permit them to evaporate and thus contribute to the fire. Both the influence of the burning of packaging materials and formulated components and the influence of inert filler materials on the resulting burn rate of the active materials cannot be quantified by current level of technology. In this study it has been assumed that the burn rate of the packaging materials and additives is the same as the burn rate of the chemicals. Based on the average structure formula, the emission for a particular toxic combustion product per kg of burnt product can be calculated as shown below. Emission Combustion Products HCl, NO2, SO2 Material category 0 contains all stored materials. The amount of combustion products being released is derived from the combustion equation (4.2). The following conversions in kg per kg of burnt material have been derived from the combustion equation (4.2). Due to the comparable toxic effects, the emissions of HF and HBr are considered to be HCl emissions and added to the HCl emission.

- 15 -
HCl: (cl x 36.5 + f x 20 + br x 81) / M NO2: (n x 46) / M SO2: (s x 64) / M η= ( cl x 36.5 + f x 20 + br x 81 + 0.35.n x 46 + s x 64 ) / M (4.6) in which: η = total conversion in kilograms HCl, NO2 and SO2 per kg of burnt chemicals M = average molar mass of the stored materials (kg/kmol) cl = number of HCl moles formed per mole burnt (mol/mol) f = number of HF moles formed per mole burnt (mol/mol) br = number of HBr moles formed per mole burnt (mol/mol) 0.35.n = number of NO2 moles formed per mole burnt (mol/mol) s = number of SO2 moles formed per mole burnt (mol/mol) 36,5 = molar mass of HCl (kg/kmol) 20 = molar mass of HF (kg/kmol) 81 = molar mass of HBr (kg/kmol) 46 = molar mass of NO2 (kg/kmol) 64 = molar mass of SO2 (kg/kmol) The source strength at NO2, HCl and SO2 is calculated from the conversion above and the burn rate: m = η x B0 (4.7) in which: m = source strength of toxic combustion products NO2, HCl and SO2 (kg/s) B0 = burn rate of category 0 materials determined using formula 4.5 Emission from Non-combusted Material This scenario is important for the chemicals that also fall into subcategory 1: highly toxic materials (LD50rat,oral ≤ 25 mg/kg). The burn rate for subcategory 1 materials are determined as follows: − With the aid of formula 4.1. an average structure formula is determined for the
subcategory 1 materials. − The oxygen requirement for the burning of 1 mole of average subcategory 1 material
is determined using equation 4.2. − The burn rate of subcategory 1 materials is equal to the burn rate of category 0
multiplied by the relative oxygen requirement of subcategory 1 with regard to the oxygen requirement of category 0:
B1 = [O2]1 / [O2]0 x B0 (4.8)

- 16 -
in which: B1 = burn rate of subcategory 1 materials (kg/s) B0 = burn rate of category 0 materials (kg/s) [O2]0 = oxygen requirement for complete burning of the category 0 materials; this is
equal to the total number of category 0 material moles multiplied with the oxygen requirement per mole of category 0 material (equation 4.2.)
[O2]1 = oxygen needed for complete burning of the subcategory 1 materials; this is equal to the total number of subcategory 1 material moles multiplied with the oxygen requirement per mole of subcategory 1 material (equation 4.2.)
The source strength of the non-combusted material is determined as follows: m = 0.02 or 0.1 x %active1 x B1 (4.9) in which: m = source strength of non-combusted very toxic material (kg/s) %active1 = weighted average weight percentage of active category 1 material B1 = burn rate for subcategory 1 materials (kg/s) 4.2.5. Toxicity This Section deals with the toxicity of the various materials that may be released in a fire, namely: the toxic combustion products NO2, HCl, SO2 and non-combusted, very toxic material. Toxic Combustion Products NO2, HCl, SO2 The source strength for toxic combustion products is determined in 4.2.4. The source strength consists of a mixture of NO2, HCl and SO2. The calculation of the damage resulting from exposure to a particular concentration of a toxic material for a certain length of time occurs through the use of the probit function concerned. The Green Book provides a method for calculating the probit functions of people. For some 30 materials probit functions have been derived from this. Whenever there is a case of exposure to a mixture of materials, as is often the case for toxic combustion products, a special probit must be used. It has been derived that for mixtures of materials with a comparable toxic effect, the common probit is provided by: Pr = a1 + ln { [(f1C)n1+Σi δi(fiC)ni] x t} (4.10) in which: Pr probit value a1, n1 probit constants for material 1 ai, ni probit constants for material i (i = 2, 3, ...) f1, fi weight fraction of the material concerned in the mixture

- 17 -
C sum of the concentrations of the materials [mg/m3] δi exp(ai - a1). For a mixture of NO2, SO2 and HCl and assuming the probit functions from the Green Book it means: Pr = -18.6 + ln { [ (fNO2C)3.7 + 0.549 (fSO2C)2.4 + 1.47 x 10⁵ (fHClC) ] x t } (4.11) The 4.11 probit function can only be derived if b=1 in Pr = a + b ln (Cn x t). In the risk evaluation subcommittee of the Commission for the Prevention of Disasters, it has been agreed that for HCl the probit function will be Pr = -37.3 + 3.69 ln (C x t). This probit function will not allow the probit for the mixture to be derived as b = 3.69. If the user wishes to take Pr = -37.3 + 3.69 ln (C x t) for HCl into account then the risks for NO2, SO2 en HCl can be calculated separately and the results of the individual calculations can then be added up. The probit relations for SO2 and NO2 are: SO2: Pr = -19.2 + ln (C1.9 x t) NO2: Pr = -18.6 + ln (C3.7 x t) (The results of the two calculation methods differ marginally). Very Toxic Material The damage models in the Damage Book can be used to calculate the damage resulting from exposure to non-combusted very toxic products. 4.2.6. Dispersion An important aspect of the dispersion of materials as a result of a fire is the possibility of plume rise. It has already been indicated in 4.2.1. that the emissions into the area of the fire scenarios are related to the duration of the fire in which plume rise occurs. Therefore, plume rise does not play a part in dispersion calculations in this study. The source height for the dispersion of materials being released from the storage space is equated to the height of the ventilation outlets. If the ventilation outlets have been created at the top of the storage area, the source height is equal to the height of the storage space. Considering that it is assumed that the products being released will disperse like a neutral gas in the area, a neutral, gas-dispersion model can be used for the dispersion calculations. As the release occurs from within a (burning) building, mixing of the material being released in the recirculation zone of the building must be taken into consideration. With the aid of the dispersion model the concentrations of the toxic materials that could occur in the area are calculated. The resulting concentrations will be averaged within the dispersion model for a time period that is equal to the exposure duration for people in the area. The concentrations calculated are related to the damage models in 4.2.5. This indicates the damage areas to be expected as a result of a fire in a chemicals storage.

- 18 -
4.3. Frequency Estimates 4.3.1. Introduction The risk analysis method differentiates between the frequency (number of times annually) that a fire will occur in a storage facility and the (development) probability, given a fire, that the fire will grow to a particular fire surface. This development of a fire into a certain volume is expressed in fire scenarios. How quickly a fire develops depends on the effectiveness and reliability of the extinguishing system. If there is a fast-response, effective fire extinguishing system, such as a gas extinguishing system for example, the chance that the fire will spread is small. This means that there is a good chance that the fire area will be small and little chance that it will be large. If the extinguishing system responds slowly, or if there is a delay such as a fire department having to break in for example, the probability of a small fire area will be small as the fire will have plenty of time to develop. This means that there will be little chance that the fire area will be small and a good chance that it will be large. In order to express these potentially different fire developments, different fire scenarios have been defined for each extinguishing system that each have a probability of occurring. If the fire frequency for a storage area is multiplied by the probability of a particular scenario, the frequency of the fire scenario will be derived. If the frequencies for all fire scenarios for a particular storage are added up, this will result in the fire frequency for the storage. In CPR-15/2 it is indicated which fire fighting systems are allowed or required for each protection level. For each of these systems requirements with regard to storage have been formulated that, among other things, concern the permitted storage surface area and the fire resistance of the storage facility. Section 4.3.2 deals with the factors that play a role in determining the fire surface area for the various fire fighting systems. Section 4.3.3 provides the fire frequency of a chemicals storage facility and 4.3.4 indicates the various frequencies of a particular fire scenario for the various fire fighting systems. 4.3.2. Factors that Influence Fire Frequency and Fire Spread The following factors influence the fire frequency and the fire spread. Flammable Materials (K1 and K2) When they are released, flammable materials will greatly contribute to fire spread due to the formation of a burning liquid pool that is expanding. If this may be the case, this must be taken into account when determining the probability of a fire area. Flammable liquids will be released during a fire when as a result of heat radiation from a fire, the packaging fails. A difference must be pointed out here between metal packaging and synthetic packaging. Calculations indicate that with respect to metal packaging, if a metal drum filled with a flammable material is located above a liquid fire of 800 l (4 drums leaking) the drum will not fail. Above the liquid surface the drum will be damaged (flange, filling opening) although this will not cause the drum to empty its contents. It is assumed that synthetic packaging will melt and due to the release of the flammable content will

- 19 -
contribute to fire development. On the basis of the considerations above, it is assumed in the risk analysis methodology that: − K1 and K2 materials stored in metal will not influence the spread of fire − K1 and K2 materials in synthetic packaging, if stored in a rack with a floor with a
partition, will have no effect on the spread of fire − If the extinguishing system does not provide cooling, the storage of K1 and K2
materials in synthetic packaging in a rack without a floor partition will have an effect on the spread of fire. This means a greater probability for a larger fire area.
The presence or absence of flammable materials also affects the probability of fire. This is dealt with in greater detail in the section on probability of fire. Storage Size Maximum storage size for the various extinguishing systems is indicated in the CPR 15-2 and CPR 15-3 guidelines. At its maximum, the fire area will not exceed the maximum storage volume (see also: 4.2.1). The probability of the occurrence of a fire area smaller than 300 m2 is derived from data of the Sprinkler Security Bureau (see: 4.3.4.1). When determining distribution of probability over the larger fire areas for the various systems, it is assumed that the probability of the largest fire areas is the smallest for the most quickly responding systems. This is why for the faster systems a distribution across areas of 300, 900, 1500 and 2500 m2 of 50:40:9:1 was opted for. For those systems with outside intervention, the division is about inversely proportional to the surface areas (P(300):P(900):P(1500) = 5:3:1). The difference between the company fire brigade and the local fire department is to be found in the probability of the creation of a fire area of 300 m2 or more. Ventilation rate During the duration of the fire considered, the building structure is not affected by the fire. If during the duration of the fire the doors are closed, the ventilation rate will be 4 (see also: 4.2.1). If during a fire the doors do not close, the ventilation rate is unlimited. The probability of doors not closing depends of the type of door: − automatic, self closing doors, in case of fire: 0.02 − manually operated doors: 0.10 Automatic self-closing doors are a requirement if the storage area must have been built to resist fire. 4.3.3. Fire Frequency for Chemicals Storage The probability of fire in a chemical storage facility is equal to the probability of fire in a pesticide/herbicide storage area. This has been set to 8.8 x 10⁻⁴ annually in the Pesticide/Herbicide study on the basis of casuistry. Materials can be stored in a chemicals storage facility at 3 different levels of protection. For protection levels 1 and 2, the same probability of fire is assumed as for

- 20 -
pesticide/herbicide storage, namely: 8.8 x 10⁻⁴ annually. The reason for this is that chemicals stored under protection levels 1 and 2 are comparable in the risk they pose with pesticides/herbicides. A lower probability of fire has been determined for chemicals stored at protection level 3. The reason for this is that under protection level 3 no K1, K2 and even virtually no K3 products, except for irritants, may be stored. In other words, materials with a high initial probability of fire are not present. In chemical storage facilities equipped with facilities as required by protection level 3, flammable materials with a flash point higher than 100 oC may be stored in metal packaging. The non-flammable materials may be stored in nonmetallic packaging. The probability of a ignition source starting a fire in such a storage without K1, K2 and almost no K3 is lower. Due to this, it is assumed that in materials stored at protection level 3, the probability of the occurrence of a fire is lower by a factor of 5 than the probability of starting fires in stored materials at protection level 1 or 2. 4.3.4. Probability of a Fire Scenario for the Various Protection Levels/systems The CPR 15-2 guideline distinguishes between three protection levels. At protection level 1 nine different fire fighting systems are differentiated. The options for the various probabilities of a particular fire area are given consecutively for the nine fire fighting systems and the protection levels 2 and 3. The CPR 15-3 guideline does not distinguish protection levels. All stored materials are subject to the protection level 1. 4.3.4.1. System 1: Automatic Sprinkler Installation On the basis of field data from the Sprinkler Security Bureau, an empirical distribution of probability has been derived for pesticide/herbicide storage from a number of possible fire areas that can occur in the case of sprinkler installations. Areas of 20, 50, 100 and 300 m2 are assigned a probability of 0.45, 0.44, 0.10 and 0.01 respectively. In doing so, larger areas are equated to 300 m2. If for stacking the sprinklers have been mounted in the racks, a slightly higher probability of smaller fire areas will be assumed, equivalent to the automatic deluge (system 2). In cases of an infinite ventilation rate fire areas larger than 300 m2 can contribute to the risk and this is why in this study the above-mentioned distribution of probability has been extended with fire areas as 900, 1500 and 2500 m2. In determining the distribution of probability for the larger fire areas it is assumed that the probability of the largest fire areas is the smallest. A subdivision for areas of 300, 900, 1500 and 2500 m2 of 50:40:9:1 has been assumed (see: 4.3.2). The probability of the various fire areas must be multiplied by the probability of closed doors: 1-Pdo (ventilation rate 4) or the probability of open doors: Pdo (ventilation rate ∞). Considering the extinguishing system, the storage of flammable products has no influence on the probability of a particular fire area, but does influence the probability of a fire.

- 21 -
Table 4 Fire Scenarios System 1: Automatic Sprinkler Ventilation rate Fire Area
[m2] 4 ∞
Fire duration [min.]
Probability [-]
Fire duration [min.]
Probability [-]
20 30 0.45 (1 – Pdo) 0.633) (1 – Pdo)
30 0.45 Pdo 0.633) Pdo
50 30 0.44 (1 – Pdo) 0.263) (1 – Pdo)
30 0.44 Pdo 0.263) Pdo
100 30 0.1 (1 – Pdo)
30 0.1 Pdo
300 202) 0.01 (1 – Pdo)
202) 0.005 Pdo
9001) - -
202) 0.004 Pdo
1500 - -
202) 0.0009 Pdo
2500 - -
202) 0.0001 Pdo
Notes: 1) If K1 and K2 is stored in synthetics without a floor partition, the maximum area will be 800
m2. The probability of this fire area is 0.005 2) If the fire resistance of the storage space is greater than 20 minutes, the fire duration will be
30 minutes. 3) These probabilities apply to a sprinkler installation that has been mounted in storage racks.
4.3.4.2. System 2: Automatic Deluge Installation With regard to the automatic sprinkler, the automatic deluge has the advantage that immediately after fire detection an entire section will be kept wet. A sprinkler is one step behind the fire (heat) development. This advantage is expressed particularly clearly in cases of more compact stacking and pool fires. This is indicated in the table by a slightly higher probability of a small fire area than that for a sprinkler.

- 22 -
Table 5. Fire Scenarios System 2: Automatic Deluge Ventilation rate Fire Area
[m2] 4 ∞
Fire duration [min.]
Probability [-]
Fire duration [min.]
Probability [-]
20 30 0.63 (1 – Pdo)
30 0.63 Pdo
50 30 0.26 (1 – Pdo)
30 0.26 Pdo
100 30 0.1 (1 – Pdo)
30 0.1 Pdo
300 201) 0.01 (1 – Pdo)
201) 0.005 Pdo
900 - -
201) 0.004 Pdo
1500 - -
201) 0.0009 Pdo
2500 - -
201) 0.0001 Pdo
Notes: 1) If the fire resistance of the storage space is greater than 20 minutes, the fire duration will be
30 minutes.
4.3.4.3. System 3: Automatic Gas Extinguishing Installation An automatic gas extinguishing installation may only be installed in a storage area of no more than 600 m2 and that has a fire resistance of 30 minutes and in which no smoke hatches may be applied. The space is therefore considered to be gas-tight. In deviation from the distribution of probability for sprinkler installations, it is assumed in the case of a gas extinguishing installation that due to the small storage space and the limited supply of oxygen only a small oxygen-restricted fire is possible during normal operation. In that case, the fire duration is set to 5 minutes. The probability of failure of the gas extinguishing installation is equal to that for a sprinkler, namely: 0.01. The cause of failure could be no extinguishing (probability: 0.005) or non-closure of the doors (probability 0.005). If the cause of failure is the non-automatic closure of the doors, a maximum area-restricted fire will occur. Table 6 Fire Scenarios System 3: Automatic Gas Extinguishing
Ventilation rate Fire Area [m2]
4 ∞
Fire duration [min.]
Probability [-]
Fire duration [min.]
Probability [-]
20 5 0.99
- -
600 30 0.005 30 0.005 4.3.4.4. System 4: Local Fire Department with Dry Deluge System

- 23 -
When the local fire department is to fight fires, the storage area may not be larger than 500 m2 with a fire resistance of 60 minutes (30 minutes if the deployment time of the local fire department < 6 minutes). It is assumed that the fire has achieved its maximum volume in the period up to the possibility of deployment of the fire department. This could be an oxygen-restricted fire, probability: 1-Pdo, or an area-restricted fire, probability: Pdo. If ventilation is unlimited (probability: Pdo) the fire can expand to 500 m2. It is assumed that the probability of a fire of 300 m2 or 500 m2 is inversely proportional to the area for systems in which the fire department must take action. For this system this means the probability of 300 m2 is 0.6; probability for 500 m2 is 0.4. Table 7 Fire Scenarios System 4: Local Fire Department with Dry Deluge
Ventilation rate Fire Area [m2]
4 ∞
Fire duration [min.]
Probability [-]
Fire duration [min.]
Probability [-]
300 30 1 (1 – Pdo)
202) 0.6 Pdo
5001) - - 202) 0.4 Pdo Notes: 1) If K1 and K2 is stored in synthetics without a floor partition, the maximum area will be 100
m2. 2) If the fire resistance of the storage space is greater than 20 minutes, the fire duration will be
30 minutes. 4.3.4.5. System 5: Automatic Hi-ex Installation When an automatic hi-ex installation is used, the storage area must have been built to resist fire for 30 minutes and the storage space may not exceed 1500 m2. The storage is equipped with a smoke and heat conveyance installation (smoke hatches). A hi-ex installation extinguishes the fire using high-expansion foam. This means that if the fire is to be extinguished properly, the smoke hatches must be open and there must be an unlimited supply of oxygen to the fire. The fire extinguishing activity is about the same as a gas extinguishing installation. Considering that the system is somewhat more complex than a gas extinguishing system, probabilities are slightly higher up to 100 m2.

- 24 -
Table 8 Fire Scenarios System 6: Automatic hi-ex Installation Fire Area [m2]
Ventilation rate ∞
Fire duration [min.]
Probability [-]
20 10
0.89
50 10
0.09
100 10
0.01
300 30
0.005
900 30
0.004
1500 30 0.001 4.3.4.6. System 6: Company Fire Brigade with Manual Deluge Installation When utilizing this fire fighting system the storage must be designed to be resistant to fire for 30 minutes.The maximum area is 2500 m2. When determining the distribution of probability for the fire areas, it is assumed that it will take more time to switch on a manually operated deluge installation than to get an automatic one operational. In this case, the probability of failure lies in the installation not being operational. As this involves human failure, this probability is derived from data about human failure under stress and is set at 0.1. If the doors are not closed (probability: Pdo), a larger area-restricted fire could also occur. This probability is distributed across the fire areas of 300 m2 and more in the same manner as for the sprinkler system.

- 25 -
Table 9 Fire Scenarios System 6: Company Fire Brigade with Manual Deluge Ventilation rate Fire Area
[m2] 4 ∞
Fire duration [min.]
Probability [-]
Fire duration [min.]
Probability [-]
20 30 0.35 (1 – Pdo)
30 0.35 Pdo
50 30 0.45 (1 – Pdo)
30 0.45 Pdo
100 30 0.1 (1 – Pdo)
30 0.1 Pdo
300 30 0.1 (1 – Pdo)
30 0.05 Pdo
9001) - -
30 0.04 Pdo
1500 - -
30 0.009 Pdo
2500 - -
30 0.001 Pdo
Notes: 1) Maximum storage space 600 m2 when storing K1 and K2 materials in synthetic packaging
(probability: 0.05).
4.3.4.7. System 7: Company Fire Brigade with Dry System Also when applying this fire fighting system will the storage area have to be fire resistant for 30 minutes and the maximum storage area will not exceed 2500 m2. When determining the distribution of probability is was assumed that extinguishing with a dry system is slower than using a deluge system. Therefore, there is a greater probability of larger fire areas. If the doors are not closed (probability: Pdo), a larger area restricted fire could also occur. This probability is distributed across the fire areas of 300 m2 and more in the same manner as for the sprinkler system.

- 26 -
Table 10 Fire Scenarios System 7: Company Fire Brigade with Dry System Ventilation rate Fire Area
[m2] 4 ∞
Fire duration [min.]
Probability [-]
Fire duration [min.]
Probability [-]
50 30 0.2 (1 – Pdo)
30 0.2 Pdo
100 30 0.3 (1 – Pdo)
30 0.3 Pdo
3001) 30 0.5 (1 – Pdo)
30 0.25 Pdo
900 - -
30 0.2 Pdo
1500 - -
30 0.045 Pdo
2500 - -
30 0.005 Pdo
Notes: 1) Maximum storage space 300 m2 when storing K1 and K2 materials in synthetic packaging
(probability: 0.5).
4.3.4.8. System 8: Company Fire Brigade with on-site Extinguishing (interior fire attack) When this fire fighting system (company fire brigade interior fire control capability) is applied the storage must be designed to resist fire for 60 minutes. The area may not exceed 1500 m2. The storage area is equipped with smoke hatches. When the fire brigade is deployed the smoke hatches must be open. Ventilation will then be unlimited. The distribution of probability across the various fire areas for opened smoke hatches (ventilation rate ∞) is determined analogically as it is for system 7, taking into account that it is now even more difficult to extinguish the fire. The probability of fires ≥ 300 m2 is distributed across 300, 900 and 1500 m2 as 5:3:1, approximately inversely proportional to the areas. If in the case of the system flammable liquids have been stored, a minimum fire volume of 300 m2 will be assumed.

- 27 -
Table 11 Fire Scenarios System 8: Company Fire Brigade with Interior Fire Control Fire Area [m2]
Ventilation rate ∞
Fire duration [min.]
Probability [-]
50 30
0.2
100 30
0.3
3001) 30
0.28
900 30
0.16
1500 30 0.06 Notes: 1) Maximum storage space 300 m2 when storing K1 and K2 materials in synthetic packaging
(probability: 0.5).
4.3.4.9. System 9: Automatic Hi-ex with Inside Air In this system there is no smoke and heat conveyance installation present. The extinguishing effectiveness is approximately equivalent to a gas extinguishing installation. Considering that the system is somewhat more complex than a gas extinguishing installation, the probabilities are a somewhat higher up to 100 m2. A hi-ex installation will not work if ventilation is ∞and this is why a fire duration of 30 minutes is assumed each time. Table 12. Fire Scenarios System 9: Automatic hi-ex with Inside Air
Ventilation rate Fire Area [m2]
4 ∞
Fire duration [min.]
Probability [-]
Fire duration [min.]
Probability [-]
20 10 0.89 (1 – Pdo)
30 0.89 Pdo
50 10 0.09 (1 – Pdo)
30 0.09 Pdo
100 10 0.01 (1 – Pdo)
30 0.01 Pdo
300 30 0.01 (1 – Pdo)
30 0.005 Pdo
900 - -
30 0.004 Pdo
1500 - -
30 0.0009 Pdo
2500 - -
30 0.0001 Pdo
4.3.4.10. Protection Level 2: < 6 Minutes

- 28 -
The distribution of probability for the fire areas for protection level 2 with a mobilization time for the community fire department of less than 6 minutes is equated to the company fire brigade with interior fire control capability (system 8). Table 13 Fire Scenarios Protection Level 2: Mobilization Time < 6 Minutes
Fire Area [m2]
Ventilation rate ∞
Fire duration [min.]
Probability [-] no K1 and K2 in Synthetics
Probability [-] K1 and K2 in Synthetics
50 30 0.2
100 30 0.3
300 30 0.28
0.72
800 30 0.28
900 30 0.16
15001) 30 0.04
2500 30 0.02 Notes: 1) Maximum storage space 1500 m2 when storing K1 and K2 materials in metal packaging
(probability: 0.06).
4.3.4.11. Protection Level 2: < 15 Minutes The distribution of probabilities for the fire areas for protection level 2 with a mobilization time for the community fire department less than 15 minutes is slightly more conservatively assumed than for protection level 2 with a mobilization time of 6 minutes.

- 29 -
Table 14 Fire Scenarios Protection Level 2: Mobilization Time < 15 Minutes Fire Area [m2]
Ventilation rate ∞
Fire duration [min.]
Probability [-] no K1 and K2 in Synthetics
Probability [-] K1 and K2 in Synthetics
300 202) 0.78
0.55
800 202) 0.45
900 202) 0.16
15001) 202) 0.04
2500 202) 0.02 Notes: 1) Maximum storage space 1500 m2 when storing K1 and K2 materials in metal packaging
(probability: 0.06). 2) Fire duration is 30 minutes if the fire resistance is ≥ 30 minutes.
4.3.4.12. Protection Level 3 At protection level 3 it is not assumed that the fire department will restrict the fire to smaller than 300 m2. The probabilities of a particular fire area are inversely proportional to the assumed area. As indicated in 4.3.3., the fire frequency for protection level 3 is: 1.8 10-4 annually. Table 15 Fire Scenarios Protection Level 3
Fire Area [m2]
Ventilation rate ∞
Fire duration [min.]
Probability [-]
300 201)
0.78
900 201)
0.16
1500 201)
0.04
2500 201)
0.02
Notes: 1) Fire duration is 30 minutes if fire resistance is ≥ 30 minutes.
4.4. Calculation of Individual and Societal Risk In addition to the data above, a number of subsequent probabilities are important for risk calculation. These subsequent probabilities refer to the prevention of meteorological

- 30 -
conditions. The meteorological conditions: stability of the atmosphere, wind speed and wind direction are important to the dispersion calculations. The risk calculation consists of jointly considering the damage areas of the distinguished fire scenarios and the corresponding probabilities of occurrence, development and lethality. 4.5. Sample Calculation for Fire in a Chemicals Storage Facility 4.5.1. Description of the Storage Facility In order to determine the risk of a fire in a chemicals storage facility, the following storage is assumed in this sample calculation. The storage area has a total surface area of 1500 m2; length times width of 50 x 30 and a height of 6 m. The ventilation rate of the storage amounts to 4. The storage area is equipped with an automatic hi-ex installation with inside air (system 9, see: Section 4.3.4). The area is equipped with manually operated doors. The following materials are present in the storage facility:
Material Amount [Metric Tons]
Aniline 200 chloroform 320 ethylene glycol 250 Phenol 200 Furfural 100 hexandiol 185 formic acid 140 salicydic acid 320 sulfurylchloride 200 Ethane tetrachloride 305 Urea 100
Very toxic materials with a LD50 (rat, oral ≤25 mg/kg) are not present in the sample storage. 4.5.2. Effect and Damage Calculation for Fire The effect and damage calculations occur in accordance with the schedule in figure 4.1. 4.5.2.1. Fire Scenario Fire Duration The fire duration for a fire in which an automatic hi-ex installation goes into operation, is set at 10 minutes (= time to extinguish fire). If the extinguishing installation fails, the fire duration is set to a maximum of 30 minutes (see table 12).

- 31 -
Fire Area The size of the fire area is largely determined by the oxygen supply and also depends on the fire fighting system. The distribution of probability drawn up for a hi-ex installation with inside air is given in table 12 for a number of fire areas. The maximum fire area will be equal to the area of the storage area, namely: 1500 m2. Ventilation rate The ventilation rate (the number of air cycles per hour) of the storage area is 4. This ventilation rate is applicable if the doors of the storage space are closed. If the doors (manually operated) are open during the fire, the ventilation is unlimited. Table 16 contains a summary of the effect of the premises above for the fire scenario with regard to fire duration, fire area and ventilation rate. Table 16. Ventilation rate, Fire Area and Fire Duration for the Sample Storage Facility
Fire Scenario Ventilation rate Fire area [m2]
Fire duration [min]
Fire in the storage space
Doors closed: 4 20
10
4 50
10
4 100
10
4 300
30
Doors open: ∞ 20
30
∞ 50
30
∞ 100
30
∞ 300
30
∞ 900
30
∞ 1500 30 4.5.2.2 Stored Materials From the list of stored products provided in Section 4.5.1. it follows that: − no flammable K1 or K2 materials are stored − no highly toxic materials (LD50rat, oral ≤ 25 mg/kg) are stored. All stored materials belong to category 0: materials that produce (toxic) combustion products. The storage involves technically pure materials, meaning 100% active material.

- 32 -
Fire in the Storage Space Materials : 'mix': see 4.5.1. Storage amount : 2320 metric tons Average Structure Formula (according to formula 4.1) : C3.28H4.35O1.38Cl1.10N0.23S0.06 Average molecule weight : 110.1 kg/kmol Combustion formula : quantitative conversion, see formula 4.2.a C3.28H4.35O1.38Cl1.10N0.23S0.06 + 3.543 O2 → 3.28 CO2 + 1.625 H2O + 1.10 HCl + 0.0805 NO2 + 0.07475 N2 + 0.06 SO2 Oxygen requirement Z0 : 3.543 kmol O2/kmol 'mix' 4.5.2.3. Burn Rate Burn rate refers to the amount of the material (or mix of materials) that burns per time unit (kg/s). Section 4.2.3. describes how the burn rate is calculated. Area-restricted Fire An area-restricted fire is said to exist if the amount of oxygen available does not constitute a restriction to the fire (in case of unrestricted ventilation through open doors or in case of closed doors and a small fire area). In that case, the burn rate per surface area unit will at its maximum be equivalent to the evaporation speed of the material which in general is 0.025 kg/s.m2. Maximum burn rate is then calculated by multiplying by fire area A (formula 4.3.): Bmax = 0.025 x A kg/s Oxygen-restricted Fire When the available amount of oxygen is smaller than the amount of oxygen required for an area-restricted fire (the maximum burn rate) the fire is oxygen-restricted (this will occur quite rapidly if doors are closed). The available amount of oxygen comes from the air that is present in the storage area (1500 m2 x 6 m) and from the ventilation air conveyed (ventilation speed = 4). The amount of oxygen available when the doors are closed is determined on the basis of equation 4.4.: mO2 = 0.2 (1 + 0.5 x F) V / (24 x 1800)
= 0.2 (1 + 0.5 x 4) x (1500 x 6) / (24 x 1800) = 0.125 kmol/s Subsequently, the burn rate is calculated based on the oxygen requirement of burning Z0 (see Section 4.5.2.2). The following burn rate has been calculated for an oxygen-restricted fire (in accordance with formula 4.5.): B0 = mO2 x M/Z0 = 0.125 x 110.1 / 3.543 = 3.88 kg/s

- 33 -
Burn rates for the Scenario The burn rates for the scenario are arrived at by multiplying the fire area of the scenario with the maximum burn rate (0.025 kg/m2) on the understanding that if the ventilation rate is 4, the burn rate can never become greater than the burn rate calculated above for an oxygen-restricted fire. The burn rates are provided in table 17. 4.5.2.4. Source Strength It can be deduced from Section 4.5.2.2. that no highly toxic materials are stored. Due to this, the release of toxic non-combusted product does not contribute significantly to the risk for the environment of a fire in the storage space. The release of the following toxic combustion products determine the risk: NO2, SO2 and HCl. The creation of these products result from the combustion formula as set up in Section 4.5.2.2. In general, it is assumed that there will be a quantitative conversion. The emission of toxic combustion products (in kg per kg of burnt product) for a fire in the storage space is calculated according to formula 4.6.: η = ( Cl x 36.5 + n x 46 x 0.35 + s x 64 ) / M (4.6) η = ( 1.10 x 36.5 + 0.23 x 46 x 0.35 + 0.06 x 64 ) / 110.1
= 0.4332 kg combustion product / kg of burnt material
HCl fraction in the combustion product: 1.10 x 36.5 / (1.10 x 36.5 + 0.23 x 46 x 0.35 + 0.06 x 64 ) = 0.842
SO2 fraction in the combustion product: 0.06 x 64 / (1.10 x 36.5 + 0.23 x 46 x 0.35 + 0.06 x 64 ) = 0.080
NO2 fraction in the combustion product: 0.23 x 46 x 0.35 / (1.10 x 36.5 + 0.23 x 46 x 0.35 + 0.06 x 64 ) = 0.078
The source strength in kg/s (formula 4.7) is then determined by multiplying by the burn rate that is determined in Section 4.5.2.3. The resulting values are provided in table 18.. 4.5.2.5. Toxicity Damage models have been derived in accordance with the methodology described in 4.2.5. for the toxic combustion products determined in Section 4.5.2.4. Fire in the Storage Space Toxic combustion product : 7.8% NO2, 84.2% HCl, 8.0% SO2 filled in in equation 4.11. this results in: Pr = -18.6 + ln { [ (fNO2C)3.7 + 0.549 (fSO2C)2.4 + 1.47 105 (fHClC) ] x t } Pr = -18.6 + ln { [ 7.96 10-5 C3.7 + 1.28 10-3 C2.4 + 1.238 105 C ] x t }

- 34 -
From this probit function, the following lethal concentrations for an exposure duration of 10 and 30 minutes were calculated: t = 10 min LC50 = 3735 mg/m3 t = 30 min LC50 = 2473 mg/m3
LC01 = 1224 mg/m3 LC01 = 461 mg/m3
4.5.2.6. Dispersion The emissions to the environment for the fire scenario are related to the duration of the fire in which no plume rise occurs. Therefore, plume rise plays no role in dispersion calculations in this study. For the purpose of calculating the dispersion in the area it is assumed that the smoke gasses will first be mixed in the recirculation zone of the storage building. In order to attribute this, an area source with a length and width that is equal to the root of the surface area (in m2) of the storage is assumed. In this example this would be the root of 1500 m2 which is approx. 39 m. The distribution is calculated with the neutral gas dispersion model. The concentrations of the toxic combustion products that may occur in the environment have been calculated. The concentrations that occur are averaged out within the dispersion model over a duration that is equal to the exposure duration of people in the area. The concentrations calculated are related to the probit functions for lethality in 4.5.2.5. from which the damage areas to be expected follow for a fire in the chemicals storage. The results of the dispersion calculations are summarized in table 18. 4.5.3. Probability Estimates In Section 4.3. the probability estimate for various fire fighting systems has been worked out. As the storage facility in question is equipped with an automatic hi-ex installation with inside air, the probabilities provided for system 9 are applicable. This involves the following probability aspects: − Fire frequency = 8.8.10-4 annually − Probability distribution for the two ventilation rates considered: − Ventilation rate = 4, manually operated doors are closed: probability = 1-Pdo = 0.90 − Ventilation rate = ∞(= unlimited), doors open: probability = Pdo = 0.10. − Probability of fire expansion in case of an automatic hi-ex installation with inside air.
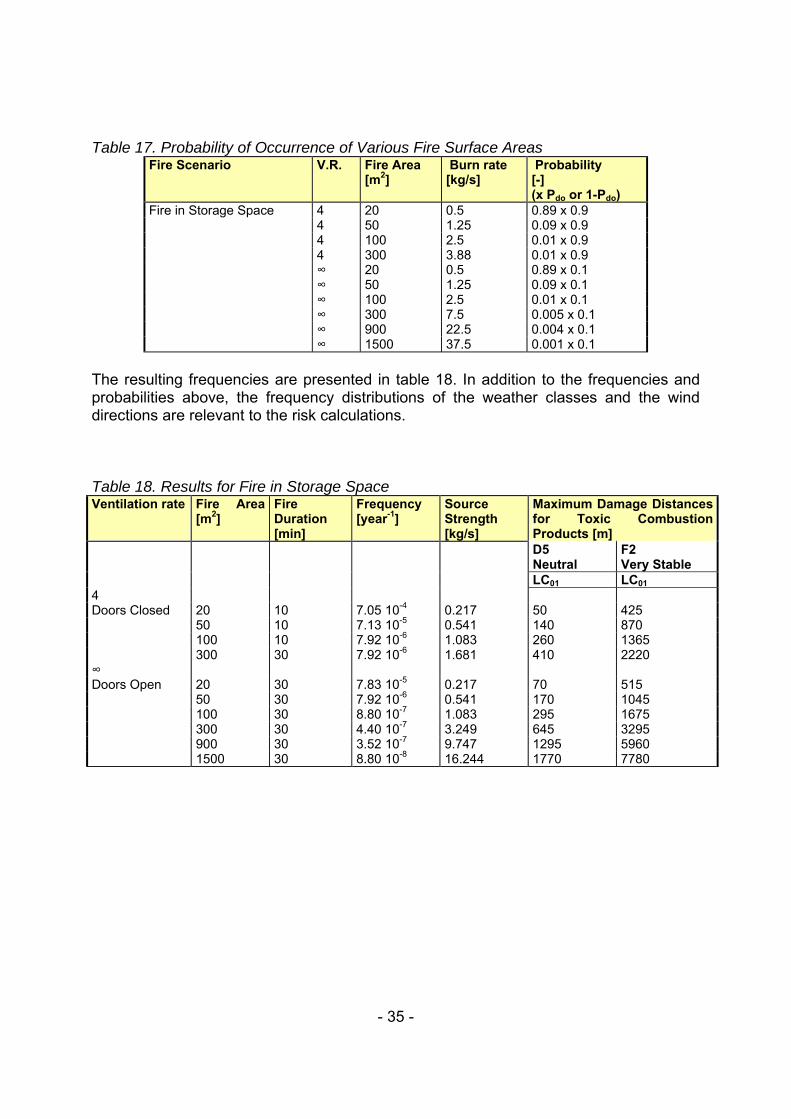
The probability of the differentiated fire areas from table 17 are derived from table 12:
- 35 -
Table 17. Probability of Occurrence of Various Fire Surface Areas Fire Scenario V.R. Fire Area
[m2] Burn rate [kg/s]
Probability [-] (x Pdo or 1-Pdo)
Fire in Storage Space 4 20 0.5 0.89 x 0.9 4 50 1.25 0.09 x 0.9 4 100 2.5 0.01 x 0.9 4 300 3.88 0.01 x 0.9 ∞ 20 0.5 0.89 x 0.1 ∞ 50 1.25 0.09 x 0.1 ∞ 100 2.5 0.01 x 0.1 ∞ 300 7.5 0.005 x 0.1 ∞ 900 22.5 0.004 x 0.1 ∞ 1500 37.5 0.001 x 0.1
The resulting frequencies are presented in table 18. In addition to the frequencies and probabilities above, the frequency distributions of the weather classes and the wind directions are relevant to the risk calculations. Table 18. Results for Fire in Storage Space Ventilation rate Fire Area
[m2] Fire Duration [min]
Frequency [year-1]
Source Strength [kg/s]
Maximum Damage Distances for Toxic Combustion Products [m]
D5 Neutral
F2 Very Stable
LC01 LC01 4 Doors Closed 20 10 7.05 10-4 0.217 50 425 50 10 7.13 10-5 0.541 140 870 100 10 7.92 10-6 1.083 260 1365 300 30 7.92 10-6 1.681 410 2220 ∞ Doors Open 20 30 7.83 10-5 0.217 70 515 50 30 7.92 10-6 0.541 170 1045 100 30 8.80 10-7 1.083 295 1675 300 30 4.40 10-7 3.249 645 3295 900 30 3.52 10-7 9.747 1295 5960 1500 30 8.80 10-8 16.244 1770 7780


