19th Jan 2017 - old.indianivesh.inold.indianivesh.in/Downloads/636523165126931184... · RETAIL...
11
19th Jan 2017 RETAIL TECHNICAL RESEARCH IndiaNivesh Securities Ltd 19th Jan 2017 1 of 11 IndiaNivesh Weekly Pulse Midcaps continue to suffer despite the pre-Budget Rally on the Street! Chart 1 : Nifty - Daily Source: IndiaNivesh Research Market Outlook Initially, the week began on an electrifying note on the D - Street following the cues from positive IIP numbers. Later on, the Bulls stayed on the driving seat throughout the week to conquer the milestone of 35000 for the BSE SENSEX and 10900 for the NIFTY spot. Meanwhile, the much awaited breakout was observed in the Nifty Bank index above the 26000 mark. The index not only sustained above the same but outperformed the markets by almost reaching the 27000 zone. Eventually, the index Nifty gained almost 2% from the last week. The journey was not that smoothed as the end suggests for the participants on the D - Street. The markets underwent tremendous choppiness while the benchmark indices were rising. The MIDCAP and the SMALL CAP stocks suffered heavy correction on the back of profit booking despite the positive sentiments. During the week, the index Nifty spot negated the resistance of 10780 level formed by the ‘Rising Channel’ on the daily chart. Later on, we discussed in Nivesh Overview that the price action and the data suggests that the markets are poised for further upside towards 10840 – 11000 levels which are the Fibonacci extension levels of the previous move shown in the inset. In line with that view the index is now near the 10900 mark. The constant OI built-up in PEs along with the fall in premium indicates further upside. Thus directionally some more upside cannot be ruled out from here on. However, due to the recent choppiness ahead of the Mega event ‘Union Budget - 2018’ we reiterate our view that the prudent strategy is to avoid getting into this bandwagon. We advise traders to keep booking their short term bets and refrain themselves from carrying any overleveraged positions. On the downside, the intermediate supports are placed at 10780 – 10650 for the index. Close 10895 R1 / R2 11000/ 11050 S1 / S2 10780/ 10650 50 EMA 10456 100 EMA 10267 200 EMA 9923 Mehul Kothari Sr. Technical Analyst - Equity Tel: +91 22 62406416 [email protected]
-
Upload
phamnguyet -
Category
Documents
-
view
216 -
download
3
Transcript of 19th Jan 2017 - old.indianivesh.inold.indianivesh.in/Downloads/636523165126931184... · RETAIL...

19th Jan 2017
RETAIL TECHNICAL RESEARCH
IndiaNivesh Securities Ltd
19th Jan 2017
1 of 11
IndiaNivesh Weekly Pulse Midcaps continue to suffer despite the pre-Budget Rally on the Street!
Chart 1 : Nifty - Daily
Source: IndiaNivesh Research
Market Outlook
Initially, the week began on an electrifying note on the D - Street following the cues from positive IIP numbers. Later on, the Bulls stayed on the
driving seat throughout the week to conquer the milestone of 35000 for the BSE SENSEX and 10900 for the NIFTY spot. Meanwhile, the much awaited
breakout was observed in the Nifty Bank index above the 26000 mark. The index not only sustained above the same but outperformed the markets by
almost reaching the 27000 zone. Eventually, the index Nifty gained almost 2% from the last week. The journey was not that smoothed as the end
suggests for the participants on the D - Street. The markets underwent tremendous choppiness while the benchmark indices were rising. The MIDCAP
and the SMALL CAP stocks suffered heavy correction on the back of profit booking despite the positive sentiments.
During the week, the index Nifty spot negated the resistance of 10780 level formed by the ‘Rising Channel’ on the daily chart . Later on, we
discussed in Nivesh Overview that the price action and the data suggests that the markets are poised for further upside towards 10840 – 11000 levels
which are the Fibonacci extension levels of the previous move shown in the inset. In line with that view the index is now near the 10900 mark. The
constant OI built-up in PEs along with the fall in premium indicates further upside. Thus directionally some more upside cannot be ruled out from here
on. However, due to the recent choppiness ahead of the Mega event ‘Union Budget - 2018’ we reiterate our view that the prudent strategy is to avoid
getting into this bandwagon. We advise traders to keep booking their short term bets and refrain themselves from carrying any overleveraged
positions. On the downside, the intermediate supports are placed at 10780 – 10650 for the index.
Close 10895
R1 / R2 11000/ 11050
S1 / S2 10780/ 10650
50 EMA 10456
100 EMA 10267
200 EMA 9923
Mehul Kothari Sr. Technical Analyst - Equity Tel: +91 22 62406416 [email protected]

IndiaNivesh Weekly Pulse
IndiaNivesh Securities Ltd
19th Jan 2017
2 of 11
Chart 2 : DALMIA BHARAT – Daily (Prev. Close : 3028) Chart 3 : DLF – Daily (Prev. Close : 249)
The stock is at the threshold of a trend line breakdown. A move below the same could lead to some
correction. (Neutral)
Even DLF is at the threshold of a trend line breakdown. A move below the same could lead to some
correction. (Neutral)
Chart 4 : THERMAX - Daily (Prev. Close : 1293) Chart 5: UPL – Daily (Prev. Close : 802)
The stock has already confirmed a trend line breakdown. A move below the low could lead to some correction. (Neutral)
The stock gave a breakout from the falling trend line on the daily chart which is a sign of strength. (Bullish)
Source: IndiaNivesh Research
Trend lines are a visual representation of support and resistance in any timeframe and a simple tool available for trend analysis. The greater the number of touch points increases the importance, break on the either side may lead to major moves or trend reversals. The above charts will help you go through recent trend line breakouts / breakdowns.
Trend lines in Actions

IndiaNivesh Weekly Pulse
IndiaNivesh Securities Ltd
19th Jan 2017
3 of 11
Chart 6 : GNFC – Weekly (Prev. Close : 495) Chart 7 : JUBILANT LIFE – Weekly (Prev. Close : 879)
Huge volumes recorded near life high are indicating overwhelming demand in the stock. (Bullish) Heavy volumes along with price breakout indicate fresh momentum going ahead. (Bullish)
Chart 8 : JUBLFOOD – Daily (Prev. Close : 2093) Chart 9 : NIITTECH – Daily (Prev. Close : 728)
The stock registered a new high with exceptional volumes today which suggest fresh upside from here on. (Bullish)
Extra ordinary volumes when the stock is near long term resistance; suggests possibility of breakout. (Neutral)
Source: IndiaNivesh Research
The given stocks witnessed climatic volumes during the week went by.
Volume Shockers

IndiaNivesh Weekly Pulse
IndiaNivesh Securities Ltd
19th Jan 2017
4 of 11
Chart 10 : CYIENT - Weekly (Prev. Close : 653) Chart 11 : EICHER- Weekly (Prev. Close : 28009)
A close above upper Bollinger band and at 52 weeks high on weekly chart indicates fresh up move. (Bullish)
Breakdown from the lower Bollinger band along with breaking the multiple support level indicates fresh downside for stock. (Bearish)
Chart 12 : IBULHSGFIN - Daily (Prev. Close : 1301) Chart 13 : ICICIBANK - Weekly (Prev. Close : 353)
A close above upper Bollinger band after a squeeze in prices indicates fresh up move. (Bullish) A close above upper Bollinger band and at multiyear high on weekly chart indicates fresh up move.
(Bullish)
Source: IndiaNivesh Research
Bollinger Band contraction represents period of low volatility and may be considered by traders for a potential sign of future increased volatility and possible trading opportunities. Thus, in the
above examples we have shared few stocks which underwent a breakout / breakdown from the Bollinger band that indicating further acceleration in the on-going trend.
Trend lines in Actions
Bollinger Band breakouts / breakdowns

IndiaNivesh Weekly Pulse
IndiaNivesh Securities Ltd
19th Jan 2017
5 of 11
Source: IndiaNivesh Research
The Averages
An exponential moving average (EMA) is a variant of moving average which is similar to a simple moving average, apart from the weightage as more weight is given to the recent closing prices.
We have added 50, 100 and 200 DEMA to our analysis which represents short-term, medium term and long term trend respectively. As short term traders can use 50 DEMA swing trading decisions, while 100 DEMA can be used by medium term. The long-term investors will focus on 200 DEMA and could consider the same for accumulation & distribution of their investments.
The Daily Exponential Moving Average (DEMA) is suited for trending market however it could possibly witness multiple cross over in sideways trend. When the market is trending and in oscillation mode as well has sustained trending nature, the DEMA will also show a similar oscillation & vice-versa.
However to limit the multiple whipsaws to a certain extent, the stocks mentioned in the table have closed 1% above or below the respective moving averages.
Going ahead, these averages can act as initial filter to on-going trend, or could possibly consider as support & resistance.

IndiaNivesh Weekly Pulse
IndiaNivesh Securities Ltd
19th Jan 2017
6 of 11
Stocks above 70 & below 30 Relative Strength Index
Source: IndiaNivesh Research
RSI- The above shown chart represents the comparison of price action of benchmark index Nifty vis a vis the overbought/ oversold zone of Nifty 50 stocks considering the value of daily RSI.
The Overbought zone occurs when the RSI value crosses 70 levels while the oversold zone occurs when it plunges below 30 levels.
As per last three years data, we can analyse that, whenever the number of overbought stocks in Nifty 50 goes above 12 the market tend to make an intermediate top, while oversold position
occurs when number of oversold stocks of Nifty 50 goes above 13 the market tend to form intermediate bottom.
As per the above logic, above shown chart suggests that the overbought number of stocks in Nifty is rising but still not at the peak.
Nifty 50 – Overbought / Oversold

IndiaNivesh Weekly Pulse
IndiaNivesh Securities Ltd
19th Jan 2017
7 of 11
Chart 14: S H KELKAR – Weekly Chart
Source: IndiaNivesh Research
Stock Outlook
The corrective move from the high of 362.90 got arrested exactly at the 78.6% Fibonacci retracement level of the previous rally.
Recently the stock confirmed higher top and higher bottom formation on the weekly chart which indicates bullish trend.
During the week, we witnessed exceptional volumes with positive price action along with rise in delivery participation which specifies
accumulation in the stock.
Thus, we recommend buying the stock in the range 306 - 300 with a stop loss of 281 for the target of 347 / 360.
BUY Prev. Close – 306
Target 360
Stop Loss 281
52 Weeks High
333
52 Weeks Low
236
50 EMA 276.85
100 EMA 273
200 EMA 274
Stock of the Week

IndiaNivesh Weekly Pulse
IndiaNivesh Securities Ltd
19th Jan 2017
8 of 11
Weekly - Open Interest Shockers
Source: IndiaNivesh Research
Nifty Option Snapshot
Source: IndiaNivesh Research
As per the Nifty option chain, we are observing highest open interest built up in the 10700 strike PEs and 10800 strike PEs to the tune of around than 7 million and 6 million respectively. On the
calls front, highest open interest built up is seen at 10800 strike CEs and 11000 strike CEs tune of 4.8 million and 5.8 million respectively. Now, as per the recent change in open interest we
observed heavy built up in 10800 strike PEs to the tune of almost 1.4mn shares along with fall in price which indicates strong base getting build at 10800 mark. On the calls front fresh built up was
observed in 10950 strike but that was not huge. The data suggests that the downside is getting capped near 10800 for the series. The PCR is now at 1.57 which is quiet high.
Weekly Derivatives Analysis
IndiaNivesh Weekly Pulse
IndiaNivesh Securities Ltd
19th Jan 2017
9 of 11
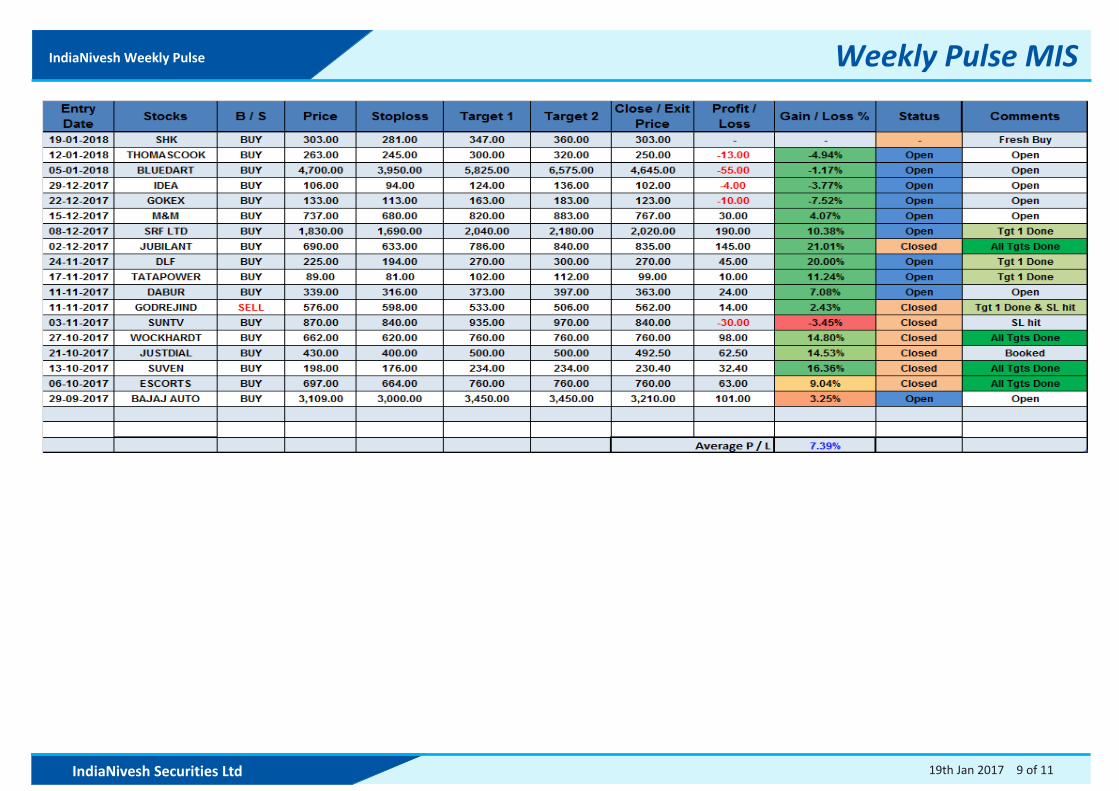
Weekly Pulse MIS

IndiaNivesh Weekly Pulse
IndiaNivesh Securities Ltd
19th Jan 2017
10 of 11
Disclaimer: This document has been prepared by IndiaNivesh Securities Limited (“INSL”), for use by the recipient as information only and is not for circulation or public distribution. INSL includes subsidiaries, group and associate companies, promoters, employees and affiliates. This document is published in accordance with Regulation 18 of the Securities and Exchange Board of India (Research Analysts) Regulations, 2014. INSL researches, aggregates and faithfully reproduces information available in public domain and other sources, considered to be reliable and makes them available for the recipient, though its accuracy or completeness has not been verified by INSL independently and cannot be guaranteed. This document is not to be altered, transmitted, reproduced, copied, redistributed, uploaded or published or made available to others, in any form, in whole or in part, for any purpose without prior written permission from INSL. This document is solely for information purpose and should not to be construed as an offer to sell or the solicitation of an offer to buy any security. Recipients of this document should be aware that past performance is not necessarily a guide for future performance and price and value of investments can go up or down. The suitability or otherwise of any investments will depend upon the recipients particular circumstances. INSL does not take responsibility thereof. The information contained in this document has been obtained from sources that are considered as reliable though its accuracy or completeness has not been verified by INSL independently and cannot be guaranteed. INSL has not independently verified all the information contained within this document. The research analysts of INSL have adhered to the code of conduct under Regulation 24 (2) of the Securities and Exchange Board of India (Research Analysts) Regulations, 2014. Nothing in this document constitutes investment, legal, accounting and/or tax advice or a representation that any investment or strategy is suitable or appropriate to recipients’ specific circumstances. INSL does not accept any responsibility or whatever nature for the information, assurances and statements given or made available herein or for any omission or for any liability arising from the use of this document. Information mentioned is the current information as of the date appearing on this document only. INSL directors/ employees and its clients may have holdings in the stocks mentioned in the document. This report is based on technical and derivative analysis on studying charts of a stock's price movement, outstanding positions and trading volume, as opposed to focusing on a company's fundamentals and, as such, may not match with a report on a company's fundamentals. Following table contains the disclosure of interest in order to adhere to utmost transparency in the matter.
Disclosure of Interest Statement
1 Details of business activity of IndiaNivesh Securities Limited (INSL) INSL is a Stock Broker registered with BSE, NSE and MCX - SX in all the major segments viz. Cash, F & O and CDS segments. INSL is also a Depository Participant and registered with both Depository viz. CDSL and NSDL. Further, INSL is a Registered Portfolio Manager and is registered with SEBI.
2 Details of Disciplinary History of INSL No disciplinary action is / was running / initiated against INSL
3 Details of Associates of INSL Please refer to the important 'Stock Holding Disclosure' report on the IndiaNivesh website (investment Research Section -http://www.indianivesh.in/Research/Holding_Disclosure.aspx?id=10 link). Also, please refer to the latest update on respective stocks for the disclosure status in respect of those stocks. INSL and its affiliates may have investment positions in the stocks recommended in this report.
4 Research analyst or INSL or its relatives'/associates' financial interest in the subject company and nature of such financial interest
No (except to the extent of shares held by Research analyst or INSL or its relatives'/associates')
5 Research analyst or INSL or its relatives'/associates' actual/beneficial ownership of 1% or more in securities of the subject company, at the end of the month immediately preceding the date of publication of the document.
Please refer to the important 'Stock Holding Disclosure' report on the IndiaNivesh website (investment Research Section - http://www.indianivesh.in/Research/Holding_Disclosure.aspx?id=10 link). Also, please refer to the latest update on respective stocks for the disclosure status in respect of those stocks. INSL and its affiliates may have investment positions in the stocks recommended in this report.
6 Research analyst or INSL or its relatives'/associates' any other material conflict of interest at the time of publication of the document
No
7 Has research analyst or INSL or its associates received any compensation from the subject company in the past 12 months
No
8 Has research analyst or INSL or its associates managed or co-managed public offering of securities for the subject company in the past 12 months
No
9 Has research analyst or INSL or its associates received any compensation for investment banking or merchant banking or brokerage services from the subject company in the past 12 months
No
10 Has research analyst or INSL or its associates received any compensation for products or services other than investment banking or merchant banking or brokerage services from the subject company in the past 12 months
No
11 Has research analyst or INSL or its associates received any compensation or other benefits from the subject company or third party in connection with the document.
No
12 Has research analyst served as an officer, director or employee of the subject company No
13 Has research analyst or INSL engaged in market making activity for the subject company No
14 Other disclosures No

IndiaNivesh Weekly Pulse
IndiaNivesh Securities Ltd
19th Jan 2017
11 of 11
INSL, its affiliates, directors, its proprietary trading and investment businesses may, from time to time, make investment decisions that are inconsistent with or contradictory to the recommendations expressed herein. The views contained in this document are those of the analyst, and the company may or may not subscribe to all the views expressed within. This information is subject to change, as per applicable law, without any prior notice. INSL reserves the right to make modifications and alternations to this statement, as may be required, from time to time.
IndiaNivesh Securities Limited
Research Analyst SEBI Registration No. INH000000511
Corporate Office: Lodha Supremus, 17th Floor, Senapati Bapat Marg, Lower Parel (West), Mumbai - 400 013.
Registered Office: 601 & 602, Sukh Sagar, N. S. Patkar Marg, Girgaum Chowpatty, Mumbai - 400 007.
Tel (Board): 022 6240 6240 | Fax: 022 6240 6241
e-mail: [email protected] | Website: www.indianivesh.in