19Accelerating Infrastructure Development
18
19 Accelerating Infrastructure Development
Transcript of 19Accelerating Infrastructure Development

19Accelerating Infrastructure Development

Chapter 19 Accelerating Infrastructure Development | 171
Chapter 19
Accelerating Infrastructure DevelopmentThe Philippine Development Plan (PDP) 2017-2022 and the 0-10 Point Socioeconomic Agenda identify infrastructure development among the top priorities of the government to sustain inclusive economic growth, generate new jobs, and improve the quality of life in both urban and rural communities.
The “Build, Build, Build” agenda of the government is seen to boost infrastructure development and usher in the envisioned “Golden Age of Infrastructure” of the country in the medium term by intensifying investments on public infrastructure whilst addressing implementation bottlenecks, ensuring the readiness of infrastructure programs and projects (PAPs) in the pipeline, and enhancing the absorptive capacities of implementing agencies in project preparation, development, and implementation.
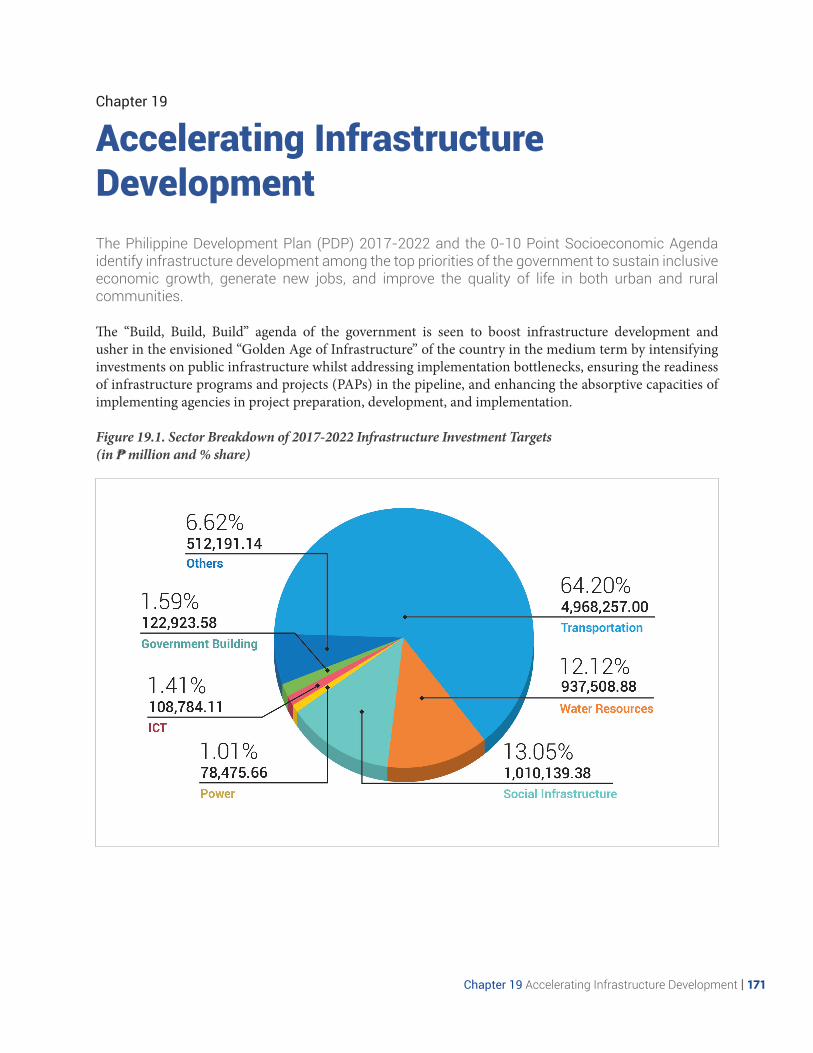
Figure 19.1. Sector Breakdown of 2017-2022 Infrastructure Investment Targets(in ₱ million and % share)

172 | 2017-2022 Public Investment Program
A total of 4,490 infrastructure PAPs on transportation, water resources, energy, social, information and communications technology (ICT), and other public infrastructure, with total investment targets of ₱7,738,279.75 million over the medium term,1 are deemed responsive to the goals and outcomes of the infrastructure sector embodied in the PDP 2017-2022. Of the said total number of PAPs, 332 PAPs2 are identified as big ticket PAPs or Core Investment Programs/Projects (CIPs), amounting to ₱4,865,496.26 million, which represent the pipeline of PAPs that shall require the review/approval of the National Economic and Development Authority (NEDA) Board - Investment Coordination Committee (ICC) prior to implementation.
Infrastructure development, as a cross-cutting strategy, plays an indispensable role in sustaining the growth momentum, safeguarding a clean and healthy environment, and providing support to the other productive sectors of the economy. Aside from the infrastructure PAPs in this Chapter, 494 additional PAPs amounting to ₱1,317,825.00 million correspond to the goals and outcomes of the social development (including housing requirements), peace and security, and environment and natural resources sectors, hence, are provided in the other respective Chapters of the 2017-2022 Public Investment Program (PIP).
INFRASTRUCTURE FLAGSHIP PROJECTSOf the priority infrastructure PAPs of the government, the NEDA Board approved the adoption of 75 high-impact Infrastructure Flagship Projects that represent the major capital undertakings that the government will implement within the medium term. These projects are envisioned to enhance the connectivity and the promotion of growth centers outside the urban-industrial region centered around Metro Manila, and are expected to significantly contribute to the government’s “Build, Build, Build” agenda. A Project Facilitation, Monitoring, and Innovation (PFMI) Task Force was created to ensure efficient and timely implementation of these flagship projects.
1 There are additional 91 PAPs submitted by the Department of Public Works and Highways (DPWH) but will be considered in the next updating of the 2017-2022 PIP, pending the submission of the project details by DPWH.2 As submitted by the implementing agencies and confirmed by the concerned Planning Committees/Subcommittees, some of the CIPs were classified as Tier 1 (Ongoing) based on Department of Budget and Management’s Two-Tier Budget Approach, but have yet to commence actual construction/civil works, secure ICC approval, etc.

Chapter 19 Accelerating Infrastructure Development | 173
Figure 19.2. Major Infrastructure PAPs

174 | 2017-2022 Public Investment Program
LINKAGE WITH THE PDP AND ITS RESULTS MATRICESThe strategic framework of the sector as provided in the PDP identifies five infrastructure intermediate outcomes that are responsive to the sector outcomes and to the overarching societal goal of providing the underlying foundation for inclusive growth, a high-trust society, and a globally competitive knowledge economy. Figure 19.3. Strategic Framework to Accelerate Infrastructure Development

Chapter 19 Accelerating Infrastructure Development | 175
The major PAPs highlighted in the succeeding sections of this Chapter correspond to the following infrastructure intermediate outcomes embodied in the Plan:
a. Efficiency, transparency, and participation in governance enhanced;b. Competitiveness and productivity of economic sectors increased;c. Gaps in basic infrastructure for human capital development reduced;d. Safety and security against natural and man-made disasters, especially for the poor, improved; ande. Innovative solutions and technologies encouraged/adopted to increase growth potential.
Efficiency, transparency, and participation in governance enhancedRecognizing the role of ICT as a vital tool for good governance, the government will continue to enhance the country's e-government system. The National Government Portal (NGP),3 with investment targets of ₱2,618.15 million for the period 2018-2022, is a one-stop shop portal to be implemented by the Department of Information and Communications Technology (DICT) that will provide access to reliable government online services, data, and information. The project further aims to provide a mechanism that will unite all web-based government content to maximize efficiency, and provide rapid and high-quality services to citizens.
Competitiveness and productivity of economic sectors increasedRoad Transport
To provide an adequate, accessible, reliable, and safe access for the people and goods, and to increase the travel speed in key corridors, the road network of the country will be improved through implementation of several projects, among others:
a. Panguil Bay Bridge Project; b. Cavite-Laguna Expressway;c. Bonifacio Global City to Ortigas Center Road Link Project;d. Widening/improvement of General Luis St.-Kaybiga-Polo-Novaliches Road;e. Davao City Bypass Road;f. Metro Manila Interchange Construction Project, Phase VI;g. North Luzon Expressway-South Luzon Expressway (NLEX-SLEX) Connector Road Project; andh. Central Luzon Link Expressway (CLLEX) Project, Phase I.
The quality of existing roads, including local, farm-to-market, and farm-to-mill roads, will be enhanced through road rehabilitation and improvement programs. Provision of adequate access to tourism destination and industrial sites will be ensured through convergence programs between the DPWH, Department of Tourism, and Department of Trade and Industry. Further, accessibility throughout the country will be improved through the construction of long-span inter-island bridges such as the Panay-Guimaras-Negros Island Bridge and the Nationwide Island Link Bridges.
3 NGP is included in the list of PAPs under Chapter 5: Ensuring People-Centered, Clean, and Efficient Governance.

176 | 2017-2022 Public Investment Program
Mass Transport Network
The movement of people and goods along high density corridors will be enhanced through the provision of new mass transport facilities, among others:
a. Mindanao Railway Project;b. Philippine National Railways (PNR) South Commuter Line;c. PNR South Long Haul;d. PNR North 1 (Tutuban-Malolos);e. PNR North 2 (Malolos-Clark Airport-Clark Green City Rail);f. MRT-LRT Grand Unified Station Project;g. Metro Manila Bus Rapid Transit (BRT) - Line 1 (Quezon Avenue); andh. Metro Manila BRT - Line 2 (EDSA/Central).
These projects are expected to reduce travel time and ensure that the passenger and cargo traffic can be accommodated. Moreover, the construction of Integrated Transport System Terminals will reduce transfer time due to more convenient and efficient passenger transfer.
Air and Water Transport
Further support to logistics will be provided through the construction, rehabilitation, and improvement of airports and seaports. The capacity and efficiency of existing facilities will be enhanced to accommodate the expected increase in traffic. The following projects, among others, will be undertaken to achieve the said outcome:
a. Clark International Airport New Terminal Building Project;b. Development, Operations and Maintenance of Regional Airports (Bacolod-Silay, Davao, Iloilo,
Laguindingan, and New Bohol); andc. New Cebu International Container Port.
Irrigation
Irrigation is an important component in improving productivity and ensuring sustainability of the agriculture sector. To accelerate irrigation development, the PDP supports the establishment and rehabilitation of small-scale and community-based irrigation projects in areas not served by national irrigations systems.
The National Irrigation Administration (NIA) will invest approximately ₱71,782.56 million within the next five years in the construction of small reservoir irrigation projects (SRIP), such as the Asbang SRIP in Davao del Sur, as well as ₱31,290.24 million for the repair and rehabilitation of existing communal irrigation systems.
Development of various multi-purpose irrigation projects, which include construction of storage and diversion dams, transbasin tunnel, power plant, irrigation, and drainage facilities will also be implemented. Among the projects that will provide water supply for irrigation, mitigate flooding, and generate additional hydroelectric power are the following:
a. Gregorio Del Pilar Impounding Project;b. Tumauini River Multipurpose Project;c. Panay River Basin Integrated Development Project;d. Bohol Northeast Basin Multipurpose Project; ande. Ilocos Norte Irrigation Project, Stage 2.

Chapter 19 Accelerating Infrastructure Development | 177
Upon completion of the irrigation projects, it is expected that irrigation service coverage will increase by 452,167 hectares (ha), while 134, 270 ha and 117,742 ha will be restored and rehabilitated, respectively.
Power Generation
Demand for electricity continues to increase with growth in economic activities. Said demand for electricity is expected to escalate up to 29,852 megawatts (MW), 9,210MW, and 10,225MW for the Luzon, Visayas, and Mindanao grids by 2040, respectively.
To ensure adequate supply of electricity in the country, the government will need to provide an additional capacity of 43,765MW from 2016-2040. The required additional capacity using the 70-20-10 baseload, mid-merit, and peaking energy mix directive proposed by the Department of Energy (DOE) is shown in the following table:
Table 19.1. Required Capacity Addition from 2016-2040
CAPACITY ADDITION (MW)LUZON VISAYAS MINDANAO TOTAL
Baseload (coal, geothermal, existing natural gas, biomass,a impounding hydro, and nuclear) 13,635 5,330 6,300 25,265
Mid-merit (new natural gas) 8,300 3,000 3,200 14,500Peaking (oil, solar pv,b wind, and run-of-river hydro) 2,450 850 700 4,000Total per grid 24,385 9,180 10,200 43,765
Source: DOENotes: Baseload - running on a 24/7basis; aBiomass is baseload only during availability of feedstock; Mid-Merit – running for long period but more flexible in operation compared to baseload; and Peaking – fast start and can be used during peak periods; bSolar output during daytime only.
As of December 31, 2017, the country reached a total dependable capacity of 20,515MW (i.e., 98% and 2% of which are from on-grid and off-grid power plants, respectively) or about 90.26 percent of the total installed capacity of 22,728MW. Meanwhile, DOE identified a total of 8,018MW and 8,990MW committed and indicative capacities of power projects, respectively, of the private sector to be implemented from 2018-2025 to address the energy security concern. The timely completion of said projects will require the support of concerned government agencies on the issuances of various permits and clearances.
As part of its mandate to explore, develop, and utilize indigenous and environment-friendly resources, DOE will continue to closely monitor the development of private sector-led power projects to ensure that the required capacity addition by the country will be met.
ICT Infrastructure
The government will continue to improve the connectivity of digital infrastructure systems in the country. To increase the number of individuals with access to the internet and online government services, DICT will embark on the implementation of the National Broadband Plan that aims to provide the overall development framework for ensuring the availability, affordability, and quality of broadband internet access with a total of ₱ 77,881.33 million estimated investments targets from 2017-2020.
Another project of the DICT, the Juan Konek! Free Wi-Fi Internet Access in Public Places Project, will target to deliver 99 percent internet connectivity in the country by investing ₱18,713.52 million from 2017-2020.

178 | 2017-2022 Public Investment Program
Gaps in basic infrastructure for human capital development reduced4
Water Supply and Sanitation
The Sagana at Ligtas na Tubig para sa Lahat (SALINTUBIG) Program aims to provide water supply systems to waterless municipalities, barangays with high poverty incidence, resettlement areas without water access, and areas that have existing health centers without water supply facilities. The said program, which started in 2011 with investment targets of ₱28,289.13 million until 2022, will continue to increase access to safe water.
Meanwhile, to augment the increasing water demand in Metro Manila and adjacent areas, development of a potential new water source will be pursued by the Metropolitan Waterworks and Sewerage System (MWSS) through the proposed New Centennial Water Source – Kaliwa Dam Project. Outside of Metro Manila, Construction of Level III Potable Water Supply Systems will be implemented by the Local Water Utilities Administration (LWUA), wherein an estimated additional 290,909 persons will have piped access to potable water after its completion. The said water supply projects of MWSS and LWUA have 2017-2022 investment targets of ₱23,589.00 million. Also, a total of about ₱1,766.50 million is programmed for the implementation of various water supply projects in the Autonomous Region in Muslim Mindanao (ARMM).
Moreover, to provide adequate sanitation services, LWUA, in coordination with the DPWH and the Department of Environment and Natural Resources (DENR), will implement the Development of Sewerage and Septage Management Systems in Water District Areas along Manila Bay with an estimated investment targets of ₱2,524.00 million. By 2020, 78 water districts along Manila Bay are expected to have sewerage and septage facilities through the said program.
Electrification
To achieve the goals of 100 percent electrification of all Philippine Statistics Authority (PSA)-identified households (based on 2015 census) by 2022 and nationwide electrification by 2040, various electrification PAPs utilizing appropriate electrification strategies and technologies will be implemented to provide access to electricity to unelectrified, off-grid, island, remote, and last mile communities. The National Electrification Administration (NEA) will continue to implement its Barangay Line Enhancement Program5 and Sitio Electrification Program (SEP)6 to provide access to electricity to rural areas within the franchise areas of electric cooperatives (ECs). The new program of NEA entitled the Strategized SEP for Off-grid Rural Electrification through Renewable Energy (RE) is aimed at providing remote areas with 24-hour access to electricity by integrating other RE systems to the original SEP design.
Meanwhile, the National Power Corporation – Small Power Utilities Group will implement various capacity additions and transmission projects under its Missionary Electrification Plan to support off-grid and island development. Furthermore, the Access to Sustainable Energy Programme of DOE is expected to provide at least 100,000 households nationwide access to electricity, and at the same time enhance the capacity of government agencies, regulators, and ECs involved in the energy sector to develop, implement, and monitor electrification projects.
4 Refer to Chapter 12: Building Safe and Secure Communities for the investment targets for the housing sector.5 A program of NEA that aims to connect previously electrified barangays to the grid.6 A program of NEA that aims to provide electricity access to communities within the franchise area of ECs which are not yet being served by generating sets for mini/micro grids and Solar Home Systems for isolated households.

Chapter 19 Accelerating Infrastructure Development | 179
School Buildings
The expansion of the Basic Educational Facilities Fund (BEFF) will be pursued by the Department of Education (DepEd) to augment the requirements resulting from the implementation of the Kindergarten to 12 (K to 12) Basic Education Program, particularly on the enrollment increments in existing schools and establishment of new schools for Kinder, Grades 1 to 10, and Grades 11 to 12.
For 2018, the program will include the provision of 37,233 quality classrooms, rehabilitation of 20,000 existing classrooms, replacement of 1,681,325 seats, and procurement of 22,649 sets of furniture/fixture for the workshops/laboratories. Health Facilities The Department of Health (DOH) will continue the construction and upgrading of health facilities nationwide through the Health Facilities Enhancement Program, with 2017-2022 investment targets of ₱259,036.35 million. The program consists of the following:
• Upgrading of all current government infirmaries and municipal and district hospitals to Level 1 Hospitals with at least 50 bed capacity;
• Establishment of one Level 2 250-bed Provincial Hospital in all provinces;• Upgrading of all Provincial Hospitals into Level 2 Hospitals with at least 250 beds;• Upgrading of all current DOH infirmaries and Level 1 Hospitals into Level 2 Hospitals;• Upgrading of all current Level 2 DOH Hospitals into Level 3;• Establishment of Regional Specialty Centers in selected DOH Level 3 Hospitals; and• Development of identified DOH Specialty Hospitals as Apex Specialty Center.
Solid Waste Management Facilities
To support the compliance of local government units (LGUs) to the salient requirements of Republic Act No. 9003 or the Ecological Solid Waste Management Act, DENR will implement the Philippine Solid Waste Management Sector Project (PSWMSP).
PSWMSP, with total investment targets of ₱3,572.10 million project for 2017-2022, aims to assist LGUs through investments in solid waste management (SWM) facilities and equipment, which will be complemented with technical assistance for capacity development. The project covers four pilot LGUs, namely: (a) Malay, Aklan; (b) La Trinidad, Benguet; (c) Janiuay, Iloilo; and (d) Del Carmen, Surigao del Norte, to showcase appropriate models for SWM in highly urbanized regions, tourist destination areas, and cluster of municipalities.

180 | 2017-2022 Public Investment Program
Safety and security against natural and man-made disasters, especially for the poor, improvedMaritime Safety and Security Projects
To improve the responsiveness of the government to natural and man-made disasters, necessary facilities and equipment of the Philippine Coast Guard (PCG), such as helicopters and multi-role response vessels, will be procured through the implementation of the following projects, among others:
• Maritime Disaster Response Helicopter Acquisition Project;• PCG and Port Capability Development Project; and• Maritime Safety Capability Improvement Project Phases I and II.
Safer navigation will be achieved through the implementation of projects, such as the Development of Maritime Aids to Navigation, rehabilitation of lighthouses, and provision of night-landing capabilities to regional airports.
Disaster Risk Reduction Facilities
Improvements in disaster risk reduction (DRR) efforts will be pursued. Among these is the Volcano, Earthquake, and Tsunami Warning Systems for Disaster Risk Reduction in the Philippines Project of the Department of Science and Technology – Philippine Institute of Volcanology and Seismology (DOST - PHIVOLCS), which aims to enhance the country’s tsunami warning system and real-time earthquake and volcano monitoring.
Flood Management Structures
As flood management becomes more challenging due to the increasing frequency of flooding, implementation of flood control measures to mitigate disaster risk and ensure the safety of the people is becoming more urgent and necessary. To reduce frequency of heavy flooding and minimize flood damages, DPWH earmarked over ₱600,129.51 million for the implementation of flood management projects in the next five years, including, among others, Cavite Industrial Area Flood Management Project; Flood Risk Management Project in Cagayan, Tagaloan, and Imus Rivers; and Metro Cebu Flood Control Project. On the other hand, there is a total investment targets of ₱2,361.20 million for the implementation of various flood control projects in ARMM.
Furthermore, part of the overall government strategy to expand the protected flood-prone areas in the country is to complete, update, and implement flood control and drainage master plans and feasibility studies (F/S) of major river basins and principal rivers. Currently, 11 out of the 18 major river basins7 have completed master plans. The preparation of the master plans and F/S for the remaining seven major river basins8 are underway. Meanwhile, DPWH intends to pursue the construction and maintenance of various flood control structures within the major and principal river basins nationwide with investment targets of about ₱31,063.05 million in the medium term.
7 Panay, Cagayan, Agno, Ilog-Hilabangan, Agusan (Upper), Bicol, Mindanao, Pampanga, Tagoloan, Cagayan de Oro, and Pasig-Laguna de Bay.⁷ Abulug-Apayao, Abra, Jalaur, Ilog-Batiano Ranao (Agus), Buayan-Malungon, Davao, and Tagum-Libuganon.

Chapter 19 Accelerating Infrastructure Development | 181
Innovative solutions and technologies encouraged/adopted to increase growth potentialIn line with the government’s thrust to institutionalize research and development (R&D)9 in the country, R&D centers will be established through the Niche Centers in the Regions for R&D Program of DOST. The said program includes the upgrading, development, and acquisition of research equipment to facilitate R&D activities and capacity building for both human resources, and science and technology infrastructure.
HIGHLIGHTS OF THE PIP CHAPTER Implementing Agency The following are the agencies with the largest share of infrastructure investment targets for 2017-2022. Note that these agencies already represent 96.60 percent of the 2017-2022 total investment targets for the sector. The biggest chunk of the investment targets will be for PAPs of DPWH (₱3,237,936.31 million) and the Department of Transportation (DOTr) (₱1,954,674.45 million) to be implemented within the medium term.
Table 19.2. Top Ten Implementing Agencies with Highest Infrastructure Investment Targets
AGENCY NO. OF PAPS
INVESTMENT TARGETS (IN ₱ MILLION)
2017 2018 2019 2020 2021 2022 2017-2022
DPWH 465 369,473.04 478,900.99 527,255.31 615,634.57 628,760.20 617,912.20 3,237,936.31
DOTr 486 22,086.45 249,862.96 405,684.21 487,068.86 431,600.73 358,371.24 1,954,674.45
DepEd 6 118,782.51 78,152.07 78,152.07 78,152.07 78,152.07 78,152.07 509,542.84
DOF 53 81,000.00 86,291.73 81,065.58 81,043.90 81,000.00 81,000.00 491,401.21
DOH 61 29,313.57 154,971.06 126,750.27 106,290.20 27,789.56 23,354.40 468,469.06
OCS9 166 25,808.64 45,181.13 47,849.53 57,503.58 57,708.49 49,990.63 284,041.99
DILG 116 20,009.83 32,008.61 33,554.90 34,805.92 34,775.09 36,653.28 191,807.62
BCDA 25 7,897.75 24,864.19 22,716.50 20,010.00 25,000.00 31,000.00 131,488.44
DICT 34 2,299.07 46,712.87 39,995.21 16,669.56 - - 105,676.71
DA 6 6,010.17 43,937.80 12,513.90 12,513.90 12,513.90 12,513.90 100,003.57
TOTAL 1,418 682,681.02 1,240,883.41 1,375,537.47 1,509,692.55 1,377,300.04 1,288,947.71 7,475,042.20
Spatial CoverageTo improve the connectivity and the promotion of economic clusters in regional and sub-regional growth centers consistent with the country’s National Spatial Strategy, 98 interregional and 4,231 region-specific PAPs amounting to ₱3,319,167.92 million and ₱2,128,915.34 million will be distributed across the regions, respectively. Furthermore, there are 161 nationwide infrastructure projects with investment targets of ₱2,290,196.48 million to be rolled out for implementation by the End-of-Plan period.
⁸ For other R&D initiatives, refer to Chapter 14: Vigorously Advancing Science, Technology, and Innovation.

182 | 2017-2022 Public Investment Program
Table 19.3. PIP Investment Targets by Spatial Coverage
SPATIAL COVERAGE
NO. OF PAPS
INVESTMENT TARGETS (IN ₱ MILLION)
2017 2018 2019 2020 2021 2022 2017-2022 % OF 2017-2022
Nationwide 161 196,508.04 424,869.64 472,612.99 443,754.11 390,937.29 361,514.42 2,290,196.48 29.60%
Interregional 98 315,422.39 473,041.65 546,330.96 663,674.61 663,831.28 656,867.04 3,319,167.92 42.89%
Region-specific 4,231 185,117.81 444,960.06 403,952.98 458,646.21 346,414.24 289,824.04 2,128,915.34 27.51%
ARMMa 1,340 636.52 28,453.15 8,892.56 21,822.14 1,497.13 1,938.40 63,239.89 0.82%
CAR 98 1,016.88 3,210.63 2,273.77 3,392.84 3,600.00 3,796.70 17,290.83 0.22%
NCR 320 93,686.98 171,712.26 187,161.29 187,705.28 166,374.19 158,040.90 964,680.89 12.47%
Region I 165 2,641.59 7,071.04 5,420.76 7,129.83 6,252.36 4,940.56 33,456.14 0.43%
Region II 288 1,158.53 7,685.90 6,532.34 11,194.53 9,856.52 5,057.64 41,485.47 0.54%
Region III 235 11,057.64 32,522.15 32,279.00 26,829.04 29,573.04 26,103.06 158,363.93 2.05%
CALABARZON 168 10,483.86 20,212.20 17,924.75 25,754.34 24,434.03 19,873.12 118,682.30 1.53%
MIMAROPA 172 2,707.29 6,244.96 5,015.96 4,783.36 940.13 790.13 20,481.82 0.26%
Region V 187 2,952.85 8,154.62 5,746.60 12,602.86 9,149.48 7,058.34 45,664.76 0.59%
Region VI 176 5,898.66 9,958.92 9,532.62 20,533.84 17,863.66 16,571.57 80,359.27 1.04%
Region VII 128 6,934.92 5,259.15 3,087.46 18,723.10 7,968.68 7,596.42 49,569.73 0.64%
Region VIIIa 191 5,112.07 13,740.37 5,422.83 5,990.21 3,152.63 1,741.91 35,160.00 0.45%
Region IX 138 3,239.37 8,471.27 4,194.21 2,277.97 6,572.60 13,639.30 38,394.72 0.50%
Region Xa 183 16,668.82 20,613.20 16,696.30 15,651.08 9,842.33 6,882.99 86,354.72 1.12%
Region XI 143 14,499.59 22,864.31 28,942.10 34,855.41 32,382.52 9,142.28 142,686.22 1.84%
Region XIIa 62 1,987.54 3,342.77 1,737.40 4,010.26 4,715.49 3,566.76 19,360.22 0.25%
Caragaa 124 4,434.71 10,826.79 13,651.32 14,764.47 12,223.45 3,079.95 58,980.69 0.76%
No specified region 113 - 64,616.37 49,441.72 40,625.64 16.00 4.00 154,703.74 2.00%
TOTAL 4,490 697,048.24 1,342,871.35 1,422,896.93 1,566,074.93 1,401,182.80 1,308,205.49 7,738,279.75 100.00%
a Five regions with the highest incidence of poverty as of 2015, as per data from the PSA.
Table 19.4. PIP Investment Targets by Major Island Group
SPATIAL COVERAGE NO. OF PAPS
INVESTMENT TARGETS (IN ₱₱ MILLION)
2017 2018 2019 2020 2021 2022 2017-2022 % OF 2017-2022
Nationwide 161 196,508.04 424,869.64 472,612.99 443,754.11 390,937.29 361,514.42 2,290,196.48 29.60%
Interregional 98 315,422.39 473,041.65 546,330.96 663,674.61 663,831.28 656,867.04 3,319,167.92 42.89%
Region-specific 4,231 185,117.81 444,960.06 403,952.98 458,646.21 346,414.24 289,824.04 2,128,915.34 27.51%
Mega Manila 723 115,228.48 224,446.60 237,365.03 240,288.66 220,381.26 204,017.08 1,241,727.11 16.05%
Rest of Luzon 910 10,477.13 32,367.16 24,989.44 39,103.43 29,798.49 21,643.37 158,379.02 2.05%
Visayas 495 17,945.65 28,958.43 18,042.91 45,247.14 28,984.97 25,909.90 165,089.01 2.13%
Mindanao 1,990 41,466.55 94,571.49 74,113.88 93,381.33 67,233.52 38,249.69 409,016.47 5.29%
No specified region 113 - 64,616.37 49,441.72 40,625.64 16.00 4.00 154,703.74 2.00%
TOTAL 4,490 697,048.24 1,342,871.35 1,422,896.93 1,566,074.93 1,401,182.80 1,308,205.49 7,738,279.75 100.00%

Chapter 19 Accelerating Infrastructure Development | 183
Table 19.5. Allocation of Infrastructure Investment Targets
SPATIAL COVERAGE 2017-2022 NOMINAL GRDP (IN ₱ MILLION)b (A)
2017-2022 INVESTMENT TARGETSc (IN ₱ MILLION) (B)
INFRASTRUCTURE INVESTMENT TARGETS TO GRDP RATIO (B/A)
ARMMa 936,425.91 163,927.28 17.51%
CAR 2,168,565.26 101,116.86 4.66%
NCR 46,390,046.53 1,952,682.92 4.21%
Region I 3,819,631.99 279,232.17 7.31%
Region II 2,217,850.83 206,156.12 9.30%
Region III 11,101,575.54 853,024.07 7.68%
CALABARZON 18,974,945.99 1,129,240.32 5.95%
MIMAROPA 1,922,137.39 163,695.21 8.52%
Region V 2,599,814.03 379,239.71 14.59%
Region VI 5,027,128.55 402,663.87 8.01%
Region VII 8,095,155.53 353,599.41 4.37%
Region VIIIa 2,562,849.85 227,130.70 8.86%
Region IX 2,525,885.67 210,738.13 8.34%
Region Xa 4,817,664.86 310,057.02 6.44%
Region XI 5,248,913.63 375,578.15 7.16%
Region XIIa 3,339,097.64 240,739.66 7.21%
Caragaa 1,466,245.83 183,008.44 12.48%
No specified region - 206,449.70 -
TOTAL 123,213,935.00 7,738,279.75 6.28%NATIONAL AVERAGE
a Five regions with the highest incidence of poverty as of 2015, as per data from the PSA. b Source: Medium-Term Fiscal Program Fiscal Year 2017-2022c It is assumed that investment targets for nationwide and interregional projects are distributed equally according to their areas of impact in proportion to their respective populations.
Mode of ImplementationBacked by robust macroeconomic fundamentals and dynamic fiscal strategy, 4,095 PAPs or 91.20 percent of all infrastructure PAPs will be implemented by the national government through the traditional government mode of procurement (i.e., RA 9184 or the Government Procurement Reform Act), while 68 PAPs will be through official development assistance (ODA), and 39 PAPs through public-private partnership (PPP), including joint venture arrangements.

184 | 2017-2022 Public Investment Program
Table 19.6. PIP Investment Targets by Mode of Implementation
MODE OF IMPLEMENTATION
NO. OF PAPS
INVESTMENT TARGETS (IN ₱ MILLION)
2017 2018 2019 2020 2021 2022 2017-2022 % OF 2017-2022
LFP (RA 9184) 4,095 574,179.07 988,678.67 903,514.30 901,793.19 734,634.58 718,090.83 4,820,890.65 62.30%
ODA 68 21,989.22 82,870.96 165,118.02 276,680.15 264,627.07 194,049.31 1,005,334.73 12.99%
PPP 39 99,826.37 166,056.93 219,003.39 254,727.34 271,786.07 268,326.96 1,279,727.06 16.54%
Othersa 227 981.58 101,090.75 134,871.44 132,570.92 129,667.00 127,601.30 626,782.99 8.10%
TBD 61 72.00 4,174.03 389.78 303.32 468.09 137.09 5,544.32 0.07%
TOTAL 4,490 697,048.24 1,342,871.35 1,422,896.93 1,566,074.93 1,401,182.80 1,308,205.49 7,738,279.75 100.00%
a Corporate funds of government-owned and controlled corporations, and internally generated funds of government financial institutions.
Status/Level of ReadinessAs shown in the table below, the infrastructure PAPs in the PIP are currently under various stages of project development. To ensure the timely implementation of these PAPs, concerned implementing agencies must secure project approval (where applicable), including the required funds for project preparation and the necessary right-of-way (ROW) acquisition and resettlement activities, ahead of award of project contract.
Table 19.7. PIP Investment Targets by Status/Level of Readiness
PROJECT READINESSa
NO. OF PAPS
INVESTMENT TARGETS (IN ₱ MILLION)
2017 2018 2019 2020 2021 2022 2017-2022
Ongoing 573 404,702.53 501,579.08 523,515.19 534,309.50 493,541.10 513,087.24 2,970,734.62
Approved (Level 1) 230 2,910.17 56,209.07 117,477.81 187,311.96 163,547.86 97,543.86 625,000.73
Undergoing Approval Process (Level 2)
893 8,767.58 181,513.85 211,332.17 229,993.03 208,243.29 167,292.35 1,007,142.28
For Submission to the Approving Body (Level 3 and Level 4)
2,574 91,858.69 338,434.28 377,317.18 439,160.53 358,782.90 357,295.85 1,962,849.43
Deferred 59 233.24 1,751.51 1,072.22 1,670.00 33,483.46 45,607.94 83,818.37
TBD 161 188,576.03 263,383.56 192,182.36 173,629.91 143,584.19 127,378.25 1,088,734.31
TOTAL 4,490 697,048.24 1,342,871.35 1,422,896.93 1,566,074.93 1,401,182.80 1,308,205.49 7,738,279.75 aLevel 1 – with NEDA Board and/or ICC project approval but not yet ongoingLevel 2 – with F/S completed, for ICC processing in 2017 (where applicable) and for inclusion in the National Expenditure Program (NEP) for 2018Level 3 – with F/S currently being prepared and to be completed in 2017, for ICC processing in 2018 (where applicable) and for inclusion in the NEP for 2019 Level 4 – with Concept Paper and F/S for completion in 2018, for ICC processing in 2019 (where applicable) and for inclusion in the NEP for 2020 To be determined (TBD) – status to be determined upon further validation/confirmation of concerned agencies

Chapter 19 Accelerating Infrastructure Development | 185
ENABLING ENVIRONMENT To ensure the timely implementation of major infrastructure PAPs in the PIP, the following actions/policies/reforms will be pursued:
a. Conduct of F/S and other pre-investment activities. Availability of funds for project preparation (i.e., pre-F/S, F/S, and Detailed Engineering Design) and the necessary ROW acquisition and resettlement activities will be prioritized. In relation thereto, concerned implementing agencies must secure project approval (where applicable), including the required funds for project preparation and the necessary ROW acquisition and resettlement activities, ahead of award of project contract.
b. Absorptive capacities of implementing agencies and contractors. In view of the government’s endeavor to accelerate spending on public infrastructure, the absorptive capacities of the implementing agencies, as well as the availability of contractors to carry out infrastructure projects, will be critical in ensuring that these projects are implemented as planned. In this regard, the necessary institutional support (e.g., administrative overhead and manpower requirements) and capacity building to the concerned agencies on project preparation and implementation should be prioritized.
c. Public Expenditure Management (PEM) and Public Financial Management (PFM) reforms. To minimize underspending on infrastructure and to further strengthen the linkage between planning, budgeting, and implementation, key PEM and PFM approaches/policies10 have already been incorporated in the NEP process. Notwithstanding, continued support to the oversight agencies that are directly involved in implementing PEM/PFM reforms (e.g., Department of Finance, Department of Budget and Management, Commission on Audit, and NEDA) should be sustained to ensure that both national and local governments adhere to the principles of efficiency, accountability, and transparency in the use of public funds.
10 Such as Performance-Informed Budgeting, Program Convergence Budgeting, among others.