1999 ANNUAL REPORT - Cemex · CEMEX is capitalizing on globalization to maximize stock-holders’...
75
1999 ANNUAL REPORT
Transcript of 1999 ANNUAL REPORT - Cemex · CEMEX is capitalizing on globalization to maximize stock-holders’...
1 9 9 9 A N N U A L R E P O R T
table of contents
2 Financial highlights - Provides a snapshot of CEMEX’s 1999financial performance.
4 To our stockholders - CEMEX Chairman & CEO, Lorenzo H.Zambrano, reviews the company’s operational and financial perfor-mance, business strategy, and industry challenges.
why? Highlights exemplary moments that demonstrate whyexisting and potential stockholders should look at CEMEX as a long-term investment opportunity.
20 Review of operations - Summarizes international markethighlights and value opportunities.
26 Selected consolidated financial information - Reviewsrelevant financial data for 1999 and the preceding years.
28 Management discussion and analysis - Examines theresults of 1999.
39 Financial statements - Presents audited financial resultsunder Mexican GAAP.
69 The terms we use - Provides a glossary of relevant financialand industry terms.
70 Board of directors and officers - Gives the composition ofthe company’s Board and biographical information about CEMEX’s topexecutives.
72 Directory - Lists CEMEX’s global offices.
73 Investor information - Provides helpful investor and mediacontacts.
CEMEX todayFounded in 1906, CEMEX is one of the three largest cement companies in the world, with approximately 65 million metric tons of pro-
duction capacity. Through operating subsidiaries positioned in four different continents, CEMEX is engaged in the production, distribu-
tion, marketing, and sale of cement, ready-mix concrete, aggregates, and clinker. In addition, the company is the world’s leading produc-
er of white cement and the world’s largest trader of cement and clinker.
MissionCEMEX’s mission is to serve the global building needs of its customers and build value for its stakeholders by becoming the world’s
most efficient and profitable multinational cement company.

CEMEX is an international growth company led by an inno-
vative, entrepreneurial management team that sells branded
cement products in markets that demand them most. It
achieves significantly greater profitability than its global
competitors and has a double-digit, ten-year compound
annual operating cash flow growth rate.
Brand matters, and CEMEX cement is the building material
of choice in the primary markets that it serves.
CEMEX is changing how the global cement game is played,
offering a total solution to its customers’ needs.
CEMEX is capitalizing on globalization to maximize stock-
holders’ return on equity.
now?why

2
riseearnings per share
89 90 91 92 93 94 95 96 97 98 99 89 90 91 92 93 94 95 96 97 98 99 89 90 91 92 93 94 95 96 97 98 99
Assetsmillions of US dollars
Consolidated net salesmillions of US dollars
Consolidated net incomemillions of US dollars
11,8
64
4,82
8
1,02
9
FINANCIAL HIGHLIGHTS
by 22 percent
12,000
8,000
4,000
0
1,200
800
400
0
5,000
4,000
1,000
3,000
2,000
0

CEMEX, S.A. DE C.V. AND SUBSIDIARIES MILLIONS OF US DOLLARS*AS OF DECEMBER 31, 1999 %
1999 1998 CHANGE
Net Sales 4,828 4,315 12
Operating Profit 1,436 1,178 22
Consolidated Net Income 1,029 843 22
Earnings per Share (BMV: CEMEXCPO)1 0.77 0.64 22
Earnings per ADS (NYSE: CX)2 3.87 3.18 22
Total Assets 11,864 10,460 13
Total Liabilities 5,430 5,321 2
Consolidated Stockholders’ Equity 6,435 5,138 25
3
Data in millions of US dollars, except per-share information*Convenience translation from constant Mexican pesos to US dollars
at the year-end exchange rate. The exchange rate of the Mexican peso to the US dollar at December 31, 1999 and 1998, was $9.51 and $9.90, respectively.
1 Based on 1.256 billion CPO shares for 1999 and 1.262 billion CPO sharesfor 1998.
2 Each ADS represents five CPO shares.
4
excepwe perform
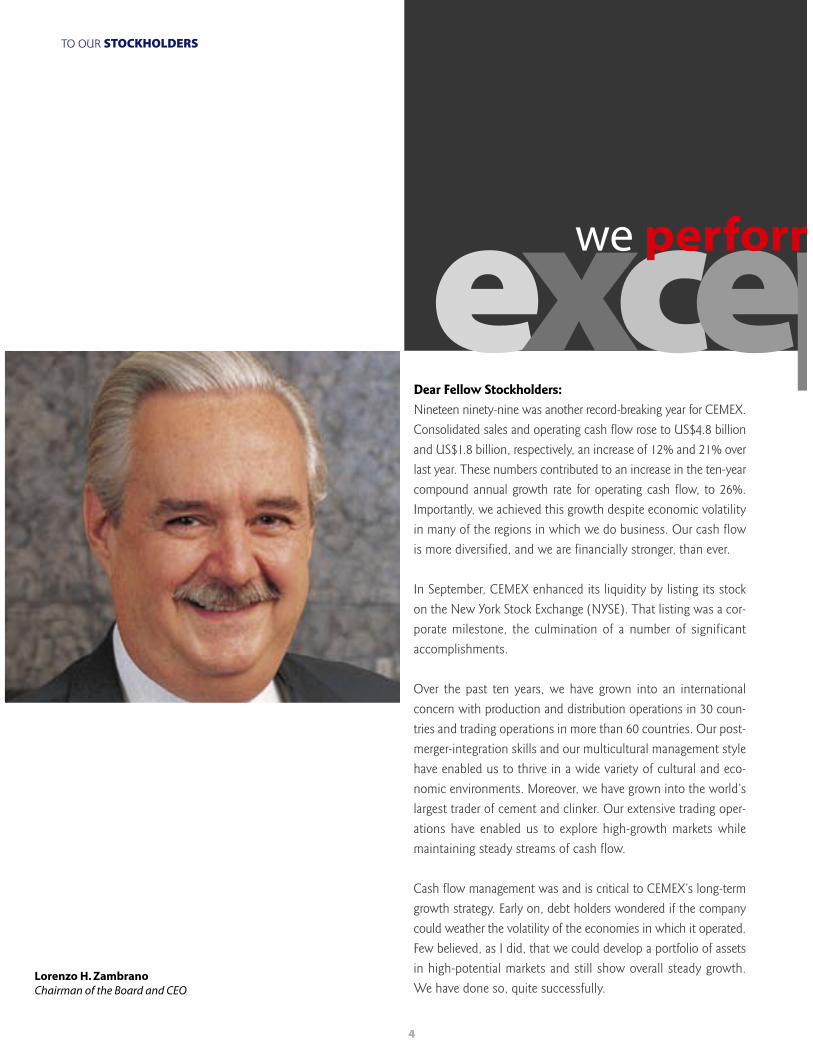
Dear Fellow Stockholders:Nineteen ninety-nine was another record-breaking year for CEMEX.Consolidated sales and operating cash flow rose to US$4.8 billionand US$1.8 billion, respectively, an increase of 12% and 21% overlast year. These numbers contributed to an increase in the ten-yearcompound annual growth rate for operating cash flow, to 26%.Importantly, we achieved this growth despite economic volatilityin many of the regions in which we do business. Our cash flowis more diversified, and we are financially stronger, than ever.
In September, CEMEX enhanced its liquidity by listing its stockon the New York Stock Exchange (NYSE). That listing was a cor-porate milestone, the culmination of a number of significantaccomplishments.
Over the past ten years, we have grown into an internationalconcern with production and distribution operations in 30 coun-tries and trading operations in more than 60 countries. Our post-merger-integration skills and our multicultural management stylehave enabled us to thrive in a wide variety of cultural and eco-nomic environments. Moreover, we have grown into the world’slargest trader of cement and clinker. Our extensive trading oper-ations have enabled us to explore high-growth markets whilemaintaining steady streams of cash flow.
Cash flow management was and is critical to CEMEX’s long-termgrowth strategy. Early on, debt holders wondered if the companycould weather the volatility of the economies in which it operated.Few believed, as I did, that we could develop a portfolio of assetsin high-potential markets and still show overall steady growth.We have done so, quite successfully.
Lorenzo H. ZambranoChairman of the Board and CEO
TO OUR STOCKHOLDERS
5
eptionallyrmed
wellOur expanding presence in Southeast Asia is just one exampleof our ability to thrive in developing markets with uncertaineconomies. In the wake of the Southeast Asian crisis, we havebuilt a strong presence in Indonesia and the Philippines, two ofthe region’s most important markets.
The future of the cement industry – as well as our continuingsuccess – depends upon a keen knowledge of our customers andtheir needs. For some of our most valued and loyal customers – theindividual homebuilders, who represent the majority in our prima-ry markets – cement is fundamental to their future.
One reason these customers hold the key to our future is thatcement demand in the self-construction sector is less affected byvolatile economic conditions. For example, in Mexico in 1995,that sector showed the strongest performance while an economicdownturn rocked the country. Because CEMEX has established astrong brand in this market, consumers have continued to buyits cement products through both tough and prosperous times.That kind of brand loyalty has helped us to maintain high per-formance and growth.
As promised in 1998, we continue to build our brand throughoutthe world. Consumers associate the CEMEX brands with strength,durability, and tradition – the very essence of a good cementproduct. We are also constantly developing new services toimprove the speed and efficiency with which all of our customerscan build. We make our customers’ concerns central to our busi-ness in order to make cement the building material of choice inthe 21st Century.
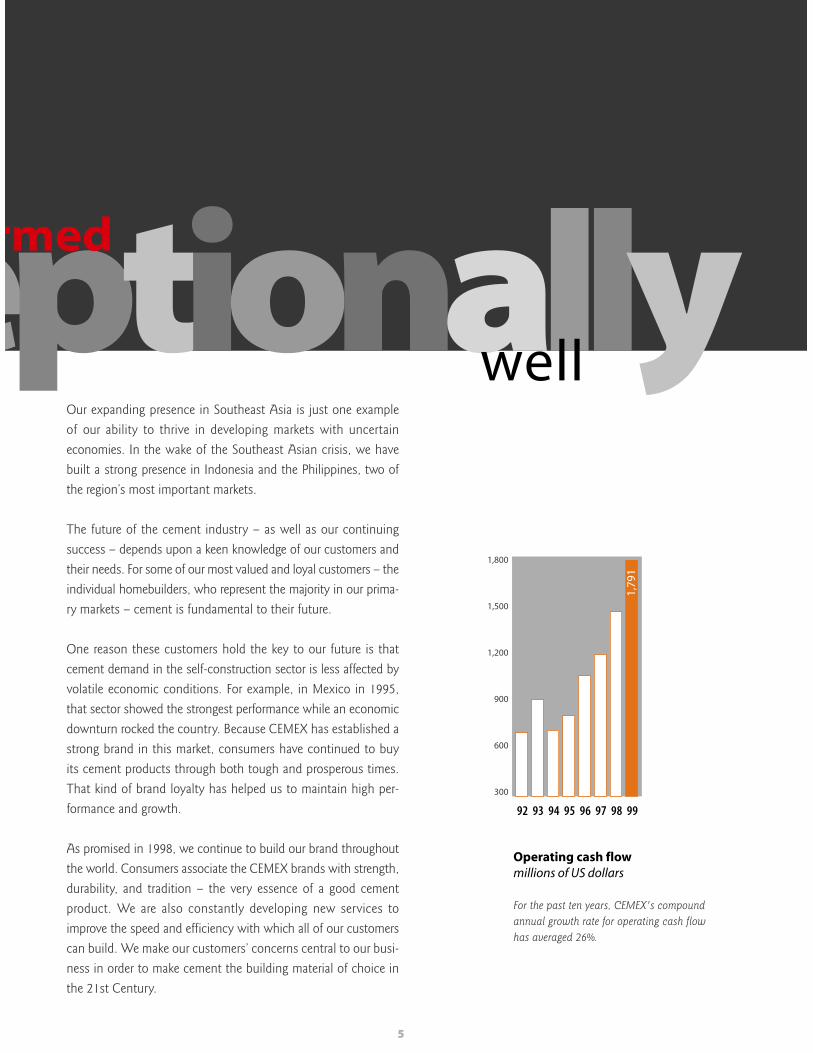
Operating cash flowmillions of US dollars
For the past ten years, CEMEX's compoundannual growth rate for operating cash flow has averaged 26%.
92 93 94 95 96 97 98 99
1,79
1
1,800
1,500
1,200
900
600
300
6
Why cement? Cement means progress. The structures of the worldtoday are most likely set on, or built with, cement. Governmentand commercial buildings, houses of worship, museums, andcultural centers – all literally rest on cement. As long as thecountries of this world remain committed to growth, productivity,and artistic, religious, and cultural expression, cement willremain a growth industry.
Why CEMEX? CEMEX is well positioned to capture the world’sgrowing demand for cement. Its position as the world’s largesttrader of cement and clinker allows it to keep plants running ator near capacity – even when domestic demand is low – to sat-isfy high demand in other parts of the world. Whether a cus-tomer is building a safer highway, a skyscraper, or his first homewith his own hands, we will be there to provide quality materialsand to help speed the process.
CEMEX enjoys a dynamic, entrepreneurial, multicultural styleand philosophy. We are a global team of operational innovators.Our superior information technology gives our executives andmanagers real-time access to every type of data – inventory, deliv-ery schedules, and even kiln temperatures – at CEMEX plantsaround the world. Every plant and subsidiary is seamlessly inte-grated into the global CEMEX network.
Our technical expertise and research and development efforts arecommitted to creating new products that will serve our clients’diverse needs. For example, we have developed a new softwarepackage that uses structure type and climate conditions to calcu-late the precise strength and durability of the cement a customerwill need. Most recently, we have developed business-to-businesse-solutions for our largest distributors and major contractors.
CEMEX is also seeking innovative ways to provide more value forcustomers and shareholders and to improve the communities inwhich it operates. The company is currently exploring financingoptions for the poor in Latin America so that they can build homes.It is also forming partnerships with federal and local govern-ments to provide technical and logistical skills in times of crisisas well as prosperity.
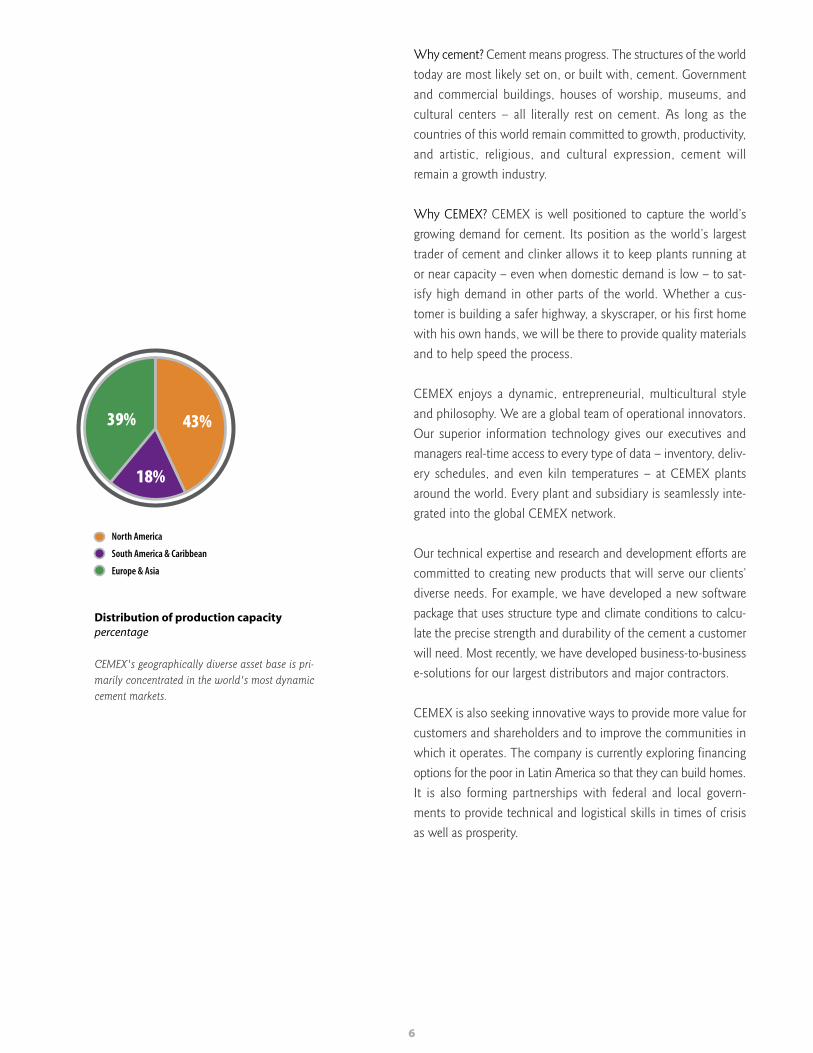
43%
18%
39%
Distribution of production capacitypercentage
CEMEX's geographically diverse asset base is pri-marily concentrated in the world's most dynamiccement markets.
North America
South America & Caribbean
Europe & Asia
7
The only threat to the realization of CEMEX’s true potential isthe traditional view that the cement industry is static and itsproducts are commodities. Although this perception has affectedCEMEX’s stock performance, the company’s operational andfinancial successes are reshaping this view. I am committed tobringing the company’s true value to the attention of the market.
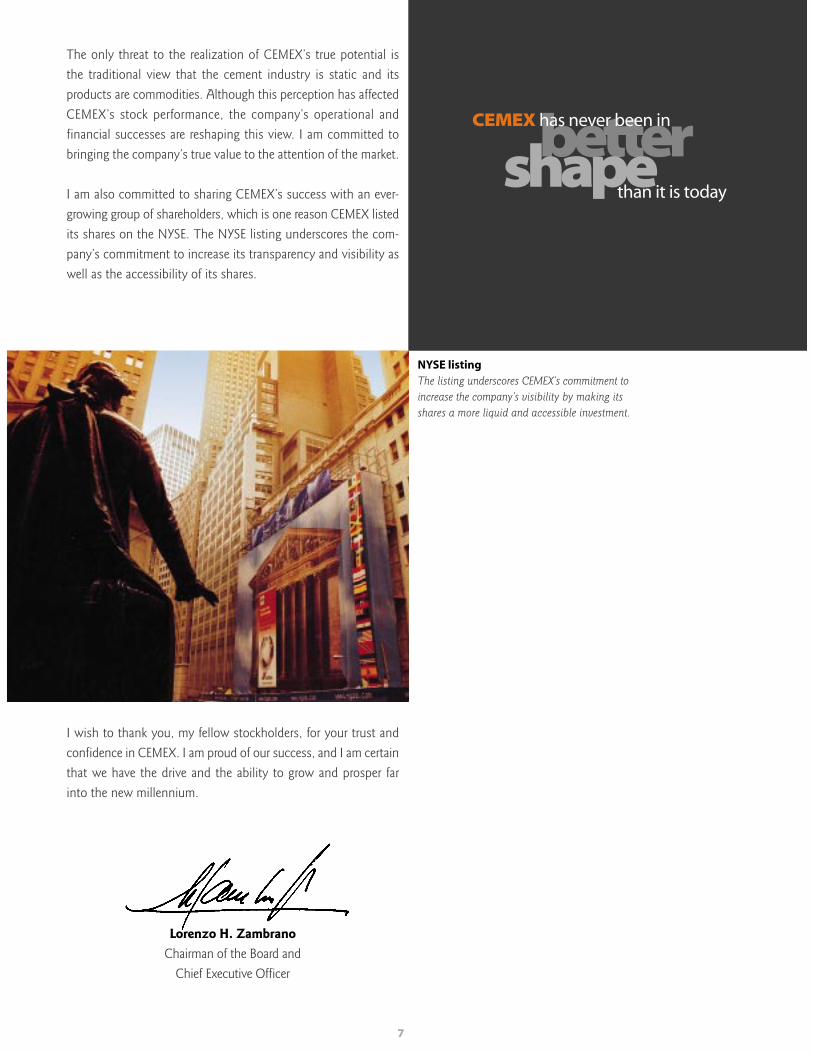
I am also committed to sharing CEMEX’s success with an ever-growing group of shareholders, which is one reason CEMEX listedits shares on the NYSE. The NYSE listing underscores the com-pany’s commitment to increase its transparency and visibility aswell as the accessibility of its shares.
I wish to thank you, my fellow stockholders, for your trust andconfidence in CEMEX. I am proud of our success, and I am certainthat we have the drive and the ability to grow and prosper farinto the new millennium.
Lorenzo H. ZambranoChairman of the Board and
Chief Executive Officer
NYSE listingThe listing underscores CEMEX’s commitment toincrease the company’s visibility by making itsshares a more liquid and accessible investment.
bettershapeCEMEX has never been in
than it is today

Joseph Stern, CEMEX shareholder from Aptos, California.

3
why?1.
c e m e n t
WH
YC
EM
EN
T

10
futurebecause cement has a
Accept no substitute
Compared to other products, CEMEX’s specialty cements enablebuilders to save money and increase effectiveness. These innov-ative solutions include high-strength cement that can effectivelycompete with steel at significantly lower cost. Durable cement,which can last up to 100 years, gives customers the option ofbuilding in difficult regions. Fluid fill, another of the company’sspecialty products, greatly simplifies the process of laying thecable that connects the world; fluid fill surrounds the cable in atightly packed shell that provides protection, prevents settling,and enables crews to work quickly.
Drive safely
Highway engineers know that concrete roads and highways aremore adhesive and safer than asphalt alternatives. Unfortunately,before CEMEX developed new application techniques, the costof building concrete highways was expensive relative to cheaperalternatives. Now, thanks to CEMEX’s efforts, federal and munic-ipal governments alike can afford to pave their highways withlow-maintenance, life-saving concrete.
Cement consumption / U.S. vs. Indonesiapercentage
In CEMEX’s developing markets, bagged cement isthe construction material of choice. Worldwide, itaccounts for 70% of the company’s total cementsales volume.
Bagged cement
Bulk
U.S.
INDONESIA

branded cement is thebuilding material of the future
Cement is a consumer product and the building material of choice in most of the markets that
CEMEX serves. By year-end 1999, CEMEX sold customers more than 500 million bags of cement.
In three of the company’s newest markets, the Philippines, Indonesia, and Egypt, this bagged
cement accounted for 80%, 93%, and 95%, respectively, of these countries’ growing cement
demand.
11
drive safelyCEMEX’s products are helping to buildsafer highways.re

Alejandra Saiz, CEMEX Spain.

3
C E M E X i s d i f f e r e n t
2.w
hy?
WH
YC
EM
EX
ISD
IFF
ER
EN
T

14
B-to-B solutionsWith a click of the mouse, contractorscan track the location of their ready-mix concrete shipments.
changibecause CEMEX is
how the gameCEMEX cares
CEMEX makes life easier for its customers. After the Puebla,Mexico, earthquake destroyed thousands of homes, the companyoffered a solution to facilitate the reconstruction effort. CEMEXacted as purchasing agent for all the materials, logistics supplierfor on-time delivery throughout the devastated area, and, ofcourse, cement producer and distributor. The company assumesa similar role throughout its distribution system by acting asmarket maker, purchasing agent, and logistics service for smallretailers. CEMEX brings to the building materials business alevel of price and transaction efficiency that significantlyincreases its speed and productivity.
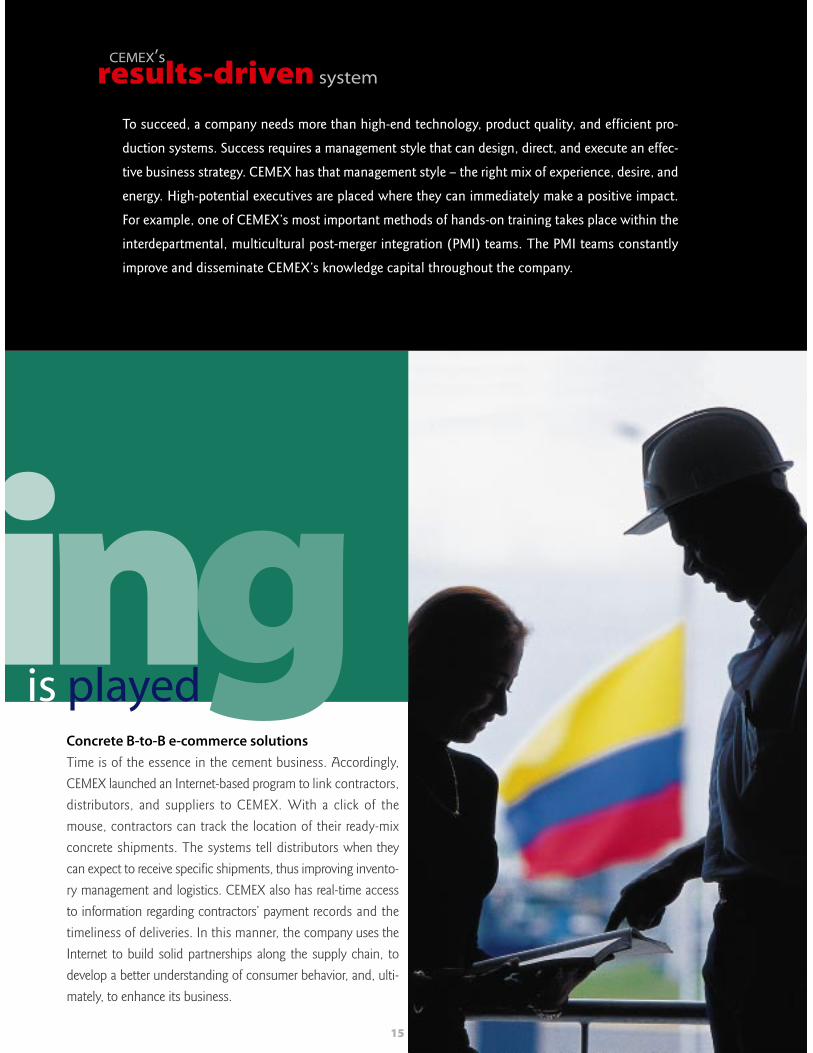
Concrete B-to-B e-commerce solutions
Time is of the essence in the cement business. Accordingly,CEMEX launched an Internet-based program to link contractors,distributors, and suppliers to CEMEX. With a click of themouse, contractors can track the location of their ready-mixconcrete shipments. The systems tell distributors when theycan expect to receive specific shipments, thus improving invento-ry management and logistics. CEMEX also has real-time accessto information regarding contractors’ payment records and thetimeliness of deliveries. In this manner, the company uses theInternet to build solid partnerships along the supply chain, todevelop a better understanding of consumer behavior, and, ulti-mately, to enhance its business.
CEMEX’sresults-driven system
To succeed, a company needs more than high-end technology, product quality, and efficient pro-
duction systems. Success requires a management style that can design, direct, and execute an effec-
tive business strategy. CEMEX has that management style – the right mix of experience, desire, and
energy. High-potential executives are placed where they can immediately make a positive impact.
For example, one of CEMEX’s most important methods of hands-on training takes place within the
interdepartmental, multicultural post-merger integration (PMI) teams. The PMI teams constantly
improve and disseminate CEMEX’s knowledge capital throughout the company.
15
ingis played

Joe Andres, from Caterpillar, a CEMEX equipment supplier.

3
why?c e m e n t ’ s f u t u r e i s C E M E X
3.
WH
YC
EM
EN
T’S
FU
TU
RE
ISC
EM
EX
capitalizbecause CEMEX is
on globalization
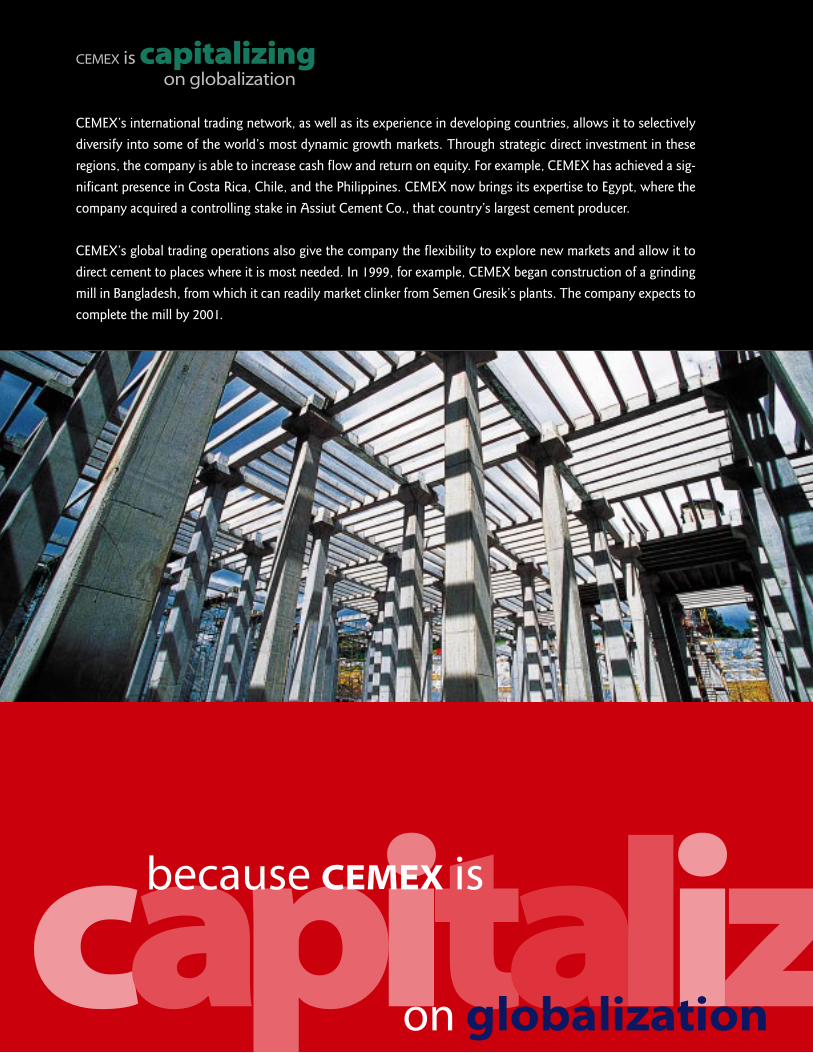
CEMEX is capitalizingon globalization
CEMEX’s international trading network, as well as its experience in developing countries, allows it to selectivelydiversify into some of the world’s most dynamic growth markets. Through strategic direct investment in theseregions, the company is able to increase cash flow and return on equity. For example, CEMEX has achieved a sig-nificant presence in Costa Rica, Chile, and the Philippines. CEMEX now brings its expertise to Egypt, where thecompany acquired a controlling stake in Assiut Cement Co., that country’s largest cement producer.
CEMEX’s global trading operations also give the company the flexibility to explore new markets and allow it todirect cement to places where it is most needed. In 1999, for example, CEMEX began construction of a grindingmill in Bangladesh, from which it can readily market clinker from Semen Gresik’s plants. The company expects tocomplete the mill by 2001.

zing
A virtual community
Technology means not only harnessing essential tools but alsoproviding a sustainable competitive advantage. CEMEX’s pro-prietary software programs enable its divisions to create virtualcommunities through which they can identify, share, andimprove upon the company’s international best practices. Theseprograms assist the company in its efforts to further streamlinebusiness activities within its global operations network. Pushtechnology, which automatically delivers information via theInternet to employees’ computers, gives executives real-timeaccess to their colleagues in similar departments around theworld.
Asia’s islands of opportunity
Asia accounts for well over 50% of the world’s current andfuture cement consumption. CEMEX enjoys a strong presencein two of Southeast Asia’s largest cement markets, Indonesia andthe Philippines. Now, with the successful funding of CEMEXAsia Holdings (CAH), an alternative, lower-cost financing vehi-cle, the company can enhance its regional position. CAH has,as its participants, prominent institutional investors led by theAIG Asian Infrastructure Fund II L.P. and GIC Special Invest-ments Pte. Ltd., the private equity arm of the Government ofSingapore Investment Corporation.
Asia’s islands ofopportunityAsia accounts for well over 50% of theworld’s current and future cement con-sumption.
19
18%
World cement consumption by regionpercentage
CEMEX's business portfolio is concentrated in theworld’s growing cement markets.Source: CEMEX estimates
1998 world consumption: 1.6 billion metric tons
Asia
Europe
Latin America
U.S. & Canada
Africa & Middle East
61
19
8
8
4

20
As of December 31,1999 % OF TOTAL % OF TOTALSALES ASSETS
MI
North America
Mexico 47.3 42.2
U.S. 12.2 5.0
South America & Caribbean
Venezuela and Dominican Republic 13.7 11.4
Colombia 3.7 7.2
Central America and the Caribbean 3.6 2.7
Europe & Asia
Spain 16.6 17.4
Egypt1 0.3 5.3
Philippines 2.6 6.8
Indonesia2 – 2.0
TOTAL 100 100
1 Includes consolidation of one month of Egyptian operations and CEMEX’s 77% participation in Assiut Cement Co.
2 Considering CEMEX’s 25% participation in Semen Gresik.
NORTH AMERICA
Market Highlights
Mexico – Nineteen ninety-nine was once again a record year for CEMEX
Mexico. The company experienced continuing high demand from
the self-construction sector, which comprises 40% of the domestic
market.
Human Resource Development – CEMEX Mexico’s record perfor-
mance is testament to its talented people and ongoing employee
development programs. It implements programs at all levels of the
organization, from basic educational training (elementary and high
school) to customized executive management programs. For example,
the Developing Professionals Program complements the recruiting
process by teaching CEMEX’s operating fundamentals to high-
potential college graduates to ensure their smooth transition into
the company. In 1999, more than 50 new hires participated in this
program.
United States – The booming U.S. economy, which has fueled seven
consecutive years of construction growth, led to significant new
building projects for CEMEX USA. Noteworthy construction projects
include the: Enron building and Highway 59 expansion in Houston,
Texas; Federal courthouse, Mayo hospital, and Phase II of the
Squaw Peak freeway in Phoenix, Arizona; Williams Gateway runway
expansion in Queen Creek, Arizona; Temecula mall in Inland Empire,
California; and Camp Pendleton military base in Oceanside, California.
oppREVIEW OF OPERATIONS
Research and developmentCEMEX Mexico's research laboratory is intro-ducing more than one new product each year.
CEMEX’s PRESENCE

21
Market characteristics -In most of the markets in which we have a presence, cement is soldas a brand-name product in bags through exclusive and nonexclu-sive distributors.
In many of these countries, cement is the most commonly usedbuilding material, and brand positioning plays a major role in mar-ket share.
CEMEX holds a leading position in Mexico, Spain, Venezuela,Dominican Republic, Costa Rica, and Panama and a significantpresence in the southwestern United States, Colombia, the Philip-pines, Egypt, and Indonesia.
These countries have major infrastructure needs and a relativelylow per-capita cement consumption, which translates into impor-tant growth potential.
CEMEX is also the largest cement trader in the world, trading morethan 13 million metric tons per year in more than 60 countries.
pportunitiesc a p i t a l i z i n g o n
PRODUCTION CEMENT CEMENT READY-MIX LAND MARINECAPACITY PLANTS PLANTS PLANTS DISTRIBUTION TERMINALS
MILLIONS OF METRIC TONS/YEAR OWNED JOINTLY OWNED CENTERS
27.2 15 3 216 72 5
1.2 1 3 48 8 5
5.0 4 – 47 15 5
4.8 5 – 15 6 –
2.0 2 6 6 8 5
10.4 8 – 75 7 15
4.0 1 – – – 2
5.8 3 – – 17 2
5.0 – 4 – – –
65.4 39 16 407 133 39
22
Value Opportunities
Research and Development – CEMEX Mexico’s state-of-the-art lab-
oratory continues to exceed its goal of introducing at least one new
product every year. Since its 1997 opening, it has developed five
new ready-mix products, accounting for over 20% of 1999 concrete
sales. The facility is on track to launch two new products in 2000.
Energy Efficiency – To increase cost effectiveness, CEMEX Mexico
continuously tests alternative sources of fuel for its plants. Over the
last three years, it has greatly diversified its energy sources to obtain the
lowest-cost energy for its plants and to minimize periods of energy
market volatility.
United States – The American Concrete Pavement Association esti-
mates that the Transportation Equity Act for the 21st Century (TEA-
21) could increase government outlays for highways and bridges by
more than 40% over the next six years. The major impact of TEA-21
on cement and aggregates demand should begin to be seen during
the first half of 2000, and the bottom-line contributions to CEMEX
USA should start to appear during the second half of the year.
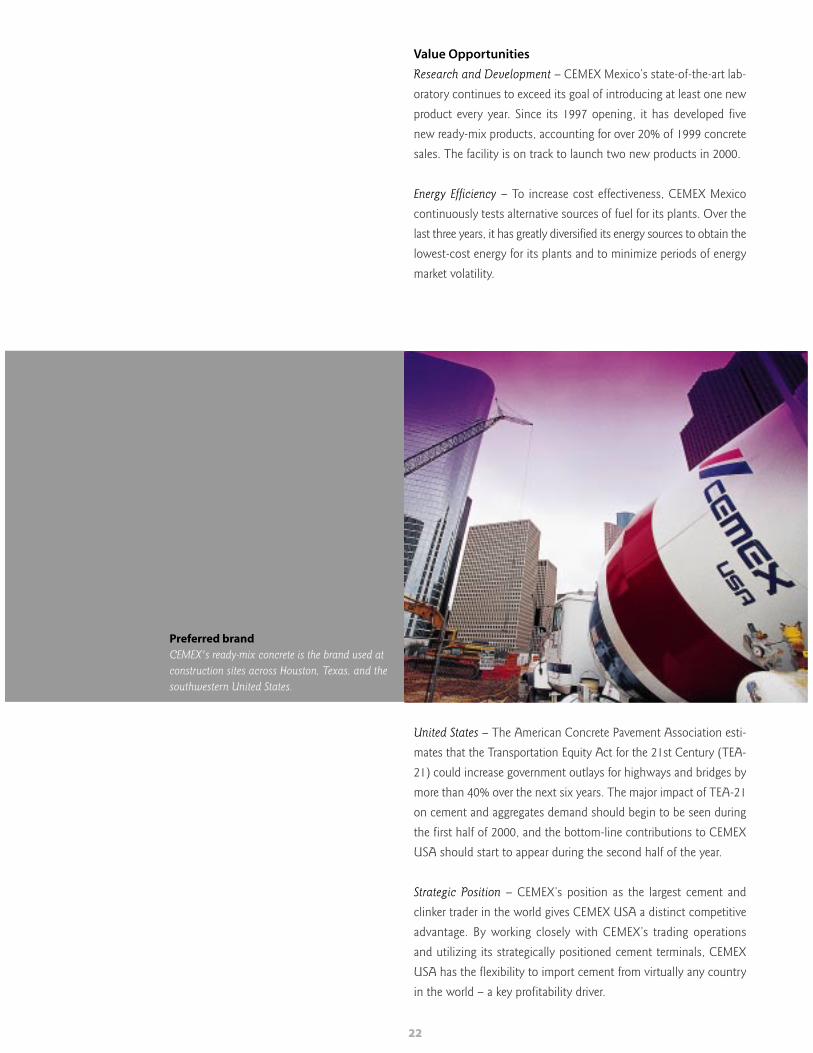
Strategic Position – CEMEX’s position as the largest cement and
clinker trader in the world gives CEMEX USA a distinct competitive
advantage. By working closely with CEMEX’s trading operations
and utilizing its strategically positioned cement terminals, CEMEX
USA has the flexibility to import cement from virtually any country
in the world – a key profitability driver.
Preferred brandCEMEX's ready-mix concrete is the brand used atconstruction sites across Houston, Texas, and thesouthwestern United States.
23
SOUTH AMERICA & CARIBBEAN
Market highlights
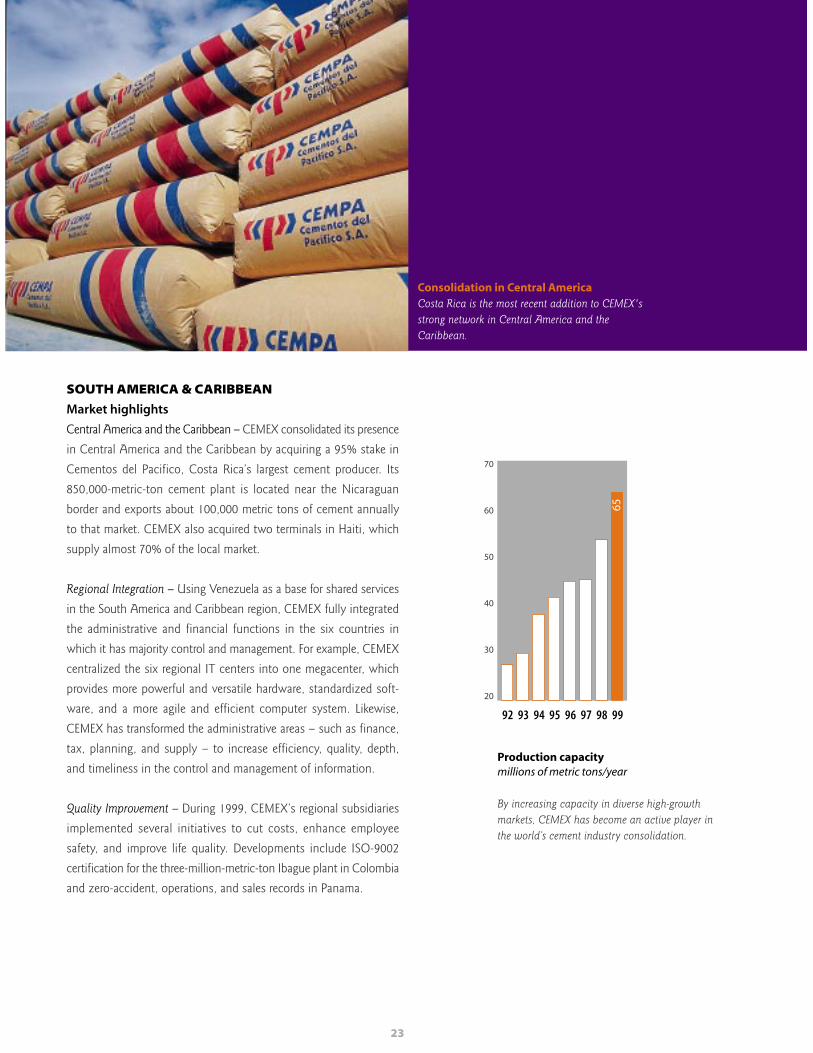
Central America and the Caribbean – CEMEX consolidated its presence
in Central America and the Caribbean by acquiring a 95% stake in
Cementos del Pacifico, Costa Rica’s largest cement producer. Its
850,000-metric-ton cement plant is located near the Nicaraguan
border and exports about 100,000 metric tons of cement annually
to that market. CEMEX also acquired two terminals in Haiti, which
supply almost 70% of the local market.
Regional Integration – Using Venezuela as a base for shared services
in the South America and Caribbean region, CEMEX fully integrated
the administrative and financial functions in the six countries in
which it has majority control and management. For example, CEMEX
centralized the six regional IT centers into one megacenter, which
provides more powerful and versatile hardware, standardized soft-
ware, and a more agile and efficient computer system. Likewise,
CEMEX has transformed the administrative areas – such as finance,
tax, planning, and supply – to increase efficiency, quality, depth,
and timeliness in the control and management of information.
Quality Improvement – During 1999, CEMEX’s regional subsidiaries
implemented several initiatives to cut costs, enhance employee
safety, and improve life quality. Developments include ISO-9002
certification for the three-million-metric-ton Ibague plant in Colombia
and zero-accident, operations, and sales records in Panama.
Production capacitymillions of metric tons/year
By increasing capacity in diverse high-growthmarkets, CEMEX has become an active player inthe world’s cement industry consolidation.
Consolidation in Central AmericaCosta Rica is the most recent addition to CEMEX'sstrong network in Central America and theCaribbean.
92 93 94 95 96 97 98 99
65
70
60
50
40
30
20
24
Value Opportunities
Rapid Turnaround – CEMEX continues to improve upon its PMI
process to achieve immediate bottom-line results. For example, the
PMI team installed the systems, indicators, and controls used in all
CEMEX plants in Costa Rica in less than 90 days.
Customer Service – The company uses a personalized platform that
informs customers of the status of their orders, delivers invoices,
and directly channels customer feedback to the appropriate CEMEX
personnel. It also offers clients a growing array of new products and
services, such as five-kilogram bags of white cement, toll-free tele-
phone service, and points programs to reward customer loyalty.
Shared Practices – CEMEX’s regional commercial strategy capitalizes
on the best practices in each country of operation. The company is
cementing the value chain by strengthening its ties with prefabricated
concrete manufacturers, retailers, and small suppliers. It also offers
alternative containers for storing cement on construction sites.
EUROPE & ASIA
Market highlights
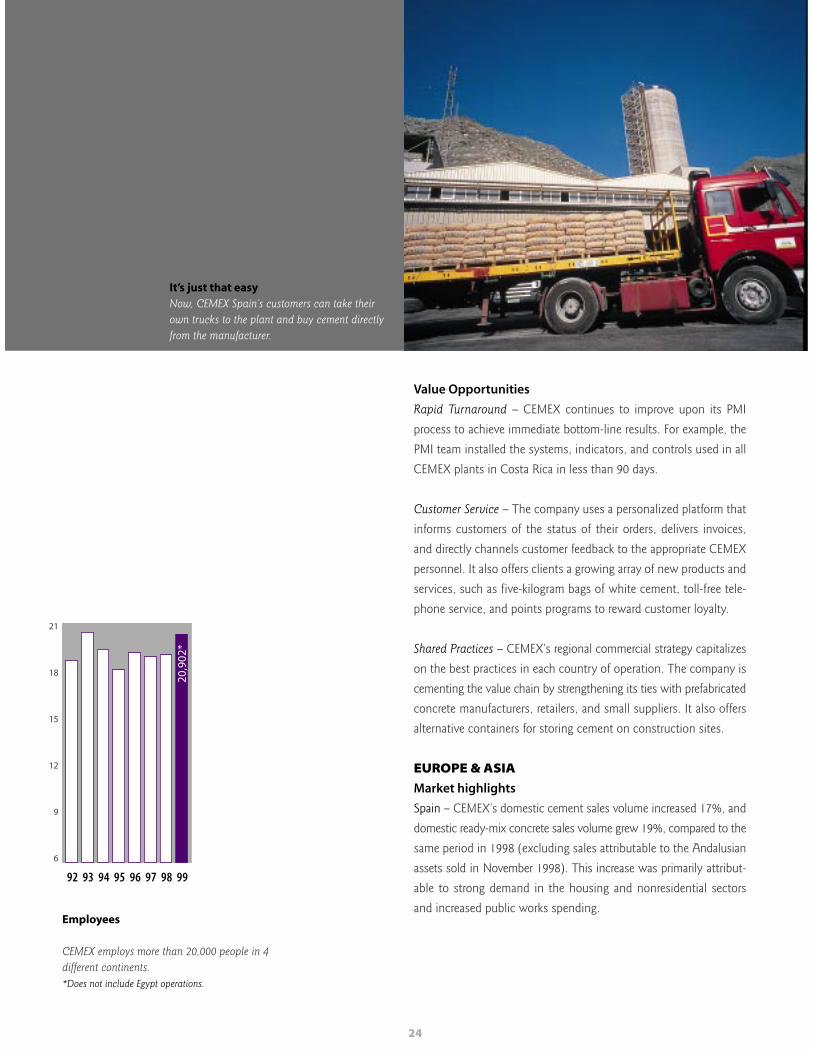
Spain – CEMEX’s domestic cement sales volume increased 17%, and
domestic ready-mix concrete sales volume grew 19%, compared to the
same period in 1998 (excluding sales attributable to the Andalusian
assets sold in November 1998). This increase was primarily attribut-
able to strong demand in the housing and nonresidential sectors
and increased public works spending.
It’s just that easyNow, CEMEX Spain’s customers can take theirown trucks to the plant and buy cement directlyfrom the manufacturer.
Employees
CEMEX employs more than 20,000 people in 4different continents.*Does not include Egypt operations.
92 93 94 95 96 97 98 99
20,9
02*
21
18
15
12
9
6
25
Egypt – After three years of increasing cement exports to the
expanding Egyptian market, CEMEX acquired a 77% stake of Assiut
Cement Co., the nation’s largest cement producer. Demand well
exceeds domestic supply in Egypt, one of Africa’s fastest-growing
cement markets.
The Philippines – In February 1999, we consolidated our position as
one of the Philippines’ top cement producers by acquiring a 99.9%
economic interest in APO Cement Corporation. This, coupled with
the company’s controlling stake in Rizal Cement Company, gives
CEMEX nationwide coverage and access to the Philippines’ main mar-
kets of Manila, Visayas, and Mindanao.
Value Opportunities
Indonesia – The Indonesian cement industry is one of the two largest
in Southeast Asia, accounting for around one-fourth of the region’s
consumption. In September 1999, CEMEX further increased its interest
in PT Semen Gresik, Indonesia’s largest producer, to 25%. Because
of its strategic location, size, significant growth potential, and role as
an anchor for the company’s Southeast Asian trading network,
Indonesia is an important element of CEMEX’s Asia strategy.
PMI – CEMEX’s multinational PMI team, comprising executives from
Colombia, Mexico, the Philippines, Spain, and Venezuela, cut the time
of APO Cement’s PMI by almost two-thirds. As a result of these
efforts, APO will enjoy significant recurring cost savings.
Self-service Cement – CEMEX Spain introduced a self-service system
for customers at its cement facilities. Now, individual consumers can
pull up their trucks, fill them up, and pay with a credit card. It’s just
that easy.
TRADING
Market highlights
Record Volume – Our 1999 total trading volume was more than 13
million metric tons of cement and clinker. Almost 60% of CEMEX’s
trading volume came from third parties, including suppliers in China,
England, Korea, Morocco, Romania, Russia, Thailand, Tunisia, Turkey,
and Ukraine.
Partners – We market cement to over 60 countries worldwide. Our
major international trading partners are located in Bangladesh, the
Canary Islands, the Caribbean, Egypt, the Ivory Coast, Mauritius,
Morocco, Nigeria, Portugal, Singapore, Taiwan, and the United States.
Exports – In 1999, roughly 5.7 million metric tons of our total trading
volume came from the company’s operations in Costa Rica, Indonesia,
Mexico, the Philippines, Spain, and Venezuela. This figure includes
493,000 metric tons of white cement exported from Mexico and Spain.
Floating Silo – CEMEX’s floating silo, Corregidora, began operating in
the port of Adabya, Egypt, in the beginning of 1999. This state-of-
the-art facility has a bagging capacity of 5,000 metric tons per day and
a discharge capacity of 250 metric tons per hour.
Value Opportunities
Global Reach – This year, the company’s international trading opera-
tions will allow it to trade more than 2.6 million metric tons of cement
from Indonesia and the Philippines. Due to lagging demand in those
markets, Southeast Asian producers are increasingly interested in
CEMEX’s ability to trade and export large volumes of cement and
clinker to other markets.
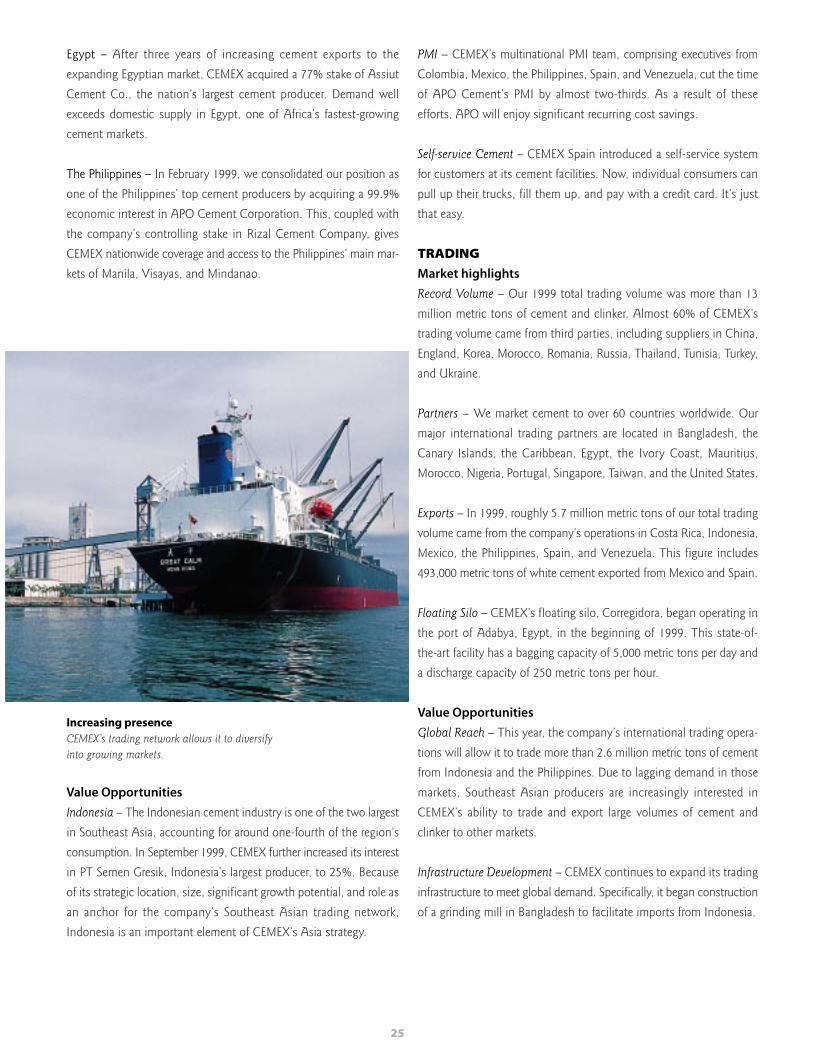
Infrastructure Development – CEMEX continues to expand its trading
infrastructure to meet global demand. Specifically, it began construction
of a grinding mill in Bangladesh to facilitate imports from Indonesia.
Increasing presenceCEMEX’s trading network allows it to diversifyinto growing markets.
26
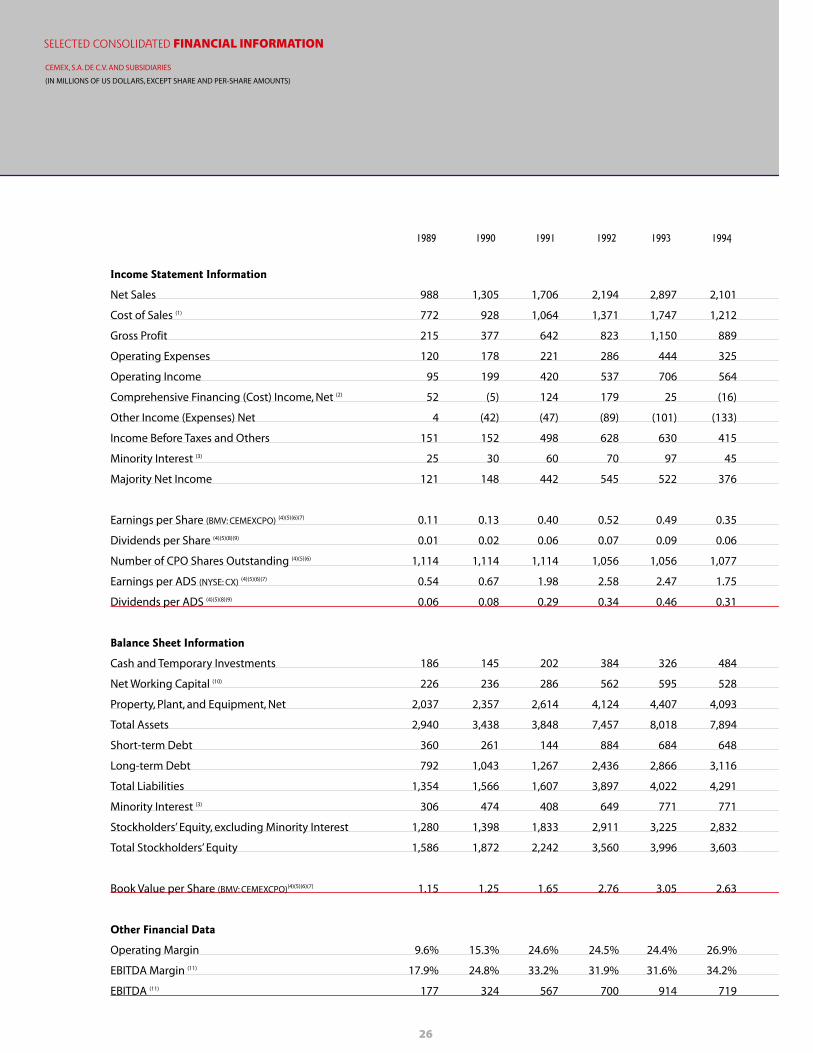
1989 1990 1991 1992 1993 1994
Income Statement Information
Net Sales 988 1,305 1,706 2,194 2,897 2,101
Cost of Sales (1) 772 928 1,064 1,371 1,747 1,212
Gross Profit 215 377 642 823 1,150 889
Operating Expenses 120 178 221 286 444 325
Operating Income 95 199 420 537 706 564
Comprehensive Financing (Cost) Income, Net (2) 52 (5) 124 179 25 (16)
Other Income (Expenses) Net 4 (42) (47) (89) (101) (133)
Income Before Taxes and Others 151 152 498 628 630 415
Minority Interest (3) 25 30 60 70 97 45
Majority Net Income 121 148 442 545 522 376
Earnings per Share (BMV: CEMEXCPO) (4)(5)(6)(7) 0.11 0.13 0.40 0.52 0.49 0.35
Dividends per Share (4)(5)(8)(9) 0.01 0.02 0.06 0.07 0.09 0.06
Number of CPO Shares Outstanding (4)(5)(6) 1,114 1,114 1,114 1,056 1,056 1,077
Earnings per ADS (NYSE: CX) (4)(5)(6)(7) 0.54 0.67 1.98 2.58 2.47 1.75
Dividends per ADS (4)(5)(8)(9) 0.06 0.08 0.29 0.34 0.46 0.31
Balance Sheet Information
Cash and Temporary Investments 186 145 202 384 326 484
Net Working Capital (10) 226 236 286 562 595 528
Property, Plant, and Equipment, Net 2,037 2,357 2,614 4,124 4,407 4,093
Total Assets 2,940 3,438 3,848 7,457 8,018 7,894
Short-term Debt 360 261 144 884 684 648
Long-term Debt 792 1,043 1,267 2,436 2,866 3,116
Total Liabilities 1,354 1,566 1,607 3,897 4,022 4,291
Minority Interest (3) 306 474 408 649 771 771
Stockholders’ Equity, excluding Minority Interest 1,280 1,398 1,833 2,911 3,225 2,832
Total Stockholders’ Equity 1,586 1,872 2,242 3,560 3,996 3,603
Book Value per Share (BMV: CEMEXCPO)(4)(5)(6)(7) 1.15 1.25 1.65 2.76 3.05 2.63
Other Financial Data
Operating Margin 9.6% 15.3% 24.6% 24.5% 24.4% 26.9%
EBITDA Margin (11) 17.9% 24.8% 33.2% 31.9% 31.6% 34.2%
EBITDA (11) 177 324 567 700 914 719
SELECTED CONSOLIDATED FINANCIAL INFORMATION
CEMEX, S.A. DE C.V. AND SUBSIDIARIES
(IN MILLIONS OF US DOLLARS, EXCEPT SHARE AND PER-SHARE AMOUNTS)

27
Notes to Selected Consolidated Financial Information
1) Cost of sales includes depreciation.
2) Comprehensive financing income (cost) includes financial expense, financial income,gains (losses) on marketable securities, net foreign exchange variation, and net mone-tary position.
3) In July 1995, a CEMEX subsidiary entered into a transaction pursuant to which it trans-ferred a portion of the common stock of Valenciana in exchange for $40 billion pesetas,which, as of December 31, 1999, represented 24.77% of such stock.This original amountwas refinanced in August 1997 at US$320 million, and subsequently in February 1999 atUS$500 million. Since the first refinancing, the minority interest in the income statementhas not been recognized since CEMEX, through its subsidiary, has retained dividend andvoting rights over such shares and has the option to acquire them in three tranches, thelast of which matures in June 2001.The company includes the cost of retaining its optionin the financial expense account. Such shares are being treated as owned by a third party,thereby creating a minority interest over the consolidated stockholders’ equity inValenciana. As of December 31, 1999, such minority interest accounted for 34.5% ofCEMEX’s minority stockholders’ equity.
4) On April 28, 1994, CEMEX declared a stock split of three shares per each share held by ashareholder. Additionally, as part of the transformation of CEMEX from a fixed to a vari-able capital company, and an increase in the variable portion of its capital stock, CEMEXissued a new share of variable capital of like series for every eight shares (after makingthe stock split effective). All CPO and per-CPO amounts for 1989 through 1993 have beenadjusted to make the effect of the stock split retroactive.
5) On September 14, 1999, the Company concluded an exchange offer of its old series “A”and “B” shares, and its old Ordinary Participation Certificates (“CPOs”), for new CPOs. As aresult, most of the holders of the old series “A” and “B” shares and old CPOs received foreach one of their titles a new CPO, which represents the participation in two new series“A” shares and one new series “B” share of the Company. As a part of the exchange offer,on September 15, 1999, the Company effected a stock split of two series “A” shares andone series “B” share for each of the old shares of any series.The proportional equity inter-est participation of the shareholders in the Company’s common stock did not change as aresult of the exchange offer and the stock split mentioned above.
The earnings per CPO and the number of CPOs outstanding disclosed in these notes tothe financial statements for the years ended December 31, 1989 through 1998, havebeen adjusted to make the effect of the stock split retroactive.
In order to comply with accounting principles in Mexico, in the Financial Statements, suchfigures are presented on a per-share basis (see Footnote 20 to the Financial Statements).
6) The number of CPOs outstanding represents the total CPOs outstanding at the close ofeach year, stated in millions of CPOs, and includes the total number of CPOs issued byCEMEX utilized in derivative transactions, and excludes the total numbers of CPOs issuedby CEMEX and owned by subsidiaries. Each ADS listed on the New York Stock Exchangerepresents five CPOs.
7) For the periods ended on December 31, 1989 to 1995, the “Earnings per CPO” amountswere determined by considering the total outstanding CPOs at the year’s end. For theperiods ended on December 31, 1996 to 1999, the “Earnings per CPO” amounts weredetermined by considering the average number of CPOs outstanding each year, i.e.,1.298, 1.283, 1.262, and 1.256 billion, respectively.
8) Dividends declared at each year’s annual stockholders’ meeting for each period arereflected as dividends for the preceding year.
9) As a result of CEMEX’s Share Repurchase Program in 1997, 24 million CPOs were acquiredfor an amount of approximately US$119 million.The CPOs acquired through this programaccounted for approximately 2% of the CPOs outstanding at that date.
10) Net working capital equals accounts receivable plus inventories minus trade payables.
11) EBITDA is earnings before interest, taxes, depreciation, and amortization. Amortizationof goodwill is not included in operating income, but is instead recorded in other income(expense) below the operating line. EBITDA does not include certain other income andexpenses that are not included in operating income under Mexican GAAP.
1995 1996 1997 1998 1999
2,564 3,365 3,788 4,315 4,828 17.2
1,564 2,041 2,322 2,495 2,690
1,000 1,325 1,467 1,820 2,138 25.8
388 522 572 642 702
612 802 895 1,178 1,436 31.2
567 529 159 (132) (29)
(162) (171) (138) (152) (296)
1,017 1,160 916 893 1,111 22.1
109 119 107 39 56
759 977 761 803 973 23.2
0.59 0.75 0.59 0.64 0.77 21.8
0.07 _(9) 0.12 0.14 n.a.
1,286 1,303 1,268 1,258 1,366
2.95 3.76 2.97 3.18 3.87 21.8
0.33 _(9) 0.60 0.70 n.a.
355 409 380 407 326
567 611 588 638 699
4,939 5,743 6,006 6,142 6,922
8,370 9,942 10,231 10,460 11,864
870 815 657 1,106 1,030
3,034 3,954 3,961 3,136 3,341
4,603 5,605 5,535 5,321 5,430 14.9
889 1,000 1,181 1,251 1,253
2,878 3,337 3,515 3,887 5,182 15.0
3,767 4,337 4,696 5,138 6,435 15.0
2.24 2.56 2.77 3.09 3.79
23.9% 23.8% 23.6% 27.3% 29.8%
31.8% 32.3% 31.5% 34.4% 37.1%
815 1,087 1,193 1,485 1,791 26.0
Average Annual Growth 89-99
28
CEMEX’s business portfolio is primarily concen-
trated in high-growth, highly profitable developing
markets. This broad diversification in markets with
different business cycles provides consistent sus-
tainable growth for the company.
RESULTS OF OPERATIONS AND ANALYSIS OF FINANCIAL CONDITION OF THE COMPANY
discussionmanagement
and analys is
strong fundamentals
The fundamentals that drive CEMEX’s business are its:
• Management expertise
• Core cement, ready-mix concrete, and aggregates base
• Low operating costs
• Use of state-of-the-art management information systems and production technology
• Versatile and resourceful financial management and capital structure
• Developing-market experience and focus

US$6,573
21%CAGR
10 YEARS AGO
US$97,414
36%CAGR
15 YEARS AGO
136%RETURN
US$2,359
1 YEAR AGO
Past performance does not guarantee future results.* Includes reinvestment of dividends.CAGR is compound annual growth rate.
the resultValue of US$1,000 invested in CEMEX shares*
29
focused strategy
CEMEX’s strategy is to:
• Leverage its core cement and ready-mix concrete
franchise
• Concentrate on developing markets
• Maintain high growth by applying free cash flow
toward selective investments that further its
geographic diversification
simple investmentcriteria
Any acquisition must satisfy three investment criteria. It must:
• Benefit from CEMEX’s management expertise andturnaround experience
• Not adversely affect CEMEX’s current financialstructure and ability to meet stated financial targets
• Offer superior long-term financial returns that exceedthe company’s weighted-average cost of capital
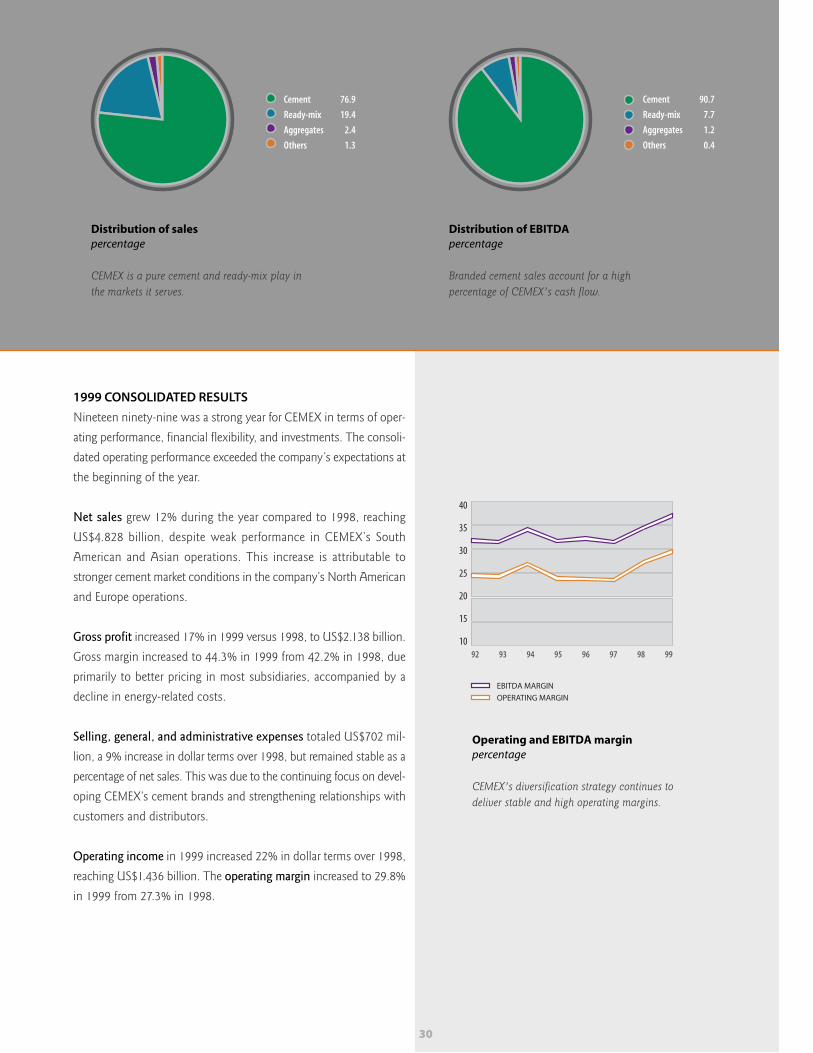
1999 CONSOLIDATED RESULTS
Nineteen ninety-nine was a strong year for CEMEX in terms of oper-
ating performance, financial flexibility, and investments. The consoli-
dated operating performance exceeded the company’s expectations at
the beginning of the year.
Net sales grew 12% during the year compared to 1998, reaching
US$4.828 billion, despite weak performance in CEMEX’s South
American and Asian operations. This increase is attributable to
stronger cement market conditions in the company’s North American
and Europe operations.
Gross profit increased 17% in 1999 versus 1998, to US$2.138 billion.
Gross margin increased to 44.3% in 1999 from 42.2% in 1998, due
primarily to better pricing in most subsidiaries, accompanied by a
decline in energy-related costs.
Selling, general, and administrative expenses totaled US$702 mil-
lion, a 9% increase in dollar terms over 1998, but remained stable as a
percentage of net sales. This was due to the continuing focus on devel-
oping CEMEX’s cement brands and strengthening relationships with
customers and distributors.
Operating income in 1999 increased 22% in dollar terms over 1998,
reaching US$1.436 billion. The operating margin increased to 29.8%
in 1999 from 27.3% in 1998.
30
92
EBITDA MARGIN
40
35
30
25
20
15
1093 94 95 96 97 98 99
OPERATING MARGIN
Operating and EBITDA marginpercentage
CEMEX's diversification strategy continues todeliver stable and high operating margins.
Distribution of EBITDApercentage
Branded cement sales account for a highpercentage of CEMEX's cash flow.
Distribution of salespercentage
CEMEX is a pure cement and ready-mix play inthe markets it serves.
Cement 76.9
Ready-mix 19.4
Aggregates 2.4
Others 1.3
Cement 90.7
Ready-mix 7.7
Aggregates 1.2
Others 0.4
31
92 93 94 95 96 97 98 99 92 93 94 95 96 97 98 99 92 93 94 95 96 97 98 99
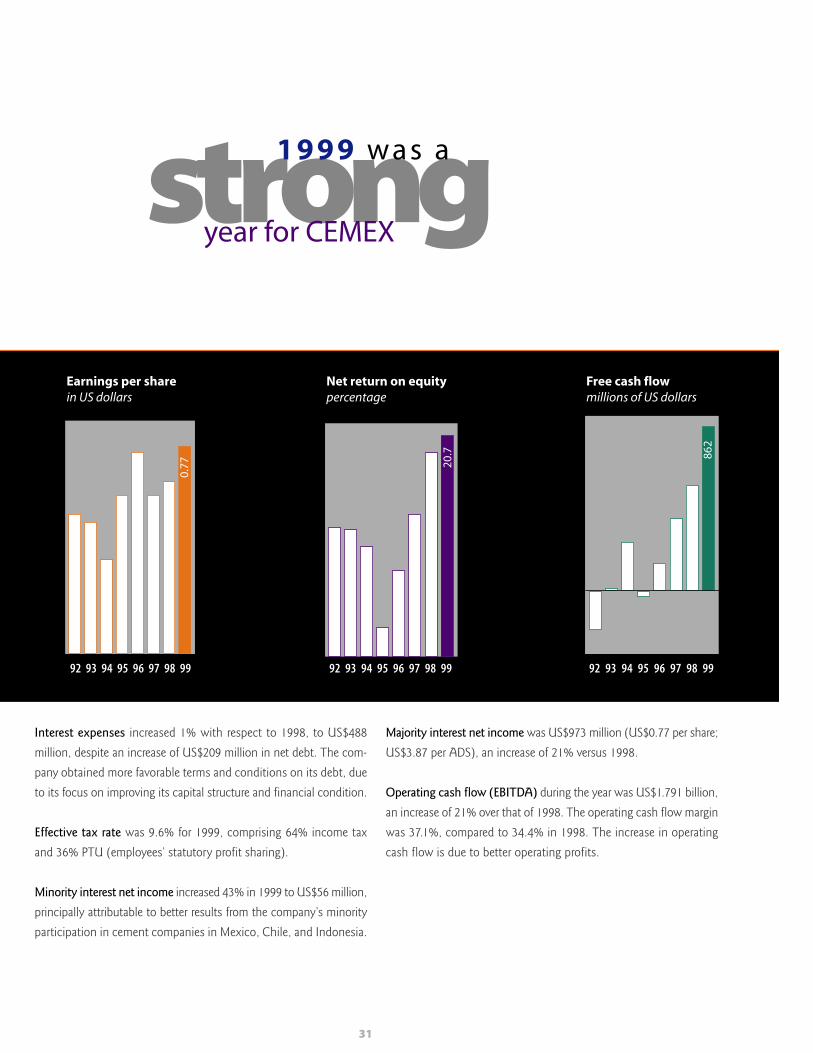
Earnings per share in US dollars
Net return on equitypercentage
Free cash flowmillions of US dollars
0.77 20
.7
strong1 9 9 9 was a
year for CEMEX
Interest expenses increased 1% with respect to 1998, to US$488
million, despite an increase of US$209 million in net debt. The com-
pany obtained more favorable terms and conditions on its debt, due
to its focus on improving its capital structure and financial condition.
Effective tax rate was 9.6% for 1999, comprising 64% income tax
and 36% PTU (employees’ statutory profit sharing).
Minority interest net income increased 43% in 1999 to US$56 million,
principally attributable to better results from the company’s minority
participation in cement companies in Mexico, Chile, and Indonesia.
Majority interest net income was US$973 million (US$0.77 per share;
US$3.87 per ADS), an increase of 21% versus 1998.
Operating cash flow (EBITDA) during the year was US$1.791 billion,
an increase of 21% over that of 1998. The operating cash flow margin
was 37.1%, compared to 34.4% in 1998. The increase in operating
cash flow is due to better operating profits.
862

32
Strong North American Economic Activity
A booming U.S. economy has driven seven consecutive years of sig-
nificant growth in cement consumption. In 1999, cement consump-
tion reached 106 million metric tons. The combination of low interest
rates, moderate GDP growth, and low unemployment rates fueled
strong residential and commercial construction activity. U.S. Govern-
ment infrastructure spending is on the rise, thanks, in large part, to
TEA-21 (Transportation Equity Act for the 21st Century), which
should contribute to cement consumption for the coming years.
For the year, CEMEX USA’s cement sales volume increased 15%
year-over-year due to the company’s expanding customer base and
improved conditions in its three main markets, Texas, California, and
Arizona.
exceededoperating performance
expectations
reviewglobal
Sales EBITDA Assets1999 1998 % Change 1999 1998 % Change 1999 1998 % Change
North America:
Mexico 2,332 1,830 27 1,174 917 28 4,913 5,470 (10)
U.S. 590 534 10 140 92 52 702 673 4
South America & Caribbean:
Venezuela and Dominican Republic 657 669 (2) 213 246 (13) 1,363 1,280 7
Colombia 168 264 (36) 72 64 13 859 1,077 (20)
Central America and the Caribbean 163 107 51 47 32 47 337 187 80
Europe and Asia:
Spain 764 888 (14) 306 318 (4) 2,120 2,242 (5)
Philippines 121 0 — 26 0 — 812 321 153
Others/eliminations* (33) (24) 41 (188) (184) 2 758 (790) 196
Consolidated 4,828 4,315 12 1,791 1,485 21 11,864 10,460 13
Millions of US dollars.* Includes the consolidation of one month of Egypt operations.

33
CEMEX’s WORLDWIDE OPERATIONS
Mexico’s GDP grew 3.7% in 1999 due to increased exports, foreign
direct investment, and domestic consumption. CEMEX Mexico’s 1999
domestic gray cement volume grew 5% due to solid demand from
the self-construction sector. This sector accounts for approximately
40% of Mexico’s total cement consumption. For the coming years,
the company expects increased growth for the Mexican economy as
well as a rise in domestic cement consumption due to higher levels
of self-construction and the potential modest expansion in public
investment.
Caribbean Remains Strong; South America Expected to Improve
The Caribbean basin showed solid economic growth in 1999. The
economies of Panama, Costa Rica, the Dominican Republic, and
Haiti grew significantly, with increases in GDP ranging from 3% to
8% for the year.
In South America, the economic downturn, together with prevailing
political uncertainty, negatively impacted CEMEX’s markets. The
economies of Venezuela and Colombia fell 7% and 5%, respectively,
versus 1998. CEMEX Venezuela’s domestic cement and concrete
volumes dropped 17% and 20%, respectively, while the company’s
Colombian operations reported a decline in domestic cement and
concrete volumes of 38% and 48%, respectively.
South America’s economic situation, along with cement and con-
crete consumption, is expected to recover once the internal political
situations improve. CEMEX’s Venezuelan and Colombian markets
should record marked improvement. The countries of the Caribbean
show important signs of continuity in governmental policy and public
and private investment. Thus, the company expects strong results in
the coming years.
60%21%
19%
65%17%
18%
47%
21%
32%
Distribution of sales by regionpercentage
Distribution of EBITDA by regionpercentage
Distribution of assets by regionpercentage
Europe Shows Sustained Improvement;
Southeast Asia Signals Initial Recovery
Despite the Euro’s relative weakness, the Spanish economy contin-
ued to perform very well and is one of the most solid economies in
the European Union. In 1999, Spain’s GDP increased 3.7%, unem-
ployment was very low, and the public deficit remained in check.
The construction sector was strong, driven primarily by housing,
industrial construction, and government spending on infrastructure
projects.
Southeast Asia’s economic downturn eased during 1999, and the
region is showing initial signs of recovery. In the Philippines construc-
tion sector, demand fell by 2.8%, an improvement over the decline
of 8.5% in 1998. Cement demand in the Philippines decreased 6%
versus 1998, due to a difficult macroeconomic environment and a
lack of consumer confidence. Government spending was the primary
driver of construction activity, while private sector activity continued
to lag.
Cement consumption in the Philippines is expected to pick up in the
coming years, based on economic growth, fueled by increasing private
investment. Investments in infrastructure and housing are expected to
increase, supported by a strong performance from the services, agri-
culture, and export sectors.
North America
South America & Caribbean
Europe & Asia

Installed cement Date ofCountry Company Investment % acquired capacity acquisition
(millions of US dollars) (million metric tons)
Indonesia PT Semen Gresik $126 11.0% 20.1 January
Philippines APO Cement 400 99.9%* 3.0 January
Chile Cementos Bio-Bio 34 11.9% 2.3 March
Costa Rica Cementos del Pacífico 80 95.3% 0.8 August
Egypt Assiut Cement 319 77.0% 4.0 November
*Economic interest
continuedstrength in financial position
During 1999, CEMEX continued to achieve, ahead of schedule, its
goal of strengthening its capital structure. The company surpassed its
financial ratio targets set at the beginning of 1999, increasing its inter-
est coverage to 3.6 times and reducing financial leverage to 2.7
times.
Net debt in 1999 increased to US$4.794 billion, US$209 million more
than in 1998, despite:
• Acquisitions of US$959 million;
• Share purchases of US$121 million, including
purchases of minority participations; and
• Investments in fixed assets of US$262 million.
92
FINANCIAL LEVERAGE
6.0
5.0
4.0
3.0
2.0
1.093 94 95 96 97 98 99
INTEREST COVERAGE
Interest coverage vs. financial leveragetimes
34

Creation of CEMEX Asia Holdings. In 1999, CEMEX formed an
investment holding company with third-party capital to take advantage
of attractive investment opportunities in cement-related assets within
southeast Asia.
The company, CEMEX Asia Holdings (CAH), has committed capital
totaling US$1.2 billion. As its initial investment, CAH purchased
the economic rights to CEMEX’s Philippine operations. CEMEX will
receive a technical assistance fee from the operating affiliates of
CAH as consideration for its role in supporting the acquired assets
and for contributing its industry expertise.
As a result of this transaction, which was completed during January
2000, CEMEX’s ownership of CAH stands at 77%, while the group of
investors owns 23%. The group of investors includes the AIG Asian
Infrastructure Fund II, L.P.; GIC Special Investments Pte Ltd.; Metro-
politan Life Insurance Company; the Asia Equity Infrastructure Fund,
L.P.; Capital International Asia CDPQ Inc.; and a consortium of
investors led by Navis Capital Partners.
Warrant issuance. In December 1999, CEMEX closed and settled a
warrant placement with a corresponding hedge. CEMEX sold 105
million warrants and an equal number of CPOs through a forward
transaction with a group of seven banks. The warrants were listed
simultaneously on the New York Stock Exchange (NYSE) under the
ticker symbol CX.WS and on the Bolsa Mexicana de Valores under
the ticker symbol CMX212E-DC059.
Net proceeds received from these transactions were approximately
US$500 million, which were used to reduce debt.
92 93 94 95 96 97 98
Dividends per shareUS dollars
SEC registration and NYSE listing. To enhance its transparency,
visibility, and liquidity, the company listed, on September 15th, a
new American Depository Share (ADS) on the New York Stock
Exchange (NYSE) under the ticker symbol “CX.”
Each ADS represents five CPO shares (Certificados de Participa-
ción Ordinaria), which are listed on the Bolsa Mexicana de
Valores under the ticker symbol “CEMEXCPO.”
At the annual shareholders meeting on April 29, 1999,
stockholders approved the dividend program for the year.
Under this dividend program, CEMEX shareholders elected
to receive a cash dividend of $1.30 pesos per share or its
equivalent in CPOs.
Of the shareholders, 86.27% elected the CPOs, while the
remaining 13.73% elected to receive the $1.30 peso cash
dividend, for a total of approximately $255 million pesos
(US$27 million) paid by CEMEX.
*As a result of CEMEX’s Share Repurchase Program in 1997, 24 million CPO shares wereacquired, totaling approximately US$119 million. The CPO shares acquired through this pro-gram account for approximately 2% of the CPO shares outstanding (see note 5 to SelectedConsolidated Financial Information).
35
0.14

36
Relevant financing. During 1999, CEMEX refinanced and restructured
close to US$2.5 billion of its debt, achieving a more solid capital
structure, better terms and conditions, and a smoother maturity
profile that matches cash flow generation. Among the transactions
were:
• US$500 million, 3-year equity swap with Valenciana shares
• US$1.1 billion, 7-year multi-currency syndicated loan
• US$250 million, 3-year Euro Medium-term Note
• 2-year U.S. Commercial Paper Program for US$250 million
• US$200 million, 10-year Euro Medium-term Note with a put
option on year 5
Derivative instruments. CEMEX periodically utilizes hedging instru-
ments designed to reduce its exposure to interest-rate fluctuations,
energy prices, currency exchange rates, and share prices. The eco-
nomic effect of these hedging transactions is reflected in the com-
pany’s cost of sales and comprehensive financing result, or as a part of
stockholders’ equity, as appropriate.
MANAGEMENT AND SHAREHOLDER INTERESTS ALIGNED
Variable Compensation Program. Fifteen hundred executives par-
ticipate in this initiative, which ties annual bonuses to shareholder
value initiatives. A Total Business Return approach is used to focus
executives’ efforts on maximizing the return on capital employed.
Under this program, key senior management receive half of their
variable compensation in restricted stock options, which fully vest if
the 12-month average of the stock price doubles, in dollar terms.
Voluntary Stock Option Plan. In 1998, the company initiated this
program, in which a total of 250 executives elected to purchase five-
year options, of which 22,636,845 remain outstanding.
Employee Stock Option Plan. In 1995, the company started a 10-year
stock option plan. The initiative includes 270 executives and represents
a portion of their annual compensation. In 1998, the company started
a 5-year restricted stock option plan for a group of 50 key executives
as part of their variable compensation. A total of 41,019,922
options remain outstanding.
YEAR 2000 (Y2K) ISSUE
The CEMEX Year 2000 Program was completed according to schedule.
The company achieved its objective of maintaining continuous oper-
ations in all its manufacturing plants, technology platforms, and
information systems.
During the transition period to Y2K, all of our operations performed
normally, and, in the following months, we will continue to moni-
tor the performance of all Y2K-sensitive elements in our worldwide
operations.
The company invested approximately 400,000 hours and approximate-
ly US$36 million in preparation for Y2K. The investment has result-
ed in improved business systems and capabilities that will permit
CEMEX to do business better in 2000 and beyond.
Balance-sheet debt US$ 4.371 billion
Long-term debt (76.4%) 3.341 billion
Short-term debt (23.6%) 1.030 billion
Equity obligations 0.750 billion
Cash 0.326 billion
Net debt 4.794 billion
Denomination of on-balance-sheet debt
Dollars 79.36 %
Euros 14.24 %
Philippine pesos 1.02 %
Egyptian pounds 5.38 %
Average cost of on-balance-sheet debt 8.10%
DEBT INDICATORS AT THE END OF 1999
38 Auditors’ report
39 Management responsibility for internal control
40 Consolidated balance sheets
42 Consolidated statements of income
43 Consolidated statements of changes in financial position
44 Balance sheets (parent company only)
46 Statements of income (parent company only)
47 Statements of changes in financial position (parent company only)
48 Statements of changes in stockholders’ equity
50 Notes to consolidated and parent-company-only financial statements
financialstatements
FIN
AN
CIA
LS
TA
TE
ME
NT
S
38
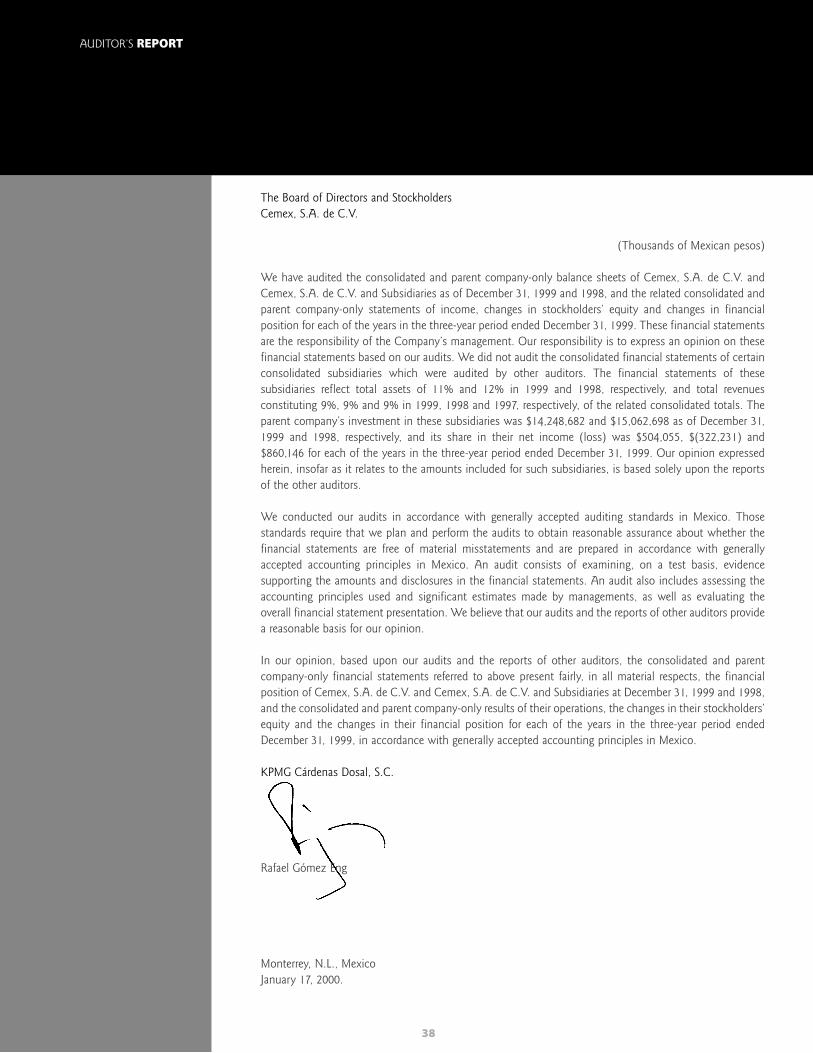
AUDITOR’S REPORT
The Board of Directors and StockholdersCemex, S.A. de C.V.
(Thousands of Mexican pesos)
We have audited the consolidated and parent company-only balance sheets of Cemex, S.A. de C.V. andCemex, S.A. de C.V. and Subsidiaries as of December 31, 1999 and 1998, and the related consolidated andparent company-only statements of income, changes in stockholders’ equity and changes in financialposition for each of the years in the three-year period ended December 31, 1999. These financial statementsare the responsibility of the Company’s management. Our responsibility is to express an opinion on thesefinancial statements based on our audits. We did not audit the consolidated financial statements of certainconsolidated subsidiaries which were audited by other auditors. The financial statements of thesesubsidiaries reflect total assets of 11% and 12% in 1999 and 1998, respectively, and total revenuesconstituting 9%, 9% and 9% in 1999, 1998 and 1997, respectively, of the related consolidated totals. Theparent company’s investment in these subsidiaries was $14,248,682 and $15,062,698 as of December 31,1999 and 1998, respectively, and its share in their net income (loss) was $504,055, $(322,231) and$860,146 for each of the years in the three-year period ended December 31, 1999. Our opinion expressedherein, insofar as it relates to the amounts included for such subsidiaries, is based solely upon the reportsof the other auditors.
We conducted our audits in accordance with generally accepted auditing standards in Mexico. Thosestandards require that we plan and perform the audits to obtain reasonable assurance about whether thefinancial statements are free of material misstatements and are prepared in accordance with generallyaccepted accounting principles in Mexico. An audit consists of examining, on a test basis, evidencesupporting the amounts and disclosures in the financial statements. An audit also includes assessing theaccounting principles used and significant estimates made by managements, as well as evaluating theoverall financial statement presentation. We believe that our audits and the reports of other auditors providea reasonable basis for our opinion.
In our opinion, based upon our audits and the reports of other auditors, the consolidated and parentcompany-only financial statements referred to above present fairly, in all material respects, the financialposition of Cemex, S.A. de C.V. and Cemex, S.A. de C.V. and Subsidiaries at December 31, 1999 and 1998,and the consolidated and parent company-only results of their operations, the changes in their stockholders’equity and the changes in their financial position for each of the years in the three-year period endedDecember 31, 1999, in accordance with generally accepted accounting principles in Mexico.
KPMG Cárdenas Dosal, S.C.
Rafael Gómez Eng
Monterrey, N.L., MexicoJanuary 17, 2000.
39
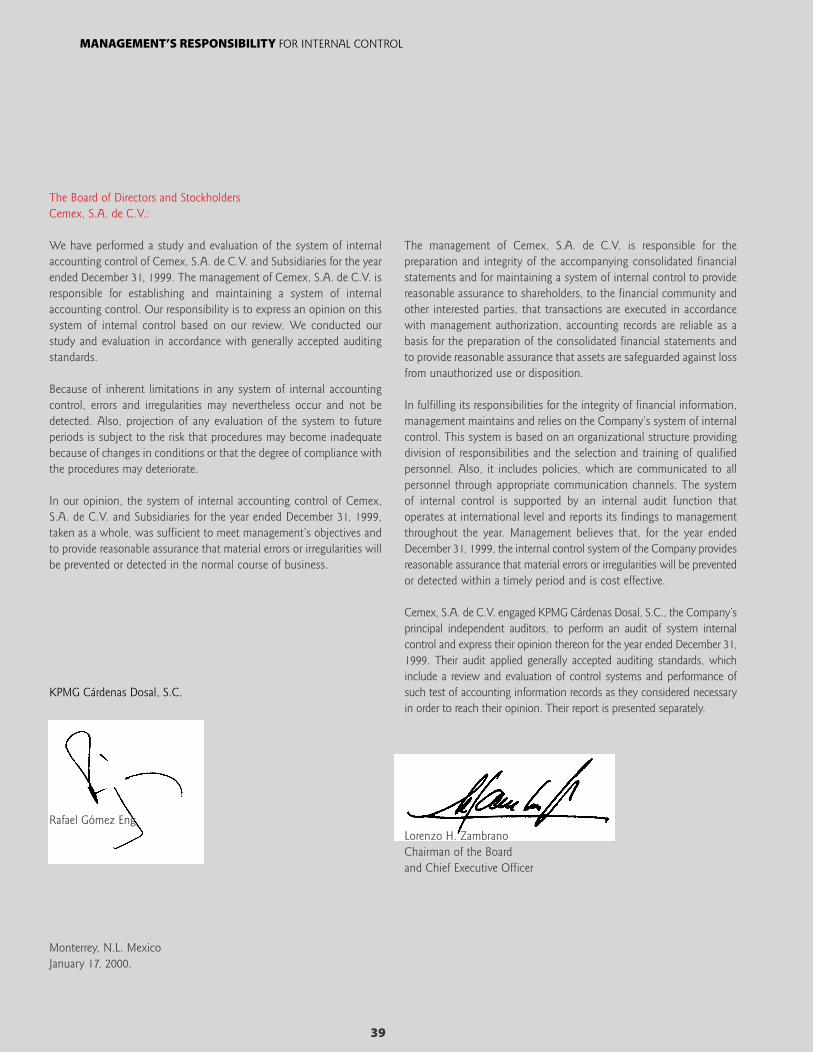
MANAGEMENT’S RESPONSIBILITY FOR INTERNAL CONTROL
The Board of Directors and StockholdersCemex, S.A. de C.V.:
We have performed a study and evaluation of the system of internalaccounting control of Cemex, S.A. de C.V. and Subsidiaries for the yearended December 31, 1999. The management of Cemex, S.A. de C.V. isresponsible for establishing and maintaining a system of internalaccounting control. Our responsibility is to express an opinion on thissystem of internal control based on our review. We conducted ourstudy and evaluation in accordance with generally accepted auditingstandards.
Because of inherent limitations in any system of internal accountingcontrol, errors and irregularities may nevertheless occur and not bedetected. Also, projection of any evaluation of the system to futureperiods is subject to the risk that procedures may become inadequatebecause of changes in conditions or that the degree of compliance withthe procedures may deteriorate.
In our opinion, the system of internal accounting control of Cemex,S.A. de C.V. and Subsidiaries for the year ended December 31, 1999,taken as a whole, was sufficient to meet management’s objectives andto provide reasonable assurance that material errors or irregularities willbe prevented or detected in the normal course of business.
KPMG Cárdenas Dosal, S.C.
Rafael Gómez Eng
Monterrey, N.L. MexicoJanuary 17, 2000.
The management of Cemex, S.A. de C.V. is responsible for thepreparation and integrity of the accompanying consolidated financialstatements and for maintaining a system of internal control to providereasonable assurance to shareholders, to the financial community andother interested parties, that transactions are executed in accordancewith management authorization, accounting records are reliable as abasis for the preparation of the consolidated financial statements andto provide reasonable assurance that assets are safeguarded against lossfrom unauthorized use or disposition.
In fulfilling its responsibilities for the integrity of financial information,management maintains and relies on the Company’s system of internalcontrol. This system is based on an organizational structure providingdivision of responsibilities and the selection and training of qualifiedpersonnel. Also, it includes policies, which are communicated to allpersonnel through appropriate communication channels. The systemof internal control is supported by an internal audit function thatoperates at international level and reports its findings to managementthroughout the year. Management believes that, for the year endedDecember 31, 1999, the internal control system of the Company providesreasonable assurance that material errors or irregularities will be preventedor detected within a timely period and is cost effective.
Cemex, S.A. de C.V. engaged KPMG Cárdenas Dosal, S.C., the Company’sprincipal independent auditors, to perform an audit of system internalcontrol and express their opinion thereon for the year ended December 31,1999. Their audit applied generally accepted auditing standards, whichinclude a review and evaluation of control systems and performance ofsuch test of accounting information records as they considered necessaryin order to reach their opinion. Their report is presented separately.
Lorenzo H. ZambranoChairman of the Boardand Chief Executive Officer
40
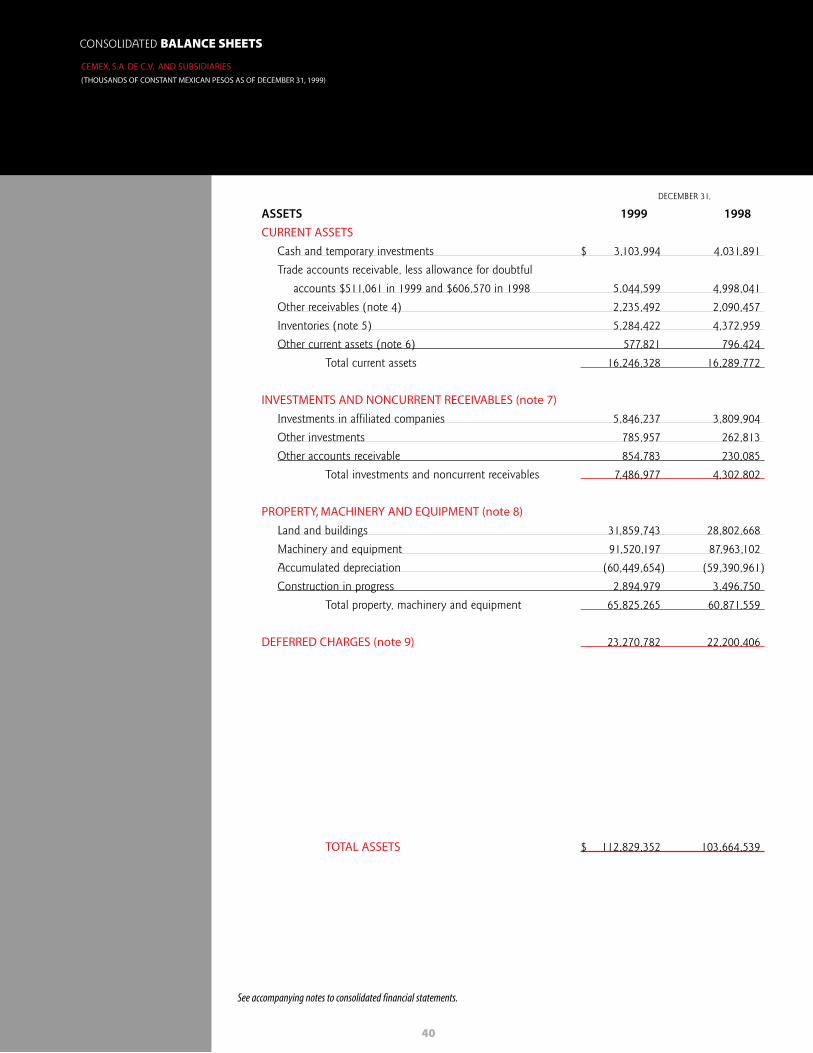
CEMEX, S.A. DE C.V. AND SUBSIDIARIES
(THOUSANDS OF CONSTANT MEXICAN PESOS AS OF DECEMBER 31, 1999)
DECEMBER 31,
ASSETS 1999 1998
CURRENT ASSETS
Cash and temporary investments $ 3,103,994 4,031,891
Trade accounts receivable, less allowance for doubtful
accounts $511,061 in 1999 and $606,570 in 1998 5,044,599 4,998,041
Other receivables (note 4) 2,235,492 2,090,457
Inventories (note 5) 5,284,422 4,372,959
Other current assets (note 6) 577,821 796,424
Total current assets 16,246,328 16,289,772
INVESTMENTS AND NONCURRENT RECEIVABLES (note 7)
Investments in affiliated companies 5,846,237 3,809,904
Other investments 785,957 262,813
Other accounts receivable 854,783 230,085
Total investments and noncurrent receivables 7,486,977 4,302,802
PROPERTY, MACHINERY AND EQUIPMENT (note 8)
Land and buildings 31,859,743 28,802,668
Machinery and equipment 91,520,197 87,963,102
Accumulated depreciation (60,449,654) (59,390,961)
Construction in progress 2,894,979 3,496,750
Total property, machinery and equipment 65,825,265 60,871,559
DEFERRED CHARGES (note 9) 23,270,782 22,200,406
TOTAL ASSETS $ 112,829,352 103,664,539
See accompanying notes to consolidated financial statements.
CONSOLIDATED BALANCE SHEETS
41
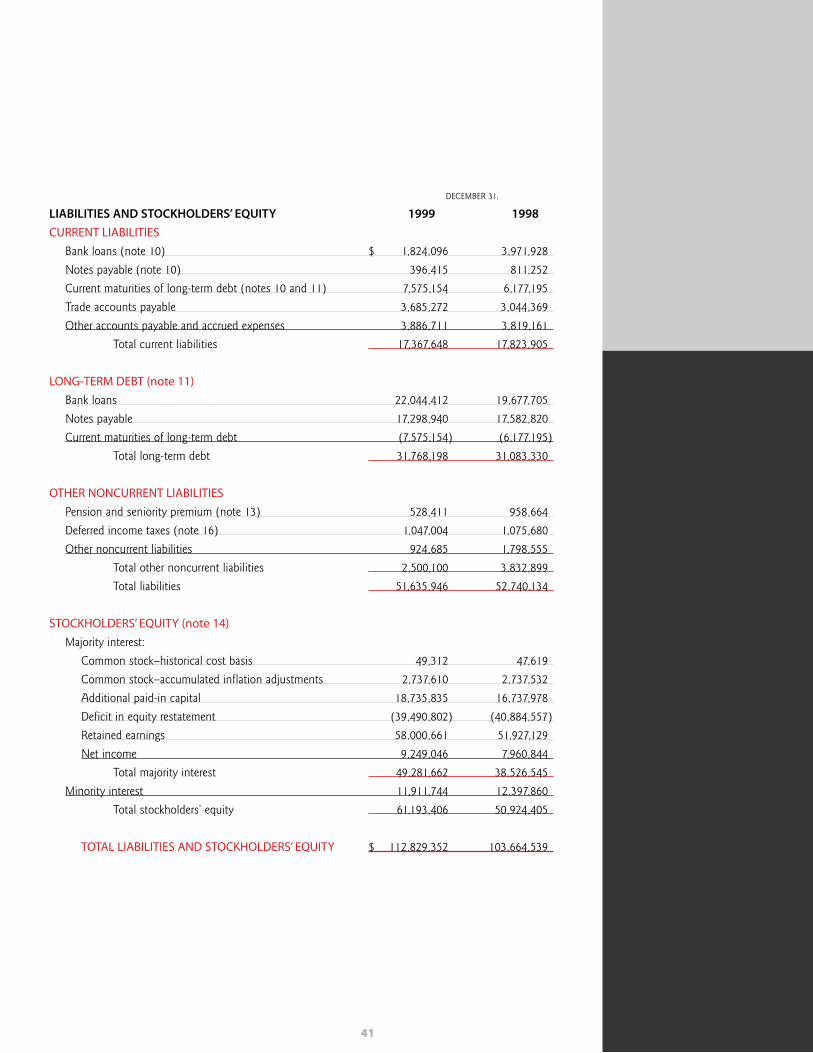
DECEMBER 31,
LIABILITIES AND STOCKHOLDERS’ EQUITY 1999 1998
CURRENT LIABILITIES
Bank loans (note 10) $ 1,824,096 3,971,928
Notes payable (note 10) 396,415 811,252
Current maturities of long-term debt (notes 10 and 11) 7,575,154 6,177,195
Trade accounts payable 3,685,272 3,044,369
Other accounts payable and accrued expenses 3,886,711 3,819,161
Total current liabilities 17,367,648 17,823,905
LONG-TERM DEBT (note 11)
Bank loans 22,044,412 19,677,705
Notes payable 17,298,940 17,582,820
Current maturities of long-term debt (7,575,154) (6,177,195)
Total long-term debt 31,768,198 31,083,330
OTHER NONCURRENT LIABILITIES
Pension and seniority premium (note 13) 528,411 958,664
Deferred income taxes (note 16) 1,047,004 1,075,680
Other noncurrent liabilities 924,685 1,798,555
Total other noncurrent liabilities 2,500,100 3,832,899
Total liabilities 51,635,946 52,740,134
STOCKHOLDERS’ EQUITY (note 14)
Majority interest:
Common stock–historical cost basis 49,312 47,619
Common stock–accumulated inflation adjustments 2,737,610 2,737,532
Additional paid-in capital 18,735,835 16,737,978
Deficit in equity restatement (39,490,802) (40,884,557)
Retained earnings 58,000,661 51,927,129
Net income 9,249,046 7,960,844
Total majority interest 49,281,662 38,526,545
Minority interest 11,911,744 12,397,860
Total stockholders’ equity 61,193,406 50,924,405
TOTAL LIABILITIES AND STOCKHOLDERS’ EQUITY $ 112,829,352 103,664,539

42
YEARS ENDED ON DECEMBER 31,
1999 1998 1997Net sales $ 45,913,946 42,767,440 38,506,438Cost of sales (25,581,085) (24,727,878) (23,596,432)
Gross profit 20,332,861 18,039,562 14,910,006
Operating expenses:Administrative (4,973,151) (4,603,483) (3,936,520)Selling (1,698,647) (1,763,114) (1,874,468)
Total operating expenses (6,671,798) (6,366,597) (5,810,988)Operating income 13,661,063 11,672,965 9,099,018
Comprehensive financing income (cost):Financial expenses (4,639,255) (4,810,542) (5,184,047)Financial income 387,714 106,419 1,051,693Foreign exchange result, net 262,463 (2,194,669) (120,187)Monetary position result 3,713,965 5,588,622 5,865,568
Net comprehensive financing income (cost) (275,113) (1,310,170) 1,613,027
Other expense, net (2,823,124) (1,507,782) (1,397,979)Income before income taxes,
employees’ statutory profit sharing and equity in income of affiliates 10,562,826 8,855,013 9,314,066
Income tax and business assets tax, net (note 16) (650,321) (457,940) (508,792)
Employees’ statutory profit sharing (note16) (364,087) (200,410) (165,913)Total income tax, business
assets tax and employees’ statutory profit sharing (1,014,408) (658,350) (674,705)
Income before equity in income of affiliates 9,548,418 8,196,663 8,639,361
Equity in income of affiliates 236,592 155,328 177,720Consolidated net income 9,785,010 8,351,991 8,817,081Minority interest net income 535,964 391,147 1,083,902Majority interest net income $ 9,249,046 7,960,844 7,733,179
Basic Earnings Per Share (note 2A and note 20) $ 2.45 2.10 2.01
Diluted Earnings Per Share
(note 2A and note 20) $ 2.44 2.10 1.98
See accompanying notes to consolidated financial statements.
CEMEX, S.A. DE C.V. AND SUBSIDIARIES
(THOUSANDS OF CONSTANT MEXICAN PESOS AS OF DECEMBER 31, 1999, EXCEPT FOR EARNINGS PER SHARE)
CONSOLIDATED STATEMENTS OF INCOME
43
See accompanying notes to consolidated financial statements.
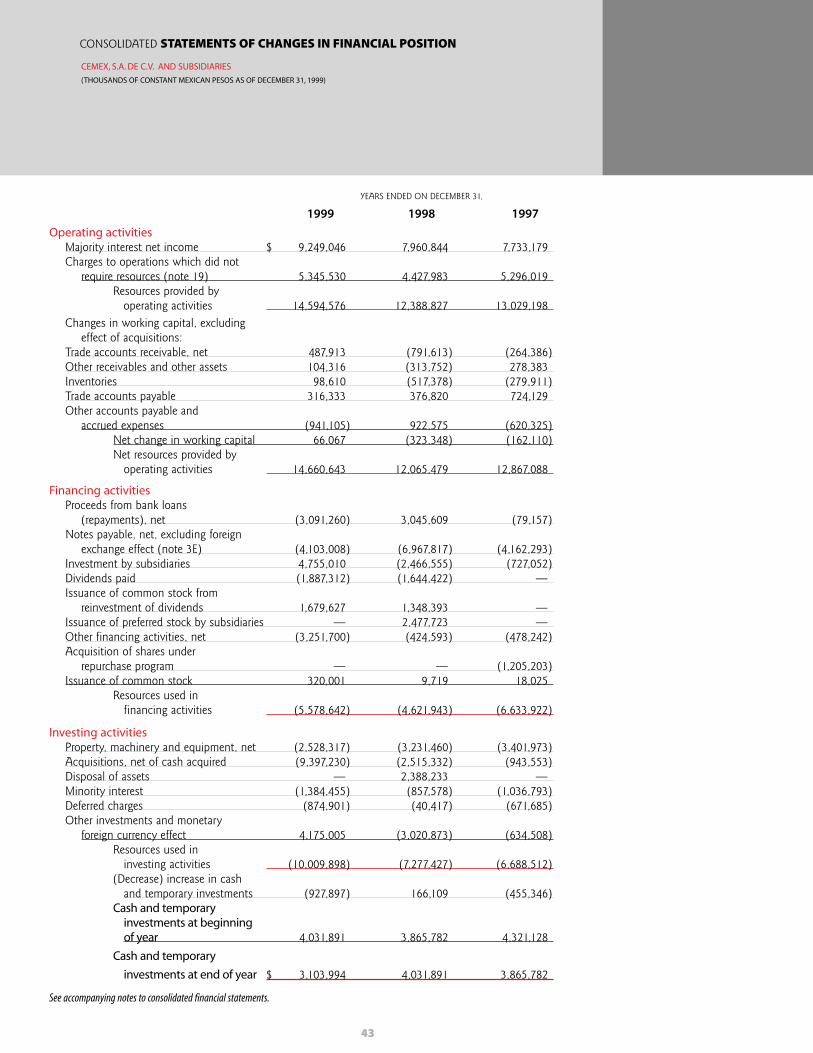
YEARS ENDED ON DECEMBER 31,
1999 1998 1997
Operating activitiesMajority interest net income $ 9,249,046 7,960,844 7,733,179Charges to operations which did not
require resources (note 19) 5,345,530 4,427,983 5,296,019Resources provided by
operating activities 14,594,576 12,388,827 13,029,198Changes in working capital, excluding
effect of acquisitions:Trade accounts receivable, net 487,913 (791,613) (264,386)Other receivables and other assets 104,316 (313,752) 278,383Inventories 98,610 (517,378) (279,911)Trade accounts payable 316,333 376,820 724,129Other accounts payable and
accrued expenses (941,105) 922,575 (620,325)Net change in working capital 66,067 (323,348) (162,110)Net resources provided by
operating activities 14,660,643 12,065,479 12,867,088
Financing activitiesProceeds from bank loans
(repayments), net (3,091,260) 3,045,609 (79,157)Notes payable, net, excluding foreign
exchange effect (note 3E) (4,103,008) (6,967,817) (4,162,293)Investment by subsidiaries 4,755,010 (2,466,555) (727,052)Dividends paid (1,887,312) (1,644,422) —Issuance of common stock from
reinvestment of dividends 1,679,627 1,348,393 —Issuance of preferred stock by subsidiaries — 2,477,723 —Other financing activities, net (3,251,700) (424,593) (478,242)Acquisition of shares under
repurchase program — — (1,205,203)Issuance of common stock 320,001 9,719 18,025
Resources used in financing activities (5,578,642) (4,621,943) (6,633,922)
Investing activitiesProperty, machinery and equipment, net (2,528,317) (3,231,460) (3,401,973)Acquisitions, net of cash acquired (9,397,230) (2,515,332) (943,553)Disposal of assets — 2,388,233 —Minority interest (1,384,455) (857,578) (1,036,793)Deferred charges (874,901) (40,417) (671,685)Other investments and monetary
foreign currency effect 4,175,005 (3,020,873) (634,508)Resources used in
investing activities (10,009,898) (7,277,427) (6,688,512)(Decrease) increase in cash
and temporary investments (927,897) 166,109 (455,346)Cash and temporary
investments at beginning of year 4,031,891 3,865,782 4,321,128
Cash and temporary
investments at end of year $ 3,103,994 4,031,891 3,865,782
CEMEX, S.A. DE C.V. AND SUBSIDIARIES
(THOUSANDS OF CONSTANT MEXICAN PESOS AS OF DECEMBER 31, 1999)
CONSOLIDATED STATEMENTS OF CHANGES IN FINANCIAL POSITION
44
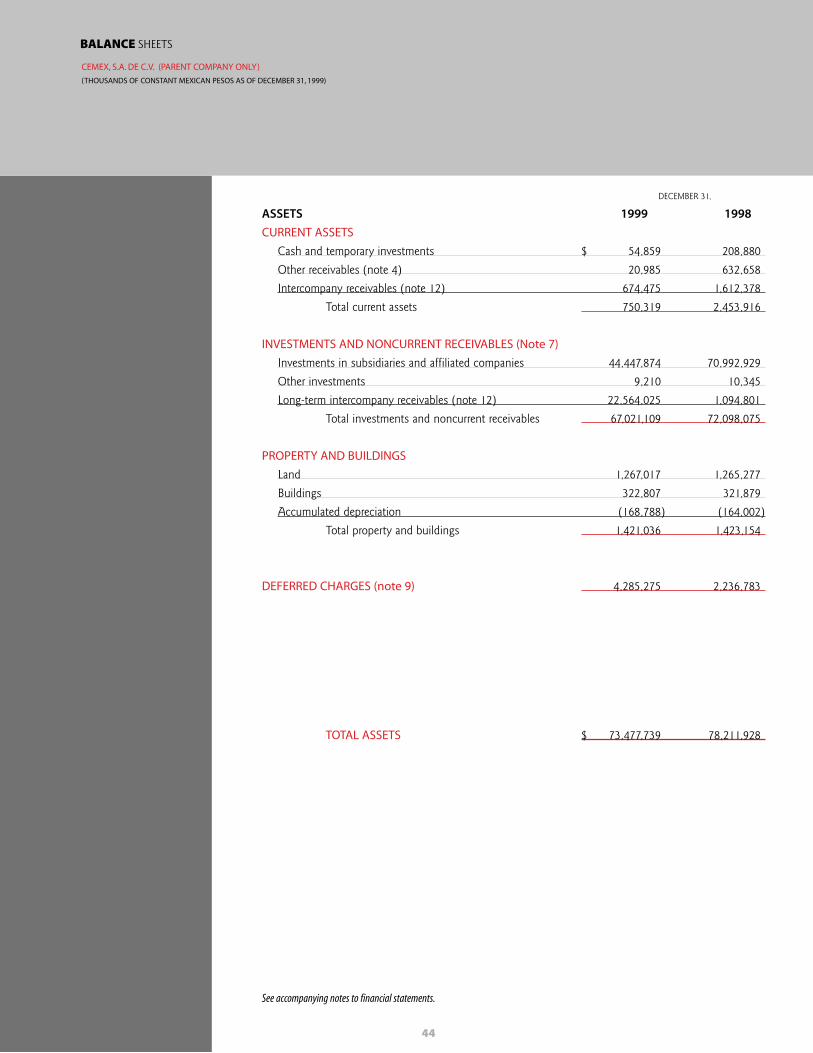
DECEMBER 31,
ASSETS 1999 1998
CURRENT ASSETS
Cash and temporary investments $ 54,859 208,880
Other receivables (note 4) 20,985 632,658
Intercompany receivables (note 12) 674,475 1,612,378
Total current assets 750,319 2,453,916
INVESTMENTS AND NONCURRENT RECEIVABLES (Note 7)
Investments in subsidiaries and affiliated companies 44,447,874 70,992,929
Other investments 9,210 10,345
Long-term intercompany receivables (note 12) 22,564,025 1,094,801
Total investments and noncurrent receivables 67,021,109 72,098,075
PROPERTY AND BUILDINGS
Land 1,267,017 1,265,277
Buildings 322,807 321,879
Accumulated depreciation (168,788) (164,002)
Total property and buildings 1,421,036 1,423,154
DEFERRED CHARGES (note 9) 4,285,275 2,236,783
TOTAL ASSETS $ 73,477,739 78,211,928
See accompanying notes to financial statements.
CEMEX, S.A. DE C.V. (PARENT COMPANY ONLY)
(THOUSANDS OF CONSTANT MEXICAN PESOS AS OF DECEMBER 31, 1999)
BALANCE SHEETS
45
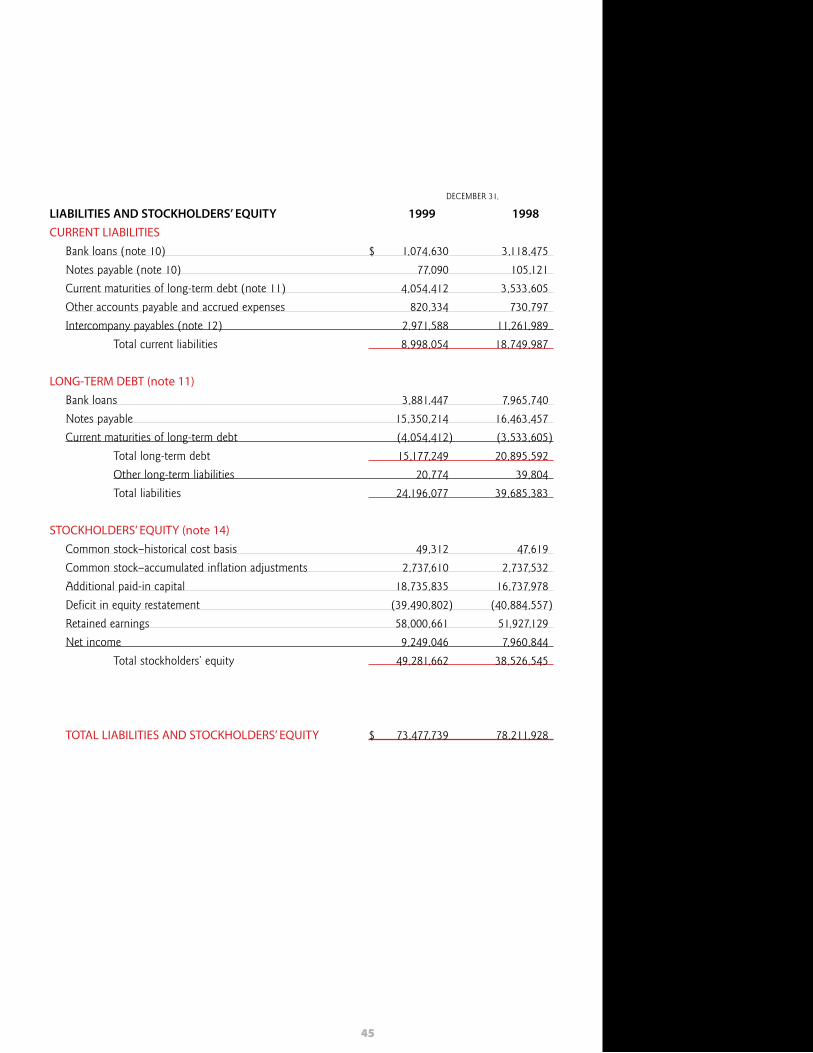
DECEMBER 31,
LIABILITIES AND STOCKHOLDERS’ EQUITY 1999 1998
CURRENT LIABILITIES
Bank loans (note 10) $ 1,074,630 3,118,475
Notes payable (note 10) 77,090 105,121
Current maturities of long-term debt (note 11) 4,054,412 3,533,605
Other accounts payable and accrued expenses 820,334 730,797
Intercompany payables (note 12) 2,971,588 11,261,989
Total current liabilities 8,998,054 18,749,987
LONG-TERM DEBT (note 11)
Bank loans 3,881,447 7,965,740
Notes payable 15,350,214 16,463,457
Current maturities of long-term debt (4,054,412) (3,533,605)
Total long-term debt 15,177,249 20,895,592
Other long-term liabilities 20,774 39,804
Total liabilities 24,196,077 39,685,383
STOCKHOLDERS’ EQUITY (note 14)
Common stock–historical cost basis 49,312 47,619
Common stock–accumulated inflation adjustments 2,737,610 2,737,532
Additional paid-in capital 18,735,835 16,737,978
Deficit in equity restatement (39,490,802) (40,884,557)
Retained earnings 58,000,661 51,927,129
Net income 9,249,046 7,960,844
Total stockholders’ equity 49,281,662 38,526,545
TOTAL LIABILITIES AND STOCKHOLDERS’ EQUITY $ 73,477,739 78,211,928
46
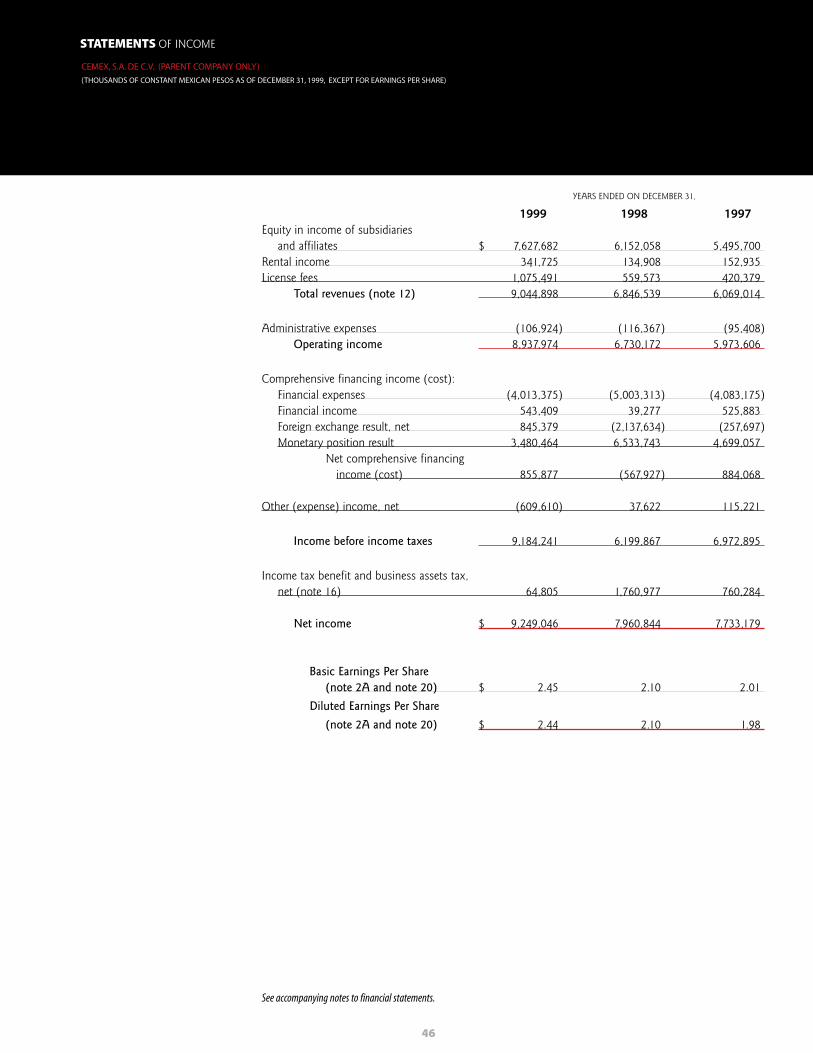
YEARS ENDED ON DECEMBER 31,
1999 1998 1997Equity in income of subsidiaries
and affiliates $ 7,627,682 6,152,058 5,495,700Rental income 341,725 134,908 152,935License fees 1,075,491 559,573 420,379
Total revenues (note 12) 9,044,898 6,846,539 6,069,014
Administrative expenses (106,924) (116,367) (95,408)Operating income 8,937,974 6,730,172 5,973,606
Comprehensive financing income (cost):Financial expenses (4,013,375) (5,003,313) (4,083,175)Financial income 543,409 39,277 525,883Foreign exchange result, net 845,379 (2,137,634) (257,697)Monetary position result 3,480,464 6,533,743 4,699,057
Net comprehensive financing income (cost) 855,877 (567,927) 884,068
Other (expense) income, net (609,610) 37,622 115,221
Income before income taxes 9,184,241 6,199,867 6,972,895
Income tax benefit and business assets tax,net (note 16) 64,805 1,760,977 760,284
Net income $ 9,249,046 7,960,844 7,733,179
Basic Earnings Per Share (note 2A and note 20) $ 2.45 2.10 2.01
Diluted Earnings Per Share
(note 2A and note 20) $ 2.44 2.10 1.98
See accompanying notes to financial statements.
CEMEX, S.A. DE C.V. (PARENT COMPANY ONLY)
(THOUSANDS OF CONSTANT MEXICAN PESOS AS OF DECEMBER 31, 1999, EXCEPT FOR EARNINGS PER SHARE)
STATEMENTS OF INCOME
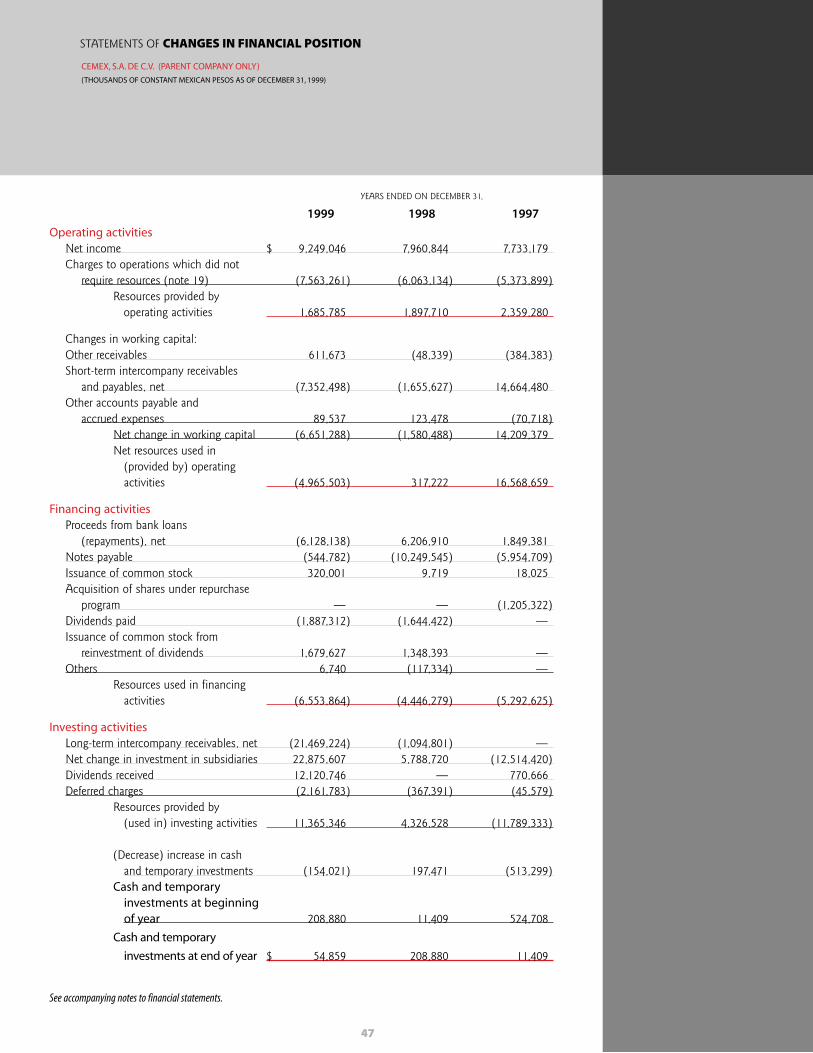
47
See accompanying notes to financial statements.
YEARS ENDED ON DECEMBER 31,
1999 1998 1997
Operating activitiesNet income $ 9,249,046 7,960,844 7,733,179Charges to operations which did not
require resources (note 19) (7,563,261) (6,063,134) (5,373,899)Resources provided by
operating activities 1,685,785 1,897,710 2,359,280
Changes in working capital:Other receivables 611,673 (48,339) (384,383)Short-term intercompany receivables
and payables, net (7,352,498) (1,655,627) 14,664,480Other accounts payable and
accrued expenses 89,537 123,478 (70,718)Net change in working capital (6,651,288) (1,580,488) 14,209,379Net resources used in
(provided by) operating activities (4,965,503) 317,222 16,568,659
Financing activitiesProceeds from bank loans
(repayments), net (6,128,138) 6,206,910 1,849,381Notes payable (544,782) (10,249,545) (5,954,709)Issuance of common stock 320,001 9,719 18,025Acquisition of shares under repurchase
program — — (1,205,322)Dividends paid (1,887,312) (1,644,422) —Issuance of common stock from
reinvestment of dividends 1,679,627 1,348,393 —Others 6,740 (117,334) —
Resources used in financingactivities (6,553,864) (4,446,279) (5,292,625)
Investing activitiesLong-term intercompany receivables, net (21,469,224) (1,094,801) —Net change in investment in subsidiaries 22,875,607 5,788,720 (12,514,420)Dividends received 12,120,746 — 770,666Deferred charges (2,161,783) (367,391) (45,579)
Resources provided by (used in) investing activities 11,365,346 4,326,528 (11,789,333)
(Decrease) increase in cash and temporary investments (154,021) 197,471 (513,299)
Cash and temporary investments at beginning of year 208,880 11,409 524,708
Cash and temporary
investments at end of year $ 54,859 208,880 11,409
CEMEX, S.A. DE C.V. (PARENT COMPANY ONLY)
(THOUSANDS OF CONSTANT MEXICAN PESOS AS OF DECEMBER 31, 1999)
STATEMENTS OF CHANGES IN FINANCIAL POSITION
48
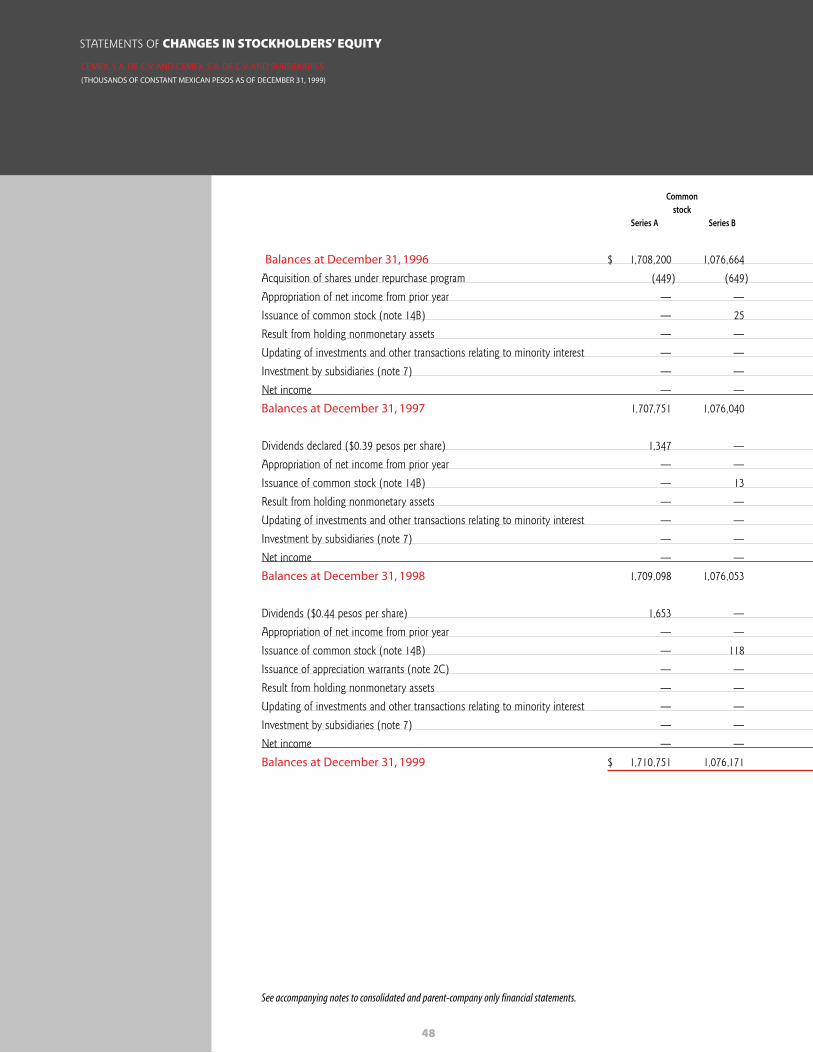
Commonstock
Series A Series B
Balances at December 31, 1996 $ 1,708,200 1,076,664
Acquisition of shares under repurchase program (449) (649)
Appropriation of net income from prior year — —
Issuance of common stock (note 14B) — 25
Result from holding nonmonetary assets — —
Updating of investments and other transactions relating to minority interest — —
Investment by subsidiaries (note 7) — —
Net income — —
Balances at December 31, 1997 1,707,751 1,076,040
Dividends declared ($0.39 pesos per share) 1,347 —
Appropriation of net income from prior year — —
Issuance of common stock (note 14B) — 13
Result from holding nonmonetary assets — —
Updating of investments and other transactions relating to minority interest — —
Investment by subsidiaries (note 7) — —
Net income — —
Balances at December 31, 1998 1,709,098 1,076,053
Dividends ($0.44 pesos per share) 1,653 —
Appropriation of net income from prior year — —
Issuance of common stock (note 14B) — 118
Issuance of appreciation warrants (note 2C) — —
Result from holding nonmonetary assets — —
Updating of investments and other transactions relating to minority interest — —
Investment by subsidiaries (note 7) — —
Net income — —
Balances at December 31, 1999 $ 1,710,751 1,076,171
See accompanying notes to consolidated and parent-company only financial statements.
CEMEX, S.A. DE C.V. AND CEMEX, S.A. DE C.V. AND SUBSIDIARIES
(THOUSANDS OF CONSTANT MEXICAN PESOS AS OF DECEMBER 31, 1999)
STATEMENTS OF CHANGES IN STOCKHOLDERS’ EQUITY
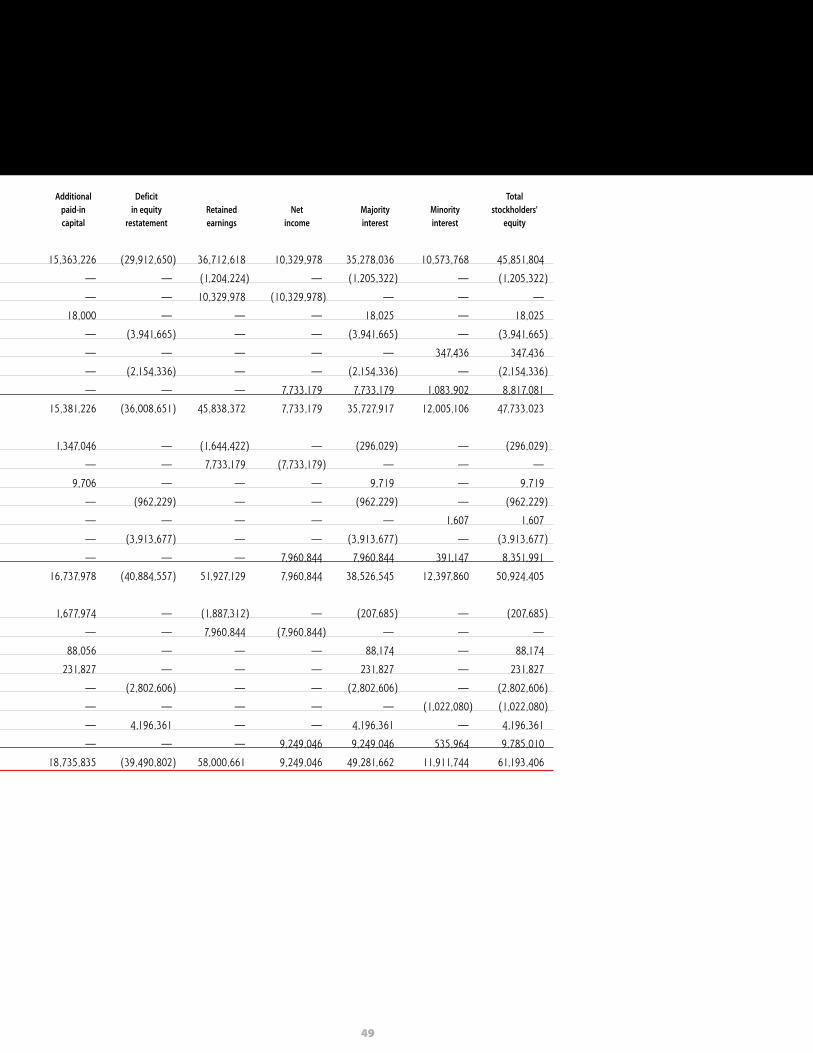
49
Additional Deficit Totalpaid-in in equity Retained Net Majority Minority stockholders’capital restatement earnings income interest interest equity
15,363,226 (29,912,650) 36,712,618 10,329,978 35,278,036 10,573,768 45,851,804
— — (1,204,224) — (1,205,322) — (1,205,322)
— — 10,329,978 (10,329,978) — — —
18,000 — — — 18,025 — 18,025
— (3,941,665) — — (3,941,665) — (3,941,665)
— — — — — 347,436 347,436
— (2,154,336) — — (2,154,336) — (2,154,336)
— — — 7,733,179 7,733,179 1,083,902 8,817,081
15,381,226 (36,008,651) 45,838,372 7,733,179 35,727,917 12,005,106 47,733,023
1,347,046 — (1,644,422) — (296,029) — (296,029)
— — 7,733,179 (7,733,179) — — —
9,706 — — — 9,719 — 9,719
— (962,229) — — (962,229) — (962,229)
— — — — — 1,607 1,607
— (3,913,677) — — (3,913,677) — (3,913,677)
— — — 7,960,844 7,960,844 391,147 8,351,991
16,737,978 (40,884,557) 51,927,129 7,960,844 38,526,545 12,397,860 50,924,405
1,677,974 — (1,887,312) — (207,685) — (207,685)
— — 7,960,844 (7,960,844) — — —
88,056 — — — 88,174 — 88,174
231,827 — — — 231,827 — 231,827
— (2,802,606) — — (2,802,606) — (2,802,606)
— — — — — (1,022,080) (1,022,080)
— 4,196,361 — — 4,196,361 — 4,196,361
— — — 9,249,046 9,249,046 535,964 9,785,010
18,735,835 (39,490,802) 58,000,661 9,249,046 49,281,662 11,911,744 61,193,406
50
CEMEX, S.A. DE C.V. AND CEMEX, S.A. DE C.V. AND SUBSIDIARIES
DECEMBER 31, 1999, 1998 AND 1997
(THOUSANDS OF CONSTANT MEXICAN PESOS AS OF DECEMBER 31, 1999)
NOTES TO CONSOLIDATED AND PARENT COMPANY ONLY FINANCIAL STATEMENTS
1.- DESCRIPTION OF BUSINESSCemex, S.A. de C.V. (Cemex or the Company) is a Mexican parent company of entities engaged in the productionand marketing of cement and concrete in the construction industry. The Company also has subsidiaries thatparticipate in the tourism industry.
2.- OUTSTANDING EVENTS DURING 1999A) EXCHANGE OF SHARES FOR THE NEW ORDINARY PARTICIPATION CERTIFICATE (“CPO”)
On September 14, 1999, the Company concluded an exchange offer of its old series “A” and “B” shares, and its oldOrdinary Participation Certificates (“CPO’s”), for new CPO’s. As a result, most of the holders of the old series “A”and “B” shares and old CPO’s, received for each one of their titles a new CPO, which represents, the participation intwo new series “A” shares and one new series “B” share of the Company. As a part of the exchange offer, onSeptember 15, 1999, the Company effected a stock split of two series “A” shares and one series “B” share, for eachof the old shares of any series. The proportional equity interest participation of the shareholders in the Company’scommon stock did not change as a result of the exchange offer and the stock split mentioned above.
Earnings per share, prices per share, and the number of shares outstanding disclosed in these notes to the financialstatements for the years ended December 31, 1998 and 1997, as well as the transactions occurred in 1999 prior toSeptember 14, have been restated to give effect the stock split mentioned in the preceding paragraph.
B) REGISTRATION IN THE NEW YORK STOCK EXCHANGE
On September 15, 1999, the Company successfully completed its registration before the United States Securities andExchange Commission (“SEC”) and the listing of the new American Depositary Share (“ADS”) in the New York StockExchange (“NYSE”), as well as the exchange process of the new CPO mentioned in note 2A. On the same date, beganthe trading of the new CPO’s in the Mexican Stock Exchange (“BMV”) and of the new ADS’s in the NYSE under thestock symbol CX. Each new ADS represents 5 new CPO’s. As a result of the registration before the SEC and the listingof the new ADS in the NYSE, beginning in the year 2000, the Company is required to file before the SEC, financialinformation according to the rules established by such Commission, including the annual financial statements withthe reconciliation of stockholders’ equity and net income to Generally Accepted Accounting Principles in the UnitedStates (“US GAAP”).
C) PUBLIC OFFER OF WARRANTS
During December 1999, through a simultaneous public offer in the Mexican Stock Exchange (“BMV”) and the NewYork Stock Exchange (“NYSE”), the Company issued 105 million warrants at a subscription price of $3.2808 pesosper warrant. The warrants allow the holder to benefit from the future increment in the market price of the Company’sCPO above the strike price of U.S. dollars 6.20 per warrant, within certain limits. The benefit, should any exist, willbe paid in CPO’s of the Company. The warrants were issued for a term of three years and their exercise is at maturity.The warrants were subscribed as American Depositary Warrants (“ADW’s”) in the NYSE, each ADW is equivalent to5 warrants.
As part of the same transaction, the Company carried out a hedge transaction in order to cover the future obligationsfor the warrants exercise. Through this transaction, 105 million CPO’s of the Company and 33,751,566 shares ofCompañía Valenciana de Cementos Portland, S.A. (“Valenciana”), subsidiary of the Company in Spain, were sold toa group of foreign banks. Simultaneously, a subsidiary of the Company entered into forward contracts with the samegroup of banks, to repurchase the basket of shares with a three-year maturity and paid in advance of the forward finalprice, approximately U.S. dollars 439.9 million to the banks.
As a result of the overall transaction, the Company received resources for the subscription of the warrants and thesale of the basket of shares for approximately U.S. dollars 490.9 million, after applying the prepayment to the banksunder the forward, fees and other expenses related to this transaction.
3.- SIGNIFICANT ACCOUNTING POLICIESA) BASIS OF PRESENTATION AND DISCLOSURE
The accompanying Parent Company-only financial statements have been prepared in order to comply with legalrequirements in Mexico. The Company also presents consolidated financial statements.
The accompanying financial statements have been prepared in accordance with Generally Accepted AccountingPrinciples in Mexico (“Mexican GAAP”), which include the recognition of the effects of inflation on the financialinformation.

51
For purposes of disclosure, when reference is made to pesos or “$”, it means Mexican pesos, likewise, when referenceis made to dollars or U.S. dollars, it means currency of the United States of America.
When reference is made to “CPO’s”, it is the Ordinary Participation Certificates of the Company, which include twoseries “A” shares and one series “B” share per each CPO. When reference is made to “ADS’s”, it is the “AmericanDepositary Shares” of the Company. Each ADS includes 5 CPO’s.
B) PRESENTATION OF COMPARATIVE FINANCIAL STATEMENTS
In accordance with Bulletin B-15 “Foreign Currency Transactions and Translation of Foreign Currency FinancialStatements”, the inflation restatement factors applied to the financial statements of prior periods were calculatedbased upon a weighted average index, which takes into consideration the inflation rates of the countries in which thesubsidiaries operate, and the fluctuations in the exchange rate of each country vis-a-vis the Mexican peso. Theinflation restatement factors for the Parent Company-only financial statements of prior periods were calculated basedupon the inflation in Mexico.
1999 1998
Inflation restatement factor using weighted average index 1.0011 1.2581Inflation restatement factor for inflation in Mexico 1.1232 1.1861
The inflation restatement adjustments for common stock and additional paid-in capital are determined by using theMexican inflation. The weighted average restatement index was used for all other inflation restatement adjustmentsto stockholders’ equity.
C) PRINCIPLES OF CONSOLIDATION
The consolidated financial statements include those of Cemex and the subsidiary companies in which Cemex holdsa majority interest and/or has control. All significant intercompany balances and transactions have been eliminated inconsolidation.
The main subsidiaries are:
• Cemex México, S. A. de C.V.• Beeston Investments Holdings Limited• Compañía Valenciana de Cementos Portland, S.A.• Corporación Venezolana de Cementos, S.A.C.A.• Cemex USA, Inc.• Cementos Diamante, S.A.• Cemento Bayano, S.A.• Cementos Nacionales, S.A.• Rizal Cement Company, Inc.• APO Cement Corporation• Assiut Cement Company• Cementos del Pacífico, S.A.• Turismo Cemex, S.A. de C.V.
D) ADMINISTRATIVE IMPROVEMENT PROGRAM DURING 1999
During 1999, as part of an administrative improvement program, the Company integrated within the structure of oneentity the cement and concrete operations in Mexico in order to eliminate redundant processes and take advantageof synergies. This administrative process included mergers, as well as sales-purchases of companies within the Group,for which the following actions were taken:
1) Effective July 31, 1999, the Company changed the legal name of Cemex Control, S.A. de C.V. (“Control”) toEmpresas Tolteca de México, S.A. de C.V. (“ETM”).
2) Effective December 31, 1999, a merger took place of most of the cement subsidiaries in Mexico, includingTolmex, S.A. de C.V. (“Tolmex”). The merging entity was Serto Construcciones, S.A. de C.V. (“Serto”),company which before the merger was a direct subsidiary of Tolmex. Likewise, on December 10, 1999, the legalname of Serto was changed to Cemex México, S.A. de C.V. (“Cemex México”).
3) Effective December 31, 1999, a merger took place of most of the concrete subsidiaries in México into one soleentity. The merging entity was Cemex Concretos, S.A. de C.V., before named Concretos de Alta Calidad yAgregados, S.A. de C.V.
52
4) Additionally, on December 15, 1999, through a sale and purchase of shares within the Group, ETM became adirect subsidiary of Cemex Mexico.
Through these mergers and the sale of ETM (see note 23), starting the year 2000, the cement and concrete operationsof the Company in Mexico are integrated in Cemex Mexico and subsidiaries.
E) FOREIGN CURRENCY TRANSACTIONS AND TRANSLATION OF FOREIGN CURRENCY FINANCIAL STATEMENTS
Transactions denominated in foreign currencies are recorded at the exchange rates prevalent on the dates of theirexecution or liquidation. Monetary assets and liabilities denominated in foreign currencies are adjusted into pesos atthe exchange rates prevailing at the balance sheet date. The resulting foreign exchange fluctuations are reflected in theresults of operations as part of the comprehensive financing income (cost) or as a charge directly to the stockholders’equity when the indebtedness is directly related to the acquisition of a foreign subsidiary.
The financial statements of consolidated foreign subsidiaries are restated for inflation in their functional currency basedon the subsidiary country’s inflation rate and subsequently translated to Mexican pesos by using the foreign exchangerate at the end of the corresponding reporting period for balance sheet and income statement accounts.
The exchange rate of the Mexican peso against the U.S. dollar used by the Company is based upon the weightedaverage of free market rates available to settle its overall foreign currency transactions.
F) CASH AND TEMPORARY INVESTMENTS
Cash and temporary investments include fixed-income marketable securities investments with original maturities ofthree months or less. Investments in marketable securities are stated at market value. Gains or losses resulting fromchanges in market values and the effects of inflation are included in the accompanying statements of income as partof the comprehensive financing income or cost.
G) INVENTORIES AND COST OF SALES (note 5)
Inventories are stated at the lower of replacement cost or market value. Replacement cost is based upon the latestpurchase price or production cost. The cost of sales reflects replacement cost of inventories at the time of sale,expressed in constant pesos as of the date of the latest balance sheet.
H) INVESTMENTS AND NON CURRENT RECEIVABLES (note 7)
In the consolidated financial statements, investments in affiliated companies in which the Company holds between10% and 50% of the issuer’s capital stock are accounted for by the equity method. Under the equity method, theinvestments are stated at cost, adjusted for the Company’s equity in the investee’s earnings after acquisition and theeffects of inflation on the investee’s equity.
Investments available for sale for which the Company has no intention to sell in the short-term are carried at marketvalue, and its valuation effects are recognized in the stockholders’ equity. The application of the accumulated effect tothe income statement will occur at the moment of sale.
I) PROPERTY, MACHINERY AND EQUIPMENT (note 8)
Property, machinery and equipment are restated for inflation in accordance with the fifth amendment to Bulletin B-10,by using the inflation index of the country of origin of the assets and the change in the foreign exchange rate betweenthe country of origin and the functional currency.
Net comprehensive financing cost incurred during the construction or installation period of fixed asset additions iscapitalized, as part of the value of the assets.
Depreciation of property, machinery and equipment is provided on the straight-line method over the estimated usefullives of the assets less salvage value. The useful lives of the assets are as follows:
YEARS
Administrative buildings 50Industrial buildings, machinery and equipment 10 to 35
The Company continuously evaluates the physical state and performance of its machinery and equipment, as well asthe impact of its sales and production forecasts, in order to determine if there are judgement elements indicating thatthe book value of these assets needs to be adjusted for impairment. An impairment loss would be recorded in theincome statement of the period if such determination is made (see note 8).
J) DEFERRED CHARGES AND AMORTIZATION (note 9)
Deferred charges are adjusted to reflect current values. Amortization of deferred charges is determined using thestraight-line method based on the current value of the assets.
Amortization of the excess of cost over book value of subsidiaries acquired (goodwill) is determined under the presentworth or sinking fund method, which intends a better matching of the amortization of goodwill with the revenuesgenerated from the acquired affiliated companies. The amortization periods are as follows:
YEARS
Goodwill from years before 1992 40Goodwill generated starting January 1, 1992 20

53
At each balance sheet date, the Company evaluates the recoverability of goodwill based on an evaluation of factorssuch as the occurrence of a significant adverse event, change in the environment in which the business operates andexpectations of operating results for each subsidiary, this to determine if there are judgement elements to believe thatthe goodwill balance would not be recovered. An impairment loss would be recorded in the period if suchdetermination is made.
Deferred financing costs originated from our financing operations are amortized over the term in which the relatedtransactions are outstanding, in proportion to their maturity dates. These costs include the expenses incurred for feespaid to lawyers, printers and consultants, as well as commissions paid to banks in the credit approval process.Deferred financing costs are adjusted to reflect current values.
K) PENSION PLANS AND SENIORITY PREMIUM (note 13)
Pension benefits and accumulated seniority premium rights to which employees are legally entitled are recognized inthe results of operations on the basis of the present value of the benefit determined under actuarial estimations. Theamortization of unrecognized prior service cost is based on the personnel’s estimated active service life. As ofDecember 31, 1999, the estimated active service life of the employee’s under plan’s benefit is approximately 22 years.
Some subsidiaries have established pension plans supplementary to the benefits provided by law. The obligationsunder these plans are determined based on actuarial calculations and, in some cases, certain irrevocable trust fundshave been established for these plans. The actuarial assumptions utilized in these calculations are based upon “real”rates (nominal rates reduced by inflation).
Other benefits to which employees may be entitled are recognized as an expense in the year in which they are paid.These benefits consist principally of severance benefits and vacation.
L) INCOME TAX AND EMPLOYEES’ STATUTORY PROFIT SHARING (note 16)
Income Tax and Employees’ Statutory Profit Sharing expense recognize the amounts incurred, and the effects ofmaterial timing differences between tax and book income on which it may be reasonably estimated that, over adefined period, a benefit or liability will arise.
M) MONETARY POSITION GAIN OR LOSS
The monetary position gain or loss is calculated by applying the inflation rate of each country in which the Companyhas operations to the average net monetary assets or liabilities in that country.
N) DEFICIT IN EQUITY RESTATEMENT
The deficit in equity restatement includes the accumulated effect from holding non-monetary assets as well as theeffects of translation of financial statements of foreign subsidiaries.
O) DERIVATIVE FINANCIAL INSTRUMENTS (note 15)
The Company uses derivative financial instruments such as interest rate swaps, forward contracts, options and futurecontracts in order to reduce its exposure to market risks from changes in interest rates, foreign exchange rates, theprice of the Company’s shares and the price of energy. Some financial instruments have been designated as hedgesof the Company’s costs, debt or equity and their economic effects are recognized as part of the cost of sales,comprehensive financing income (cost) or in stockholders’ equity, according to their designation. Premiums paid orreceived on derivative instruments, are deferred and amortized to the income statement or stockholders’ equity,depending on their destination, over the life of the underlying hedge instrument or immediately when they aresettled.
Equity derivatives on our own common stock are accounted for as equity instruments and gains and losses arerecognized as an adjustment to stockholders’ equity. At maturity, these contracts provide for physical or net cashsettlement at the Company’s option.
Currency forward instruments that have been designated as, and are effective as, a hedge of the Company’s netinvestments in foreign subsidiaries are recorded at their estimate fair value in the balance sheet. The realized orunrealized gains or losses are recognized in stockholders’ equity as part of the foreign currency translation gain orloss.
The results of derivative instruments contracted as a hedge of interest rates are accounted for as part of the effectiveinterest rate of the related debt within the financial expense. At settlement, the results are deferred and recognizedover the shorter term of the remaining contractual life of the derivative instrument or the remaining life of the liabilityas an adjustment to interest expense.
P) REVENUE RECOGNITION
Revenue is recorded upon shipment of the cement and ready-mix concrete to customers.
Q) USE OF ESTIMATES
The preparation of financial statements in conformity with generally accepted accounting principles requiresmanagement to make estimates and assumptions that affect reported amounts of assets and liabilities at the date ofthe financial statements and the reported amounts of revenues and expenses during the reported period. Actualresults could differ from these estimates.
R) RECLASSIFICATIONS
Certain amounts reported in the notes to the consolidated financial statements as of December 31, 1998 and 1997,have been reclassified to conform to the 1999 presentation.
54
4.- OTHER RECEIVABLESOther current receivables consist of:
1999 1998
CONSOLIDATED PARENT CONSOLIDATED PARENT
Non-trade receivables $ 1,537,471 20,985 1,284,647 13,029Refundable income tax 388,226 — 635,239 591,321Other refundable taxes 309,795 — 170,571 28,308
$ 2,235,492 20,985 2,090,457 632,658
As of December 31, 1999 and 1998, non trade receivables consisted primarily of interest receivable, notes receivable,advances to employees for travel expenses, loans made to employees and receivable from the sale of assets.
5.- INVENTORIESInventories are summarized as follows:
CONSOLIDATED
1999 1998
Finished goods $ 744,626 998,663Work-in-process 586,471 485,695Raw materials 514,152 509,160Supplies and spare parts 2,754,377 1,988,828Advances to suppliers 418,411 170,409Inventory in transit 117,815 31,087Real estate held for sale 148,570 189,117
$ 5,284,422 4,372,959
As of December 31, 1999 and 1998, real estate held for sale corresponds to undeveloped land in different touristlocations in Mexico, originally acquired by the Company for future tourism projects. Currently, this real estate is heldfor sale in the short-term. In accordance to the Fifth Amendment to Bulletin B-10, until December 31, 1996,independent appraisers determined the amounts, which represented their estimated realizable value. Beginning in1997, such amounts have been restated using the inflation factors arising from the NCPI.
6.- OTHER CURRENT ASSETSOther current assets include $128,774 and $473,330, as of December 31, 1999 and 1998, respectively, of non-cementrelated assets which are intended to be sold in the short-term, and that are stated at their estimated realizable value.These assets include securities and assets for lines of business other than the Company’s, which are mainly originatedfrom (i) non-cement related assets acquired in the acquisition of our international subsidiaries, and (ii) assets held forsale including land and buildings received from customers as payment of trade receivables.
As of December 31, 1998, within non-cement related assets acquired as part of the acquisition of subsidiaries, wereincluded approximately $420.8 million for an uncompleted real estate project in Spain. During 1999, the Companysold part of this asset in Spain, recording a net result of approximately $(160) million in the caption Other Expenses,net. Additionally, as of December 31, 1999, the Company recognized an impairment allowance related to this assetfor approximately $37.5 million in the income statement. The fair value of the remaining non-cement assets in Spainas of December 31, 1999 is approximately $28.5 million and was reclassified to fixed assets.
7.- INVESTMENTS AND NON CURRENT RECEIVABLESInvestments in shares of subsidiaries and affiliated companies are accounted for by the equity method, whichconsiders the results of operation and the stockholders’ equity of the investee’s. Investment in subsidiaries andaffiliated companies are summarized as follows:
1999 1998
CONSOLIDATED PARENT CONSOLIDATED PARENT
Contribution or book value at acquisition date $ 4,261,284 27,910,116 2,464,092 35,015,884
Equity in income and other changes in stockholders’ equity of subsidiaries and affiliated companies 1,584,953 16,537,758 1,345,812 35,977,045
$ 5,846,237 44,447,874 3,809,904 70,992,929
55
Investment held by subsidiaries in the Parent Company amounting to $6,051,455 (113,625,709 CPO’s and 3,663,615warrants) and $4,280,151 (171,064,911 CPO’s) as of December 31, 1999 and 1998, respectively, are offset againstmajority interest stockholders’ equity in the accompanying financial statements. As part of the hedge transactioncarried out by the Company during 1999 (see notes 2C and 15(d)), a total of 105 million CPO’s held by subsidiariesin the Parent Company were sold.
a) On November 22, 1999, the Company acquired from the Egyptian government 77% equity interest in AssiutCement, Co. (“Assiut”), the largest cement-producing company in Egypt for US dollars 318.8 million ($3,031.8million). Additionally, the Company has an option until June 30, 2000 to acquire an additional 13% for anapproximate amount of US dollars 53.8 million. As of December 31, 1999, the consolidated financial statementsof the Company include the balance sheet of Assiut with figures as of November 30, 1999, and the results ofthe one-month period ended November 30, 1999.
b) During 1999, the Company entered into capitalization and subscription of shares agreements with institutionalinvestors in Asia, represented by AIG Asian Infrastructure Fund II, L.P. and GIC Special Investments Pte Ltd., toco-invest in Cemex Asia Holdings Ltd. (“CAH”), subsidiary of the Company created to make cementinvestments in Asia. Based on the agreements, on September 30, 1999, the investors in Asia contributed capitalto CAH for approximately US dollars 87 million, and the Company, through subsidiaries, contributed to CAHits direct participation and its economic benefits in Rizal Cement and APO Cement, subsidiaries in thePhilippines. As a result of this transaction, on September 30, 1999, the direct participation and economicbenefits of the Company in Rizal and APO decreased to 60% and 86%, respectively. Due to this transaction, aminority interest increase in the consolidated stockholders’ equity was reflected.
c) On September 21, 1999, the Company successfully completed a tender offer for the acquisition of the CostaRican cement producer, Cementos del Pacífico, S.A. (“Cempasa”). Through this transaction, a subsidiary of theCompany acquired an additional 79.5% of the shares outstanding of Cempasa for approximately US dollars 72million ($685 million), increasing the equity interest of the Company in Cempasa to 95.3%. As of December 31,1999, the consolidated financial statements of the Company, include the balance sheet of Cempasa with figuresas of December 31, 1999, and the results for the three-month period ended December 31, 1999.
d) In June 1999, the Company acquired 11.92% equity interest in Cementos Bio Bio, S.A., the largest cementproducer of Chile. The total of this transaction amounted to approximately US dollars 34 million. As ofDecember 31, 1999, the investment in Cementos Bio Bio was accounted for under the equity method ofaccounting, and is included in the investments in affiliated companies’ caption for $294,126.
e) In February 1999, a subsidiary of the company acquired 99.9% interest in the economic benefits of APO CementCorporation (“APO”), a Philippine cement producer, for approximately US dollars $400 million. As of December31, 1999, the consolidated financial statements of the Company include the balance sheet and results of APOfor the year ended December 31, 1999.
f) Through transactions carried out in 1999 and 1998 for approximately US dollars 126 and 114.6 million,respectively, a subsidiary of the Company acquired 25.53% of the common stock of PT Semen Gresik (Persero),Tbk. (“Gresik”), an Indonesian company with several cement plants. As of December 31, 1999, the investmentin Gresik was included in the consolidated financial statements under the equity method of accounting, and isincluded in the investments in affiliated companies’ caption for $2,715,781. As of December 31, 1998, theinvestment in Gresik was accounted under the cost method of accounting and totals $1,169,446. Under theterms of the Company’s agreement, entered into with the Indonesian government in connection with ourinvestment in Gresik, the Indonesian government has an option until October 2001 to require the Company topurchase its 51% interest in Gresik for a purchase price of approximately US dollars 418 million ($3,975 million),plus accrued interests since October 1998 at 8.2% per annum.
g) In December 1998, through a public offering, the Company acquired an additional 21.96% of the sharesrepresentative of the capital stock of its Colombian subsidiary. Through this acquisition, the Company’sinvestment in this subsidiary increased from a 68.7% to 90.7%. This transaction amounted to approximately USdollars 47.3 million.
h) In November 1998, a subsidiary of the Company increased its equity interest in Rizal Cement, Inc. (“Rizal”), aPhilippine cement producer to 40%, for an approximate amount of US dollars 130 million. Likewise, as part ofthis transaction, a Philippine investor, through the subscription of a special series of shares, purchased anadditional 30% of Rizal. The Philippine investor and Cemex formed an alliance that grants the Company controlof the operations not reserved for nationals, and the administration of Rizal. Through these transactions, theCompany has 70% of the economic benefits of Rizal. As of December 31, 1999, the consolidated financialstatements include the balance sheet and results of Rizal for the year 1999. As of December 31, 1998, theinvestment in Rizal was accounted for by the purchase method of accounting and the accounts of Rizal areincluded in the Company’s consolidated financial statements based upon Rizal’s November 30, 1998 amounts.

56
Certain condensed financial information of the balance sheets and income statements of the acquired companiesduring 1999, for the periods mentioned above, are presented below:
a) ASSIUT c) CEMPASA e) APO
Total assets $ 4,071,075 636,775 3,583,730Total liabilities 2,712,115 254,312 1,180,891Stockholders’ equity 1,358,960 382,463 2,402,839Net sales $ 137,686 91,195 617,044Operating income 15,392 20,099 111,070Net (loss) income (7,200) (17,728) 73,217
8.- PROPERTY, MACHINERY AND EQUIPMENTDuring 1999, through the analysis of the economic and market conditions prevailing in the countries where theCompany operates, the marketing plans, as well as the future production needs, the Company decided to fully stopoperations in 4 operating cement assets located in Mexico and Colombia, as well as the partial closing of other 4operating cement assets located in the same countries, this in order to avoid a production overload. Based on thisanalysis, the Company estimated that the expected future cash flows to be generated by such assets would not besufficient to recover their book value.
As a result of the above and according to the guidelines established in Bulletin C-6 “Property, Machinery andEquipment”, during 1999, the Company determined an impairment provision of approximately US dollars 63.1 million($600.1 million), which is reflected in the consolidated income statement under the caption Other Expenses, net. Asof December 31, 1999, the assets subject to impairment described above are valued at their estimated realizable value,net from the expenses estimated for their disposal and, their depreciation has been suspended. The remaining bookvalue of these assets is approximately $313 million and it is the Company’s intention to dispose of those that werecompletely closed. The impact of having suspended depreciation of these assets on the 1999 results wasapproximately $30.2 million.
The Company continues with the assesment process of its subsidiaries’ fixed assets, therefore, the possibility of futureprovisions for impairment of assets exists, additional to those recognized in 1999.
In 1998, the Company sold a cement plant of its Spanish subsidiary and its related assets for approximately US dollars260 million ($2,577 million), resulting in a gain in the consolidated income statement of approximately $325.5million. The sale included the ready-mix concrete, mortar and aggregates operations related to that plant.
9.- DEFERRED CHARGESDeferred charges are summarized as follows:
1999 1998
CONSOLIDATED PARENT CONSOLIDATED PARENT
Excess of cost over book value of subsidiaries and affiliated companies acquired $ 24,341,809 3,670,942 23,032,628 1,832,167
Terminal installation costs and other intangibles 59,125 — 45,890 —
Deferred financing costs 532,666 365,448 415,753 383,375Others 3,434,052 1,274,666 2,936,326 1,111,560Accumulated amortization (5,096,870) (1,025,781) (4,230,191) (1,090,319)
$ 23,270,782 4,285,275 22,200,406 2,236,783
As of December 31, 1999, as a result of the acquisitions made by the Company during 1999 (see note 7), goodwillincreased approximately US dollars 249 million ($2,368 million), in relation to the prior year.
10.- SHORT-TERM BANK LOANS AND NOTES PAYABLE Short-term debt is summarized by currency as of December 31, 1999 and 1998, as follows:
CONSOLIDATED
1999 RATE 1998 RATE
US Dollars $ 7,823,221 5.4% - 10.8% 10,238,479 5.8% - 10.0%Euros 882,465 3.5% - 4.1% — —Egyptian Pounds 674,049 10.5% — —Philippine Pesos 226,710 13.0% - 15.7% 196,334 16.8%Spanish Pesetas 183,782 3.8% 381,717 3.9% - 5.8%Colombian Pesos 5,438 19.8% 143,845 19.8%
$ 9,795,665 10,960,375
A total of 98% of the short-term debt of the Parent Company is denominated in US dollars in 1999 and 1998.

57
11.- LONG-TERM BANK LOANS AND NOTES PAYABLE The consolidated long-term debt is summarized as follows:
1999 RATE 1998 RATE
A) Bank Loans1. Syndicated loans denominated in
foreign currency, due from 2000to 2006 $ 13,453,507 4.1% - 9.5% 9,507,040 6.1% - 8.2%
2. Bank loans denominated in foreign currency, due from 2000 to 2007 4,786,905 3.5% - 15.7% 5,314,328 3.9% - 19.8%
3. Revolving line of credit in foreign currency, due from 2001 to 2002 3,804,000 7.1% 4,856,337 6.6%
22,044,412 19,677,705B) Notes Payable
4. Euro medium-term Notes Programmedenominated in foreign currency, due from 2000 to 2006 14,118,718 8.5% - 12.8% 13,029,409 8.5% - 12.8%
5. Commercial paper denominated in foreign currency with revolving maturities every one or two years 1,588,170 7.3% 1,922,713 5.3% - 7.7%
6. Yankee Notes, due in 2003 782,673 8.4% 1,735,989 8.4%7. Other notes denominated in
foreign currency, due from 2000 to 2009 809,379 7.1% - 8.9% 894,709 6.7% - 9.8%
17,298,940 17,582,82039,343,352 37,260,525
Current maturities (7,575,154) (6,177,195)$ 31,768,198 31,083,330
1. Syndicated loans denominated in foreign currency had a weighted average floating interest rate of 6.2% in 1999and 6.8% in 1998. These loans had a weighted average spread based on LIBOR of 98 basis points in 1999 and132 in 1998.
2. Bank loans denominated in foreign currency, of which 48% in 1999 and 93% in 1998 were floating rate with aweighted average interest rate of 5.4% in 1999 and 6.5% in 1998. These loans had a weighted average spreadbased on LIBOR of 45 basis points in 1999 and 122 in 1998.
3. Revolving line of credit in foreign currency with an average floating rate of 7.1% in 1999 and 6.6% in 1998. Theseloans had a spread based on LIBOR of 125 basis points.
4. Euro medium-term Notes Programme denominated in foreign currency with a weighted average fixed rate of10.3% in 1999 and 10.5% in 1998.
5. Commercial paper denominated in foreign currency with revolving maturities every one or two years with aweighted average floating interest rate of 7.3% in 1999 and 6.0% in 1998. These loans had a spread based onLIBOR of 116 basis points in 1999 and 73 in 1998.
6. Yankee Notes had a fixed rate of 8.375% in 1999 and 1998.
7. Other notes denominated in foreign currency of which $124,170 and $412,057 were floating rate with aweighted average interest rate of 5.9% and 6.9% in 1999 and 1998, respectively. These loans had a weightedaverage spread based on LIBOR of 16 basis points in 1999 and 162 in 1998. The remaining $685,209 in 1999and $482,652 in 1998 were fixed rate with a weighted average interest rate of 6.4% and 8.9% in 1999 and 1998,respectively.
Long-term debt is summarized by currency as of December 31, 1999 and 1998 as follows:
CONSOLIDATED
1999 1998
US Dollars $ 25,119,131 30,219,953Euros 4,354,799 —Egyptian pounds 1,560,124 —Philippine Pesos 197,409 137,837Spanish Pesetas 498,006 668,085Colombian Pesos 38,729 13,599Venezuela Bolivars — 43,856
$ 31,768,198 31,083,330
A total of 99% of the long-term debt of the Parent Company is denominated in US dollars in 1999 and 1998.
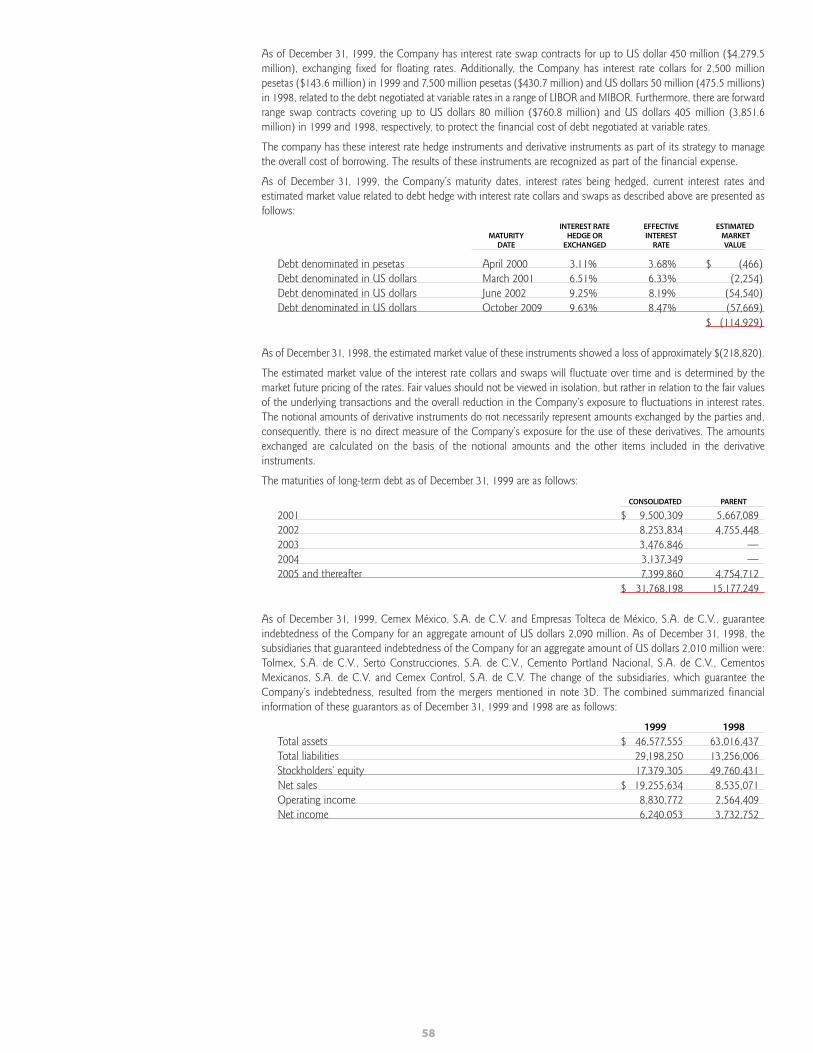
58
As of December 31, 1999, the Company has interest rate swap contracts for up to US dollar 450 million ($4,279.5million), exchanging fixed for floating rates. Additionally, the Company has interest rate collars for 2,500 millionpesetas ($143.6 million) in 1999 and 7,500 million pesetas ($430.7 million) and US dollars 50 million (475.5 millions)in 1998, related to the debt negotiated at variable rates in a range of LIBOR and MIBOR. Furthermore, there are forwardrange swap contracts covering up to US dollars 80 million ($760.8 million) and US dollars 405 million (3,851.6million) in 1999 and 1998, respectively, to protect the financial cost of debt negotiated at variable rates.
The company has these interest rate hedge instruments and derivative instruments as part of its strategy to managethe overall cost of borrowing. The results of these instruments are recognized as part of the financial expense.
As of December 31, 1999, the Company’s maturity dates, interest rates being hedged, current interest rates andestimated market value related to debt hedge with interest rate collars and swaps as described above are presented asfollows:
INTEREST RATE EFFECTIVE ESTIMATEDMATURITY HEDGE OR INTEREST MARKET
DATE EXCHANGED RATE VALUE
Debt denominated in pesetas April 2000 3.11% 3.68% $ (466)Debt denominated in US dollars March 2001 6.51% 6.33% (2,254)Debt denominated in US dollars June 2002 9.25% 8.19% (54,540)Debt denominated in US dollars October 2009 9.63% 8.47% (57,669)
$ (114,929)
As of December 31, 1998, the estimated market value of these instruments showed a loss of approximately $(218,820).
The estimated market value of the interest rate collars and swaps will fluctuate over time and is determined by themarket future pricing of the rates. Fair values should not be viewed in isolation, but rather in relation to the fair valuesof the underlying transactions and the overall reduction in the Company’s exposure to fluctuations in interest rates.The notional amounts of derivative instruments do not necessarily represent amounts exchanged by the parties and,consequently, there is no direct measure of the Company’s exposure for the use of these derivatives. The amountsexchanged are calculated on the basis of the notional amounts and the other items included in the derivativeinstruments.
The maturities of long-term debt as of December 31, 1999 are as follows:
CONSOLIDATED PARENT
2001 $ 9,500,309 5,667,0892002 8,253,834 4,755,4482003 3,476,846 —2004 3,137,349 —2005 and thereafter 7,399,860 4,754,712
$ 31,768,198 15,177,249
As of December 31, 1999, Cemex México, S.A. de C.V. and Empresas Tolteca de México, S.A. de C.V., guaranteeindebtedness of the Company for an aggregate amount of US dollars 2,090 million. As of December 31, 1998, thesubsidiaries that guaranteed indebtedness of the Company for an aggregate amount of US dollars 2,010 million were:Tolmex, S.A. de C.V., Serto Construcciones, S.A. de C.V., Cemento Portland Nacional, S.A. de C.V., CementosMexicanos, S.A. de C.V. and Cemex Control, S.A. de C.V. The change of the subsidiaries, which guarantee theCompany’s indebtedness, resulted from the mergers mentioned in note 3D. The combined summarized financialinformation of these guarantors as of December 31, 1999 and 1998 are as follows:
1999 1998
Total assets $ 46,577,555 63,016,437Total liabilities 29,198,250 13,256,006Stockholders’ equity 17,379,305 49,760,431Net sales $ 19,255,634 8,535,071Operating income 8,830,772 2,564,409Net income 6,240,053 3,732,752

59
As of December 31, 1999, the Company and its subsidiaries have the following lines of credit, both committed andsubject to the bank’s availability, at annual interest rates ranging from 5.4% to 12.8%, in accordance with thenegotiated currency:
LINE OF CREDIT AVAILABLE
Euro medium-term Notes (US dollars 1,250 million) $ 11,887,500 8,180,312European commercial paper (US dollars 600 million) 5,706,000 4,117,830US commercial paper (US dollars 250 million) 2,377,500 2,377,500Current line of credit (US dollars 250 million) 2,377,500 2,377,500Lines of credit of foreign subsidiaries 5,450,086 3,603,728Other lines of credit from Mexican banks 5,376,839 4,503,688Other lines of credit from foreign banks 4,203,831 2,292,348
$ 37,379,256 27,452,906
At December 31, 1999 and 1998 in the consolidated balance sheets there are current liabilities amounting to US dollars226 and 168 million, respectively, classified as long-term debt due to the ability and intention of the Company torefinance such indebtedness with the available amounts of the long-term lines of credit.
As of December 31, 1999, the Company established deposits in trusts amounting to US dollars 120 million ($1,141.2million), such deposits are committed to the repayment of short-term and long-term debt, US dollars 30 million inshort-term and US dollars 90 million in long-term, to repay part of the Yankee Bond’ purchase offer (see note 23).These deposits have been offset for presentation purposes.
Certain credit agreements are guaranteed by the Company and/or some of its subsidiaries and contain restrictivecovenants that limit the sale of assets, maintain control of the shares of certain subsidiaries, establish liens and requirethe Company to comply with certain financial ratios. When a default event has occurred, the Company has obtainedthe respective waivers.
12.- BALANCES AND TRANSACTIONS WITH RELATED PARTIESThe most important balances receivable and payable from and to affiliated companies as of December 31, 1999 and1998 are the following:
PARENT COMPANY 1999
ASSETS LIABILITIES
SHORT-TERM LONG-TERM SHORT-TERM
Cemex México, S.A. de C.V. $ 87,603 22,564,025 —Centro Distribuidor de Cemento, S.A. de C.V. 417,219 — —Aviación Comercial de América, S.A. de C.V. 97,573 — —Sunbelt Trading, S.A. 40,244 — —Cemex Concretos, S.A. de C.V. 27,413 — —Empresas Tolteca de México, S.A. de C.V. 3,444 — —Proambiente, S.A. de C.V. 795 — —Petrocemex, S.A. de C.V. — — 2,872,090Beeston Investments Holdings Limited — — 76,755Cemex Central, S.A. de C.V. — — 22,451Productora de Bolsas de Papel, S.A. de C.V. — — 232Others 184 — 60
$ 674,475 22,564,025 2,971,588
PARENT COMPANY 1998
ASSETS LIABILITIES
SHORT-TERM LONG-TERM SHORT-TERM
Sunbelt Enterprises $ — 1,094,801 1,212,920Centro Distribuidor de Cemento, S.A. de C.V. 922,092 — —Cemex Control, S.A. de C.V. 402,818 — —Badenoch Corporation 128,366 — —Aviación Comercial de América, S.A. de C.V. 105,962 — —Concretos de Alta Calidad y Agregados, S.A. de C.V 32,197 — —Concreto y Precolados, S.A. 17,118 — —Cementos Mexicanos, S.A. de C.V. 1,790 — —Proambiente, S.A. de C.V. 1,274 — —Cemex México, S.A. de C.V. — — 9,960,339Petrocemex, S.A. de C.V. — — 71,534Productora de Bolsas de Papel, S.A. de C.V. — — 16,927Others 761 — 269
$ 1,612,378 1,094,801 11,261,989
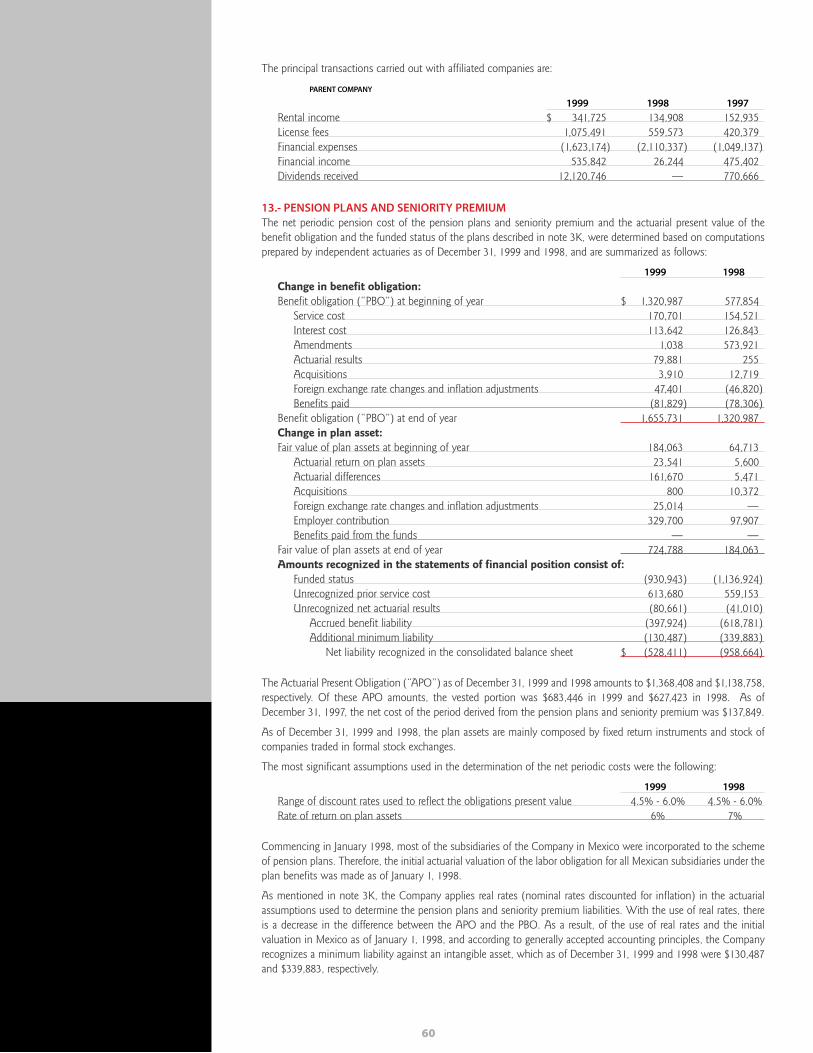
60
The principal transactions carried out with affiliated companies are:
PARENT COMPANY
1999 1998 1997
Rental income $ 341,725 134,908 152,935License fees 1,075,491 559,573 420,379Financial expenses (1,623,174) (2,110,337) (1,049,137)Financial income 535,842 26,244 475,402Dividends received 12,120,746 — 770,666
13.- PENSION PLANS AND SENIORITY PREMIUMThe net periodic pension cost of the pension plans and seniority premium and the actuarial present value of thebenefit obligation and the funded status of the plans described in note 3K, were determined based on computationsprepared by independent actuaries as of December 31, 1999 and 1998, and are summarized as follows:
1999 1998
Change in benefit obligation:Benefit obligation (“PBO”) at beginning of year $ 1,320,987 577,854
Service cost 170,701 154,521Interest cost 113,642 126,843Amendments 1,038 573,921Actuarial results 79,881 255Acquisitions 3,910 12,719Foreign exchange rate changes and inflation adjustments 47,401 (46,820)Benefits paid (81,829) (78,306)
Benefit obligation (“PBO”) at end of year 1,655,731 1,320,987Change in plan asset:Fair value of plan assets at beginning of year 184,063 64,713
Actuarial return on plan assets 23,541 5,600Actuarial differences 161,670 5,471Acquisitions 800 10,372Foreign exchange rate changes and inflation adjustments 25,014 —Employer contribution 329,700 97,907Benefits paid from the funds — —
Fair value of plan assets at end of year 724,788 184,063Amounts recognized in the statements of financial position consist of:
Funded status (930,943) (1,136,924)Unrecognized prior service cost 613,680 559,153Unrecognized net actuarial results (80,661) (41,010)
Accrued benefit liability (397,924) (618,781)Additional minimum liability (130,487) (339,883)
Net liability recognized in the consolidated balance sheet $ (528,411) (958,664)
The Actuarial Present Obligation (“APO”) as of December 31, 1999 and 1998 amounts to $1,368,408 and $1,138,758,respectively. Of these APO amounts, the vested portion was $683,446 in 1999 and $627,423 in 1998. As ofDecember 31, 1997, the net cost of the period derived from the pension plans and seniority premium was $137,849.
As of December 31, 1999 and 1998, the plan assets are mainly composed by fixed return instruments and stock ofcompanies traded in formal stock exchanges.
The most significant assumptions used in the determination of the net periodic costs were the following:
1999 1998
Range of discount rates used to reflect the obligations present value 4.5% - 6.0% 4.5% - 6.0%Rate of return on plan assets 6% 7%
Commencing in January 1998, most of the subsidiaries of the Company in Mexico were incorporated to the schemeof pension plans. Therefore, the initial actuarial valuation of the labor obligation for all Mexican subsidiaries under theplan benefits was made as of January 1, 1998.
As mentioned in note 3K, the Company applies real rates (nominal rates discounted for inflation) in the actuarialassumptions used to determine the pension plans and seniority premium liabilities. With the use of real rates, thereis a decrease in the difference between the APO and the PBO. As a result, of the use of real rates and the initialvaluation in Mexico as of January 1, 1998, and according to generally accepted accounting principles, the Companyrecognizes a minimum liability against an intangible asset, which as of December 31, 1999 and 1998 were $130,487and $339,883, respectively.
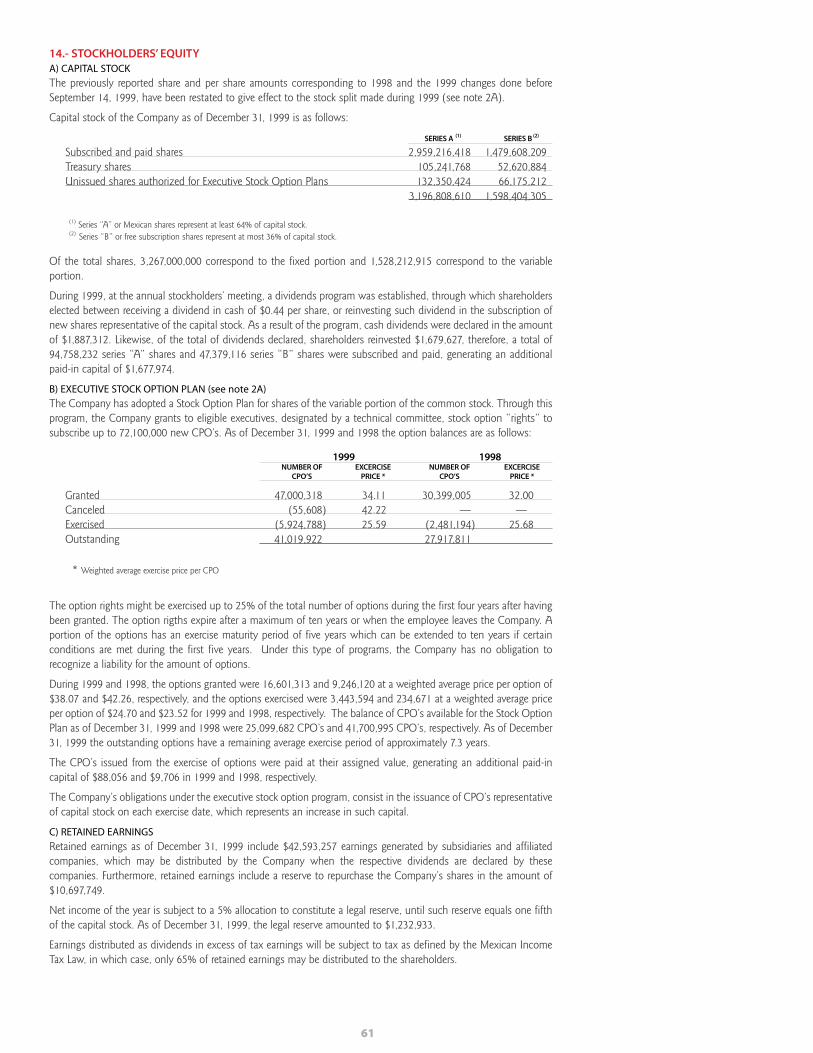
61
14.- STOCKHOLDERS’ EQUITYA) CAPITAL STOCK
The previously reported share and per share amounts corresponding to 1998 and the 1999 changes done beforeSeptember 14, 1999, have been restated to give effect to the stock split made during 1999 (see note 2A).
Capital stock of the Company as of December 31, 1999 is as follows:
SERIES A (1) SERIES B (2)
Subscribed and paid shares 2,959,216,418 1,479,608,209Treasury shares 105,241,768 52,620,884Unissued shares authorized for Executive Stock Option Plans 132,350,424 66,175,212
3,196,808,610 1,598,404,305
(1) Series “A” or Mexican shares represent at least 64% of capital stock.(2) Series “B” or free subscription shares represent at most 36% of capital stock.
Of the total shares, 3,267,000,000 correspond to the fixed portion and 1,528,212,915 correspond to the variableportion.
During 1999, at the annual stockholders’ meeting, a dividends program was established, through which shareholderselected between receiving a dividend in cash of $0.44 per share, or reinvesting such dividend in the subscription ofnew shares representative of the capital stock. As a result of the program, cash dividends were declared in the amountof $1,887,312. Likewise, of the total of dividends declared, shareholders reinvested $1,679,627, therefore, a total of94,758,232 series “A” shares and 47,379,116 series “B” shares were subscribed and paid, generating an additionalpaid-in capital of $1,677,974.
B) EXECUTIVE STOCK OPTION PLAN (see note 2A)
The Company has adopted a Stock Option Plan for shares of the variable portion of the common stock. Through thisprogram, the Company grants to eligible executives, designated by a technical committee, stock option “rights” tosubscribe up to 72,100,000 new CPO’s. As of December 31, 1999 and 1998 the option balances are as follows:
1999 1998NUMBER OF EXCERCISE NUMBER OF EXCERCISE
CPO’S PRICE * CPO’S PRICE *
Granted 47,000,318 34.11 30,399,005 32.00Canceled (55,608) 42.22 — —Exercised (5,924,788) 25.59 (2,481,194) 25.68Outstanding 41,019,922 27,917,811
* Weighted average exercise price per CPO
The option rights might be exercised up to 25% of the total number of options during the first four years after havingbeen granted. The option rigths expire after a maximum of ten years or when the employee leaves the Company. Aportion of the options has an exercise maturity period of five years which can be extended to ten years if certainconditions are met during the first five years. Under this type of programs, the Company has no obligation torecognize a liability for the amount of options.
During 1999 and 1998, the options granted were 16,601,313 and 9,246,120 at a weighted average price per option of$38.07 and $42.26, respectively, and the options exercised were 3,443,594 and 234,671 at a weighted average priceper option of $24.70 and $23.52 for 1999 and 1998, respectively. The balance of CPO’s available for the Stock OptionPlan as of December 31, 1999 and 1998 were 25,099,682 CPO’s and 41,700,995 CPO’s, respectively. As of December31, 1999 the outstanding options have a remaining average exercise period of approximately 7.3 years.
The CPO’s issued from the exercise of options were paid at their assigned value, generating an additional paid-incapital of $88,056 and $9,706 in 1999 and 1998, respectively.
The Company’s obligations under the executive stock option program, consist in the issuance of CPO’s representativeof capital stock on each exercise date, which represents an increase in such capital.
C) RETAINED EARNINGS
Retained earnings as of December 31, 1999 include $42,593,257 earnings generated by subsidiaries and affiliatedcompanies, which may be distributed by the Company when the respective dividends are declared by thesecompanies. Furthermore, retained earnings include a reserve to repurchase the Company’s shares in the amount of$10,697,749.
Net income of the year is subject to a 5% allocation to constitute a legal reserve, until such reserve equals one fifthof the capital stock. As of December 31, 1999, the legal reserve amounted to $1,232,933.
Earnings distributed as dividends in excess of tax earnings will be subject to tax as defined by the Mexican IncomeTax Law, in which case, only 65% of retained earnings may be distributed to the shareholders.

62
D) EFFECTS OF INFLATION
The effects of inflation on the majority interest stockholders’ equity as of December 31, 1999 are summarized asfollows:
HISTORICAL INFLATIONCOST ADJUSTMENT TOTAL
Common stock $ 49,312 2,737,610 2,786,922Additional paid-in capital 9,255,558 9,480,277 18,735,835Deficit in equity restatement — (39,490,802) (39,490,802)Retained earnings 29,637,268 28,363,393 58,000,661Net income of the year 9,178,227 70,819 9,249,046
E) FOREIGN CURRENCY TRANSLATION
Net foreign currency translation results, amounting to $(229,244), $2,864,866 and $229,670 in 1999, 1998 and 1997,respectively, have been recorded directly to stockholders’ equity, and are summarized as follows:
1999 1998 1997
Foreign currency translation adjustment $ (825,736) 5,877,309 676,599Foreign exchange gain (loss) (1) 596,492 (3,012,443) (446,929)
$ (229,244) 2,864,866 229,670
The foreign currency translation adjustment includes foreign exchange results from financing related to the acquisitionof foreign subsidiaries generated by the subsidiary of the Company in Spain for $(1,876,891), $452,978 and$(852,571), in 1999, 1998 and 1997, respectively.
(1) Foreign exchange losses from the financing identified with the acquisitions of foreign subsidiaries in accordance with Bulletin B-15.
F) OTHER EQUITY TRANSACTIONS
In May 1998, a subsidiary of the Company in Spain issued US dollars 250 million of preferred shares (“Putable CapitalSecurities”) at an annual dividend rate of 9.66% per year. The Company has an option to repurchase the balance ofthe instrument on November 15, 2004, or on any other subsequent dividend payment date. Additionally, the holdersof the instrument have the right to sell the instrument to the Company on May 15, 2005.
As of December 31, 1999 there are financial transactions totaling US dollars 604.6 million ($5,749.8 million), someof which include guarantees, which have been offset for presentation purposes in the Company’s consolidatedbalance sheet. These financial transactions have been offset as follows: US dollars 500 million for a minority interestwithout voting rights or dividend rights of the subsidiary in Spain; and US dollars 104.6 million for the transfer ofassets to a trust. These financial transactions require certain collateral guarantees. The maturity of the describedtransactions varies between the year 2000 and 2007, and the Company has the option to reacquire the related assetsat different dates. As of December 31, 1998, US dollars 78 million were compensated with stock of the ParentCompany, amount that was refinanced in 1999 as a part of the transaction, which includes stock of the subsidiary inSpain.
As of December 31, 1999, the Company has recognized valuation effects in the stockholder’s equity for $523,433,derived from investments available for sale (see note 3H).
15.- DERIVATIVE FINANCIAL INSTRUMENTSAs of December 31, 1999, the Company has entered into various derivative financial instrument transactions in orderto reduce its risks resulting from changes in interest rates (see note 11), foreign exchange rates and the price of itscommon shares. These instruments have been negotiated with major domestic and international institutions andcorporations, which have a solid financial capacity. Therefore, the Company considers that the risk of non-complianceof the obligations agreed upon by such counterparties is minimum. The notional amount, as well as the estimatedfair value of the derivative instruments as of December 31, 1999 and 1998, is as follows:
THOUSANDS OF US DOLLARS
1999 1998NOTIONAL NOTIONAL AMOUNT FAIR VALUE AMOUNT FAIR VALUE
a) Equity forward contracts 222,719 89,650 220,638 (48,011)b) Foreign exchange forward contracts 410,000 12,423 250,000 (60,848)c) Call options 51,530 (15,427) — —d) Warrants related forward contracts 606,005 122,690 — —
a) The Company has entered into forward agreements and has sold (put) options related to its outstandingcommon stock at an established price that covers up to approximately US dollars 106 and 137 million as ofDecember 31, 1999 and 1998, respectively. At maturity, these agreements provide for physical or net cashsettlement, at the Company’s option, and the gains or losses are recognized in stockholder’s equity. In addition,the Company has forwards related to its ADS’s, in order to fully cover its voluntary stock option plans foremployees for up to US dollars 116 and US dollars 84 million, in 1999 and 1998, respectively. Through theseprograms, the Company’s executives elected to purchase options to buy 7,293,675 ADS’s of the Company.

63
These options are exercisable quarterly over a period of 5 years, and they have an exercise price which increasesquarterly in dollars taking into account the funding cost in the market. For the sale of the options, the Companyreceived a premium equivalent to a percentage of the option price at the beginning of the program. As ofDecember 31, 1999, there are options not exercised for 4,527,369 ADS’s.
b) The Company has entered into foreign exchange forward contracts in order to protect itself from variations inforeign exchange rates. These contracts have been designated as a hedge on the Company’s net investment inforeign subsidiaries for up to US dollars 410 and 250 million as of December 31, 1999 and 1998, respectively.The fair value effects arising from these instruments are recorded for as part of the translation effect of foreignsubsidiaries (see note 14E).
c) At December 31, 1999 the Company has outstanding call options for 1,229,260 of its ADS’s. The Company mayexercise these call options until October 15, 2000, at a weighted average strike price of US dollars 41.89 per ADS.
d) Regarding the public offer for warrants’ subscription made by the Company during December 1999, and therelated sale of CPO’s and shares of a subsidiary mentioned in note 2C, the Company, through a subsidiary,carried out a hedge transaction by means of which forward contracts were entered into to repurchase the totalof CPO’s and shares over a period of three years, and prepaid toward the final price of the forward approximatelyUS dollars 439.9 million ($4,183.5 million). At maturity, the forward contracts provide the physical exchange ofthe shares, and the effects are recognized as part of stockholders’ equity. In the financial statements as ofDecember 31, 1999, anticipated effect has been given to the liquidation of the forward for the portioncorresponding to the shares of the subsidiary, due to the prepayment of the forward and the withholding of alleconomic and voting rights over such shares. Therefore, a net prepayment of approximately US dollars 51.7million ($491.7 million), is reflected in Other Long-Term Accounts Receivable corresponding to the CPO’sportion.
Additionally, during 1999, the Company terminated a derivative transaction from which gains or losses, depended onthe performance of its common shares in relation to the Price and Quotation Index in Mexico. The effects derivedfrom this transaction are included in the statements of income.
The estimated fair values of derivative financial instruments used to hedge the Company’s risks will fluctuate overtime, and are based on estimated settlement costs or quoted market prices. Fair values should not be viewed inisolation, but rather in relation to the fair values of the underlying hedge transactions and the overall reduction in theCompany’s exposure to adverse fluctuations in foreign exchange rates and price of shares. The notional amounts ofderivatives summarized above do not necessarily represent amounts exchanged by the parties and, therefore, are nota direct measure of the exposure of the Company though its use of derivatives. The amounts exchanged are calculatedon the basis of the notional amounts and the other items of the derivatives, which relate to interest rates, exchangerates or other financial indexes.
16.- INCOME TAX (“IT”), BUSINESS ASSETS TAX (“BAT”), EMPLOYEES’ STATUTORY PROFIT SHARING(“ESPS”) AND DEFERRED TAXES
In accordance with present tax legislation in Mexico, corporations must pay either Income Tax (“IT”) or BusinessAssets Tax (“BAT”) depending on which amount is greater for their operations in Mexico. Both taxes recognize theeffects of inflation, in a manner different from generally accepted accounting principles. Employees’ Statutory ProfitSharing (“ESPS”) is calculated on similar basis as Income Tax, but without recognizing the effects of inflation.
A) IT, BAT AND ESPS
The Company and its subsidiaries in Mexico consolidate for IT and BAT purposes. Beginning in 1999, thedetermination of the consolidated IT for the Mexican companies will consider 100% of the taxable income or tax lossof the holding company, and a maximum of 60% of the taxable income or tax loss of each of the subsidiaries. For theperiod of 1999 and after, the taxable income of the subsidiaries that have tax loss carryforwards generated before 1999,will be taken according to its equity participation at the end of the period. Therefore, the amounts of these itemsincluded in the accompanying financial statements, in respect to the Mexican subsidiaries, represent the consolidatedresult of these taxes. For ESPS purposes, the amount presented is the sum of the individual results of each company.
Income Tax benefit (expense) is summarized as follows:
1999 1998
CONSOLIDATED PARENT CONSOLIDATED PARENT
Current Income Tax $ (3,951,129) (3,605,974) (1,476,492) (1,131,179)Received from subsidiaries — 364,805 — 1,929,457Deferred taxes (5,166) — — —Utilization of tax loss carryforwards 3,305,974 3,305,974 962,699 962,699Effects of inflation (note 3B) — — 55,853 —
$ (650,321) 64,805 (457,940) 1,760,977

64
1997
CONSOLIDATED PARENT
Current Income Tax $ (1,495,290) (1,210,192)Received from subsidiaries — 1,013,365Deferred taxes — —Utilization of tax loss carryforwards 957,111 957,111Effects of inflation (note 3B) 29,387 —
$ (508,792) 760,284
Total IT includes $340,082, $290,389 and $240,588 from foreign subsidiaries and $310,239, $167,551 and $268,204from Mexican subsidiaries for 1999, 1998 and 1997, respectively. The Company, as a holding company, prepares itsIT and BAT returns on a consolidated basis for its operations in Mexico, which resulted in tax benefits of $64,805 in1999, $1,760,977 in 1998 and $760,284 in 1997.
The effects of inflation are not recognized for income tax purposes in some countries in which the Company operates,or are recognized differently from the generally accepted accounting principles used by the Company. These effects,as well as other differences between the accounting and the income tax basis, arising from the several income taxrates and laws to which the Company is entitled in the countries in which it has operations, give rise to temporarydifferences between the statutory tax rate and the effective tax rate presented in the income statement:
DECEMBER 31,
1999 1998 1997
% % %
Statutory tax rate 35.0 34.0 34.0Utilization of tax loss carryforwards (27.9) (14.9) (14.2)Additional deductions and tax credits for
income tax purposes 8.0 (20.0) (12.9)Expenses and other non-deductible items (9.1) 5.9 4.8Non-taxable sale of marketable securities
and fixed assets (2.4) 0.4 (3.6)Difference between book and tax inflation 2.4 (6.9) (6.7)Business assets tax 3.7 2.1 3.5Depreciation 3.5 2.8 (0.3)Inventories (6.6) (1.5) (0.1)Others (0.4) 3.3 1.0
Effective consolidated tax rate 6.2 5.2 5.5
The Company, for its operations in Mexico has accumulated tax loss carryforwards regarding IT, which may be offsetagainst taxable income in the succeeding ten years according to the Income Tax Law:
YEAR IN WHICH TAX LOSS OCCURRED AMOUNT OF YEAR OF CARRYFORWARD EXPIRATION
1995 $ 855,142 2005
For the year ending December 31, 1999, the Company utilized accumulated tax loss carryforwards against the period’staxable income of its operations in Mexico in the amount of $9,445,639, which generated a benefit of $3,305,974.The Company and its subsidiaries in Mexico must generate returns to keep the benefit of the tax losses carryforwardgenerated from 1999 and up.
The BAT Law establishes a 1.8% tax levy on assets, indexed for inflation in the case of inventory, property, plant andequipment after deducting certain liabilities.
The BAT levied in excess of IT for the period may be recovered, restated for inflation, in any of the succeeding tenyears, provided that the IT levied exceeds BAT levied in such period. The recoverable BAT as of December 31, 1999is as follows:
YEAR IN WHICH BUSINESS ASSETS TAX EXCEEDED INCOME TAX AMOUNT OF YEAR OF CARRYFORWARD EXPIRATION
1997 $ 133,374 20071999 314,400 2009
447,774
B) DEFERRED INCOME TAX
As of December 31, 1999, the Company has created a deferred income tax provision for the temporary differences ofresults, over which it is reasonably estimated that in a defined period a benefit or liability is originated for tax effectsin the amount of $1,047 million.
During 1999, the Mexican Institute of Public Accountants (“IMCP”), issued the new Bulleting D-4 Accountingtreatment of income tax, business assets tax and employees’ profit sharing (“Bulletin D-4”). Bulletin D-4 requires thedetermination of deferred IT through the application of the statutory IT rate, to the amount of temporary differences

65
resulting from comparing the book and taxable value of the assets and liabilities, applying when available the tax losscarryforwards, as well as the BAT balances or other tax credits to be recovered. Likewise, it is required to determinethe effect of deferred ESPS for those temporary differences arising from the reconciliation of the net income of theperiod and the taxable income for ESPS, of a non-recurring nature.
The provisions of Bulletin D-4 are mandatory starting January 1, 2000. The beginning net accumulated effect fromdeferred income tax derived from the adoption of the Bulletin, must be recognized in the financial statements affectingthe stockholders’ equity in the account named “Accumulated Effect of Income Tax”.
So far, the Company is in the process of determining the final effect that Bulletin D-4 will generate on the financialstatements once the adoption becomes effective in the year 2000, for such purpose, an estimated consolidatedcalculation was determined, which can be representative of the position as of December 31, 1999. Through thiscalculation, the Company estimated that due to the adoption of the new Bulletin D-4, it would be necessary torecognize an additional deferred income tax liability for an approximate amount of $3,799 million. Such additionalliability would be recorded against stockholders’ equity.
17.- FOREIGN CURRENCY POSITIONThe exchange rate of the Mexican peso to the U.S. dollar as of December 31, 1999, 1998 and 1997 was $9.51, $9.90and $8.07 pesos per dollar, respectively. As of January 17, 2000, the exchange rate was $9.43 pesos per dollar.
As of December 31, 1999 and for the year then ended, the principal balances denominated in foreign currencies, aswell as non-monetary assets in Mexico of foreign origin are presented as follows:
THOUSANDS OF U.S. DOLLARS
MEXICO FOREIGN TOTAL
Current assets 123,376 939,677 1,063,053Non-current assets 693,858 (1) 5,840,472 6,534,330
Total assets 817,234 6,780,149 7,597,383Current liabilities 804,253 856,126 1,660,379Long-term liabilities 1,848,675 1,641,939 3,490,614
Total liabilities 2,652,928 2,498,065 5,150,993
(1) Non-monetary assets in Mexico of foreign origin.
Additionally, the Mexican operations in foreign currencies during 1999, 1998 and 1997, are summarized as follows:
THOUSANDS OF U.S. DOLLARS
1999 1998 1997
Export sales 83,190 92,170 131,773Import purchases 29,954 36,563 43,452Interest income 14,575 24,035 12,652Interest expense 221,057 202,748 225,300
18.- GEOGRAPHIC SEGMENT DATAThe Company is engaged principally in one industry segment which is the construction industry through theproduction and marketing of cement and concrete. The following table presents information about the Company bygeographic area for 1999, 1998 and 1997:
OPERATINGNET SALES INCOME
1999 1998 1997 1999 1998 1997
Mexico $ 22,177,707 19,320,749 17,463,315 9,821,679 7,805,839 5,179,121Spain 7,335,325 8,909,898 7,441,683 2,387,015 2,423,426 1,602,176Venezuela 4,570,566 5,173,018 4,700,165 1,247,517 1,736,383 1,627,505United States 5,677,615 5,357,583 4,483,937 1,172,163 752,845 284,606Colombia 1,598,998 2,612,383 3,765,344 378,761 110,679 831,747Caribbean and Central-America 3,509,134 2,616,834 2,361,719 642,088 438,509 608,304Philippines 1,164,474 — — 23,879 — —Egypt 137,686 — — 15,392 — —Others 3,700,630 2,745,770 3,070,832 (2,027,431) (1,594,716) (1,034,441)
49,872,135 46,736,235 43,286,995 13,661,063 11,672,965 9,099,018Eliminations (3,958,189) (3,968,795) (4,780,557) — — —Consolidated $ 45,913,946 42,767,440 38,506,438 13,661,063 11,672,965 9,099,018
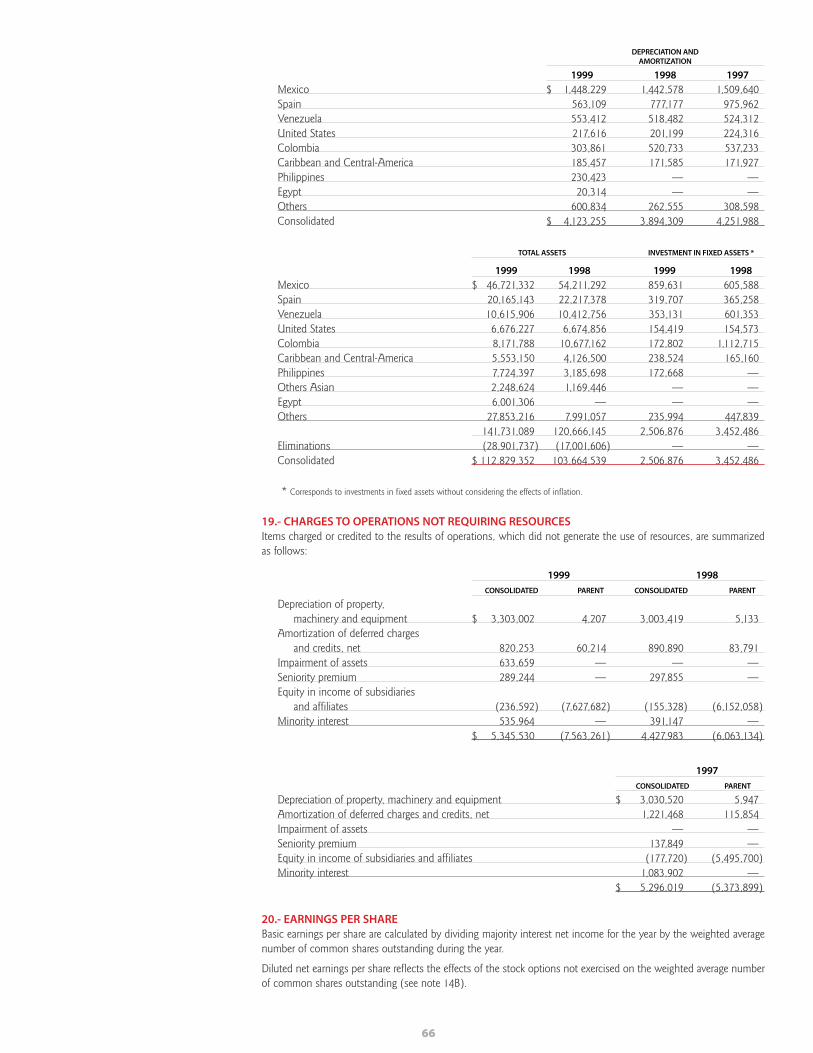
66
DEPRECIATION ANDAMORTIZATION
1999 1998 1997
Mexico $ 1,448,229 1,442,578 1,509,640Spain 563,109 777,177 975,962Venezuela 553,412 518,482 524,312United States 217,616 201,199 224,316Colombia 303,861 520,733 537,233Caribbean and Central-America 185,457 171,585 171,927Philippines 230,423 — —Egypt 20,314 — —Others 600,834 262,555 308,598Consolidated $ 4,123,255 3,894,309 4,251,988
TOTAL ASSETS INVESTMENT IN FIXED ASSETS *
1999 1998 1999 1998
Mexico $ 46,721,332 54,211,292 859,631 605,588Spain 20,165,143 22,217,378 319,707 365,258Venezuela 10,615,906 10,412,756 353,131 601,353United States 6,676,227 6,674,856 154,419 154,573Colombia 8,171,788 10,677,162 172,802 1,112,715Caribbean and Central-America 5,553,150 4,126,500 238,524 165,160Philippines 7,724,397 3,185,698 172,668 —Others Asian 2,248,624 1,169,446 — —Egypt 6,001,306 — — —Others 27,853,216 7,991,057 235,994 447,839
141,731,089 120,666,145 2,506,876 3,452,486Eliminations (28,901,737) (17,001,606) — —Consolidated $ 112,829,352 103,664,539 2,506,876 3,452,486
* Corresponds to investments in fixed assets without considering the effects of inflation.
19.- CHARGES TO OPERATIONS NOT REQUIRING RESOURCESItems charged or credited to the results of operations, which did not generate the use of resources, are summarizedas follows:
1999 1998
CONSOLIDATED PARENT CONSOLIDATED PARENT
Depreciation of property, machinery and equipment $ 3,303,002 4,207 3,003,419 5,133
Amortization of deferred charges and credits, net 820,253 60,214 890,890 83,791
Impairment of assets 633,659 — — —Seniority premium 289,244 — 297,855 —Equity in income of subsidiaries
and affiliates (236,592) (7,627,682) (155,328) (6,152,058)Minority interest 535,964 — 391,147 —
$ 5,345,530 (7,563,261) 4,427,983 (6,063,134)
1997
CONSOLIDATED PARENT
Depreciation of property, machinery and equipment $ 3,030,520 5,947Amortization of deferred charges and credits, net 1,221,468 115,854Impairment of assets — —Seniority premium 137,849 —Equity in income of subsidiaries and affiliates (177,720) (5,495,700)Minority interest 1,083,902 —
$ 5,296,019 (5,373,899)
20.- EARNINGS PER SHAREBasic earnings per share are calculated by dividing majority interest net income for the year by the weighted averagenumber of common shares outstanding during the year.
Diluted net earnings per share reflects the effects of the stock options not exercised on the weighted average numberof common shares outstanding (see note 14B).

67
The weighted average number of shares utilized in the calculations is as follows:
BASIC (1) DILUTED
December 31, 1999 3,767,646,462 3,787,200,759December 31, 1998 3,786,281,775 3,797,376,945December 31, 1997 3,851,983,824 3,908,702,910
(1) Included in 1998 and 1997, are 118,919,607 and 187,733,226 shares related to financial transactions, respectively, (see note 14F).
The difference between the basic and diluted average number of shares for 1999, 1998 and 1997 above is attributableto the additional shares issued under the Company’s executive stock option plan (see note 14B).
21.- CONTINGENCIES AND COMMITMENTSA) GUARANTEES
At December 31, 1999, Cemex, S.A. de C.V. has signed as guarantor for loans made to certain subsidiaries forapproximately US dollars 101 million.
B) TAX ASSESSMENTS
As of December 31, 1999, the Company and some of its subsidiaries in Mexico have been notified of several taxassessments determined by the Tax Authorities related to years prior to 1996. These tax assessments totalapproximately $2,616 million. The tax assessments result primarily from: (i) disallowed deductions resulting fromemployee benefit plans; and (ii) recalculation of the inflationary tax deduction, since the tax authorities purport that“Advance Payments to Suppliers” are not by their nature credits. The companies involved have legally contested theassessments by seeking legal remedies available before the courts.
During 1998, three indirect subsidiaries of the Company in Colombia, acquired as a part of the purchase of CementosDiamante, S.A., were individually notified by the Domestic Taxes and Costumes Office of Colombia (“DIAN”), ofspecial assessments corresponding to income taxes of the 1995 fiscal year, for approximately US dollars 143 million($1,360 millions). The Colombian subsidiaries filed a timely response to such special assessments within the requiredlegal period. During 1999, the DIAN issued a formal deficiency note and the Colombian subsidiaries issued areconsideration resource against such assessments within the required legal period. The company estimates that thefinal resolution of these procedures may delay as long as 2 years, so far, it can not be established if the reconsiderationresources will succeed.
C) ANTI-DUMPING DUTIES
In 1990, the United States Department of Commerce (DOC) imposed an anti-dumping duty order on imports of grayPortland cement and clinker from Mexico. As a result, certain subsidiaries of the Company as importers of record,have been subject to payment of anti-dumping duty deposits estimated on imports of gray Portland cement andclinker from Mexico since April 1990. The order is likely to continue for an indefinite period, however, it will bereviewed by the United States government no later than July 2001, taking into consideration the World TradeOrganization new rules in order to determine whether the conditions for imposing the order still exist. The Companyand its subsidiaries have used the available legal means in this matter and will continue to do so in order to determinethe actual dumping margins within each period of the administration reviews carried out by the DOC.
As of December 31, 1999, the Company has accrued a liability of US dollars 37 million, including accrued interest,for the difference between the amount of anti-dumping duties paid on imports and the latest findings by the DOC inits administrative reviews for all of the reviewed periods.
As of December 31, 1999, the Company finds itself in the ninth administrative review period by the DOC, and willexpect a preliminary resolution in the second semester of the year 2000. With respect of the first 4 review periods,the DOC has issued a final resolution of the anti-dumping duties. With respect of the remaining review periods, thefinal resolutions are suspended until all the procedures before the NAFTA Panel have been concluded, for which, thefinal results may be different from those registered in the accompanying consolidated financial statements.
D) LEASES
The Company has entered into various non-cancelable operating leases, primarily for the lease of operating facilities,cement storage and distribution facilities and certain transportation and other equipment, which require annual rentalpayments plus the payment of certain operating expenses. Future minimum annual rentals due under such leases aresummarized as follows:

68
THOUSANDS OFYEAR ENDING DECEMBER 31, U.S. DOLLARS
2000 32,8112001 38,5602002 32,8912003 30,4722004 27,2722005 and thereafter 130,333
292,339
Rental expense for the years ended December 31, 1999, 1998 and 1997 was approximately US dollars 41, 25 and 22million, respectively.
E) PLEDGE ASSETS
At December 31, 1999 there are liabilities amounting to US dollars 91 million secured by property, plant andequipment.
F) COMMITMENTS
As of December 31, 1999, subsidiaries of the Company have future commitments for the purchase of raw material foran approximate amount of US dollars 38 million.
As of December 31, 1999, the Company has entered into agreements with an international partnership, which willbuild and operate an electrical energy generating plant. These agreements establish that when the plant beginsoperations, the Company will acquire, starting the second half of 2002, all the electrical energy generated by suchplant for a term no less than 20 years. As part of these agreements, the Company has agreed to supply the electricplant with enough fuel for its operation. This commitment will be covered through a 20 year agreement that theCompany has with Petróleos Mexicanos. By means of this transaction, the Company expects to have enoughdecreases in the electrical energy costs, and the supply will be enough to cover approximately 60% of the electricalenergy usage of 12 cement plants in Mexico. For effect of these agreements, the Company is not required to makecapital investment in the project.
22.- YEAR 2000 PROGRAMThe CEMEX 2000 program was completed according to the schedule. The Company achieved the objective tomaintain continous operations in all its manufacturing plants, technological platforms and information systemsaccording to the work plan.
During the transition period to the year 2000, all operations have been performing normally and during the followingmonths, the Company will continue monitoring the performance of all Y2K sensitive elements in its worldwideoperations.
The Company invested approximately 400 thousand man-hours and a budget of US dollars 36 million ($342.4million) in the Y2K preparation.
The Company has undertaken the necessary efforts to ensure business as usual during the year 2000 and beyond.
23.- SUBSEQUENT EVENTSAs a result of the natural disaster occurred in Venezuela, country where the Company operates, during December1999, an approximate amount of US dollars 2.6 million was recorded in the results under the caption other expenses,net. This provision corresponds to the book value of the portion of assets of the subsidiary in Venezuela, which asof December 31, 1999 are estimated to be unrecoverable. These assets include accounts receivable from clients,inventory, investments in shares, as well as fixed assets. As of the date of the financial statements, the Companycannot assure that it will not be necessary to record extraordinary losses in addition to those recognized during 1999,due to the effects of the natural disaster mentioned above, since some of the effects are not yet known.
Regarding the sale of shares mentioned in note 3D with effects as of December 31, 1999, Cemex México requiredconsent of 51% or more of the 8.375% Yankee Notes holders’, in order to modify certain restrictions in the contractthat limited the Company’s possibility to complete the transaction. For this purpose, on January 3, 2000, the Companyannounced a purchase offer for the notes outstanding, through which the holders were offered a premium equivalentto 2% of the value of the notes in exchange for their consent, and simultaneously the redemption of the notes at 98%of their nominal value. In case the consent would not be obtained from most of the note holders, the trading of shareswould be invalid, since it was conditioned to such consent. The term to receive the consent expired January 14, whilethe term for the purchase of the notes expires on February 2, 2000.
As of the date of the financial statements, the Company obtained consent of approximately 85% of the note holders,and therefore validates the sale of shares with retroactive effects to December 31, 1999. For the Company, the consentreceived from the note holders represents the redemption of notes for approximately US dollars 148.8 million beforethe due date in 2003, however, such amount could be increased until the purchase offer expires on February 2, 2000.
Aggregates are sand and gravel, which are mined from quarries. They give ready-mix concrete its necessary volume
and add to its overall strength. Under normal circumstances, one cubic meter of fresh concrete contains two metric
tons of gravel and sand.
Clinker is an intermediate cement product. Limestone, clay, and iron oxide are sintered in a kiln at around 1,450
degrees Celsius to produce clinker. One metric ton of clinker is used to make approximately 1.1 metric tons of gray
Portland cement.
Comprehensive financing income (cost) includes financial expense, financial income, gains (losses) on
marketable securities, net foreign exchange variation, and net monetary position result.
EBITDA (operating cash flow) is earnings before interest, taxes, depreciation, and amortization. Amortization of
goodwill is not included in operating income, but is instead recorded in other income (expense) below the operating
line. EBITDA does not include certain extraordinary income and expenses that are not included in operating income
under Mexican GAAP.
Effective tax rate is defined as income tax plus employees’ statutory profit sharing, divided by net income before
income taxes but after comprehensive financing income (cost), depreciation, and amortization.
Financial leverage is defined as net debt divided by EBITDA for the previous twelve months.
Free cash flow is defined as EBITDA less net financial expense, capital expenditures, taxes paid, net working capital
investment, and dividends.
Gray Portland cement is a hydraulic binding agent with a composition by weight of at least 95% clinker and 0–5%
of a minor component (usually calcium sulfate). It can set and harden underwater and, when mixed with aggregates
and water, produces concrete or mortar. Today, our research and development focuses on blended cements. These
special cements not only meet our customers’ more stringent demands, but they also reduce our energy consumption.
Installed capacity is the theoretical annual production capacity of a plant, whereas effective capacity is a plant’s
actual optimal annual production capacity, which can be 10–20% less than installed capacity.
Interest coverage is defined as EBITDA before operating lease payments and cost restatements for inflation, divided
by the sum of financial expenses and dividends on preferred capital securities, all for the previous twelve months.
Metric ton is the equivalent of 1.102 short tons.
Net debt equals balance-sheet debt plus equity swaps and the preferred capital securities minus cash and cash
equivalents. CEMEX is conservatively adding the preferred capital securities (US$250 million) because of its put option
under this structure.
Net working capital equals accounts receivable plus inventories minus trade payables.
Ready-mix concrete is a mixture of cement, aggregates, and water. It is a building material that is produced in
batching plants and delivered directly to the building site. Stringent controls during the manufacturing process
guarantee the quality and consistency of the finished product.
White cement is a strategic, high-potential specialty cement, which is particularly suited for the world’s developing
markets. It is not only used for decorative purposes, but it also has a wide range of uses as a structural building material.
termsthe
we use
GLOSSARY
69

70
CHAIRMAN Lorenzo H. Zambrano
HONORARY CHAIRMAN Marcelo Zambrano Hellion
EXAMINER Luis Santos de la Garza
ALTERNATE EXAMINER Fernando Ruiz Arredondo
DIRECTORS Juan F. Muñoz Terrazas (deceased)
Eduardo Brittingham
Lorenzo Milmo
Armando J. García
Rodolfo García Muriel
Bernardo Quintana Isaac
Rogelio Zambrano
Roberto Zambrano
Dionisio Garza Medina
Alfonso Romo Garza
ALTERNATE DIRECTORS Mauricio Zambrano Villarreal
Jorge García Segovia
Tomás Brittingham Longoria
experiencedan
management team
BOARD OF DIRECTORS
Lorenzo H. Zambrano, 55Chairman of the Board and Chief Executive Officer
Mr. Zambrano joined CEMEX in 1968 and has beeninvolved in all operational aspects of the business. Heholds a degree in industrial engineering from the Insti-tuto Tecnológico y de Estudios Superiores de Monterrey(ITESM) and an M.B.A. from Stanford University. Heis a member of the Boards of Directors of Alfa, Empre-sas ICA, Cydsa, Vitro, and Televisa. He is also theChairman of the Board of ITESM and a member of theAdvisory Committee of the Stanford Graduate Schoolof Business.
Héctor Medina, 49Executive Vice President of Planning and Finance
Mr. Medina, who joined CEMEX in 1988, is a graduateof ITESM with a degree in chemical engineering. Hereceived an M.S. degree in administration from theUniversity of Bradford Management Center in Englandand an M.S. degree from the Escuela de OrganizaciónIndustrial in Spain. Mr. Medina is responsible forCEMEX’s worldwide planning and finance strategies.
Francisco Garza, 44President of the North America Region
Mr. Garza is a graduate of ITESM and has an M.B.A.from Cornell University's Johnson Graduate School ofManagement. Since he joined CEMEX in 1988, he hasoccupied several senior management positions in thecompany. Mr. Garza is directly responsible for CEMEX’sinterests and operations in Mexico and the U.S. andthe company’s Trading unit.
Víctor Romo, 41President of the South America & Caribbean Region
Mr. Romo joined CEMEX in 1985. He earned hisBachelor’s degree in accounting and his M.S. degreein administration from ITESM. Before assuming hiscurrent position, Mr. Romo was President of Vencemos,CEMEX’s Venezuelan subsidiary. He is now responsiblefor CEMEX’s interests and operations in Venezuela,Colombia, Panama, the Caribbean, the DominicanRepublic, Costa Rica, and Chile.
José Luis Sáenz de Miera, 53President of the Europe & Asia Region
Mr. Sáenz de Miera, who joined CEMEX in 1994, has adegree in economics and accounting. He has heldseveral management positions within CEMEX. Appoint-ed in 1998 to this position, he is directly responsiblefor supervising CEMEX’s interests and operations inSpain, the Philippines, Indonesia, and Egypt.
Armando J. García, 47Executive Vice President of Development
Mr. García, who originally joined CEMEX in 1975 andrejoined the company in 1985, is a graduate of ITESMand has an M.B.A. from the University of Texas. He isresponsible for managing CEMEX’s operations tech-nology, human resources, energy, and research anddevelopment departments.
Mario de la Garza, 60Vice President of Administration
Mr. de la Garza, who joined CEMEX in 1965, is a C.P.A.He graduated from the Universidad Autónoma deNuevo León with a degree in philosophy and attendedthe Programa de Alta Dirección de Empresas, AD2 at theInstituto Panamericano de Alta Dirección de Empresa.
Rodrigo Treviño, 43Chief Financial Officer
Mr. Treviño, who joined CEMEX in 1996, received hisB.S. and M.S. degrees in industrial engineering fromStanford University. He is responsible for the com-pany's finance, reporting, capital markets, treasury,and investor relations.
OFFICERS
71
72
HeadquartersAv. Constitución 444 Pte.C.P. 64000 Apdo. Postal 392Monterrey, N.L., MéxicoPhone: (528) 328-3000 Fax: (528) 328-3188
AmsterdamRiverstaete BuildingAmsteldijk 1661079 LH Amsterdam, The NetherlandsPhone: (3120) 642-4288 Fax: (3120) 642-0053
BogotáCarrera 14 No. 93 B-32 Piso 2Bogotá, ColombiaPhone: (571) 634-0030Fax: (571) 634-0333
CaracasCalle Londres, entre c/ Nueva York y TrinidadEdificio VencemosUrbanización Las MercedesCaracas, 1060 VenezuelaPhone: (582) 999-7000Fax: (582) 999-7302
Costa RicaGuatuso de Patarrá 5 Km al Sur de la Iglesia de Sn. Antonio deDesamparadosSan José, Costa RicaPhone: (506) 276-6001
EgyptP.O. Box: 82 New MaadiCairo, EgyptPhone: (202) 754-5461
HoustonOne Riverway, Suite 2200Houston, Texas 77056 U.S.A.Phone: (713) 881-1000Fax: (713) 881-1012
IndonesiaJakarta Stock Exchange BuildingTower II, 24th FloorSudirman Central Business DistrictJI. Jend. Sudirman Kav. 52-53Jakarta 12190 Indonesia Phone: (6221) 5299 3400Fax: (6221) 5299 3440
MadridHernández de Tejada No. 1C.P. 28027, Madrid, EspañaPhone: (3491) 377-9200Fax: (3491) 377-9203
Mexico CityAv. Presidente Masarik 101 Piso 18Polanco. C.P. 11570México, D.F.Phone: (52) 5726-9040 Fax: (52) 5203-2542
New York590 Madison Ave., 41st FloorNew York, N.Y. 10022 U.S.A.Phone: (212) 317-6000Fax: (212) 317-6047
Panama CityPlaza Credicorp Bank Panamá, Piso 28Calle 50 Entre c/59 y 60Bella Vista, Panamá 5C.P. 7262 República de PanamáPhone: (507) 210-1300Fax: (507) 210-1325
Philippines25th Floor, Petron Mega Plaza358 Sen. Gil J. Puyat AvenueMakati City, Philippines 1200Phone: (632) 849-3600Fax: (632) 849-3639
Singapore3 Temasek Avenue#22-01 Centennial TowerSingapore 039190Phone: (65) 433-0700Fax: (65) 433-0780
Internetwww.cemex.com
DIRECTORY
The information presented herein contains certain forward-looking statements and information relating to CEMEX, S.A.de C.V. and its subsidiaries (collectively, “CEMEX”) that are based on the beliefs of its management as well as assump-tions made by and information currently available to CEMEX. Such statements reflect the current views of CEMEX withrespect to future events and are subject to certain risks, uncertainties and assumptions. Many factors could cause theactual results, performance, or achievements of CEMEX to be materially different from any future results, performance, orachievements that may be expressed or implied by such forward-looking statements, including, among others, changesin general economic, political, governmental, and business conditions globally and in the countries in which CEMEXdoes business, changes in interest rates, changes in inflation rates, changes in exchange rates, the level of constructiongenerally, changes in cement demand and prices, changes in raw material and energy prices, changes in business strategy,problems relating to the “Year 2000” issue, and various other factors. Should one or more of these risks or uncertaintiesmaterialize, or should underlying assumptions prove incorrect, actual results may vary materially from those describedherein as anticipated, believed, estimated, or expected. CEMEX does not intend, and does not assume any obligation, toupdate these forward-looking statements. In addition, certain information presented herein was extracted from informa-tion published by various official sources.This information includes statistical information relating the cement industrycertain reported rates of inflation, exchange rates, and information relating to the countries in which CEMEX operates.CEMEX has not participated in the preparation or compilation of any of such information and accepts no responsibilitytherefor.
Exchange listings:
Bolsa Mexicana de Valores (BMV), Mexico
New York Stock Exchange (NYSE), U.S.
Share series:
CPO shares (representing two A shares
and one B share)
BMV ticker symbol:
CEMEX CPO
NYSE ticker symbol:
CX
Media relations contact:
Phone: (528) 152-2739
Fax: (528) 152-2750
Investor relations contact:
From the U.S.: 1 8777 CX NYSE
From other countries: (528) 328-7171
Fax: (528) 328-7221
INVESTOR AND MEDIA INFORMATIOND
ESIG
N:S
IGN
I/P
RIN
TIN
G:W
ETM
OR
E