1998 Home Appliance Buying Trends Survey - Energy … Home Appliance Buying Trends Survey Final...
28
1998 Home Appliance Buying Trends Survey Final Report Prepared for the U.S. Department of Energy By D&R International, Ltd. June, 1999
Transcript of 1998 Home Appliance Buying Trends Survey - Energy … Home Appliance Buying Trends Survey Final...

1998 Home Appliance Buying Trends Survey
Final Report
Prepared for the U.S. Department of Energy
By D&R International, Ltd.
June, 1999

Table of Contents
I. Executive Summary 1
II. Overview 2
1. Objectives 2
2. Research Approach 2
III. Findings 3
1. Profile of Survey Respondents 3
2. Visibility of the ENERGY STAR Logo 6
3. How Consumers Make Buying Decisions 7
4. Other Influential Factors in Decision Making 7
5. The Role of Rebates in Buying Decisions 7
6. The EnergyGuide Label 8
7. ENERGY STAR Clothes Washers 8
IV. Conclusions 9
Appendix A: Methodology 10
Appendix B: Universe and Stratification of Sample 12
Appendix C: Weighting and Statistical Significance 14
Appendix D: Survey Materials 16

1998 Home Appliance Buying Trends Survey Final Report
Page 1 of 26
I. Executive Summary
The Department of Energy conducted a study in 1998 entitled the “Home ApplianceBuying Trends Survey.” The study consisted of a survey of about 500 recent appliancepurchasers, half of whom purchased ENERGY STAR-qualifying appliances, and half ofwhom did not. The purpose of the study was to better understand the appliance market, andthe importance of ENERGY STAR and energy efficiency in general in appliance purchasedecisions. The study also serves as a baseline for consumer awareness of the brand.
The key findings of the survey are as follows.1
• 44% recognized the ENERGY STAR logo. Of those who recognized the logo, 47%correctly interpreted its meaning.
• Purchasers of products tended to be older and slightly more educated. Nearly half(44%) of the purchasers of ENERGY STAR products were 50 or older, compared to one-third of the purchasers of non-qualified product. About 28% of purchasers of productsheld graduate degrees, compared to 22% of purchasers of non-qualified product.Incomes were fairly consistent across both groups.
• Two thirds said they used the EnergyGuide label to compare different modelswhen making their purchased decision. Most people (81%) thought the model theypurchased was energy efficient.
• The manufacturer’s reputation was most often (58%) cited as important in thepurchase decision. However, salespeople (28%) and in-store materials (23%) werealso commonly listed as sources of information that were used in the decision-makingprocess.
• Lower water use and better cleaning were the most important reasons peoplepurchased horizontal axis washers. These were followed by uses less energy, saveson utility bills, large capacity, and finally good for the environment.
These results, and others, are discussed in detail in the following sections. Findings such asthese offer insight into consumer preferences and buying habits that will help guide futureENERGY STAR promotional activity.
1 Results have been weighted to reflect the population in general, rather those who responded to the survey.That is, we surveyed roughly equal numbers of ENERGY STAR- purchasers compared to standard efficiencyappliance purchasers. Because in reality fewer people purchase ENERGY STAR appliances, the responses ofthe group of standard-efficiency appliance purchasers are given more weight when computing the finalresults. This procedure is detailed in the Methodology section.

1998 Home Appliance Buying Trends Survey Final Report
Page 2 of 26
II. Overview
The mission of the ENERGY STAR Program is to create and sustain consumer demand for
energy efficient appliances by developing partnerships between government, utilities,manufacturers, and retailers. A variety of strategies are used to promote the brand,including a continuing national brand awareness campaign, a comprehensive web site, localpromotions, and product labeling by retailers and manufacturers.
As ENERGY STAR promotions have increased and diversified, so has the need to evaluatethe impact ENERGY STAR is making on the nation’s consumers. This survey was conceivedas an early step towards evaluating the progress and direction the program has taken. Theresults will be used, along with other evaluation techniques, to judge the success of programefforts to date, and help better target them in the future to achieve the greatest success.
Objectives
The goals of this survey are to build a profile of the ENERGY STAR target audience in orderto improve program efficacy and to establish a baseline of consumer research aboutENERGY STAR programs. Additionally, we seek to better understand how future programefforts can be targeted to reach the widest and most receptive audience, and how to tailorour message to have the greatest impact.
Research Approach
A mail survey was developed and mailed in the spring of 1998 to five thousand recentappliance purchasers. The survey, entitled the “1998 Home Appliance Buying TrendsSurvey,” consisted of a small questionnaire booklet, an introduction letter and postage-paidreturn envelope. Approximately 5,000 people, who had purchased clothes washers,refrigerators, dishwashers, or room air conditioners at a major retail chain between May andSeptember of 1997, were chosen to participate in the survey. Half of the sample purchasedENERGY STAR-qualifying products, and half purchased non-qualifying products. Onlyconsumers in Arizona, California, Florida, Massachusetts and Texas were sampled, with theexception of horizontal-axis clothes washer purchasers, who were sampled nationally. Wereceived 534 responses, for a response rate of 11%, typical of mail surveys of this type.

1998 Home Appliance Buying Trends Survey Final Report
Page 3 of 26
III. Findings
The findings presented in this section are organized according to the following surveyobjectives:
1) to develop a profile of people purchasing energy efficient products;2) to evaluate the visibility of the logo; and3) to better understand how people arrive at buying decisions in the appliance
market.
Profile of Survey Respondents
The following demographic information collected from survey respondents constitutes abaseline, a reference point, for learning about what kinds of people buy ENERGY STARappliances, compared to appliance purchasers in general. Overall, demographiccharacteristics were fairly similar between the two groups, with a few differences.
The median age group of the survey respondents was 40-49 years old. Compared topurchasers of non-qualified products, appliance purchasers tended to be slightly older, andslightly more educated. However, survey respondents who purchased ENERGY STARproducts tended to be older, with nearly twice as many respondents in the 50-59 age grouppurchasing an ENERGY STAR-qualified model.
0%
5%
10%
15%
20%
25%
30%
35%
Under 25 25-29 30-39 40-49 50-59 60+
Age of Respondents
ENERGY STAR
Non-qualifying
1998 Home Appliance Buying Trends Survey Final Report
Page 4 of 26
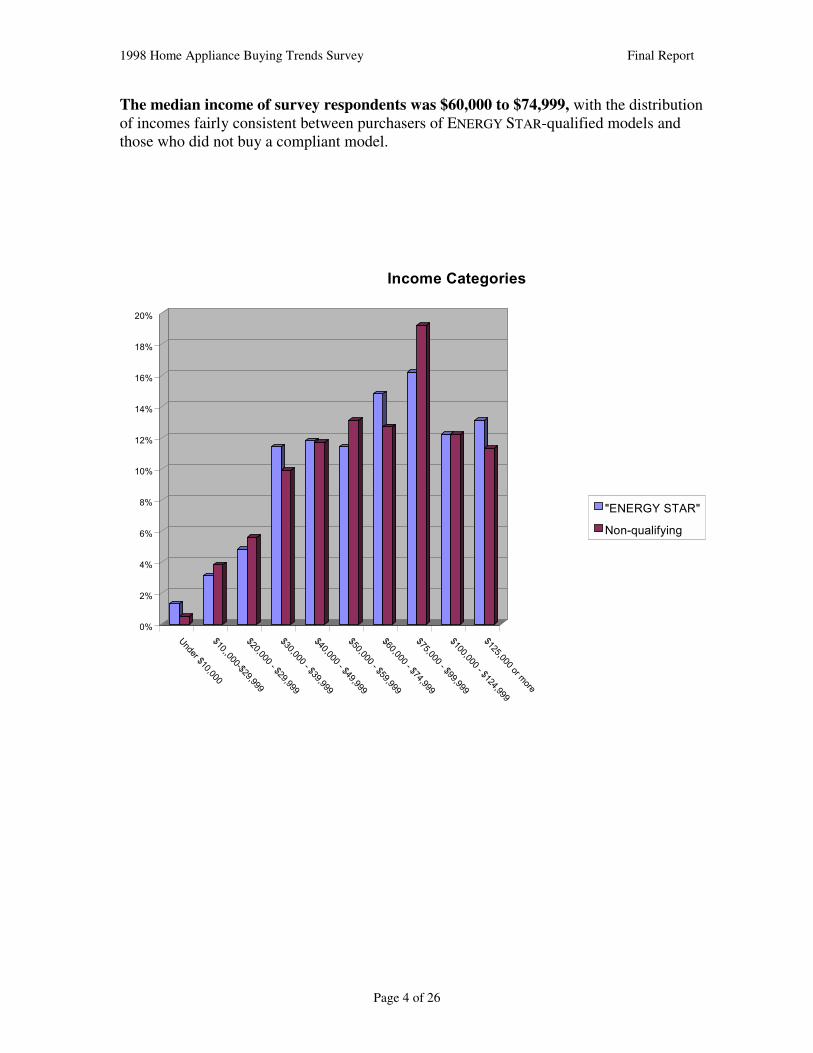
The median income of survey respondents was $60,000 to $74,999, with the distributionof incomes fairly consistent between purchasers of ENERGY STAR-qualified models andthose who did not buy a compliant model.
0%
2%
4%
6%
8%
10%
12%
14%
16%
18%
20%
Under $10,000$10,,000-$29,999$20,000 - $29,999$30,000 - $39,999$40,000 - $49,999$50,000 - $59,999$60,000 - $74,999$75,000 - $99,999$100,000 - $124,999
$125,000 or more
Income Categories
"ENERGY STAR"
Non-qualifying
1998 Home Appliance Buying Trends Survey Final Report
Page 5 of 26
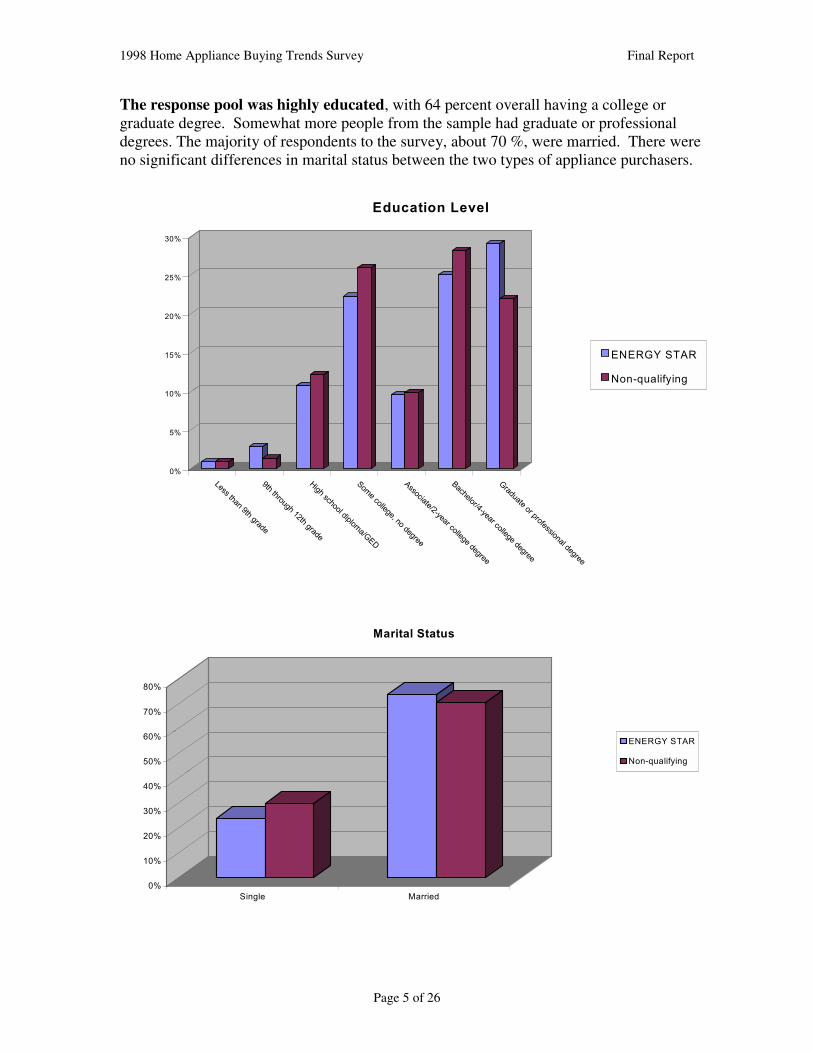
The response pool was highly educated, with 64 percent overall having a college orgraduate degree. Somewhat more people from the sample had graduate or professionaldegrees. The majority of respondents to the survey, about 70 %, were married. There wereno significant differences in marital status between the two types of appliance purchasers.
0%
5%
10%
15%
20%
25%
30%
Less than 9th grade
9th through 12th grade
High school diploma/GED
Some college, no degree
Associate/2-year college degree
Bachelor/4-year college degree
Graduate or professional degree
Education Level
ENERGY STAR
Non-qualifying
0%
10%
20%
30%
40%
50%
60%
70%
80%
Single Married
Marital Status
ENERGY STAR
Non-qualifying

1998 Home Appliance Buying Trends Survey Final Report
Page 6 of 26
Visibility of the ENERGY STAR Logo
The survey indicates some early success of the ENERGY STAR labeling program in terms oflogo recognition. While a solid percentage of consumers recognize the ENERGY STARlogo, the survey results also show the importance of retailers, manufacturers, and other thirdparty groups—such as utilities—in influencing consumer awareness and understanding ofenergy efficiency. These results are examined in detail below.
Nearly half (44%) of consumers recognize the logo. Perhaps one of the reasons for suchan impressive level of recognition is that the ENERGY STAR message is being delivered toconsumers in a variety of ways and by a variety of messengers. Partner promotion is vitalto repeated consumer exposure to the logo. The same logo spotted on a utility bill insert, ona retailer advertisement and on product information generated by a manufacturer gainslegitimacy and recognition.
Of those who recognized the logo, nearly half (48%) correctly interpreted its meaning.This surprising result shows a very strong association of the brand with its intendedmeaning. Among those who did not recognize the logo, a full 19% had some idea of itsmeaning, indicating that it meant energy efficiency, good for the environment, or moneysaving.
When asked where they have seen the program logo, most respondents had seen theENERGY STAR symbol on computer monitors (27%). This is not surprising, consideringthat computers and other office equipment products were among the first products labeledby the program, beginning in 1992. The labeling of computers was also very popularamong participating manufacturers. In addition to seeing the logo on monitors, 20% statedthey had seen the logo on products in showrooms; 16% indicated newspaper or magazineadvertisements; 16 % indicated utility company bill inserts; and 13% indicated televisionadvertisements.
Local and regional ENERGY STAR promotional efforts were found to boost logovisibility. Several utilities in California, one of the target areas of our survey, were involvedin the Appliances pilot program during 1997-1998. California utility partners worked withretailers to label compliant products, distribute point-of-purchase materials, and train salesstaff. The partners also promoted ENERGY STAR through advertising in local media andutility bill stuffers. The logo recognition rate of survey respondents was 56% in California,compared to 41% in other states, where little or no promotional efforts were ongoing at thetime.
California Other States
R ecognize Logo
D on't R ecognize

1998 Home Appliance Buying Trends Survey Final Report
Page 7 of 26
How Consumers Make Buying Decisions
Sales people and in-store materials were identified as very common sources ofinformation for consumer buying decisions, 32% and 25% respectively. Shoppers used avariety of methods to collect information about products before they buy. But when theconsumer has little or no time to do extensive research on products, these two resourcesbecome extremely valuable. Such findings underscore the need for effective showroomdisplays and retailer expertise on the benefit of energy efficient products.
The most common reason for purchasing a new product was that an existingappliance failed, with nearly 45 percent of respondents indicating this reason. Thisreinforces the need to focus on retailer activities, including salesperson training and point-of-purchase materials. When an appliance fails, the consumer is most likely far moreconcerned with getting a replacement quickly than with properly researching the purchase.
Other reasons for replacement were moving to a new house (25%), and upgrades to anexisting appliance that still worked (15%). Remodeling accounted for only 6.3% of newpurchases.
Other Influential Factors in Decision Making
The survey indicates that 78% of consumers rate energy efficiency as “extremelyimportant” or “important” to their purchase decision. Of consumers who purchased anenergy efficient product, energy efficiency is the most important criteria, followed by size,warranty, brand, premium features, price, and color. However, among those who did notpurchase an energy efficient product, energy efficiency ranked fifth, behind size, price,brand, and warranty. That is, even though it was often listed as important, it was lessimportant than many other factors.
Sixty-five percent of consumers rely on manufacturer reputation in making appliancepurchase decisions. With purchase decisions often being made quickly, manufacturerproduction and labeling of energy efficient products is critical. With more appliancemanufacturers supporting ENERGY STAR, consumers will increasingly associatemanufacturer reputation not only with product reliability and quality, but also with efficientdesigns and money saving operation.
The Role of Rebates in Buying Decisions
Approximately 20% of survey respondents received a rebate for the appliance theypurchased. Most of these were for qualified products. Of these, 71% said the rebate wasimportant to their decision to buy that particular model. Price is one of the top criteria formany consumers, so for those who did not purchase an energy efficient product,rebates could help in the decision to buy. A higher proportion of respondents whoreceived a rebate recognized the ENERGY STAR logo (56%). The average respondent whoreceived a rebate was slightly younger than the consumer profile (30-50 years old) andmore educated (62% college degree, 35% graduate degree).
1998 Home Appliance Buying Trends Survey Final Report
Page 8 of 26
The EnergyGuide Label
This survey also asked appliance purchasers questions about their recognition andunderstanding of the EnergyGuide label. These labels, which are located on refrigerators,dishwashers, clothes washers, room air conditioners and other appliances, are modelspecific and provide information about the model’s energy consumption. EnergyGuidelabels enable shoppers to compare energy consumption figures for various models.
The survey found that 84% of consumers look at the label and two-thirds used it to comparedifferent models. However, the results of the survey suggest confusion in understandingthe EnergyGuide label when using it to select an energy efficient model. Eighty-onepercent of survey respondents indicated they had purchased an efficient model, with 61%indicating they knew the product was energy efficient because of the EnergyGuide label. Inreality, 48% bought -compliant appliances.
This discrepancy illuminates one of the challenges in promoting highly efficient products.The survey results suggest that the public perceives the mere presence of an EnergyGuidelabel as a certification of product efficiency. In addition, there is not necessarily a goodunderstanding of the range in efficiency that exists among products. The public mayunderstand that newer products are much more efficient than the older models beingreplaced, but they may not be aware of the range of efficiency among new products.
Purchasers of ENERGY STAR-Qualified Clothes Washers
The survey also asked purchasers of ENERGY STAR-qualified horizontal-axis clotheswashers about what factors influenced their decision to buy. Tied for first place were lowerwater use and better cleaning ability. Next in order of priority were “using less energy,”“saving on utility bills,” the “large capacity” and “good for the environment.”
Price and questions about the new technology of horizontal-axis (H-axis) washers presentedsubstantial barriers. Of those consumers who did not purchase an H-axis washer, 37%indicated price was the reason, with 36% stating that they simply prefer their top-loadingmachines. Some respondents’ written comments included statements such as — “I neededto keep [the] cost down,” and “habit, never did before,” and “mine loads at the top—I amokay with that.” Eleven percent of respondents chose not to buy a horizontal-axis washerbecause of the lack of availability. Others (8%) said they did not purchase one because oftheir skepticism of the technology—such as leaks or lack of reliability data.
1998 Home Appliance Buying Trends Survey Final Report
Page 9 of 26
IV. Conclusions
The 1998 Home Appliance Buying Trends Survey underscores the need for all marketplayers to get involved in raising consumer awareness of the benefits of energy efficientproducts. Third party endorsements and promotions from utilities and local governmentscan help consumers overcome informational and price barriers. Manufacturer production,labeling, and marketing of ENERGY STAR-qualified products can go a long way towardbuilding consumer trust and demand for energy efficient products. Retailers, on the frontline with consumers, are critical in explaining the benefits of energy efficiency and thevalue of purchasing an ENERGY STAR-qualified product.
This survey gives us a useful baseline of information on consumer awareness of ENERGYSTAR and sheds some light on several factors that influence consumer purchase decisions.This information can help guide future consumer research efforts and help directimplementation activities to target audiences.
1998 Home Appliance Buying Trends Survey Final Report
Page 10 of 26
Appendix A: Methodology
Survey Design
A mail-based survey, consisting of an eight-page booklet, a cover letter, and a postage-paidreturn envelope, was chosen as the format for this study. In-person interviews, telephonesurveys and mail surveys were all proposed as possible study designs. The objectives of thestudy, financial, and logistical concerns were all considered when evaluating theappropriateness of each method.
The expense and logistics of conducting a large volume of in-person interviews quicklydisqualified this method from contention. A telephone survey was logistically feasiblealthough the exchange of questions and answers via telephone prevented the measurementof the visual recognition of the ENERGY STAR logo. Although a telephone survey yields amuch higher response rate than a mail survey, visual logo recognition was one of the centralpurposes of the study, and ultimately disqualified a telephone survey as well. Thisconsideration, the study objectives and budget left the mail survey as the most appropriatetechnique.
Sample Design
D&R International mailed its survey, the 1998 Home Appliance Buying Trends Survey, toapproximately 5,000 recent appliance purchasers in the spring of 1998. The survey samplewas chosen from a universe of people who purchased an appliance (clothes washer,refrigerator, dishwasher, or room air conditioner) at a major retail chain between May andSeptember of 1997. The sample included Arizona, California, Florida, Massachusetts, andTexas. Additionally, horizontal-axis clothes washer purchasers from all 50 states wereincluded because there were not enough of them in the target states to draw a large enoughsample for independent analysis.
The sample was stratified by state of residence, by type of appliance purchased, and by ornon-ENERGY STAR. Stratifying the sample ensured that the survey contained enoughresponses from each subgroup to perform meaningful comparisons across the differentgroups. (See Appendix B for the percent breakdown of the universe and for tablesidentifying the major strata).
Survey Instrument Design and Distribution
The survey package consisted of an introduction letter with toll-free information phonenumber, a six-page questionnaire in booklet form, and a postage-paid (business reply mail)return envelope. D&R International mailed the survey in plain white Number 10 envelopeswith a D&R International return address. Appendix C contains information for obtainingreproductions of the survey materials.
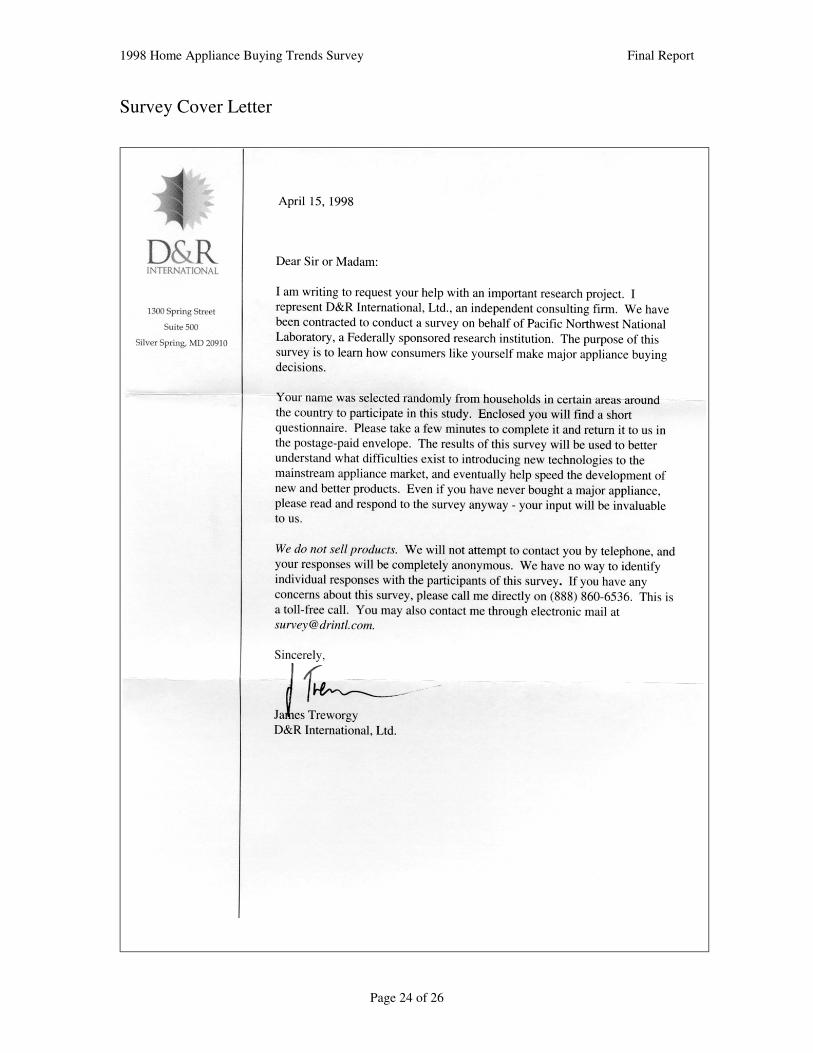
The cover letter was deliberately vague in that it did not mention energy efficiency at all.The purpose of the survey was only described as a way “to learn how consumers like you
1998 Home Appliance Buying Trends Survey Final Report
Page 11 of 26
make major appliance buying decisions.” If we had mentioned energy efficiency, or thetrue purpose of the survey, we might have influenced certain types of people to respond, ornot respond. For instance, someone with a particularly strong feelings towards theimportance of energy efficiency might have been more likely to respond upon realizing thesurvey was about energy efficiency, biasing the responses towards the more aware people.
The questionnaire contained 30 questions. Most (24) were multiple choice. Two of thequestions asked respondents to rate the importance of specific factors that influence buyingdecisions. The remaining four questions were open-ended to encourage elaboration.Generally speaking, the first half of the survey contained questions designed to betterunderstand how people arrive at their appliance purchasing decisions. These were followedby nearly equal amounts of questions aimed at evaluating the recognition and meaning ofthe logo and at developing a profile of people purchasing energy efficient products. Thelast question allowed respondents to submit final comments.
In February of 1998, D&R International conducted a pre-test of 20 people to test the surveyquestionnaire. The pre-test yielded no significant questionnaire problems. After minorrevisions, the full survey was mailed to 5,000 people between April 21 and April 24, 1998.To minimize costs, the survey did not include advance or follow-up mailings.
Analysis
D&R International received exactly 534 responses, for a response rate of 11%—a rate thatis typical of this type of mail survey. Eleven states were represented in the responses. Inaddition, approximately 11 % of the respondents indicated that they did not recentlypurchase an appliance. Therefore most of the analysis focused on the remaining 476responses.
The number of responses did not yield a large enough pool in each substratum to performstatistically significant comparisons at the finest level. To ensure valid results, the studycombines substrata for the purposes of weighting and analysis. While D&R Internationaldrew the sample from the intersection of ENERGY STAR qualification, appliance type, andstate of residence, the analysis is limited to either qualification and appliance type, orENERGY STAR qualification and state, or simply qualification.
D&R International entered the data from each survey twice and verified the entries againsteach other (double key entry) to ensure accuracy. Responses to open-ended answers werecoded with the most common responses and are included in the tabular analyses. Afterentering and cleaning the data, the data was weighted to allow extrapolation to the universeat large from the responses. By weighting the responses within each stratum to match thesame proportions as the universe, the responses can be generalized to the universe ofappliance purchasers, rather than just represent the rather skewed sample that was originallychosen. Percentages cited in this report are generally weighted values, except in situationswhere the differences between the two populations are noted (e.g., the demographics).

1998 Home Appliance Buying Trends Survey Final Report
Page 12 of 26
Appendix B: Universe and Stratification of Sample
The chart below shows the breakdown of the universe used for this survey. Since thesample universe represents individual sales from partners that supplied the data, D&RInternational cannot disclose the actual numbers, the period over which the data was drawn,or the detailed breakdown of the sample. This discretion is necessary to protect theconfidentiality of the information. However, the following tables show major strata ratios.The numbers outside parenthesis show the breakdown of the states within the ENERGYSTAR or non-qualifying strata. The numbers in parenthesis show the breakdown within astate of vs. non-qualifying products.
Distribution of Universe by ENERGY STAR qualification and StateArizona California Florida Massachusetts Texas TOTAL
5%
(14%)
58%
(16%)
13%
(11%)
6%
(10%)
18%
(12%)
100%
Non-Qualifying 5%
(86%)
47%
(84%)
18%
(89%)
9%
(90%)
21%
(88%)
100%
TOTAL (100%) (100%) (100%) (100%) (100%)
Distribution of Universe by ENERGY STAR qualification and ProductAirConditioner
ClothesWasher
Dishwasher Refrigerator TOTAL
6%
(9%)
3%
(2%)
5%
(5%)
86%
(26%)
100%
Non-Qualifying 10%
(91%)
34%
(98%)
15%
(95%)
41%
(74%)
100%
TOTAL (100%) (100%) (100%) (100%)
The charts below show the breakdown of the sample.
Stratification of sample by ENERGY STAR qualification of purchase
Strata Number Percent
2,188 56
Non-Qualified 2,812 44
Total 5,000 100.0
1998 Home Appliance Buying Trends Survey Final Report
Page 13 of 26
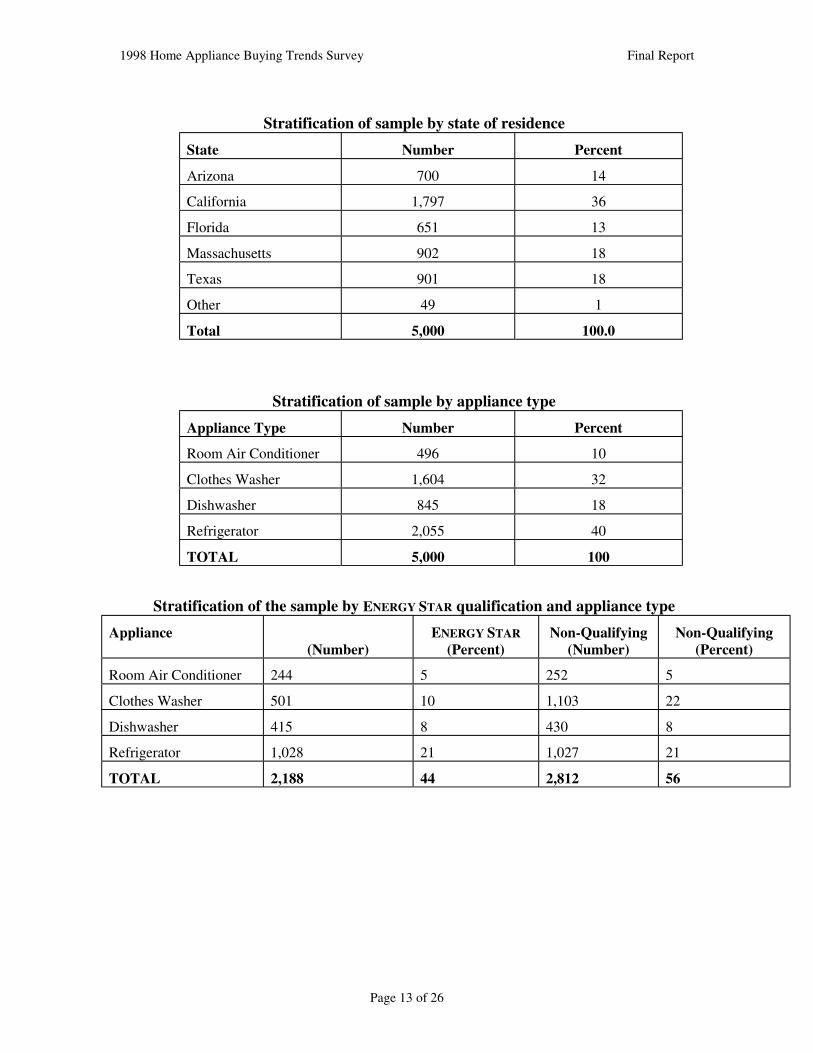
Stratification of sample by state of residence
State Number Percent
Arizona 700 14
California 1,797 36
Florida 651 13
Massachusetts 902 18
Texas 901 18
Other 49 1
Total 5,000 100.0
Stratification of sample by appliance type
Appliance Type Number Percent
Room Air Conditioner 496 10
Clothes Washer 1,604 32
Dishwasher 845 18
Refrigerator 2,055 40
TOTAL 5,000 100
Stratification of the sample by ENERGY STAR qualification and appliance type
Appliance(Number)
ENERGY STAR(Percent)
Non-Qualifying(Number)
Non-Qualifying(Percent)
Room Air Conditioner 244 5 252 5
Clothes Washer 501 10 1,103 22
Dishwasher 415 8 430 8
Refrigerator 1,028 21 1,027 21
TOTAL 2,188 44 2,812 56
1998 Home Appliance Buying Trends Survey Final Report
Page 14 of 26
Appendix C: Weighting and Statistical Significance
Some of the results of this study are cited in terms of the percentage of survey respondentsanswering a certain way. This is the actual percentage of the surveys received and may notbe representative of the population at large. For certain questions, we are interested in theactual breakdown of our survey respondents, particularly when comparing one groupagainst another. But if we are interested in representing all appliance buyers, not just thosefrom a particular cross section, we need to weight the responses in order to more accuratelyrepresent the complete population.
Our sample has been selected to disproportionately represent certain groups – that is,purchasers of appliances, purchasers of h-axis clothes washers, and each state. This isnecessary to ensure enough responses from each group to enable comparison across thedifferent cross sections. But it does mean that the sample is no longer random, and taken asa whole, does not accurately represent the complete population. To correct this, we useweighting.
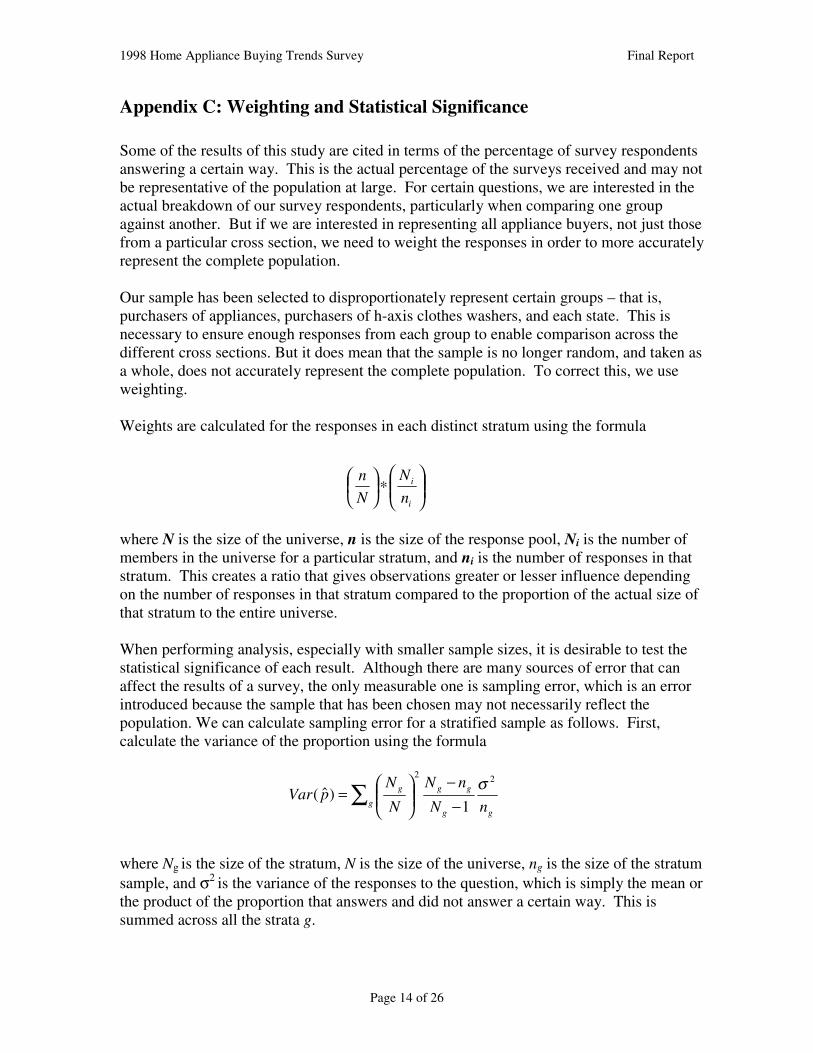
Weights are calculated for the responses in each distinct stratum using the formula
where N is the size of the universe, n is the size of the response pool, Ni is the number ofmembers in the universe for a particular stratum, and ni is the number of responses in thatstratum. This creates a ratio that gives observations greater or lesser influence dependingon the number of responses in that stratum compared to the proportion of the actual size ofthat stratum to the entire universe.
When performing analysis, especially with smaller sample sizes, it is desirable to test thestatistical significance of each result. Although there are many sources of error that canaffect the results of a survey, the only measurable one is sampling error, which is an errorintroduced because the sample that has been chosen may not necessarily reflect thepopulation. We can calculate sampling error for a stratified sample as follows. First,calculate the variance of the proportion using the formula
where Ng is the size of the stratum, N is the size of the universe, ng is the size of the stratumsample, and σ2 is the variance of the responses to the question, which is simply the mean orthe product of the proportion that answers and did not answer a certain way. This issummed across all the strata g.
∗
i
i
n
N
N
n
∑ −−
=
ggg
ggg
nN
nN
N
NpVar
22
1)ˆ(
σ
1998 Home Appliance Buying Trends Survey Final Report
Page 15 of 26
The standard error is the square root of the variance. At a 90% confidence level, the truevalue lies within plus or minus 1.6 times the standard error. On the tabular analysis, theconfidence intervals provided are calculated for each question based on a 90% confidencelevel.
Other sources of error, which are not directly measurable, are non-response and self-selection bias. This means that the group that responds to the survey may have differentcharacteristics than the group that did not. This type of error is difficult to measure, sinceby definition we don’t know what the characteristics of the non-responding group might be.In the case of this survey, one of our long-term goals is to compare the present resultsagainst results from a future survey to measure changes due to the continuedimplementation of the ENERGY STAR program. For these purposes, non-response bias isless significant because we would assume that respondents to successive surveys wouldhave similar characteristics, thus making the comparison valid.
1998 Home Appliance Buying Trends Survey Final Report
Page 16 of 26
Appendix D: Survey Materials
Below are reproductions of the survey materials. A copy of the actual materials in theiroriginal format is included with this report. To obtain a reproduction of the surveymaterials, please contact Jennifer Fitzgerald at D&R International Ltd., 301-588-9387.
The survey instrument itself was booklet made of two sheets of ivory 11 x 17 paper, staplebound to create a small, eight-page (including front and back cover) booklet.

1998 Home Appliance Buying Trends Survey Final Report
Page 17 of 26
Survey Booklet Cover
1998 Home Appliance Buying Trends Survey
Conducted by D&R International, Ltd.On Behalf Of Pacific Northwest National Laboratory

1998 Home Appliance Buying Trends Survey Final Report
Page 18 of 26
Survey Booklet Page 1
1998 Home Appliance Buying Trends Survey Page 1
Please continue to the next page
Instructions: Please read each question below. Check the box next to the response that bestmatches your answer. Whenever a question says check all that apply, please check off each answerthat applies to you. We have no way to identify individual responses to this survey - your response iscompletely anonymous.
1. Have you purchased a new clothes washer, refrigerator, window-unit air conditioner or dishwasherwithin the last year?
Yes
No If NO, please skip to Question 19, on page 4.
2. What type of appliance did you purchase? If you have purchased more than one of the applianceslisted below in the last year, please answer for the one that you purchased most recently.
Clothes Washer
Refrigerator
Air Conditioner
Dishwasher
Please answer the following questions for this particular appliance.
3. Why did you purchase this new appliance? Please check only one.
Old one broke down
Moved into new house
Remodeled
Needed bigger/better model
Didn’t previously own one
Other: why? ____________________
4. When did you buy this appliance? If you don’t remember exactly when, please make your bestguess.
May 1997 September 1997 January 1998
June 1997 October 1997 February 1998
July 1997 November 1997 March 1998
August 1997 December 1997 April 1998

1998 Home Appliance Buying Trends Survey Final Report
Page 19 of 26
Survey Booklet Page 2
Page 2 1998 Home Appliance Buying Trends Survey
Please continue to the next page
5. What sources did you use to help decide which make and model to buy? Please check all that apply.
Friends/word of mouth In-store materials (brochures, etc.)
Salesperson Consumer Reports
Internet/World Wide Web Reputation of brand/manufacturer
Other sources: what? ________________________________________________________
6. What was important to you when deciding upon a make and model? Below is a list of factors whichmight have influenced your decision to buy the particular model you chose. Please rate the importance ofeach factor by circling a number from 1 to 4, where 1 is extremely important and 4 is not at all important.
ExtremelyImportant
←→ Not At AllImportant
Price 1 2 3 4Brand 1 2 3 4Color 1 2 3 4Size 1 2 3 4Energy efficiency 1 2 3 4Premium features 1 2 3 4Cash-back rebate 1 2 3 4Warranty 1 2 3 4Other:what?_____________________
1 2 3 4
9. Did a salesperson explain the long-term costs of owning an appliance due to its energy use?
Yes
No
7. Did you look at the yellow EnergyGuide label, like the one pictured here?
Yes, briefly
Yes, carefully
No
If YES: 8. Did you use the information on thislabel to compare different models?
Yes
No
Don’t know
1998 Home Appliance Buying Trends Survey Final Report
Page 20 of 26
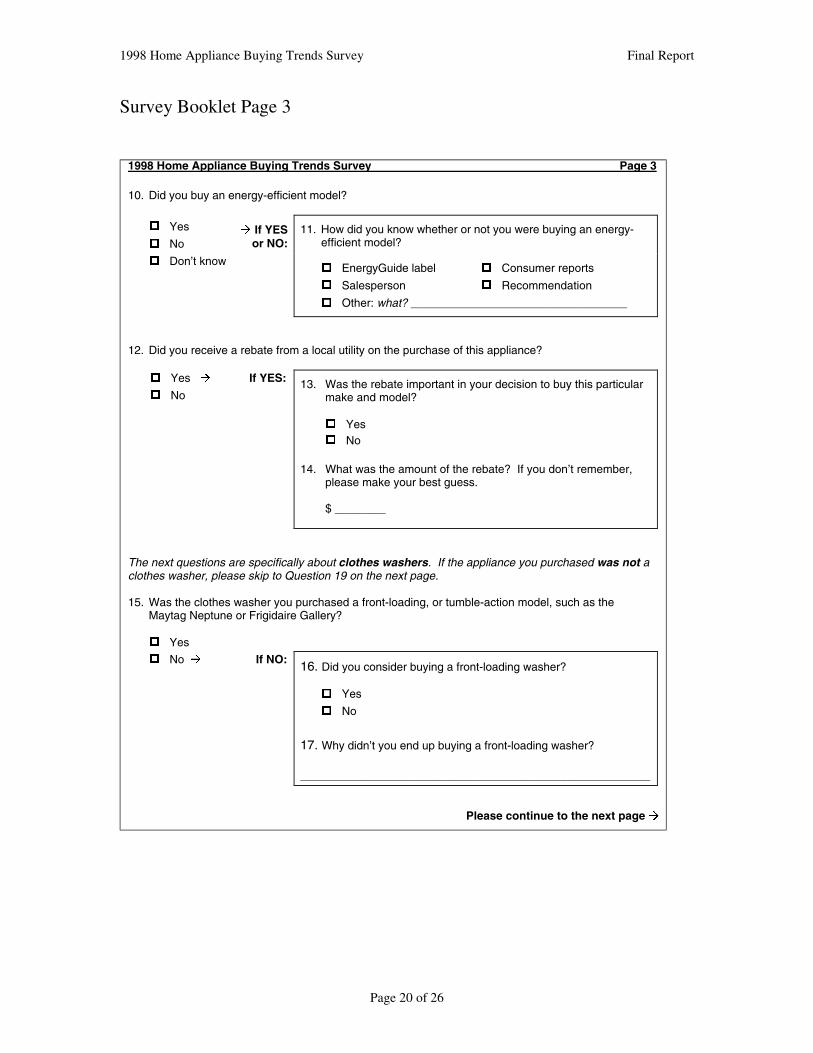
Survey Booklet Page 3
1998 Home Appliance Buying Trends Survey Page 3
Please continue to the next page
10. Did you buy an energy-efficient model?
Yes
No If YESor NO:
11. How did you know whether or not you were buying an energy-efficient model?
Don’t knowEnergyGuide label Consumer reports
Salesperson Recommendation
Other: what? __________________________________
12. Did you receive a rebate from a local utility on the purchase of this appliance?
Yes If YES:
No13. Was the rebate important in your decision to buy this particular
make and model?
YesNo
14. What was the amount of the rebate? If you don’t remember,please make your best guess.
$ ________
The next questions are specifically about clothes washers. If the appliance you purchased was not aclothes washer, please skip to Question 19 on the next page.
15. Was the clothes washer you purchased a front-loading, or tumble-action model, such as theMaytag Neptune or Frigidaire Gallery?
Yes
No If NO: 16. Did you consider buying a front-loading washer?
Yes
No
17. Why didn’t you end up buying a front-loading washer?
_______________________________________________________

1998 Home Appliance Buying Trends Survey Final Report
Page 21 of 26
Survey Booklet Page 4
Page 4 1998 Home Appliance Buying Trends Survey
Please continue to the next page
18. If you bought a front-loading washer: Why did you decide to buy one? Below is a list of factorswhich might have influenced your decision to buy a front-loading clothes washer. Please rate the importanceof each factor by circling a number from 1 to 4, where 1 is extremely important and 4 is not at all important.
ExtremelyImportant
←→ Not At AllImportant
Cleans clothes better 1 2 3 4
Large capacity 1 2 3 4
Uses less water 1 2 3 4
Uses less energy 1 2 3 4
Saves on utility bills 1 2 3 4
Good for the environment 1 2 3 4
Other: what?_________________________ 1 2 3 4
Please answer the next questions whether you purchased an appliance or not.
21. What does this logo mean to you?
___________________________________________________________________________________
___________________________________________________________________________________
19. Below is an image of the “ENERGY STAR” logo. Have you ever seen this logo before?
Yes If YES:
No
20. Where have you seen it? Please check all that apply.
Computer monitors
TV advertisement
Newspaper or magazine advertisement
Newspaper or magazine article
Power company bill stuffers
Other publications: what? _____________________
On products in showrooms
Internet/World Wide Web
Some other place: where? ____________________
1998 Home Appliance Buying Trends Survey Final Report
Page 22 of 26
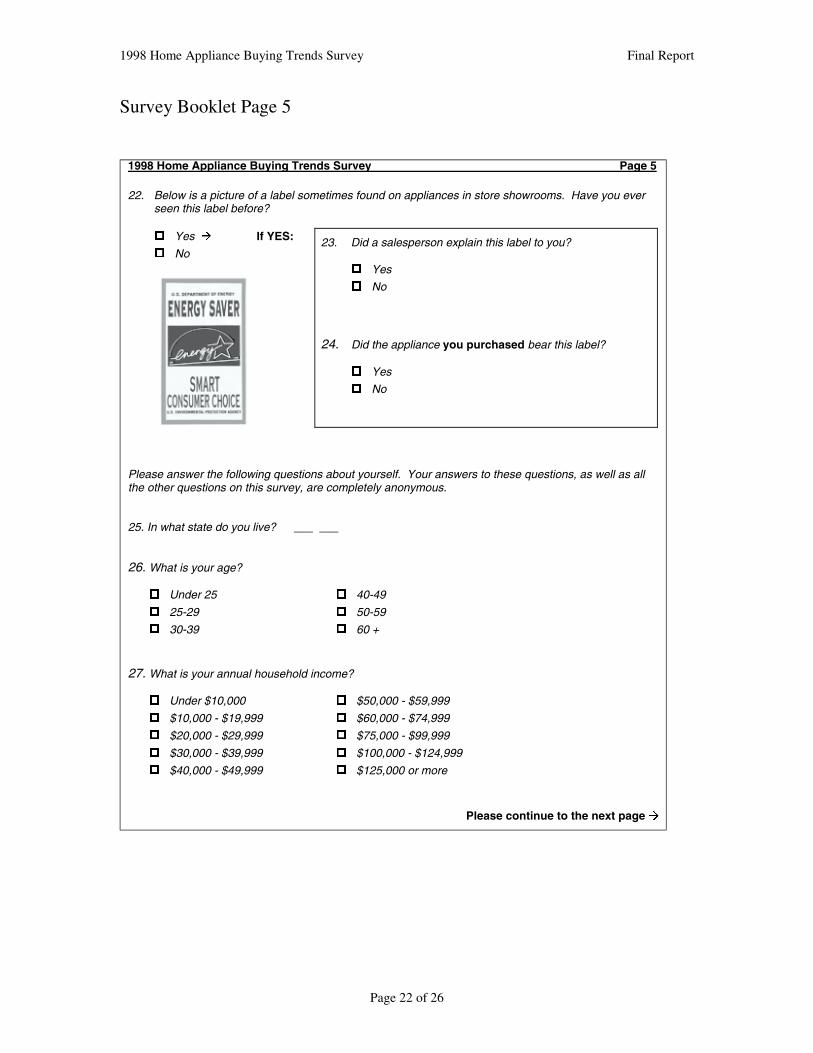
Survey Booklet Page 5
1998 Home Appliance Buying Trends Survey Page 5
Please continue to the next page
Please answer the following questions about yourself. Your answers to these questions, as well as allthe other questions on this survey, are completely anonymous.
25. In what state do you live? ___ ___
26. What is your age?
Under 25 40-49
25-29 50-59
30-39 60 +
27. What is your annual household income?
Under $10,000 $50,000 - $59,999
$10,000 - $19,999 $60,000 - $74,999
$20,000 - $29,999 $75,000 - $99,999
$30,000 - $39,999 $100,000 - $124,999
$40,000 - $49,999 $125,000 or more
22. Below is a picture of a label sometimes found on appliances in store showrooms. Have you everseen this label before?
Yes If YES:
No
23. Did a salesperson explain this label to you?
Yes
No
24. Did the appliance you purchased bear this label?
Yes
No
1998 Home Appliance Buying Trends Survey Final Report
Page 23 of 26
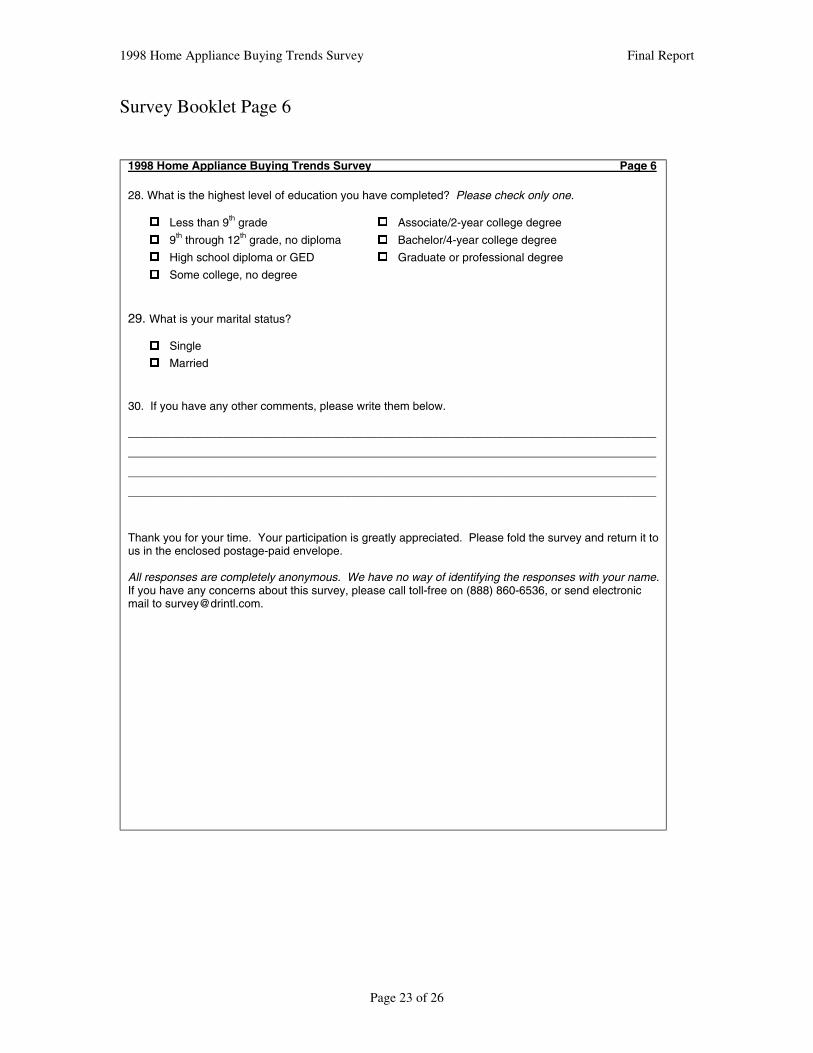
Survey Booklet Page 6
1998 Home Appliance Buying Trends Survey Page 6
28. What is the highest level of education you have completed? Please check only one.
Less than 9th grade Associate/2-year college degree
9th through 12th grade, no diploma Bachelor/4-year college degree
High school diploma or GED Graduate or professional degree
Some college, no degree
29. What is your marital status?
Single
Married
30. If you have any other comments, please write them below.
___________________________________________________________________________________
___________________________________________________________________________________
___________________________________________________________________________________
___________________________________________________________________________________
Thank you for your time. Your participation is greatly appreciated. Please fold the survey and return it tous in the enclosed postage-paid envelope.
All responses are completely anonymous. We have no way of identifying the responses with your name.If you have any concerns about this survey, please call toll-free on (888) 860-6536, or send electronicmail to [email protected].
1998 Home Appliance Buying Trends Survey Final Report
Page 24 of 26
Survey Cover Letter

1998 Home Appliance Buying Trends Survey Final Report
Page 25 of 26
Return Envelope

1998 Home Appliance Buying Trends Survey Final Report
Page 26 of 26
Appendix E: Raw Tabulations
The following section contains the raw results from the survey. There are four sections:
- All Tabulations (Unweighted)- All Tabulations (Weighted)- ENERGY STAR purchasers only- Non-ENERGY STAR purchasers only
The second section contains confidence intervals at 90% confidence for the responses toeach question. Certain questions, such as demographics, were not weighted, since they aremost interesting in how they distinguish the respondents from the qualified versus non-qualified strata.