Modelling of fuel fragmentation, relocation and dispersal during Loss-of-Coolant Accident in Light
Upload
edward-keeCategory
view
114download
2
~- ~ -~ ~- -~ _ ~ ~ ~ ~ -
~~ ~~
CONTRACTOR REPORT SAND964957 Unlimited Re lease UC-502
Site Restoration: Estimation of Attributable Costs From Plutonium-Dispersal Accidents
David I. Chanin, Walter B. Murfin Technadyne Engineering Consultants, Inc. 8500 Menual Blvd. N.E. Albuquerque, NM 871 12
Prepared by Sandia National Laboratories Albuquerque, New Mexico 87185 and Livermore, California 94550 for the United States Department of Energy under Contract DE-AG04-94AL85000
Approved for public release; distribution is unlimited.
Printed May 1996

Issued by Sandia National Laboratories, operated for the United States Department of Energy by Sandia Corporation. NOTICE: This report was prepared as an account of work sponsored by an agency of the United States Government. Neither the United States Govern- ment nor any agency thereof, nor any of their employees, nor any of their contractors, subcontractors, or their employees, makes any warranty, express or implied, or assumes any legal liablity or responsibility for the accuracy, completeness, or usefulness of any information, apparatus, prod- uct, or process disclosed, or represents that its use would not infringe pri- vately owned rights. Reference herein to any specific commercial product, prwess, or service by trade name, trademark, manufacturer, or otherwise, does not necessarily constitute or imply its endorsement, recommendation, or favoring by the United States Government, any agency thereof or any of their contractors or subcontractors. The views and opinions expressed herein do not necessarily state or reflect those of the United States Govern- ment, any agency thereof or any of their contractors.
Printed in the United States of America. This report has been reproduced directly from the best available copy.
Available to DOE and DOE contractors from office of Scientific and Technical Information PO Box 62 Oak Ridge, TN 37831
Prices available from (615) 576-8401, FTS 626-8401
Available to the public from National Technical Information Service US Department of Commerce 5285 Port Royal RD Springfield, VA 22161
NTIS price codes Printed copy: A l l Microfiche copy: A01

Site Restoration: Estimation of Attributable Costs From Plutonium-Dispersal Accidents
David I. Chanin Walter B. Murfh
Technadyne Engineering Consultants, Inc. Albuquerque, NM
Contractor Report
Sandia Contract No. AN-2239B
Prepared For
Transportation Systems Analysis Department Sandia National Laboratories
Albuquerque, NM
ABSTRACT
A nuclear weapons accident is an extremely unlikely event due to the extensive care taken in operations. However, under some hypothetical accident conditions, plutonium might be dispersed to the environment. This would result in costs being incurred by the government to remediate the site and compensate for losses. This study is a multi-disciplinary evaluation of the potential scope of the post-accident response that includes technical factors, current and proposed legal requirements and constraints, as well as sociaUpolitical factors that could influence decisionmaking. The study provides parameters that can be used to assess economic costs for accidents postulated to occur in urban areas, Midwest farmland, Western rangeland, and forest. Per-area remediation costs have been estimated, using industry-standard methods, for both expedited and extended remediation. Expedited remediation costs have been evaluated for highways, airports, and urban areas. Extended remediation costs have been evaluated for all land uses except highways and airports. The inclusion of cost estimates in risk assessments, together with the conventional estimation of doses and health effects, allows a fuller understanding of the post-accident environment. The insights obtained can be used to minimize economic risks by evaluation of operational and design alternatives, and through development of improved capabilities for accident response.
Acknowledgements Special thanks are owed to Norm Grandjean (Sandia National Laboratories) who played an instrumental role throughout this project, serving as project manager for the initial stages, and assuring the continuation of funding necessary for its completion. In addition, the critical comments of Robert E. Luna (Sandia National Laboratories) on the initial draft of this report resulted in a change of focus which greatly enhanced its quality.
Over the course of this effort several organizations at Sandia National Laboratories provided funding and technical leadership. Heartfelt thanks are owed to David Carlson, Laura Gilliom, Richard E. Smith, and Richard Yoshimura of Sandia National Laboratories for sponsoring the research and its publication, and Sieglinde Neuhauser for providing technical leadership.
Thanks are extended to the staff of the Sandia National Laboratories Technical Library, notably Julie Kesti, Connie Souza, and Glenda Sweatt. Other Sandia staff who gave freely of their expertise in responding to inquiries were Len Connell, Louis Restrepo, and Jerry Sprung.
Appreciation is extended to all those who responded to telephone inquiries. If any have been inadvertently omitted, it is partly because so many individuals contributed valuable information.
Thanks to Fred Gibson (Gibson Trucking), Pat Melloy (Melloy Mobile Storage), Wayne Hanson (independent consultant), Tom Longo (DOUEM), Bob Ostmeyer (DOWRF), Jake Chavez (DOEIAL), Jeff Fickney (DOE/AL), Lee Stevens (DOEIEM), and Andy Wallo (DOUEM), Chuck Hall, Steve Homan, David Layton, Dong Nguyen, Joe Shinn, and Tore Straume (Lawrence Livermore National Laboratory), Lt. John Crapo (Armed Forces Radiobiology Research Institute), Kent Parker (Envirocare of Utah), Bruce Napier and Dennis Strenge (Pacific Northwest Laboratory), Dave Ericson (Ogden Environmental), Maj. David Kramer (HeadquarterdDefense Nuclear Agency) and Maj. Joseph Kimbrell (Field Command/Defense Nuclear Agency), Bruce Boecker, Bill Griffith and Bobby Scott (Inhalation and Toxicology Research Institute), Terry Foppe (M.H. Chew Associates), Vern Peterson (Rocky Flats Plant), Barbara Deshler (IT Corporation, Las Vegas, NV) and Roger Hansen (IT Corporation, Englewood, CO), Nels Johnson (TMA Eberline), Steve Fisher (Oak Ridge National Laboratory), Arlen Schade (Westinghouse Hanford Company), Bill Inkret and George Voelz (Los Alamos National Laboratory), Casper Sun (Brookhaven National Laboratory), Bill Fuller (PLG), Jack Tawil (Research Enterprises), and Dr. Charles Eddington (National Academy of Sciences).
Appreciation is extended to the following Environmental Protection Agency staff Mike Boyd, Gordon Burley, Craig Conklin, Stephen Dean (San Francisco, CA), Allan Richardson, Phil Nieberg, Paolo Pascetta (Montclair, NJ), Peter Tsirigotis, and Stuart Walker.
This report benefitted from reviews provided by Becky Krauss and Sieglinde Neuhauser of Sandia National Laboratories.
.. 11
Contents List of Tables . . . . . . . . . . . . . . . . . . . . . . . . . . . . . . . . . . . . . . . . . . . . . . . . . . . . . . vi
Executive Summary . . . . . . . . . . . . . . . . . . . . . . . . . . . . . . . . . . . . . . . . . . . . . . . . . vii
Glossary of Acronyms . . . . . . . . . . . . . . . . . . . . . . . . . . . . . . . . . . . . . . . . . . . . . . . xv
Conversion Factors and Abbreviations for Units of Measure ..................... xvii
1.0 Introduction. . . . . . . . . . . . . . . . . . . . . . . . . . . . . . . . . . . . . . . . . . . . . . . . . . . 1-1
2.0 Assessment Methodology . . . . . . . . . . . . . . . . . . . . . . . . . . . . . . . . . . . . . . . . . 2-1 Potential Extent of Contamination . . . . . . . . . . . . . . . . . . . . . . . . . . . . . 2-1 Likelihood of Occurrence . . . . . . . . . . . . . . . . . . . . . . . . . . . . . . . . . . . 2-2
2.3 Exposure Pathways . . . . . . . . . . . . . . . . . . . . . . . . . . . . . . . . . . . . . . . 2-3 Criteria For Acceptable Exposures . . . . . . . . . . . . . . . . . . . . . . . . . . . . . 2-4
2.5 Attributable Costs . . . . . . . . . . . . . . . . . . . . . . . . . . . . . . . . . . . . . . . . 2-5 2.6 DOE Accidents Versus DoD Accidents . . . . . . . . . . . . . . . . . . . . . . . . . 2-6 2.7 Degree of Protectiveness . . . . . . . . . . . . . . . . . . . . . . . . . . . . . . . . . . . 2-6 2.8 Price-Anderson Indemnity Limit . . . . . . . . . . . . . . . . . . . . . . . . . . . . . 2-8
Applicability of Current Estimates . . . . . . . . . . . . . . . . . . . . . . . . . . . . 2-10
2.1 2.2
2.4
2.9
3.4 3.5 3.6 3.7
3.0 Pertinent Federal Laws. Regulations. and Procedures . . . . . . . . . . . . . . . . . . . . . . 3-1 Robert T . Stafford Disaster Relief Act . . . . . . . . . . . . . . . . . . . . . . . . . . 3-1
3.2 Price-Anderson Amendments to the Atomic Energy Act . . . . . . . . . . . . . 3-2
Act (CERCLA) . . . . . . . . . . . . . . . . . . . . . . . . . . . . . . . . . . . . . . . . . . 3-3 3.3.1 Historical Background . . . . . . . . . . . . . . . . . . . . . . . . . . . . . . . . 3-3 3.3.2 Enforcement Responsibilities . . . . . . . . . . . . . . . . . . . . . . . . . . . . 3-5 National Environmental Policy Act (NEPA) . . . . . . . . . . . . . . . . . . . . . . 3-6 Responsibilities of Multiple Government Agencies . . . . . . . . . . . . . . . . . 3-8 Impacts of the Need for Concurrence .......................... 3-10 Issues That Could Influence Decisionmaking . . . . . . . . . . . . . . . . . . . . 3-10
3.1
3.3 Comprehensive Environmental Restoration. Compensation. and Liability
4.0 Overview of CERCLA Requirements ................................. 4-1 Short-Term "Removal Actions" . . . . . . . . . . . . . . . . . . . . . . . . . . . . . . . 4-2
4.2 Site Evaluation . . . . . . . . . . . . . . . . . . . . . . . . . . . . . . . . . . . . . . . . . . 4-2 4.3 Applicable or Relevant and Appropriate Requirements (ARARs) . . . . . . . 4-3
CERCLNNEPA Record of Decision (ROD) ...................... 4-5
4.1
4.4 Remedial Investigation/Feasibility Study (RWS) and Proposed Plan . . . . . 4-4 4.5 4.6 Remedial DesigdRisk Assessment (RDRA) ...................... 4-5 4.7 Time and Cost Requirements for CERCLANEPA Compliance . . . . . . . . 4-6
... 111

5.0 Timeline of Post-accident Actions . . . . . . . . . . . . . . . . . . . . . . . . . . . . . . . . . . . 5-1 5.1 Emergency Actions . . . . . . . . . . . . . . . . . . . . . . . . . . . . . . . . . . . . . . . 5-1 5.2 Detailed Characterization ................................... 5-5 5.3 Decontamination . . . . . . . . . . . . . . . . . . . . . . . . . . . . . . . . . . . . . . . . . 5-6
5.3.1 Light-Contamination Urban Areas ........................ 5-9 5.3.2 Moderate-Contamination Urban Areas ..................... 5-9 5.3.3 Heavy-Contamination Urban Areas . . . . . . . . . . . . . . . . . . . . . . 5-10 5.3.4 Highways and Runways . . . . . . . . . . . . . . . . . . . . . . . . . . . . . . 5-10
5.4 WasteDisposal . . . . . . . . . . . . . . . . . . . . . . . . . . . . . . . . . . . . . . . . . 5-11 5.5 Ecological Restoration . . . . . . . . . . . . . . . . . . . . . . . . . . . . . . . . . . . . 5-13
6.0 Integration of Cost Estimates . . . . . . . . . . . . . . . . . . . . . . . . . . . . . . . . . . . . . . . 6-1 6.1 Simplifying Assumptions in Cost Estimates ...................... 6-2 6.2 Cost Estimates for Extended Remediation of Farmland and Urban Land . . 6-4 6.3 Cost Estimates for Expedited Decontamination .................... 6-5 6.4 Parameter Values Derived for Risk Assessments . . . . . . . . . . . . . . . . . . . 6-6 6.5 Sources of Uncertainty in Cost Calculations . . . . . . . . . . . . . . . . . . . . . . 6-6
7.0 Conclusion . . . . . . . . . . . . . . . . . . . . . . . . . . . . . . . . . . . . . . . . . . . . . . . . . . . 7-1
Appendix A Case Studies of Cleanup Criteria. Methods. and Costs
A.l Palomares. Spain . . . . . . . . . . . . . . . . . . . . . . . . . . . . . . . . . . . . . . . . . A-1 A.2 Thule. Greenland . . . . . . . . . . . . . . . . . . . . . . . . . . . . . . . . . . . . . . . . . A-2 A.3 Enewetak Atoll . . . . . . . . . . . . . . . . . . . . . . . . . . . . . . . . . . . . . . . . . . A-3 A.4 Johnston Island . . . . . . . . . . . . . . . . . . . . . . . . . . . . . . . . . . . . . . . . . . A-4 A S BOMARC Missile Site. McGuire AFB . . . . . . . . . . . . . . . . . . . . . . . . . A-5 A.6 Montclair-East Orange. NJ Radium Soil Site . . . . . . . . . . . . . . . . . . . . A-7 A.7 Fernald Plant . . . . . . . . . . . . . . . . . . . . . . . . . . . . . . . . . . . . . . . . . . . A-8
B . 2
B.3 B . 4
Appendix B Criteria for Cleanup . . . . . . . . . . . . . . . . . . . . . . . . . . . . . . . . . . . . . . . . . . . . . . . . . B-1
B.1 Historical Criteria . . . . . . . . . . . . . . . . . . . . . . . . . . . . . . . . . . . . . . . . B-1 B.l. 1 Colorado Construction Standard . . . . . . . . . . . . . . . . . . . . . . . . . B-1 B.1.2 1977 EPA Screening Level . . . . . . . . . . . . . . . . . . . . . . . . . . . . B-1 Current Rulemakings on Residual Material . . . . . . . . . . . . . . . . . . . . . . . B-3 B.2.1 EPA’s Proposals for 40 CFR Parts 195 and 196 . . . . . . . . . . . . . B-4 B.2.2 NRC’s Notice of Intent to Revise 10 CFR 20 . . . . . . . . . . . . . . . . B-5 EPA Protective Action Guides (PAGs) . . . . . . . . . . . . . . . . . . . . . . . . . . B-7 Influence of SocialPolitical Factors . . . . . . . . . . . . . . . . . . . . . . . . . . . . B-8
iv
Appendix C Exposure Pathways for Plutonium . . . . . . . . . . . . . . . . . . . . . . . . . . . . . . . . . . . . . . . C-1
Appendix D Isotopic Mix of Weapons Grade Plutonium ................................. D-1
Appendix E Survey of Literature on Decontamination . . . . . . . . . . . . . . . . . . . . . . . . . . . . . . . . . . E-1
Appendix F Technical Basis of Cost Estimates . . . . . . . . . . . . . . . . . . . . . . . . . . . . . . . . . . . . . . . F-1
F.l Data Sources and Uncertainty in Cost Estimates . . . . . . . . . . . . . . . . . . . F-1 F.2 Emergency Actions . . . . . . . . . . . . . . . . . . . . . . . . . . . . . . . . . . . . . . . F-3 F.3 Access Control . . . . . . . . . . . . . . . . . . . . . . . . . . . . . . . . . . . . . . . . . . F-6 F.4 Radiologic Characterization and Certification . . . . . . . . . . . . . . . . . . . . . F-6 F.5 Lost Income and Personal Property ............................ F-7 F.6 Decontamination . . . . . . . . . . . . . . . . . . . . . . . . . . . . . . . . . . . . . . . . . F-9
F.6.1 Expedited Decontamination of Mixed-Use Urban Areas . . . . . . . . F-10 F.6.2 Expedited Decontamination of Highways . . . . . . . . . . . . . . . . . . F- 19 F.6.3 Strategies For Extended Remediation under CERCLA . . . . . . . . . F-20
F.7 Waste Disposal . . . . . . . . . . . . . . . . . . . . . . . . . . . . . . . . . . . . . . . . . F-23 F.7.1 On-Site Disposal . . . . . . . . . . . . . . . . . . . . . . . . . . . . . . . . . . . F-23 F.7.2 Off-Site Disposal . . . . . . . . . . . . . . . . . . . . . . . . . . . . . . . . . . F-24 F.7.3 Volume Reduction . . . . . . . . . . . . . . . . . . . . . . . . . . . . . . . . . F-25
F.8 Cost Estimate Results . . . . . . . . . . . . . . . . . . . . . . . . . . . . . . . . . . . . F-25 F.8.1 Expedited Remediation . . . . . . . . . . . . . . . . . . . . . . . . . . . . . . F-25 F.8.2 Extended Remediation under CERCLA . . . . . . . . . . . . . . . . . . F-28
F.9 Construction Cost Indexes and Inflators . . . . . . . . . . . . . . . . . . . . . . . . F-32
Appendix G Cost Calculation Spreadsheets . . . . . . . . . . . . . . . . . . . . . . . . . . . . . . . . . . . . . . . . . . G- 1
Appendix H Historical Experience Regarding Medical Costs . . . . . . . . . . . . . . . . . . . . . . . . . . . . . . H- 1
Bibliography . . . . . . . . . . . . . . . . . . . . . . . . . . . . . . . . . . . . . . . . . . . . . . . . . . . . Bib- 1
V

List of Tables
Table 6-1
Table 6-2
Cleanup Costs For Two Land Uses and Two Waste Disposal Option? . . . 6-4
Cleanup Costs for Expedited Decontamination of Urban Areas . . . . . . . . . 6-5
Table C-1 Six Widely Cited Models for Resuspension Factor-W(t) . . . . . . . . . . . . . C-8
Table C-2 First-Year Average Resuspension Factor (RF... ) and Dose Using Various Models . . . . . . . . . . . . . . . . . . . . . . . . . . . . . . . . . . . . . . . . . . . . . . . . C-8
Isotopic Composition of RFP Product According .. EIS . . . . . . . . . . . . . D-2 Table D-1
Table D-2
Table F- 1
Pu:Am Ratio As a Function of Time Since Manufacture . . . . . . . . . . . . . D-3
Typical Urban Land-Usage Fractions . . . . . . . . . . . . . . . . . . . . . . . . . . F- 11
Table F-2 Light Decontamination Operations for Residences . . . . . . . . . . . . . . . . . F- 15
Table F-3 Light Decontamination Operations for Commercial and Industrial Areas . F-16
Table F-4 Expedited Remediation of Lightly Contaminated Mixed-Use Urban Areas F-26
Table F-5 Expedited Remediation of Moderately Contaminated Mixed-Use Urban Areas . . . . . . . . . . . . . . . . . . . . . . . . . . . . . . . . . . . . . . . . . . . . . . . . F-26
Table F-6 Expedited Remediation of Heavily Contaminated Mixed-Use Urban Areas . . . . . . . . . . . . . . . . . . . . . . . . . . . . . . . . . . . . . . . . . . . . . . . . F-26
Table F-7 Extended Decontamination of Midwest Farmlands . . . . . . . . . . . . . . . . . F-29
Table F-8 Extended Decontamination of Western Rangeland . . . . . . . . . . . . . . . . . F-30
Table F-9 Costs for Remediating Plutonium-Contaminated Forests with On-Site Waste Disposal . . . . . . . . . . . . . . . . . . . . . . . . . . . . . . . . . . . . . . . . . F-31
vi
Executive Summary A nuclear weapons accident is an extremely unlikely event due to the extensive care taken during weapons operations. Over the past decades, safety provisions in the nuclear weapons program have been made more stringent, and a large number of safety related changes have been made to the stockpile. As a result, the risk of an accident has been successively reduced. Nevertheless, if a nuclear weapon became involved in an accident, radioactive materials might be dispersed to the environment as a result of fixe or the non-nuclear detonation of high explosive. Such accidents are routinely analyzed for the purpose of minimizing the risks of operations.
In the event of such an accident, the principal radioactive material of concern is plutonium. Conventional practice in assessing the consequences of such accidents focuses on the estimation of radiation doses to maximally exposed individuals, and radiation-induced cancers among the surrounding populace. It is common practice to consider only a single exposure pathway in such analyses, namely, direct inhalation of particulates in the cloud or plume of dispersed material.
After passage of the cloud, inhalation of deposited material resuspended by wind or mechanical disturbances, and ingestion of contaminated food are likely to become the dominant exposure pathways. In order to protect the populace from the potential hazards, remediation of the site or long-term interdiction might be required.
For some accident scenarios, publicly available information discussed in this report suggests that an area of a few square kilometers might be contaminated to a level requiring intervention. In such an event, the magnitude and phenomenology of the release, the associated meteorological conditions, and the selected cleanup criterion would all serve to determine the size of the affected area, detailed estimates for which are outside the scope of this report.
Almost all of the prior U.S. work on the costs associated with potential nuclear accidents has focused on technical considerations such as the costs and effectiveness of various decontamination operations. In contrast, the present study is based on the premise that technical operations need to be considered within the context of the legal and social/political environment surrounding an accident and its site of contamination. In assessing accident costs, we believe it is necessary to consider both the action-forcing requirements of Federal law, as well as the potential legal impediments to prompt action.
A major reason for considering technical factors within the context of the post-accident legal environment is that decontamination becomes progressively less effective with increased time of standing. This fact is amply demonstrated in our survey of literature on decontamination, which is presented in Appendix E. A crucial parameter in remediation is, therefore, the time between the occurrence of an accident and the initiation of decontamination activities.
vii
The duration of time that might elapse before decontamination is highly uncertain; historical evidence presented in Appendix A suggests that it could be as long as decades for areas of low population density. If delayed that long, the effective decontamination of populated areas could be problematic, and might entail the demolition of some or all structures. Other current factors disfavoring prompt remediation are the lack of Federal plans for expedited cleanups of populated areas in the event of a nuclear accident, and the legal requirements for detailed study (with public participation in decisionmaking), in advance of remediation activities.
The approach taken in this report was to focus on the directly attributable costs' that might be faced by the government in compensating property owners for loss or damage and in restoring an accident site. The impact of the current environmental laws on attributable costs is discussed in the report. The governing laws affect the Department of Energy (DOE) and the Department of Defense (DoD) equally. The cost estimates derived could thus be used to assess the costs that either agency might face if weapons-related nuclear material in its custody became involved in an accident culminating in the release of plutonium to the environment.
The costs of such an accident would be depend primarily on local land use, population density, and the size of the affected area, with the size of the affected area depending primarily on the accident conditions and the intervention criteria adopted. Case studies of recent radiation site cleanups (presented in Appendix A) indicate that the criteria for protection of the public could be very stringent.
The 0.2 pCi/m2 screening level for transuranic contamination, originally proposed by the Environmental Protection Agency (EPA) in 1977, appears to represent a useful criterion to estimate the extent of land that might require some type of remedial action, because that, or similar standards, are currently being applied in government cleanups of small areas. However, in the event of an actual accident, current laws and regulations are clear in requiring that a cleanup criterion would need to be selected on a case-by-case basis, considering local factors.
Recent decades have seen a progressive tightening of standards governing radiation exposures. In Appendices A and B we present several case studies illustrating that tightening, and summarize pertinent current rulemakings by the EPA and the Nuclear Regulatory Commission (NRC) to define cleanup standards for radiation sites. These appendices provide evidence of the need to consider sociaVpolitica1 factors as well as legal requirements in the performance of quantitative risk assessments.
The Federal laws given major discussion in this report are the Robert T. Stafford Disaster Relief Act, the Atomic Energy Act, the Comprehensive Environmental Restoration, Compensation, and Liability Act (CERCLA), and the National Environmental Policy Act (NEPA).
Indirect costs have not been addressed. Examples of such are those associated with loss of production capacity, litigation, implementation of operational changes in response to an accident, and societal impacts due to economic multiplier effects; none of which were analyzed.
1
... V l l l
Site restoration activities conducted in accordance with current environmental laws could be very costly and require a long period of time as a result of the involvement of multiple government agencies at both Federal and local levels and the requirements for public participation in the remediation decisionmaking.
However, if a vital facility (for example, an airport or major highway) had to be shut down because of plutonium contamination, a long lapse of time might be detrimental to the national interest. In such cases there are clear provisions for exemptions or waivers from the pertinent environmental laws.
We analyzed two types of response actions: "extended remediation," such as might result from the full application of current environmental laws, and "expedited remediation" of critical facilities such as highways and airport runways and mixed-use urban land. It is conceivable that a combination of these two approaches would be utilized in the event of an accident. For all of the scenarios analyzed, estimates are provided for cleanup effectiveness as well as the cost of performance.
In the absence of an exemption from the NEPA and CERCLA requirements, current law calls for the responsible agency to prepare both an Environmental Impact Statement (for NEPA) and a Remedial InvestigatiordFeasibility Study (for CERCLA) before undertaking remediation of an accident site. These documents describe the remediation alternatives that were considered by the responsible agency, and the proposed course of action. The ultimate decision on a remedial action is usually only made after considering comments on this proposal from the host State and the public. Federal law requires the responsible agency to evaluate potential remedial measures with public participation, even if only Federal land is contaminated.
Under CERCLA, the public has a much greater role in decisionmaking and more access to information than it is afforded under NEPA. CERCLA also gives the host State an important role in remediation decisionmaking that exceeds the formal role of the State under NEPA. But perhaps of greatest importance is the fact that the EPA has legal authority to review and approve all response actions taken by the DOE or DoD at a CERCLA site, and is empowered to take independent actions for protection of the public.
Because of the time required to conduct remediation decisionmaking in accordance with applicable requirements, relocation of some of the surrounding populace might be performed before remediation was initiated. A detailed evaluation of the extent of the contamination would also probably be peiformed before any major decontamination effort could be mounted. These evaluations typically require surveys with sensitive field instruments, supplemented with, and corroborated by, laboratory analyses of environmental samples. A similar evaluation would need to be performed after remediation in order to identify residual hotspots and/or verify cleanup effectivenqss. The costs of these assessments have been estimated.
ix
A review of data on the effectiveness of decontamination techniques (presented in Appendix E) indicates that one reliable approach to remediation of a contaminated site that is not critical to national security would be acquisition of property, demolition of structures, removal of debris, and scraping of surface soil.
Acquisition, demolition, and soil removal might be more costly than the thorough ,cleaning of structures, but it affords the potential of a much greater cleaning effectiveness. The principal base of this conclusion is that the ability of decontamination to remove contaminants decreases rapidly with time if cleanup is delayed for more than a few weeks.
Land use of an affected area might dictate the need for an expedited response. If called for due to national security concerns, there are clear provisions under law whereby an expedited response could be mounted, thus bypassing the CERCLA and NEPA processes.
If the full CERCLA and NEPA decisionmaking processes were followed, historical evidence (presented in Appendix A) suggests that the complete decontamination of the affected area might not be completed for years. After several years without maintenance, most structures would deteriorate to the point that they would not be worth saving, and the effectiveness of decontamination would be doubtful.
Radioactive debris generated during decontamination would require disposal either on-site or at an off-site government or commercial facility. Most of the debris would have such a low level of radioactivity that the legal constraints associated with its transportation and disposal are minimal. However, despite the low radioactivity and potential for causing radiation exposures, the public aversion to plutonium might result in logistical or legal obstacles to the ultimate disposition of the waste material. If this were the case, additional delays could result and this could lead to increased costs.
The full economic liability associated with relocation of populace, compensation for losses, environmental surveys, and remediation of the site would rest with the Federal agency that had custody of the material at the time of the accident.
Costs of extended remediation were estimated for mixed-use urban land, Midwest farmland, arid Western rangeland, and forested areas.’ The types of land uses considered represent the overwhelming majority of the U.S. land area and population. Accident costs were highest for urban areas. Accident costs for Midwest farmland and arid Western rangeland were found to be similar.
Costs were not estimated for very high density urban areas (centers of large cities), coastlines, or wetlands. Nuclear weapons operations scrupulously avoid city centers. Coastal lands or wetlands would require site-specific information outside the scope of this report.
2
X

We estimated the costs of compensation for damaged property and lost income, site characterization, decontamination, demolition, transportation, waste disposal, and ecological restoration by developing conceptual designs for typical residential areas, commercial sites, industrial areas, vacant land, and streets that would compose a mixed-use urban area. Similar
Each such area was typical of its type, in the sense that it matched national or regional averages of similar land-use areas.
I , conceptual designs were developed for Midwest farmland and Western rangeland.
Decontamination and remediation activities for each area type were broken down into individual operations. The cost of each operation was calculated using industry-standard methods incorporating engineering judgment and standard contractors’ bidding formulas and estimating methods.
Our method of cost estimation entailed many assumptions: site characteristics, remediation goals, strategies employed, operations performed, equipment used, etc. In many instances, the basis of our assumption was very clear, and we were able to state a reason for our choice. In other cases, there was no obvious best choice, and we chose paths that engineering judgment suggested were reasonable. Alternative plausible assumptions (in many cases equally plausible), can readily be envisioned. The evaluation of the effects of alternative assumptions was beyond the scope of the current effort, but could be investigated in sensitivity and uncertainty studies.
We estimated the costs of off-site disposal by obtaining current prices from organizations engaged in the transportation and disposal of radioactive waste. Off-site disposal costs were estimated by postulating that it would require transportation to a commercial shallow land burial facility at an assumed distance of 1609 km (1000 miles).
For on-site disposal, given the historical reluctance of many communities to accept waste disposal sites, we developed a conceptual design for an on-site disposal confinement system incorporating a higher level of protection than is called for by current regulations and estimated its cost using data on the costs of labor and material. Despite the very conservative design of the on-site disposal system, our estimated cost for on-site disposal is substantially lower than the estimated cost for off-site disposal.
For accidents occurring in forested areas, the estimated costs of decontamination and waste disposal were found to be so high that it is unlikely such areas could be feasibly remediated. This is due to the very large volume of waste that would require disposal. CERCLA provides for situations where remediation is unfeasible by allowing the imposition of long-term acq%s controls instead of performing decontamination.
We identified three major components of attributable costs: compensation for lost or damaged property, decontamination, and waste disposal. The potential costs of medical monitoring and assessment for exposed individuals were deemed too uncertain to include in our estimates; the historical background of such programs is described in Appendix H.
xi

The average acquisition cost for property can be estimated in a straightforward manner although there are substantial uncertainties. Uncertainties regarding decontamination and waste disposal costs are probably somewhat larger. There is also uncertainty because of the variability in land and usage characteristics; this uncertainty could be minimized by the use of site-specific data when accidents are postulated to occur at specific locations.
Despite these uncertainties, the estimates provided are intended to be useful for quantitative assessments of the risks of nuclear weapon operations by the DOE and DoD.
Estimated accident costs for both on-site and off-site waste disposal are tabulated. In an average- density urban area, with a population of 1344 persons/km2, the costs for extended remediation under CERCLA were estimated to be $400 million/km2 for off-site disposal. For Midwest farmland, with a population density of 12 persons/km2, the comparable cost was $39 million/km2. We also calculated costs for unpopulated Western rangeland, which would be slightly less than costs for farmland.
The second type of response action, expedited cleanup with waivers from NEPA and CERCLA, was analyzed for contaminated highways, airport runways, and average-density urban land. We did not separately analyze the expedited cleanup of farmland or rangeland, because the costs for those land use types were found to be similar to that for extended remediation, except for the cost of acquisition.
The cost of expedited decontamination of major highways built to Interstate standards was estimated to range from $16 to $58 per m2 of highway surface, not including the cost of constructing detours around the contaminated area. The cost of decontaminating nearby vacant land was estimated to be approximately $74 per m2.
The cost of expedited decontamination of airport runways was estimated to be the same as the cost for highways. The cost of decontaminating unoccupied land between runways would be similar to the cost of decontaminating land adjacent to highways. The potential costs of decontaminating airport terminals or hangars or of constructing alternate facilities were not addressed.
For expedited cleanup of urban areas, we considered three options: (1) nondestructive cleaning of the exterior and interior with the owner’s permission, (2) a somewhat more intrusive decontamination, with compensation for resultant damages to the property, and (3) acquisition of the property by condemnation, followed by demolition, soil scraping, and disposal of debris. The degree of decontamination to be achieved would depend on a number of factors: primarily, the contamination level and the cleanup goal. And these would then serve to govern the choice of option to be followed.
xii
We calculated a cost of $127 million per km2 for the first option, $178 million per km2 for the second option, and $396 million per km2 for the third option; with these costs being estimated for mixed-use urban land with the national average population density of 1344 persons/km2. The estimated costs were derived separately for residential, urban, and industrial districts, and then combined according to national-average statistics on the relative proportion of these land uses in urban areas.
The simple acquisition and long-term access control of average-density urban areas (without decontamination), was estimated to cost $176 million per km2, plus a continuing cost of $250,000 to $540,000 per km2 per year. Acquisition and long-term interdiction might be considered as an alternative to demolition for some types of heavily contaminated urban areas, and we have thus estimated the associated costs.
All of the cost calculations were performed using computer spreadsheets. The details of the calculations are reproduced in their entirety in Appendix G. In addition, a standalone computer program incorporating the spreadsheet calculations is being developed by Sandia National Laboratories as part of the RADTRAN transportation accident code system. The software thus being developed is intended to support sensitivity and uncertainty studies, and will allow the substitution of alternative parameter values.
In assessing the risks of operations involving nuclear weapons, the consideration of economic costs, in addition to the conventional consideration of doses and health effects, can lead to a fuller understanding of the impacts of potential accidents. The insights obtained may prove useful in ongoing government efforts to minimize the risks of operations.
... Xll l

Intentionally Left Blank
xiv

AFB ALI ARARs BBS BOMARC CCI CERCLA CFR CPI CWG DCF DEIS DF DIL DNA DoD DOE DO1 DOT DQOs EA EIS E N 0 EPA FDA FEIS FEMA FIDLER FONSI FR FRERP FRMAP FRP GAO - --
Glossary of Acronyms Air Force Base Annual Limit on Intake (as specified by the ICRP) Applicable or Relevant and Appropriate Requirements Bulletin Board System Boeing Michigan Aeronautical Research Center (McGuire AFB, NJ) Construction Cost Index Comprehensive Environmental Restoration, Compensation, and Liability Act Code of Federal Regulations Consumer Price Index Community Work Group Dose Conversion Factor Draft Environmental Impact Statement Decontamination Factor Derived Intervention Level Defense Nuclear Agency Department of Defense Department of Energy Department of the Interior Department of Transportation Data Quality Objectives Environmental Assessment Environmental Impact Statement Extraordinary Nuclear Occurrence Environmental Protection Agency Food and Drug Administration Final Environmental Impact Statement Federal Emergency Management Agency Field Instrument for Detection of Low Energy Radiation Finding of No Significant Impact Federal Register Federal Radiological Emergency Response Plan Federal Radiological Monitoring and Assessment Plan Federal Response Plan General Accounting Office --. . - . .

IG IHE IMP JNACC keV LET LFA LLW LSA M&O MDA NARP NCP NCRP NEPA NRC NTS osc OSHA OSWER OTA PAG PRPs RAGS RCA RCRA RD/RA RERF RF'P RFRAG RWS
Glossary of Acronyms (Continued) Inspector General Insensitive High Explosive "in situ van" (a tracked vehicle for radiation detection) Joint Nuclear Accident Coordinating Center kilo electron-Volt Linear Energy Transfer Lead Federal Agency Low Level Waste Low Specific Activity Management & Operating Minimum Detectable Activity Nuclear Weapon Accident Response Procedures (DoD 5 100.52.M) National Contingency Plan (40 CFR 300) National Committee on Radiation Protection and Measurements National Environmental Policy Act Nuclear Regulatory Commission Nevada Test Site On-Scene Coordinator (DOE) or On-Scene Commander (DoD) Occupational Safety and Health Administration EPA Office of Solid Waste and Emergency Response Office of Technology Assessment Protective Action Guide Potentially Responsible Parties Risk Assessment Guidance for Superfund Radiological Control Area Resource Conservation and Recovery Act Remedial DesigdRisk Assessment Radiation Effects Research Foundation Rocky Flats Plant Rocky Flats Risk Assessment Guide Remedial InvestigatiodFeasibility Study

Site Restoration: Estimation of Attributable Costs From Plutonium-Dispersal Accidents
1 .O Introduction
In the extremely unlikely event of an accident involving nuclear weapons, it is possible that plutonium could be dispersed to the environment. The principal mechanisms for dispersal would be fire or the non-nuclear detonation of high explosive. Such an event is termed a plutonium- dispersal accident. In such an event, the dispersed plutonium could be transported by winds and deposited on soil, vegetation, or structures. The principal phenomenon of concern during cloud passage is direct inhalation. Unintended nuclear explosions are not being considered.
Conventional analyses of the consequences of plutonium-dispersal accidents generally focus on the inhalation dose during cloud passage. However, because of the long-term hazard posed by resuspension of the deposited plutonium and ingestion of contaminated foods, some fraction of the area in which plutonium was deposited could be considered uninhabitable or unusable without remediation. Remediation of these contaminated areas should almost always be technically feasible, but might be very costly in some cases, depending on the local conditions.
Previous U.S. work estimating the cost to protect public health and safety in a post-accident environment has generally focused on purely technical factors such as the cost of cleaning surfaces, sometimes extending the scope to include a weighing of cleanup costs against the benefits to be achieved by the cleanup. In contrast, our study considers current and proposed legal requirements, sociaVpolitica1 factors, and current Federal policies and plans, as well as technical factors.
Industry-standard methods have been used to estimate the costs of remediation if rangeland, farmland, forests, highways, airport runways, or mixed-use urban areas were to become contaminated with plutonium. The cost estimates thus derived are applicable to the majority of the U.S. land area. Not addressed, because of their complexity, are coastal regions, wetlands, and the centers of large cities.
Although only publicly available information has been utilized, the results of this study are intended to be useful for classified research undertaken by the government to minimize the risks of operations, as well as for public information documents such as Environmental Impact Statements (EISs).
1-1

Intentionally Left Blank
1-2
2.0 Assessment Methodology
2.1 Potential Extent of Contamination
The current research was initiated with a review of public information on nuclear weapons accidents, referred to by the Department of Defense (DoD) as Broken Arrows. Cuddihy and Newton (1985) and Gregory and Edwards (1988) give comprehensive descriptions of reported nuclear weapons accidents. For the same purpose, a summary of nuclear weapon accidents worldwide by the Stockholm International Peace Research Institute (1977) was reviewed. It was also helpful to study the proceedings of an informal workshop on plutonium cleanups (DOE, 1991). Appendix A of this report presents a series of case studies describing past and current cleanup experience. The recent cleanup experience corroborates the cost estimates of this report.
Apart from the published reports on the Palomares, Spain and Thule, Greenland incidents, publicly available data on the possible extent of contamination following a high explosive (HE) detonation accident are sparse. In discussing the accidental detonation of the HE associated with nuclear weapons, Langham, et al. (1956) stated that,
Information collected in the field has clearly indicated that Contamination (to a level of significant residual hazard for which something must be subsequently done) certainly extends for ten miles or nwre in a downwind direction froin ground zero.
The area and distance estimates given above for HE detonation are consistent with a graph presented by Boughton and DeLaurentis (1992), based on an unclassified summary by Shreve and Thomas (1965), of ground contamination levels measured during Operation Roller Coaster at the Nevada Test Site (NTS) in 1963. Under stable meteorology and flat terrain, the graph of results from the Clean Slate 1 shot shows plutonium contamination levels exceeding 10 &m2 (roughly 0.7 pCi/m2) in a cigar-shaped region that extends beyond a distance of 10.4 km from ground zero.
It is important to note that the worst-case combination of release magnitude and meteorology is not the most likely occurrence. In the Project 57 and 58 series of safety shot tests conducted in the late 1950s on flat terrain at the Tonopah Test Range (TTR), contamination to a level exceeding 0.2 yCi/m2 was limited to a downwind distance of eight km or less (DOE, 1995a). The TTR data also shows that the area contaminated to that level from a single safety shot did not exceed seven square kilometer^.^ However, it is worth noting that the Roller Coaster tests differed from the safety shots in that Roller Coaster was intentionally conducted under "worst- case" meteorological conditions.
Some shortcomings of the TTR data are discussed in Section 5.1. 3
2- 1

In a textbook for British military personnel, Grace (1994) states that the crash of an airplane carrying a nuclear weapon poses the greatest risk of plutonium dispersal; a fiie is likely, and the HE might burn or detonate. He states that this could contaminate an area of "perhaps a few square kilometers," with fissile material," and in such an event, "thorough removal of contaminated soil is essential."
In the unlikely event that a plutonium-dispersal accident were to occur, there are many factors which would combine to determine the size of the contaminated area and the degree of contamination. Bounding estimates of the contaminated area and distance such as that presented by Drell et al. (1990) should not be used to estimate the likely costs of accidents.
The area exceeding the criterion for continuous occupation, a highly uncertain parameter, could range from a small fraction of a square kilometer in the case of a fire to a few square kilometers for an accident involving HE detonation. HE detonation is less likely than involvement of weapons in a fire. The area contaminated in any specific hypothetical accident scenario would need to be estimated by calculations involving scenario-specific parameter values for the amount of material at risk, initial cloud size and thermal buoyancy, particle size distribution, ambient meteorology, and surrounding terrain characteristics, all of which are outside the scope of the present study.
2.2 Likelihood of Occurrence
Cuddihy and Newton (1985) present a summary of the nuclear weapons accidents that occurred between 1950 and 1980. The vast majority of those accidents occurred during the height of the Cold War and were associated with strategic bombers on either airborne or ground alert, i.e. with nuclear weapons loaded on aircraft and either in the air or ready for take-off.
It should be noted that these few accidents dispersing plutonium occurred during a period when the number of nuclear weapons actively deployed was much larger than at present, and that the frequency of accidents per weapon-year was extremely low.
Airborne alert flights were terminated after the B-52 crash at Thule, Greenland in 1968. Further, as of September 1991, the U.S. no longer maintains a ground alert status for its strategic bomber force. That is, nuclear weapons are no longer routinely loaded onto bombers as part of readiness exercises. The termination of air and ground alert status for the strategic bomber force has yielded great reductions in accident risks, see Simmons (1993).
Also notable is the extremely low probability of such accidents because of the extensive precautions taken in nuclear weapon operations. Safety precautions and operational rules have been made more stringent. There have also been several important safety-related changes to the stockpile, such as the use of insensitive high explosive (IHE), crash-resistant containers, and fire- resistant pits. As a result of these changes (many of which were at least partially motivated by the weapons accidents of the 1950s and 1960s) very large reductions in accident risks have been achieved, see Drell (1993).
2-2

Also important to note in regard to the diminishment of nuclear weapon accident risks is the fact that as a result of arms control treaties for strategic weapons such as SALT and START, the number of weapons in the stockpile has been significantly reduced. In addition, the Intermediate Nuclear Forces (INF) treaty eliminated an entire class of weapons from Europe. Furthermore, the U.S. Army has totally eliminated the active deployment of nuclear weapons with its troops, and the U.S. Navy no longer routinely fields tactical nuclear weapons on surface ships. As a result of these changes, and DoD/DOE practices that greatly minimize the use of air transportation for nuclear weapons, the likelihood of accidents in which dispersal of plutonium might occur have been driven to extremely low levels.
2.3 Exposure Pathways
Radiation exposures to humans can result from a number of different pathways, but because of the radiological and chemical characteristics of weapons grade plutonium (over 99% by mass alpha-emitting 239e240Pu), inhalation dominates over the other exposure pathways considered in other types of radiological assessments such as those for nuclear power plant accidents. The other exposure pathways commonly considered for reactor accidents are cloudshine, groundshine, and ingestion.
Immediately following a plutonium-dispersal accident, the bulk of the exposure to the populace would be via direct inhalation of the cloud as it traveled downwind. If there were no advance warning of an accident, exposures could occur without the opportunity to implement protective actions such as sheltering or evacuation. Risk assessments of such accidents typically report radiation doses to maximally exposed individuals, in units of rem or sieverts (Sv), as well as the collective dose (in units of person-rem or person-Sv).
Health effects such as cancer in lungs or other organs might subsequently occur! In accordance with guidance from authoritative bodies such as the International Commission on Radiological Protection (ICRP) and the National Committee on Radiation Protection and Measurements (NCRP), DOE risk assessments utilize the assumption that the dose-response relationship observed from high doses and high dose rates (such as at Hiroshima and Nagasaki) can be extrapolated linearly without a threshold to estimate the risks of cancer at the low doses and dose rates that would result from a plutonium-dispersal accident.
In comparing the numbers of cancer health effects that could result from a plutonium-dispersal accident to those that could result from a severe accident at a commercial nuclear power plant, it is readily apparent that the health consequences and costs of a severe reactor accident could greatly exceed the consequences of even a "worst-case" plutonium-dispersal accident because the
The potential toxicological effects of weapon materials are not addressed in this report. 4
2- 3
quantities of radioactive material in nuclear weapons are a small fraction of the quantities present in an operating nuclear power
2.4 Criteria For Acceptable Exposures
In the unlikely event of a dispersal accident, costs would be incurred by the government as a result of mitigative actions taken to protect public health and safety within the affected area. The definition of the boundaries of the affected area depends on the choice of a derived intervention level (DIL). The DIL is a numerical criterion used to distinguish between acceptable and unacceptable contamination levels in the environment.
Under the authority of the Atomic Energy Act of 1954, as amended (42 USC 5 201 1 et seq.), and various Executive Orders, the Environmental Protection Agency (EPA) has the responsibility to set generally applicable standards for protection of the public from radiation.
As of January 1996, no fixed standards defining what constitutes an acceptable level of contamination from radioactive contamination have been issued; but the EPA would have authority to set such standards on a case-by-case basis. The EPA (1977) has proposed a numerical criterion that could be used as a "screening level" for transuranic Contamination. The 0.2 pCi/m2 screening level was intended to distinguish between areas that indisputably satisfied the criteria for acceptability and areas that required further study through a detailed analysis of exposure pathways and doses. Recent cleanups discussed in Appendix A show that what was originally intended for screening has evolved into a de facto cleanup standard.
In a report to Congress, the EPA (1993d) described numerous inconsistencies in the legal requirements for protection from hazardous materials that have led to difficulties for the agencies tasked with enforcement. Furthermore, the General Accounting Office (GAO) (1993; 1994a; 1994b) has repeatedly criticized the involved Federal agencies for their inability to define consistent radiation protection standards.
The lack of fixed standards introduces substantial uncertainty into assessments of costs from potential accidents. Nevertheless, case studies of radiation cleanup experience presented in Appendix A indicate that the cleanup standards for an accident occurring in the future, could, in situations involving relatively small areas, be much more stringent than the standards utilized in the past decades.
Commercial power reactors can each contain several kilograms of plutonium created by neutron capture in the uranium fuel, but plutonium gives a negligible contribution to reactor accident consequences because its volatility is much lower than that of fission products.
2-4
An extensive discussion of Derived Intervention Levels (DILs) for plutonium, the relative importance of the various exposure pathways, and current EPA and NRC rulemakings that may define a site cleanup standard applicable to radiation accidents is provided in Appendix B.
2.5 Attributable Costs
There are a number of different approaches that may be taken to estimate costs. The approach selected for this report is to derive a methodology to estimate the costs that could be incurred as direct liabilities by the DOE or DoD if a nuclear weapon or weapon component in its custody is involved in an accident resulting in plutonium dispersal to the environment. This report does not address in any manner the render-safe and reclamation procedures performed by explosive ordinance disposal (EOD) personnel and the near-term activities that might be required for the protection of classified information.
What will be addressed are the costs associated with the protective actions that could be performed to assure adequate protection of the public from the radiation hazards associated with a plutonium-dispersal accident. Qver the period following such an accident, these actions could take a number of forms, ranging from a precautionary advance evacuation of nearby individuals, to, over subsequent years, access control, decontamination of the environment, waste disposal, and ecological restoration.
The costs predicted using the described methodology have two principal components: (1) disaster relief and compensation costs to those facing losses and (2 ) costs of the actions that the government might perform in order to restore the surrounding environment and ensure the long- term health and safety of the affected population.
Some types of costs are highly uncertain, for example, the cost of litigation, and this report makes no attempt to quantify legal expenses. Government compensation to affected individuals is assumed to be limited to actual costs because current law prohibits the award of punitive damages. Current law also provides for government payment of a claimant’s legal expenses only if those expenses satisfy criteria for reasonableness.
After remediation and restoration of a contaminated site, the land would have value and could be sold to offset government costs. For the expedited remediation of light- and moderate- contamination areas, we assumed that properties acquired by the government would be resold without loss.
The possible economic costs to society associated with premature cancer deaths or indirect losses likely to be absorbed by the economy of the affected region are not addressed. In any case, those non-attributable economic costs, although commonly considered in European safety assessments of power reactors (Alonso et al., 1990; Haywood et al., 1991) are expected to be small in comparison to directly attributable costs because losses to one sector of the economy are usually balanced by gains to another. Also, when facilities are rebuilt, overall efficiency gains are sometimes achieved that yield a net benefit to the economy. A detailed analysis that considers
2-5
such losses and gains along with their attendant uncertainties is not feasible for prospective accidents.
2.6 DOE Accidents Versus DoD Accidents
The Atomic Energy Act assigns the DOE and the DoD special responsibilities for assuring the adequate protection of the public from the risks involved with nuclear weapons and nuclear explosive devices. In the event of an actual nuclear incident, a crucial determination would be the question of which agency had custody of the involved material. The question of custody takes precedence over the physical location or ownership of land or that an accident occurs. The Federal government would be responsible for the resultant costs. Funding for the costs could have an impact on the budget of the responsible agency, depending on the magnitude. There is no reason to believe that, everything else being equal, the cost of an accident involving a weapon in DOE custody would be different from those involved in DOE custody.
2.7 Degree of Protectiveness
The estimation of accident costs from a postulated accident, without any knowledge of the accident location, the degree and spatial extent of contamination, etc. is fraught with difficulties. Before applying the parameters derived in this report, analysts need to consider the assumptions we utilized and ensure that our results are applied appropriately.
First, we supposed that current laws would play an important role in determining the resultant costs. Although there are no fixed standards for radiation site cleanup, we assumed that the historical experience in radiation cleanups can be relied upon, in conjunction with proposed standards recently issued for public comment by the EPA (1994d) and the NRC (1994a), to forecast that cleanup standards at a contemporary accident site could be very stringent.6
The costs under consideration in this report would, by definition, result from the actions taken by the government. Social and political factors would play a role in determining the protective actions taken. We assumed, based on historical experience, that the post-accident decisionmaking would give great weight to minimizing public concerns.
In the period immediately following an accident, several important decisions would be made in a limited period of time. Those decisions would be based on initial estimates of contamination levels that would have some uncertainty. Consideration of the social and political pressures that could come to bear led us to conclude that the actions taken would probably err on the side of conservatism and greater protectiveness.
For additional information on the approach being taken by the NRC, see Daily et al. (1994), 6
Huffert et al. (1994, 1995), Huffert and Miller (1995), and Gogolak et al. (1995).
2-6
The degree of protectiveness modeled in this study would not yield upper-bound estimates of accident costs. With the exception of nuclear medicine, the American public is extremely averse to radiation exposures resulting from human activities. This reaction can be expected to be particularly pronounced if the potential radiation exposure was the result of an accident involving a nuclear weapon or explosive device. Therefore, it is conceivable that a course of action more protective than suggested by our analysis could be taken, at additional cost. It is also conceivable that a less protective course of action could be taken, at lower cost.
Even for an unlikely scenario involving a very severe accident, we determined that a comprehensive course of action providing great protection to the public health and safety would be feasible. Because of the importance of nuclear weapons for the national defense, and the need to minimize public fears, we assumed that such a strategy would be carried out.
Both CERCLA (described in Section 3.3) and NEPA (described in Section 3.4) allow for waivers. For one scenario, we assumed that government actions would be constrained by the legal requirements of those two laws. As a result of those legal requirements, a possible extended period of several years could elapse before remediation of the contaminated region. Consequently, some of the cost estimates include condemnation of affected property and relocation of the residents even though the immediate risks to residents in a large portion of the area would be minimal.
Predicted costs would be reduced if an expedited decontamination effort were conducted. Several important issues would need to be addressed before an expedited cleanup action could become a realistic option. Because a full understanding of the degree and extent of contamination and a coherent plan are essential before undertaking clean-up operations involving radioactive materia1,and because there are presently no plans in place for the performance of expedited cleanup after nuclear weapons accidents, advance planning and preparations would need to be developed. This planning would have to consider the following:
decontamination is most effective if accomplished in a month or less,
decontamination of structures is difficult and some methods can cause damage,
(3) residual plutonium within a decontaminated structure would be difficult to detect,
(4) decontamination generates radioactive waste and its ultimate disposal would have to be planned for,
decontamination activities might cause damage to ecosystems, and
2-7
(6) if initial efforts proved unsuccessful, progressively more vigorous methods might have to be applied, with a possible culmination in total demolition, as was experienced at Chernobyl?
For expedited remediation of an accident site, DoD capabilities might be utilized because of the fact that troops can be rapidly mobilized to an accident site; the DOE has no such capabilities at this time. Military troops are trained and equipped so that they can operate safely in hazardous environments referred to as nuclear/biological/chemical (NBC). However, NBC training and equipment is currently oriented towards expedient methods of decontaminating personnel, vehicles, and vital facilities such as airport runways, see GAO (1986a) and DoD (1994).
The major focus of NBC preparedness is on chemical warfare agents, where decontamination is performed by the spray application either of caustic solutions to chemically neutralize the toxic agent or of detergent solutions to wash it off. This equipment, with trained operators, could supplement commercially available equipment and be of great benefit. However, some of the methods incorporated in current NBC planning procedures are inapplicable to a plutonium- dispersal accident that might occur during peacetime in a civilian area. These expedient field techniques might serve only to expand the size of the contaminated area through further dispersal and make the ultimate remediation process more difficult.
Also, although the N in NBC is for nuclear, a recent report to Congress on military capabilities (ibid.), including an inventory of available equipment, is focused primarily on defense from chemical agents. A search of the DoD literature revealed no current information on military capabilities for the NBC decontamination of building interiors, and (ibid.) noted that no capabilities exist for the decontamination of aircraft interiors, although there is a need for such.
2.8 Price-Anderson Indemnity Limit
Because estimates of potential costs from commercial power plant accidents have been used to set the Price-Anderson indemnity limit, which does pertain to a nuclear weapon accident, it is worthwhile to discuss a major limitation of an important prior effort to estimate accident costs. In introducing this topic it is also important to note that commercial reactor accidents are exempt from CERCLA. This means that if a reactor accident were to occur, the criteria for site restoration would be developed by the EPA on an individual basis.
The GAO (1986b and 1987) prepared two reports for Congress that summarized the technical basis for the 1988 revision to the "Price-Anderson" indemnity limits of the Atomic Energy Act. Both GAO studies relied on the fundamental assumptions of WASH-1400 (NRC, 1975) and on two reports issued in September of 1982: Technical Guidance for Siting Criteria Development (NUREGJCR-2239) and Estimates of the Financial Consequences of Nuclear Power Reactor Accidents (NUREGKR-2273).
None of the cost estimates of this report consider the possibility of such an escalation. 7
2- 8
. The GAO found that the total cost of a "catastrophic" accident would not be likely to exceed $6.5 billion. That judgement was based on (1) the WASH-1400 criterion for acceptable long-term exposure, 25 rem (0.25 Sv) incurred over a period of 30 years, and (2) an urban decontamination factor (DF)' of 20 achieved at a cost that represented just 10% of the property's value. We note that a similar study was used in Canada to define the potential liabilities associated with Canadian commercial power reactor accidents (Lonergan and Goble, 1990). Considered in light of the present research, both have similar shortcomings.
In comparing the WASH-1400 long-term dose criterion to current standards, it is important to note that the dose rate from dispersed and deposited reactor fission products would decrease relatively quickly in the first few years following an accident because of the decay of radionuclides with short halflives. As a result, in an area that satisfied the 25-rem-in-30-years criterion, the annual doses in the first few years could each amount to several rem, with the annual doses from subsequent years averaging less than one rem.
Current EPA (1992a) Protective Action Guides (PAGs) allow for the possibility of a 2 rem (0.02 Sv) exposure in the first year following an accident, after weighing the disruption of relocation against the risk of exposure, and there has been no major change in this criterion since 1975. The change in radiation protection criteria that is important to the present study a change in criteria for long-term exposure to residual radioactive material. Those long-term exposure standards, discussed in Appendix B, have been tightened considerably since 1975.
Prior to the 1986 Chernobyl accident, reactor accident risk assessments in the U.S. and Europe relied heavily on the economic cost model of WASH-1400, in which the decontamination of residential property was modeled as achieving a DF of 20 in urban areas at a minimal cost, that is, one-tenth of the value of the affected property.
The use of a DF of 20 in WASH-1400 was apparently based on contemporary guidance documents for anticipated recovery actions following nuclear explosions of warfare. Nuclear explosions produce fallout with large particles and high mass loadings on surfaces. The DF of 20 was widely used in planning documents addressing such events. Furthermore, data presented within WASH- 1400 give strong weight to this supposition in its presentation of decontamination data for mass loadings of 5 and 25 g/f? (ibid.: pp. K-23 through K-32).
The WASH-1400 model now appears to have been unduly optimistic in the broad application of a DF of 20 to large-scale urban areas, when, according to Cowan and Meinhold (1969), in their discussion of the importance of pre-planning for the post-attack recovery of vital selected facilities such as power plants, water works, medical installations, and transportation systems,
Radiation levels inside of selected structures can be reduced by a factor of 5.
A DF of twenty means that contamination is reduced by a factor of twenty; that is, 95% of the radioactive material is removed.
2-9
Radiation levels outdoors in selected areas can be reduced by a factor of 20.9
These results can be achieved without excessive exposure to individuals carrying out the decontamination.
and,
Data on recovery from nuclear explosions that have been publicly available since the 1960s appear to have been misinterpreted, which has led to long-standing underestimates of the potential economic costs of severe reactor accidents.
2.9 Applicability of Current Estimates
Accidents could be postulated to occur at a number of different locations, and there are large variations in costs depending on locale. We estimated hypothetical accident costs for four representative locales. These are (1) mixed-use urban areas such as are found in mid-sized cities and in the suburbs of large cities, (2) Midwest states farmland, (3) Western states arid rangeland and prairie, and (4) forested areas.
Accident costs in Western arid rangeland were found to be almost identical to accident costs in farmland areas. Acquisition cost for farmland is higher than for rangeland, but this is overshadowed by the cost of waste disposal, which is nearly the same for both farmland and rangeland. As a result, the farmland cost parameters may be used to characterize rural areas throughout much of the continental United States.
For forests, our analysis indicates that the costs of decontamination and ecological restoration would greatly exceed any plausible monetary value for the property. Consequently, the most prudent course of action for such areas would probably be acquisition and imposition of long- term access controls.
Locales for which the data in this report are inapplicable include coastal regions and wetlands, which have unique characteristics that can have a great impact on costs, principally, the difficulty of conducting ecological restoration. The parameter values presented in this report should be carefully evaluated before using them to estimate costs for accidents postulated to occur in fragile or complex environments. High-value areas with multistory office buildings or large industrial or transportation facilities are only briefly discussed, and the parameters provided may underestimate the costs for those locales.
The data derived and presented in this report are intended to be applicable to hypothetical accidents at fixed DOE or DoD facilities and to transportation accidents in the U.S. for the sole
These estimates, for expedited remediation after nuclear explosions, are not inconsistent with our analysis of decontamination effectiveness, presented in Appendix D. It is also noted that we have drawn on many of the same references that were used by Cowan and Meinhold.
2-10

purpose of assessing the direct costs of such an accident that might be borne by the government if it were to occur.
Such an event is very unlikely. Our analysis of the cost to recover after such an event should not in any way be taken as an indication that such an accident is deemed likely, or that there need be any public concern regarding the adequacy of the safeguards that are taken to prevent such accidents. On the contrary, despite the dramatic reductions in weapon-accident risks that have already been achieved, efforts to reduce these risks still further are ongoing. This study is intended to facilitate that process.
2-11

Intentionally Left Blank
2-12

3.0 Pertinent Federal Laws, Regulations, and Procedures
Three laws form the principal legal basis for our estimation of accident costs: the Robert T. Stafford Disaster Relief Act, the Atomic Energy Act, and the Comprehensive Environmental Restoration, Compensation, and Liability Act (CERCLA). The impacts of these laws on accident costs, in conjunction with the requirements of the National Environmental Policy Act (NEPA), are discussed in the remainder of this section.
If an accident were to occur at some future time, the legal requirements then in effect would play an important role in determining the actions taken by the government, and the associated costs. Since the governing legal requirements are subject to change, the present study should in no way be relied upon to provide guidance for any type of post-accident response after an actual accident. The summarization of legal requirements that follows is thus intended to be used for the sole purpose of estimating costs from potential accidents.
3.1 Robert T. Stafford Disaster Relief Act
Natural disasters in the U.S. of large scope have been caused by hurricanes, earthquakes, and floods. In the early 1990s, severe events with damages exceeding ten billion dollars occurred on an annual basis." The Federal and State procedures for disaster relief are well-exercised. Many of the actions that would be performed following a plutonium-dispersal accident are identical to those performed after natural disasters.
The Federal law governing such actions, the Disaster Relief Act of 1974, as amended," is fully applicable to man-made disasters such as a plutonium-dispersal accident. In such an event, the Federal Emergency Management Agency (FEMA) would be expected to coordinate the following types of actions: temporary housing assistance, unemployment assistance, individual and family grant programs, small business loans, food coupon distribution and emergency mass feeding, relocation assistance, crisis counseling, emergency communications, emergency public transportation, and provision of vital services such as medical care.
lo According to Dialog@ Information Services, Hurricane Andrew caused damages of $20 billion in 1992, the Midwest floods caused damages of $12 billion in 1993, and the Northridge, CA earthquake caused damages of $15 billion in 1994.
42 USC 6 5121 et seq., Public Law 93-288, amended by Public Law 100-707 and renamed The Robert T. Stafford Disaster Relief and Emergency Assistance Act.
3- 1

The Act specifically permits the limited use of DoD resources for emergency work,
3.2
During the immediate aftermath of an incident which may ultimately qualify for assistance ... the Governor of the State may request the President to direct the Secretary of Defense to utilize the resources of the Department of Defense for the purpose of perJorming on public or private lands any emergency work which is made necessary by such incident and which is essential for the preservation of life and property ... Such emergency work may only be carried out for a period not to exceed 10 days.
Price-Anderson Amendments to the Atomic Energy Act
Under the contracts DOE places with its management and operating contractors (M&O's), the DOE indemnifies its contractors, up to an established amount, for accidents involving nuclear materials. If an accident were to be of a sufficient scale to be determined a nuclear incident (in the terminology of the amended Atomic Energy Act) or an extraordinary nuclear occurrence (ENO) (as defined in the Federal regulations) the compensation provisions of Price-Anderson are activated.
At 10 CFR 840, et seq., the DOE establishes several criteria for determination of an ENO. In brief, the following can be stated. For alpha-emitting transuranics, an E N 0 would be declared if off-site ground contamination of more than 100 m2 exceeded 0.35 pCi/m2 and the aggregate amount of damage that "has been or will probably be sustained as the result of such event" exceeds $5 million. Only the most minor plutonium-dispersal accidents, in which contamination was limited to government property, would fail to qualify as an ENO.
The Price-Anderson Act of 1988 amended the Atomic Energy Act to increase the amount of financial indemnity for DOE government contractors so that it equals the amount of the insurance fund established for liability from accidents at commercial nuclear power reactors. It is noted that the indemnity provisions of Price-Anderson afford greater protection to DOE contractors than is afforded to DoD contractors (Swanson and DePetro, 1994). However, that distinction has no bearing on operations performed by DoD personnel. For the purposes of this report, the Price- Anderson Act is considered to have equal effects for DOE and DoD plutonium accidents.
For nuclear incidents within the U.S. the amount of the Price-Anderson insurance fund is set at $63 million (in 1988 dollars) times the number of licensed power reactors with a capacity of at least 100 mega-Watts electrical power. If reductions in the amount of financial protection for NRC-licensed facilities occur as a result of decommissioning, the DOE indemnity limit is not reduced. The indemnity limit is annually adjusted for inflation with the Consumer Price Index (CPI). Punitive damages are prohibited under the Act.
In 1995, with approximately 115 licensed reactors, the indemnity limit for DOE contractors is around $9 billion. If this amount is insufficient, the 1988 Price-Anderson Act states,
3-2

In the event of a nuclear incident involving damages in excess of the anwunt of aggregate public liability ... (the $9 billion) the Congress will thoroughly review the particular incident ... and ... take whatever action is necessary ... to provide full and prompt compensation to the public for all public liability claims resulting from a disaster of such mgnitude.
Under both the Atomic Energy Act and CERCLA, the sovereign immunity of the Federal government is waived, thus allowing lawsuits against the government, in specific circumstances, by parties suffering damages as a result of radioactive or toxic releases.
Under the Atomic Energy Act, a procedure is established so that parties suffering damages as a result of certain nuclear incidents may file damage claims with the Federal courts and thereby receive compensation. There would be no need for a lawsuit per se against the government, see 42 USC 0 2210: Indemnification and Limitation of Liability.
Under CERCLA, persons who comply with orders brought by the Attorney General under that section (see Section 4.7) may petition the President for the reimbursement of their associated expenses. If the President refuses to grant all or part of the petition, an action may be brought against the President in Federal court (see 42 USC 9 9606: Abatement Actions.)
In regard to the waivers of sovereign immunity, any legal actions brought against the Federal government would be subject to the requirements of the Federal Rules of Civil Procedure, see 28 USC 6 2412: Costs and Fees. Although all of the possible types of claims that might be brought cannot be predicted, some possible damages are subsistence expenses during relocation, lost income, disruption of business, and requisition or condemnation of property.
The associated government liabilities would be assessed by the Federal courts. Obviously, any expenses previously reimbursed by FEMA under disaster relief could not be claimed. However, the compensation paid out in satisfaction of damage claims would be independent of, and in addition to, the costs that the government might incur in the course of site remediation as required by CERCLA. Thus, an exceedance of the Price-Anderson indemnity limit might have no bearing on the financing of remediation efforts called for under CERCLA.
3.3 Comprehensive Environmental Restoration, Compensation, and Liability Act (CERCLA)
3.3.1 Historical Background
In 1978 at Love Canal in Niagara Falls, NY, President Jimmy Carter declared a state of emergency to remedy a situation where buried chemical wastes were seeping into homes and adverse health effects were alleged to be caused by toxic exposures. Federal laws at the time included no mechanism to compel responsible parties to remediate environmental damages from toxic material releases.
3-3
In response, CERCLA (42 USC 6 9601 et seq.) was enacted into law in 1980 to provide a framework for the reporting, investigation, and remediation of such environmental damages.
Federal appropriations for the acquisition of Love Canal property (42 USC 0 9661) total $2.5 million; the legislation specifies that,
No property shall be acquired pursuant to this section unless the property owner voluntarily agrees to such acquisition.
After ten years of remedial activities at Love Canal, consisting of an engineered cap, barrier drain, leachate collection and treatment, and site monitoring, the cost of cleanup for the 16-acre site was estimated to be $25 million (Kadlecek, 1988).
After enactment of CERCLA, Times Beach, MO, became a well-known example of the law's implementation. The contamination at Times Beach resulted from spraying roads for dust control in the 1970s with oil that was contaminated with dioxin. The contamination was subsequently further spread, through 1982, as a result of the use of contaminated soil as fill material. After a December 1982 flood, the Federal government began an evacuation of the town which eventually became permanent. More than 2000 people were moved from the rural community at a cost of approximately $30 million in 1983 dollars (Monks, 1993). Years after the disaster, many of the former residents remained critical of the government's handling of the situation, see Goodman and Vaughan (1988) and Sagan (1993).
The initial Record of Decision (ROD) for Times Beach (EPA, 1984) selected the CERCLA Alternative that involved interim on-site storage (in a concrete vault with flexible cover) of 50,000 cubic yards of contaminated soil, which was to be removed from six noncontiguous regions. The affected properties included a few "ranches," a golf course, and a trailer park. The contamination levels varied widely. Most of the affected populace was to be offered only temporary relocation during the period of soil removal and emplacement; eleven families were initially offered permanent relocation. The ROD noted the public opposition to on-site storage, but made the selection based on considerations of health benefits and cost effectiveness. The total cost of this remedial action was estimated to be $15.7 million in the 1984 ROD.
A subsequent and totally different ROD (EPA, 1988) was later issued. The 1988 ROD selected the CERCLA Alternative that consisted of the demolition and on-site disposal of all uncontaminated structures and debris remaining at the site, excavation of all dioxin-contaminated soils for on-site incineration with on-site disposal of the resultant ash, imposition of flood and erosion controls, placement of a clean soil cover, and revegetation. The total cost of this remedial action was estimated to be $48.8 million. Ten years after the flood, the 801 families that comprised the town have been permanently relocated and the town is no longer found on the Missouri state map (Sagan, 1993). As of January 1996, the cleanup action has not yet been fully completed, and controversy continues over the risks posed by operation of the incinerator.
3-4
3.3.2 Enforcement Responsibilities
Enforcement of CERCLA is the responsibility of the EPA. The pertinent regulations are codified by the EPA (1994b) at 40 CFR 300, referred to as the National Contingency Plan (NCP). Although CERCLA establishes an EPA-administered trust fund, the so-called Superfund, to pay for remediation if responsible parties cannot be found or cannot afford to pay, the EPA has broad powers to require property owners to pay for remediation of contamination that is located on or originated from their property, even if the current landowner had no knowledge of the material’s existence. The law makes no distinction between accidental releases and those due to negligence or willfulness; any party even remotely responsible can be required to pay the entire cost of remedial activities.
For accidental releases of toxic material (radioactive or not) in the custody of the DOE or DoD, the responsible Lead Federal Agency (LFA) is tasked with complying with all the requirements of CERCLA and the NCP and thus is becomes a regulator as well as the responsible party. However, under EPA-DOE and EPA-DoD inter-agency agreements, the EPA has the ultimate authority to approve or deny any CERCLA-related response action.12
CERCLA applies to releases of hazardous materials to the environment that exceed a reporting threshold set by the EPA in Appendix B of 40 CFR 302. For the alpha-emitting radionuclides in weapons grade plutonium, the reportable quantity that triggers applicability of CERCLA is 0.01 Ci (3.7 x IO8 Bq). The environment is defined broadly to include air, water, and soil, but releases contained within a building or other structure are not considered unless there is an imminent hazard of release to the outside environment.
Because CERCLA is intended to deal with a wide variety of situations, ranging from the discovery of long-buried waste from an unknown source, to accidental releases from government facilities or during transportation, a great deal of flexibility is built into the framework. In this respect the law is similar to NEPA. The NCP specifies a set of procedures that must be followed to (1) determine the nature of the problem, (2) identify the environmental standards that need to be considered in seeking a solution, (3) evaluate the strengths and weaknesses of different approaches that could meet those standards, and (4) document the basis for the selection of a remedial action from among the alternatives considered.
And, just as with NEPA, there is a requirement that the public be afforded the opportunity to provide comments. In several respects though, the scope of public participation under CERCLA is broader than that afforded under the NEPA EIS process, with CERCLA requiring a series of
l2 The primacy of the EPA in this regard is evidenced by an Administrative Settlement in which the DoD is required to pay $1.4 million to the Hazardous Substances Superfund to compensate EPA for its response actions at the Eastern Surplus Superfund Site (EPA, 199%).
3-5

community meetings and opportunities for public comment at several stages of the CERCLA process.
Unlike the Resource Conservation and Recovery Act (RCRA), an environmental law applicable to hazardous waste generation, treatment, storage, and di~posal , '~ which mandates the types of remedial action to be taken, e.g. the Best Demonstrated Available Technology, a CERCLA response action can take many forms, including long-term access controls. The law does not require that decontamination be performed in all situations. Although the flexibility may be advantageous in some respects, the nature of the CERCLA process practically guarantees that several years would elapse between the time of an accident and the initiation of remediation of the affected site. An outline of the principal requirements of CERCLA and the NCP is given in Section 4.
3.4 National Environmental Policy Act (NEPA)
NEPA (42 USC 5 4321 et seq.) requires that Federal agencies planning to undertake actions that could have "significant impacts" on the environment are required to follow a set of procedures to ensure that the possible effects of the proposed action are given due consideration by the agency (Zeller, 1984). The required substantive procedures include a detailed assessment, documented in an EIS, of the potential impacts of the proposed action as well as alternative approaches that might fulfill the same objectives. The agency is also required to evaluate the environmental effects of the No Action Alternative that, in the event of a plutonium-dispersal accident, could represent a course of action whereby no cleanup is performed.
An integral requirement of NEPA is that there be public involvement in the decisionmaking process via the publication of Draft Environmental Impact Statement (DEIS) for public comment, and consideration of those comments in the preparation of a Final Environmental Impact Statement (FEIS). The outcome of the process is the issuance of a Record of Decision (ROD) by the agency documenting the basis for the selected course of action.
For proposed actions deemed by the agency to lack the potential for significant impacts, a less detailed analysis, an Environmental Assessment (EA), supporting a Finding of No Significant Impact (FONSI), can be utilized to demonstrate NEPA compliance. The specified scope of public participation for an EA is less than that for an EIS.14 The criteria for determining significance are established by the Council on Environmental Quality (CEQ) at 40 CFR 1508.27, and have been adopted by the DOE. The CEQ definition of environment is broad. It includes
l3 Unless an accident occurred at an existing permitted RCRA site, or an interim status site (see 40 CFR 265), RCRA would probably not apply to the initial site of contamination.
l4 Recent EAs, DOE (1994a) and DOE (1994c), for weapons-related storage at Pantex and Y-12 have offered much more opportunity for comment than is required by Federal regulations.
3-6
the surrounding air, water, and ground, habitats for plant and animal life as well as humans, and the human environment is stated to include social and economic impacts.
Under the legal doctrine of "functional equivalence" the EPA has claimed (and maintained to date in the Federal courts), that CERCLA cleanups under its purview do not require NEPA compliance documents such as an EA or an EIS. The bases for this claim are: (1) that the CERCLA process calls for a detailed evaluation of potential environmental impacts and provides for public participation via review of such analyses, and, most importantly, (2) EPA's sole responsibility, under law, is the protection of the environment. However, DOE or DoD, in conducting CERCLA cleanups that fully comply with EPA directives, because of their lack of standing as environmental advocates, are thus tasked with performing the requisite analyses in a manner that complies with NEPA as well as CERCLA.
In response, the DOE (1989) and the DoD (Hanson, 1992; Hastings et al., 1994) have issued directives to integrate the NEPA and CERCLA compliance process so that a single ROD can be issued at the conclusion of the analyses called for by the two laws. Obviously, if the two sets of requirements were addressed in sequence, CERCLA followed by NEPA, the attendant time lapse could span many years. However, because of the differences in the requirements of the two laws, the merging of the two sets of compliance documents may entail some difficulties.
The net effect of the need for DOE and DoD to comply with both NEPA and CERCLA documentation requirements is to increase the amount of time that would need to precede the initiation of remedial actions at a site. Also, because both laws require public participation, and both laws waive the government's sovereign immunity from lawsuits, there could be numerous delays. However, the burden of complying with NEPA may be small in comparison to the compliance efforts called for under CERCLA, as Hanson (1992) points out,
The court record shows that there is an even greater potential for administrative procedural burdens under CERCU than under NEPA.
Hansen (1992) identifies a number of potential problems in integrating the two sets of requirements. In addition, it is noted that the public participation in the CERCLA process is much more extensive than is the case for the NEPA process, as evidenced by the fact that under CERCLA, the entire administrative record file is required to be made publicly available (Pantex Plant, 1995). In contrast, the corresponding records for the NEPA process need not be made publicly available in full.
At the present time, little detailed guidance exists on the integration of the NEPA and CERCLA process. As of this writing, in January 1996, we have identified only one situation in which NEPA and CERCLA compliance efforts for DOE or DoD facilities requiring a full-scale EIS have resulted in a single ROD, the BOMARC Missile Site at McGuire AFB, a relatively small site discussed in Appendix A (Hastings et aL, 1994). One set of notebooks contains the BOMARC RUFS and another contains its EIS. Much of the text can be found in both documents, though their organization differs.
3-7

It is likely that as various agencies conduct combined NEPNCERCLA processes, some of the current difficulties will be remedied. However, evidence that the difficulties can be substantial is shown in (NRC, 1995b), where the performance of a combined NEPNCERCLA process, constrained by lawsuit and a resultant consent decree, is leading to delays in the decommissioning of an NRC-licensed facility.
3.5 Responsibilities of Multiple Government Agencies
In addition to the EPA-promulgated NCP, there are three FEMA-promulgated documents describing the inter-agency relationships relating to a DOE or DoD plutonium-dispersal accident: (1) the Federal Radiological Emergency Planning and Preparedness regulations at 44 CFR 35 1 , (2) the Federal Response Plan (FRP) (FEMA, 1992), and (3) the Federal Radiological Emergency Response Plan (FRERP) (FEMA, 1985; 1994).
Under both the current and proposed versions of the FRERP, during all stages of the post- accident period, all of the cooperating agencies listed below are tasked with providing requested support services, using their own funds, if such support does not interfere with the performance of their statutory responsibilities. However, in the event of a National Disaster declaration by the President, agencies would be reimbursed for their expenditures from Congressional disaster relief appropriations (see 42 USC 6 5147).
The remainder of this section is based on the NCP and the FRERP, which are pertinent to the potential accidents under consideration. 44 CFR 351 is focused on emergency preparedness and the FRP is focused on natural disasters. The following collation of responsibilities, which is by no means exhaustive, is presented to demonstrate that the relationships between agencies may be complex and that there could thus be delays before concurrence was reached.
For all peacetime nuclear incidents, the DOE is responsible for implementing the Federal Radiological Monitoring and Assessment Plan (FRMAP) during the immediate "emergency" period following the event. The FRMAP calls for the DOE to play the lead role in the initial assessments of the nature and extent of the radiological emergency and its potential effects on public health. After the situation becomes stabilized, the DOE is to transfer that responsibility to the EPA. The EPA plays the lead role in implementing the FRMAP during the intermediate and recovery phases.
For accidents involving material under its control, the DoD would be the LFA during both the emergency phase and in subsequent site restoration activities. When assigned this responsibility, the DoD can request the assistance of DOE'S capabilities throughout the period culminating in release of the site for unrestricted use.
For nuclear weapons accidents involving either DOE or DoD material, technical and logistic services would be available from the Joint Nuclear Accident Coordinating Center (JNACC). The procedures for such DOEDoD cooperation by the Accident Response Group (ARG) are maintained in a high state of readiness through field exercises coordinated by the DoD's Defense
3-8

Nuclear Agency (DNA). In the period immediately following an accident, such support could take the form of mobile analytical laboratories (and trained staff) that can be airlifted to an accident site on short notice.
During the emergency phase, FEMA plays the lead role in coordinating the participation of Federal and local agencies. If the evacuation or relocation of population are necessary, FEMA arranges such actions in coordination with local authorities; however, local authorities may undertake evacuations under their own authority if an imminent hazard is judged to be present.
Under authority of the Atomic Energy Act, the EPA is tasked with setting generally applicable standards for protection from radiation. For all stages of post-accident recovery actions, the EPA can also issue, at any time, revised recommendations for PAGs. The EPA also reviews and approves all CERCLA response actions and compliance documents of the DOE and DoD.
The Department of Health and Human Services (HHS) has the authority to declare a health emergency, assist with emergency housing and medical care, provide psychological counseling services for disaster relief, perform risk assessment of hazardous substances and epidemiological studies of affected population. The Food and Drug Administration (FDA), an agency of HHS, specifies the protective actions necessary for assuring fitness for consumption of human food and animal feed.
The Occupational Safety and Health Administration (OSHA) a branch of the Department of Labor (DOL) has authority to conduct safety and health inspections of hazardous waste sites. OSHA can take unilateral action to protect workers, if it determines such an action is necessary. Although Federal agencies are exempt from OSHA authority under normal circumstances, the NCP states that its OSHA provisions would apply to Federal agencies.
As public trustee of two million square kilometers of Federal lands, including national parks and wildlife refuges, and Bureau of Land Management lands, the Department of the Interior (DOI) would play an important role if any of its lands were affected. For accidents affecting tribal lands, the DO1 would act as an intermediary between tribes and other government agencies.
The U.S. Forest Service, a branch of the U.S. Department of Agriculture (USDA), has responsibilities for the protection and management of national forests and grasslands, and would have a role if an accident affected such lands. Another branch of the USDA, the Food Safety and Inspection Service, establishes acceptability for slaughter of exposed or potentially exposed animals and their products.
The Department of Transportation (DOT) would play an important role if an accident were to affect a federal highway, airport, or other related infrastructure. The United States Coast Guard (an agency of DOT during peacetime) would play a similar role if navigable waterways were affected. DOT regulations on the packaging and transportation of radioactive materials would be applicable to the transportation of samples to off-site analysis laboratories as well as to any off-site transportation of waste material generated during remediation.
3-9
In the past, broad deference has been given, by EPA and the Federal courts, to State jurisdictions that set radiation protection standards more protective than those issued by the Federal government. The record is less clear regarding local governments and Indian tribes.
However, a current draft guidance document (DNA, 1993b) emphasizes that the DoD's On-Scene Commander (OSC), the corollary of the DOE'S On-Scene Coordinator, in order to minimize future problems, must address the concerns of State and local authorities and the general public, including citizens groups and environmental advocates.
3.6 Impacts of the Need for Concurrence
The larger the affected area, the more likely it is that there will be difficulties in reaching concurrence among the multiple government agencies with affected interests. Under the FRERP, during the emergency phase, FEMA, as the Federal coordinator is tasked to,
refer all interagency policy issues and interagency operational problems which cannot be resolved at the scene to FEMA headquarters for resolution with Federal agencies at the national level.
It is also noted that under the FRERP, the EPA is empowered to take unilateral action to protect the public health without the concurrence of other Federal agencies. If such action were taken under its CERCLA authority, the EPA might utilize Superfund monies, with the expended funds ultimately reimbursed to Superfund by the LFA. Such an event is deemed very improbable. However, the existence of the authority underscores EPA's important role in DOE and DoD cleanups under CERCLA.
Circumstances that could arise in the event of a plutonium-dispersal accident are difficult to predict. Nevertheless, a framework of laws, regulations, plans, and directives is in place that would provide a structured process for the post-accident decisionmaking. In general it can be stated with some certainty that, everything else being equal, the more numerous the affected parties, the greater the time required to reach decisions and the higher the costs.
3.7 Issues That Could Influence Decisionmaking
Weart (1988) gives a comprehensive presentation of the history affecting public perceptions of the danger of nuclear activities. A number of factors contribute to the public's aversion to nuclear accidents and the residual material that can result from an accident's occurrence. Principal causes of the "images of fear" are (1) association of all nuclear activities with the destructive effects of a nuclear detonation, (2) excessive secrecy and the issuance of misleading information to the public during the Cold War, see (Fradkin, 1989; Oakes, 1994; Udall, 1994), and (3) tendencies of the nuclear-safety and technical communities to focus analyses on so-called "worst-case" accidents.
3-10
Manning (1992) describes some of the problems that have occurred in recent responses to technologically-based accidents, including violations of law, issuance of inaccurate information, and withholding of information, in conjunction with an observed historical tendency of decisionmakers under pressure to make decisions arbitrarily and then attempt to provide a suitable ex post facto justification. However, in all of the cases discussed, these problems resulted when unanticipated events occurred, with a lack of advance planning.
Because of the extensive planning for nuclear weapons accidents, including regular accident exercises with the full participation of Federal, State, and local government agencies, it is unlikely that these problems would occur after a nuclear weapons accident. This is particularly certain because of clear mandates to OSCs to be aware of and to comply with all relevant laws, including NEPA and CERCLA (DNA, 1993b).
Furthermore, in the NAW (DoD, 1990), the list of applicable statutes includes, in addition to NEPA and CERCLA, long-standing laws restricting the authority of military forces to enforce civil law (e.g. see 18 USC 5 1385: Use of Army and Air Force as Posse Comitatus, and 10 USC 5 332: Use of Militia and Armed Forces to Enforce Federal Authority.)
In regard to compliance with laws, it is also useful to mention a joint Army-FEMA planning document (Herzenberg et aL, 1994) for chemical weapon accidents that also stresses the need for military compliance with applicable laws such as NEPA and CERCLA in conducting remediation of an accident site.
Despite the very high level of advance planning for a weapons accident, the social and political reactions to a plutonium-dispersal accident are highly uncertain. Despite the uncertainty, some broad predictions can be made: A very important variable is the location of the postulated accident. If it is a fixed facility where nuclear weapons operations are commonly known to occur, the potential for over-reaction is less than would be the case for accidents postulated to occur during transportation.
The optimal situation for the responsible agency would be one in which all actions were based on sound reasoning, and timely disclosure of accurate information helped to maintain public confidence. A less-optimal case would be one in which an absence of reliable information led to exaggerated fears and to over-reaction. Costs would be incurred as an inevitable outcome of the actions taken to protect the public. If the perceived risk is large, that would ultimately lead to greater protectiveness of the actions implemented, and higher associated costs.
The phenomenology of an accident could be an important determinant of public reaction. An HE-detonation event would be very dramatic, with possible injuries and deaths resulting from the blast. Also, in comparison to a fire, an HE detonation would probably contaminate a larger area. As a result, the possibility of over-reaction is greater for HE detonation than for fire.
In both cases, material would be dispersed in a plume or cloud. After passage of the cloud, plutonium deposited on the ground could pose a hazard that, if actions were not taken over the
3-11
following days, months, or years (depending on contamination levels) might exceed the radiation protection criteria established by the EPA. What is most important to recognize is that the dominant exposure pathway for plutonium following cloud passage is resuspension, which is a slow process. The longer the exposure, the higher the dose; and, in most cases, only a relatively small fraction of the affected area would have contamination levels posing an immediate threat to human health.
However, focusing on calculated risks and demonstrating that they are minimal is of little use for estimating the costs associated with a potential accident. The decisionmaking process for protection of the public could be difficult because technical considerations of decontamination effectiveness and calculated risk would need to be considered in addition to considerations of sociaVpolitica1 factors (as discussed in Appendix B).
3-12
4.0 Overview of CERCLA Requirements A complete description of EPA's guidance on CERCLA implementation is found in the Risk Assessment Guidance for Superfund (RAGS), EPA (1989a; 1991a; 1991b; 1991~). The principal aspects of the guidance pertinent to the estimation of accident costs are summarized in the following subsections.
The legal requirements governing CERCLA cleanups at hypothetical DOE radiation accident sites are substantially the same as the requirements that would be in effect for an accident involving DoD chemical weapons agents; see Herzenberg et aZ. (1994) for the current DoD planning basis for chemical weapons accidents. The two primary differences we note are: (1) the existence of the FRERP, see FEMA (1985; 1994), a response plan for radiological accidents which is not applicable to chemical weapons accidents, and (2) inherent differences in the nature and detectability of radioactive materials and chemical-weapons agents.
For cleanups conducted under CERCLA, based on past experience, it appears reasonable to assume that long periods of time could elapse before actual remediation of an accident site is initiated. At the Johnston Atoll and BOMARC weapon accident sites (see Appendix A), remedial actions are being, or will be, conducted decades after the initiating events.
When there is controversy over the risk posed by environmental releases, detailed "dose reconstruction" studies are typically performed. Several examples exist of the types of dose assessments that might be performed in order to provide a technical basis for the selection of a cleanup standard (Agency for Toxic Substances and Disease Registry, 1995a; 1995b; 1995c), (ChemRisk, 1994a; 1994b; 1994c), (Farris et aZ., 1994a; 1994b), and (Technical Steering Panel of the Hanford Environmental Dose Reconstruction Project, 1994; 1995).
For accidents that might affect sensitive ecosystems, the remediation decisionmaking would need to consider the potential damages to the environment that could occur as the result of the various possible remedial actions. It has long been recognized that radiation cleanups in desert areas such as NTS would need to consider the potential harm to the environment, Wallace and Romney (1974) and EPA (1978). There is however little available guidance for the performance of quantitative ecological risk assessments. See Exxon Valdez Oil Spill Trustee Council (1994a; 1994b) and EPA (1992b; 1994c) for examples of the ecological issues that could affect the remediation decisionmaking and the potential difficulties that could be encountered.
4- 1
4.1 Short-Term "Removal Actions"
CERCLA terminology distinguishes between short-term, "removal actions," and long-term measures, "remediation." The types of removal actions that may be taken in the early stages of a CERCLA response action are limited. They include relocation of population, erection of fences, removal of visible waste containers and drums, installation of barriers to prevent migration by surface runoff, etc.
Under Superfund-financed cleanups, CERCLA specifies that removal actions should be completed within a period of one year and the cost limit for such actions is set at $2 million. Extensions are allowed if a continued response to an immediate risk is needed and the removal action is consistent with the remedial action to be subsequently taken."
The primary distinction between removal and remediation is that removal actions may be conducted without detailed analyses and there is no requirement for public participation in the decisionmaking. Remediation, in contrast, can only be conducted after the conclusion of a well- defined process that culminates in the issuance of a ROD. Based on precedents established for EPA Superfund cleanups, any decontamination efforts beyond, for example, removal of hot spot soil with shovels and pails, might not be undertaken in advance of the ROD.
Short-term removal actions that would make future permanent remediation more difficult are specifically prohibited under CERCLA and the NCP. Thus, the immediate use of equipment to plow contaminated soil deep below the surface would probably be prohibited. Also, any proposed application of fixatives to reduce resuspension would face critical scrutiny from an ecological perspective to ensure that plant and animal habitats are not damaged. To ensure compliance with these constraints, any actions taken in advance of the ROD would require the concurrence of the EPA, State, and tribal authorities.
4.2 Site Evaluation
In advance of remediation, a detailed assessment of the nature and extent of the contamination is typically performed. The scoping of this "site evaluation'' is required under the NCP to be performed in a manner that considers public comments via an open meeting. Also, the EPA and State, tribal, and local authorities are involved in the decisionmaking surrounding the plan to characterize the site.
In a series of directives issued by the EPA's Office of Solid Waste and Emergency Response, the OSWER Directives, the EPA gives instructions to its Remedial Program Managers (RPMs) as to the Data Quality Objectives (DQOs) to be achieved in EPA-conducted site characterizations under CERCLA (EPA, 1987a; 1987b).
For example, such a waiver was issued by the EPA Administrator in the initial ROD for 15
Times Beach (EPA, 1984).
4-2
The specified DQOs are quite rigorous, calling for dense sampling of the site, sampling of soil, water, and vegetation, randomized selection of sampling locations, and prohibition of the use of an evenly-spaced "purposive" rectangular or polar sampling grid.
In order to verify the accuracy of laboratory analyses, the EPA calls for the use of split samples independently analyzed by two laboratories, and the submission of blank samples containing no contaminant and spiked samples containing a known quantity of contaminant. The analyzing laboratories must be "blind" as to the origin of the samples. It is doubtful whether the specified DQOs would be feasible for all analyses of samples taken from a large contaminated region, (an area exceeding a square kilometer.) Considerations of practicality suggest that the resources available might be best focused on reliably defining the outer boundary of the affected region, and thereby assuring the safety of the individuals located outside of the RCA.
The OSWER Directives were developed for the guidance of EPA staff, and are subject to change without advance notice. In no respect are they binding on DOE or DoD CERCLA actions. However, a proposed DOE or DoD plan of action that deviated markedly from the available guidance, or past practice, might lead to non-approval by the EPA, negotiations, and delays.
4.3 Applicable or Relevant and Appropriate Requirements (ARARs)
In order to lay a framework for the ultimate decisionmaking on remediation, CERCLA calls for a determination of applicable requirements such as Federal, State, and local laws and regulations restricting land usage, maximum permissible concentrations of contaminants, etc. But applicability is not the only consideration. CERCLA also requires consideration of relevant and appropriate requirements; the combined set of requirements is referred to by EPA as Applicable or Relevant and Appropriate Requirements (ARARs).
Under the NCP, ARARs include legal requirements that, although not having the force of law in the specific situation, are intended to apply to similar situations, and that therefore may be deemed appropriate to apply. An example of such an appropriate but not applicable requirement might be an NRC regulation pertaining to licensed facilities; the NRC has no jurisdiction over DOE or DoD nuclear weapons activities, but plays an important role in regulating the safety of other nuclear activities. The NCP allows the LFA a great deal of flexibility in the determination of ARARs, and subjective judgements considering site-specific factors may be made.
For instance, waivers from the ARARs are allowed, provided a suitable justification is given. In that respect, at least for activities conducted on the site, CERCLA can be thought of as taking precedence over other applicable laws and regulations. For example, if DOT regulations on the packaging of radioactive material for transportation on-site were deemed an undue burden on remediation, a waiver from those requirements could be justified in an RWS.
As long as public comments were given adequate consideration by the LFA and there was EPA, tribal, and State concurrence, a waiver might be utilized. This extremely powerful aspect of
4-3
CERCLA is limited to the site of contamination, which is defined by the boundaries of the contaminated area, irrespective of property or jurisdictional boundaries.
4.4 Remedial Investigatiofleasibility Study (RVFS) and Proposed Plan
The principal CERCLA compliance document is titled a Remedial Investigatiofleasibility Study (RVFS). The W F S includes the results of the site evaluation in its entirety. For example, appendices would 'include maps showing locations of all samples taken, contamination levels found, chain of custody forms for analysis of samples, etc.
The RVFS also describes the ARARs and the bases for their selection. The EPA (1990b) describes the process that must be followed in choosing a remedial action as follows.
The two most important threshold criteria are,
(1) overall adequate protection16 of human health and the environment (addressing whether a remedy provides adequate protection and describes how the risks posed through each exposure pathway are eliminated, reduced, or controlled through treatment, engineering controls, or institutional controls), and
(2) compliance with the ARARs (whether a remedy will meet all of the applicable or relevant and appropriate requirements of other Federal and State environmental laws or whether a waiver can be justified),
If a remedy does not satisfy the two threshold criteria, it cannot be considered further.
Five primary balancing criteria are used to examine each potential remedy in turn, providing a basis for the choice of a Preferred Alternative, which is then described in a Proposed Plan. The five criteria are,
(1) long-term effectiveness and permanence (refers to the ability of a remedy to maintain reliable protection of human health and the environment over time, once cleanup goals have been met),
(2) reduction of toxicity, mobility, or volume through treatment (refers to the anticipated performance of the treatment technologies that a remedy may employ),
l6 The EPA (1991a, 1991b, 1991c, 1991d) here defines adequate protection as a reasonable assurance that a maximally exposed individual faces a cancer incidence probability not exceeding the selected risk goal, a chosen numerical value between lo4 and lo4.
4-4
(3) short-term effectiveness (refers to the period of time needed to achieve protection and any adverse impacts on human health and the environment that may be posed during the construction and implementation period, until cleanup goals are achieved),
(4) implementability (refers to the technical and administrative feasibility of a remedy, including the availability of materials and services needed to implement a particular option), and
(5) cost (refers to the total estimated capital, operation, and maintenance costs).
The RVFS and the Proposed Plan are issued to the public and the State for formal comment. During the comment period, public meetings are held to provide additional information and receive comments. After the comment period is complete, two modifying criteria are to be considered by the LFA before choosing a remedial action,
(1) State acceptance (particularly with regard to compliance with State ARARs), and
(2) community acceptance (refers to the public’s general response to the alternatives described in the RUFS and the Proposed Plan).
4.5 CERCLA/NEPA Record of Decision (ROD)
Consideration of the two modifying criteria can result in a selected course of action that differs from the preferred alternative described in the Proposed Plan. The selected course of action and the bases for that selection are described in a CERCLA Record of Decision (ROD) that describes the remedial action to be taken (EPA, 1989b).
4.6 Remedial Des igmsk Assessment (RD/RA)
After issuance of the ROD, the Remedial DesigdRisk Assessment (RD/RA) stage encompasses all of the activities needed to plan the implementation details of the remediation efforts. However, CERCLA allows the flexibility to deal with unanticipated circumstances through the modification of a previously issued ROD, if information gathered during the RD/RA process indicates that such a modification is necessary (ibid).
4-5
4.7 Time and Cost Requirements for CERCLA/NEPA Compliance
The historical experience in Superfund cleanups (GAO, 1988; Office of Technology Assessment, 1988) indicates that many years might elapse before the remediation of an accident site could be initiated.17 The 1986 amendments to CERCLA added a requirement for "substantial and meaningful" involvement of the States in the initiation, development, and selection of remedial actions. There is ample evidence that achieving concurrence with States can be time-consuming.
When CERCLA came up for reauthorization in 1994, the Administration proposal for CERCLA revision responded to pressures for "environmental justice" by expanding the current scope of public participation through the mandate to organize formal Community Work Groups (CWGs) as advisory bodies involved in remediation decisionmaking (Clinton, 1994). It can be expected that if the scope of public involvement increases, the decisionmaking time will increase. Also, because both NEPA and CERCLA waive the Federal government's sovereign immunity, numerous opportunities for additional delays are possible as a result of citizen lawsuits challenging Federal actions.
After consideration of (1) historical experience of CERCLA cleanups, (2) potential difficulties in reaching concurrence of multiple government agencies and jurisdictions, (3) current expansion of public role in decisionmaking, (4) need to fulfill requirements of both CERCLA pJ NEPA, and (5) waivers of immunity-we concluded that a period of several years might elapse before the ultimate cleanup of an accident site could be conducted.
As a result, it is possible that the affected property would be condemned. Deterioration of structures and difficulties in detecting and removing plutonium embedded in structural materials, after a lapse of several years, would make demolition of all surface structures, removal of debris, scraping of surface soil, and shallow land burial of the radioactive debris one cost-effective and technologically reliable approach to decontamination.
In support of that conclusion, it is instructive to note the words of Langham, et al. (1956) from an era when environmental standards were much less stringent than now,
The problem of decontaminating the site of the accident may be insurmountable and it may have to be "written of' permanently with at best an attempt to $x the plutonium and keep itfrom moving around. Demolition and burial of a building is dificult butpossible, and may be the best countermeasure.
In an assessment of the remedial measures that could be utilized for removal of 23gPu contamination from urban areas the National Aeronautics and Space Administration recently
l7 EPA-administered CERCLA cleanups have often been delayed by the need to identify and obtain financial arrangements with private potentially responsible parties (PWs). Some of the factors causing those delays might not be present for DOE or DOD cleanups.
4-6

(1995) indicated that the demolition of some or all structures might be performed if a highly protective strategy for remedial action was utilized.
If it were determined that an expedited cleanup of an accident site was necessary, the time lapse associated with the CERCLA and NEPA compliance processes could be eliminated. Both NEPA and CERCLA allow for waivers. Waivers might be utilized if vital property, such as a major airport or an Interstate highway required rapid cleanup. Political and social pressures could also motivate a legislative exemption if urban property were contaminated.
NEPA allows waivers for "emergencies" (see 40 CFR 1506.11) and the common practice is for the head of the Agency to inform the CEQ and the EPA. For actions taken during a National Disaster the Robert T. Stafford Act explicitly provides for a statutory exclusion from NEPA for actions taken during the period of a declaration that have,
the eBect of restoring a facility substantially to its condition prior to the disaster of emergency
(FEMA, 1995). There is no corresponding statutory exclusion for CERCLA during National Disasters. CERCLA, however, specifically does allow for "national security" waivers (42 USC 6 9620Q)). The CERCLA waiver requirements are more onerous than is the case for NEPA waivers; they are,
The President may issue (CERCLA waivers) regarding response actions at any specified site or facility of the Department of Energy or Department of Defense as may be necessary to protect the national security interests of the United States at that site or facility. ... The President shall notih Congress within 30 days of the issuance ... of any such exemption. Such notification shall include a statement of the reasons for the granting of the exemption. An exemption ... period ... may not exceed one year. Additional exemptions may be granted ... each ... for a specijied period which m y not exceed one year. The Congress shall be notified periodically of the progress of any response action with respect to which an exemption has been issued under this paragraph.
Federal agencies are fully subject to CERCLA (42 USC 8 9620: Federal Facilities),
in the same manner and to the same extent, both procedurally and substantively, as any nongovernmental entity.
The EPA Administrator is given clear authority (42 USC 0 6961: Application of Federal, State and Local Law to Federal Facilities) to proceed against any Federal agency that fails to follow applicable laws governing waste disposal, generation, and management.
However, CERCLA gives the President broad powers (42 USC 0 9606: Abatement Actions):
4-7

when the President determines that there may be an imminent and substantial endangerment to the public health or welfare or the environment because of an actual or threatened release of a hazardous substance from a facility, he may require the Attorney General of the United States to secure such relief as may be necessary to abate such danger or threat, and the district court of the United States in the district in which the threat occurs shall have jurisdiction to grant such relief as the public interest and the equities of the case may require.
This clear statement of Presidential authority to abate threats to the public health or welfare is the principal basis for our analysis of the expedited remediation of urban areas and highways and airport runways. We have assumed that irrespective of whether a CERCLA waiver were issued for reasons of national security, an expedited effort could be performed, if so directed by the President.
In the absence of a Presidential directive to proceed expeditiously, there is considerable evidence to suggest that substantial time could elapse before remediation. Fifteen years after the enactment of CERCLA, there were 1238 sites on the National Priority List (NPL), with 51 sites being proposed for addition to the list (EPA, 1995a). As of April 1995, only 74 sites had been cleaned up.
The EPA has recently provided aggregate cost figures (in 1994 dollars) for the cleanups to date (ibid.). Average cost for an RUFS is $1.35 million, average cost for a Remedial Design is $1.26 million, and average cost for a Remedial Action is $22.5 million. No cost was given for the Risk Assessment (RA) component of the RD/RA.
4-8
5.0 Timeline of Post-accident Actions Two alternative scenarios for post-accident actions are considered: (1) remediation is accomplished after completion of the NEPNCERCLA processes with a likely time lapse of several years, and (2) expedited remediation of highways, airport runways, and urban land.
A period of three months was used to calculate the cost of expedited cleanup of lightly contaminated urban areas: one month for planning, assembling resources, and survey; one month for actual cleanup; and one month for certification and resettling inhabitants." A period of six months was used for moderately contaminated areas, and one year for heavily contaminated areas. Work on highways and airport runways could begin almost immediately, because detours and rerouting of air transportation routes to alternate airports could be used to ensure that vital traffic would not be seriously delayed. Although none of the calculations is critically time dependent, longer delays could make decontamination more difficult or even impractical.
It is noted that apart from Federal planning for cleaning up highway spills, there are currently no procedures in place for the expedited remediation of radiation accident sites (Adler, 1995). Throughout the Cold War, extensive plans were made for recovery from nuclear attack (Federal Civil Defense Administration, 1952; Owen and Sartor, 1963; Cammarano et al., 1964a, 1964b; and Oakes, 1994). Although the civil defense planning documents remain available, the prior high level of readiness has not been maintained.
Although cleanup procedures could be improvised as needed for a contemporary accident, the primary focus of emergency preparedness in the U.S. is on natural disasters. Also, the current planning base for nuclear weapons accidents includes no training for DoD and DOE OSCs regarding the use of CERCLA and NEPA waivers to facilitate the performance of an expedited response action (Dassler, 1994).
5.1 Emergency Actions
If an accident occurred during transportation, the first responders at the scene are likely to be local police or fire personnel. In such an event, immediate actions by local authorities to protect the nearby populace, including nearby evacuation and highway or airport closure, might be initiated as a precautionary measure in advance of any response actions by Federal agencies.
This schedule might be unduly optimistic if nearby areas were so heavily contaminated as to require more intensive measures, because operations in a nearby heavily contaminated region could recontaminate buildings and soil that had already been cleaned.
18
5- 1
For an accident at a fixed facility, the prompt activation of emergency-response procedures would result in simultaneous and coordinated actions by local authorities and facility staff. For both transportation and fixed facilities, a first priority of the accident responders would be to notify and take protective measures for nearby populace as soon as possible. State and local authorities often carry out evacuations in response to natural disasters or toxic chemical releases, and a local response might be initiated in advance of the Federal response.
As a result of disaster preparedness exercises coordinated by FEMA, local and State governments have a clear set of procedures that can be followed to initiate a Federal response after an accident or man-made disaster beyond the capabilities of the local authorities. It is anticipated that notification of an accident situation would be made promptly, initiating a coordinated Federal response.
After activation of the Federal response, initial predictions of cloud path and ground contamination would rely on the M A C modeling capabilities maintained by the Lawrence Livermore National Laboratory (DoD, 1990). During normal working hours, preliminary estimates of ground contamination could be available within 30 minutes after notification, with a 60 to 90 minute additional delay outside of normal working hours.
Because 239Pu and 2u)Pu are primarily alpha emitters, one might suppose that alpha-counting instruments would be used for detection of plutonium contamination. In fact, alpha-counting instrumentation was used for the Palomares, Spain cleanup and found unsatisfactory for field use (McRaney, 1970; DNA, 1975). The low range of alpha particles makes accuracy difficult and the detectors are fragile; contact of the detector window with a blade of grass can disable the instrument.
A satisfactory field method is to measure the 60-keV gamma ray emitted from 241Am, the daughter product of 24'Pu. The latter is only present as an impurity, usually in small amounts. The ratio of 239+240Pu to =lAm (denoted as Pu:Am) depends on age and initial assay. Radiochemical analysis of soil samples can give an accurate picture of this important ratio. A discussion of the Pu:Am ratio is provided in Appendix D. Measurement of the 24'Am gamma-ray emission was first used at Thule, Greenland, and has been refined over subsequent years.
Apart from limited ground surveys with hand-held instruments, the first complete on-site measurements would probably be aerial surveys. Aerial surveys can give rapid, although relatively crude, isopleths within a few hours. The window for aerial measurement is very wide, typically on the order of 0.01 km2; because measurements are averaged over that area, isolated hot spots are not likely to be observed. Also, because of the short range in air of the radiation emitted from weapons grade plutonium, contamination at the 0.2 yCi/m2 screening level (see Appendix B) could not be measured. However, aerial surveys could be used to determine the approximate boundaries of the area(s) of concern, the location(s) of peak contamination, and the precautions ground surveyors should take.
5-2

After analysis of aerial survey results, ARAC calculations could be adjusted to match the measured contours of high contamination. The adjusted calculations could improve the approximation of the outer boundaries of the contaminated area.
In the event of a rapid mobilization of available resources, up to fifty skilled technicians could be available within one or two days to conduct an emergency characterization of the radiological contamination (Johnson, 1994). Several hundred technicians, with air-transportable laboratories, might be on-site within a week. For perimeter detection, a FIDLER @eld Instrument for Detection of Low Energy Radiation, a device for measuring radiation from =lAm) could be carried at a slow walking pace along a closed loop or serpentine path until a count rate of twice the background level is observed. The perimeter of an area of several square kilometers could thus be reliably defined within a few days in open, easily accessible areas.
Air sampling would be performed early in order to estimate the resuspension factor. Air samplers trap airborne dust by forced flow through filter paper, which is then analyzed in the laboratory. Air sampling and monitoring would probably continue for a long period after an accident, in order to detect changes in resuspension with time. EPA guidance for CERCLA (EPA, 1989a) and its PAGs (EPA, 1992a) call for continuous air monitoring.
A useful picture of the extent of contamination could be expected to be available in less than a week, even if the affected area were large. These early data would become the basis for important decisions on the short-term actions necessary to protect any persons remaining in the accident vicinity.
The terrain types most difficult to survey, mountains and forests, are usually sparsely populated. However, under most conditions, the location(s) of heaviest contamination, from which prompt relocation might be advisable, could be defined within one or two days. Complete perimeter definition of lower contamination levels might require one or two weeks, and could take more time in difficult terrain or if there were multiple isolated hot spots.
The meteorology during an accident and shortly thereafter would determine the patterns of deposition. If windspeed, wind direction, or precipitation showed great variation with time, radiological characterizations could be very difficult due to non-uniformity of the deposits. If precipitation were so pronounced as to result in surface runoff, the migration of material would further complicate the problem.
Under most circumstances, only a small fraction of the contaminated area would be so intensely contaminated that prompt relocation of the populace would be performed. Data in (DOE, 1995a) show the areas near NTS contaminated with plutonium during Operation Roller Coaster in the 1963 events Double Tracks 1 ,2 , and 3, and Clean Slate. These tests were chosen for illustration because they approximated the conditions of a hypothetical plutonium-dispersal accident involving HE detonation.
5-3

However, that study (ibid.) utilized airborne measurements taken thirty years after Operation Roller Coaster. These measurements are of doubtful accuracy for the low-contamination contours because of terrain-shielding effects and time-dependent erosion due to wind and rain. One of the authors of that study has cautioned us regarding the limited validity of these later aerial measurements (Deshler, 1995). Nonetheless, most of the area (about 90%) appears to be contaminated at a very moderate level, less than 100 pCi/g. And, only a very small fraction of the area is contaminated at greater than 400 pCi/g. For comparison it is instructive to note that soil contaminated at levels below 2000 pCi/g can be shipped without any special measures such as "radioactive" placarding on the vehicle (see Section 5.4).
Data presented by Dick and Baker (1967) of plutonium contamination from the Plumbbob event are probably of much greater accuracy than the later aerial measurements; both ground survey and radiochemical analysis were used promptly after the event. No data were presented for the lightly contaminated areas, less than 100 pCUg (approximately 6 yWm2 for a 4-cm mixing depth). However, the data are qualitatively similar in that the heaviest concentrations were only found in a small fraction of the total area.
In the period immediately following an accident, limitation of exposures resulting from the resuspension pathway would be important. In a populated area, resuspension would be augmented by the mechanical disturbances associated with human activities. Fixatives might be applied to reduce public exposures and migration of material.
Several actions have been found effective in reducing resuspension by an order of magnitude or more (Howorth and Sandalls, 1987; Tawil et al., 1987; Menzel and James, 1971): plowing, leaching with chelating agents (FeC1, or EDTA), or spraying with rapid-cure road oil. The last method was used at NTS without harmful effects on the desert ecology (Wallace and Romney, 1974).
Western et al. (1973), in an analysis of soil stabilization focused on Nevada desert, found that the application of DCA-70, a polyvinyl film, was more effective than oil, asphalt emulsions, and an asphalt-sealed polypropylene sheet. Although oil was said to last only a month, the DCA-70 remained intact two and a half years after application. They noted however, that it would kill plants and animals and, "to most viewers, some of the results of these treatments would be unaesthetic. It
All of the stabilization methods that could be used are likely to either make subsequent remediation more difficult or cause some damage to ecosystems. The only method of fixation currently considered in DNA weapon accident exercises, water, might have an effectiveness of very short duration in arid regions with high winds or other mechanical disturbances.
One immediate action that might be utilized is windrowing, scraping a thin layer of soil with a road grader. The scraped surface soil is left in windrows, which are more easily managed than distributed contamination, and from which resuspension is reduced. Windrowing is only feasible on open land.
5-4

CERCLA explicitly calls for actions such as the blocking of watercourses and sewers to prevent material from being carried off-site or into drinking-water supplies. For the case of extended remediation we assumed that an acceptable fixative would be water judiciously applied in order to avoid runoff. It is possible, however, that more effective fixatives such as road oil could be used to reduce resuspension and alleviate the hazard to nearby residents.
The most important early actions would be to define the boundary of the contaminated area and limit public access to the region. In accordance with the NCP and the FRERP, an ad hoc working group consisting of the OSC and staff, State and local governments, and the EPA and other Federal agencies would be involved in decisionmaking for early actions. After establishment of the boundaries of the Radiological Control Area (RCA), inhabitants not already evacuated from the RCA could be relocated by local authorities in coordination with FEMA.
Contaminated properties would probably have to be acquired if decontamination and remediation were not completed for several years. If the area was not already Federally owned, actions might be taken to condemn and acquire the entire contaminated site and a suitable buffer zone. All inhabitants not already evacuated could be relocated. It is possible that some land owners might contest condemnation if they wanted to remain and that others might insist that their property be added to the affected region (Jensen and Feldman, 1986), so that this process could be time consuming and difficult.
The described actions have as their ultimate goal the protection of the public from plutonium resuspended in the air by wind or mechanical disturbance. Even if all inhabitants were relocated, resuspension could result in the migration of material, expanding the size of the contaminated region. Some temporary fixation methods to control resuspension show promise (e.g. rapid- setting foam). Such methods might be utilized after testing to demonstrate safety and effective- ness. In a recent ARG exercise, the planning basis was to utilize water as a fixative because it was considered relatively benign; however, it is conceivable that more effective fixatives, such as road oil, might be used if conditions warranted.
5.2 Detailed Characterization
In addition to radiological surveys, geological, biological, hydrologic and geographic characterizations are called for by CERCLA. For plutonium contamination, unless an accident were to occur in a sensitive or high-value ecosystem, we expect that the cost for the non- radiological characterizations would be less than the cost of radiological characterization. This is because many samples would need to be taken, analyzed in a laboratory, and statistical methods must be applied.
Accurate characterization of the site requires taking and analyzing samples, including profile samples to determine the variation of contamination with depth. Sample analysis supplements but does not replace in situ measurements. Laboratory analysis can characterize contamination with great accuracy. The most time-consuming factor is testing for individual elements in a soil, water, or vegetation sample. This involves complex chemical-separation techniques, followed
5-5
by radio-assay. In rugged or complex terrain, where field surveys could be difficult, many thousands of samples might have to be analyzed in a laboratory.
Field measurement of 23*"0Pu ground contamination down to levels of 0.2 pCi/m2 can be accom- plished without difficulty for aged plutonium. The higher sensitivity that would be needed for fresh plutonium is possible, but with higher cost and time requirements. For a given sensitivity, the time and cost can be considered directly proportional to the area.
Until recently, the usual hand carried instrument for close ground surveys was the FIDLER. The FIDLER also measures the 60-keV gamma rays from "'Am. The sensitivity of the FIDLER depends on counting time and background, but a sensitivity of 0.2 pCi/m2 of "'Am is achievable on a routine basis, and greater sensitivity is often possible with longer counting times.
One previously used system for vehicular surveys is a tracked in situ van known as the IMP. The field of view is a circle with a diameter of 21-25 meters (DNA, 1981). The van uses a liquid-nitrogen cooled germanium detector to measure the 60-keV gamma-ray emission from
Am. The equipment is completely self-contained. Because the detector is a considerable height (7.4 m) above ground level, vegetation can obscure the readings. Shinn et al. (1989a) reported on an experiment at NTS in which the detection limit of "lAm was 0.03 yCi/m2, corre- sponding to a 23*"0Pu level of 0.2 pCi/m2.
241
Recent developments by the DOE have yielded major improvements in the sensitivity of field instruments. One is named VIOLINIST. Miller (1994) describes a hand-held device considerably more sensitive than the FIDLER. Reiman (1994) describes a vehicle-mounted device roughly ten times as sensitive to plutonium contamination as the IMP, capable of reliably measuring 0.02 pCi/m2 of Z1'Am with a one-hour counting time; this sensitivity would be more than adequate for most site characterization.
Even with the newly developed field instruments, the time needed for site characterization to the highest of CERCLA standards could take several years for a site comprising several square kilometers, with much of that time being spent on devising a plan, considering public comments, and gaining concurrence of the State and the EPA. CERCLA-standard site characterization would need to be performed twice, both before and after remediation, in order to certify the site as meeting the selected cleanup criterion.
5.3 Decontamination
Decontamination is the removal of plutonium from land and buildings. Methods can vary greatly with terrain and land use. For example, in flat, sparsely vegetated land, scraping off the surface soil is a simple and effective decontamination measure. At the other extreme is precipitous mountainous forest, where decontamination might be impossible or prohibitively expensive. In the event of an actual accident, decontamination strategies would surely be chosen on a case-by- case basis.
5-6
The decontamination factor (DF) is a commonly used measure of treatment effectiveness. The percent removed, or percent remaining, are also often quoted. The DF is related to these measures as follows:
DF = 100/(100 - percent removed), or DF = lOO/(percent remaining).
A synopsis of our review of the decontamination literature is given in Appendix E. The subject is quite complicated, and the data from different sources are often contradictory. Very few experiments have been conducted under conditions that closely approximate those of the accidents under consideration. The vast majority of the available data is focused on nuclear explosions or reactor accidents where chemistry, mass loadings, and particle sizes differ greatly from what would be expected in a plutonium-dispersal accident. There are almost no completely relevant data for decontamination effectiveness after delays of several years, or even several months. Nevertheless, some general observations can be made, each of which surely has exceptions:
(1) Decontamination is less efficient for small particle sizes. The particles of interest range from a fraction of a micron to a few microns. Most of the experiments, because they were concerned with nuclear explosion fallout, involved particle sizes of tens to hundreds of microns. Adhesive forces are relatively more important for small particles, and they can more easily become lodged in small cracks and crevices.
(2) Decontamination is less efficient for low mass loadings. Most of the DoD decontamination experiments involved mass loadings many orders of magnitude greater than would be expected in a plutonium-dispersal accident, often over 100 grams/m2, because of their focus on fallout resulting from nuclear explosions.
(3) Decontamination appears to become less effective with the passage of time. Most experiments have been conducted within a few days, or at most a few months, of deposition.
(4) Fission products may be more difficult to remove than plutonium. Some fission products could chemically bond to the substrate. The overwhelming majority of decontamination experiments were conducted with fission products.
( 5 ) Repeated passes of any decontamination operation tend to give diminishing returns. A smaller fraction of the remaining contaminant is removed in each successive pass. When any operation no longer removes a significant fraction, results can often be improved by following up with a completely different operation. That is, vacuuming for two or three passes followed by scrubbing with detergent and rinsing can be more effective than continued vacuuming. Many of the experiments did follow a schedule of combining different operations.
5-7
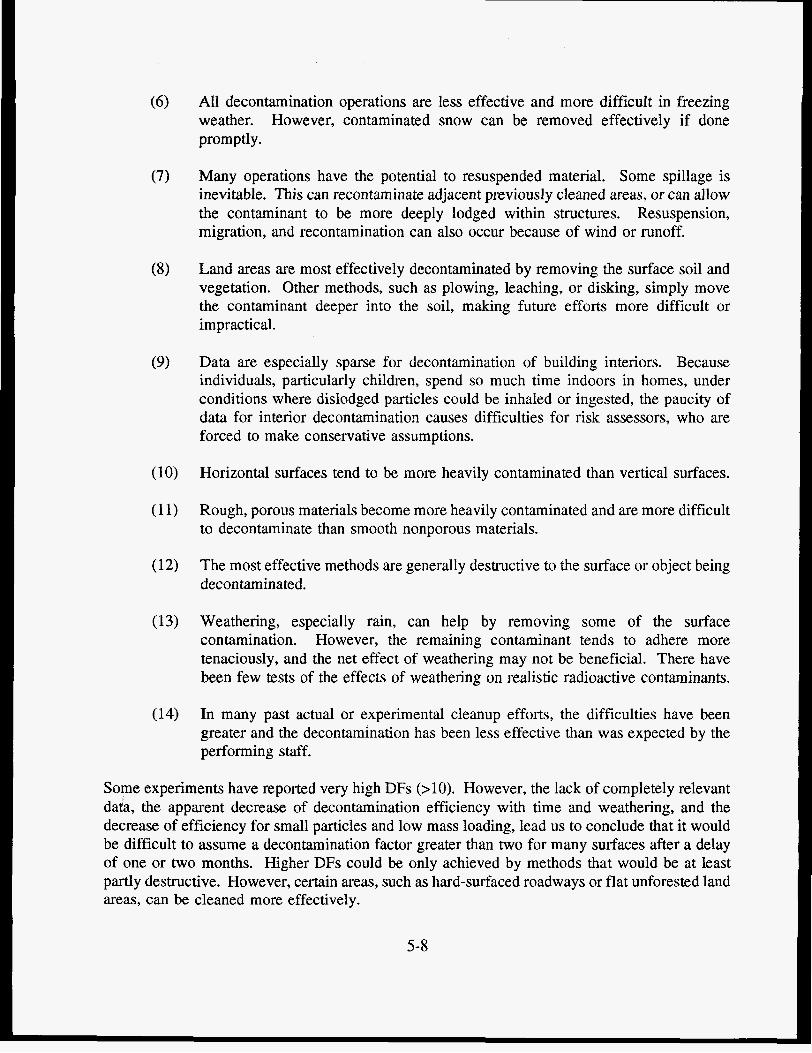
All decontamination operations are less effective and more difficult in freezing weather. However, contaminated snow can be removed effectively if done promptly.
Many operations have the potential to resuspended material. Some spillage is inevitable. This can recontaminate adjacent previously cleaned areas, or can allow the contaminant to be more deeply lodged within structures. Resuspension, migration, and recontamination can also occur because of wind or runoff.
Land areas are most effectively decontaminated by removing the surface soil and vegetation. Other methods, such as plowing, leaching, or disking, simply move the contaminant deeper into the soil, making future efforts more difficult or impractical.
Data are especially sparse for decontamination of building interiors. Because individuals, particularly children, spend so much time indoors in homes, under conditions where dislodged particles could be inhaled or ingested, the paucity of data for interior decontamination causes difficulties for risk assessors, who are forced to make conservative assumptions.
Horizontal surfaces tend to be more heavily contaminated than vertical surfaces.
Rough, porous materials become more heavily contaminated and are more difficult to decontaminate than smooth nonporous materials.
The most effective methods are generally destructive to the surface or object being decontaminated.
Weathering, especially rain, can help by removing some of the surface contamination. However, the remaining contaminant tends to adhere more tenaciously, and the net effect of weathering may not be beneficial. There have been few tests of the effects of weathering on realistic radioactive contaminants.
In many past actual or experimental cleanup efforts, the difficulties have been greater and the decontamination has been less effective than was expected by the performing staff.
Some experiments have reported very high DFs (>lo). However, the lack of completely relevant data, the apparent decrease of decontamination efficiency with time and weathering, and the decrease of efficiency for small particles and low mass loading, lead us to conclude that it would be difficult to assume a decontamination factor greater than two for many surfaces after a delay of one or two months. Higher DFs could be only achieved by methods that would be at least partly destructive. However, certain areas, such as hard-surfaced roadways or flat unforested land areas, can be cleaned more effectively.
5-8
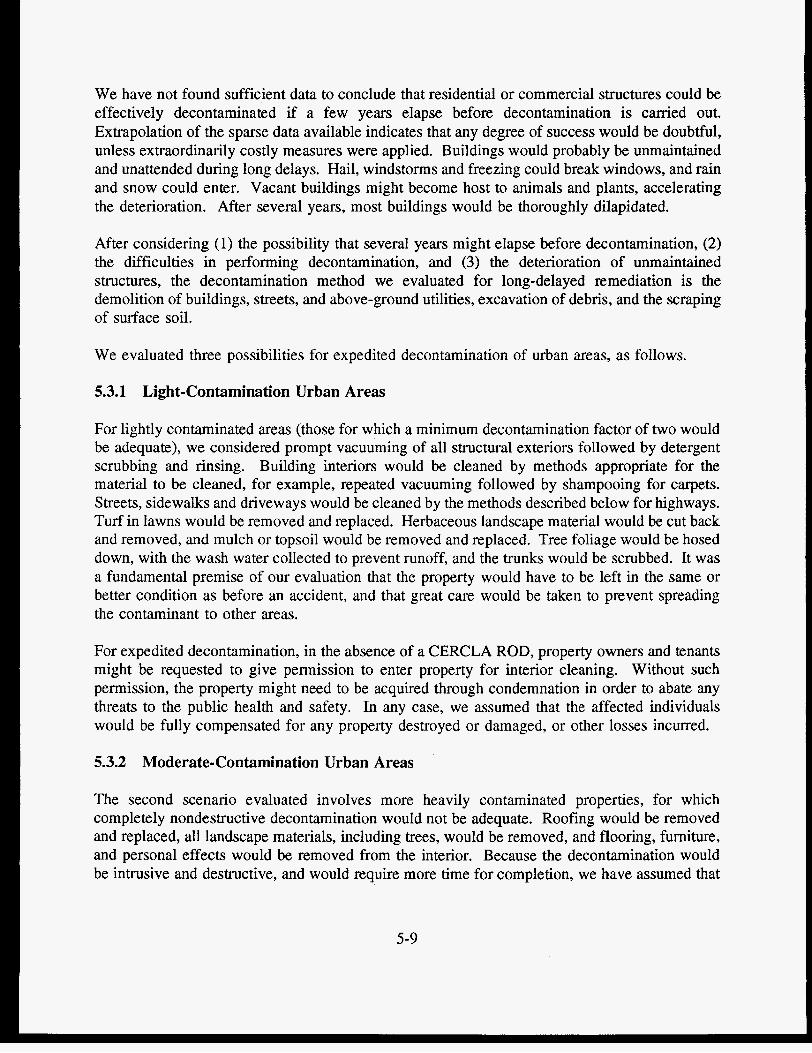
We have not found sufficient data to conclude that residential or commercial structures could be effectively decontaminated if a few years elapse before decontamination is carried out. Extrapolation of the sparse data available indicates that any degree of success would be doubtful, unless extraordinarily costly measures were applied. Buildings would probably be unmaintained and unattended during long delays. Hail, windstorms and freezing could break windows, and rain and snow could enter. Vacant buildings might become host to animals and plants, accelerating the deterioration. After several years, most buildings would be thoroughly dilapidated.
After considering (1) the possibility that several years might elapse before decontamination, (2) the difficulties in performing decontamination, and (3) the deterioration of unmaintained structures, the decontamination method we evaluated for long-delayed remediation is the demolition of buildings, streets, and above-ground utilities, excavation of debris, and the scraping of surface soil.
We evaluated three possibilities for expedited decontamination of urban areas, as follows.
5.3.1 Light-Contamination Urban Areas
For lightly contaminated areas (those for which a minimum decontamination factor of two would be adequate), we considered prompt vacuuming of all structural exteriors followed by detergent scrubbing and rinsing. Building interiors would be cleaned by methods appropriate for the material to be cleaned, for example, repeated vacuuming followed by shampooing for carpets. Streets, sidewalks and driveways would be cleaned by the methods described below for highways. Turf in lawns would be removed and replaced. Herbaceous landscape material would be cut back and removed, and mulch or topsoil would be removed and replaced. Tree foliage would be hosed down, with the wash water collected to prevent runoff, and the trunks would be scrubbed. It was a fundamental premise of our evaluation that the property would have to be left in the same or better condition as before an accident, and that great care would be taken to prevent spreading the contaminant to other areas.
For expedited decontamination, in the absence of a CERCLA ROD, property owners and tenants might be requested to give permission to enter property for interior cleaning. Without such permission, the property might need to be acquired through condemnation in order to abate any threats to the public health and safety. In any case, we assumed that the affected individuals would be fully compensated for any property destroyed or damaged, or other losses incurred.
5.3.2 Moderate-Contamination Urban Areas
The second scenario evaluated involves more heavily contaminated properties, for which completely nondestructive decontamination would not be adequate. Roofing would be removed and replaced, all landscape materials, including trees, would be removed, and flooring, furniture, and personal effects would be removed from the interior. Because the decontamination would be intrusive and destructive, and would require more time for completion, we have assumed that
5-9

all such property might be condemned and thus acquired by the Federal government. We assumed that any property so acquired could be resold without loss.
Condemnation actions could take place under Atomic Energy Act authority or CERCLA authority. As a result, if a CERCLA exemption were issued, the loss of CERCLA authority would not limit the government’s power to condemn property.
In moderate-contamination urban areas, we have postulated that the homes could be renovated and rebuilt, but, because of the major impacts, especially losses of vegetation, there would be dramatic changes in appearance, which could lead to depressed market values. As a result, very heavily contaminated property might require the same actions as for extended decontamination; that is, acquisition, total demolition, disposal, and restoration.
5.3.3 Heavy-Contamination Urban Areas
The third scenario involves properties for which decontamination would be impossible or impractical; that is, those for which a minimum decontamination factor greater than ten would be required. The procedure analyzed for these properties was condemnation and acquisition, total demolition, disposal, and restoration to parkland.
5.3.4 Highways and Runways
Highways could be decontaminated by vacuum sweepers followed by detergent scrubbing and rinsing. Any sections not adequately decontaminated would have to be cleaned by surface removal. Methods for surface removal, in ascending order of effectiveness, cost, and damage, are shotblasting, planing, and complete removal and replacement. If snow were present, there would be benefits from removing it as promptly as possible, before thawing allowed the contaminant to reach the highway surface and wash off onto the roadside.
Contaminated land near the highway would also require decontamination to prevent the highway from being recontaminated later. The method evaluated here, which seems likely to be the most effective, is complete removal of soil to the level of clean soil, and soil replacement. Also, neighboring agricultural crops, weeds, and brush might have to be carefully gathered and removed.
Some of the highway surface operations, and most of the adjacent land operations, have the potential to recontaminate areas already cleaned. Recontamination could be minimized by care, or by covering clean sections of the highways with tarpaulins, but cannot be completely eliminated. There is thus the possibility that a final cleaning of the highway surface might be required to removed redeposited material.
Losses to adjacent property owners would seem likely, either from physical damage or loss-of- use. It is conceivable that unanticipated events during a highway cleaning operation or other large-scale efforts could result in further migration of material, and an expanded cleanup area.
5-10

Additional remediation efforts and compensation payments for any nearby properties impacted in this manner might be necessary.
The expedited decontamination of airport runways would be similar to decontamination of I highways. Fortunately, runways are typically close together, maintained in better condition than roadways, and the areas between runways are typically flat and vegetated only with grass, so that airport runway operations might be considerably less difficult than highway operations.
5.4 Waste Disposal
Federal regulations governing commercial waste disposal sites are codified by the NRC at 10 CFR 61. Those guidelines prohibit siting near valuable mineral resources and in areas subject to natural hazards such as flood, earthquake, and tornado. The NRC specifies a performance- based standard of less than 25 mrem annual dose commitment to a member of the public residing on the site, with a 500 mrem dose limit for an intrusion scenario. Kozak et al. (1990) describe a methodology for evaluating whether a waste disposal design satisfies those criteria. However, the NRC regulations are not applicable to DOE or DoD waste disposal sites.
DOE (1988a) Order 5420.2A gives directions for DOE waste disposal activities that are based largely on the criteria of 10 CFR 61, though stated with less specificity. In 1988, the EPA announced plans to issue regulations that would be applicable to the DOE and DoD under 40 CFR 193, but those regulations have not been issued. Consequently, the DOE and the DoD currently regulate their own waste disposal activities, in conjunction with the host State government. However, for on-site waste disposal conducted at a CERCLA site, the NRC regulations could be considered ARARs.
Current DOE guidelines for shallow land-disposal allow for near-surface burial in a permitted facility for assays not exceeding 100 nCi/g (U.S. Air Force, 1992a). Obtaining a permit would require compliance with Federal, State, and local laws. Disposal of radioactive Low Level Waste (LLW) is prohibited in many regions by State or local laws.
In excavating contaminated soil and debris, it is inevitable that much dilution occurs. It is extremely unlikely that significant volumes of waste material would exceed 100 nCi/g. Small amounts of waste from hot spots that exceeded 100 nCi/g would need to be stored retrievably pending licensing of a geological repository such as the Waste Isolation Pilot Plant (WIPP).
The cost of geologic isolation has been estimated to be $5,000 more per m3 than for shallow burial (Cohen, 1982). Except for very small amounts of material, geologic disposal might be deemed unfeasible in the CERCLA decision process because of excessive cost. Retrievable storage for high-assay waste would be preferable because of its lower cost. Also, there are presently no licensed geological repositories.
5-11

Although land burial at any given CERCLA site might utilized if it satisfied the applicable siting criteria, political and social pressures might weigh against on-site disposal in populated areas. However, waste disposal costs could generally be reduced if on-site burial is utilized.
It is emphasized that the level of hazard posed by the waste material would probably be extremely low. The DOT regulations governing the placarding and transport of radioactive material are codified at 49 CFR Parts 172 and 173.
Per 49 CFR 173.425(c), radioactive material falling into the category of Low Specific Activity (LSA) can be transported in "unpackaged (bulk) shipments" if "exclusive use closed transport vehicles are utilized." For debris and soils contaminated with weapons grade plutonium, bulk shipments, for example in a closed rail car, would be allowed for,
materials of low radioactive concentration, if the average estimated radioactivity concentration does not exceed 0.001 millicurie per gram,
additionally, these (i.e. bulk)
shipments must be loaded by the consignor, and unloaded by the consignee from the conveyance or freight container in which originally loaded.
It is possible that much of the excavated debris would not require radioactive placarding according to the DOT regulations (Feldman, 1986). Per the DOT regulations at 49 CFR 173.403(y),
radioactive material means any material having a specific activity greater than 0.002 microcuries per gram
We note that the above definition is augmented with the statement,
The specific activity of a material in which the radionuclide is essentially uniformly distributed is the activity per unit mass of the material.
Our analysis indicates that a substantial fraction of the debris generated during remediation would have an average specific activity less than 0.002 microcuries per gram (2000 pCi/g), and thus fall outside the scope of the DOT regulations for transportation of radioactive materials. However, the additional costs imposed by the regulations for bulk shipments of LSA are minimal, and we have thus calculated transportation costs by assuming that the shipments are treated as radioactive.
The cost of waste disposal would vary on whether or not on-site disposal is utilized. Cost estimates are presented for two options: on-site shallow burial, and off-site transportation of waste to a shallow land burial site at an assumed distance of 1609 km (1000 miles).
5-12
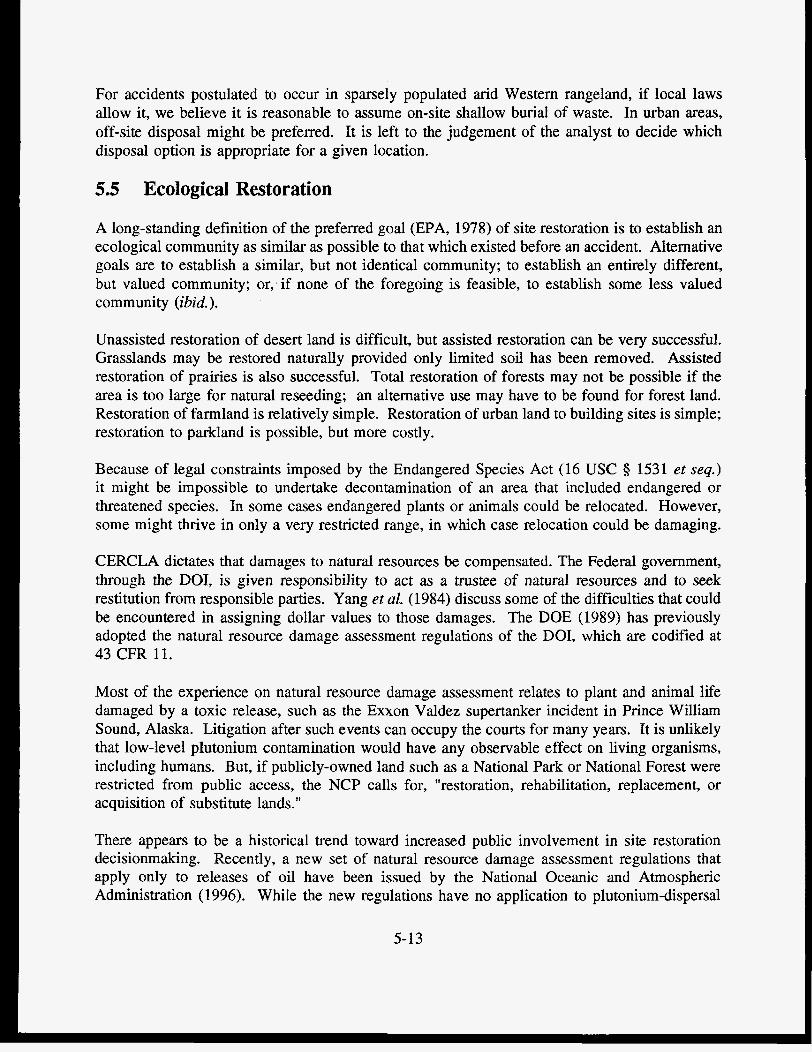
' I
For accidents postulated to occur in sparsely populated arid Western rangeland, if local laws allow it, we believe it is reasonable to assume on-site shallow burial of waste. In urban areas, off-site disposal might be preferred. It is left to the judgement of the analyst to decide which disposal option is appropriate for a given location.
5.5 Ecological Restoration
A long-standing definition of the preferred goal (EPA, 1978) of site restoration is to establish an ecological community as similar as possible to that which existed before an accident. Alternative goals are to establish a similar, but not identical community; to establish an entirely different, but valued community; or, if none of the foregoing is feasible, to establish some less valued community (ibid.).
Unassisted restoration of desert land is difficult, but assisted restoration can be very successful. Grasslands may be restored naturally provided only limited soil has been removed. Assisted restoration of prairies is also successful. Total restoration of forests may not be possible if the area is too large for natural reseeding; an alternative use may have to be found for forest land. Restoration of farmland is relatively simple. Restoration of urban land to building sites is simple; restoration to parkland is possible, but more costly.
Because of legal constraints imposed by the Endangered Species Act (16 USC 0 1531 et seq.) it might be impossible to undertake decontamination of an area that included endangered or threatened species. In some cases endangered plants or animals could be relocated. However, some might thrive in only a very restricted range, in which case relocation could be damaging.
CERCLA dictates that damages to natural resources be compensated. The Federal government, through the DOI, is given responsibility to act as a trustee of natural resources and to seek restitution from responsible parties. Yang et al. (1984) discuss some of the difficulties that could be encountered in assigning dollar values to those damages. The DOE (1989) has previously adopted the natural resource damage assessment regulations of the DOI, which are codified at 43 CFR 11.
Most of the experience on natural resource damage assessment relates to plant and animal life damaged by a toxic release, such as the Exxon Valdez supertanker incident in Prince William Sound, Alaska. Litigation after such events can occupy the courts for many years. It is unlikely that low-level plutonium contamination would have any observable effect on living organisms, including humans. But, if publicly-owned land such as a National Park or National Forest were restricted from public access, the NCP calls for, "restoration, rehabilitation, replacement, or acquisition of substitute lands."
There appears to be a historical trend toward increased public involvement in site restoration decisionmaking. Recently, a new set of natural resource damage assessment regulations that apply only to releases of oil have been issued by the National Oceanic and Atmospheric Administration ( 1996). While the new regulations have no application to plutonium-dispersal
5-13

accidents, they are noted because a principal goal of the rulemaking, as required by a Consent Decree following litigation brought by the Natural Resources Defense Council, was to "bring selection of restoration actions clearly into a public planning process."
5- 14
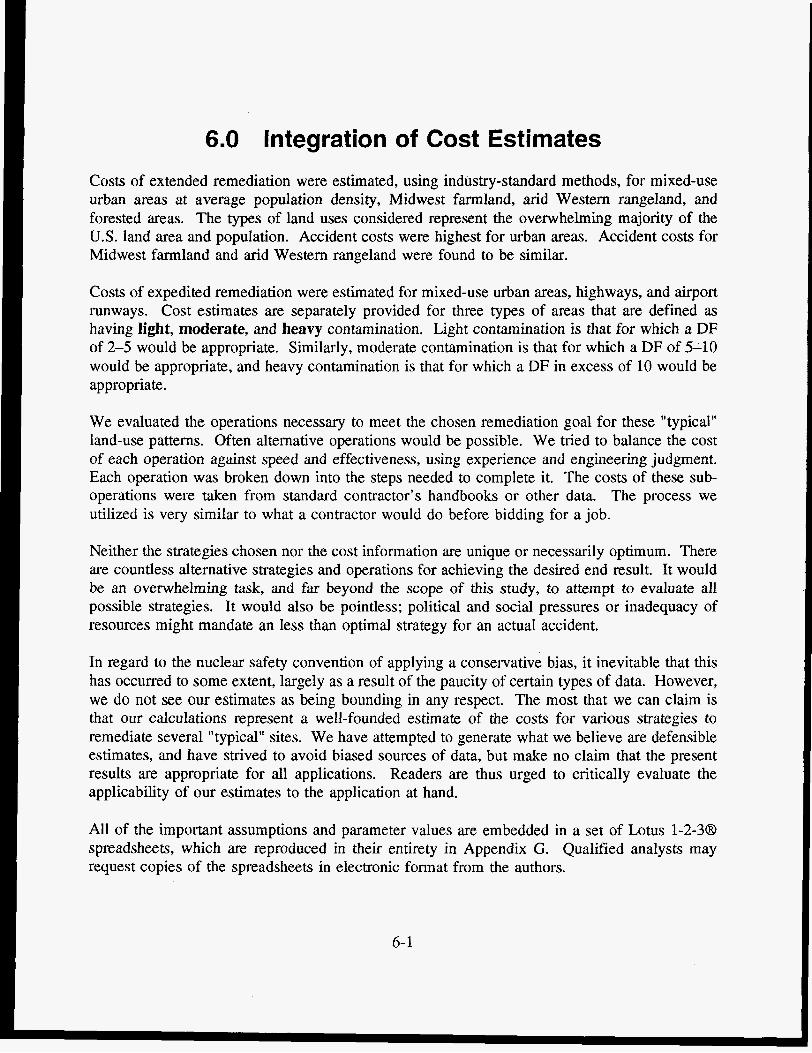
6.0 Integration of Cost Estimates Costs of extended remediation were estimated, using industry-standard methods, for mixed-use urban areas at average population density, Midwest farmland, arid Western rangeland, and forested areas. The types of land uses considered represent the overwhelming majority of the U.S. land area and population. Accident costs were highest for urban areas. Accident costs for Midwest farmland and arid Western rangeland were found to be similar.
Costs of expedited remediation were estimated for mixed-use urban areas, highways, and airport runways. Cost estimates are separately provided for three types of areas that are defined as having light, moderate, and heavy contamination. Light contamination is that for which a DF of 2-5 would be appropriate. Similarly, moderate contamination is that for which a DF of 5-10 would be appropriate, and heavy contamination is that for which a DF in excess of 10 would be appropriate.
We evaluated the operations necessary to meet the chosen remediation goal for these "typical" land-use patterns. Often alternative operations would be possible. We tried to balance the cost of each operation against speed and effectiveness, using experience and engineering judgment. Each operation was broken down into the steps needed to complete it. The costs of these sub- operations were taken from standard contractor's handbooks or other data. The process we utilized is very similar to what a contractor would do before bidding for a job.
Neither the strategies chosen nor the cost information are unique or necessarily optimum. There are countless alternative strategies and operations for achieving the desired end result. It would be an overwhelming task, and far beyond the scope of this study, to attempt to evaluate all possible strategies. It would also be pointless; political and social pressures or inadequacy of resources might mandate an less than optimal strategy for an actual accident.
In regard to the nuclear safety convention of applying a conservative bias, it inevitable that this has occurred to some extent, largely as a result of the paucity of certain types of data. However, we do not see our estimates as being bounding in any respect. The most that we can claim is that our calculations represent a well-founded estimate of the costs for various strategies to remediate several "typical" sites. We have attempted to generate what we believe are defensible estimates, and have strived to avoid biased sources of data, but make no claim that the present results are appropriate for all applications. Readers are thus urged to critically evaluate the applicability of our estimates to the application at hand.
All of the important assumptions and parameter values are embedded in a set of Lotus 1-2-3@ spreadsheets, which are reproduced in their entirety in Appendix G. Qualified analysts may request copies of the spreadsheets in electronic format from the authors.
6- 1

These spreadsheets are also being incorporated into a standalone computer program written in C" intended to support an updated version of the RADTRAN transportation accident code system (Neuhauser and Kanipe, 1992) being developed by Sandia National Laboratories. Additional details on that computer program can be obtained from the RADTRAN development team. Sensitivity and uncertainty studies, or the simple substitution of alternative parameter values, could be performed using the software that has been developed.
6.1 Simplifying Assumptions in Cost Estimates
In estimating the costs of demolition of structures, and the removal of debris and surface soil, we did not consider the costs of a health physics program to control occupational exposures to the plutonium. Consideration of the labor cost of health physicists to monitor work activities, and laboratory analysis of nose swipes and urine samples from workers, would increase costs over our estimates. However, we did consider these activities to a limited extent by adjusting our cost estimates for lost labor due to participation in an occupational health physics program.
The cost estimates for mixed-use urban land do not include downtown business and commercial districts, heavy industrial areas, or high-rise apartment buildings. Inclusion of these areas would increase costs. Trees on undeveloped land and structures in parks would increase the volume of rubble, which would increase costs.
In our scenario for off-site waste disposal the transportation would be by truck using commercially available steel containers for packaging. If a rail link were available between an accident site and the waste disposal site, transportation costs might be lower. Costs, time, and transportation dislocations could be reduced if rail transport were used, because more than one container could be placed on a single rail car. We did not assume the availability of rail transport because many locations are distant from a rail line. If trucks were used to transfer the material to a nearby rail line, the extra handling costs would need to be considered.
For an accident postulated to occur at a fixed facility, rail access might be very close. However, in investigating waste emplacement costs for NTS, we found that there is no rail link to the waste burial ground, and this increases the cost of disposal at NTS. The waste burial ground at Hanford does have a rail link, but the emplacement cost at Hanford was found to be three times the emplacement cost at NTS, negating the potential savings in transportation costs by using rail.
The cost of remediating land owned by railroads was estimated to be the same as the remediation cost for industrial property. Demolition and removal of rail track could be expensive, though it might be economical to decontaminate the steel and reuse it. Potential loss-of-use costs for valuable infrastructure were not accounted for.
Restoration of urban land would be more expensive than our scenario for restoration to parkland if streets and roads and infrastructure needed to be replaced. However, we estimated that the compensation cost for such assets would be the replacement cost, and this compensation would
6-2
not have to be paid if the assets were replaced, and there could be a net saving by restoring the streets and utilities.
The remediation cost for "other public" areas was assumed to be the same as commercial areas, because government offices and schools are often constructed to about the same standards as commercial structures. The cost of remediating public recreational land (parks and playgrounds) was assumed to be the same as the cost for undeveloped land. We did not account for the possible cost of removing trees, fountains, plazas, public swimming pools, sports stadiums, or other improvements likely to be found on public recreational land.
We included the rubble from farm buildings and small towns in farmland, but we ignored the possible cost of demolishing farm roads.
We included the value of standing crops and livestock in the acquisition cost for farms, judging that they would probably need to be destroyed. We included the cost of harvesting the crops, but did not consider the possible cost of their disposal as waste.
Trees on farms, especially if part of the farmland was wooded, could add to the volume and cost of waste, and tree removal could significantly increase decontamination costs.
Our estimates of the cost of remedial activities are based on prices set by a competitive market. In remote areas of the country, where there could be a scarcity of labor, equipment, or suppliers, prices would probably be higher than our estimates. Labor and material costs could vary as much as 30% above or below the average values used in this report, depending on the location.
Indirect costs such as government administration and support have not been estimated, although contractors' overhead and profit have been included. Administrative and support costs for the cleanup of Enewetak Atoll were roughly equal to the direct cost of conducting remediation (DNA, 198 1). Also, after the Chernobyl accident, the Swedish government's cost tabulation for its emergency response programs showed that indirect administration and support were roughly equal to the cost of direct actions (Nordic Liaison Committee for Atomic Energy, 1990: p. 220).
The current research has not attempted to quantify indirect costs beyond citing those two data points.lg We believe however, that it might be reasonable to double the cost estimates provided in order to account for indirect costs. The impact of indirect costs could be better established if additional data was available.
In any complex undertaking, there is the possibility that mistakes could be made. It is likely that all actions undertaken would be closely scrutinized by the public, environmental advocacy
l9 In the Stoneman It1 tests Owen and Sartor (1963) reported that indirect costs amounted to 20% of the total cost of the operations; we give this little weight for accident analysis because the operations were surely quite routine after the performance of twelve years of similar tests.
6-3

groups, and government officials. If mistakes or deficiencies were found, it is possible that some actions might need to be redone or augmented, at additional expense. We have not attempted to account for those possible additional costs.
Although we have mentioned waivers of sovereign immunity, possible litigation costs are not addressed. If litigation ensued, costs could increase over what has been estimated. Because of the adverse impact of delays, costs could increase even if lawsuits proved unsuccessful.
6.2 Cost Estimates for Extended Remediation of Farmland and Urban Land
The economic impact of a plutonium-dispersal accident depends strongly on land use. Acquisition cost is dependent on land value, which is clearly higher for city land than for farmland or rangeland. Decontamination cost is higher if the land includes structures. Disposal costs in urban areas are high because of our assumption that all structures would need to be demolished and disposed of as waste. Restoration cost depends on the final ecological community to be achieved, which might differ from the existing ecosystem.
Appendix F describes the cost calculations. A summary of the cost components for two land uses (average urban and Midwest farmland) and two waste disposal options (on-site and off-site) is given in Table 6-1.
Table 6-1 Cleanup Costs For Two Land Uses and Two Waste Disposal Options
( $ million / km2)
cost Item Midwest Farmland Characterization and Certification 0.6 Acquisition and Compensation 1.0 Long-Term Access Control 0.3 Emergency Actions 0.2 Demolition/Decontamination 0.9 Ecological Restoration 3.6 Option 1-On-Site Waste Disposal 32.2 Option 2-Off-Site Waste Disposal 67.3 Option 1-TOTAL for On-Site Disposal 38.8 Option 2-TOTAL for Off-Site Disposal 74.0
Averaqe Urban 0.8
180.0 1.2 1.1
40.5 5.3 82.7 173.2 311.7 402.2
For a given postulated accident location, risk assessors would need to determine whether on-site waste disposal could be utilized. Many factors could influence the decision. First, if State or local laws would prohibit it, on-site disposal should not be assumed in risk assessments. Three CERCLA cleanups now in progress (see Appendix A) are planning to ship LSA soil and debris to shallow burial grounds in Nevada and Utah. For accidents postulated to occur in the sparsely populated arid Western states, on-site disposal would be more likely than in urban regions on the East or West Coasts.
6-4

Population density and proximity to surface or ground water would be important factors in the waste disposal determination. Another factor to consider is the size of the affected region. For very small sites such as BOMARC, on-site disposal would make little sense because of the close proximity to a road and residential areas. If the site were very large, off-site disposal costs and/or logistical difficulties might make remediation unfeasible.
Every attempt has been made in this analysis to provide nominal values that represent a best- estimate for risk analysis. See Section 6.1 and Appendix F for a discussion of the simplifying assumptions utilized and the potential costs that were not considered in the calculations.
6.3 Cost Estimates for Expedited Decontamination
We estimated costs for expedited decontamination of mixed-use urban areas, highways, and airport runways. The costs for expedited decontamination depend on the intensity of contamination. We have estimated costs for decontamination strategies to yield DFs of 2-5 (light contamination), DFs of 5-10 (moderate decontamination), and DFs in excess of 10 (heavy contamination). The strategies for achieving these goals are described in Appendix F.
Table 6-2 shows the estimated costs for representative types of urban areas, and for a combined average population mixed-use urban area. The costs in Table 6-2 are for off-site waste disposal.
Table 6-2 Cleanup Costs for Expedited Decontamination of Urban Areas
( $ million / kmz)
Usaqe Typ e Residential Commercial Industrial Streets Vacant Land
Combined -----------
Light Moderat e Heavy
76.4 169.6 312.8 Contaminat ion Contaminat ion Contaminat ion
195.3 674.0 15.9 81.1
295.5 704.2 18.5 85.7
851.2 1245.9 247.7 95.2
127.8 178.7 398.4
The costs for the combined mixed-use urban area with on-site waste disposal are estimated to be $88.8 million (light contamination), $136.4 million (moderate contamination), and $309.1 million (heavy contamination).
The costs for decontamination of highways or airport runways are estimated to be $17 per m2 of roadway or runway surface (light), $20 per m2 (moderate), or $24 per m2 (heavy). The costs of decontaminating and remediating shoulders, ditches, and adjacent land, or the areas between runways, are estimated to be $81 per m2 (light) and $86 per m* (moderate and heavy). These costs do not include the additional costs attributable to bridges, overpasses, or difficult terrain, and hence may understate the costs. The minimum cost of constructing a detour, if one is required, is estimated to be $235 per meter of detour length. If difficult terrain is encountered, or if a heavy duty bypass is utilized, the cost of the detour could be much higher.
6-5

6.4 Parameter Values Derived for Risk Assessments
For a given source term and meteorology, a computer code and Census data can be used to estimate the area, land usage types, and number of resident individuals in the region of a given DIL, for example, the EPA screening level discussed in Appendix B.
For accidents postulated to occur in urban areas, the computer code should utilize appropriate meteorological data that considers heat-island effects as well as the increased dispersion and deposition because of structures and vegetation. Likewise, for accidents in rural areas, appropriate parameters for the terrain and vegetative cover should be utilized.
The costs per unit area and per unit length of perimeter, as given in Appendix F and in more detail in the spreadsheets of Appendix G, could then be applied in combination with the estimates of areas of each land usage type to produce an estimate of total costs.
6.5 Sources of Uncertainty in Cost Calculations
There are many sources of uncertainty. A specific site might not resemble the average site. The estimated goal for remediation might not be the goal chosen for a specific accident. The strategies for achieving the goal, and the individual operations for that strategy, might not be those chosen for an actual accident. Also, contractor’s bids usually differ from one another (often by sizeable amounts). We have not accounted for the possibility that the contractor performing the operation might have unique equipment or abilities that afford an unforeseen efficiency, nor have we considered contractors who might magnify costs through carelessness.
All of the costs calculated were due to estimated expenses based on prices established in a competitive market. The overhead charges of a hypothetical contractor bidding on the project were included, but overhead for the government’s support and oversight was not included. If government overhead were accounted for, the cost estimates might be approximately doubled over what is presented, as based on the decidedly limited historical experience.
The employment of site-specific data in risk assessments can reduce the uncertainty arising from the use of average land use patterns. The uncertainty arising from the use of specific goals and strategies can be evaluated by analyzing alternatives. The uncertainty in contractors’ bidding costs can be evaluated by using a range of representative bids. Although the uncertainties cannot be entirely eliminated, they can be minimized, or their extent can be evaluated.
The average cost of acquisition of property can be reasonably estimated. Risk assessors can adjust costs for higher or lower valued sites, thus removing much of the uncertainty. The greatest uncertainty is in the costs of operations because the strategies used for decontamination could be different from those utilized to generate the cost estimates of this study.
6-6
7.0 Conclusion Because of (1) the stringency of current environmental law, (2) the need for consensus of multiple government agencies, (3) requirements for public participation and provision for citizen lawsuits, (4) the need for detailed analyses under CERCLA and NEPA preceding actual site cleanup, ( 5 ) deterioration of structures over time, and (6) the difficulty in decontaminating surfaces with long-standing contamination, it was determined that condemnation of all property in the affected area might be a prerequisite to delayed remediation of the affected area under the current regulatory structure.
Condemnation would not be a necessary prerequisite to cleanup. Both CERCLA and NEPA allow for waivers. If necessary approvals were obtained, an expedited remediation could be conducted. We evaluated both the costs and the effectiveness of such an expedited response. This evaluation was performed for (1) accidents postulated to occur in urban areas and (2) those affecting highways and airport runways. We did not analyze the expedited remediation of Western rangeland, Midwest farmland, or forests.
The following costs were addressed: (1) emergency actions to promptly characterize the site and protect the public, (2) compensation for lost property and income, (3) detailed site characteriza- tion, (4) removal of contaminated material, (5) shallow land burial of waste, (6) post-cleanup certification, and (7) ecological restoration.
In an appendix, we looked at the history of government-funded programs for medical monitoring and care and concluded that there could be a basis for establishment of such a program in the event of an accident. However, there are insufficient data on which to base a quantitative cost estimate for such programs.
The estimates provided are intended to be used as nominal values for risk assessments. Actual costs would vary depending on location. There was no attempt to bias the results for conservatism. We assumed, based on historical experience and our assessment of the current social and political climate, that a very protective stance would be taken. The degree of protectiveness we used is consistent with the criteria being utilized for current CERCLA cleanups of radiation sites, and proposed regulations for the same.
Costs would be lower if a set of less protective actions were implemented. Also, technological advances in the detection of plutonium, decontamination techniques, and the treatment of waste to minimize its volume could decrease costs in comparison to the provided estimates.
In order to derive the cost estimates presented, we assumed that the size of the affected area could range from a few hundred square meters to a few square kilometers. Our choice of the potential size of the affected area should not be used to predict the costs of accidents. Those predictions require detailed data on the masses of material at risk, accident phenomenology,
7- 1
release fractions, accident location, local terrain, and meteorological conditions, which are outside the scope of this report. For average weather conditions and flat terrain, even for HE detonation, the size of the affected area might be only a very few square kilometers.
An important consideration for accidents postulated to occur in urban areas is the influence of local meteorology. In the presence of large buildings and trees, deposition can become localized, decreasing the size of the affected area. Also, stable weather conditions in cities, minimizing dilution of the cloud, are extremely rare because of surface roughness and heat-island effects. In modeling the dispersion and deposition occurring in urban areas, analysts are urged to consider the influence of these phenomena in order to avoid overestimating accident costs. This would entail the derivation of dispersion and deposition parameters appropriate for use in urban areas and their use in computer simulations of accidents postulated to occur in those areas.
A simple calculational methodology has been developed that can either be incorporated into existing computer codes, or used by an analyst external to such codes, in order to estimate accident costs. It is a simple matter to determine the land usage characteristics of each sector in the area exceeding a specified interdiction criterion and multiply the area of each land use type by the parameter values that have been provided.
Our results show that there are two major components of attributable cost: (1) compensation for acquired property, and (2) decontamination and waste disposal. Both of these components of cost are uncertain to possibly large degree, and revisions to the parameter values we used could result in one or another of these components becoming the "major" component of cost. As a result of the uncertainties, it is not possible to identify the major cost component with any confidence, and there would be little value in making such a choice.
We believe that variation of parameter values within plausible ranges would not result in a change in our judgement that remediation of an accident site in a populated area would probably be slow, complex, and expensive, absent waivers from current environmental laws. Moreover, even if such waivers were used to expedite the process, decontamination of urban areas could still prove to be difficult, or prove to be of limited effectiveness.
For a worst-case release under worst-case weather occurring in or near a mid-sized city, attributable costs could be on the order of few billion dollars (including overhead and miscellaneous expenses). An unanticipated Federal cost of that magnitude is not unusual. A recent example of a high cost event was the massive failure of savings and loan banks; after liquidation of the Resolution Trust Corporation in 1995, the net cost to the Federal government amounted to over $100 billion dollars.
Another large liability of the government is the cleanup of residual material in the DOE weapons complex, with, by most accounts, an estimated cost of several hundred billions of dollars. DOE (1995b) currently estimates that for its "base-case" strategy, it may cost $200-350 billion (in 1995 dolIars) over the next 75 years to remediate the vast majority of its sites; for the maximal "green fields" cleanup, the cost is estimated to be $500 billion.
7-2

There were many types of costs that we found difficult to quantify and thus omitted from the analysis. One such omission is the government’s expense associated with project management and administration?’ In addition to omitting government overhead expenses, in order to avoid undue complexity in our calculations, there were many simplifying assumptions that may have tended towards the over- or underestimation of cost.
Because of the difficulty of quantifying possible medical costs, this expense has also been omitted from our analysis. Medical costs might turn out to be very low, in which case the omission is unimportant. However, the government has in the past paid substantial sums for medical monitoring and care (See Appendix H), and the possibility that the government might assume costs for epidemiological studies, dose reconstruction studies, periodic monitoring, or even outright medical care for exposed individuals cannot be totally excluded.
The cost estimates provided by this study could offer a valuable addition to risk assessment methodology, in spite of these omissions and uncertainties, because the cost estimates allow relative economic comparisons of alternative operational strategies, design methods, and remediation technologies.
We believe that quantitative risk assessments of nuclear weapon operations should include, in addition to the conventional predictions of doses and health effects, estimates of the potential economic costs. Our recommendation is to focus on the attributable costs, i.e. the potential liabilities that could be borne by the government over subsequent years. Although other non- attributable costs could occur and be borne by society as a whole, their quantification is much more difficult, and would entail a separate analysis outside the scope of the current research.
The estimation of contaminated area sizes, without monetized cleanup costs, although useful, does not allow consideration of the large variability in costs because of land usage and population density. This report has demonstrated that the cost of an accident occurring in an urban area is likely to be much greater than an accident occurring in farmland or rangeland. Attributable costs can, and should, be utilized in government efforts to prioritize potential safety improvements in order to minimize the risks of its operations.
In interpreting the consequence estimates of quantitative risk assessments, for both health effects and costs, analysts are urged to focus on relative risks, not the absolute measures of consequences. Quantitative risk assessments are of greatest value when they are utilized to identify potential safety improvements.
It has been recognized by the DNA (1993a) that there is a need to pay more attention to the process of site restoration in accident planning,
Contractor’s overhead and administrative costs have been included. 20
7-3

Site restoration for nuclear weapon accidents is a relatively new and loosely defined process. Recent nuclear weapon accident exercises have included some site restoration play, but the focus of those exercises clearly has been on the initial emergency response actions associated with a weapon accident. Just as the site restoration issues were addressed, the exercise concluded. As a result, many of the policies, procedures and organizational issues concerning site restoration planning have been left unresolved.
It is hoped that the current focus on addressing this topic, and the cost estimates in this report, will foster wider understanding of the complexities involved in restoring an accident site, and prove useful to the extensive government efforts now being taken to minimize such risks.
We believe that the improvisation of a cleanup program in the immediate aftermath of an accident could be problematic because of the high potential for mistakes or unexpected events. Examples of such mishaps are inadvertent uptakes of radioactive material by cleanup workers, or the injury or death of cleanup workers because of occupational accidents.
If these occurred, or if cleanup actions led to unintentional further dispersal of material and thus made subsequent efforts more difficult, negative repercussions could well ensue. This would be particularly true if, as we expect, there were extensive news coverage.
The risks of mishaps are always present in complex undertakings, but they can be minimized through advance planning, training of personnel, and the testing of plans through exercise. In the absence of advanced planning for expedited decontamination of urban areas, plans would need to be improvised, and this could lead to problems. Economic risks of nuclear weapons accidents could be reduced through the development of plans for the expedited remediation of areas contaminated with radioactive materials.
The inclusion of cost estimates in risk assessments, in addition to the conventional estimation of doses and health effects, allows a fuller understanding of the post-accident environment. The insights obtained can be used to minimize economic risks through comparison of alternative sites and through the development of improved capabilities for accident response.
7-4

Appendix A
Case Studies of Cleanup Criteria, Methods, and Costs A.1 Palomares, Spain
On January 17, 1966 a B-52 bomber on airborne alert carrying four nuclear weapons collided with a KC-135 tanker during refueling and both planes crashed near the remote village of Palomares, Spain (Cuddihy and Newton, 1985). Two weapons deployed parachutes and were recovered intact, one from a dry river bed and the other from the Mediterranean Sea. The two others landed on the ground in agricultural fields outside of the village with sufficient force to cause HE detonation and plutonium dispersal. The two impact points were 2.6 km apart (Iranzo, 1968).
After lengthy negotiations, the following criteria were adopted for 239Pu.
Areas exceeding 32 $Urn2: for 0.02 km2, top soil and vegetation were removed and shipped by the DoD to the Savannah River Site (SRS).
Areas of 0.32-32.0 pCi/m2: for 2.3 km2, soil was plowed to at least 10 inches, standing vegetation was removed, mulched, and shipped to SRS.
The detection limit for the PAC-1s alpha-detector was less than 0.32 pCi/m2. Areas too rough to plow, but contaminated between 3.2 and 32.0 $Urn2 were worked with hand tools to move the contamination below the surface.
830 m3 of contaminated soil and 305 m3 of mulched vegetation were shipped to SRS. The remainder of the vegetation (Le. 3700 2.5 ton truckloads), contaminated near the limit of detectability (0.2 pCi/m2), was burned at the riverbed when the wind was blowing out to sea, and the residues left in Spain (DNA, 1975).
The remoteness of Palomares and its lack of telephone communications caused numerous problems. Characterization of ground contamination with the PAC- 1 S alpha-detector was fraught with difficulties; the instruments were easily damaged by contact with vegetation and measurements were uncertain. The adopted remedy was to have the instruments used only by senior personnel (DNA, 1975).
Despite the arid climate, resuspension did not cause measurable exposures of the decontamination workers or Palomares residents and was detectable only when wind speeds exceeded 35 h / h r (21 mph) (Iranzo, 1968). However, during the decontamination effort it was found that areas previously free of surface contamination were being contaminated by resuspended material (DNA,
A- 1

1975). Also, six years after the accident it was found that the previously-plowed areas adjacent to the unplowed hillsides showed increasing surface contamination levels. This was attributed to wind-driven transport from the more contaminated hillside areas (Richmond, 1975).
Long-term investigations of the nearby marine environment showed that plutonium is very efficiently incorporated into plankton in the muddy bottom sediments of the sea and a nearby estuary (Gasco et al., 1992). There has been no evidence that the plutonium is transferred to humans through consumption of fish.
There is a lack of clear information regarding the total costs incurred by the U.S. to date as a result of the Palomares accident. Some of those costs, such as the periodic medical examinations and radiological assessments of village residents, are still being incurred. Published estimates vary. Excluding the aircraft and their cargo, Cuddihy and Newton (1985) estimated the total cost to the U.S. at $100 million: 10% spent on the location and retrieval of the weapon from the sea using a research submarine; 70% expended in decontamination of the land and medical examinations of Palomares residents; and the remaining 20% was compensation paid to residents who suffered from the lost production of agriculture and seafood. Baes et al. (1986) estimated the cost of the radiological cleanup at $3.36 million/km2.
A.2 Thule, Greenland
On January 21, 1968 a B-52 over Baffin Bay carrying four nuclear weapons developed a f i e onboard. The pilot attempted an emergency landing at the U.S. Air Force base on Danish territory at Thule, Greenland. Before the plan could land, the growth of the fire caused the crew to bail out. The abandoned aircraft crashed on sea ice in a bay 12 km from the runway. The impact occurred at a shallow angle with a speed in excess of 500 nautical mph.
The aircraft fuel inventory was 102,000 kg (225,000 pounds). The majority of the fuel was consumed in the ensuing large fire. HE detonation occurred for all four weapons. Analysis of the resultant plutonium particles often found the associated presence of unburned fuel. The fuel fire resulted in a black crust on the snow pack where the bulk of the plutonium was found. The area of visible contamination was a drop-shaped area 90-120 meters (300-400 feet) wide and approximately 680 meters (2200 feet) long and contained 3100 g of 239Pu (Langham, 1971).
One important insight from this observation is the possibility of highly localized deposition from aircraft crash events. Dispersion and deposition modeling of such scenarios should consider the possibility of fuel-fire soot effectively retaining released plutonium. However, one factor that may be unique to arctic (or winter) conditions is the induced condensation of residual fuel vapors.
Two prototype FDLERs from the Lawrence Radiation Laboratory were sent to the site along with the physicist in charge of developing the device (Becker and Shaw, 1970). The FIDLER proved to be vastly superior to the PAC-1s. The cleanup was limited to the blackened ice (0.06 km2) where 99% of the plutonium deposition occurred. A post-decontamination survey indicated that the decontamination was 93% effective, yielding a DF of 14 (McRaney, 1970). Despite the
A-2

extensive discussion on the use of the FIDLER to detect the 60-keV gamma of 241Am and thereby infer the plutonium contamination levels, the available reports provide no information on the observed Pu:Am ratio.
Despite the difficulties caused by the arctic weather, the decontamination effort was efficiently conducted by the U.S. military under Danish oversight. Over a period of two months, contaminated ice, snow, water and aircraft debris were removed and packaged for transport using large tanks. Approximately 7000 m3 of waste material was shipped to SRS for disposal.
Aside from the material deposited on the nearby ice, an airborne cloud containing an estimated 1-5 Ci of plutonium was believed to have deposited residual plutonium on the surrounding sea ice and land (Langham, 1971). Also, 25-30 Ci of 239Pu was estimated to lie in ocean sediments, with some material judged to have penetrated the sea ice directly. Lichen was shown to be effective in incorporating plutonium (Hanson, 1972). Plankton were also shown to be effective in incorporating plutonium, but people were judged to be not at risk (Aarkrog, 1971).
A.3 Enewetak Atoll
Enewetak is 3800 km SW of Honolulu, HI. Widespread contamination of the atoll with weapons grade plutonium and fission products occurred as a result of the 43 atmospheric and underwater tests of nuclear weapons conducted between 1948 and 1958 (Gudiksen and Lynch, 1975). In 1972 the decision was made to restore the atoll so that the former inhabitants, relocated by the U.S. elsewhere in the Marshall Islands, could return home. A thorough record of the Enewetak Atoll cleanup prepared by the DNA (1981) provided the principal reference for this case study.
Although fission products were present, the primary material of concern was weapons grade plutonium. There were numerous difficulties in deriving cleanup criteria. In 1977, when cleanup was to begin, the publication by the EPA of the 0.2 pCi/m*screening level cast doubt on the adequacy of the criteria developed over the preceding five years of NEPA studies by DNA, DOE studies, and an independent panel of experts. The EPA pathways analysis for generic U.S. locations used to derive the 0.2 pCi/m2screening level was determined to have little relevance to the atoll environment. Also, the cost of compliance with the EPA proposal was deemed excessive by the DNA. In the end, the following criteria for transuranics were chosen by the DNA, and accepted by the representatives of the Enewetak people, despite the fact that they fell short of the EPA proposal:
less than 40 pCi/g: "Village Islands" suitable for permanent habitation, 40 pCi/g to 80 pCi/g: "Agricultural Islands" not suitable for residence, and 80 pCi/g to 160 pCi/g: "Picnic Islands" suitable for occasional visits.
Characterization of the contamination levels was made extremely difficult because of the numerous contamination events. After many test events, contaminated soil was plowed under or moved to other areas in order to allow the operations to continue. Barnes et al. (1979) discuss
A-3
the difficulties encountered in the statistical analysis of data obtained from the laboratory analysis of environmental samples and in situ measurements using an IMP.
Because of those difficulties, characterization occurred continually throughout the cleanup process utilizing IMPS and laboratory analysis of samples. Earthmoving equipment was utilized to remove soil until contamination levels met the selected criteria. Most of the resultant waste material was entombed in a large bomb crater on Runit, one of the most heavily contaminated islands. The resulting crypt was covered with a 46 centimeter (18 inch) cap of reinforced concrete and Runit was permanently interdicted.
After decontamination was accomplished, restoration of the ecology was performed by planting coconut, pandanus, breadfruit, papaya and lime obtained from other islands or grown on-atoll in greenhouses and nurseries. Fertilizer was imported. Houses were built.
Because extensive precautions were taken to minimize resuspension exposures to workers, it was found that resuspension was negligible and no plutonium body burdens were observed in workers.
The effort spanned 3 years and required 1000 people on the atoll for a 3-year period. 0.33 km2 (81 acres) of land were decontaminated via the removal of 84,000 m3 (110,000 CY) of contaminated soil and debris from six islands. It was estimated that the removed soil contained 14.7 Ci (5.4 x 10" Bq) of radioactivity. One island was permanently quarantined. The total cost to the U.S. was $100 million.
A.4 Johnston Island
Johnston Island is part of the Johnston Atoll, an unincorporated territory of the U.S. that is 1330 km WSW of Honolulu, HI. In July 1962 at Johnston Island, a nuclear-device-equipped Thor missile was intentionally destroyed on the launch pad during an aborted launch (Bramlitt, 1982; Vesper et al., 1988; Moroney et al., 1993; and Bramlitt, 1994). As a result of that event, and two other aborts after launch, weapons grade plutonium was spread over the surrounding land, but most especially in the vicinity of the launch pad.
After the launch pad abort, surrounding structures were washed and scrubbed, and much of the plutonium was removed, but Bramlitt (1982) reported that some plutonium remained in concrete surfaces and metallic materials. Because the residual plutonium was considered "fixed surface contamination" it was allowed to remain in place. However, when contaminated sheet metal pilings showed corrosion in 1980, the contamination was determined to be "removable surface contamination" and the steel pilings were removed.
In 1984, the DoD began a more thorough cleanup of the area surrounding the launch pad, shipping the contaminated material to Nevada for disposal by the DOE. The majority of the material was LSA, subject to transportation packaging requirements that imposed minimal additional costs over ordinary commercial shipments, and the material was suitable for shallow land burial at a permitted site. Only one 55-gallon drum of material exceeded those criteria and
A-4
required shipment in a DOT Type-A package (Vesper et al., 1988). The Pu:Am ratio was determined during the operation to have a nominal value of 8.7:l though there was considerable variation, possibly because of the multiple contamination events.
In the area surrounding the launch pad, low levels of transuranic contamination remained, requiring that occupancy restrictions be maintained. The Radiological Control Area (RCA) encompasses 0.109 km2 (27 acres). An effort is currently underway to decontaminate 0.097 km2 (24 acres) of the RCA and thereby make it available for unrestricted use. The criterion for clean soil is 0.5 Bq/g (13.5 pCi/g) based on the 0.2 pCi/m2 screening level (see Appendix B).
Since the entire island is a Part B RCRA-permitted facility (see 40 CFR 265) , there is no CERCLA RIPS for the selected course of action, namely, the treatment of contaminated soil to reduce volume using the Segmented Gate System of TMA-Eberline (Moroney et al., 1993; Bramlitt, 1994). The NEPA authorization basis (DNA, 1991) of the waste treatment operation is an EA and FONSI. The EPA exercises close oversight over the DNA operations at the island, which hosts a National Wildlife Refuge.
The treatment system demonstrated a volume-reduction factor of 50:l at the site making it extremely cost-effective (TMA-Eberline, 1993). Volume reduction greatly reduces the cost of disposal of material at a DOE shallow land burial site in Nevada and avoids the need to import soil for construction projects on Johnston Atoll. The multi-year project is expected to process approximately 100,000 m3 of soil with an average transuranic assay of less than 1 nCi/g. The total cost of the soil treatment process cannot yet be determined, but it was expected to be approximately $15 million (Bramlitt, 1994). Additional costs will be incurred in shipping the concentrated waste material to Nevada and disposing of it in a shallow land burial site.
According to Kimbrell (1993, excluding prior research and development efforts, from FY91 through FY95 a total of $10.4 million has been spent on the project. MAJ Kimbrell estimates that another $14 million is needed to complete the project by FY2000. If the total project cost reaches the forecasted $24.4 million, the per-area cost would be $244 million/km2. The remoteness of the site has led to higher costs than would be expected for a continental U.S. site. Also, the research and development of the waste treatment system added to costs. There were no acquisition costs. Consideration of these factors indicates that the Johnston Island cleanup cost is not inconsistent with the cost estimates of this report.
A S BOMARC Missile Site, McGuire AFB
On June 7, 1960 an explosion and fire occurred in a missile shelter at the Boeing Michigan Aeronautical Research Center (BOMARC) Missile Site on U.S. Army land leased to the nearby McGuire AFB, NJ. The shelter housed a nuclear-warhead-equipped missile but there was no HE detonation. The fire burned uninhibited for 30 minutes, and over the subsequent 15 hours 30,000 gallons of water were sprayed into the shelter with fire hoses. Plutonium-contaminated water flowed out the front door of the shelter into a drainage ditch; an earthen dam was improvised in an attempt to minimize the spread of material (U.S. Air Force, 1992a).
A-5
Seven containers of plutonium were recovered by EOD personnel. Recent analyses indicated that approximately 1 g of weapons grade plutonium was transported off-site as an airborne cloud. The amount of plutonium originally in the weapon remains classified. The upper estimate of material unaccounted for, and thought to be lodged in nearby surrounding soil, is 300 g of plutonium. The CERCLA site characterization, 29 years after the accident, was facilitated by the spatially uniform h : A m ratio of 6:l (ibid.). FIDLERs and laboratory analysis of samples were used for the CERCLA characterization.
There were serious difficulties relating to the laboratory analysis of samples. A great deal of resources were expended on trying to implement a scheme to analyze the split samples. Just taking a pail of material and dividing it in two equal parts was found to be inadequate because the two halves could contain different assays. The approach settled upon was to grind the soil samples into one micron particles to homogenize the assay. In the end, it was not feasible to verify laboratory accuracy because of technical problems at one of the laboratories performing the analyses.
The final NEPA and CERCLA documentation for BOMARC occupies one meter of shelf space, and four years elapsed from project initiation to the issuance of a ROD. There was little controversy. After thirty years, the prevailing public mood was satisfaction that the site would finally be cleaned up.
The BOMARC accident site is located in the Pinelands region of southern New Jersey where hazardous waste disposal is prohibited by State law. As a result, on-site shallow land burial was not considered a viable option in the RUFS. Another consideration disfavoring on-site disposal was the small size of the site (0.02 km2) and its proximity to private property. While the CERCLA process theoretically allows waivers from compliance with other laws (see Section 4.3), EPA and State concurrence would be needed, in addition to an absence of public opposition to the proposed waiver.
The selected course of action in the ROD is the removal and transportation of an estimated 6100 m3 (8000 CY) of soil exceeding 8 pCi/g to an unspecified DOE shallow-land burial site. The soil criterion was based on a pathways analysis that utilized the RESRAD code (Gilbert et aL, 1983; Gilbert et al., 1989) and a "acceptable" cancer incidence risk of lo4 to a maximally exposed individual.
There was public opposition to a proposed remedy for on-site waste treatment to reduce volume. As a result, despite CERCLA favoring waste treatment, and disfavoring the relocation of untreated material to another location, off-site disposal of untreated waste was selected. At the end of calendar year 1995, an EA was being prepared for the DOE evaluating the environmental impacts of shipping the contaminated soil to a shallow-land burial site at NTS. We were unable to obtain estimates for the cost of this project.
A-6

A.6 Montclair-East Orange, NJ Radium Soil Site
As a consequence of industrial activities in the early 1900s relating to the manufacture of luminous paint for watches, soil contaminated with radium came to be used in fill dirt and concrete in residential areas of Montclair and East Orange, NJ. Remediation of the site was begun in 1992 (EPA, 1993c) and was well underway in mid-1994 (National Public Radio, 1994). Additional information on the cleanup was provided by Mr. Paolo Pascetta (1994), the RPM for the project at the EPA’s Montclair, NJ Field Office.
Cleanup of the site is being paid for with Superfund monies, since responsible parties cannot be identified. The CERCLA site encompasses a total of 769 homes, but only 250 of those were found to be affected by the contamination. The homes requiring remediation are distributed over a residential land area of 0.49 km2 (120 acres). The average value of a home in the area is approximately $200,000, twice the national average. No commercial properties required remediation.
The chosen risk goal for the remediation is a cancer incidence risk of IO4. The remedy currently under way to reach that goal is the demolition and removal of detached garages and driveways, and the excavation of contaminated soil to a depth of up to 2.5 m (8 ft). Large vacuum equipment normally used to remove material from sewers was modified by the Army Corps of Engineers and used by them to remove soil from beneath the homes. Resultant damages to the structures are repaired and clean soil used as fill. The garages and driveways are being replaced.
The affected residents are being provided with substitute housing and associated miscellaneous expenses are being reimbursed. One of the attendant difficulties is the fact that it has been very difficult for the EPA to obtain comparable rental homes for the displaced population because of the higher than average value of the homes being remediated.
No radiation protection measures are utilized for casual visitors who can observe from a distance the excavation and removal of soil from around their homes.
The acquisition and demolition of all structures might have lowered remediation costs but the EPA decided to preserve the existing homes in the long-established neighborhoods. It would have been impossible to restore the neighborhoods to their prior condition. Also, by preserving the homes, the volume of waste material is minimized. If the debris from demolished homes became contaminated with the radium soil, that debris might require disposal as LLW.
Great weight is being given to the community interests by the EPA. Obtaining consent from some of the elderly longtime residents was difficult in some instances, but, as of mid-1994, after the project had been underway for several years, no litigation had occurred. In the hope of minimizing disruptive impacts, the EPA was accommodating those individuals facing difficulties by rearranging the schedule so that their homes will be remediated last.
A-7
The untreated excavated LSA LLW is being transported for emplacement at a commercially licensed shallow-land burial ground operated by Envirocare of Utah, Salt Lake City, UT. The estimated volume of the debris is 76,000 m3 (100,000 CY). The material is loaded in 0.76 m3 (1 CY) plastic buckets and shipped to Utah by rail. The fee being paid to Envirocare for waste emplacement is $286/m3 ($220/CY).
The original estimate of the total cleanup cost was $250 million, but the project was running ahead of schedule and in 1994 Mr. Pascetta believed the total cost would be $200 million.
At an estimated approximate cost of $400-500 million/km2, this case study is in excellent agreement with our estimates of average urban area costs. Also notable is the fact that our estimate of on-site shallow-land disposal costs, $318/m3, is very close to the fee being charged by a commercial facility.
A.7 Fernald Plant'
The Fernald Plant, located 29 km (18 miles) northwest of Cincinnati, processed uranium for nuclear weapons programs during the period from 1951 to 1989. The site encompasses 4.25 km2 (1050 acres). With the cessation of production, all activities at the plant were shifted to environmental restoration. Although the nature of the contamination at Fernald is different from the contamination that could result from a plutonium-dispersal accident, the experiences at that site illustrate many of the potential problems that can occur and corroborate our conclusion that radiation site cleanups will probably be slow, complex, and expensive.
A class action lawsuit by 14,000 individuals residing within 8 km (5 miles) of the plant was settled in September 1989 with the DOE agreeing to pay $78 million for lost property values and emotional distress because of radioactive contamination of their property. The lawsuit was originally filed in 1985 asking for $300 million. During the proceedings, the DOE admitted that the plant had released more than 136 metric tons (300,000 pounds) of uranium oxide into the atmosphere.
The Associated Press (Oct. 23, 1989) reported that settlement trustees said it would take about a year to perform in-depth medical examinations for the eligible population and the settlement money pays for only monitoring, diagnosis, and epidemiological studies, with no funds allocated for medical treatment. Previously, the Associated Press (September 15, 1989) reported the chairman of the Environmental Safety and Health Advisory Committee for the Fernald Plant as saying that the cost of tracking cancers and other ailments would be greater than the settlement funds allow.
The newspaper stories referenced in this section were obtained from Dialog@ Information 1
Services. They are not listed in the References section of the report.
A-8
The Cincinnati Post (December 1, 1993) reported that a U.S. Centers for Disease Control study reported that 590 metric tons (1 million pounds) of uranium and 170,000 Ci of radon was released into the air by Fernald between 1951 and 1988. The report also stated that 99,000 kg (217,800 pounds) of uranium was released into a nearby river and creek.
The Cincinnati Post (May 12, 1993) reported that the CERCLA RI/FS process for the Fernald Plant was criticized in an April 15, 1989 report issued by the DOE Inspector General (IG). The IG stated that when the RI/FS was initiated in 1986, the DOE estimated it would take three years and cost $10 million to complete. The IG estimated that the 50% complete R W S would eventually require a total of eleven years and cost $200 million. The IG stated that for each year of unnecessary delay of the RVFS and cleanup, the DOE will spend $149 million for site support costs.
In criticizing the delays, the IG noted that detailed information on the plant has existed for years, reducing the need for more extensive testing. In 1989, EPA headquarters recommended to the DOE and the EPA’s Chicago Field Office that a streamlined approach be adopted that made use of the available information, but that recommendation was not followed by the DOE and the EPA Field Office overseeing the cleanup, who conducted a CERCLA site evaluation that did not utilize the existing information from the plant.
The potential high cost of overhead is indicated by the Dayton Daily News (March 8, 1994) which reported on a statement by the local Congressional Representative, Rob Portman. Portman stated that in the prior year, of the over $290 million budget allocated for cleanup, only 10% actually went toward the cleanup, with the remainder spent on salaries, operating expenses, and preparations for cleanup, including studies performed by the Federal government and the state of Ohio.
Some insight on the question of on-site versus off-site disposal is given by the Cincinnati Post (April 19, 1994). The DOE investigated forty nine of its laboratories and production facilities located throughout the U.S. to determine which might be suitable for the disposal of low-level radioactive and hazardous waste generated by other DOE facilities. At the first level of selection, three criteria had to be met: (1) Is it more than 61 m from an active fault?; (2) Is it outside of a 100 year flood plain?; and (3) Is a 100 m buffer zone available?
Twenty six sites, including the Fernald Plant, satisfied all three criteria, but before the next round of selection, the DOE will confer with the National Governor’s Association and state officials. In discussing the possible use of the Fernald Plant for a disposal site, DOE officials said that Fernald’s location above the Miami Aquifer, which already shows some evidence of uranium contamination from the plant, made it unlikely that Fernald would be a suitable candidate.
The Cincinnati Post (March 26, 1994) reported that a public workshop on cleanup strategies for the Fernald waste pits was to be held. The waste pits cover a 0.15 km2 (37.7 acre) area of the plant and they contain more than 459,000 m3 (600,000 CY) of mixed radioactive and hazardous waste. The DOE was soliciting public comments on a proposal to excavate the waste pits and
A-9
treat the wastes by drying to reduce mobility. The proposal called for the material to be shipped by rail to Envirocare of Utah, for disposal near Salt Lake City, UT. The DOE estimated that the waste pit cleanup would take eight years and cost $457 million.
The Cincinnati Post (June 29, 1994) reported that the Nevada Attorney General filed a lawsuit to compel the DOE to produce a NEPA environmental study before shipping low level radioactive waste from the Fernald Plant to the NTS for disposal. According to Stevens (1994) the lawsuit has resulted in a suspension of all DOE waste shipments to the NTS.
In July of 1994, a class action lawsuit by 6000 employees of the Fernald Plant and 1000 subcontractors went to trial. The Fernald workers allege that they suffered emotional distress and increased risk of cancer from radiation exposures in the workplace. In addition to monetary damages for emotional distress, the plaintiffs are seeking lifetime medical monitoring with complete annual physical examinations, including blood analyses, lung function tests, and electrocardiograms. A total of $500 million was being sought. Only medical monitoring expenses, not medical care, was sought. The Washington Post (July 27, 1994) subsequently reported that the lawsuit was settled before conclusion of the trial, with the DOE agreeing to pay $20 million for medical examinations over succeeding years.
A-10
Appendix B
Criteria for Cleanup B.1 Historical Criteria
B.l . l Colorado Construction Standard
According to Hayden et al, (1980), criteria for acceptable plutonium in soil were first proposed in 1968, but the first official statement on "acceptable" levels of plutonium contamination was the adoption in 1973 by the State of Colorado of an amendment to Subpart RH 4.21 of the Rules and Regulations Pertaining to Radiation Control. It reads as follows:
Permissible Levels of Radioactive Material in Uncontrolled Areas
Plutonium. Contamination of the soil in excess of 2.0 disintegrations per minute of plutonium per gram of dry soil or square centimeter of suqace area (0.01 microcurie plutonium per square meter) presents a suficient hazard to the public health to require the utilization of special techniques of construction upon property so contaminated. Evaluation of proposed control techniques shall be available from the (Colorado) Department of Health upon request.
B.1.2 1977 EPA Screening Level
In the late 1970s the EPA (1977) issued a Notice of Proposed Rulemaking and a number of associated reports addressing the potential impacts on human health of the residual transuranic contamination at sites involved in the manufacture and testing of nuclear weapons. The main purpose of that research was to provide a technical basis for decisions on whether or not individual sites required remediation. Also, for NTS specifically, the potential detrimental ecological impacts of remediation were analyzed in great detail (Wallace and Romney, 1974).
Because of the difficulties in achieving concurrence of the multiple government agencies involved in radiation protection, the proposed guidance issued by the EPA was never finalized, and remains as draft. Those reports are currently being reissued by the EPA with (Burley, 1990a; 1990b) but the reissued reports are stated to reflect the views of the EPA staff authors and not the EPA as a whole.
Despite the lack of formal adoption of the guidance by the EPA, one tangible product of that research is the quantitative "screening level" for areas with longstanding contamination with transuranics such as 239+2.10Pu. The screening level was chosen to facilitate the "screening out"
B-1
of areas at which the low levels of contaminant made it indisputable that no remedial actions were needed. It was based on the assumption that a de minimis risk could be defined as an annual exposure with an estimated incremental one-in-a-million chance of incurring cancer fatality. The EPA (1977) stated,
The screening level is not to be interpreted as a soil cleanup standard to which all sites of transuranium contamination mast be decontaminated; instead, when correctly applied, it will identi& land areas where no additional monitoring is required.
For areas that exceeded the transuranic screening level, 0.2 yCi/m2, the EPA proposed that a site- specific assessment of exposure pathways be performed to determine if the radiation doses that would result from occupancy exceeded the criteria for radiation protection of the public. Since resuspension was the pathway of concern, only particles with a physical diameter of 2 microns or less were to be considered.
Although the EPA (1986) subsequently indicated that it would be issuing regulations to implement criteria for cleanup decisionmaking, as of January 1996, no final guidance or regulation has been issued. Nevertheless, the screening level has been widely used in assessing the extent of land contamination for actual and potential accidents involving nuclear weapons or their components.
Recent application of the criterion has been made in NEPA documents. The 0.2 pCi/m2 screening level has been specified as a cleanup standard in an EA relating to the interim storage of plutonium components at the Pantex Plant (DOE, 1994a). In that EA, the analysis of potential impacts to the Oglalla Aquifer states that if an accidental plutonium contamination event occurs, the DOE would remediate areas exceeding the screening level. It is somewhat unclear whether or not this commitment falls into the category of a NEPA Mitigative Action Plan (10 CFR 1021.331) but, if so, it might be legally binding on the DOE in the event of an accident.
Also, in a National Aeronautics and Space Administration (1995) EIS for the Cassini space mission, the screening level is used to determine the size of the area that could have sufficient plutonium to be considered contaminated and thus possibly require remediation. However, the report notes,
The applicable cleanup standard may be site specific and may be higher or lower than the proposed EPA screening level.'
In the Cassini EIS, costs were estimated for two strategies: 1
(1) a minimum-scope radiological monitoring program estimated to cost $2.3 million per site for the first four years, and (2) a maximal-scope remediation involving population relocation, partial or total demolition of structures, waste disposal, and reclamation, which, according to unspecified DOE data, were estimated to sum to $200 million/km2 for general land areas in Florida
B-2

If surface-deposited material is distributed uniformly in the first centimeter of soil and the specific gravity of the soil is 1.5, as at Johnston Atoll, the 0.2 pCi/m2 screening level translates into a soil concentration of 13.5 pCi/g (0.5 Bq/g). This is an extremely low contamination level, roughly 0.2 parts-per-billion (ppb) of mass.
To illustrate the dose potential, the following information may serve useful. For soil contaminated to 13.5 pCi/g with 239pu in oxide form, dose conversion factors from Eckerman et al. (1989) indicate that the inhalation of 240 g of the soil, or the ingestion of 1.4 metric tons of the soil, would each result in a committed effective dose of 1 rem (0.01 Sv).
In the event of an actual accident, observations of resuspension air concentrations would play a crucial role in the decisionmaking regarding relocation of population, etc. Despite the possibility that resuspension dose estimates relying on actual measurements might indicate the acceptability of contamination levels much higher than the screening level, the implementation of similar soil- based criteria at (1) Johnston Island (13.5 pCi/g) and (2) the BOMARC Missile Site (8 pCi/g), and (3) the commitment of the DOE to remediate to 0.2 pCi/m2 in the event of an accident at Pantex (DOE, 1994a), all serve to lend support to the usefulness of the 0.2 pCi/m’ screening level for estimating the extent of land for which remediation might be needed. In fact, because of its usage, it has become a sort of de facto cleanup standard for small accident sites.
B.2 Current Rulemakings on Residual Material
The current problems due to lack of official promulgation for the 1977 EPA screening level, and ambiguity of the CERCLA risk range may be diminished at the conclusion of the two rulemakings presently underway by the EPA and the NRC.
Partly because of the EPA’s delay of 16 years in its rulemaking, the NRC initiated a rulemaking to revise 10 CFR 20, Radiation Protection of the Public, to include a new section describing the radiological criteria for decommissioning licensed production and utilization facilities such as power reactors.
Although DOE and DoD weapons-related activities are fully exempt from NRC regulation, the EPA does have clear jurisdiction. Furthermore, as a matter of policy, both DOE and DoD maintain nuclear safety requirements for their operations are consistent with NRC standards for licensed facilities.
In announcing their rulemaking processes for a radiation cleanup standard, both agencies have committed to harmonize their rulemakings. This is given credence by a DOE (1995b) citation of their announcement,
(ibid.: p. 4-70), a cost estimate that is not inconsistent with ours.
B-3
the two agencies ' parallel approach will yield regulations which are consistent, fully protective of public health and the environment, and issued in a timely manner.
In announcing their rulemaking processes for a radiation cleanup standard, both agencies have committed to "harmonize" their rulemakings. Additional evidence of the trend of towards consistency of EPA and NRC standards is their joint issuance of a standard for the storage of mixed waste (NRC, 1995a).
For these reasons, if the EPA fails to issue a rule, but the NRC succeeds in issuing a rule, we believe it would be reasonable for risk assessors evaluating nuclear weapon accident risks to consider the utilization of the NRC-issued cleanup criterion. This is mentioned because the NRC, as of January 1996, appears to be ahead of the EPA in the promulgation of a site cleanup standard, having published and widely distributed several reports for formal public comment, and having issued several Notices of such in the Federal Register.
The EPA, in contrast, is distributing its proposal informally through the framework of public meetings of a Science Advisory Board (EPA, 1995b) and its Cleanup Standards Outreach BBS.' Both the EPA and the NRC (as mentioned below), are making extensive use of computer bulletin board systems (BBSs) to distribute information relating to the current rulemakings on cleanup standards.
B.2.1 EPA's Proposals for 40 CFR Parts 195 and 196
The EPA (1993b) published a detailed Issues Paper describing the technical bases it was considering in developing a regulation fulfilling the process it initiated in 1977. The rulemaking was assigned to 40 CFR 195 (EPA, 1993a).
The present CERCLA process specifies that an acceptable risk can range from lod to lo4, or even higher, if justified. The ambiguity has resulted in numerous difficulties for the EPA and the DOE in administering cleanups of radioactive material. It has been their experience that a proposed action at the less protective end of the spectrum is almost always challenged as providing inadequate protection. This is despite the fact that ambient radiation levels, if radon is included, result in a projected lifetime risk of roughly for the average individual.
With no Federal Register notice of a change in direction by the EPA, a new, and completely different proposal for the radiation site cleanup regulation was made available to the public by the EPA (1994a) through the Cleanup Standards Outreach BBS. The prologue of this Staff Draft regulation states,
It is expected to change and is intended to be used primarily to maximize public discussion and comment.
Accessible by modem at telephone 800-700-7837; the System Operator is at 703-893-6600. 2
B -4
The Staff Draft is distinguished from the EPA's prior Issues Paper in being assigned to Part 196 of the Federal regulations on the environment. It differs from the Part 195 proposal in being based on a dose standard instead of a risk standard. A risk-based standard would be consistent with the EPA's existing CERCLA guidance.
It is also noted that a risk-based standard would also be consistent with National Academy of Sciences (1995), where, in making recommendations to the EPA on criteria for the licensing of a high-level waste repository, a risk-based standard was found to be preferable to a dose-based standard.
The Staff Draft 40 CFR 196 states,
Remediation of sites shall be conducted to provide a reasonable assurance that, for 1,000 years after completion of the remedial action, radionuclide concentrations in excess of natural background levels shall not exceed those amounts that could cause any member of the public to receive, through all potential pathways under a residential land use scenario, an annual committed effective dose of 15 mrem/yr (0.15 mSv/yr).
The dose-based standard is stated to correspond to a cancer incidence risk limit of 3 x lo4. If remediation to that level is impractical, the staff draft states that the "implementing agency" is required to (1) maintain "active control measures" to limit the doses to the 15 mremlyr criterion and (2) to have a "reasonable expectation" in the absence of such control measures, that no member of the public would receive an annual committed effective dose of 75 mrem/yr during the subsequent 1000 years.
The change of direction of the EPA could be the result of the need to harmonize the EPA cleanup regulations with the NRC rulemaking discussed in the next section. Another possible difficulty in relying on a risk-based standard is that accepted dose-response parameters for cancer have changed over time, increasing by a factor of five in the past twenty years, from the nominal risk factor of O.OOOl/rem (i.e. 1 cancer fatality per 10,000 person-rem) used in WASH-1400 to the current ICRP (1991a) risk factor of 0.0005/rem.
B.2.2 NRC's Notice of Intent to Revise 10 CFR 20
Partly because of the EPA's delay of 17 years in its rulemaking, the NRC initiated a rulemaking to revise 10 CFR 20, Radiation Protection of the Public, to include a new section describing the radiological criteria for decommissioning licensed production and utilization facilities such as power reactors. The Enhanced Participatory Rulemaking BBS is being used to both distribute documents and to receive and redistribute docketed ~0mrnent.s.~ The current standards for decommissioning are based partly on surface contamination levels, and partly on external dose rates, as described in (NRC, 1992), and this has resulted in difficulties for enforcement.
Accessible by modem at telephone 800-880-6091; the System Operator is at 301-415-6026. 3
B-5
Motivated by these difficulties, the NRC (1994a) has published for public comment a proposed cleanup standard for licensed facilities. The radiological criterion is based on the annual committed dose to a maximally exposed individual residing at the location. All pathways, including food and water ingestion, are to be considered. The dose limit is 15 mrem committed effective dose per year of exposure. Annual dose commitments for each of the 1000 years following decommissioning are to be evaluated, for comparison against the criterion. If institutional controls are maintained, for example, only allowing workers into the region, the dose limit is increased to 75 mrem.
These criteria would only apply to the property within the boundary of the licensed facility and there is no mention of the possibility of higher doses being allowable if the contamination is the result of an accident. If both the EPA and the NRC issue regulations that state criteria for allowable contamination levels, the EPA regulations would take precedence. That is, the NRC could not allow residual contamination levels higher, i.e. more permissive, than any limits specified by the EPA. The NRC could choose, however, to implement standards more protective than those issued by the EPA.
It is possible that the final form of any EPA or NRC rules on residual material could be substantially different from the current proposals. It is also possible that the two rulemakings could be subject to delays, although NRC (199%) indicates that a final NRC rule will be issued in early 1996.
For an example of an issue that could impede the rulemaking, see (ibid.) for the dissenting view of Commissioner De Planque. De Planque expressed strong skepticism of the prudence of adopting a cleanup standard more stringent than a value of 25 or 30 mrem consistent with the recommendations of national and international organizations for radiation protection, and furthermore expressed the opinion that the underlying pathways analysis of Daily et al. (1994), as based on Kennedy and Strenge (1992) is unduly conservative,"
Unnecessarily conservative assumptions will lead to cleanup of radioactivity to levels so low that it will be dificult, if not impossible, to determine compliance and the effort will be extremely expensive for licensees.
It is noted that the Generic Environmental Impact Statement in support of this rulemaking (NRC, 1994b) gives no consideration to the costs of cleanup that might be incurred by a licensee after an accident, and it appears to be focused exclusively on the decommissioning of facilities at the end of their normal service life. Despite this focus and purpose, the current proposed rule, as written, could apply to facilities being decommissioned as a result of an accident.
We are inclined to concur. For a "residential" exposure scenario, the draft NRC Reg. Guide of Daily et al. (1994) indicates that 1.9 pCi/g of "'Pu in soil yields an annual dose of 15 mrem, (96% due to ingestion). In contrast, the draft pathway analysis of EPA (1994e) indicates that 27 pCi/g of 239Pu in "rural residential" soils would yield the same 15 mrem annual dose.
4
B-6
The current proposals for radiation cleanup standards, if implemented in regulations, would represent a very considerable tightening of standards in comparison to the current PAGs. Also, while the PAGs do not currently have the force of law and are subject to change at the discretion of the EPA, regulations in effect at the time of an accident would be an important determinant of the stringency of the remediation levels that would need to be chosen, and, consequently, the resultant economic costs incurred during the remediation process.
Evidence for the tightening of radiation protection standards in the issuance by the EPA (1994e) of a proposed revision to the current Federal Radiation Protection guidance that would the overall dose limit from 0.5 rem (0.005 Sv) whole body to a new value of 0.1 rem (0.001 Sv) effective dose.
The current Federal dose limit, issued in 1960 by the Federal Radiation Council, represents an upper limit on the dose that an individual can receive as a result of all activities conducted by, or regulated by, the Federal government (ibid.). The said guidance, however, applies only to routine releases, and does not apply to accidents.
It is unclear in the current proposal whether or not the proposed Federal Radiation Protection guidance would apply to the remediation decisionmaking at an accident site, where, depending on the circumstances, radiation doses may or may not be readily controllable, but this ambiguity will hopefully be resolved in the final issuance by the EPA. The proposed Federal Radiation Protection guidance does, however, cite the PAGs, and explicitly states that the tightened standards are consistent with the PAGs, though the basis for that claim is not made clear.
B.3 EPA Protective Action Guides (PAGs)
One of the principal determinants of accident costs is the specification of criteria to distinguish between acceptable and unacceptable exposures. Under the authority of the Atomic Energy Act, the EPA is responsible for setting generally applicable standards for the protection of the public from radiation. Any such standards set by the EPA are applicable either through policy or by law to the nuclear activities of the DOE and other Federal agencies, including the NRC. The primary EPA guidance on criteria for the relocation of public is the PAGs (EPA, 1992a).
The PAGs apply to all nuclear accidents or incidents occurring in peacetime. However, they are not implemented as Federal regulations, and the EPA could revise its guidance without prior notice in order to address site-specific conditions in the event of an actual release.
The EPA PAG for initiating protective actions in the immediate "early" phase of the accident response is 1 rem (0.01 Sv) effective dose. That level of projected dose is intended to be used as the criterion for ordering sheltering or evacuation as a precautionary measure.
After the passage of radioactive clouds, the Federal response detailed radiological assessments for the purpose of determining PAGs for the "intermediate" exposure phase. It is important to
to nuclear accidents involves what, if any, areas exceed the note that the dose projections
B -7
made for this purpose are strictly focused forward in time. That is, the inhalation, cloudshine. and groundshine dose incurred during cloud passage and in the intervening period before radiological assessments are completed is not considered. The purpose of the intermediate phase dose projection is to make decisions on the long-term relocation of population or condemnation of properties.
According to the PAGs,
... relocation is wurrunted btvhrn the pri,jectetl sun2 of the close eyrtivulent fioni extrrnul guninicl radiotion untl the conmiitted eflective dose eyuivulent fioni inhulution of resuspended rarlicmuclicles e.rceeds 2 rem in the first veur.
For subsequent exposures the PAGs state.
In conclusion on the topic of the PAGs, the following points are noted:
( I ) The EPA PAGs allow a maximum effective dose of 2 rem in the first year. 0.5 rem in the second year, and a cumulative total of 5 rem during the entire fifty years after an accident. If a dose of 2.5 rem is incurred during the tirst two years, a constant dose rate of 50 mt-em/yr would lead to a total dose of 5 rem for the fifty year exposure period.
(2) The EPA PAGs are much more lax than the CERCLA risk limit of 10 '. 143 mrem effective dose incurred over a 30 year exposure period.
(3) The EPA PAGs are also much more lax than the proposed EPA and NRC cleanup standards for 40 CFR 196 and I O CFR 20, I5 mrem per year, though by a smaller margin than is the case for the CERCLA risk limit.
B.4 Influence of SociaVPoIitical Factors
It may be argued that dose limits as stringent as the CERCLA risk standard or the proposed EPA and NRC cleanup criteria cannot be justified from a technical standpoint. There has long been a recognition among some risk assessors that nontechnical factors can be very impoi-tant, and require consideration. for example. see Spangler ( 1980; 1983).
In assessing costs. we believe that it is important to consider the fact that people are likely to overreact to highly publicized and dramatic risks (Viscusi, 1992). It seems credible that the occurrence of a nuclear weapons accident would be result in this type of reaction. When such accidents were common during the Cold War. public reactions were minimal. However, such
B-8

would probably not be the case today, due, in part at least, to the Fact that such accidents are no longer commonplace.
Our opinion on the observed current stringent tightening of radiation protection standards, which some in the technical community may find difficult to accept, is that it is the logical result of forces and pressures that fall within the domain of economics, psychology, and sociology. Also, a full understanding of the post-accident environment. and the defensible estimation of the resultant economic costs, virtually requires that such factors be taken into consideration.
We believe that recent history and contemporary events, such as the current cleanups de.wribed in Appendix A, can be relied upon to forecast the social/political reactions that could come into play in the event of a nuclear weapons accident. The recognition that nontechnical Factors are important, and require considerition in risk assessment, is now becoming more widespread, particularly in work by the DoD.
A full understanding of these issues may require a multi-disciplinary approach incorporating insights from psychology and economics. Tornblum ( l992) is a good example,
This viewpoint is supported by U.S. Army (1995: p. 4-31), in a discussion of the impacts of an accidental release of a chemical weapons agent,
... In Renerd, u mujor uccident would huw atlwrsc~ irnpucts on thp qirulip of I$e, including eff2ct.s reluted to nrentul hrulth unrl well-heing, social strircturr, und coniniunity well- being.
B-9

In making decisions on what constitutes a "acceptable" level of residual contamination, the risk estimate numbers might not be the real deciding factors. On this point it is important to note Segal (1993), where, in a discussion of the fallacies of selecting countermeasures based strictly on technical considerations, and ignoring the social and political factors that may truly govern the actual decisionmaking process, he says,
What is clear is that there is rarely, if ever, going to be a simple "right" answer and the objective should be to find the best available answer in the given circumstances. It is also clear that the best answer will be very different in different circumstances, which is why it is essential not to lose sight of the basic principles (of the ICRP). The optimum solution to a given technical problem will depend at least as much on economic, social and political factors; it is important for those making the scientijlc input to recognize that this is not only inevitable but also the correct application of the basic principles of radiation protection.
Buttressing this viewpoint is the National Academy of Sciences (1994), in a discussion of the important factors that need to be considered in making decisions on the resettlement of Rongelap, the population of which was relocated as a result of U.S. nuclear weapons tests,
The annual dose limit recommended for members of the public by the ICRP is not intended to be directly applicable to decisions on when to return to an area that has been evacuated because of radiological concerns raised by potential or actual radiation contamination. In the latter circumstances, ICRP recommends that the decision to return to a previously evacuated area is justified when being back is more beneficial to the people involved than remaining away. The assessment of which is more beneficial must take into account all the factors that influence health and well-being. A population might expect to achieve the greatest net benefit by appropriate allocation of whatever resources it has available to it within the context of all the factors that affect its health and well- being. I t follows that in any specific situation brought about by intervention, a decision by (emphasis added) a displaced population needs to be made on the basis of factors that have the greatest influence on them. There is no reason to expect that the magnitude of any particular factor (for example, residual contamination) on which a decision to return is based will be the same from case to case. Each population's situation will involve different tradeofls.
By acknowledging that the return of individuals to areas free of contamination might not be in the best interest of displaced individuals, and that decisions on whether or not to return can only properly be made by the affected individuals themselves, an authoritative body lends support to the prospect that the decisionmaking of remediation of an accident site, and the return of displaced populations could be fraught with numerous difficulties.
The potential importance of social-political factors and the perceived risk has often been neglected in studies that investigate trade-offs between the costs of mitigative actions and the value of the averted dose. See Finn et al. (1980), Burke et al. (1984), Alonso and Gallego
B-10
(1987), and Tawil and Strenge (1987) for examples of analyses that have focused exclusively on the technical factors that could affect remediation decisionmaking, and have neglected to consider the types of issues that may in fact have the greatest impact on post-accident decisionmaking for the recovery phase following the occurrence of an accident.
In conclusion, regarding social-political factors, it instructive to note that the forces that could be operative are not limited to the U.S., as evidenced by a statement of the USSR Supreme Soviet on the aftermath of the Chernobyl accident in (Current Digest of the Soviet Press, 1990),
The USSR Supreme Soviet emphasizes that the measures taken [up to now] to eliminate the consequences of the accident have been insuficient. In regions that were subjected to radioactive contamination, an extremely tense social and political situation has come about, due to contradictions in the recommendations of scientists and specialists on problems of radiation safety and delays in adopting the necessary measures and as a result some of the population’s loss of confidence in local and central bodies of power. An in-depth study of the post-accident situation and the working out of a well-founded program of action are proceeding slowly, something that is causing legitimute indignation among the residents of the region that was subjected to radiation exposure.
B-11

Intentionally Left Blank
B-12
Appendix C
Exposure Pathways for Plutonium In the interim until EPA or NRC regulations are issued that specify a cleanup standard, risk assessors have two choices: either use the 0.2 pCi/m’ screening level as a de facto criterion or perform a pathways analysis and evaluate the acceptability of the resultant doses. Details of the EPA and NRC rulemakings on this topic can be found in Appendix B.
The primary determinant of the economic costs from a plutonium-dispersal accident is the choice of a level of surface contamination deemed to be the dividing line between acceptable and unacceptable. In calculating a Derived Intervention Level (DIL) for weapons grade plutonium, it is important to consider the various exposure pathways that may require consideration.
As a result of global fallout from the above-ground testing of nuclear weapons, there is abundant information on the behavior of plutonium in the environment. For accidents involving nuclear weapons or components, any plutonium released to the environment would be in the form of an oxide, the same chemical form as global fallout. The fallout data are thus broadly applicable.
Other environmental data may not be applicable. During reprocessing activities conducted by the DOE, plutonium may be present in the form of a nitrate in solution with nitric acid. Because of the unique chemistry of plutonium nitrate, data on its environmental behavior may be of limited usefulness in setting DILs for accidents involving nuclear weapons or components.
A detailed assessment of the plutonium ingestion pathway for irrigated agriculture in the desert environment was performed for NTS under DOE auspices by the Nevada Applied Ecology Group (Kercher and Anspaugh, 1991). For plutonium oxide in the desert environment, it was found that resuspension inhalation doses exceeded ingestion doses by a wide margin. The only organ receiving a significant dose from ingestion was the gastrointestinal tract. Furthermore, over 99% of the ingestion dose was the result of external contamination of edible foodstuffs via resuspension and rain splash. Because of the discrimination of plants against plutonium oxide, very little plutonium was predicted to be incorporated into plants by root uptake. For that reason, the ingestion pathway can probably be ignored in setting a DIL for weapons grade plutonium.’
External radiation from 239+2.10Pu is nil because its decay is by alpha particles that cannot penetrate the skin. For plutonium workers, skin injuries represent a potential exposure pathway but this
In the literature we reviewed, only two sources were found where ingestion was reported 1
to dominate over resuspension for Pu deposits: ChemRisk (1994~) and Daily et al. (1994).
c- 1
pathway can be ignored in estimating risks to the public. Appendix D discusses the isotopic mix of weapons grade plutonium as a function of time. Eckerman and Ryman (1993) give revised dose conversion factors for groundshine. Even with a maximum buildup of %lAm, annual groundshine doses from weapons grade plutonium at the 0.2 pCi/m2 screening level are much less than 0.1 rnrem, and thus groundshine too can probably be ignored in setting a D E .
There has been a longstanding consensus of experts that resuspension is the pathway of principal importance for long-term exposures subsequent to a plutonium-dispersal accident, for examples see Langham (1956; 1971), EPA (1977), Burley (1990a; 1990b), and Layton et al. (1993). Resuspension of deposited material occurs through mechanical disturbances and the interaction of wind with surface material. There are three approaches used to model resuspension: resuspension rate, mass loading, and resuspension factor, Sehmel (1984) and Nicholson (1988).
The resuspension rate model is the least commonly used approach. It entails the specification of a rate of transfer of material from the surface to the atmosphere in units of s-'. If an atmospheric dilution factor (x/Q) is available, time-integrated air concentrations at a downwind location can be calculated. Since both the resuspension rate and the atmospheric dilution factor can vary by orders of magnitude over a long-term exposure period, annual average values for both quantities should be used. One possible useful application of the resuspension rate approach would be to estimate exposures of a nearby population center from resuspended material originating at a discrete source location.
The mass loading model of resuspension has as its basic premise the assumption that aerosol particles have the same relative composition as that of the underlying soil. In its simplest form, the mass loading model requires taking the product of two quantities to obtain the instantaneous air concentration of the contaminant: (1) the soil concentration of the contaminant (commonly reported in pCi/g) and (2) the concentration of dust in the atmosphere (commonly reported as Clg/m3).
In practice, unitless adjustment factors are used to scale the simple product derived above to account for the extent of the contaminated area and the relative propensity of the contaminant of concern to be resuspended. The mass loading model is most commonly used for situations where the contaminant is well-mixed within the surface soil. A DOE computer code implementing this model is RESRAD, Gilbert et al. (1983; 1989). In the DoD CERCLA risk assessment for the BOMARC missile site (see Appendix A), RESRAD was used to derive a "clean soil" criterion of 8 pCi/g (0.3 Bq/g) corresponding to a CERCLA risk limit of 10".
The resuspension factor approach is conceptually the simplest of the three and thus has clear advantages for use in risk assessments (Linsley, 1978). It is presently the most commonly used for analysis of prospective accidents, and is expected to be the primary model utilized in the short-term period following an actual accident. The resuspension factor model entails the specification of the ratio between (1) the instantaneous air concentration typically measured at one meter above a specified location (Bq/m3) and (2) the level of surface contamination on the ground below (Bq/m2). The resuspension factor is thus given in units of m-'. A resuspension
c - 2

I
factor model is implemented in the HOTSPOT computer code of the Lawrence Livermore National Laboratory, a code intended for use in the event of a weapon accident, and it is also specified in the current PAGs (EPA, 1992a).
Despite the wide usage of the resuspension factor approach, it has important conceptual and practical limitations, as follows. First, because resuspension occurs at an upwind location that is variable because of changing wind direction and wind speed, air concentrations at a given location are subject to extreme variations, while the underlying ground contamination level remains constant. Second, air contamination levels are measured by quantitative analysis of filter paper through which high volumes of air have been filtered.
When air contamination levels are relatively low, each sample of filter paper might contain just a few (or zero) small particles. This can lead to orders of magnitude variation in reported values for the resuspension factor, even in a single set of experiments using a consistent methodology when the ground contamination level is relatively uniform, as is the case for global plutonium fallout (Sehmel, 1984). If the pattern of ground contamination is nonuniform, as is likely in the event of an actual plutonium-dispersal accident, the uncertainties are increased.'
Because of the predominant importance of the resuspension pathway, following an actual accident, a great deal of attention would be focused on estimation of the resuspension factor. In order to judge the acceptability of an area for long-term habitation, the EPA (1992a) issued PAGs for estimating the first year's dose to resident populations. If that projected dose exceeds 2 rem effective dose, the EPA calls for consideration of protective actions to limit exposures. The prompt measurement of resuspension air concentration is an integral aspect of the planning basis for weapon accident response (DoD, 1990).
Over the period following an accidental deposition, weathering decreases the amount of material available for resuspension (Allot et al., 1992), and, as a result, the resuspension factor decreases with time, possibly reaching an asymptote after a period of decades (Anspaugh et al., 1975). There are numerous models for a time-dependent resuspension factor that have been implemented in nuclear accident assessment codes. The most widely used models are based on measurements at NTS performed 15 years after atmospheric tests involving plutonium dispersal (ibid.). Those measurements were used to extrapolate an initial resuspension factor of 10" m-' from the subsequently observed values of roughly m-I.
In contrast, more recent literature on measured resuspension factors indicate that even in arid regions values do not often exceed lo4 m-', and are often as small as lo-'' m-'. Perhaps the observations most pertinent to Pu-dispersal accidents involving nuclear weapons are those made near Palomares, Spain (Iranzo et al., 1994),
Although computer simulations often show smooth patterns of deposition, smoothness usually results from the simplicity of the models. While uniform deposition can occur, it is likely to be the exception rather than the rule.
2
c-3
... the data obtained indicate that the resuspension factor decreases progressively with time, from an initial average value of the order of IC7 m-’ to values of the order of m-’ some months later, and the order of IC9 m-’ to lo-’’ m-’ after several years.
Shinn et al. (1986) found similar results and reported the median value of the resuspension factor from plutonium measurements at Bikini Atoll, South Carolina, and California was 3 x lo-’’ m-’. Hartmann et al. (1989) reported a value of 8 x lo-’ m-’ for global fallout plutonium. The latter group also found that plutonium resuspension factors were similar to resuspension factors for elements like calcium, titanium, and iron.
In an evaluation of resuspension doses from weathered plutonium at Bikini Atoll performed in 1978, Shinn et al. (1989b) reported that the 239t240Pu concentration in the soil of bare fields was found to be 15.5 pCi/g, just slightly higher than the 13.5 pCUg criterion for “clean” soil currently being used in the Johnston Island cleanup. Plutonium surface concentrations in coconut grove soil and on roads were 8.0 and 4.1 pCi/g, respectively. Extensive measurements of air concentrations in the bare fields, in coconut groves, and along roads, and consideration of a typical occupancy pattern yielded an estimate of the average daily inhalation of plutonium, 15.6 fCi. For a lifetime of residency on the island, that exposure was estimated to yield a committed 96 mrem effective dose.
Garland et al. (1992) in assessing cesium resuspension data from freshly deposited Chernobyl fallout in Europe found that there was no correlation between the resuspension factor and annual rainfall and presented a model, presented below, which, according to Shinn (1994), is the most appropriate means of projecting doses in the first year following an accidental deposition.
Six widely cited references for a time-dependent resuspension factor are shown in Table C-1.
The Anspaugh model is the most widely used basis for calculation of resuspension doses from plutonium contamination, though often with the initial RF reduced by a factor of ten, to 10” m-’, in order to account for non-desert conditions. For example, as was done in NRC (1975; 1990).
The projected first-year resuspension dose from ground contaminated at the 0.2 pCi/m2 screening level (DJ, is calculated by selecting values for the average resuspension factor (RF,,J, an inhalation dose conversion factor, and a unitless shielding factor.
The shielding factor is appropriate to use because over a one-year period individuals spend the majority of the time indoors and structures afford protection from aerosols through filtration (Roed, 1985; El-Shobokshy and Hussein, 1988; DOE, 1990; Allot et al., 1992). Data from those sources indicates that indoor exposures to airborne particulates could range between 0.1 and 0.5 of the ambient outdoor exposure levels.
The annual average breathing rate (8040 m’/year) was taken from DOE (1988b), the 239e240Pu dose conversion factor from Eckerman et al. (1989), and the 0.45 shielding factor from the RESRAD code, Gilbert et al. (1983; 1989).
c-4

The projected first-year dose (D,) is calculated as follows:
D, = Wavg x (2 x Ci/m2) x (8040 m3/year) x (3.08 x 10' rem/Ci) x 0.45
Numerical integration of the six models was performed to obtain RFaV8 and corresponding individual doses for the first-year exposure from a deposit at the 0.2 pCi/m2 screening level. The results are presented in Table C-2.
Examination of these results indicates that the Anspaugh et al. (1975) model yields a first-year resuspension dose more than double the EPA PAG of 2 rem (0.02 Sv). This leads to the question of whether the screening level is sufficiently protective for the first-year's exposure, or, alternatively, whether the Anspaugh model is excessively conservative.
In assessing the fact that the use of the Anspaugh resuspension model leads to resuspension doses that would, over the near-term period following an accident, exceed the doses from direct inhalation, Kocher (1980) expressed his disbelief as follows:
This result casts doubt on the validity of the resuspension models and indicates the need for a re-examination of the values of the model parameters.
The applicability of the Anspaugh model to non-desert conditions was investigated by Moss et al. (1980) in laboratory experiments using 238Pu. Those experiments were focused on the variation of resuspension due to the presence or absence of moisture. The purpose of the research was to determine if the Anspaugh model was appropriate for Safety Analysis Report accident analyses of Hanford facilities. They found moisture to have a limited influence on resuspension and thus concluded that the Anspaugh model, "may be a useful predictor of hazard irrespective of site," and therefore found it to be an appropriate model for Hanford.
Despite its wide acceptance, the limited usefulness of Anspaugh et aZ.'s (1975) model for predicting short-term doses was affirmed by Shinn (1994) who stressed the fact that resuspension factors observed in nature are consistently lower than the short-term resuspension factors predicted by the Anspaugh model.
Although it might be conjectured that resuspension factors for soluble elements such as cesium might be lower than for insoluble plutonium, there appears to be no data in support. Garger (1994), measured resuspension factors for l'Cs, 137Cs, 141Ce, lo3Ru, '06Ru, 95Nb, and "Zr within the 30 km exclusion zone surrounding Chernobyl during August and September of 1986. Similar resuspension factors were obtained for the various elements, with the observed values found to be mostly in the range from lo4 to m-'.
One well-documented set of observations of cesium fallout from Chernobyl (Nordic Liaison Committee for Atomic Energy, 1990: p. 91) derives a nominal initial value for the resuspension factor of 2 x 10" m-', with a halflife of 0.9 years. The highest observed average value, in Stockholm 2 to 5 months after the accident, was only 4.1 x 10" m-'. Variations of the
c - 5
resuspension factor at individual sites were found to be correlated with season of the year, with peaks found in the spring and autumn, and this was thought to be due to the fact that there was less vegetation present at those times.
At Palomares, Iranzo et al. (1994) found a strong seasonal variation in the resuspension factor, but there the peaks occurred in the summer, which decreased rapidly to low levels with the onset of winter. The difference in the seasonality effect between Palomares and the Nordic countries points out the possibility that site-specific factors could be an important influence.
Many researchers have conjectured that resuspension in arid areas should be higher than in areas with significant rainfall, but Shinn (1994) stated that there is no clear empirical evidence to support that assertion. And, throughout Europe following Chernobyl, Garland et al. (1992) observed no correlation between annual rainfall and the observed resuspension factor.
There could be other confounding factors that decrease the observed correlation. Evidence for such is given by Hollander (1994) who found that in the first few weeks after deposition, the observed resuspension factor for cesium deposits in Germany was proportional to windspeed, u.
With the resuspension factor, RF(u), given in units of m-', the following relationship was derived (ibid. ) ,
RF(u) = F& x ul.O1
with R, = 2.14 x lod m-', and u in units of m/s.
After a few months, even during strong wind periods with substantial airborne dust, radioactivity concentrations were found to below the detection limit of the utilized equipment.
The stabilization of cesium contamination was also observed by Kashparov et al. (1994a) who found that agricultural activities resulted in the spread of cesium contamination for only up to a few hundred meters, who suggested that the rate of spread into decontaminated villages is likely to be slow, but that the resuspension from agricultural activities would be important in determining the contamination of food crops. Garland and Pomeroy (1994), in assessing the length scale for recontamination by resuspension similarly concluded,
In the years following the accident, measurable quantities of material were resuspended and deposited again. In the first year the fraction of the initial deposit involved in the process ranged from 0.01 to about 1.0. It is thus possible for previously uncontaminated or cleansed areas to become contaminated well after the original deposition event. However, evidence from specific sites indicates that it is the immediate area around sampling sites that provide the source for much of the resuspended material found in deposit gauges, and the length scale for transport of signijicant levels of contamination is probably very limited.
C-6
Finally, in an assessment relevant to the exposures of decontamination workers, Kashparov et al. (1994b) utilized air sampler data from the operator's cabin to estimate the resuspension doses to drivers of agricultural tractors working in the vicinity of Chernobyl. They found that if the total plutonium deposit exceeded 0.1 pCi/m2 (3700 Bq/m2), the average air concentrations in the cabin could exceed the maximum permissible limits that applied. However, when consideration was given to the fact that a typical exposure period would be 3 to 4 months of work per year with a 10-hour working day, the authors concluded that agricultural workers in the region would incur an annual committed effective dose on the order of 0.1 rem (0.001 Sv), an uptake less than the applicable local standards for workplace exposure.
The available data indicates that the use of resuspension models yielding average first-year resuspension factors exceeding 10" m-l could lead to the implementation of protective actions that are unduly stringent and expensive. There are very large uncertainties in the resuspension factor, but very little evidence for values so large over a long averaging period.
In discussing the importance of resuspension in comparison to other exposure pathways during the first year following a reactor accident, the EPA (1992a) states in its PAGs that,
... an assumed average resuspension factor of I @ m-' ... led it to conclude, at least for the reactor accidents under consideration, that resuspension doses should be small in comparison to gamma radiation from contaminated ground. The EPA's use of a I O 4 m-l parameter value in this manner strongly suggests that it was judged to be a conservative value, not likely to be exceeded.
Highlighting the fact that resuspension factors are highly uncertain, the PAGs provide no additional model parameters (such as a weathering rate), that could be used for the purpose of dose projection. Instead, the EPA calls for measurements of the resuspension factor with,
... air sample analyses should be performed for specific situations (e.g. areas of average and high dynamic activity) to determine the magnitude of possible inhalation exposure.
c - 7
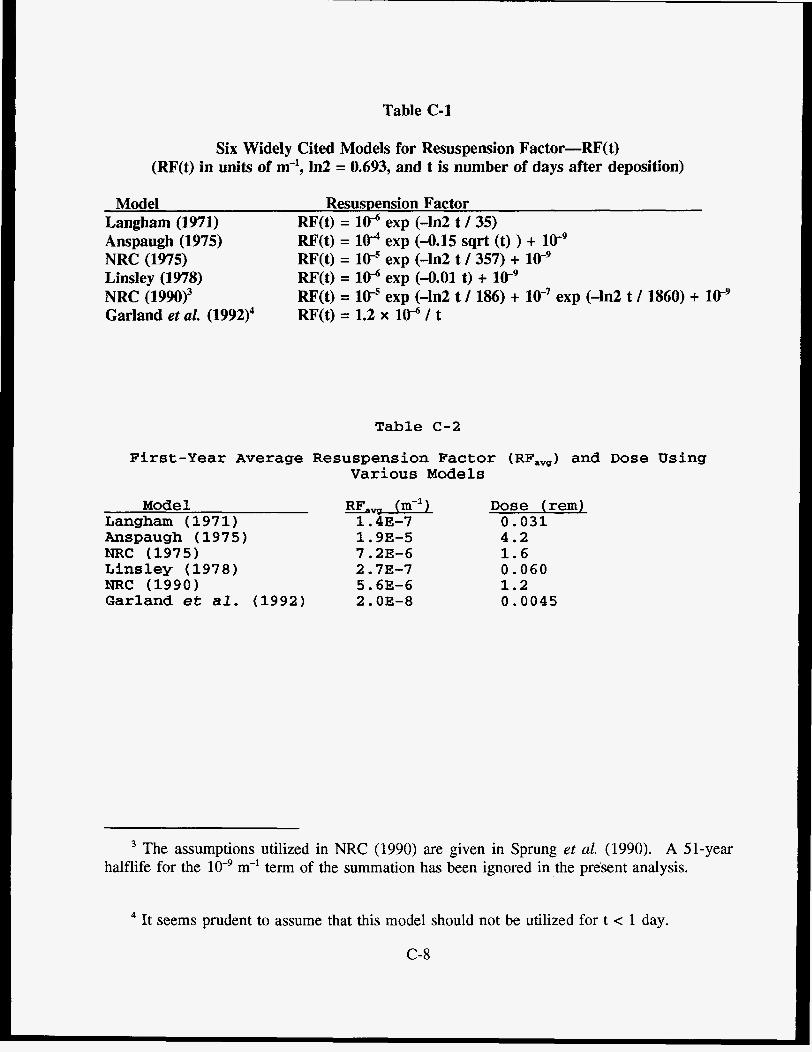
Table C-1
Six Widely Cited Models for Resuspension Factor-RF( t) (RF(t) in units of m-', In2 = 0.693, and t is number of days after deposition)
Model Resuspension Factor Langham (1971) Anspaugh (1975) NRC (1975) Linsley (1978) NRC (1990)3 Garland et a2. (1992)4
RF(t) = 10-6 exp (-In2 t / 35) RF(t) = l@ exp (-0.15 sqrt (t) ) + lW9 W(t) = IC5 exp (-ln2 t / 357) + 1w9 RF(t) = 10-6 exp (-0.01 t) + 10-~ RF(t) = 16' exp (-ln2 t / 186) + lo-' exp (-In2 t / 1860) + RF(t) = 1.2 x 10⁻⁶ / t
Table C-2
First-Year Average Resuspension Factor (RF,,) and Dose Using Various Models
Model RF., (m-l) Langham (1971) 1.4E-7 Anspaugh (1975) 1.9E-5 NRC (1975) 7.2E-6 Linsley (1978) 2.7E-7 NRC (1990) 5.6E-6 Garland et al. (1992) 2.OE-8
Dose (rem) 0.031 4.2 1.6 0.060 1.2 0.0045
The assumptions utilized in NRC (1990) are given in Sprung et al. (1990). A 51-year halflife for the lo-' m-' term of the summation has been ignored in the present analysis.
It seems prudent to assume that this model should not be utilized for t < 1 day. 4
C-8

Appendix D
Isotopic Mix of Weapons Grade Plutonium Direct detection of plutonium in the field environment is difficult because of the short range of alpha particles and the fragility of alpha-detection devices. For that reason, field-detection equipment is calibrated to detect the 60-keV gamma ray emitted by %lAm, the radioactive daughter of %lPu.
The ease of detecting plutonium residues in the environment is related directly to the isotopic fraction of Am2' in the released material. When weapons grade plutonium is produced, there is zero or only a trace of %lAm present. Over the course of time, the Puml originally present decays to mlAm, reaching a maximum at 73 years after manufacture.
There is scarce public information on isotopic assays of plutonium components. There are apparently only two sources of public information on isotopic assays: (1) the EIS for the Rocky Flats Plant (RFP) issued by the DOE (1980), and (2) the isotopic mix defined in the Rocky Flats Risk Assessment Guide (Rocky Flats Plant, 1994). The EIS states that the isotopic mix used in their analyses was based on, "the average composition of Rocky Flats plutonium during the last two years." The EIS isotopic mix is presented in Table D-1.
The isotopic mix used in the RFRAG was based on assumptions regarding RFP waste material documented in the Safety Analysis Report for Packaging for the TRUPACT transportation package (GA Technologies, 1986). The RFRAG isotopic mix is deemed less useful for the purposes of this report than the EIS isotopic mix, and is thus not being presented.
The Pu:Am ratio is a function of two variables: (a) the initial assay of ='Pu arid (b) the time since the plutonium's manufacture. Using the EIS isotopic mix as a basis, and the inferred initial composition of %'Am (0.0001), the EIS isotopic mix shows an initial ratio of 208:l. If decay and ingrowth are calculated for an aging period of 73 years, the ratio reaches a minimum value of 6.33:l at the end of the period.
According to the NARP (DoD, 1990), the Pu:Am ratio approaches a minimum value of 5:l for aged plutonium. It is conjectured that early manufacturing processes for plutonium could have yielded slightly higher initial assays of %'Pu than is presented in the RFP EIS. If the initial assay of %lPu is 27% higher than the 0.0036 mass fraction specified above, an aging period of 73 years yields a minimum ratio of 5: 1.
Decay and ingrowth of weapons grade plutonium was calculated for two isotopic mixes: that presented in the EIS, and an inferred isotopic mix for earlier plutonium manufacture yielding a minimum ratio of 5:l after 73 years of aging. These results are presented in Table D-2.
D- 1
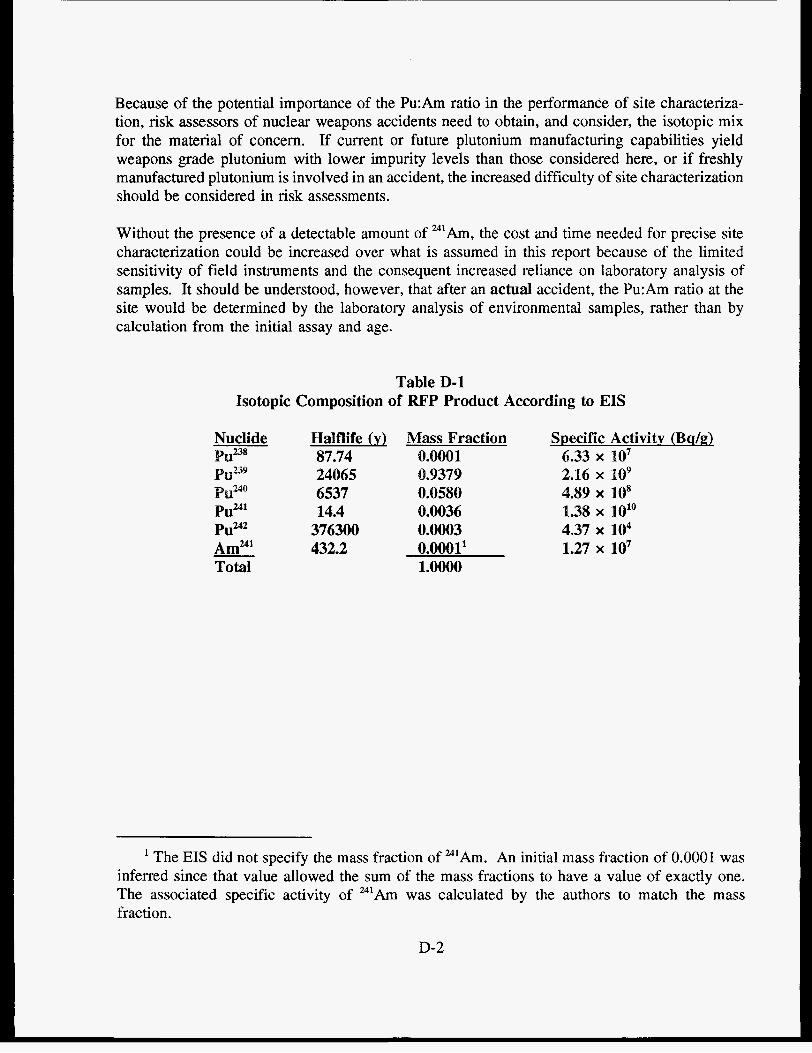
Because of the potential importance of the Pu:Am ratio in the performance of site characteriza- tion, risk assessors of nuclear weapons accidents need to obtain, and consider, the isotopic mix for the material of concern. If current or future plutonium manufacturing capabilities yield weapons grade plutonium with lower impurity levels than those considered here, or if freshly manufactured plutonium is involved in an accident, the increased difficulty of site characterization should be considered in risk assessments.
Without the presence of a detectable amount of "'Am, the cost and time needed for precise site characterization could be increased over what is assumed in this report because of the limited sensitivity of field instruments and the consequent increased reliance on laboratory analysis of samples. It should be understood, however, that after an actual accident, the Pu:Am ratio at the site would be determined by the laboratory analysis of environmental samples, rather than by calculation from the initial assay and age.
Table D-1 Isotopic Composition of RFP Product According to EIS
Nuclide Halflife (y) Puu8 87.74 PUB9 24065
6537 14.4
Pu242 376300 Am241 432.2 Total
u240
Mass Fraction Specific Activity (Bq/g) 0.0001 4.33 x 10⁷ .9379 2.16 x PO9
0.0580 4.89 x IO* 0.0036 1.38 x lolo 0.0003 4.37 x 10⁴ 0.0001' 1.27 x 10⁷ 1.0000
' The EIS did not specify the mass fraction of "'Am. An initial mass fraction of 0.0001 was inferred since that value allowed the sum of the mass fractions to have a value of exactly one. The associated specific activity of "'Am was calculated by the authors to match the mass fraction.
D-2
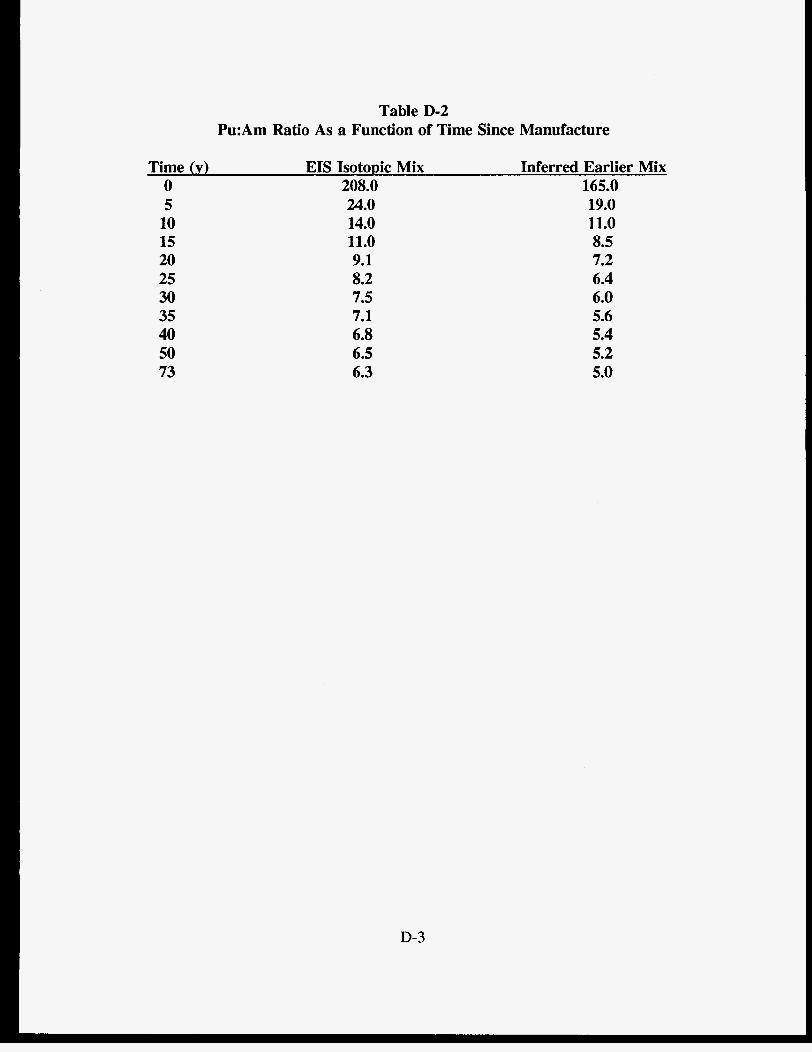
Table D-2 Pu:Am Ratio As a Function of Time Since Manufacture
Time (9) EIS Isotopic Mix Inferred Earlier Mix 0 208.0 165.0 5 24.0 19.0
10 14.0 11.0 15 11.0 8.5 20 9.1 7.2 25 8.2 6.4 30 7.5 6.0 35 7.1 5.6 40 6.8 5.4 50 6.5 5.2 73 6.3 5.0
D-3

Intentionally Left Blank
D-4
Appendix E
Survey of Literature on Decontamination Almost all of the prior work in the U.S. and abroad on methods and effectiveness of radiological decontamination has been focused on fission products, and on time frames and conditions that have limited applicability to decontamination after a plutonium-dispersal accident. Nevertheless, sufficient data has been found, as summarized below, to support the calculational methodology and cost estimates of this report.
Many fission products are highly reactive and can bond chemically with the substrate, which would not be true of plutonium released from a weapons accident. Also, the hazards to humans are different for fission products and for plutonium. Fission products that cannot be removed by decontamination may be hazardous by reason of gamma radiation. Unremoved plutonium particles are primarily hazardous because they could later be released into the air (for example, by maintenance of the structure in which they were lodged), and the particles would then be subject to inhalation or ingestion.
Most of the work cited here has also been focused on particle sizes, mass loadings, or chemical forms that are not directly applicable to a weapons accident. The particle sizes and mass loadings of most experiments have been in a range that should have facilitated decontamination, relative to plutonium-dispersal accidents. The reason for this is that most of the prior work has focused on recovery actions for nuclear explosions (Cowan and Meinhold, 1969), where the large mass loadings (up to a pound per square foot) and particle sizes (20 to 200 microns) greatly exceed the values that might be observed after a weapons accident. Large mass loadings and particle sizes lead to greatly increased decontamination effectiveness. Furthermore, in discussing fallout (ibid.),
The mass of the radioactive inaterial itself is a tiny fraction of the mass of the inert fallout material with which it is associated. Thus, in discussing the mechanics of removal, fallout may be considered as a type of dirt.
In spite of the difficulties in applying the available data to plutonium-dispersal accidents, one general observation stands out. That is, decontamination has often proven to be more difficult and less effective than was expected by the experimenters.
Those few data points that indicate the possibility of a highly effective, and easily executed decontamination are often contradicted by other experiments. Also, the need for risk assessors to consider the experimental results within the context of the experimental conditions may be one of the most important observations to be drawn from the available literature.
E- 1
The impetus for the initial DoD research on decontamination was an unanticipated outcome from a nuclear weapons test. In the Baker Shot of Operation Crossroads, conducted at Bikini Atoll in 1946, it was found that the radioactive contamination of sea vessels contaminated by a shallow underwater nuclear weapon detonation is extremely difficult to remove because of the nature of the aerosols created in a marine environment (Weisgall, 1994).
Over subsequent years, the DoD conducted many tests to evaluate the effectiveness of various decontamination techniques that might be used in the event of air, ground, and sea blasts. Although the decontamination difficulties of Operations Crossroads have little relevance to the decontamination of plutonium after a weapons accident, the Crossroads experience was a major motivation for military tests of decontamination effectiveness under a wide variety of conditions, as described below.
In preparation for the upcoming decontamination tests of Operation Greenhouse, laboratory experiments were conducted to learn about the ease with which building materials are contaminated and decontaminated (Howell and Vandivert, 195 1). These tests involved a mixture of four fission products (Y, Sr, Zr, and Nb) mixed with seawater and applied in a manner that simulated rainfall. The tests showed that materials with rough and porous surfaces absorbed more of the contaminant, and were harder to decontaminate. DFs of up to 100 were achieved, however, through the use of vacuum-blasting or planing to remove surfaces, but it was noted that the dry surface-removal methods,
presented problems of waste control and disposal, and in some instances, damaged the sugace being decontaminated.
Of the less-destructive techniques evaluated (ibid.), scrubbing with a hot water solution of 10% trisodium phosphate was found to achieve a DF of 100 on soft wood painted with standard Navy paint, but the report noted the fact that wet methods did cause damage to the unpainted surfaces. No indication was given of the time-of-standing before performance of decontamination.
In Operation Greenhouse, conducted at Enewetak Atoll, Werner and Sinnreich (1951) reported on the contamination and decontamination efficiencies of fission products after atmospheric nuclear detonations. Three of the Greenhouse weapons tests (George, Dog, and Easy) were utilized in a joint test series conducted by the Army Chemical Center and the Naval Radiological Defense Laboratory to gather information on decontamination effectiveness.
The analysis techniques utilized, as well as the locations of the analyzing laboratories, varied between the various shots. Furthermore, for two of the shots, samples were analyzed both at Enewetak and on the mainland. Nevertheless, because the report (ibid.) provides extensive descriptions of the test procedures, as well as the raw data, we have studied it in detail. Adding further interest to this source is the fact that it has not been widely cited, and it is not included in a comprehensive bibliography on decontamination published by the DNA (Reitz, 1985).
E-2
A multitude of materials in use on military equipment and structures were tested, the testing methods were fully described, and extensive tables of raw data were presented, thus allowing independent analysis. Samples of materials were placed on the ground and attached to drone airplanes that traveled through the radioactive clouds. The majority of the decontamination factor (DF) values reported were for decontamination within eight days of the detonation. Additional readings were taken at 23 and 79 days after detonation. The report noted,
measurable decreases of decontamination eflciency appeared with increased time of standing before decontamination.
The testing times span an interval appropriate for expedited early decontamination, that is, up to two and one-half months. Our analysis of the ensemble raw data for all of the drone samples did not show a statistically significant time dependence. However, the drone sample testing procedures were not the same for all of the test events; for some events, the test samples were airlifted to the mainland for analysis. It is possible that decontamination methods varied between those used in the field at Enewetak and at the Army and Navy laboratories on the Mainland. It is also possible that other confounding factors were present to decrease the correlation coefficient.
For the Greenhouse decontamination test event for which all of the bare aluminum and painted samples were decontaminated at a single laboratory (Dog Shot), our analysis of the raw data found there was a statistically significant time dependence; decontamination factors decreased approximately as the -0.16 power of ratio of time. That is, in comparing DFs at t=l day and t=30 days, everything else being equal, we estimated that the DFs at 30 days would be approximately 58% (i.e. 304.16) of the DFs obtained at 1 day.
The Greenhouse report (ibid.) concluded that porosity and surface roughness of materials were strongly correlated with contamination and decontamination efficiency, Porous and rough surfaces acquired initial contamination levels up to ten times higher than smooth and hard surfaces. Also, porous surfaces and rough surfaces were found to be more difficult to decontaminate by about the same ratio. The repeated use of hot detergent and solvent cleaning solutions in combination with brushing was found to be the most effective method of decontamination, with almost all of the DFs observed in the range of from two to twenty.
Though it was not discussed in the text, the DFs reported for some of the drone aircraft samples show a weak correlation with the initial contamination level. When the initial contamination level is lower, the DFs are lower, with stainless steel exhibiting the phenomenon to a more marked degree than the other tested materials. There were several instances where the DFs for stainless steel exposed on drone aircraft were less than two when the initial contamination levels were at the low end of the measurable range. A similar correlation was also observed for bare and painted aluminum samples, but was weak and not statistically significant. Miura and Ishida (1957) also observed this correlation, and particularly noted that decontamination was most effective initially, and that the repetition of cleaning operations had less effect.
E-3
Prewetting was found in Operation Greenhouse (ibid. ) to decrease decontamination effectiveness. A similar effect was observed by Corn (1961), who directly measured adhesive forces of nonradioactive particles in the range of 25.5 to 88 microns on a solid substrate. Adhesion was found to increase with greater humidity. On the other hand, time of contact (up to 44 hours) was not found to be important. The effect of prewetting could, however, be very important if rains fell before decontamination was attempted.
Corn (ibid.) did not observe a dependence of adhesive force with particle size. (However, all the particles used in his experiments were larger than the range of interest for plutonium contamination.) Decontamination force due to air or water movement or brushing would be expected, on physical grounds, to be in some way proportional to the facing area of the particles. The ratio of decontamination force to adhesive force is thus greater for larger particles. It is also reasonable to suppose that small particles can more effectively lodge in the valleys and crevices of a rough surface than can large particles.
In Operation Jangle, conducted at the NTS, Earl et al. (1952) reported on the DFs achievable for three test structures contaminated by fallout from surface and shallow buried nuclear detonations: two steel magazines and a simulated wood frame house. The tests began one week after the contamination. The most effective method, yielding an overall DF of six, was found to be vacuum cleaning and brushing followed by high-pressure-jet washing with a hot-detergent solution. DFs for this method were in the range of 5 to 20. Of particular interest for residential contamination were the results for tar and gravel and asbestos shingle roofs. Vacuuming alone on tar and gravel yielded DFs of 2 to 4.5. Vacuuming, followed by hot liquid cleaning, gave DFs from 8 to 20. Vacuum alone on asbestos shingles gave DFs from 1.1 to 3; vacuum plus hot liquid gave DFs from 3 to 16. The report noted that it was increasingly difficult to remove contaminant that was deposited at successively lower levels.
The decrease of decontamination efficiency at lower contamination levels has implications for repetitive operations. After a few passes of any cleaning method, a point could be reached at which additional passes would be of limited value. The Jangle report did not attempt to explain the phenomenon. However, in the Stoneman I1 tests utilizing radioactively-spiked simulated fallout, the sensitivity of DFs to initial mass loading was corroborated by Owen et al. (1960).
The Jangle report (ibid.) also reported on the exposure of equipment operators. Dust was raised in some operations, but the equipment offered considerable shielding. The authors recommended fatigue-type coveralls and full-face respirators for dry operations and full rubberized protective clothing for wet operations. Decontamination of the equipment used (trucks, graders, tractors, etc.) was not a problem; hosing, with detergent washing for oily areas, was sufficient.
Teres et al. (1953) investigated the decontamination of aircraft that had been flown through a radioactive cloud in Operation Snapper. The most effective decontamination method was solvent emulsion (Gunk@ and kerosene), brushing, and water and brush rinse. Final DFs between twelve and fifty were observed after three successive applications. Oily surfaces picked up more contamination, but could still be effectively decontaminated by this method. Abrasive surfaces
E-4
(the "step" areas, which were coated with a sandpaper-like material) were much more difficult to clean. Although significant amounts of contamination were removed in each successive application, the DF decreased for each successive pass.
In Operation Castle, conducted at the Bikini and Enewetak Atolls, Maloney et al. (1955) examined the effectiveness of decontamination on test panels of construction materials that were mounted on ships and barges and exposed to a nuclear detonation in a harbor. Obtaining results very similar to the Operation Crossroads experience, they found that after high-pressure hosing and vigorous scrubbing, the DF for most surfaces was less than two. The vigor of the efforts was indicated by their observation that decontamination contributed to the physical deterioration and outright removal of several of the protective coatings that were being tested.
In presenting some of the Castle results, we fully recognize that the fission products can be more difficult to remove than plutonium, and the chemical and physical form of fallout from a sea burst of a nuclear weapon would be very different from the contamination dispersed in a non- nuclear accident. However, it is interesting to note that decontamination after Castle was less effective than was expected by the test personnel (ibid.), who undoubtedly were all well aware of the decontamination difficulties after the Baker shot of Operation Crossroads.
Our review of the literature identified only one set of observations to support a high DF for plutonium. Pinson et al. (1957) and Dick and Baker (1967) reported on the effectiveness of decontamination after Operation Plumbbob, conducted at NTS. Those test results, possibly more than any other DoD results in the unclassified literature, are of interest because the contaminant was aerosol plutonium produced by the HE-detonation of a nuclear explosive test device.
At twelve days after the shot, with decontamination by high-pressure hosing with detergent and scrubbing, the average DF for all the surfaces evaluated was eighteen (ibid.). However, at twenty three days after the shot, decontamination of highway asphalt and wood float concrete by high- pressure hosing with detergent solution yielded DFs of three and four, respectively. Dick and Baker (1967) state that the DFs for the latter surfaces were low because of several rains that fell before decontamination.
However, the method for measurement of decontamination for the large asphalt and concrete pads at 23 days was so crude that the results appear questionable. Rains could have had the effect of reducing decontamination efficiency. Runoff could carry away the most easily separated particles, leaving only the most tenacious particles for the later purposeful decontamination. The moisture could also have increased the adhesion of particles to the roadway.
Dick and Baker (ibid.) also reported on the physical diameter of the deposited plutonium particles. In measurements of the particles found within a 16 km (10 miles) radius of ground zero, it was found that 99% had physical diameters of less than 2.5 microns. The report thus concluded that all of the fallout particles were in the respirable size range.
E-5

Maloney and Meredith (1962b) reported on simple decontamination of a residential structure and surrounding area contaminated by radioactively-laced sand. The particle sizes were in the range of 150 to 300 microns, with a mass loading of 50 g/ftz (536 g/m*). The particle size and mass loading are orders of magnitude larger than would be expected for a plutonium-dispersal accident. The DFs achieved on structures are thus not completely applicable. However, it is interesting to note that nondestructive cleaning of lawn areas by mowing or vacuuming yielded DFs of less than two, although large particle sizes and heavy mass loadings are usually easier to decontaminate. Removal of the sod by scraping gave a DF of eight. Subsequent shovel cleanup was able to remove essentially all of the contaminant.
Removal of the surface is, in fact, the most effective decontamination method for land surfaces. Surface soil can be removed by motor graders, bulldozers, motor scrapers, vacuuming, front end loaders, or hand shoveling. Hand shoveling is only appropriate for small areas or difficult terrain, and is not practical if there are large rocks or heavy vegetation present.
The depth of soil to be removed depends on the decontamination factor needed and the depth to which the contaminant has migrated into the soil. Brown et al. (1988) reported a marked decrease after one year in the effectiveness of removing one centimeter of soil, due largely to downward migration. Shinn et al. (1989a) reported that the fractions of %*Am in the top 5 centimeters of plutonium contaminated NTS soils ranged from 62-92%. Howorth and Sandalls (1987) reported on a test of plutonium migration in soil near Seascale in the UK; 90% of the total deposit was found in the top 15 centimeters.
Although it is the common practice to assume that plutonium deposited on surface soil does not migrate more than a few centimeters deep, Lukashev (1993) in assessing observations after the Chernobyl accident found that in the wetland soils typical of Byelorussia, plutonium
formed soluble organic complexes and migrated to depths of 15-20 centimeters. Anaerobic conditions are favorable for Pu migration due to its reduction from Pu4' to Pu3+, which is more mobile,
with similar findings by Pavlotskaya et al. (1994), and by Kopeykin (1994) who found that Chernobyl plutonium was being transported by water in the marshy environs.
The depth of soil to be removed may depend more on the need for multiple passes because of spillage than on the actual depth to which the plutonium has migrated. For almost all cases, 20 centimeters would probably be adequate and readily achievable, with local cleanup of any remaining hotspots.
Motor graders and bulldozers do not actually remove soil. They leave it in windrows or piles which must then be picked up by front end loaders. Meredith et al. (1964) noted problems with motor graders and bulldozers in their tests. A high degree of operator skill was found to be needed. There is a tendency for scraped material to escape under the blade because of uneven ground or operator inattention. As a result, successive passes were generally utilized. The same
E-6

spillage effects were noted by Lee et al. (1959). The data showed that although some activity was removed in each pass, the decontamination factor was lower for each successive attempt.
A similar effect has been noted by nearly all investigators. Straume et al. (1978) reported that considerable skill is also needed for front end loader operators. Operator error or carelessness during those test operations resulted in spillage of contaminated material during loading on to trucks. The same authors reported that vacuuming was successful, provided that the material had not appreciable migrated into the soil, and that the terrain was reasonably flat.
Similar results were reported by Shinn et al. (1989a); a truck mounted vacuum apparatus reduced "'Am in the soil by 92% after four passes. Motor scrapers, like vacuums, actually remove surface soil. Meredith et al. (1964) indicated results for scrapers similar to those for graders. Lee et al. (1959) found higher efficiencies for grading followed by scraping than for either method alone, and that either method gave higher efficiencies and lower effort per cycle than did bulldozing.
Plowing has been suggested as an alternative to soil removal (Adriano and Pinder, 1980; Dick and Baker, 1967; James and Wilkins, 1969; Menzel and James, 1971). The effectiveness of plowing is only that the contaminant is moved deeper into the soil and is diluted. We did not consider plowing as a usable decontamination strategy, because subsequent activities such as agricultural or landscaping operations could return the contaminant to the surface again, and such operations raise quantities of inhalable dust. Furthermore, plowing is only effective if essentially all the material is at the upper soil surface. Brown et al. (1988) presented the results of calculations showing the marked decrease of plowing effectiveness with time, because of migration of the contaminant deeper into the soil.
Maloney and Meredith (1962a), Maloney et al. (1962), and Meredith et al. (1964) described cold weather decontamination with simulated fallout. All techniques were found to be less effective in cold weather. However, merely removing contaminated snow gave a DF of three. Ordinary blade snowplows were reported to be the most efficient. Vacuuming was ineffective for bare frozen soil. Scraping and grading were effective for both frozen and thawing soils. Successive passes (up to four) of mechanical sweepers and firehosing were needed to achieve DFs of ten or greater on asphalt and concrete. Firehosing of roofs from the roof itself gave good results; firehosing from the ground was ineffective.
Lightly contaminated forest lands might be decontaminated by grubbing out the understory and scraping or vacuuming between trees. However, complete decontamination will usually entail felling and chipping all trees, grubbing out stumps, and scraping and removing the soil. Some of the radioactive material remains on leaves and pine needles for many months after deposition, even after new leaves have grown (Paajanen and Lehto, 1992).
Those authors (ibid.) found that it would not be advisable to attempt to burn the logs and litter in the field. The radioactive material might be concentrated in the ashes, and the ash is easily spread by wind. There is also a health hazard from aerosolization during burning. It seems
E-7
doubtful that such logs could be used for lumber, even after total de-barking, because of the potential for residual contamination, and public aversion.
A review of decontamination tests was performed by Owen et al. (1968) for the purpose of making the DoD information available to the public and civil defense planners for protection against nuclear war. In the conclusion section, their report states,
Residual mass, a measure of absolute effectiveness, is generally a direct function of initial muss loading. The residual fraction, a measure of relative effectiveness, usually exhibits an inverse relationship to mass loading or tends to remuin constant. ... Effectiveness improves as fallout particle size (range) increases and suvace texture becomes smoother.
DFs were reported (ibid.) for experiments where the particle size ranged from 44 to 600 microns physical diameter, much larger than the respirable size, and thus of limited applicability to plutonium accident decontamination estimates. (Plutonium particles with physical diameters of from 2 to 3.3 microns or less are considered respirable.) The range of mass loading for which results were reported was 54 to 1076 g/m2 (5 to 100 g/f?), seven orders of magnitude higher than the contamination levels of interest in this report. (The 0.2 pCi/m2 screening level for plutonium is approximately 3 pg/m2.)
When contamination levels are extremely high, particles are likely to be deposited on other contaminant particles, and not the surface being evaluated. It stands to reason that the DFs achieved under those circumstances could be very high, and some DFs of a hundred or more are reported (Owen et al., 1968). However, after considering the conditions associated with the cited DoD experiments on decontamination, and the purpose for which they were intended, it is clear that the DFs achieved in those tests represent an optimistic upper bound on the DFs that might be achievable after an accident of the type being considered in this report.
And, since many of the DoD test results show achievable DFs of less than ten, it is doubtful that the long-postponed decontamination of private property contaminated by a plutonium-dispersal accident would be worthwhile. On the other hand, prompt (nondestructive) decontamination of most surfaces could be expected to give a DF of at least two. Higher DFs would be achievable if part of the surface could be removed, as in the shotblasting or planing of pavement surfaces or the scraping and removing of soil.
The difficulty of achieving a high DF is supported by results from civilian researchers in Europe. In a review of the available literature, including work by the DOE and DoD, Warming (1984a) concluded that, "gentle action that keeps the surface relatively unharmed gives a DF below ten."
In outdoor experiments using simulated fission products, Warming (1982; 1984b) found DFs of less than two for high-pressure hosing of asphalt and concrete and concluded that when decontamination is delayed for a month, high-pressure hosing of urban surfaces was found to remove only 5-10% of the contamination, and was thus deemed not worthwhile.
E-8
In Warming’s (1987) shotblasting test, removal of “Rb from a 25 year old asphalt road was evaluated with a machine designed for the removal of rubber tracks from airport runways. The BlastracB machine utilizes high-velocity steel pellets to remove the surface layer, incorporating a vacuum system to capture the waste material and recycle the pellets. Shotblasting was found more effective than high-pressure hosing, but, at sixteen days after deposition, was able to achieve only a DF of two. In assessing this result, we note that the soluble rubidium, which can chemically react with asphalt, was applied as a spray solution and furthermore that 15 millimeters of precipitation occurred before the performance of the decontamination.
In earlier work on the subject, Warming (1982) attributed the tenacity of rubidium to chemical bonding with the roadway surface. The shotblasting results are thus only qualitatively applicable to plutonium contamination, for which no such chemical bonding would be expected. For ruthenium, which is similar to plutonium because it does not chemically bond to the surface, there was no reduction of efficiency with age. However, the general trend of decreasing effectiveness with time might be at least partially applicable to plutonium if heavy rains occur before decontamination. Warming noted that heavy showers removed some of the contaminant, as well as accelerating the chemical reactions between particles and substrate. Probably, the most easily removed particles were swept away by runoff leaving the more firmly fixed particles behind. The same effect was observed by Dick and Baker (1967). Wetting could also increase adhesive force if a liquid film developed.
Barbier and Chester (undated) described other machines for removing the top layer of concrete. Planers are much more effective than wirebrushers, but also more costly ($1.46 per m2 for one inch of planing depth, according to Means, 1994b). Any such equipment requires an associated vacuum to remove the dust and material loosened and prevent recontamination.
Some buildings have been effectively decontaminated after long delays (White, 1980.) The interiors of the buildings had to be completely gutted and replaced. Roofs had to be removed and rebuilt with new materials. The buildings were effectively stripped of all removable surfaces, including plaster or wallboards, and rebuilt with new materials.
Sandblasting can decontaminate hard surfaces very well and DFs of from ten to a hundred might be achievable, but the equipment would have to reliably retain all the contaminated material, including a substantial volume of sand, which would all require disposal. Also, sandblasting of surfaces less robust than concrete and asphalt could have a totally destructive effect.
No matter what method of decontamination is used, and how carefully it is carried out, there is always some spillage and re-contamination. Heavily contaminated residential property would be especially difficult to decontaminate because, through spillage, the contaminant could become lodged in crevices within the structure from which it could not be removed except by major demolition and rebuilding. Unless the material could be reliably sealed, respirable particles could be released, for example, if structural repairs or modifications were carried out after the building had been returned to service.
E-9

There are very few sources of data on the decontamination of building interiors. Some normal housecleaning operations, especially vacuuming with ordinary vacuum cleaners, actually release respirable particles into the air (Consumer Reports, 1995), indicating that decontamination of interiors should be as complete as possible. Inhabitants, especially children, spend a large fraction of time indoors and any particles dislodged in the air could easily be inhaled.
Interior surfaces in a tightly-closed house could be more lightly contaminated than the exterior because of filtration effects. If windows or doors are open during cloud passage, areas of the interior could be as heavily contaminated as the exterior. Moreover, there are always some leaks, and the very fine particles from a plutonium-dispersal accident could always enter the tiny cracks that are inevitable even in well-constructed homes; this would be especially true in regions subject to high winds.
Nevertheless, available data indicates that if windows and doors were closed, indoor dust levels would be from 10% to 50% of the outdoor dust levels (Roed, 1985; El-Shobokshy and Hussein, 1988; DOE, 1990; Allot et al., 1992). There might only be minimal weathering effects inside buildings, so the decrease of efficiency with time might be less pronounced than for outdoors.
Tawil and Bold (1 990-DRAFT) have estimated decontamination factors for various floor surfaces, including carpeting, and hard-finish and soft-finish furniture. A DF of approximately two is estimated for vacuuming. Additional operations, such as shampooing after vacuuming, give only small increases in the DF.
Very high DFs (that is, greater than ten) can probably only be achieved by vacuuming, followed by spraying with a fixative to prevent releasing the contaminant, and removal (including pad) and replacement. If this drastic step is carried out, the under flooring would also have to be thoroughly cleaned before placing the new carpet. Reasonably high DFs are achievable on linoleum flooring with double vacuuming followed by washing and scrubbing. Lower DFs (not over ten) are reported for the same operations on wood floors. Vacuuming, foaming, and shampooing soft-finish furniture gives results similar to carpets; replacement is the only means of achieving a high DF. Repeated washing of hard-finish furniture is reported to be not very effective: the most effective cleaning method is repeated vacuuming, followed by repeated washing and rinsing.
Empirical data on the limited effectiveness of delayed decontamination can be obtained from the Soviet experience after Chernobyl nuclear power plant accident. Two attempts to decontaminate the nearby town of Pripyat ended in failure. After those attempts, in 1990, it was found that the contamination levels of the decontaminated and un-decontaminated areas of Pripyat were practically the same (Paajanen and Lehto, 1992).
In discussing this phenomenon with some prescience, Howorth and Sandalls (1987) stated that in the first three to four months after an accident, the resuspension of loosely attached particles will be significant. And, in areas with high concentration gradients, the pattern of deposition can continue to change significantly for one to two years.
E-10

After the Chernobyl accident, it became widely recognized that the decontamination of urban areas could be exceedingly difficult. The following observations came to be widespread in the European literature. Porous surfaces are much more difficult to decontaminate than smooth surfaces. Material deposited by rain is much more difficult to remove than material deposited under dry conditions. And, of greatest importance, as the time lapse from deposition to decontamination increases, decontamination is rendered less effective. Both the problems for decontamination and the hazards to humans are different than for a plutonium-dispersal accident. However, it should be noted that the difficulties proved to be greater, and the decontamination was less effective, than prior expectations would have suggested.
However, the acknowledged difficulties of the Chernobyl cleanup (Current Digest of the Soviet Press, 1989; 1990; and Nuclear Engineering International, 1994) may be due in large part to poor training, lack of equipment, and the almost total breakdown in leadership that followed the accident (Woolfson, 1989). Although the contemporary press reports highlighted the impressive heroism of fire fighters and helicopter pilots who helped minimize spread of material and incurred large radiation doses, many of the local officials and reactor technical staff fled the scene in panic.
Despite the limited applicability of the Chernobyl experience to the potential accidents under consideration it is worthwhile, because of the many important points raised, to quote from Sobotovich (1994) a summary of the cleanup results after five years of decontamination activities,
... some of them are virtually valueless. An example is decontaminating inhabited areas as pe$ormed by sections of the civil defense force in the strict control zones. In four years, decontamination involved the accrual of 1.5 million man-ber (to 120,000 people) and cost 1.5 billion rubles. m e results of this decontamination were very slight. The background levels in the inhabited areas were reduced on average by 10-15%. For that money, one could have constructed three Slavutich cities (490 million rubles each), which could have received the people from the uselessly decontaminated areas.
and, in noting a principal cause of the difficulties encountered, this source states,
... It must always be remembered that introducing energy into the system (in mechanical, chemical, or other forms) increases the radionuclide mobility and consequently causes spread.
Laboratory experiments have demonstrated the difficulties in the decontamination of fission products. Sandalls (1987) examined the effectiveness of chemical solutions in removing cesium from many types of building surfaces. Spraying and soaking were evaluated. An ion-exchange solution of ammonium nitrate was found to be more effective than an etching solution of hydrochloric acid. Nevertheless, porous surfaces like brick and clay tile, even after twenty hours of spray treatment, showed DFs of less than two. It is noted, however, that removal of fission
E-1 1

products is likely to be much more difficult than removing the plutonium oxide deposits expected from a weapons accident, because plutonium oxides would not chemically bond to the substrate.
In discussing the most effectively decontaminated surfaces (ibid.), aged roof material exhibiting DFs of ten or more, it was stated that the efficient decontamination of aged roof material could be due to the trapping of cesium by visible surface algae, which were easily removed. It was also pointed out that large quantities of chemical agents might be needed and mentioned, as a plus, that the procurement cost of ammonium nitrate is low because of its widespread use in agriculture as fertilizer. The use of large quantities of fertilizer might have detrimental effects on the environment; however, the effectiveness of ammonium nitrate cannot be extrapolated to plutonium because of the different chemistry of cesium and plutonium. Thus, the trapping effect observed for cesium may be irrelevant for plutonium.
Incorporation of post-Chernobyl decontamination data from the U.K. and Denmark was described by Brown et al. (1988) who concluded that, for decontamination performed within one to twelve months of deposition, removal of walls, roofs, paved areas, and inside surfaces from homes would result in DFs of less than two. They stated,
to be at all effective the su$aces need removing at 30 days or earlier.
Roed and Sandalls (1990) reported on the effectiveness of residential decontamination in Gavle, Sweden, which was contaminated by a heavy rain deposit of Chernobyl fallout. For wet deposition, they found that gardens could be decontaminated to a DF of two by removing soil, but, aside from windows, which were found to be easily decontaminated, no more than 18% of the contaminant could be removed from the other components of residential property.
Because of the abundance of information indicating the limited usefulness of decontamination of fission products, European reactor risk assessments have begun utilizing the new information. For example, the Nordic Liaison Committee for Atomic Energy (1990: p. 150), utilized a DF of three for the groundshine pathway in a comprehensive evaluation of countermeasures and costs.
Although the post-Chernobyl research on decontamination has focused almost exclusively on cesium, the insights into the difficulties of decontamination are to some extent applicable to plutonium contamination. Although cesium is more soluble and binds with surfaces more readily, the high-energy gamma radiations emitted from deposited radioactive cesium are easily detected with simple field instruments, even if the material migrates below surfaces. In contrast, plutonium measurement in the field might be very difficult, particularly if some of the material was lodged in crevices, under vegetation, or inside buildings. Decontamination would probably be useless unless the post-cleanup level of residual contamination could be reliably quantified.
E-12

Appendix F
Technical Basis of Cost Estimates F.l Data Sources and Uncertainty in Cost Estimates
The estimation of costs from hypothetical accidents entails considerable uncertainty. If one were to calculate projected costs for an actual accident, the site-specific data, resources, and action plans would be known or could be reasonably estimated. However, none of this information is available for estimating the costs of the hypothetical accidents under consideration.
We have estimated costs by analyzing generic land areas that match national or regional averages. Towards this end, we developed conceptual designs of sample land-use patterns that, in our judgement, are consistent with national-average characteristics for the particular land usage. For example, we analyzed a city block similar to residential blocks actually observed locally, and this model of an urban residential area was then updated to match the national average statistics for residential housing.
We then evaluated the operations that might be utilized to meet specific remediation goals for these "typical" land-use patterns. Alternative choices of operations would surely be possible. We tried to balance the cost of each operation against speed and effectiveness, using experience and engineering judgment. The least expensive method was not chosen if it appeared incapable of completing the remediation effectively. The costs of the chosen sub-operations were then estimated using standard contractors' handbooks or other data. The process is similar to what a contractor performs before bidding for a job.
We do not pretend that either the strategies chosen or the cost information is unique or optimum. There would be countless alternative strategies and operations for achieving the desired end result. It would be an overwhelming task, and far beyond the scope of this study, to attempt to evaluate all possible strategies, and to estimate the attendant uncertainties. It would also be fruitless; political and social pressures or inadequate resources might conceivably result in a less- than-optimal strategy for an actual accident.
Our calculations have produced what we believe to be defensible estimates of the costs for a restricted set of strategies for remediating a restricted set of possible sites. Although in some instances we have chosen parameter values conservatively, the resultant bias is compensated to some unknown extent by the many potential costs that have been omitted from our estimates.
The descriptions of the strategies and operations are by no means recommendations or prescriptions for work to be carried out in the unlikely event of an actual accident. Wherever it is stated that any action "would" be carried out, the intention is only to provide details of our
F- 1

scenarios. Whether or not any specific action would be carried out is a decision beyond the purview of this study.
There are many sources of uncertainty. Any specific site may differ from the typical sites that we analyzed. Also, for any specific hypothetical or actual accident, the remediation goal and strategies for achieving such could differ from our assumptions. Further, high and low bids usually differ from one another (often by substantial amounts); and the operations we analyzed might not represent optimum (or even logical) choices for a particular postulated accident.
We have not accounted for the possibility that the organization(s) performing the operation might have unique equipment or capabilities that afford an unforeseen efficiency, nor have we considered the possibility of a contractor increasing costs through error or carelessness. The sparsity of data on radiological cleanups is also noted. The historical background for bidding on ordinary construction contracts is so extensive that these costs can generally be estimated with fair accuracy; the background for bidding on radiological decontamination tasks is far less complete.
An additional source of uncertainty arises from uncertainty in the unit-cost data, which varies to some degree depending on the source. In some cases we have been able to average data from several sources. However, only a single source was found for most cost data. We depended heavily on the estimates in Tawil et al. (1985) and Tawil and Bold (1990-DRAFT). Their cost estimates appear to have been diligently researched. However, when we compared their estimates (corrected for inflation) with the most recent available data from Means (1994a, 1994b), we found significant differences in some cases. For some operations the Tawil data were higher than the 1995 bidding estimates, and lower for others. We used the more recent estimates for all operations for which they were available.
The cost estimates for expedited urban remediation have been carried out for light, moderate, and heavy contamination. These degrees of contamination are keyed to the DFs potentially achievable by our chosen strategies. There is currently an absence of regulations defining a clear target level of residual contamination to be achieved by remediation. As a result, there is large uncertainty as to which of the strategies would apply, and for what fraction of the affected area, in the remediation of any specific hypothetical accident.
Perhaps the greatest element of uncertainty stems from the sparsity of relevant historical data; plutonium-dispersal accidents have not occurred since 1968. Much of the uncertainty is inherent in the nature of prospective future hypothetical accidents. For example, in the absence of relevant historical data and an a priuri plan for providing financial compensation, it is impossible to know how those compensation costs would be assessed by the Federal Courts.
It has been necessary for us to make many assumptions about policies and decisions that would have a great impact on costs, but it is purely a matter of our judgement that these assumptions seem to be reasonable. In applying our cost estimates to any particular application, risk assessors
F-2

are urged to evaluate the appropriateness of our assumptions, and to provide suggestions on how these estimates might be improved.
Some of the attendant uncertainty could be removed by using site-specific information. For example, our calculations for the cost of remediation of Midwest farmland include the average incidence of small villages in several farm States. It might be known that there are no villages or farm buildings contaminated in a specific hypothetical accident. The calculations could then be modified to account for the absence of villages. The spreadsheets for our cost calculations are presented in Appendix G. These spreadsheets could be modified for different site data or to include more timely cost information. As was mentioned in Section 6.0, the spreadsheets are also being incorporated into a C" computer program intended for use with the RADTRAN code.
Some cost estimates are area dependent, that is, given in dollars per square kilometer. Still others are time dependent, in dollars per month or year. A very few are length dependent, in dollars per meter. These cost components can only be combined if the corresponding area, time, and length parameters are known or can be estimated.
Several data sources have been utilized to develop our cost estimates. Spreadsheet DATA.WK1 of Appendix G gives, for each datum, the reference source and the page number or table number from which the datum was taken. Any value in a data spreadsheet can be changed or updated, and the change will automatically propagate upward through the higher-level linked spreadsheets.
The construction cost estimates, such as those from Means (1994a, 1994b) include an allowance for contractors' overhead and profit. However, no allowance has been made for the government's overhead cost in assembling resources and overseeing the work. In a few instances discussed previously, history suggests that government overhead could be as great as the actual cost of performing the cleanup work.
We have assumed that the restoration of an accident site could be performed by military personnel, or by civilian contractors, or by some combination of the two. Some military units (for example, the U.S. Army Chemical Corps) have personnel, equipment, and training suitable for performing decontamination in hazardous environments, but there might be no need to utilize such specialized military forces. All of the heavy demolition, construction, and reclamation tasks could probably be performed by the Army Corps of Engineers or their contractors. We have assumed that the total cost of any work assigned to military units would be equal to a competitive contractor's bid for similar work.
F.2 Emergency Actions
The DOE and DoD maintain the capability of transporting necessary equipment and personnel to a radiation accident on short notice. We have not considered the cost of maintaining those capabilities in a ready status. One urgent and immediate action might be the removal of national security material from the accident site. We have not estimated the cost of this activity.
F-3
Fixatives other than water might not be used for remediation due to possible concerns about detrimental impacts to the environment. Thus, for extended remediation we considered only water as a fixative. For expedited decontamination we considered water spraying for lightly contaminated areas, those for which a DF of two is appropriate. Repeated water spraying would be appropriate for moderately contaminated areas, those for which a DF of 5-10 would be adequate.
For very heavily contaminated areas, spraying with a binder or fixative, such as road oil or an organic binder, might be appropriate; more effective fixation could be needed for such areas in order to minimize the spread of the heavy contamination. We supposed that a binder would always be sprayed on streets and unoccupied land for expedited decontamination; any detrimental impacts of such spraying could be mitigated by removal of the contaminated soil.
Water used for cleanup, especially in only lightly contaminated areas, might contain so little plutonium that no special treatment would be required. It is highly speculative whether such water would have to be treated or disposed of. We have included the cost of removing water used for decontamination, but have not estimated the cost of removing standing rain water. If all water, including rain water, were sent for disposal, the cost of remediation would be only fractionally increased. If no water were saved for disposal, the cost of remediation would be only fractionally decreased.
We also estimated the cost of blocking streets by earthen barriers to limit the migration of plutonium by runoff. Sewers could be blocked by expandable plugs in the lines. However, the sewers themselves would then become contaminated, and decontamination would be difficult or impossible and extremely costly. We chose to consider gasketted plugs for each manhole, at minimal cost. The small amount of leakage, if any, would probably be deposited immediately under the manholes, from which it could easily be decontaminated.
The cost of verifying evacuation, of decontaminating and monitoring evacuated individuals, and of sealing buildings has not been specifically addressed. We have included the cost of guards as a part of access control. We initiated the guard cost immediately after the dispersal incident, and the amount should be sufficient to cover evacuation verification. However, the expense of carrying out the evacuation and of decontaminating and monitoring the evacuated populace has not been included; this expense is expected to be minor, relative to other costs.
Estimates for the cost of emergency actions in rural areas include harvest and disposal of standing crops in fields, followed by windrowing the soil with simultaneous water spraying to hold down dust. Additional water irrigation after windrowing would help to minimize resuspension. We also included compensation to farmers for loss of the affected crops. Any watercourses on the land were assumed to be blocked to prevent contamination from traveling downstream. The cost of this action has not been estimated. In most cases, watercourses would only be active seasonally or following heavy rains, and runoff could be prevented by simple earthen dams at minimal cost. If natural running streams crossed the land, blockage could be difficult and extremely costly.
F-4

The earliest actions in a plutonium-dispersal accident that contaminated a highway would probably be taken by local or State law enforcement. As soon as any injured individuals had been transported from the scene, we assumed that the highway would be closed and traffic rerouted over alternate routes. The costs for local and State response and the rerouting of traffic have not been included in our estimates.
In the event of a highway accident, the spread of the contamination could be minimized by spraying a fixative on the highway and surrounding land. Ditches, culverts, and watercourses could be blocked to minimize wider contamination via water runoff. Our cost estimates include blockage and fixative spraying. Construction of a detour around the contaminated area could begin as soon as aerial and ground surveys had determined the extent of the contamination. A detour might not be necessary if uncontaminated alternate routes allowed ample traffic flow. We present the cost of detours separately, so that risk analysts can include detours only if circumstances require them.
If airport runways were contaminated, the emergency actions would depend on the extent of the contamination. An efficient fixative such as road oil or an organic binder could be sprayed on and between runways to minimize resuspension and spreading the contamination. A dike could be constructed around the contaminated area to minimize the spread of Contamination by runoff. Our cost estimates include dikes and fixative spraying.
If an expedited cleanup were conducted, CERCLA and NEPA waivers might be required. The development of cleanup plans would probably need to be undertaken very quickly. We have assumed that the cleanup planning for expedited cleanup would be concurrent with emergency actions and site characterization,and that contractors would be alerted, and resources of material, equipment, and personnel would be gathered at the site as soon as possible. The needed equipment could include large capacity truck mounted HEPA vacuums, high powered HEPA household vacuums, bulldozers, motor scrapers and graders, firehoses, pumps, vacuum hazardous waste tank trucks, vacuum street sweepers, highway planers, and a sizeable m a y of smaller and less specialized commercial equipment.
The cost of equipment is included in our cost estimates, but not the cost of transporting it to and from the site, which could vary greatly depending on the location. Mobilization and demobilization of heavy equipment costs from $250 to nearly $400 per unit (Means, 1995b). Personnel, in addition to those required for site characterization, would include health physics technicians, analytic laboratory staff, equipment operators, laborers, and foremen, as well as government inspectors and supervisors. We have allotted one month for planning, marshaling resources, and letting contracts.
In the absence of in-place plans tested by exercise, this time allotment may be optimistic. The one month time allotment is based on the contaminated area being of modest extent (just a few km2) and simple character. Larger areas or those with complex features might require much more planning, resources, personnel, and time. If the cleanup plans called for the performance of complex or potentially hazardous tasks, there might be a need to test the plans with practice
F-5
exercises, adding to the cost and required time. Planning costs have not been included in our estimates.
F.3 Access Control
We estimated costs for dual-barrier access control. The area (including a suitable buffer zone) is assumed to be fenced. Patrolling guards could give a second layer of protection. The cost of fencing varies greatly with the type and intended purpose of the fence. We used costs for a six- foot high industrial grade chain-link fence, with the customary aluminum poles and three courses of barbed wire. A twelve-foot high security type fence with heavy steel poles emplaced in concrete, suitable for prisons or high security areas, would give additional protection against intrusion. However, the cost of a high security fence is more than five times as great as an industrial grade fence, and we assumed the use of the latter throughout.
The perimeter-to-area ratio depends on the size and shape of the contaminated region. We have provided fencing costs in dollars per meter, which can be used directly for specific hypothetical accidents for which the perimeter length has been determined.
In rural areas, with long sight lines and sparse surrounding population, one guard has been assumed adequate for two km2. However, sight lines in urban areas are much shorter, and the surrounding population could be denser, and we have assumed two guards for each km2. The guards would be on duty at all hours. The length of time for access control is indeterminate. As an example, we have assumed access control for three months for expedited remediation if no part of the area is heavily contaminated, six months if part of the area is moderately contaminated, one year if part of the area is heavily contaminated, and five years for extended remediation under CERCLA. These estimates are provided only to show a rough approximation of the magnitude of access control expenses relative to other costs. Because of the low cost of the guards relative to other costs, the uncertainty involved in the time for access control is not very important.
F.4 Radiologic Characterization and Certification
We collected nine estimates for the cost of characterization and certification. All of these estimates are for ground surveys. The cost of aerial surveys might be lower, but the higher sensitivity and accuracy of ground surveys would probably be required. The highest estimate is a pessimistic judgment of the cost in a remote, difficult region. Similarly, the lowest estimate is an optimistic judgment of cost for an easily surveyed area. Neither the highest nor the lowest is believed realistic for most of the sites we have analyzed for a hypothetical accident, and we have therefore taken "low" and "high" averages of the cost estimates.
In an open rural area, there are fewer obstacles to radiological survey than in an urban setting. Site characterization would be easier and less costly than in a city. Therefore, we used the mean of the lowest five estimates for rural sites and streets or unoccupied land. Characterization of an urban area would involve making measurements on and around buildings, which could be
F-6

awkward and time consuming. Therefore, we used the mean of the highest five estimates for residential, commercial, or industrial sites. Forested areas would probably be the most difficult to characterize, and there is no experience to guide cost estimation. Therefore, we used the highest estimate found for characterization of forests.
F.5 Lost Income and Personal Property
Populations removed from their homes and temporarily or permanently relocated elsewhere would incur numerous associated expenses for which they could be compensated under the Robert T. Stafford Disaster Relief Act or the Atomic Energy Act. We generally assumed that all damages would be either repaired or compensated for. We used replacement cost rather than market value as the basis for compensation. Compensation costs would be lower, in some cases significantly so, if market value were used as the basis. Compensation is a major element of total cost, and the difference between replacement cost and market value could be an important source of uncertainty.
Every displaced household was assumed to be lodged in quarters similar to those they had left. We have taken the rental cost to be that for housing units of average size and quality. A rental allowance of three months was allocated for lightly contaminated areas, six months for moderately contaminated areas, and one year for heavily contaminated areas or for extended remediation. Only one year’s rental was used for extended remediation, under the assumption that by the end of a year, all condemned property would have been paid for.
For simplicity, and because duration of unemployment is highly variable, we assumed that there would be no lost income compensation for residents of the affected area, except for employees of commercial establishments temporarily or permanently closed. However, if an entire small town had to be displaced, the residents could face extended unemployment and thus might receive government compensation. The latter type of cost has not been included in our estimates, but lost business income has been addressed, as follows.
Displaced businesses or temporarily shut could be eligible for lost income compensation. We made the conservative assumption that such compensation would be paid. This was estimated as the average net income for small firms plus average payrolls for each enterprise. Businesses could also be compensated for lost inventories. There is no experience on which to base an estimate of the amount of stock that could be salvaged.
We conservatively assumed that all stock would have to be removed, disposed of, and compensated for. Hard-surfaced nonporous articles could probably be adequately cleaned, but the cost might well approach the value of the items. Jewelry and other items of very high value would probably be cleaned. Clothing and other soft goods could be cleaned, but could not then be sold as new items. The conservatism of our assumption is recognized, and this is an obvious source of uncertainty. The average value of inventory for retail stores, exclusive of automobile dealers and department stores, as determined from Bureau of the Census (1994), was used for
F-7

each establishment. The cost for replacement of inventory is large, and the use of an average for a several types of f m s could also be a source of uncertainty.
We included compensation to businesses for loss of income during the entire duration of the decontamination effort, but not to exceed one year. This could amount to payment for 12 months for heavily contaminated areas. During the course of a year, many of those eligible for compensation would probably have found other employment. We were unable to estimate the number of such persons, so we have conservatively estimated that all employees of affected firms would be compensated for the full period. We assumed compensation for one year’s net sales income for businesses that were permanently dislocated, as well as for lost buildings, inventory, and equipment.
For extended decontamination under the CERCLA process, there could be a lapse of several years before decontamination even started. We have chosen to assume that lost income compensation would be paid for only one year; at the end of a year we assumed that all businesses would have been condemned and paid for. However, the condemnation process might last longer, and lost income compensation might thus be continued until the government had acquired the properties. This is a source of uncertainty that could be explored in future research.
The use of an average net income per firm could understate the compensation for lost business income. The average area we used for each building, 1315 m2, appeared reasonably representa- tive of shopping centers we visited. However, many such buildings were subdivided, with several establishments in each building. The use of an average value per firm would understate the amount of compensation if there were more firms than we had assumed. On the other hand, the inclusion of public and semi-public buildings, which might have no income to be compensated for, as being equivalent to the commercial sector might tend to overstate lost income compensation. Also, the net sales income we used was for 1991, a recession year. We are unable to estimate which of these contradictory tendencies is more important.
Personal property might be lost for moderately to heavily contaminated residential properties. We calculated the replacement cost for average personal property, including motor vehicles and all household furnishings and appliances. We postulated total recovery of all personal property for lightly contaminated areas, and total loss for moderately to heavily contaminated areas. Actually, some loss could be expected even in lightly contaminated residences, and some items would probably be salvaged in moderately or heavily contaminated residences. We have implicitly assumed that the cost of cleaning any salvaged items would be equal to the replace- ment cost. Because the value of personal property could be large, the uncertainty in the fraction salvaged might be a significant factor in the total cost uncertainty.
FEMA has in the past compensated victims of natural disasters for personal items that were unavailable to them even temporarily. The magnitude of this compensation has varied depending on the amount of the disaster relief appropriation. We included an allowance for each displaced household to cover clothing, electronic entertainment items, household articles, and work related tools during the period of dislocation. The amount of this personal allowance is a possible source
F-8

of uncertainty. However, the magnitude of the allowance would not be large compared with other costs even under quite generous terms. We have calculated an average allowance per household for clothing, home entertainment, and housewares for an average sized household to be in the neighborhood of $5,000 per household.
F.6 Decontamination
Many cost factors would be higher during decontamination operations than in normal construction. Workers are assumed to wear protective clothing and filtered breathing apparatus, with fully-rubberized protective clothing in wet operations. Every worker, as a minimum, is assumed to wear a full-face filter, and workers in particularly dusty tasks might need to use self- contained breathing apparatus.
There is ample evidence, for example, see (DNA, 1981) that efficiency is drastically reduced under protective circumstances. Time is lost at the beginning of the day in suiting up, and at the end of the day in personnel decontamination and monitoring. There are a number of other cost factors that could result in higher costs than are faced in normal construction activities: overhead, equipment rental expense, higher cost of insurance, and scheduling difficulties.
Tawil et al., 1984, and Tawil and Bold (1990-DRAFT) allowed one hour per eight-hour shift for suiting up, decontamination, and monitoring, but did not make any allowance for the reduction of efficiency attributable to protective equipment. Tawil et al. (1984) also mention that workers might receive a premium in pay for working in a radioactively contaminated environment.
Because the loss of time for suiting up and suiting down is only part of the overall loss of efficiency, and because one hour per shift appears only marginally sufficient, we consider their one-hour allowance to be overly optimistic. An allowance of 30 minutes at the beginning of the shift, one hour at the end of the shift for changing and showering, and 30 minutes for health physics monitoring appears more reasonable. This would increase costs by a factor of 1.33.
We applied this factor of 1.33 to all cost elements as well as to labor. The cost of overhead and equipment rentals would reasonably be increased in like ratio. Although expendable material costs might not be increased because of the difficulties of working in a protected environment, there would be other material costs: protective clothing, respirators, etc., in addition to added costs for monitoring. We applied a factor of 1.17 to Tawil and Bold’s cost estimates, to bring them up to the same basis (1.17 x 8/7 = 1.33). We did not apply this factor for tasks that take place in a radiologically clean environment.
Many contractors bidding on remediation contracts might not have personal experience with operations in a radiation environment. There is, however, adequate experience in working under other unfavorable conditions. Means (1994a, 1994b) provides separate estimates for the cost of some operations for ”adverse” as opposed to average or ideal conditions. Adverse conditions, as used by Means, refers to inclement weather and unfavorable terrain rather than to radioactive protection conditions. The increment for adverse conditions for 20 randomly chosen operations
F-9

ranged from 10% to over loo%, with a mean of 42%. A factor of 1.42 compares reasonably well with the estimated factor of 1.33.
The present cost estimates are not systematically conservative. However, there are some costs for which we believed that our estimates might be somewhat high. On the other hand, we made no allowances for inadvertent damage that would have to be repaired or compensated for. For example, we did not allow for the possibility that scrubbing residential roofs could damage or loosen some shingles, which would either need to be repaired or replaced. We did not make a specific allowance for contingencies. Contractors’ bids normally contain an allowance for unforeseen circumstances, and we assumed that an adequate contingency allowance was already included in the bidding estimates.
We separately estimated costs for light, moderate, and heavy contamination areas. Light contamination is that for which a DF of 2-5 would be adequate. We assigned moderate contamination to areas for which a DF of 5-10 would be required. Heavy contamination is that which would require a DF greater than 10. The levels of contamination corresponding to these definitions would depend on the residual contamination level to be achieved after decontamina- tion. There is currently no firm guidance on the allowable level. (See Appendix B). Risk assessors should explore the uncertainty attendant on the unknown level to be achieved. However, relative costs of operational strategies can be assessed with less uncertainty.
F.6.1 Expedited Decontamination of Mixed-Use Urban Areas
We considered three scenarios corresponding to ascending levels of contamination. For the most lightly contaminated area, for which a DF of 2-5 would be adequate, we postulated methods of decontamination that would leave the property in essentially the same state as before an accident. For moderately contaminated areas, for which a DF of 5-10 would be required, we postulated decontamination methods that leave the property altered, but of equal or greater value as before an accident.
For any property so heavily contaminated that a DF greater than 10 would be required, we have been unable to discover any practical method that could reliably achieve successful decontamina- tion short of completely demolishing buildings and disposing of the material in a licensed burial facility. Cleanup operations that yield DFs much greater than 10 overall are difficult to achieve and are likely to be more costly than the value of the property would warrant. We note, however, very high DFs might be possible for local hot spots using simple low-cost shovel and pail techniques.
We have not assumed acquisition of real property to be necessary for the lightly or moderately contaminated areas. If residents declined to accept the return of their property after its cleaning, the government could purchase it and resell it to other buyers. Although the government might incur some loss due to depressed market values, we are unwilling to speculate on a possible magnitude, nor are we willing to estimate the fraction of residents who would decline to reoccupy their homes.
F-10
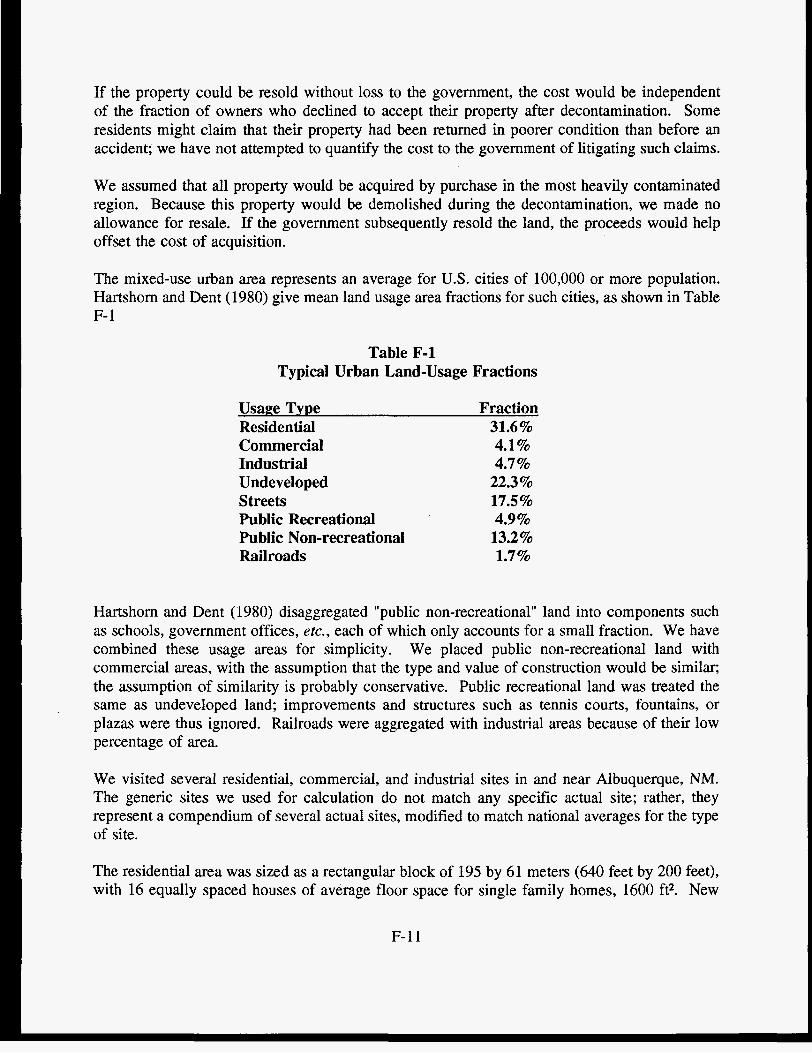
If the property could be resold without loss to the government, the cost would be independent of the fraction of owners who declined to accept their property after decontamination. Some residents might claim that their property had been returned in poorer condition than before an accident; we have not attempted to quantify the cost to the government of litigating such claims.
We assumed that all property would be acquired by purchase in the most heavily contaminated region. Because this property would be demolished during the decontamination, we made no allowance for resale. If the government subsequently resold the land, the proceeds would help offset the cost of acquisition.
The mixed-use urban area represents an average for U.S. cities of 100,000 or more population. Hartshorn and Dent (1980) give mean land usage area fractions for such cities, as shown in Table F- 1
Table F-1 Typical Urban Land-Usage Fractions
Usage Type Residential Commercial Industrial Undeveloped Streets Public Recreational Public Non-recreational Rail roads
Fraction 31.6% 4.1% 4.7 %
22.3 % 17.5 % 4.9% 13.2% 1.7%
Hartshorn and Dent ( 1980) disaggregated "public non-recreational" land into components such as schools, government offices, etc., each of which only accounts for a small fraction. We have combined these usage areas for simplicity. We placed public non-recreational land with commercial areas, with the assumption that the type and value of construction would be similar; the assumption of similarity is probably conservative. Public recreational land was treated the same as undeveloped land; improvements and structures such as tennis courts, fountains, or plazas were thus ignored. Railroads were aggregated with industrial areas because of their low percentage of area.
We visited several residential, commercial, and industrial sites in and near Albuquerque, NM. The generic sites we used for calculation do not match any specific actual site; rather, they represent a compendium of several actual sites, modified to match national averages for the type of site.
The residential area was sized as a rectangular block of 195 by 61 meters (640 feet by 200 feet), with 16 equally spaced houses of average floor space for single family homes, 1600 ft2. New
F-11
houses constructed in 1993 had an average area of 2,095 ft2. However, the average single family residence was then approximately 18 years old. An area of 1,600 ft2 is more appropriate for homes of this age. Each residence was assumed to include a single car attached garage. Each I
I lot was sized at 24.4 meters by 30.5 meters, and was assumed to have four trees.
The commercial block was defined as a community shopping center with five retail shops, each of which was sized at the mean floor area for retail stores, 1,315 m2, surrounded by an asphalt paved parking area. The acquisition cost for commercial property was based on an estimated valuation (based on the national average) of the buildings of approximately $75/ft2 of floor space (Bureau of the Census, 1994). The national average value of inventory for retail establishments (exclusive of automobile dealers and department stores) is $113,000 per store (ibid.).
This value includes some relatively large fms, and may overstate the value of inventory for businesses in a small shopping center. Also, firms such as attorneys' or realtors' offices would carry no stock for sale. The use of retail commercial inventory values to estimate lost inventory costs for public and semi-public buildings may result in overestimates. However, public buildings typically have valuable records. It was implicitly assumed in our estimates that the cost of copying and restoring such records would be comparable to compensation for retail stocks.
Shops and offices also contain some equipment, as well as stock for sale. The national average of the value of nonresidential equipment is 91.5% of the value of nonresidential structures (ibid.). This ratio includes manufacturing firms, and probably overstates the value of commercial equip- ment. On the other hand, medical or dental offices generally have extremely costly equipment. The commercial buildings on which we based our estimates have an area 8.8 times greater than the area of our residential buildings.
We assumed that the value of commercial equipment was 8.8 times greater than the value of the personal property, furnishings, and vehicles assumed for each residence. Because commercial equipment is sometimes of higher quality than residential furnishings, this assumption may understate the value of commercial equipment. We assumed that equipment in the commercial block would be equivalent to "hard finish furnishings" as defined by Tawil and Bold (1990- DRAFT). Compensation for lost inventory and equipment is a major cost factor in some of our scenarios. It should be noted that this important cost element is highly uncertain.
The industrial district was defined as a 214 by 61 meters (700 foot by 200 foot) block containing two concrete block warehouses, each with 30,000 ft2 of floor space. The contents of the warehouses were assumed to be equal to the value of the warehouse itself, $40/ft2 of floor space. The value of $40/ft2 was based on a visual estimate of the quality of warehouse construction, relative to that of retail stores.
The assumed value for the contents could be too low for warehouses containing expensive items such as home appliances. We further assumed that equipment in the warehouse would be of negligible value. If the industrial block is largely devoted to manufacturing, the value of the contents could be higher than our estimate. In 1992 the capital value of equipment for manu-
F-12
facturing was 334% of the capital value of structures (Bureau of the Census, 1994). However, it is possible that attempts would be made to clean costly manufacturing equipment, and the cost of cleaning could be comparable to the assumed value of warehouse contents.
The volume of warehouse contents could be a substantial element in the volume for waste disposal. Although warehouse contents are often stacked as much as three meters high, the aisles for forklift operation reduce the average height by about 50%. We assumed an average height of five feet (1.52 meters).
We assumed that public non-recreational land (schools, government offices, fire and police stations, public plazas, etc.) was occupied with buildings of the same nature, and value, as the commercial area. New construction of commercial buildings in 1993 was slightly greater in dollar value than new construction of public and semi-public buildings (Bureau of the Census, 1994).
We assumed that all waste material would be hauled to a central collection site. We assumed that the average distance to the collection site was 3.2 km (2 miles). We made these assumptions because it would be more economical to use a central collection site than to attempt to ship waste to the on-site or off-site disposal area directly from the area being decontaminated.
Table F-2 shows the postulated decontamination operations for lightly contaminated residences. After cleaning each surface, a radiological survey would be performed to monitor the adequacy of cleaning. Additional cleaning might sometimes be found necessary after the survey. In the absence of any information on the amount of additional cleaning needed, we have arbitrarily assumed that 25% of all surfaces would be given additional decontamination. The fraction needing additional work is not a critical factor. After cleaning and survey, waterproof tarpaulins would be laid over exterior surfaces to protect from recontamination by dust raised in operations on neighboring properties. The tarpaulins would be removed after all other decontamination is completed; a fixative would be sprayed and great care would be exercised to prevent spillage and recontamination from the tarpaulins. Interior walls would be painted to repair any damage caused by cleaning; the paint would also deter resuspension of any remaining particles.
Table F-3 shows the decontamination operations for lightly contaminated commercial areas. The only operation considered for stocks and inventory is vacuuming to remove loose dust, after which the stock was assumed to be removed for disposal. Decontamination of light industrial districts was assumed to be similar in cost to that for commercial areas.
The decontamination operations for streets include mechanized vacuum sweeping, scrubbing with detergent, and high pressure water rinsing with firehoses. We assumed that firehoses would be connected directly to hydrants. If there was no water pressure available, there would be addi- tional costs for tanker-pumper trucks. The rinse water was assumed to be collected for disposal by a hazardous waste vacuum truck accompanying the fiehose crews. After a radiological survey, any remaining hot spots (consistently assumed to be 25% of the area, and denoted (25%) in these tables), were assumed to be cleaned by an additional scrub and rinse. We have not
F-13
included the cost of surface removal for areas that could not be cleaned by less drastic methods. Plastic tarpaulins were assumed to be spread to minimize recontamination, except for those streets needed for transport of decontamination equipment.
The decontamination operations for parks and other public recreational spaces were assumed to be similar to those for residential lawns, trees, and planting areas. The decontamination operations considered for unoccupied land were vegetation removal, removal of an average of 10 centimeters of soil, spreading clean soil, and spreading tarpaulins.
F-14

ITEM Roofs and Exterior Walls
Table F-2 Light Decontamination Operations for Residences
Carpets
Linoleum
Concrete floors
Interior walls
Ceilings
Soft surface furnish- ings
Hard surface furnish- ings
Electronic equipment and paper goods
Attic spaces
AJC and heating
, Lawns
Trees
Planting Beds
OPERATIONS Vacuum, scrub with detergent, low pressure water rinse, radiological survey, additional rinse (25%), spread tarpaulins. Spray fixative and remove tarpaulins
Double vacuum, shampoo, radiological survey, additional vacuum (25 %)
Vacuum, scrub and wash, radiological survey, additional scrubbing (25%)
Same as linoleum
Vacuum, detergent wash and rinse, radiological survey, additional detergent wash and rinse (25%), repaint
Vacuum, radiological survey, additional vacuum (25%)
Double vacuum, steam clean, radiological survey, additional vacuum (25%)
Vacuum, wet wipe, radiological survey, additional wet wipe (25 %)
Vacuum, radiological survey, additional vacuum (25%)
Radiological survey, clean up hot spots by hand, remove and replace 25% of the insulation batting
Vacuum and steam clean ducts, replace filters, radiological survey, additional vacuum (25%)
Vacuum, mow, irrigate, remove sod, remove topsoil to a total depth of 10 centimeters, radiological survey, replace topsoil, spread tarpaulins. Spray organic binder and remove tarpaulins, install new turf
Hose down foliage, scrub trunks, rinse, radiological survey, additional cleaning (25%)
Cut back herbaceous plants, remove mulch or topsoil, radiological survey, remove additional topsoil (25%), spread tarpaulins. Spray organic binder, remove tarpaulins, add new topsoil
F-15

ITEM Roofs
Exterior walls
Table F-3 Light Decontamination Operations for Commercial and Industrial Areas
Inventory
Carpets
Linoleum
Concrete floors
Interior walls
Ceilings
Equipment
Electronic equipment and paper products
Parking lots
OPERATIONS Vacuum, remove gravel, detergent wash and rinse, radiological survey, additional wash and rinse (25%), spread tarpaulins. Spray fixative, remove tarpaulins, apply pitch, apply new gravel
Vacuum, detergent scrub and rinse, radiological survey (25%), spread tarpaulins. Spray fixative, remove tarpaulins
Vacuum, remove for disposal
Double vacuum, shampoo, radiological survey, additional vacuum (25%)
Vacuum, scrub and wash, radiological survey, additional scrubbing (25%)
Same as linoleum
Vacuum, detergent wash and rinse, radiological survey, additional wash and rinse (25%), repaint
Vacuum, radiological survey, additional vacuum (25 %)
Same as "hard surface furnishings" for residences
Vacuum, radiological survey, additional vacuum (25%)
Vacuum sweep, detergent scrub and rinse, radiological survey, additional scrub and rinse (25%), spread tarpaulins. Spray fixative and remove tarpaulins
Our scenario for decontamination of moderately contaminated residential and commercial areas (that is, those for which a DF of 5 to 10 would be needed) includes the removal and replacement of roofs, internal flooring materials, and all furnishings, appliances, and personal property, described as follows.
After removing the roofing, carpets, or linoleum, the underlayment would be surveyed, and any spillage of contaminant would be cleaned up. Concrete floors, driveways, and sidewalks would be cleaned as thoroughly as possible, and a strippable coating is assumed to be laid down and removed after hardening. Any remaining hotspots (arbitrarily assumed to be 25% of the area) were assumed to be scarified and resurfaced.
F- 16
Buildings were assumed to be painted inside and out to repair any damage and to deter resuspension of any remaining plutonium particles. The lawns and topsoil would be removed and replaced. All trees and shrubs would be removed, and new trees would be planted. Contaminat- ed insulation batting in attic spaces would be removed and replaced. Heating ducts would be removed and replaced in attic spaces, but not in walls.
It is possible that attempts might be made to clean and return articles of special value, or of great personal significance to the residents. We have not attempted to estimate the cost of cleaning such items. The magnitude is probably small relative to the cost of other operations.
The cost of removal and replacement of personal property, exclusive of motor vehicles, was estimated by Tawil and Bold (1990-DRAFT). Tawil and Bold based their estimates on a larger residence than we used. We corrected their estimate for inflation, and assumed that the value of personal property and furnishings would be directly proportional to the floor area of the residence.
The national average number of motor vehicles per household is 1.3 (Bureau of the Census, 1994). The average age of private motor vehicles has consistently been several years old for the past decade. An older vehicle has very little value, and basing an average compensation on older vehicles would grossly understate the cost. On the other hand, compensation based on average sales price ($20,000 in 1992) is probably too high to use for average compensation. Newspaper advertisements for three- to four-year old mid-sized cars suggested that $9,000 per vehicle ($1 1,700 per household) seems more realistic, and this value was used in our estimates. We have not addressed potential disposal costs for lost vehicles.
The decontamination operations postulated for moderately contaminated streets include thorough cleaning, followed by planing. Planing is a costly operation. Shotblasting might be less expensive than planing. However, the experimental evidence for shotblasting (Warming, 1987) indicates lower effectiveness for shotblasting than for planing (Barbier and Chester, undated). Neither of these experiments directly addresses plutonium contamination, so the evidence is rather equivocal. However, we have opted for planing, rather than shotblasting. We have also assumed that only those areas not adequately cleaned by conventional methods would be planed.
Conservatively, it could be assumed that all streets would require 100% planing; or it could be optimistically assumed that no planing would be required. In the absence of any historical information, we have arbitrarily assumed that 50% of the street area would be planed. Resur- facing might not be required for moderate depths of planing. However, we assumed that all streets would be resurfaced with asphalt, because resurfacing would deter resuspension of any remaining plutonium.
The decontamination of parks and other public recreational lands would be similar to those for residence lawns and landscaping: removal and replacement of turf, topsoil, and trees. The decontamination of unoccupied land would be similar to that for parks. Decontamination of open spaces is similar regardless of the degree of contamination. The depth of soil removed is related
F- 17
Acquisition costs were based on replacement value in current (1995) dollars. The median value of single-family housing was used for residential areas. We used the median rather than the mean, because the mean is biased upward by a relatively small number of very high cost residences. Luxury homes are seldom located in close proximity to interstate highways, railroads, or airports, and we believe that the median more closely represents the type of homes likely to be affected in the event of an accident. We calculated the new cost per square foot of the median house, and assumed that the same cost per square foot would apply to the smaller houses in our generic residential district. Average costs per square foot were used for commercial and industrial buildings, along with average square footage for retail and wholesale f i i s .
Restoration after demolishing the buildings could involve nothing more than bringing in clean soil, grading and leveling; the cost of the simplest restoration would probably not exceed $1 million per km2. We made a more conservative assumption that restoration to parkland or some similar land use would be carried out. We assumed that loam would be trucked to the site, leveled, graded, and hand raked. Grass seed and fertilizer would be spread, trees would be planted, and the area would be irrigated as required. Restoration of these areas is not a major component of the total cost, so that little uncertainty is introduced by a conservative estimate.
F-18
more to the operator’s skill than to the amount of contaminant, and an average of 10 centimeters of soil was assumed to be adequate for most land surfaces. We have assumed a highly skilled operator. The cost of decontamination and the amount of debris for disposal could easily be doubled with a less skillful operator.
We considered off-site disposal for expedited cleanup of urban land. We also present the cost savings, which are substantial, for on-site disposal.
Very heavily contaminated areas (that is, those for which a DF greater than 10 would be required), would be difficult to decontaminate effectively without considerable destruction. The cost of removing and replacing exterior and interior walls, subflooring, attic spaces, as well as all contents, would probably exceed the value of the structure. It would also be impossible to ensure that particles of plutonium had not lodged within the structure, from which they could be dislodged by later housecleaning or remodeling. Complete demolition, although not the only possible strategy, appears to be the most reliable. In the scenario we selected for the most heavily contaminated areas, all structures would be demolished. Streets would be torn up and above ground utilities would be removed. All land surfaces would be scraped to an average depth of 10 centimeters, and clean soil would be returned.
All real, personal, commercial, private and public property was assumed to be acquired by condemnation. We have also assumed all of the acquired property, including streets and utilities, would be compensated at replacement value. It could be alternatively assumed that present value would be utilized for some or all of the compensation, and this would lower costs. We have arbitrarily made the conservative assumption.
After completion of these activities, the land might be sold on the market to offset costs, or transferred to the local government(s), but the impact of any offsets would probably be small, and it has not been included in our estimates.
Streets and utilities might be renovated at a substantial savings in cost in comparison to our estimates. This is so because disposal of the rubble from street destruction is a sizeable element of the total cost. Disposal and compensation costs for streets amount to about $30 millionikm2 for the average mixed-use urban area.
F.6.2 Expedited Decontamination of Highways
If there were snow cover on the highway, it would be advantageous to plow the snow and dispose of it as quickly as possible. We have not included the cost of snow removal. We have not included the cost of traffic barriers. Earth barriers could be built in ditches and culverts to prevent the spread of plutonium by runoff. The cost of barriers would be small; we supposed that the cost would not exceed the cost of building barriers in streets. There would usually be no need to block sewers, so that this cost would be absent for highways. However, water used for cleaning might still have to be removed for disposal.
One of the earliest actions following the determination of the extent of contamination could be construction of a detour around the contaminated area, so that orderly traffic flow could be restored. The cost of a detour, if one is necessary, would depend on the lateral extent of contamination, as well as on the length along the highway. The cost of constructing the detour is given in dollars per meter of detour length so that risk assessors can apply this cost to specific hypothetical accidents.
The decontamination of the highway itself would be similar to that for urban streets. However, we have assumed that very heavily contaminated sections would not be permanently removed from service, in order that the highway could eventually be returned to full usage. Our cost estimates are for planing and resurfacing the most heavily contaminated areas. The cost estimates are given in dollars per m2 of lightly, moderately, and heavily contaminated highway surface. If bridges, overpasses, or interchanges were heavily contaminated, the cost could be significantly higher.
Decontamination of shoulders, ditches, and land adjacent to the highway would be similar to the decontamination of urban unoccupied spaces. Vegetation and soil would be removed, and clean soil would be returned and revegetated. The cost of cleanup and remediation of adjacent land depends on its usage. The cost would be higher for adjacent farmland, forest, or urban areas than for arid wasteland. The cost could be exceedingly high if the contaminated section of highway were in treacherous terrain, for example, in a mountain pass. Risk assessments of the cost for specific hypothetical accidents should consider the characteristics of the surrounding land, and availability of alternative transportation routes.
F-19

F.6.3 Strategies For Extended Remediation under CERCLA
In the following subsections we analyze strategies that might be employed for the extended remediation under CERCLA of mixed-use urban land (Section F.6.3. l), Midwest farmland (Section F.6.3.2), deserts, semi-arid grasslands and rangelands (Section F.6.3.3), and forests (Section F.6.3.4).
F.6.3.1 Mixed-Use Urban Land
As discussed in Appendix E, decontamination of urban property after a lapse of several years would probably be only marginally effective and the property would have deteriorated badly. The strategy we analyzed is complete destruction and disposal of all structures, removal of soil to an average depth of 10 centimeters, disposal of debris either on-site or off-site, and restoration of the area to a useful condition.
The strategy we analyzed for the remediation of residential, commercial, and industrial areas and streets under CERCLA is virtually identical to that used for expedited decontamination of heavily contaminated urban areas. The only difference is that access control would probably be continued for a longer time, but that makes only a minor increase in cost. It is possible that compensation for lost income could be continued for a longer time than we have assumed, but we are unwilling to speculate on a bounding estimate of such a period.
F.6.3.2 Midwest Farmland
Farmland remediated under CERCLA could be acquired by condemnation, or could be decontaminated and remediated and returned to the prior owners with compensation for damages to the property. We chose to analyze condemnation, because of the difficulty of quantifying possible losses due to property damage.
The value of total farm assets (land, buildings, machinery, livestock, crops in fields, and personal possessions) for Illinois, Indiana, Iowa, Kansas and Nebraska was divided by total rural area of those states to give an average value for farmland.
Typical Midwest farmland also contains small towns. We counted small towns (2500 inhabitants or less) in Illinois and Iowa on a 1994 road atlas (Rand-McNally, 1994), and divided the number by the rural area of those States to find the average number of towns per km2. The average population of the small towns was approximately 1500. A dimensionless "Village Factor" was defined as (Villages per km2) x (Population per village) + (Urban population per km2). The "Village Factor" times the urban acquisition, decontamination, and disposal costs was added to the corresponding farm costs to account for the acquisition and decontamination of property in small towns in farm areas.
Decontamination of rangeland and farmland is relatively simple. All farm or ranch buildings were assumed to be demolished, but over most of the area, scraping, loading, and transporting
F-20

the soil would be sufficient. Any residual contamination after a final pass with a motor grader could be removed by hand shoveling and bagging for nearly total decontamination (Straume et al., 1978).
Restoration of farmland is very straightforward. All that is necessary is to return cleaned soil and bring in additional loam to return the soil to its original level. Planting might not be necessary, but in areas of high erosion, annual grasses could be used as a green mulch. Our cost estimates include restoration to tall-grass prairie. No credit was taken for possible resale of the restored land. If the land were resold as new farmland, the total net costs would only be a few hundred thousand dollars per k m 2 lower.
Both on-site and off-site waste disposal costs were estimated, at the same cost per m3 as for mixed-use urban land.
F.6.3.3 Deserts, Semi-Arid Grasslands, and Rangelands
The restoration of deserts, semi-arid grasslands, and rangelands under CERCLA was analyzed.
True deserts make up only 0.4% of the U.S. land surface. Prairies, many of which are semi-arid, are by far the largest biome, making up 49.8% of the land surface.
All of the decontamination methods considered would have a destructive impact on desert ecosystems. In true deserts, those receiving less than 250 millimeters annual rainfall, unassisted recovery is slow to nonexistent. Deserts are delicate ecosystems and may never recover from the shock of insult without help. However, assisted reintroduction of plants, along with protection from browsing animals and supplemental moisture, can make restoration of the desert ecosystem quite practical. Wallace and Romney (1974) reported on several successful attempts to restore desert flora in Nevada. Small burrowing mammals do not return (Shinn et al., 1989a), at least within the first two years, and would need to be reintroduced after mature flora had been established.
Semi-arid grasslands (the high desert characterized by Sagebrush and Indian Rice Grass) that have at least 250 millimeters of rain annually can revegetate without assistance. The process can be accelerated if mulch, seed, and supplemental moisture are provided,
According to EPA (1978), true tall-grass prairies can recover promptly if scraping is only 5- centimeters deep, even without soil replacement. Deeper scraping removes all the topsoil and vital organic material, and large areas can recover only slowly. Replacement of the topsoil and reseeding with a mix of temporary and climax species can bring the system back in a few seasons. The results of 10 centimeters scraping would be catastrophic for short-grass prairies without replacement of the topsoil, reseeding, and irrigation. The cost of hauling, dumping and spreading the clean topsoil, plus soil amendments and seeding was estimated to be approximately five times the original cost of decontamination.
F-2 1

An optimal situation for cleanup might be marginal rangeland that was already Fedc There would be minimal acquisition cost. Decontamination and restoration woul than in inhabited areas. Also, though it was not factored into the cost estimates, method of on-site disposal than was assumed for urban and farm areas might be 1
minimum on-site waste disposal cost for rangeland is estimated to be about 20 IT per km2. The average population density of rangeland is no more than one persoi
Unless there were valuable mineral resources for which compensation needed to b disposal would be the only important cost component for an accident that rangeland. The presence of mineral or petroleum resources on the land would incr minimizing prospects for on-site disposal.
The cost for restoring desert land would be slightly greater than for farmland bc difficulties in restoring a desert ecosystem, but waste disposal would probabl dominant contributor, even if on-site disposal was utilized.
In New Mexico, Utah, Arizona, and Nevada, the average farmland value was $85,60O/kmz and the average population density outside of cities was founc persons/km2 (Bureau of the Census, 1994).
We estimated the cost of decontaminating uninhabited rangeland by modifying thc for farmland, eliminating villages, and using the average value of privately-owned the arid Western states for acquisition cost. The cost of repeated irrigation nece5 arid climate partially offsets the lower cost of acquisition and absence of Restoration to short-grass prairie was assumed.
F.6.3.4 Forests
Remediation of forests under CERCLA could be difficult or impractical.
Deciduous forests cover 28.9% of US . land area, and coniferous forests cover prairies, forests comprise the second most extensive component of U.S. land area,
Decontamination of forests, as explained in Appendix E, is virtually unfeasibl practical method we have been able to find is to completely remove the forest. C at decontamination would be extremely costly as well as ineffective. The strategy is for felling and chipping all trees and removing understory brush and stumps. Th tree, brush and stump removal would be hauled to a collection site for disposa removal, the soil would be scraped by bulldozers.
Disposal would be a problem and a major cost factor. There would be an large vol in addition to the soil; we calculated that the volume for disposal would be approx as great as for farmland. We analyzed costs for both on-site and off-site disposal
F-22

Restoration of forest communities is much more complex than deserts and prairies. Not only is there a greater richness of species in forest communities, but there are many types of forests.
EPA (1978) states that the determining factor in natural revegetation is proximity to a seed source. Even barren mine spoils have naturally revegetated if the area was small enough. Areas of several square kilometers might be too large. Artificial reseeding could be resorted to, but it would be difficult to get a proper species mix. For example, some understory species only grow in the shade of mature trees. Forests might not completely regenerate for a century or more, even with assistance . Forest land affected by an accident could possibly be restored to a different but still valued use; for example, farmland or parkland. However, decisions on future land use are highly uncertain and speculative. We have assumed restoration to parkland. This assumption has been made only to support a f i t -order cost estimate; we do not suggest that such a restoration objective is likely, or even desirable.
F.7 Waste Disposal
Two options were evaluated for waste disposal, on-site and off-site. On-site disposal would always be less expensive because of savings in transportation costs. However, many locales prohibit disposal of LLW, and public acceptance is given great weight in the CERCLA decision process. Costs were estimated for the two options.
The present estimates are based on the assumption that all material removed, whatever its contamination level, would be disposed of as radioactive waste. The reason for this assumption, which may be conservative, is that we were not able to estimate what fraction might be free of contamination. I t is also possible that the cost of monitoring and segregating waste would cost as much as disposing of all waste as if it were contaminated. Waste disposal is a major cost element, and our conservative assumption is a possibly important source of uncertainty.
We included water used for cleaning as waste to be disposed of. The level of contamination in the water might be so low that disposal as radioactive waste would be unnecessary. The fraction of water in the total waste is only about 5%. Contaminated water might be mixed with waste soil and rubble, so there would probably be little or no additional volume to be disposed of.
F.7.1 On-Site Disposal
For on-site disposal we postulated many precautions taken to minimize the possibility of intrusion or leakage, based on the public’s aversion to plutonium. We designed a disposal site incorporating those precautions. The cost would be higher than some other estimates (for example, Smith and Lambert, 1978; or Dickman, 1982), but we believe that this design for on- site disposal would have a greater probability of acceptance than would simpler designs. The unit cost would be approximately double the median cost of current estimates, and slightly higher than the upper bound estimate, for disposal systems that meet minimum current requirements.
F-23
We designed a disposal site in which waste would be containerized, cement stabilized, and emplaced in reinforced-concrete lined trenches. The waste would be 5-meters deep and would be covered with an overburden of 5 meters of cemented broken rock as recommended by Kennedy (1984). A 0.61-meter thick concrete cap would cover the trench area, with 2.5 meters of overlap on each side (Levin, 1984).
Our cost estimate for on-site disposal, $318/m3, was obtained by creating a conceptual design, and then using McMahon (1987) to estimate the total disposal costs. Those calculations were quite detailed, and included surveying, placement and removal of forms for laying concrete, tying steel reinforcement, and mixing backfill with cement powder and compaction. The three major components of the waste disposal cost were (1) emplacing waste (26% of total), (2) installing overburden (23% of total), and (3) constructing concrete walls, floor, and cap (42% of total).
In our judgement, on-site disposal costs would be only about one-half of our estimates in a well- sited land burial facility complying with the minimum requirements of 10 CFR 61.
The cost of formal design and permitting was not considered. The engineering and environmen- tal studies, and legal expenses to obtain a permit for the site could be quite costly if the process required substantial time or if there were controversy.
F.7.2 Off-Site Disposal
We assumed that the waste would be shipped by truck in commercially-available steel containers, because such shipments could be made to any present or prospective site. The containers would actually hold 16 m3, but because of weight restrictions for highway shipment, would have to be shipped less than completely full for most shipments. The cost of the containers is $7000 each (Melloy, 1994). Each container could be used for 50 round trips. Waste could be shipped 1609 km (1000 miles) at a cost of $3.50 per mile (Gibson, 1994). A complete round trip is not necessary, because four empty containers could be returned on a single truck. Some savings below the cost of $3.50 per mile might be achieved with efficient scheduling.
According to Stevens (1994) the current emplacement cost for low specific activity transuranic waste at NTS was $353/m3 ($lO/f?), but acceptance of waste from outside of NTS was temporarily suspended (in July 1994) because of a lawsuit brought under NEPA. The NTS disposal area lacks rail access and waste must be transported there by truck. The emplacement cost for LSA transuranic waste at Hanford is approximately three times the fee charged by NTS, $1059/m3 ($30/ft3); it is accepting DOE waste as of this writing, and there is rail access to the Hanford disposal areas that can lower transportation costs relative to truck transport.
Although it is DOE policy (DOE, 1988a) that waste material generated in the course of its operations be disposed of in DOE facilities, waivers can be obtained to dispose of DOE waste at commercial disposal sites (Stevens, 1994). Exemptions are being issued by the DOE to place low level waste with Envirocare of Utah, near Salt Lake City, UT. As reported in Appendix A,
F-24

the fee charged for disposal of EPA waste from the Montclair-East Orange radium soil site was $288/m3 ($220/CY). That value was utilized in our cost estimation.
Mr. Kent Parker of Envirocare stated (1994) that their facility in Utah could handle in excess of a million cubic meters of waste material. The assay limit for the alpha-emitting transuranics in weapons grade plutonium in a single shipment is 9.9 nCi/g. He speculated that the fee charged for a million cubic meters might be 20% less than the fee being charged for the 76,000 m3 of waste from the NJ radium soil site.
We estimated a total cost for off-site disposal of $666/m3. Transportation cost, including loading, unloading, and tie-downs, accounts for slightly over half of the total. We believe this to be a realistic estimate for off-site disposal. We also made a pessimistic estimate, with shipment in 55-gallon drums and retrievable emplacement at a cost 20% higher than for disposal at NTS. The pessimistic estimate, including transportation, was nearly $2,000/m3.
F.7.3 Volume Reduction
TMA-Eberline, Inc. has designed and produced a machine, the "segmented Gate" system, for waste sorting that is now being used at Johnston Island (Moroney, et al., 1993). Johnson (1994) stated that the cost of processing would be about $60-70 per cubic yard ($78-92/m3). A 5040% volume reduction is possible for most soils. We did not consider volume reduction in our analysis because there would be little cost savings for waste containing building rubble, which would probably have to be ground up, and because of the modest volume reduction achievable with current technology. However, even at existing technology levels, the Segmented Gate System or similar commercially available technology might be worth considering for farmland or rangeland decontamination, because waste disposal is a major cost element.
F.8 Cost Estimate Results
Cost estimates are presented on Area-Related and Per-Capita bases in Sections F.8.1 and F.8.2. Section F.8.1 presents costs estimates for expedited remediation; Section F.8.2 presents costs estimates for extended remediation under CERCLA.
The method used to derive Area-Related costs was described in Sections F.2, F.3, F.4, and F.6; the method used to derive Per-Capita costs was described in Section F.5.
F.8.1 Expedited Remediation
The area-related andper-capita costs for expedited remediation of lightly contaminated mixed-use urban areas are shown in Table F-4. These costs have been calculated for off-site waste disposal.
F-25

Table F-4 Expedited Remediation of Lightly Contaminated Mixed-Use Urban Areas
( $ million / km')
Area-Related Major Per-Capita Usaqe T y p e cost Component cost Total
S75.2 Residential $72.4 DisDosal $2.8 Connnercial si95.3 Decontamination $ 0 . o Industrial $674.0 Disposal $0.0 Streets $15.9 Disposal $0.0 Unoccupied $81.1 Disposal $0.0 Combined $124.6 DiSpOSal $2.8
si95.3 $674.0 $15.9 $81.1 $127.4
Fencing costs of $76 per meter of perimeter should be added to the above costs.
Table F-5 shows costs for the expedited decontamination of moderately contaminated urban areas.
Table F-5 Expedited Remediation of Moderately Contaminated Mixed-Use Urban Areas
($ million / k m a )
Area-Related Major Per-Capita Usaqe T y p e cost Component cost Total Residential $163.9 Decontamination $3.5 $167.3 Commercial $295.5 Decontamination $0.0 $295.5 Industrial $704.2 Disposal $0.0 $704.2 Streets $18.5 Disposal $0.0 $18.5 Unoccupied $85.7 Disposal $0.0 $85.7 Combined $174.5 Disposal $3.5 $178.0
As before, fencing costs of $76 per meter of perimeter should be added to these costs.
Table F-6 shows costs for the expedited remediation of heavily contaminated urban areas.
Table F-6 Expedited Remediation of Heavily Contaminated Mixed-Use Urban Areas
( $ million / k m 2 )
Area-Related Major Per-Capita Usaqe Typ e cost Component cost Total Residential $301.2 Compensation $4.8 $306.0 Commnercial $851.2 Compensat ion $0.0 Industrial $1,245.9 Disposal $0.0 Streets $247.7 Disposal $0.0 Unoccupied $95.2 Disposal $0.0 Combined $391 -4 Compensation $4.8
$851.2 $1,245.9 $247.7 $95.2 $396.2
As before, fencing costs of $76 per meter of perimeter should be added to these costs.
If the streets and utilities were decontaminated and left in place, there would be a saving of $33.2 million per km2. If, in addition, no restoration was carried out except for replacing and grading topsoil, there would be a cost saving of $34.7 million per km2.
F-26

Figure F-1 is a graphical representation of the components of our estimated area-related cost for the combined urban land-use area. Other costs (including site characterization and certification, access control, emergency actions, and site restoration) are insignificant contributors for light and moderate contamination areas, and barely noticeable for heavy contamination areas.
This figure clearly shows that for the expedited remediation scenario, compensation and disposal costs are the most important factors in the very large increase in cost between moderate and heavy contamination areas. This is because we expect that decontamination costs would be lower for heavily contaminated areas than for moderately contaminated areas, since demolition was estimated to be less expensive than thorough cleaning.If a highly protective on-site waste disposal system were utilized, disposal costs would be reduced by $39.1 million for light contamination, $42.3 million for moderate contamination, and $89.3 million for heavy contamination. The savings would be approximately twice as great for a less protective disposal system that just met current requirements.
Compensation in Tables F-4 and F-5 refers to compensation to private and business property owners for damage to or disposal of property, and to business firms for lost income. Compensation in Table F-6 also includes the cost of acquisition of property. Compensation is one of the major determinants of total cost. The amount of compensation depends on a multitude of unpredictable economic, political, and social factors. This is a source of uncertainty that could be explored; the extent can be estimated, but the uncertainty cannot be removed.
The cost of decontaminating lightly to moderately contaminated highways or airport runways would be similar to the cost of decontaminating streets; $16 per m2 of road surface for lightly contaminated roads, and $18 per m2 for moderately contaminated roads. The cost could be reduced by about $6 per m2 for both light and moderate contamination if a highly protective on- site disposal system were utilized. The cost for decontaminating shoulders, ditches, and adjacent areas (on level land) would be similar to costs for farmland or rangeland; about $74 per m2, with off-site disposal.
Heavily contaminated highways could be demolished and rebuilt. However, it would be more economical to attempt decontamination. 100% planing and resurfacing might be adequate; this would only increase the cost to about $22 per m2. With highly intensive decontamination-100% planing in two passes, followed by an additional washing pass-the cost would be $58 per m2. The cost of decontaminating adjacent heavily contaminated adjoining land would be little higher than for moderately contaminated land.
The cost of decontaminating adjacent land could be reduced by $35 per m2 for both light and moderate contamination, if a highly protective on-site disposal system were utilized. The cost of decontaminating adjacent land could greatly exceed the cost of decontaminating the highway surface.
The cost of constructing a detour around the contaminated area is estimated to be $235 per meter of detour length for a light duty, 15-meter wide roadway, assuming level land, and that no
F-27
culverts or bridges would be required. The estimate is thus optimistic; the cost for the detour could easily be double or triple this amount. The cost would also be higher for a heavy duty roadway. Fencing costs of $76 per meter should also be added to the cost of decontamination.
The cost of expedited decontamination of farmland and rangeland was not specifically addressed in our research. However, a reasonable estimate can be made by subtracting the acquisition cost from the estimated cost for extended remediation of farmland and rangeland. If this is done, heavily contaminated farmland would cost approximately $38 million per km2 and rangeland would cost approximately $37 million per km2. These estimates assume on-site disposal.
As previously explained, the cost would not differ greatly for moderate or light as opposed to heavy contamination, because the depth of soil to be removed depends more on the equipment used and the skill of the operator than on the degree of contamination. However, if the terrain, or the depth of migration of plutonium were such that scraping was difficult, or more than an average of 10 centimeters of soil needed to be removed, the cost could be significantly higher, If more than 10 centimeters average depth of soil had to be removed, the cost would be $3.3 million/km2 per centimeter of additional depth for on-site waste disposal, and $6.8 millionkrn2 per centimeter for off-site waste disposal.
F.8.2 Extended Remediation under CERCLA
The history of CERCLA cleanups suggests that the process could be extremely time consuming. There is virtually no history that is directly applicable (see Appendix A); and the available experience may not be very applicable to a larger area of dispersal, especially if residences were contaminated. The public aversion to plutonium could lead to conflicting tendencies. The possibility of many challenges to any plan could tend to lengthen the process, and pressures to decontaminate the site as rapidly as possible could tend to shorten the process. We have arbitrarily selected a time of five years to complete remediation. The total cost is not strongly dependent on the time duration.
Fixed costs for the Remedial InvestigatiordFeasibility Study (RI/FS) and the Remedial Design (RD) should be added to the total costs for each site. According to EPA (1 995a) the average cost for the RI/FS is $1.35 million, and for the RD the cost is $1.26 million.
F.8.2.1 Rangeland and Farmland
The method of calculating the cost of acquisition of farmland and rangeland was described in Sections F.6.3.2 (for farmland) and F.6.3.3 (for rangeland) of this appendix.
Site characterization and certification costs are assumed to be the low average for both farmland and rangeland. Emergency actions are assumed to be limited to crop removal (for farmland only), windrowing with water spraying to hold down dust, and repeated water spraying as a fixative. Cost estimates are based on level land without woods or heavy brush. If farms and ranches included areas of woodland or heavy brush, the cost of early actions could be
F-28
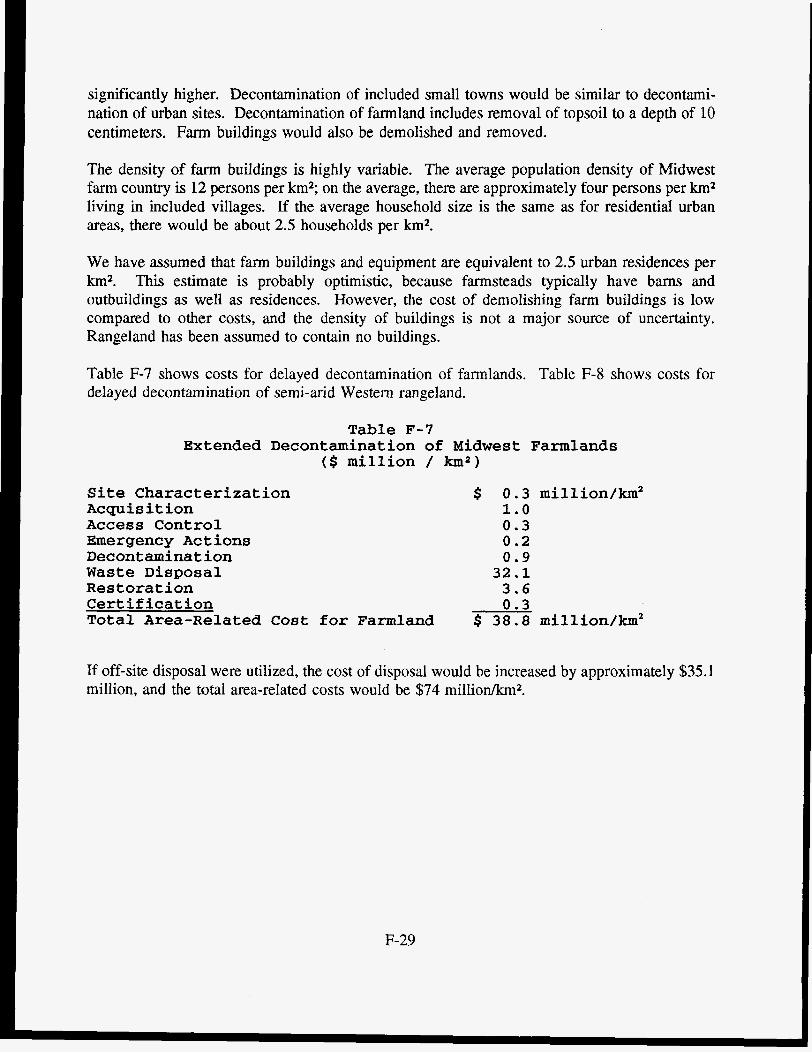
significantly higher. Decontamination of included small towns would be similar to decontami- nation of urban sites. Decontamination of farmland includes removal of topsoil to a depth of 10 centimeters. Farm buildings would also be demolished and removed.
The density of farm buildings is highly variable. The average population density of Midwest farm country is 12 persons per km2; on the average, there are approximately four persons per km2 living in included villages. If the average household size is the same as for residential urban areas, there would be about 2.5 households per km2.
We have assumed that farm buildings and equipment are equivalent to 2.5 urban residences per km2. This estimate is probably optimistic, because farmsteads typically have barns and outbuildings as well as residences. However, the cost of demolishing farm buildings is low compared to other costs, and the density of buildings is not a major source of uncertainty. Rangeland has been assumed to contain no buildings.
Table F-7 shows costs for delayed decontamination of farmlands. Table F-8 shows costs for delayed decontamination of semi-arid Western rangeland.
Table F-7 Extended Decontamination of Midwest Farmlands
( $ million / - 2 )
Site Characterization Acgui s it ion Access Control Emergency Actions Decontamination Waste Disposal Restoration Certification Total Area-Related Cost for Farmland
$ 0.3 million/km* 1.0 0.3 0.2 0 . 9
32.1 3.6 0.3
$ 38.8 million/km2
If off-site disposal were utilized, the cost of disposal would be increased by approximately $35.1 million, and the total area-related costs would be $74 million/km2.
F-29
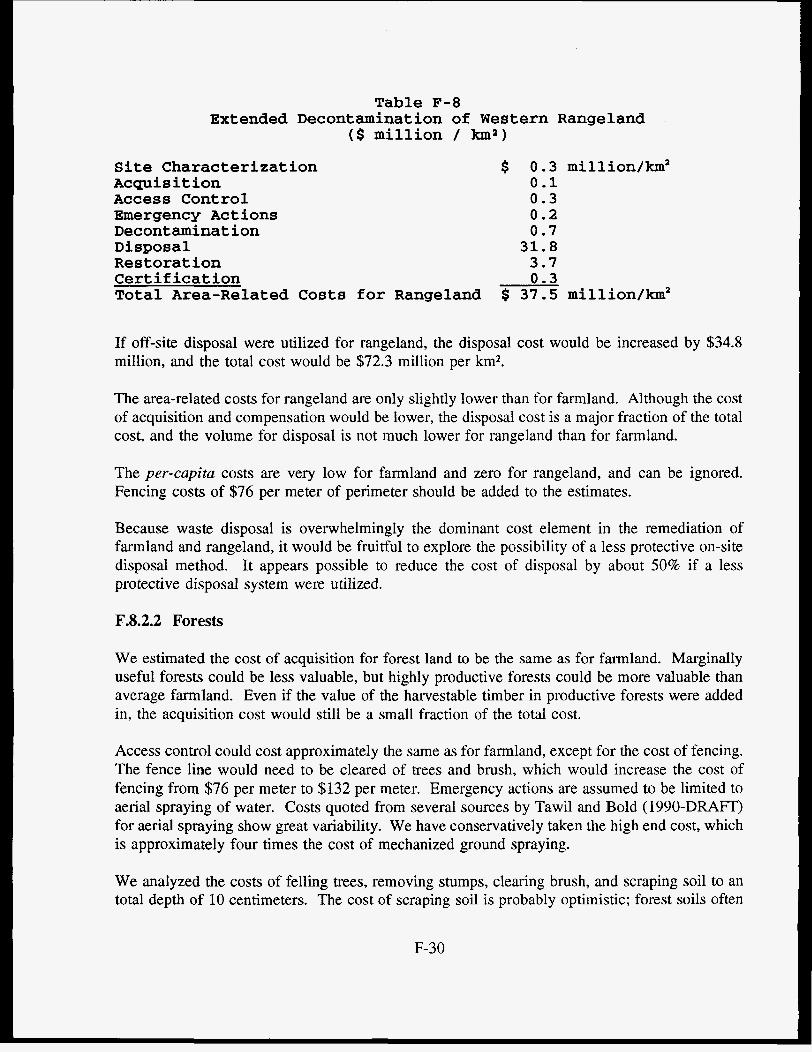
Table P-8 Extended Decontamination of Western Rangeland
( $ million / k m 2 )
Site Characterization Acquisition Access Control Emergency Actions Decont amina t ion Di sgosal Restoration
$ 0.3 million/km2 0.1 0.3 0.2 0.7
3.7 31.8
Certification 0.3 Total Area-Related Costs for Rangeland $ 37.5 million/km2
If off-site disposal were utilized for rangeland, the disposal cost would be increased by $34.8 million, and the total cost would be $72.3 million per km2.
The area-related costs for rangeland are only slightly lower than for farmland. Although the cost of acquisition and compensation would be lower, the disposal cost is a major fraction of the total cost, and the volume for disposal is not much lower for rangeland than for farmland.
The per-capita costs are very low for farmland and zero for rangeland, and can be ignored. Fencing costs of $76 per meter of perimeter should be added to the estimates.
Because waste disposal is overwhelmingly the dominant cost element in the remediation of farmland and rangeland, it would be fruitful to explore the possibility of a less protective on-site disposal method. It appears possible to reduce the cost of disposal by about 50% if a less protective disposal system were utilized.
F.8.2.2 Forests
We estimated the cost of acquisition for forest land to be the same as for farmland. Marginally useful forests could be less valuable, but highly productive forests could be more valuable than average farmland. Even if the value of the harvestable timber in productive forests were added in, the acquisition cost would still be a small fraction of the total cost.
Access control could cost approximately the same as for farmland, except for the cost of fencing. The fence line would need to be cleared of trees and brush, which would increase the cost of fencing from $76 per meter to $132 per meter. Emergency actions are assumed to be limited to aerial spraying of water. Costs quoted from several sources by Tawil and Bold (1990-DRAFT) for aerial spraying show great variability. We have conservatively taken the high end cost, which is approximately four times the cost of mechanized ground spraying.
We analyzed the costs of felling trees, removing stumps, clearing brush, and scraping soil to an total depth of 10 centimeters. The cost of scraping soil is probably optimistic; forest soils often
F-30
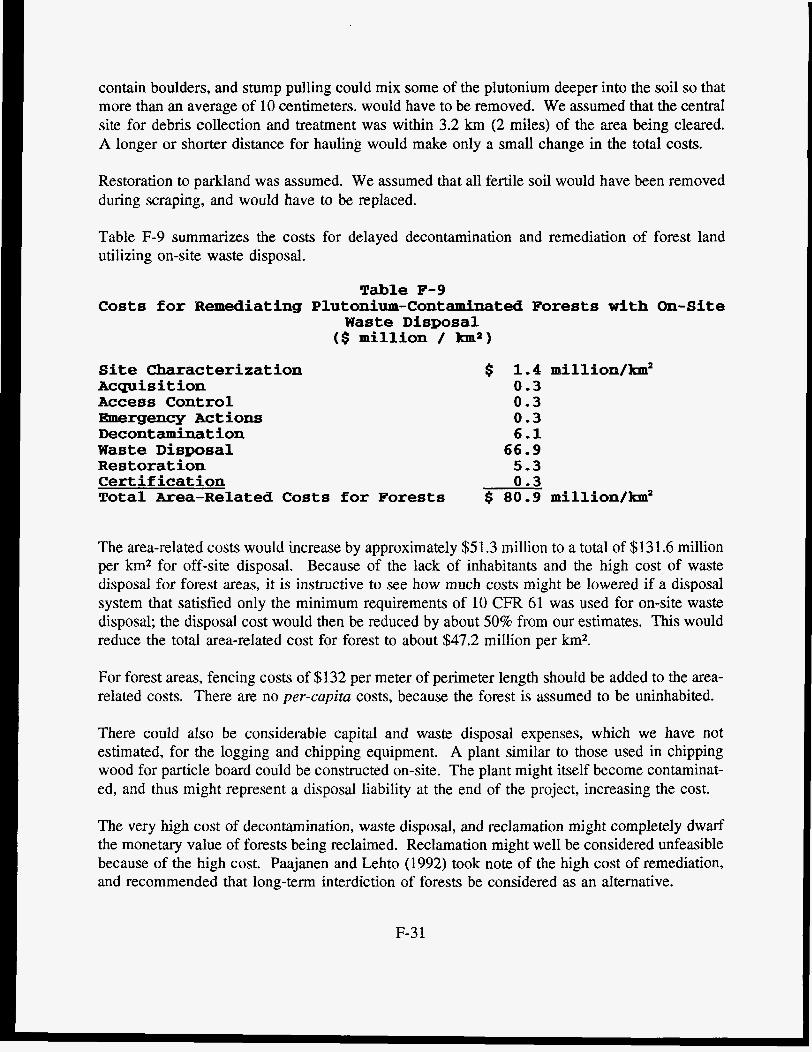
contain boulders, and stump pulling could mix some of the plutonium deeper into the soil so that more than an average of 10 centimeters. would have to be removed. We assumed that the central site for debris collection and treatment was within 3.2 km (2 miles) of the area being cleared. A longer or shorter distance for hauling would make only a small change in the total costs.
Restoration to parkland was assumed. We assumed that all fertile soil would have been removed during scraping, and would have to be replaced.
Table F-9 summarizes the costs for delayed decontamination and remediation of forest land utilizing on-site waste disposal.
Table P-9 Costs for Remediating Plutonium-Contaminated Forests with --Site
Waste Disposal ($ million / h a )
Site Characterization Acquisition Access Control Emergency Actions Decontamination Waste Disposal Restoration Certification Total Area-Related Costs for Forests
$ 1.4 million/km2 0.3 0.3 0.3 6.1 66.9 5.3 0.3
$ 80.9 million/h2
The area-related costs would increase by approximately $51.3 million to a total of $13 1.6 million per km2 for off-site disposal. Because of the lack of inhabitants and the high cost of waste disposal for forest areas, it is instructive to see how much costs might be lowered if a disposal system that satisfied only the minimum requirements of 10 CFR 61 was used for on-site waste disposal; the disposal cost would then be reduced by about 50% from our estimates. This would reduce the total area-related cost for forest to about $47.2 million per km2.
For forest areas, fencing costs of $132 per meter of perimeter length should be added to the area- related costs. There are no per-capita costs, because the forest is assumed to be uninhabited.
There could also be considerable capital and waste disposal expenses, which we have not estimated, for the logging and chipping equipment. A plant similar to those used in chipping wood for particle board could be constructed on-site. The plant might itself become contaminat- ed, and thus might represent a disposal liability at the end of the project, increasing the cost.
The very high cost of decontamination, waste disposal, and reclamation might completely dwarf the monetary value of forests being reclaimed. Reclamation might well be considered unfeasible because of the high cost. Paajanen and Lehto (1992) took note of the high cost of remediation, and recommended that long-term interdiction of forests be considered as an alternative.
F-3 1

F.8.2.3 Mixed-Use Urban Areas
The remediation of mixed-use urban areas under CERCLA was found not materially different from the expedited decontamination of heavily contaminated areas as shown in Table F-6. The cost of access control increases by about one million dollars per km2, because we assumed a longer total elapsed time of five years under CERCLA. The per-capita costs would be somewhat higher than our estimates if the acquisition of property was not achieved within one year. However, the per-capita costs are small compared with other costs.
Acquisition, compensation, and emergency action costs for a mixed-use urban area are estimated to be approximately $176 million per km2. Access control costs would be approximately $248,000 per km2 per year. Annual respraying of fixative would cost an additional $287,000 per km2 per year. Acquisition and long-term access control of such areas, in conjunction with fixative spraying and periodic monitoring, is a possible alternative to remediation that would lower costs in comparison to our estimates.
F.9 Construction Cost Indexes and Inflators
The data sources we used all gave costs in various prior year dollars. Inflation would cause these estimates to be optimistic for today’s economy. There is no certain method for translating costs from year to year, and inflation rates for a given year can vary widely across industries and product categories.
Price indexes are given in Bureau of the Census (1994) for many distinct fields. The Bureau of Reclamation Construction Cost Index (ibid.: Table 1194) is the most relevant index for heavy site construction work. We also used specific indexes for furniture and personal effects, housing rental, and home construction, wherever appropriate. We used the Consumer Price Index (CPI) for those cases for which a specific index was not applicable.
It was our intent that all of cost estimates derived in the present research be given in 1995 dollars. However, cost indexes were not available to us for 1995. We found that linear regression on past years gave an excellent predictor for every year (r2>0.97). We extrapolated the regression line for each index to 1995 to derive an inflator for previous years. The inflator for translating an estimate from year x to year y is (Index-for-year-y) / (Index-for-year-x); it is independent of the base year. Any uncertainty or error introduced by use of the regression line or by extrapolation is judged to be minimal compared to the much greater uncertainties inherent in our cost overall estimates.
F-32

krn v) 0 0
400
300
200
I00
0
r LIGHT
n MODERATE HEAVY
CONTAMINATION LEVEL
HOTHER COSTS llIODECONTAMINATION
BCOMPENSATION UDISPOSAL
Figure F-1 Estimated Area-Related Costs for a Postulated Mixed-Use Urban Area
F-33

Intentionally Left Blank
F-34
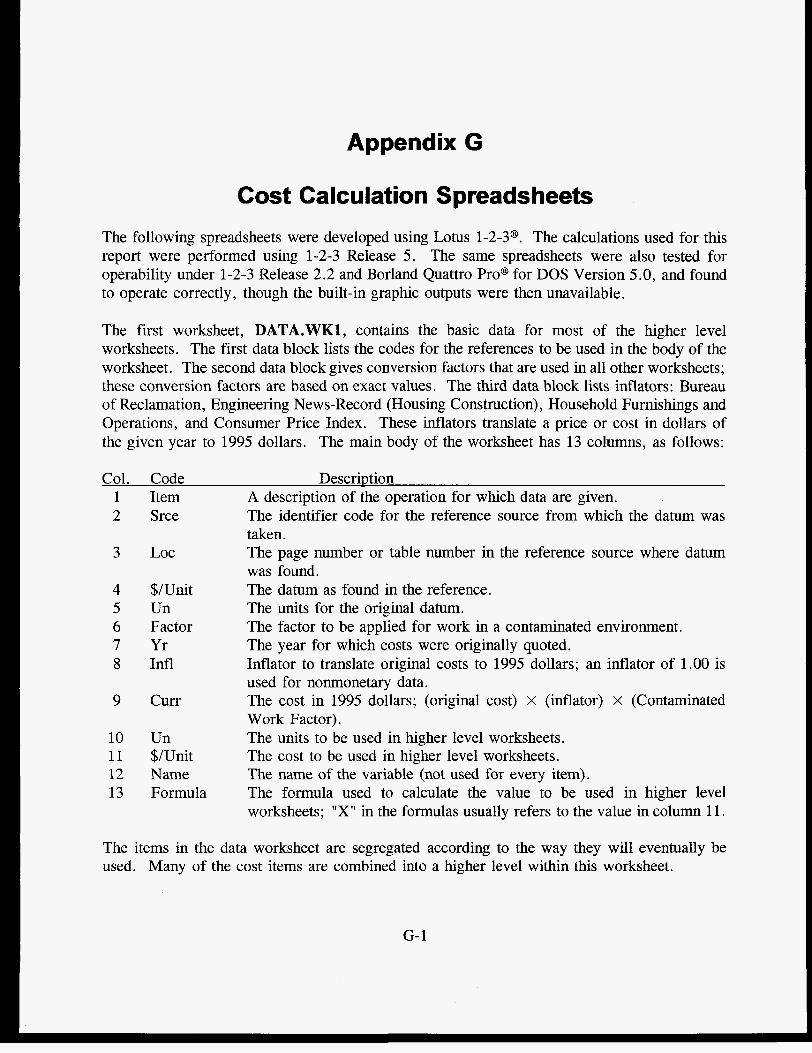
Appendix G
Cost Calculation Spreadsheets The following spreadsheets were developed using Lotus 1-2-3@. The calculations used for this report were performed using 1-2-3 Release 5. The same spreadsheets were also tested for operability under 1-2-3 Release 2.2 and Borland Quattro Pro@ for DOS Version 5.0, and found to operate correctly, though the built-in graphic outputs were then unavailable.
The first worksheet, DATA.WK1, contains the basic data for most of the higher level worksheets. The first data block lists the codes for the references to be used in the body of the worksheet. The second data block gives conversion factors that are used in all other worksheets; these conversion factors are based on exact values. The third data block lists inflators: Bureau of Reclamation, Engineering News-Record (Housing Construction), Household Furnishings and Operations, and Consumer Price Index. These inflators translate a price or cost in dollars of the given year to 1995 dollars. The main body of the worksheet has 13 columns, as follows:
Col. Code Description 1 2
3
4 5 6 7 8
9
10 11 12 13
Item Srce
LOC
$/Unit Un Factor Yr Infl
cum
Un $/Unit Name Formula
A description of the operation for which data are given. The identifier code for the reference source from which the datum was taken. The page number or table number in the reference source where datum was found. The datum as found in the reference. The units for the original datum. The factor to be applied for work in a contaminated environment. The year for which costs were originally quoted. Inflator to translate original costs to 1995 dollars; an inflator of 1.00 is used for nonmonetary data. The cost in 1995 dollars; (original cost) X (inflator) X (Contaminated Work Factor). The units to be used in higher level worksheets. The cost to be used in higher level worksheets. The name of the variable (not used for every item). The formula used to calculate the value to be used in higher level worksheets; "X" in the formulas usually refers to the value in column 11.
The items in the data worksheet are segregated according to the way they will eventually be used. Many of the cost items are combined into a higher level within this worksheet.
G- 1
The next higher level worksheets, URBLIT, URBMOD, and URBHVY calculate expedited decontamination costs for light, moderate, and heavy contamination of an urban setting. The provenance of each datum used is given in these worksheets. RANGEON, FARMON and FOREST give costs for extended remediation under CERCLA with on-site waste disposal for rangeland, farmland, and forest. ONSITE and OFFSITE calculate unit disposal costs, which are used in the preceding higher level worksheets. CITIES calculates the average population density of all cities with populations of 100,000 or more; 180 cities are included. FARMVAL calculates the average value of Midwest farmland and Western rangeland. CCI calculates the cost inflators used in the second data block of worksheet DATA.
G-2

WORKSHEET "DATA. WK1" BASIC DATA TO BE USED I N OTHER WORKSHEETS . . . . . . . . . . . . . . . . . . . . . . DATA BLOCK 1: REFERENCES: Barbier & Chester a Bureau o f Census, 1994 b Dept. o f Energy, 1995 c McMahon (1988) d Means (1994b) e Smith & Lambert (1978) f Tawil e t a l . (1985) g Tawil&Bold (1990-DRAFT) h Personal Observation i
DATA BLOCK 2: CONVERSION FACTORS Factor Name Meters t o Feet (Exact Value 0.3048 M FT Feet t o Meters 3.28084 FT M Sq F t t o Sq M 10.7639 SF-SM Sq Yd t o Sq M 1.19599 SY-SM Acre t o HA 2.47105 AC-HA Acre t o Sq Km 247.105 AC-SKM Cu F t t o Cu M 35.3147 CF-CM Cu Yd t o Cu M 1.30795 C Y I C M
OATABLOCK 3:
Means (1994a) j . . . . . . . . . . . . . . . . . . . . . .
. . . . . . . . . . . . . . . . . . . . . . I NFIATORS
Year Inf(BInf(ENR) I n 75 1.86 1.90 76 1.78 1.82 77 1.71 1.74 78 1.65 1.67 79 1.59 1.61 80 1.53 1.55 81 1.48 1.49 82 1.43 1.44 83 1.38 1.40 84 1.34 1.35 85 1.30 1.31 86 1.26 1.27 87 1.23 1.23 88 i . i g 1.20 89 1.16 1.17 90 1.13 1.13 9 1 1.10 1.10 92 1.07 1.08 93 1.05 1.05 94 1.02 1.02 95 1.00 1.00
. . . . . . . . . . . . . . . . . . . . . . Rat io o f adverse t o average costs: Rat io o f costs f o r Ref. h . . . . . . . . . . . . . . . . . . . . . .
f(HF&O) Inf(CP1) 1.64 2.66 1.59 2.46 1.54 2.28 1.50 2.13 1.45 2.00 1.41 1.88 1.38 1.78 1.34 1.68 1.31 1.60 1.27 1.52 1.24 1.45 1.21 1.39 1.19 1.33 1.16 1.28 1.13 1.23 1.11 1.19 1.08 1.14 1.06 1.10 1.04 1.07 1.02 1.03 1.00 1.00
1.33 2 Hrs l o s t each 8.Hr s h i f t 1.17 Rat io * 718
G-3
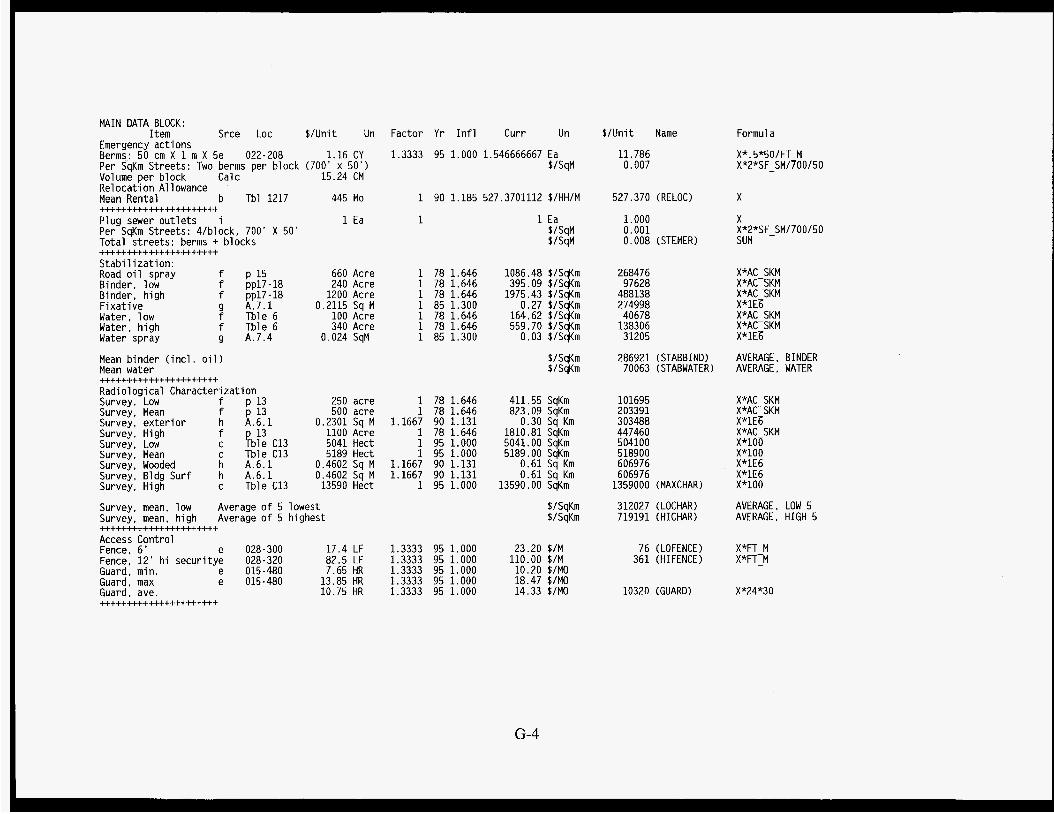
MAIN DATA BLOCK: Item Srce LOC Factor Y r I n f l Curr Un $/Unit Name
11.786 0.007
Formul a
X*.5*50/FT M X*2*SF_SM/700/50
$/Unit Un Emergency actions Berms: 50 cm X 1 m X 5e 022-208 Per SaKm Streets: Two berms Der block
1.16 CY
15.24 CM (700' x 50')
1.3333 95 1.000 1.546666667 Ea $/SqM
Volume per block Calc '
Re1 oca t i on A1 1 owance Mean Rental b Tbl 1217
Plug sewer ou t l e t s i Per SqKm Streets: 4/block. 700' X 50' Total s t ree ts : berms + blocks
Stabi 1 i za t i on : Road o i l spray f p 15
F i xa t i ve g A.7.1 Water, low f Tble 6 Water, h igh f Tble 6 Water spray g A.7.4
Mean binder ( i n c l . o i l ) Mean water
Radi o l ogi cal Characterization Survey, Low f p 13 Survey, Mean f p 13 Survey, ex te r io r h A.6.1 Survey, High f p 13 Survey, Low c Tble C13 Survey, Mean c Tble C13 Survey, Wooded h A.6.1 Survey, Bldg Surf h A.6.1 Survey, High c Tble C13
. . . . . . . . . . . . . . . . . . . . . .
......................
Binder, low f pp17 - 18 Binder, h igh f pp17 ~ 18
. . . . . . . . . . . . . . . . . . . . . .
1 90 1.185 527.3701112 $/HH/M
1 1 Ea $/SqM $/SqM
527.370 (RELOC) X 445 Mo
1 Ea 1.000 0.001 0.008 (STEMER)
X X*2*SF_SM/700/50 SUM
660 Acre 240 Acre
1200 Acre 0.2115 Sq M
100 Acre 340 Acre
0.024 SqM
1 78 1.646 1086.48 $/SqKm 1 78 1.646 395.09 $/SqKm 1 78 1.646 1975.43 $/SqKm 1 85 1.300 0.27 $/SqKm 1 78 1.646 164.62 $/SqKm 1 78 1.646 559.70 $/SqKm 1 85 1.300 0.03 $/SqKm
$/SqKm $/SqKm
268476 97628
488138 274998 40678
138306 31205
X*AC SKM X*AC-SKM X*AC-SKM X*1E6 X*AC SKM X*AC-SKM X*lE6
AVERAGE, BINDER AVERAGE, WATER
286921 (STABBIND) 70063 (STABWATER)
250 acre 500 acre
0.2301 Sq M 1100 Acre 5041 Hect 5189 Hect
0.4602 Sq M 0.4602 Sq M
13590 Hect
1 78 1.646 1 78 1.646
1.1667 90 1.131
411.55 SqKm 823.09 SqKm
1810.81 SqKm 5041.00 SoKm
0.30 Sq Km
101695 203391 303488 447460 504100
X*AC SKM X*AC-SKM X*lE6 X*AC SKM X*lOU
1 78 1.646 1 95 1.000 1 95 1.000
1.1667 90 1.131 1.1667 90 1.131
1 95 1.000
5189.00 SqKm
13590.00 SqKm
0.61 Sq Km 0.61 Sq Km
518900 606976 606976
1359000 (MAXCHAR)
x*100 X*1E6
$/SqKm $/SqKm
312027 (LOCHAR) 719191 (HICHAR)
AVERAGE, LOW 5 AVERAGE, HIGH 5
Survey, mean, low Average o f 5 lowest Survey, mean, high Average o f 5 highest
Access Control Fence, 6 e 028-300 17.4 LF Fence, 12' h i secur i tye 028-320 82.5 LF Guard, min. e 015-480 7.65 HR Guard, max e 015-480 13.85 HR Guard, ave. 10.75 HR
......................
......................
1.3333 95 1.000 1.3333 95 1.000 1.3333 95 1.000 1.3333 95 1.000 1.3333 95 1.000
23.20 $ /M 110.00 $/M 10.20 $/MO 18.47 $/MO 14.33 $/MO
76 (LOFENCE) 361 (HIFENCE)
X*FT-M X*FT-M
10320 (GUARD) X*24*30
G-4

Character ist ics o f res ident ia l property value: Homes, new, med pr . b Tbl 1206 126500 Ea Homes, new, sq footageb Tbl 1204 Cost/SF Cal c Cost, 1600SF house T&B House Size 2061 SF This study house s ize (heated area) 1600 SF Garage area 360 SF Total under roo f 1960 SF Ratio: This house/T&B house 0.776213389 (AREARATIO)
1 93 1.050 93
132778 Ea SF $/SF Ea
132778 1945
68 109226
X x COSTISQ. FT.
( RESACQ) $/SQFT*SQFT
Personal property: Sof t surface h Tbl 2.23 Hard surface h Tbl 2.22 Paper i Elec t h Tbl 2.24 Per vehic le i Avg 1.3 Vehicles/household Total personal property
Commercial Acqu is i t ion Cost, t o t a l , comm. b Tbl 1198 Floor space b Tbl 1198 Cost/ Sq F t b Calc Square footage o f bui 1 dings A l l Comm Bldgs, mean b Tbl 1230 Comm Bu i ld ing value b Calc
Compensation f o r l o s t income Sales, Gen Merch b Tb11281 No. Establishments b Tbl 1278 Sales per establishmencalc Reta i l rece ip ts b Tbl 833 Reta i l ne t income b Tbl 833 Ratio: net/gross Calc Net Inc/Firm Cal c Payro l l , Gen Merch b Tbl 1278 Payrol l per estab. Calc Total sales + pay
Parking l o t s B i t . Concr. Paving, 3"e R025-110 Paving. 6480 Sq M Calc Paint pkg s t a l l s (100)e 025-804 Pkg ba r r i e rs , 100 e 028-408 Lights, 6 Ea, 20' e 166-115 Total parking l o t Calc
Stock
. . . . . . . . . . . . . . . . . . . . . .
2853 House 4106 House 1200 House 762 House
9000 Ea 11700 House
3.420E+10 $ 4.790E+08 Sq F t
71.40 $/SF
14100 Sq F t
5.50E+10 $ 26700 Num
2059925 $/Yr 1886 B$
27 B$ 0.0143 29490 $ / Y r
5.00E+09 $ 187266 $/Yr
5.15 $/SY
2.48 Ea 28.6 Ea 1073 Ea
1 82 1.340 1 82 1.340 1 82 1.684 1 82 1.684 1 95 1.000 1 95 1.000
3823.78 House 5503.14 House 2020.52 House 1283.03 House
11700.00 House House
2968 Sof t 4272 Hard 1568 Paper 996 E lec t
11700 Vehicles X 21504 (PERSACQ) SUM
1 93 1.050
1 92
74.94 $/SqM 807 X*SF-SM
:TBydg 1056683 1310 (COMMACQBLDG) X/SF $/SQM*SQM SM
1 91
196173 XI12
1 91 1.143 33700.92 $/Mo 1 91 1 91 1.143 214006.52 S/Mo
$/Mo
2808 x/12
17834 x/12 20642 (INCCOMP) NETINC+PAYROLL
1 95 1.000
1 95 1.000 1 95 1.000 1 95 1.000
5.15 $/sqM $
2.48 $ 28.60 $
1073.00 $ $ Tot
6.16 X*SY SM
248 X"100 2860 X * l O O 6438 X*6
49459 (COMMACQPKG) SUM
$/SQM*SQM 39913
_. Total value b Tbl 1283 1.62E+ll $ 1 93 (Dept stores excluded) No. Establishments b Tbl 1278 1.2972E+06 Num 1 91 (De t stores excluded) Excluding Dept. stores, automotive dealers. f ue l dealers. merch. macline, adminstrative Value Ea. Cal c 1.250E+05 $ 1 93 1.067 133288.83 $/Bldg 133289 (COMMACQSTK) X
G-5

Equipment Homes, Sq F t Each 1600 Stores, Sq F t Each 14100 Ratio 8.8125 Homes, a1 1 furn+veh. 21503.9 Equipment value Calc . . . . . . . . . . . . . . . . . . . . . .
$/Bldg 189504 (COMMACQEQUIP) Ratio*PERSACQ
Streets, acqu is i t ion 50' wide s t ree t Prepare subbase e 022-304 Base Course e 022-308 Paving, b i t conc. e R025-110 Curbs e 025-254 Curbs. per SY Calc Total Paving Calc
0.8 SY 2.95 SY 5.15 SY 2.2 LF
0 .01 SY 8.91 SY
Sewers 15" Excav & B a c k f i l l Total Sewer
e 027-162 e 026-014 Calc
Water 8" , CI/CL e 026-666 Valves, 8" e 026-690 Valves, 2/700 F t Calc Hydrants. 4-1/2: valvee 026-454 Hydrants, 2/700 Cal c Excav & B a c k f i l l e 026-014 Total water Cal c
12.75 LF 1.9 LF
14.65 LF
22.5 LF 885 Ea
2153 LF 980 Ea 2.8 LF 1.6 LF
29.43 LF
1 95 1.000
95
1 95 1.000
8.91 f/SqM
14.65 USqM
10.66 (STACQPVG) X*SQ-SM
3.15 (STACQSEW) X/WIDTH*SF-SM
1 95 1.000 29.43 $/SqM 6.34 (STACQWAT) X/WIDTH*SF-SM
Gas 2" Excav & B a c k f i l l Valves, 2" j x gas Valves, 2/700 F t Total gas
E lec t r i c . Poles, 30' Cross arms Dig holes Total /pole Poles, 4/700' Feeders (4) Transformers, 45 KVA Transf., 1/700 Total E lec t
e 026-856 e 026-014 e 026-858 Calc Cal c
e 167-110 e 167.110 e 169-110 Calc Calc e 167-130 e 167-130 Cal c Calc
8.65 LF 1.6 LF 93 Ea
0.27 LF 10.52 LF
815 Ea 245 Ea 199 Ea
1259 Ea 7.19 LF 108 LF
1000 Ea 1.43 LF
116.62 LF
1 95 1.000 10.52 $/SqM 2.26 (STACQGAS) X/WIDTH*SF-SM
1 95 1.000 815.00 1 95 1.000 245.00 1 95 1,000 199.00 1 95 1.000 1259.00 1 95 1.000 7.19 1 95 1.000 108.00 1 95 1.000 1000.00 1 95 1,000 1.43 1 95 1,000 116.62 $/SqM 25.11 (STACQELECT) X/WIDTH*SF-SM
$/Sq K 47515325 (STACQ) SUM*lE6 Total s t ree t acqu is i t i ca l c . . . . . . . . . . . . . . . . . . . . . .
G-6
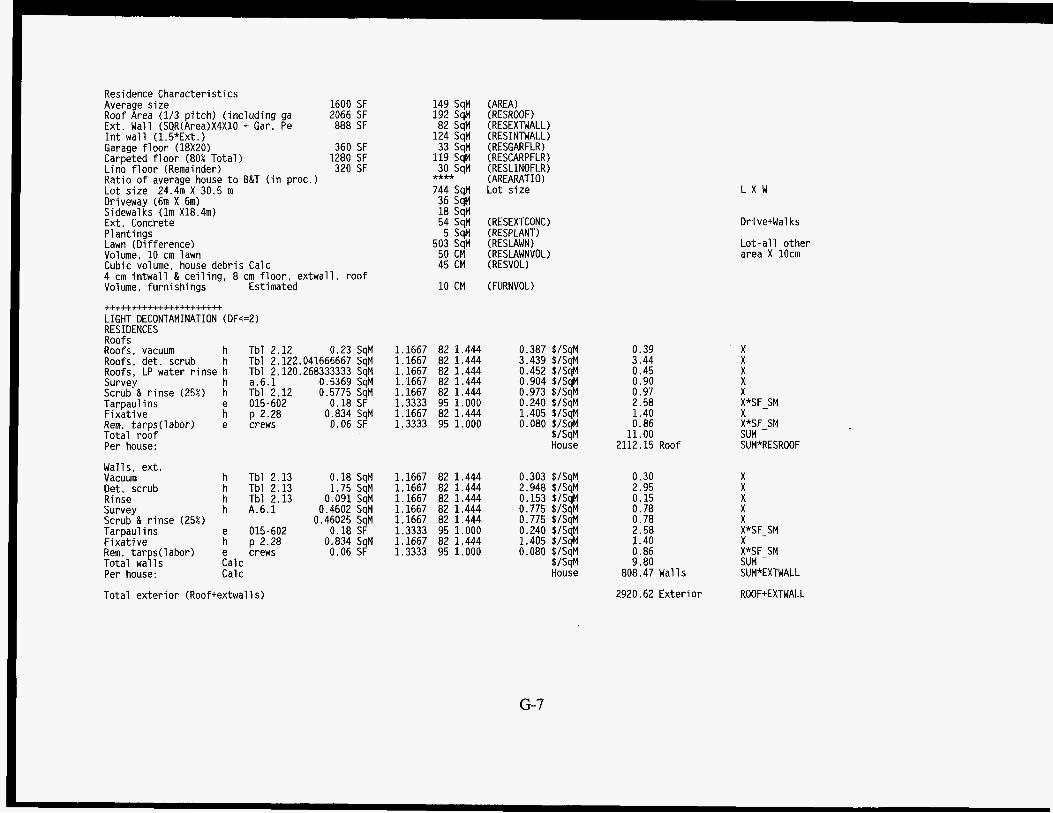
Residence Character ist ics Average s ize 1600 SF Roof Area (1/3 p i tch) ( inc lud ing ga 2066 SF Ext. Wall (SQR(Area)X4X10 + Gar. Pe 888 SF I n t wal l (1.5*Ext.) Garage f l o o r (18x20) 360 SF Carpeted f l oo r (80% Total) 1280 SF Lino f l o o r (Remainder) 320 SF Rat io o f average house t o B&T ( i n proc. ) Lot s ize 24.4111 X 30.5 m Driveway (6m X 6m) Sidewalks ( l m X18.4m) Ext . Concrete P1 antings Lawn (Difference) Volume, 10 cm lawn Cubic volume, house debr is Calc 4 cm in twa l l & ce i l i ng , 8 cm f l o o r , extwal l , r oo f Volume, furnishings Estimated
LIGHT DECONTAMINATION ( DF<=2 ) RESIDENCES
. . . . . . . . . . . . . . . . . . . . . .
Roofs Roofs, vacuum h Roofs, det. scrub h Roofs, LP water r i nse h Survey h Scrub & r i nse (25%) h Tarpaulins e F i xa t i ve h Rem. tarps(1abor) e Total roo f Per house:
Walls, ex t . Vacuum h Det. scrub h Rinse h Survey h Scrub & r i nse (25%) Tarpaul i n s e F i xa t i ve h
p 2.28 crews
Tbl 2.13 Tbl 2.13 Tbl 2.13 A.6.1
p 2.28 crews
015-602
Tbl 2.12 0.23 SqM Tbl 2,122.041666667 SqM Tbl 2,120.268333333 SqM a.6.1 0.5369 SqM Tbl 2.12 0.5775 SqM 015-602 0.18 SF
0.834 SqM 0.06 SF
Rem: t a r s(1abor) e Total wayls Calc Per house: Cal c
Total ex te r io r (Roof+extwalls)
149 SqM (AREA) 192 SqM (RESROOF) 82 SaM (RESEXTWALL)
**** ' (AREARAT I O 1
54 SqM (RESE) 5 SaM (RESPLANT)
10 CM (FURNVOL)
1.1667 1.1667 1.1667 1.1667 1.1667 1.3333 1.1667 1.3333
82 1.444 82 1.444 82 1.444 82 1.444 82 1.444 95 1.000 82 1.444 95 1.000
0.387 $/SqM 3.439 $/SqM 0.452 $/SqM 0.904 $/SqM 0.973 $/SqM 0.240 S/SqM 1.405 $/SqM 0.080 $/SqM
$/SqM House
0.18 SqM 1.1667 82 1.444 0.303 $/SqM 1.75 SqM 1.1667 82 1.444 2.948 $/SqM
0.091 SqM 1.1667 82 1.444 0.153 $/SqM 0.4602 SqM 1.1667 82 1.444 0.775 $/SqM
0.46025 SqM 1.1667 82 1.444 0.775 $/SqM 0.18 SF 1.3333 95 1.000 0.240 $/SqM
0.834 SqM 1.1667 82 1.444 1.405 $/SqM 0.06 SF 1.3333 95 1.000 0.080 $/SqM
$/SqM House
0.39 3.44 0.45 0.90 0.97 2.58 1.40 0.86
11.00 2112.15 Roof
0.30 2.95 0.15 0.78 0.78 2.58 1.40 0.86 9.80
808.47 Walls
2920.62 Ex ter io r
L X W
Drive+Wal ks
L o t - a l l other area X 10cm
X X X X X X*SF-SM X X*SF-SM SUM SUM*RESROOF
X X X X X X*SF-SM X X*SF SM SUM - SUM*EXTWALL
ROOF+EXTWALL
G-7

I n t e r i o r Carpets Vacuum (twice) Shampoo Survey h A . 6 . 1 Vacuum & shampoo (25X)Calc Total carpet Cal c Per house:
h Tbl 2.18 h Tbl 2.18
A t t i c spaces Survey h A.6.1 Remove insu l (25%) j 072-118 (Same as i n s t a l l . labor. O&P only) I n s t a l l new bat ts j Total a t t i c space
Ducts: vacuum/steamcl e i
Linoleum Floors Vacuum h Scrub & wash h Survey Scrub & Wash (25%) Total f o r l i n o
h h
Per house:
Concrete f l oo rs (garage) Vacuum h Scrub & wash h Survey Scrub & Wash (25%) Total f o r concrete Per house:
I n t e r i o r wal ls Vacuum Scrub & wash
h h
h h
072 - ii8
Tbl 2.16 Tbl 2.16 A . 6 . 1 Tbl 2.16
Tbl 2.16 Tbl 2.16 A . 6 . 1 Tbl 2.16
Tbl 2.20 Tbl 2.20 A . 6 . 1
0.36 SqM 1.25 SqM
0.4602 SqM 0.4025 SqM
1.1667 82 1.340 i . i w 82 1.340 1.1667 82 1.340 1.1667 82 1.340
0.563 $/SaM 1.955 $/SqM 0.720 $/SqM 0.629 $/SQM
$/S4M House
0.56 1.95 0.72 0.63 3.87
459.78 Carpet
X X X X SUM SUM*RESCARPFLR
0.4602 SqM 2.76 SqM
5.45 SqM
1.1667 82 1.340 1.3333 95 1.000
1.3333 95 1.000
250 House
0.18 SqM 1.75 SqM
0.4602 SqM 0.4375 SqM
1 95 1
1.1667 82 1.340 1.1667 82 1.340 1.1667 82 1.340 1.1667 82 1.340
0.720 House 3.680 House
7.267 House House
250.000 House
0.281 $/SqM 2.736 $/SqM 0.720 $/SqM 0.684 $/SqM
$/SqM House
0.18 SqM 1.75 SqM
0.4602 SqM 0.4375 SqM
0.18 SqM 1.75 SqM
0.4602 SqM 0.4825 SqM 1.94 SqM
1.1667 82 1.340 1.1667 82 1.340 1.1667 82 1.340 1.1667 82 1.340
1.1667 82 1.340 1.1667 82 1.340 1.1667 82 1.340 1.1667 82 1.340
1 95 1.000
Survey h Vacuum, scrub, wash (25%) Repaint j 099-224 Total I n t . Walls Per house:
Cei 1 i ngs Vacuum Survey Vacuum (25%) Total ce i l i ngs
h Tbl 2.20 0.18 SqM 1.1667 82 1.340 h A . 6 . 1 0.4602 SqM 1.1667 82 1.340 h Tbl 2.20 0.045 SqM 1.1667 82 1.340
0.281 $/SqM 2.736 $/SqM 0.720 $/SaM 0.684 $/SqM
$/SqM House
0.281 $/SqM 2.736 $/SqM 0.720 $/SqM 0.754 $/SqM 1.940 $/SqM
House
0.281 $/SqM 0.720 $/SqM 0.070 $/SqM
$/SqM House
106.96 136.75
X*AREA X*AREA
270.04 513.75 A t t i c
250.00 Ducts
.25*X*AREA SUM
X
0.28 2.74 0.72 0.68 4.42
131.45 Lino
0.28 2.74 0.72 0.68 4.42
147.88 Concr
0.28 2.74 0.72 0.75 1.94 6.43
795.64 Walls
X X
X X X X SUM SUM*RESGARFLR
X X X X X SUM SUM*RESINTWALL
X X X SUM SUM*AREA
G-8

Sof t surface furnishings Vacuum h Tbl 2.23 76.00 Housel 1.1667 82 1.340 Steam Clean h Tbl 2.23 193.90 Housel 1.1667 82 1.340 Survey h A . 6 . 1 194.31 Housel 1.1667 82 1.340 Vacuum & steam clean (25%) 67.48 Housel 1.1667 82 1.340 Total Sof t surface
Hard surface furnishings Vacuum h Tbl 2.22 244.40 Housel 1.1667 82 1.340 Wet wipe h Tbl 2.22 569.80 Housel 1.1667 82 1.340 Survey h A . 6 . 1 624.85 Housel 1.1667 82 1.340 Wet wipe (25%) h Tbl 2.22 142.45 Housel 1.1667 82 1.340 Total hard surface
118.837 House2 303.191 House2 303.827 House2 105.507 House2
382.155 House2 890.965 House2 977.042 House2 222.741 House2
92.24 235.34 235.83 81.90
645.31 So f t
296.63 691.58 758.39 172.89
1919.50 Hard
E lec t ron ic equipment h Tbl 2.24 76.90 House 1.1667 82 1.340 Paper products h Tb12.25 183.60 House 1.1667 82 1.340
120.244 House 287.085 House
93.34 E lec t 222.84 Paper
X*AREARATIO X*AREARATIO X*AREARATIO X*AREARATI 0 SUM
X*AREARATIO X*AREARATI 0 X*AREARATI 0 X*AREARATIO SUM
X*AREARATIO X*AREARATIO
Total f o r i n t e r i o r ( f loors . wa l ls , contents) House 4574.99 A l l I n t e r i o r SUM
h Tbl 2.10 h Tbl 2.10
0.19 SqM 1.1667 82 1.429 0.147 SaM 1.1667 82 1.429
Lawns Vacuum Mow LP Water h Tbl 2.10 0.014 SqM 1.1667 82 1.429 Remove sod e 029-208 0.48 SY 1.3333 95 1.000 Remove tooso i l (3") e 0212-144 1.19 CY 1.3333 95 1.000 r - - . . . . . ..
Survey h Tbl-2.31 0.2301 SqM 1.1667 82 1.429 Hand shovel 12 CF e 029-208 31 CY 1.3333 95 1.000 Rep1 ace topsoi 1 e 029-204 0.395 SY 1.3333 95 1.000 TarDaul ins e 015-602 0.18 SF 1.3333 95 1.000
0.834 SqM 1.1667 82 1.429 0.06 SF 1.3333 95 1.000 0.43 SF 1.3333 95 1.000
0.317 $/SqM 0.245 $/SqM 0,023 $/SqM 0.640 $/SqM 1.587 $/SqM 0.384 $/SqM
41.333 $/SqM 0.527 $/SqM 0.240 $/SqM 1.390 $/SqM 0.080 $/SqM 0.573 $/SqM
$/SqM House
0.32 0.25 0.02 0.77 0.16
0.04 0.63 2.58 1.39
6.17 13.56
0.38
0.86
6819.19 Lawn
X X X X*SY SM X/4/3*SY_SM x X*12/27/RESLAWN X*SY SM XXSFISM Y X*SF SM X*SFISM SUM SUM*RESLAWN
h p 2.28 e crews e 209-316
F i xa t i ve Rem. tarps(1 abor) Replace sod Total lawn Per house:
Trees, 2 lab . 4 h r ea e Crews 30.95 Hr Pump ren ta l e 016-400 35 Day Survey (2 Sq M) h Tbl 2.31 0.4602 SqM Reclean (25%) Tota l , each t r e e Total t rees (4)
1.3333 95 1.000 1.3333 95 1.000 1.1667 82 1.429
41.267 Ea 46.667 Ea
0.767 Ea Ea Ea
41.27 17.50 1.53
15.08 75.38
301.51 Trees
X X*3/8 X*SQM .25*TOTAL SUM SUM*4
P1 ant ing beds 200 Hse 1.3333 95 1.000
Driveways, walks Same as concrete f l oo rs Tarpaul i n s e 015-602 F i xa t i ve h p 2.28 Rem. tarps(1abor) e crews Total /SqM Tot1 per house
0.18 SF 1.3333 95 1.000 0.834 SqM 1.1667 82 1.429 0.06 SF 1.3333 95 1.000
266.667 House
$/SqM 0.240 $/SqM 1.390 $/SqM 0.080 $/SqM
266.67 Plant ings X
4.42
1.39 0.86 9.26
503.54
2.58 Sam as Gar. X*SF-SM X X*SF-SM SUM SUM*RESEXTCONC
G-9
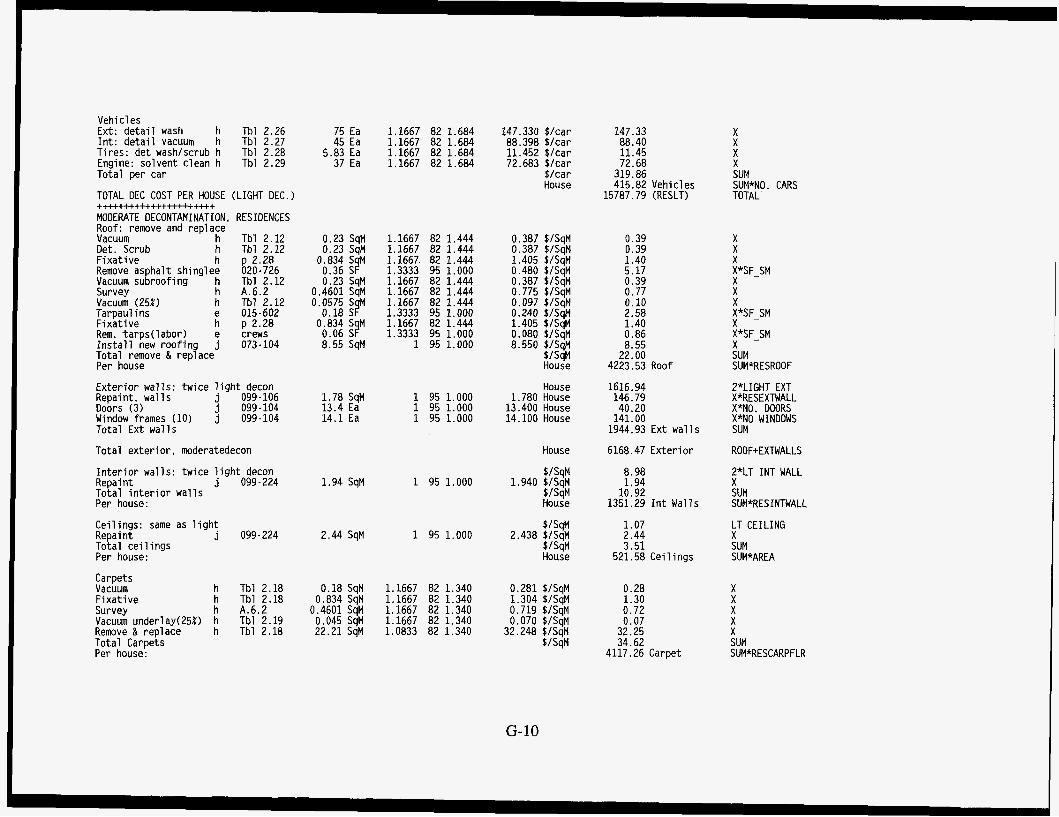
Vehi c l es Ext: de ta i l wash h Tbl 2.26 I n t : de ta i l vacuum h Tbl 2.27 Tires: det washlscrub h Tbl 2.28 Engine: solvent clean h Tbl 2.29 Total per car
TOTAL DEC COST PER HOUSE (LIGHT DEC. )
MODERATE DECONTAMINATION, RESIDENCES Roof: remove and replace Vacuum h Tbl 2.12 Det. Scrub h Tbl 2.12 Fixa t ive h p 2.28 Remove as h a l t shinglee 020-726 Vacuum suhoo f ing h Tbl 2.12 Survey h A.6.2 Vacuum (25%) h Tbl 2.12 Tarpaulins e 015-602 Fixa t ive h p 2.28 Rem. tarps(1abor) e crews I n s t a l l new roo f i ng j 073-104 Total remove & replace Per house
Ex ter io r wal ls: twice l i g h t decon Repaint, wal l s j 099-106 Doors (3) j 099-104 Window frames (10) j 099-104 Total Ext wal ls
Total ex te r io r , moderatedecon
I n t e r i o r wal ls: twice l i g h t decon Repaint j 099-224 Total i n t e r i o r wal ls Per house:
. . . . . . . . . . . . . . . . . . . . . .
Cei l ings: same as l i g h t Repaint j 099-224 Total cei 1 ings Per house:
h Tbl 2.18 h Tbl 2.18
Carpets Vacuum F ixa t ive Survey h A.6.2 Vacuum underlay(25X) h Tbl 2.19 Remove & replace h Tbl 2.18 Total Carpets Per house:
75 Ea 45 Ea
5.83 Ea 37 Ea
1.1667 82 1.684 147.330 $/car 1.1667 82 1.684 88.398 $/car 1.1667 82 1.684 11.452 $/car 1.1667 82 1.684 72.683 $/car
$/car House
147.33 88.40 11.45 72.68
X X X X
319.86 415.82 Vehicles
15787.79 (RESLT)
SUM SUM*NO. CARS TOTAL
0.23 SqM 1.1667 82 1.444 0.23 SqM 1.1667 82 1.444 0.834 SaM 1.1667 82 1.444 0.36 SF 1.3333 95 1.000 0.23 SqM 1.1667 82 1.444
0.4601 SqM 1.1667 82 1.444 0.0575 S M 1.1667 82 1.444 0.18 Sf! 1.3333 95 1.000 0.834 SqM 1.1667 82 1.444 0.06 SF 1.3333 95 1.000 8.55 SqM 1 95 1.000
1.78 SqM 13.4 Ea 14.1 Ea
1.94 SqM
1 95 1.000 1 95 1.000 1 95 1.000
1 95 1.000
2.44 SqM 1 95 1.000
0.387 $/SqM 0.387 $/SqM 1.405 S/SqM 0.480 $/SqM 0.387 $/SqM 0.775 $/SqM 0.097 VSqM 0.240 $/SqM 1.405 $/SqM 0,080 $/SqM 8.550 VSqM
$/SqM House
House 1.780 House 13.400 House 14.100 House
House
$/SqM 1.940 $/SqM
$/SaM Houie
$/SqM 2.438 $/SqM
$/SqM House
0.18 SqM 1.1667 82 1.340 0.281 $/SqM 0.834 SqM 1.1667 82 1.340 1.304 $/SqM 0.4601 SaM 1.1667 82 1.340 0.719 S/SaM 0.045 SqM 1.1667 82 1.340 0.070 S/S;M 22.21 SqM 1.0833 82 1.340 32.248 $/SqM
$/SqM
0.39 0.39 1.40 5.17 0.39 0.77 0.10 2.58 1.40 0.86 8.55 22.00
4223.53 Roof
X X X X*SF-SM X X X X*SF-SM X X*SF-SM X SUM SUM*RESROOF
1616.94 146.79 40.20 141.00 1944.93 Ext wa l ls
6168.47 Exter io r
8.98 1.94 10.92
1351.29 I n t Walls
2*LIGHT EXT X*RESEXTWALL X*NO. DOORS X*NO WINDOWS SUM
ROOF+EXTWALLS
2*LT INT WALL X SUM SUM*RES INTWALL
1.07 2.44 3.51
521.58 Cei 1 i ngs
0.28 1.30 0.72 0.07 32.25 34.62
4117.26 Carpet
LT CEILING X SUM SUM*AREA
X X X X X SUM SUM*RESCARPFLR
G-10

Linoleum f l oo rs Vacuum h Tbl 2.16 Fixa t ive h Tbl 2.16 Survey h A.6.2 Vacuum underlay(25X) h Tbl 2.19 Remove & replace h Tbl 2.16 Total Lino Per House:
A t t i c spaces : Survey h Remove insu l (50%) j (Same as i n s t a l l . labor. I n s t a l l new ba t t s j Total A t t i c spaces
A.6.2
O&P o n l : ~ ) 072 - 118
072 - 118
Ductwork: 120 f t 4" X 8" Remove e 020-700 I n s t a l l FG/metal he1ix.i 157-250 Total Ductwork
Concrete f l oo rs Vacuum h Tbl 2.19 Scrub & wash h Tbl 2.19 S t r i m a b l e coat ins h Tbl 2.19 Survi j l h A.6.2 Scari fy/resurface 25% h Tbl 2.19
Total concr f l oo rs Per House:
Sof t surface furnishings: replace Vacuum h Tbl 2.23 Remove & replace h Tbl 2.23 Total s o f t , per house:
Hard surface furnishings, replace Vacuum h Tbl 2.22 Removelrepl ace h Tbl 2.22 Total hard, per house
0.18 SqM 0.834 SqM 0.4601 SqM 0.045 SqM 14.47 SqM
0.4601 SqM 2.76 SqM
5.45 SqM
1.24 LF 11.1 M
0.18 SqM 1.75 SqM 2.92 SqM
0.4601 SqM 6.195 SqM
1.1667 82 1.340 1.1667 82 1.340 1.1667 82 1.340 1.1667 82 1.340 1.0833 82 1.340
0.281 $/SqM 1.304 S/SqM 0.719 S/SqM 0.070 $/SqM 21.010 SISqM
1.1667 82 1.340 1.3333 95 1.000
1.3333 95 1.000
0.719 House 3.680 House
7.267 House
1.3333 95 1.000 1.3333 95 1.000
1.653 House 14.800 House
0.28 1.30 0.72 0.07 21 * 01 23.39 695.22 Lino
106.94 273.51
540.08 920.52 A t t i c
198.40 541.32 739.72 Ductwork
X X X X X SUM SUM*RESL I NOFLR
X*AREA .5*X*AREA
.5*X*AREA SUM
X*LF X*LF/FT-M SUM
1.1667 82 1.340 1.1667 82 1.340 1.1667 82 i.340 1.1667 82 1.340 1.1667 82 1.340
0.281 SISqM 2.736 S/SqM 4.566 WSaM 0.719 $/SiM 9.687 IISqM
0.28 2.74 4.57 0.72 9.69
X X X X X
$/SqM 17.99 601.67 Concr
SUM SUM*RESGARFLR
76 Housel 1.1667 82 1.340 3143 Housel 1.1667 82 1.340
244.4 Housel 1.1667 82 1.340 9387 Housel 1.1667 82 1.340
118.837 House2 4914.535 House2
382.155 House2 14677.933 House2
92.24 3814.73 3906.97 Sof t
296.63 11393.21 11689.84 Hard
X*ARE ARAT IO X*AREARATIO SUM
X*AREARAT I O X*AREARAT I O SUM
G-11
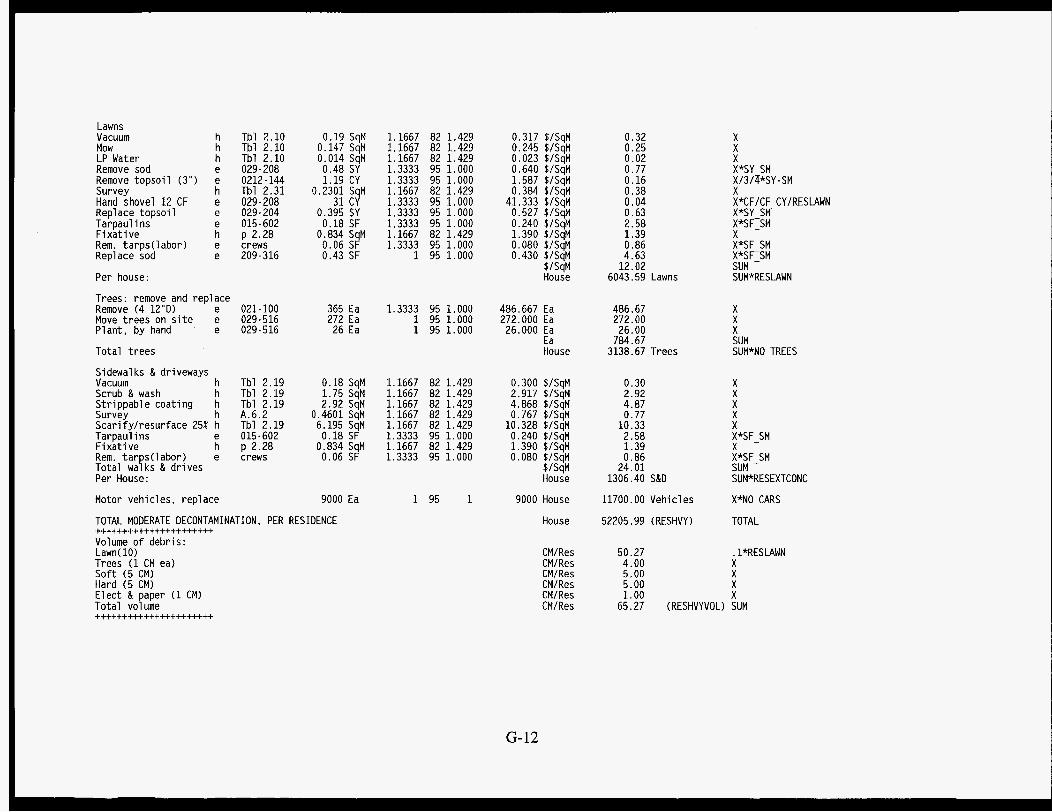
Lawns Vacuum Mow LP Water Remove sod Remove topso i l (3") Survey Hand shovel 12 CF Rep1 ace topsoi 1 Tarpaulins F i xa t i ve Rem. ta rps (1 abor ) Replace sod
Per house:
h Tbl 2.10 h Tbl 2.10 h Tbl 2.10
0.19 SqM 0.147 SqM 0.014 SaM
1.1667 82 1.429 1.1667 82 1.429 1.1667 82 1.429
0.317 0.245 0.023
e 029-208 e 0212-144 h Tbl 2.31
0.48 S\i .. .. ..
1.19 CY 0.2301 SaM
e 029-208 31 Cv' e 029-204 e 015-602 h D 2.28 e crews e 209-316
0.395 SY 0.18 SF 0.834 SaM 0.06 SF 0.43 SF
1.3333 95 1.000 0.640 1.3333 95 1.000 1.587 1.1667 82 1.429 0.384 1.3333 95 1.000 41.333 1.3333 95 1.000 0.527 1.3333 95 1.000 0.240 1.1667 82 1.429 1.390 1.3333 95 1.000 0.080
1 95 1.000 0.430
SISqM SISqM SISqM SISqM SISqM SISqM $/SqM SISqM SISqM SISqM SISqM SISqM SISqM House
0.32 0.25 0.02 0.77 0.16 0.38 0.04 0.63 2.58 1.39 0.86 4.63 12.02
6043.59 Lawns
X X X X*SY SM X/3/4*SY- SM X X*CF/CF CYIRESMWN X*SY SM- X*SFISM Y X*SF SM X*SFISM SUM SUM*RESLAWN
Trees: remove and replace Remove (4 12"D) e 021-100 Move t rees on s i t e e 029-516 Plant, by hand e 029.516
Total t rees
Sidewalks & driveways Vacuum h Tbl 2.19 Scrub & wash h Tbl 2.19 Str ippable coat ing h Tbl 2.19 Survey h A.6.2 Scari fy l resurface 25% h Tbl 2.19 Tarpaul i n s e 015-602 F ixa t i ve h p 2.28 Rem. t a r s(1abor) e crews Total wafks & dr ives Per House:
Motor vehicles , rep1 ace
365 Ea 1.3333 95 1.000 486.667 Ea 272 Ea 1 95 1.000 272.000 Ea 26 Ea 1 95 1.000 26.000 Ea
Ea House
486.67 272.00 26.00 784.67 3138.67 Trees
X X X SUM SUM*NO TREES
0.18 SqM 1.1667 82 1.429 0.300 SISqM 1.75 SqM 1.1667 82 1.429 2.917 WSqM 2.92 SqM 1.1667 82 1.429 4.868 SISqM
0.4601 SqM 1.1667 82 1.429 0.767 t1SqM 6.195 SqM 1.1667 82 1.429 10.328 SISqM 0.18 SF 1.3333 95 1.000 0.240 61SqM 0.834 SqM 1.1667 82 1.429 1.390 61SqM 0.06 SF 1.3333 95 1.000 0.080 $/SqM
SISqM House
9000 House
House
0.30 2.92 4.87 0.77 10.33 2.58 1.39 0.86 24.01
1306.40 S&D
11700.00 Vehicles
52205.99 (RESHVY)
X X X X X X*SF-SM X X*SF SM SUM SUM*RESEXTCONC
X*NO CARS
TOTAL
9000 Ea 1 95 1
TOTAL MODERATE DECONTAMINATION, PER RESIDENCE
Vol ume o f debri s : Lawn(l0) Trees (1 CM ea) Sof t (5 CM) Hard (5 CM) E lec t & paper (1 CM) Total volume
. . . . . . . . . . . . . . . . . . . . . . CMIRes CMIRes CMIRes CMIRes CMIRes CM/ Res
50.27 4.00 5.00 5.00 1.00 X 65.27 (RESHVYVOL) SUM
. l*RESLAWN X X X
. . . . . . . . . . . . . . . . . . . . . .
G-12
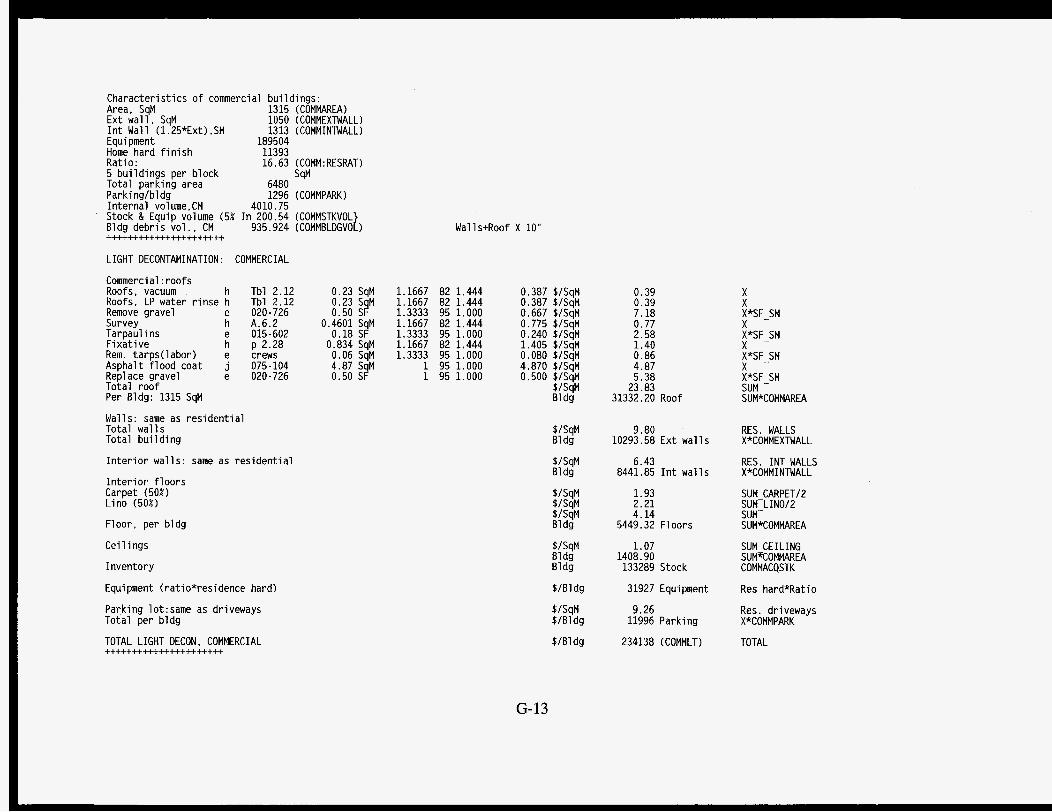
Character ist ics o f commerci a1 bu i ld ings : Area, SqM 1315 (COMMAREA) Ext wa l l , SqM 1050 (COMMEXTWALL) I n t Wall (1.25*Ext),SM 1313 (COMMINTWALL) Equipment 189504 Home hard f i n i s h 11393 Ratio: 16.63 (C0MM:RESRAT)
Total parking area 6480 Parkinglbldg 1296 (COMMPARK) In te rna l volume.CM 4010.75 Stock & Equip volume (5% I n 200.54 (COMMSTKVOL Bldg debr is vo l . , CM
5 bu i ld ings per block SqM
935.924 (COMMBLDGVOL) . . . . . . . . . . . . . . . . . . . . . .
Wall s+Roof X 10"
LIGHT DECONTAMINATION: COMMERCIAL
Commercial : roofs Roofs, vacuum h Tbl 2.12 0.23 SqM 1.1667 82 1.444 Roofs, LP water r i nse h Tbl 2.12 0.23 SqM 1.1667 82 1.444 Remove gravel e 020-726 0.50 SF 1.3333 95 1.000 Survey h A.6.2 0.4601 SqM 1.1667 82 1.444 Tarpaulins e 015-602 0.18 SF 1.3333 95 1.000 F i xa t i ve h p 2.28 0.834 SqM 1.1667 82 1.444 Rem. tarps(1abor) e crews 0.06 SqM 1.3333 95 1.000
Total roo f Per Bldg: 1315 SqM
Asphalt f lood coat j 075-104 4.87 SqM 1 95 1.000 Rep1 ace gravel e 020-726 0.50 SF 1 95 1.000
Walls: same as res ident ia l Total wal ls Total bu i l d ing
I n t e r i o r wal ls: same as res ident ia l
I n t e r i o r f l oo rs Carpet (50%) Lino (50%)
Floor, per b ldg
Cei 1 i ngs
Inventory
Equipment (ratio*residence hard)
Parking 1ot:same as driveways Total per b ldg
TOTAL LIGHT DECON. COMMERCIAL . . . . . . . . . . . . . . . . . . . . . .
0.387 SISqM 0.387 SlSqM 0.667 SISqM 0.775 SISaM 0.240 SISqM 1.405 SISqM 0.080 SISqM 4.870 SISqM 0.500 SISqM
SISqM B1 dg
SISqM Bldg
SISqM B1 dg
SISqM SISqM SISqM B1 dg
SISqM Bldg Bldg
SIBldg
$/SqM SIBldg
SIBldg
0.39 0.39 7.18 0.77 2.58 1.40 0.86 4.87 5.38
23.83 31332.20 Roof
X X X*SF-SM X X*SF-SM X
X*SF_SM x X*SF SM SUM - SUM*COMMAREA
9.80 10293.58 Ext wa l ls
8441.85 I n t wal ls 6.43
1.93 2.21 4.14
5449.32 F1 oors
1.07 1408.90 133289 Stock
31927 Equipment
11996 Parking
234138 (COMMLT)
9.26
RES. WALLS X*COMMEXTWALL
RES. INT WALLS X*COMM I NTWALL
SUM CARPET12 SUM-L I NO12 SUM- SUM*COMMAREA
SUM CEILING SUM*COMMAREA COMMACQSTK
Res hard*Ratio
Res. driveways X*COMMPARK
TOTAL
G-13
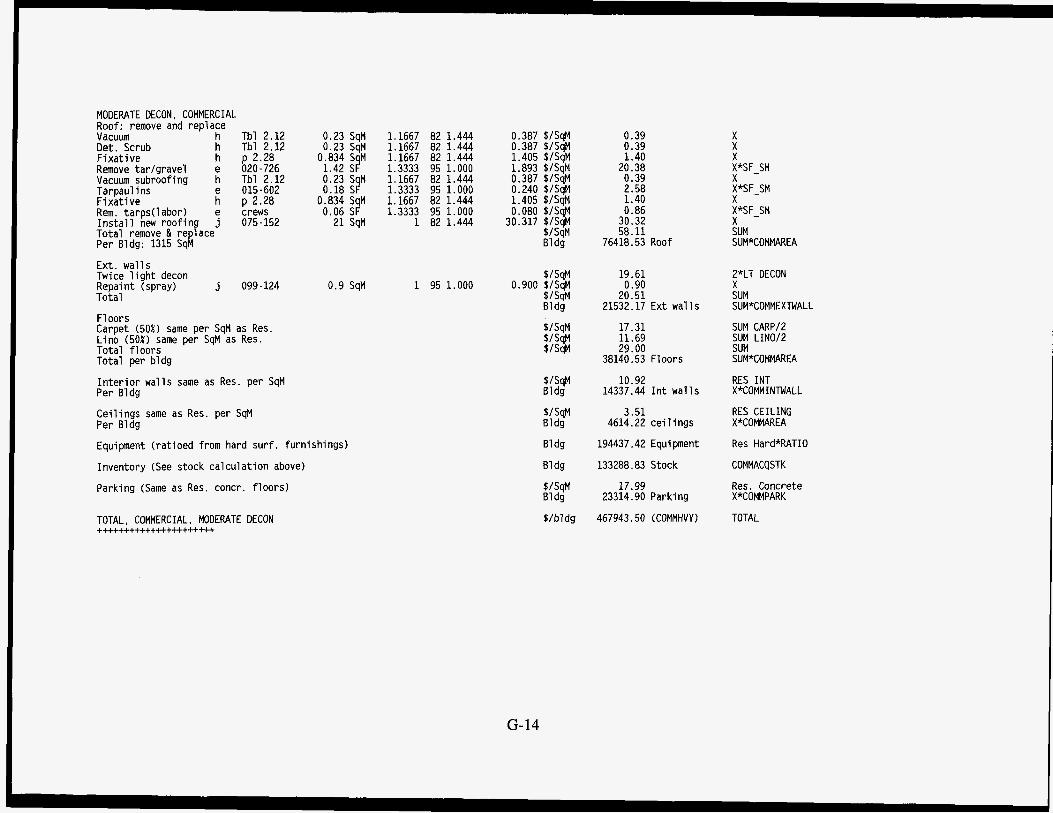
MODERATE DECON. COMMERCIAL Roof: remove and replace Vacuum h Tbl 2.12 Det. Scrub h Tbl 2.12 F ixa t i ve h p 2.28 Remove ta r lg rave l e 020-726 Vacuum subroofing h Tbl 2.12
F ixa t i ve h" p 2.28 Rem. tarps(1abor) e crews I n s t a l l new roo f ing j 075-152 Total remove & replace Per Bldg: 1315 SqM
Tarpaul i ns 015-602
Ext . wa l ls Twice l i g h t decon Repaint (spray) j 099-124 Total
F1 oors Carpet (50%) same per SqM as Res. Lino (50%) same per SqM as Res. Total f l oo rs Total per bldg
I n t e r i o r wal ls same as Res. per SqM Per Bldg
0.23 SaM 0.23 SqM 0.834 SqM 1.42 SF 0.23 SqM 0.18 SF 0.834 SqM 0.06 SF 21 SqM
1.1667 1.1667 1.1667 1.3333 1.1667 1.3333 1.1667 1.3333
1
82 1.444 82 1.444 82 1.444
0.387 SISqM 0.387 $lSqM 1.405 $/SaM
0.39 0.39 1.40
95 i.ooo 82 1.444 95 1.000 82 1.444 95 1.000 82 1.444
i.893 $ 1 ~ 4 ~ 0.387 $/SqM 0.240 SISqM 1.405 SISaM 0.080 $/SqM 30.317 $/SqM
$lSqM 61 dg
20.38 0.39 2.58 1.40 0.86 30.32 58.11
76418.53 Roof
X X X X*SF-SM X X*SF-SM X X*SF-SM X SUM SUM*COMMAREA
0.9 SqM
Cei l ings same as Res. per SqM Per Bldg
Equipment ( ra t ioed from hard sur f . furnishings)
Inventory (See stock ca lcu la t ion above)
Parking (Same as Res. concr. f l oo rs )
TOTAL, COMMERCIAL, MODERATE DECON . . . . . . . . . . . . . . . . . . . . . .
1 95 1.000 $/SqM
0.900 $/SqM $lSqM 61 dg
$/SqM $/SqM $/SqM
$/SqM Bldg
JISqM Bldg
61 dg
81 dg
$/SqM 81 dg
$/bldg
19.61 0.90 20.51
21532.17 Ext wa l l s
17.31 11.69 29.00
38140.53 Floors
10.92 14337.44 I n t wa l ls
3.51 4614.22 ce i l i ngs
194437.42 Equipment
133288.83 Stock
17.99 23314.90 Parking
467943.50 (COMMHVY)
2*LT DECON X SUM SUM*COMMEXTWALL
SUM CARPI2 SUM LIN0/2 SUM SUM*COMMAREA
RES INT X*COMMINTWALL
RES CEILING X*COMMAREA
Res Hard*RATIO
COMMACQSTK
Res. Concrete X*COMMPARK
TOTAL
G-14

STREETS, L igh t Decon Vacuum sweep h Tbl 2.8 0.0086 SqM 1.1667 82 1.429 HP Water (Firehose) h Tbl 2.8 0.0352 SqM 1.1667 82 1.429 Firehose ra te h Tbl 2.8 1342 SqM/Hr Vacuum truck, haz mat e 016-400 36.5 $/Hr Vac t ruck oper cost e 016-400 12.9 $/Hr Total Vac t ruck Cal c 49.4 $/Hr Derived Vac t ruck { $ /Hr / (SqM/Hr)} 0.037 $/SqM 1.3333 95 1.000 Survey h A.6.2 0.4601 SqM 1.1667 82 1.429 Firehose (25%) h Tbl 2.8 0.0088 SqM 1.1667 82 1.429 Tarpaulins e 015-602 0.18 SF 1.3333 95 1.000 F i xa t i ve h p 2.28 0.834 SqM 1.1667 82 1.429 Rem. tarps(1abor) e crews 0.06 SF 1.3333 95 1.000
Total f o r s t ree ts . . . . . . . . . . . . . . . . . . . . . . STREETS, Moderate Decon Vacuum sweep h Tbl 2.8 0.0086 SqM 1.1667 82 1.429 Firehose h Tbl 2.8 0.0352 SqM 1.1667 82 1.429 Vacuum (from above) e Calc 0.037 P1 aning (50%) e 025-454 1.12 SY 1.3333 95 1.000 Tarpaul i n s e 015-602 0.18 SF 1.3333 95 1.000 F i xa t i ve h p 2.28 0.834 S M 1.1667 82 1.429 Rem. tarps(1abor) e crews 0.06 S? 1.3333 95 1.000 Tack coat e 025-454 0.21 SY 1 95 1.000 Seal coat e 025-458 0.84 SY 1 95 1.000 Surface coat e 025-458 1.01 SY 1 95 1.000
Total f o r s t ree ts
Volume o f water f o r f i h (Gal /SF)*(SF/SM)/(Gal /CF)/(CF/CM)
A.1.5.3
. . . . . . . . . . . . . . . . . . . . . . Parkland. l i g h t Trees @ 30X30M Tur f (same as lawns) Trees Total l i g h t parkland
Volume (10 cm s o i l )
Park1 and, moderate/heavy Tur f (same as lawns) Volume, each t r e e Trees
. . . . . . . . . . . . . . . . . . . . . .
Volume (10 cm s o i l + Trees) . . . . . . . . . . . . . . . . . . . . . .
0.014 $/SqM 0.059 $/SqM
0.01 0.06
X X
0.049 $/SqM 0.767 $/SaM 0.015 $/SqM 0.240 $/SqM 1.390 $/SqM 0.080 $/SqM
$/SqM
0.05 0.77 0.01 2.58 1.39 0.86
X X X X*SF-SM X X*SF-SM
5.74 (STLT) SUM
0.014 $/SqM 0.059 $/SqM 0.042 $/SqM 1.493 $/SqM 0.240 $/SqM 1.390 $/SqM 0.080 $/SqM 0.210 $/SqM 0.840 $/SqM 1,010 $/SqM
$/SqM
CM/SM
0.01 0.06 0.04 0.89 2.58 1.39 0.86 0.25 1.00 1 .21
X X X
5*X*SF SM X*SF-SM- X X*SF SM X*SY-SM X*SY SM X*SYISM
8.31 (STHVY) SUM
0.0090 (SThATERVOL) 0.22 Gal /SqFt
1111 TreesISqKm (SqM/SqKm)*(Trees/SqM) $/SqKm 13564848.91 $/SqM*lE6 $/SqKm 83751.46 $/Tree*Trees/SqKm $/SqKm 13648600.36 (PARKLT) SUM
CM/SqK 100000.00 (PARKLTVOL) 10 cm*lE6
7.12 From "FOREST.WK1: VOLTREE" $/SqKm 12022021.75 $/SqM*lE6
$/SqKm 871851.85 $/Tree*Trees/SqKm $/SqKm 12893873.60 (PARHVY) Sum
107907.56 (PARKHVYVOL) lE5+Trees/SqKm*CM/Tr
G-15

Character ist ics o f i ndus t r i a l bui ld ings: Floor/cei lng/roof area (500' X 60') 30000 SF Ext wal l area (Perim X 10') 11200 SF I n t Wall area (Ext + 1000 SF) 12200 SF Value o f Bldg ($40/SF) Value o f contents ($40/SF) Volume o f contents (5' high) 5555.56 CY Bu i ld ing Vol ( Int wa l l tEx t wall+Roo 44500 CF Block s ize: 700' X 200 Parking l o t AREA: 700*200-60000 SF Two Bldgs/block
LIGHT DECONTAMINATION. INDUSTRIAL Roof (same as comm.) Ext wal ls (same as comm) Cei 1 i ngs I n t wal l s Floor (concrete) Scra e 10 cm oust ide bCalc Totay i ndus t r i a l . l i g h t . . . . . . . . . . . . . . . . . . . . . . Mod, DECONTAMINATION, INDUSTRIAL Roof (Same as comm.) Ext wall s Cei 1 i ngs In t wal l s F1 oor Scrape 10 cm oust ide bCalc Total i ndus t r i a l , moderate
13006.4256 SqM
. . . . . . . . . . . . . . . . . . . . . .
. . . . . . . . . . . . . . . . . . . . . .
$/SqM $/SqM $/SqM $/SqM $/SqM CM/B1 k
$/SM
DEMOLITION: Concrete, mesh r e i n f Concrete, rod r e i n f Curbs Single Bldgs, Conc Frame house. maximum
e e e e e
Disposal t o cent ra l s i t e : Conc Bldg e 020-608 Wood frame e 020-608 Dumpster, load & dump e 020-616 Trucking, 2 m i , unloade 020-616 Total f o r Misc t rash Calc
Demolish house, haul debr is Demol i t i o n Dumpster/truck Total f o r house demol i t ion
Demolish Comm Bldg, haul debris Demol i ti on Dumpster/truck
Total f o r comm. demol i t ion
. . . . . . . . . . . . . . . . . . . . . .
. . . . . . . . . . . . . . . . . . . . . .
020-554 020-554 020-554 020 - 604 020 - 604
2.08 SF 1.3333 95 1.000 2.26 SF 1.3333 95 1.000 3.14 LF 1.3333 95 1.000
0.3 CF 1.3333 95 1.000 3740 Ea 1.3333 95 1.000
7.6 CY 1.3333 95 1.000 13.65 CY 1.3333 95 1.000 20.5 CY 1.3333 95 1.000
45 CY 1.3333 95 1.000 65.5 CY 1.3333 95 1.000
S/CM
$/CM $/CM
2787.091 1040.514 1133.417 2400000 2400000
8495.054 2520.199
743.224
23.827 9.803 1.071 6.432 4.422
743.224
58.113 20.507 3.509
10.924 17.990
743.224
2,773 3.013 4.187 0.400
4986.667
10.133 1B.200 27.333 60.000 87.333
4986.667 114.228
14.126 114.228
SqM (INDAREA) (SQMIBUILDING) (INDEXTWALL) (SQM/BUILDING) zq! (INDINTWALL) (SQM/BUILDING)
$/B1 k (INDCONT) CM/B1 k( INDVOL) CM/ B 1 k ( I NDB LDGVOL
$ 9 ~ 1 k ( INDBLDGACQ)
CM/ B1 k ( I NDPARKVOL
$/B1 k $/B1 k $/B1 k $/Blk $/B1 k $/B1 k $/B1 k
$/B1 k $/B1 k $/B1 k S/B1 k $/B1 k CM/B1 k $/B1 k
$/SqM $/SqM $/M $/CM Ea
$/CM $/CM S/CM S/CM $/CM
$Ea $Ea $Ea
EA EA
EA
66407.37 20401.18 5972.23
14580.01 24646.35 5317.39
137324.53 (INDLT)
323932.18 42675.28 19559.30 24762.36
100278.92 5317.39
516525.44 (INDHVY)
29.85 32.44 (CONCDEM) 13.74 (CURBDEM) 14.13
4986.67
13.25 23.80 35.75 78.48
114.23
4986.67 6252.61
11239.27 (RESDEM)
13220.73 129815.34
143036.07 (COMMDEM)
$/SF*SF/Bl dg*2 Same as Bldg !j*SF/SF-CY*CY+CM*Z
Area*. l/SF-SM
X*INDAREA*2 X* I NDEXTWALL"2 X*INDAREA*2 X*INDINTWALL*Z X*INDAREA*2 X*( EXCAV+LOADHAUL) SUM
X * I NDAREA*2 X*INDEXTWALL*Z X*INDAREA*2 X*INDINTWALL*Z X * I NDAREA*2 X* (EXCAV+LOADHAUL) SUM
X*SF SM X*SF-SM X*FTIM X*CF-CM X
X*CY CM X*CCCM X*CY CM X*CY-CM X*CYICM
X X*(RESVOL+FURNVOL) SUM
X*COMMBLDGVOL X*( COMMBLDGVOL +COMMSTKVOL) SUM
G-16
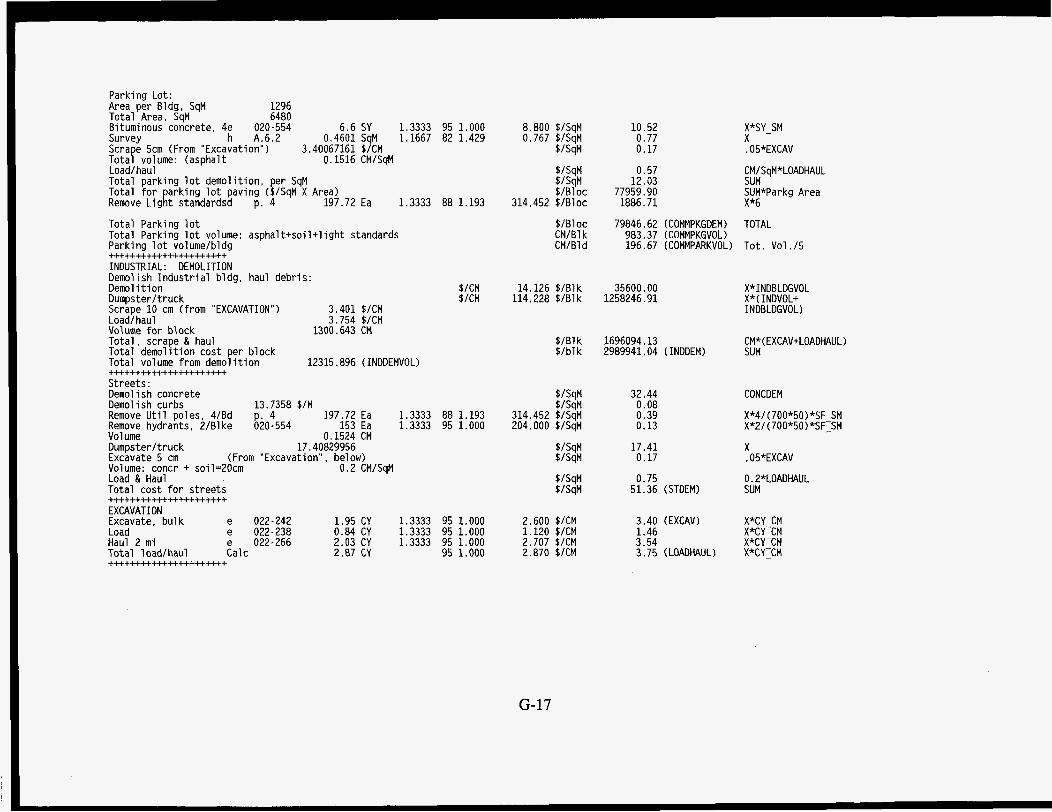
Parking Lot: Area per Bldg, SqM 1296 Total Area, SqM 6480 Bituminous concrete, 4e 020-554 6.6 SY 1.3333 95 1.000 Survey h A.6.2 0.4601 SqM 1.1667 82 1.429 Scra e 5cm (From "Excavation") 3.40067161 $/CM TotaP volume: (asphalt 0.1516 CM/SqM Load/ haul Total parking l o t demolit ion. per SqM Total f o r ark ing l o t paving ($/SqM X Area) Remove L i g i t standardsd p. 4 197.72 Ea 1.3333 88 1.193
Total Parking l o t Total Parking l o t volume: asphal t+soi l+ l ight standards Parking l o t volume/bldg
INDUSTRIAL: DEMOLITION Demolish Indus t r i a l b ldg, haul debris: Demol i t i o n Dumpster/truck Scrape 10 cm (from "EXCAVATION") Load/ haul Volume f o r block Total , scrape & haul Total demol i t ion cost per block Total volume from demol i t ion
Streets : Demol i s h concrete Demol i s h curbs 13.7358 $/M Remove U t i1 poles, 4/Bd 197.72 Ea 1.3333 Remove hydrants, 2/81 ke 9204554 153 Ea 1.3333 Volume 0.1524 CM
. . . . . . . . . . . . . . . . . . . . . .
. . . . . . . . . . . . . . . . . . . . . .
17.40829956 (From "Excavation", below)
soil=20cm 0.2 CM/SqM
Total cost f o r s t ree ts
EXCAVATION Excavate. bu lk e 022-242
. . . . . . . . . . . . . . . . . . . . . .
Dumpster/truck Excavate 5 cm Volume: concr + Load & Haul
$/CM $/CM
3.401 $/CM 3.754 $/CM
1300.643 CM
12315.896 (INDDEMVOL)
88 1.193 95 1.000
1.95 CY 1.3333 95 1.000 Load e 022-238 0.84 CY 1.3333 95 1.000 Haul 2 m i e 022-266 2.03 CY 1.3333 95 1.000 Total load/haul Calc 2.87 CY 95 1.000 . . . . . . . . . . . . . . . . . . . . . .
8.800 $/SqM 0.767 $/SqM
$/SqM
$/SqM $/SqM $/Bloc
314.452 $/B1 oc
SIB1 oc CM/B1 k CM/B1 d
10.52 0.77 0.17
0.57 12.03
77959.90 1886.71
X*SY-SM X .05*EXCAV
CM/SqM*LOADHAUL SUM SUM*Parkg Area X*6
79846.62 (COMMPKGDEM) TOTAL 983.37 (COMMPKGVOL) 196.67 (COMMPARKVOL) Tot. Vol . /5
14.126 $ /8 lk 35600.00 114,228 $/B1 k 1258246.91
$/B1 k 1696094.13 $ /b l k 2989941.04 (INDDEM)
X*INDBLDGVOL X*(INDVOL+ I NDBLDGVOL)
CM*( EXCAV+LOADHAUL) SUM
$/SqM $/SqM
314.452 $/SqM 204.000 $/SqM
$/SqM $/SqM
32.44 0.08 0.39 0.13
17.41 0.17
$/SqM $/SqM
0.75 51.36 (STDEM)
CONCDEM
X*4/(700*50)*SF SM X*2/ (700*50 *SFISM
X .05*EXCAV
0.2*LOADHAUL SUM
2.600 $/CM 1.120 $/CM 2.707 $/CM 2.870 $/CM
3.40 (EXCAV) X*CY CM 1.46 X*CY-CM 3.54 X*CY-CM 3.75 ( LOADHAUL) X*CYTCM
G-17
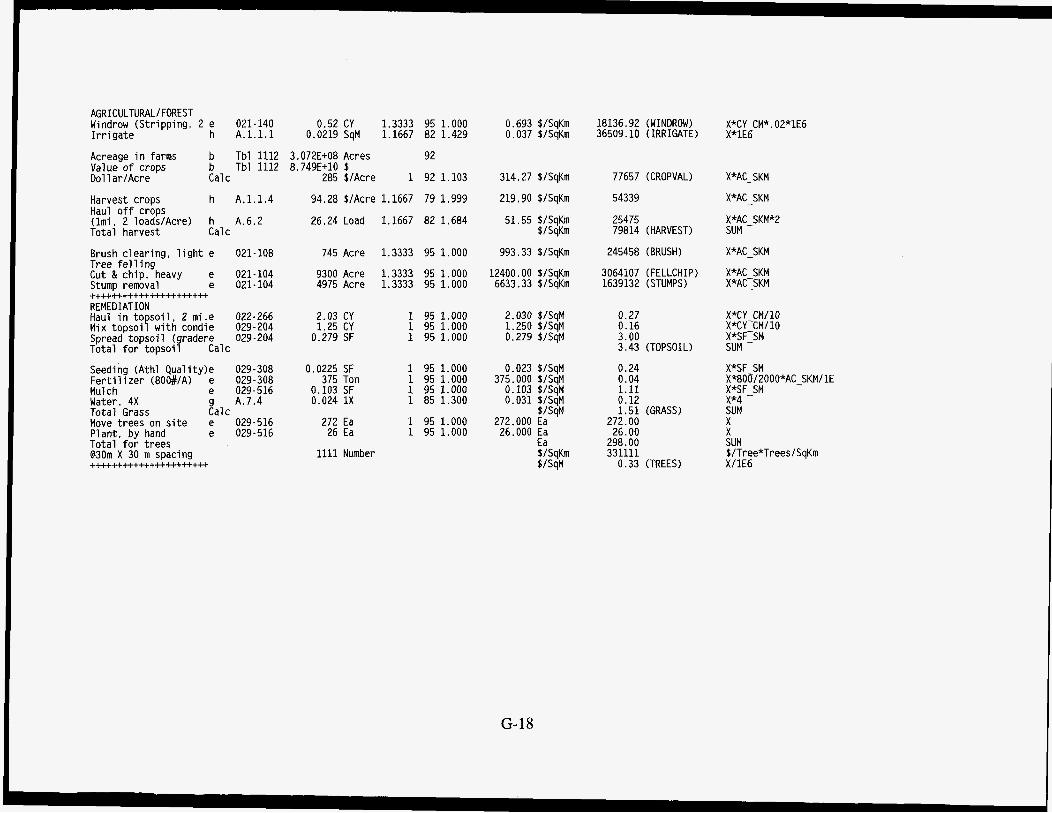
AGRICULTURALIFOREST Windrow (Str ipping, 2 e 021-140 I r r i g a t e h A . l . l . l
0.52 CY 1.3333 95 1.000 0.0219 SqM 1.1667 82 1.429
0.693 $/SqKm 0.037 $/SqKm
18136.92 (WINDROW) X*CY CM*. 02*1E6 36509.10 (IRRIGATE) X*lE6
Acreage i n farms Value o f crops Dol 1 ar/Acre
b Tbl 1112 3.072E+08 Acres b Tbl 1112 8.749E+10 $ Cal c 285 $/Acre
92
1 92 1.103
Harvest crops h A.1.1.4 Haul o f f crops (hi, 2 1oadsIAcre) h A.6.2 Total harvest Cal c
Brush clear ing, l i g h t e 021-108 Tree f e l l i ng Cut & chip, heavy e 021-104 Stump removal e 021-104
REMEDIATION Haul in t o s o i l , 2 mi.e 022-266 Mix topsoiy w i t h condie 029-204 Spread topso i l (gradere 029-204 Total f o r topso i l Calc
. . . . . . . . . . . . . . . . . . . . . .
94.28 $/Acre 1.1667 79 1.999
26.24 Load 1.1667 82 1.684
745 Acre 1.3333 95 1.000
9300 Acre 1.3333 95 1.000 4975 Acre 1.3333 95 1.000
2.03 CY 1.25 CY
0.279 SF
1 95 1.000 1 95 1.000 1 95 1.000
Seeding (Athl Q u a l i t y l e 029-308 0.0225 SF F e r t i l i z e r (80C#/A) e 029-308 375 Ton Mulch e 029-516 0.103 SF Water, 4X g A.7.4 0.024 1 X Total Grass Cal c Move t rees on s i t e e 029-516 272 Ea Plant, by hand e 029-516 26 Ea Total f o r t rees @30m X 30 m spacing . . . . . . . . . . . . . . . . . . . . . .
1111 Number
1 95 1.000 1 95 1.000 1 95 1.000 1 85 1.300
1 95 1.000 1 95 1,000
314.27 $/SqKm
219.90 $/SqKm
51.55 $/SqKm $/SqKm
993.33 $/SqKm
12400.00 $/SqKm 6633.33 $/SqKm
77657 (CROPVAL)
54339
25475 79814 (HARVEST)
245458 (BRUSH)
3064107 (FELLCHIP) 1639132 (STUMPS)
X*AC-SKM
X*AC-SKM
X*AC-SKM*Z SUM
X*AC-SKM
X*AC SKM X*ACZSKM
2.030 $/SqM 1.250 $/SqM 0.279 $/SqM
0.27 0.16 3.00 3.43 (TOPSOIL)
X*CY C M / l O X*CY-CM/lO X*SFISM SUM
0.023 $/SqM 375.000 $/SqM
0.103 $/SqM 0.031 $/SqM
$/SqM 272.000 Ea
26.000 Ea Ea $/SqKm $/SqM
0.24 0.04 1.11 0.12 1.51 (GRASS)
272.00 26.00
298.00 331111
0.33 (TREES)
X*SF SM X*80~/2000*AC_SKM/ 1E X*SF-SM x*4 SUM X X SUM $/Tree*Trees/SqKm X/1E6
G-18

PERSONAL ALLOWANCES Source: JCPenney Catalog, summer, 1995
Mens’ c lo th ing Su i t 250 1 250 Dress s h i r t s 25 3 75 Casual s h i r t s 26 4 104 dress shoes 75 2 150 casual shoes 70 1 70 sweaters 40 1 40
sweats 60 1 60 T s h i r t s 6 7 42 b r i e f s 6 7 42 socks 5 7 35 PJs 20 1 20 Insul jacket 75 1 75 Total men’s c lo th ing ._____...__..._........__ 1075 Ladies’ c lo th ing Su i t 200 1 200 Pantsets 50 2 100 Dresses 65 2 130 Sweater slacks Dress set nightgown robe b r i e f s bras
shoes 65, 2 130 100 casual shoes 50 2
Chi 1 drens ‘ c l o t h i n9 PJ’s 15 dress 56 s l acksl jeans 64 blouses casual shoes dress shoes b r i e f s T s h i r t s Sweats jacket Total chi ldrens’ Household i tems
Item P r Ea No Total
sl acks/ jeans 28 4 112
pantyhose 5 7 35
Total lad ies ’ c lo th ing ......................... 1110
P i 1 1 ows sheets, se t s reads byankets towels, se t cookware se t TV stereo Total household
40 28 70 28 55 6
12
2
7
a0
28
56 70
55 42 84
15 28 16 18 35 40 4 4
1 2 4 7
2 1
126 70 40 28 28 40 55 __....
17 38 50 35 30
110 235 220
3
1 1 1
51 114 150 105 90
110 235 220
522
1075
G-19
00 . N O 00 .a0 Lnw .a0
* b L n
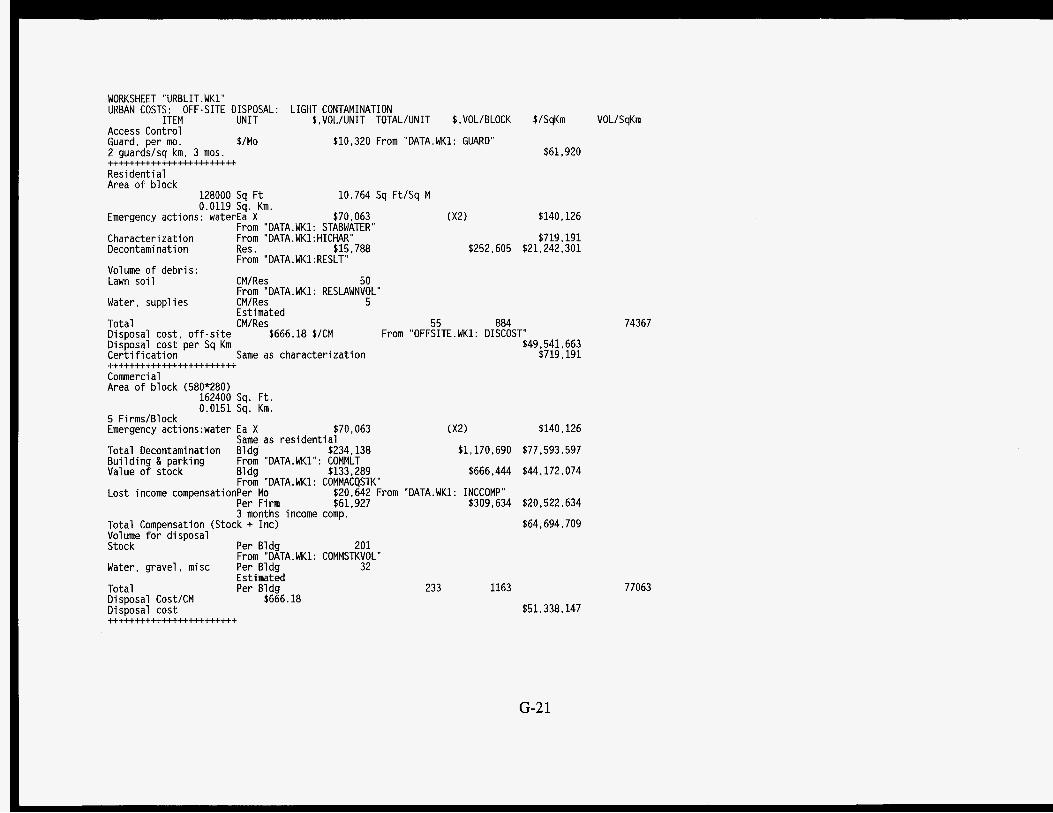
WORKSHEET "URBLIT. WK1" URBAN COSTS: OFF-SITE DISPOSAL: LIGHT CONTAMINATION
ITEM UNIT $.VOL/UNIT TOTAL/UNIT $.VOL/BLOCK $/SaKm VOL/SaKm Access Control Guard, per mo. $/Mo $10,320 From "DATA.WK1: GUARD" 2 guards/sq km, 3 mos.
Resi dent i a1 Area o f block
Emergency actions: waterEa X $70.063 (X2) $140,126
Characterization From "DATA. WK1: HICHAR" $719,191 Decontamination Res. $i5,7aa $252,605 $21,242,301
Volume o f debr is: Lawn s o i l CM/Res 50
Water, suppl i e s CM/Res 5
$61,920 . . . . . . . . . . . . . . . . . . . . . . . .
128000 Sq F t 0.0119 Sq. Km.
10.764 Sq Ft/Sq M
From "DATA. WK1: STABWATER"
From "DATA. WK1: RESLT"
From "DATA.WK1: RESLAWNVOL"
Estimated - - . . . . .- . - - Total CM/Res 55 884 Disposal cost , o f f - s i t e $666.18 $/CM From "OFFSITE. WK1: DISCOST" Disposal cost per Sq Km $49,541,663 Cer t i f i ca t i on Same as character izat ion $719,191
74367
........................ Commerci a1 Area o f b lock (580*280)
162400 Sq. F t . 0.0151 Sa. Km.
5 Firms/Block Emergency actions:water Ea X $70,063 (X2) $140,126
Total Decontamination Bldg $234,138 $1,170,690 $77,593,597 Bu i ld ing & parking Value o f stock B1 dg $133,289 $666,444 $44,172,074
Same as res ident ia l
From "DATA.WK1": COMMLT
From "DATA. WK1: COMMACQSTK"
Per Firm 561.927 $309.634 $20.522.634 Lost income compensationPer Mo $20,642 From "DATA. WK1: INCCOMP"
3 months income comp. Total Compensation (Stock + Inc) Volume f o r disposal Stock Per Bldg
Water. gravel , misc Per Bldg
Total Per Bldg Disposal CostKM $666.18 Disposal cost
From "DATA. WK1:
Estimated
. . . . . . . . . . . . . . . . . . . . . . . .
201
32 COMMSTKVOL"
233
$64,694,709
1163
$51.338.147
77063
G-2 1
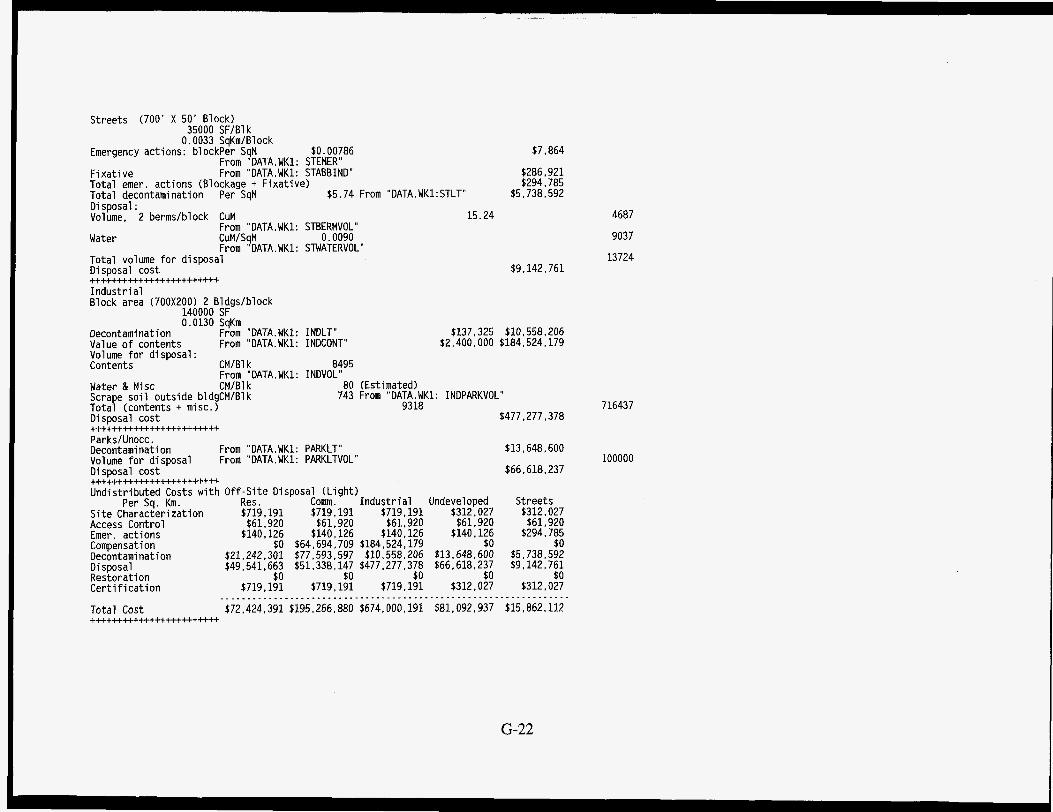
Streets (700' X 50' Block) 35000 SF/B1 k
Emergency actions: blockper SqM $0.00786 0.0033 SqKm/Block
From "DATA.WK1: STEMER" $7,864
Fixative From "DATA.WK1: STABBIND" $286,921 Total emer. actions (Blockage + Fixative) $294,785 Total decontamination Per SaM $5.74 From "DATA. WK1: STLT" $5,738,592 Disposal : Volume, 2 berms/block CUM
From "DATA.WK1: STBERMVOL"
From "DATA. WK1: STWATERVOL" Water CuM/SqM 0.0090
Total volume for disposal Disposal cost . . . . . . . . . . . . . . . . . . . . . . . . I ndustr i a1 Block area (700X200) 2 Bldgs/block
140000 SF 0.0130 SqKm
Decontamination From "DATA. WK1: INDLT" Value o f contents From "DATA.WK1: INDCONT"
15.24
8495 INDVOL"
80 (Estimated) 743 From "DATA.WK1:
9318
Volume for disposal : Contents CM/B1 k
Water & Misc CMB1 k Scra e soil outside bldgCM/Blk Tota? (contents + misc.) Disposal cost . . . . . . . . . . . . . . . . . . . . . . . . Parks/Unocc. Decontamination From "DATA.WK1: PARKLT" Volume for disposal Disposal cost ..........................
Undistributed Costs with Per Sq. Km.
Site Characterization Access Control Emer. actions Compensation Decontamination Disposal Restoration Certification
From "DATA. WK1:
From "DATA.WK1: PARKLTVOL"
13724 $9,142,761
$137,325 $10,558,206 $2,400.000 $184,524,179
I NDPARKVOL"
$477,277.378
$312: 027 $61.920
$140.126 $0
$13,648,600 $66,618,237
$0
4687
9037
716437
$13,648,600
$66.618.237 100000
Off-Site Disposal (Light) Res. Comm. Industrial UndeveloDed Streets $719,191 $719,191 $719,191 $312,027 $61,920 $61,920 $61,920 $61,920
$140,126 $140,126 $140,126 $294,785 $0 $64,694,709 $184,524,179 $0
$21,242,301 $77,593,597 $10,558,206 $5,738.592 $49,541,663 $51,338,147 $477 I 277.378 $9,142,761
$0 $0 $0 $0 $719,191 $719,191 $719.191 $312,027 $312,027
Total Cost $72,424,391 $195,266,880 $674,000,191 $81,092,937 $15,862,112 _______ .__ ._________ ._____ . . . . . ______ . . . . __ ._ .__ .__________ . .____
. . . . . . . . . . . . . . . . . . . . . . . .
G-22
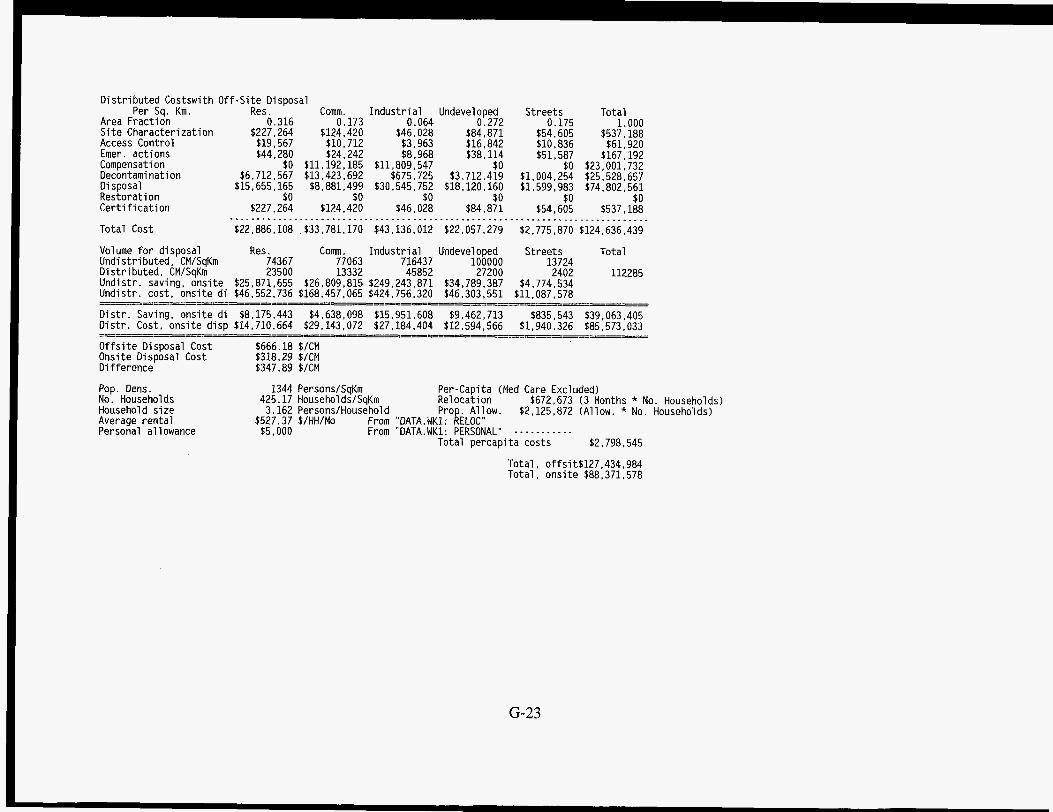
Dis t r ibu ted Costswith O f f - S i t e Disposal
Area Fract ion 0.316 0.173 0.064 0.272 0.175 1.000 S i t e Characterization $227,264 $124,420 $46,028 $84,871 $54,605 $537,188 Access Control $19,567 $10,712 $3,963 $16,842 $10.836 $61,920 Emer. actions $44,280 $24,242 $8,968 $38,114 $51,587 $167,192 Compensation $0 611,192,185 611,809,547 $0 $0 $23,001,732 Decontarni na t ion $6,712,567 $13,423,692 $675,725 $3,712,419 $1,004,254 $25,528,657 Disposal $15,655,165 $8,881,499 $30,545,752 $18,120,160 $1,599,983 $74,802,561
C e r t i f i c a t i o n $227.264 $124.420 $46,028 $84,871 $54.605 $537,188
Total Cost $22,886,108 $33,781,170 $43,136,012 $22,057,279 $2.775,870 $124,636,439
Volume f o r disposal Res. Cornm. Indus t r i a l Undeveloped Streets Total Undistr ibuted, CM/SqKm 74367 77063 716437 100000 13724 D is t r ibu ted , CM/SqKm 23500 13332 45852 27200 2402 112285 Undistr . saving, onsi te $25,871,655 826,809,815 $249,243,871 $34.789.387 $4,774.534 Undistr . cost, ons i te d i $46.552.736 $168,457,065 $424.756.320 $46,303,551 $11.087.578
D i s t r . Saving. ons i te d i $8,175,443 $4,638,098 $15,951,608 $9,462.713 $835,543 $39,063,405 D i s t r . Cost, ons i te disp $14,710,664 $29,143,072 $27,184,404 612,594,566 61,940,326 $85,573,033
O f f s i t e Disposal Cost $666.18 $/CM Onsite Disposal Cost $318.29 S/CM Di f ference $347.89 $/CM
Pop. Dens. 1344 Persons/SqKm Per-Capita (Med Care Excluded) No. Households 425.17 Households/SqKm Relocation $672,673 (3 Months * No. Households) Household s ize 3.162 Persons/Household Pro . Al1,ow. 52,125,872 (Allow. * No. Households) Average ren ta l $527.37 $/HH/Mo From "DATA.WK1: kLOC Personal a1 lowance $5,000 From "DATA.WK1: PERSONAL" . -. - - - . - - - -
Per Sq. Km. Res. Comm. Indus t r i a l Undeveloped Streets Total
Restoration $0 $0 $0 $0 $0 $0 ..............................................................................
........................................................... --- _I
__ __l__-__l___ _I ------ -=========-_-=C===E-= -I=_-- __ ----I_ -
Total percapi ta costs $2,798,545
Total , offsit$127,434,984 Tota l , ons i te $88,371,578
G-23
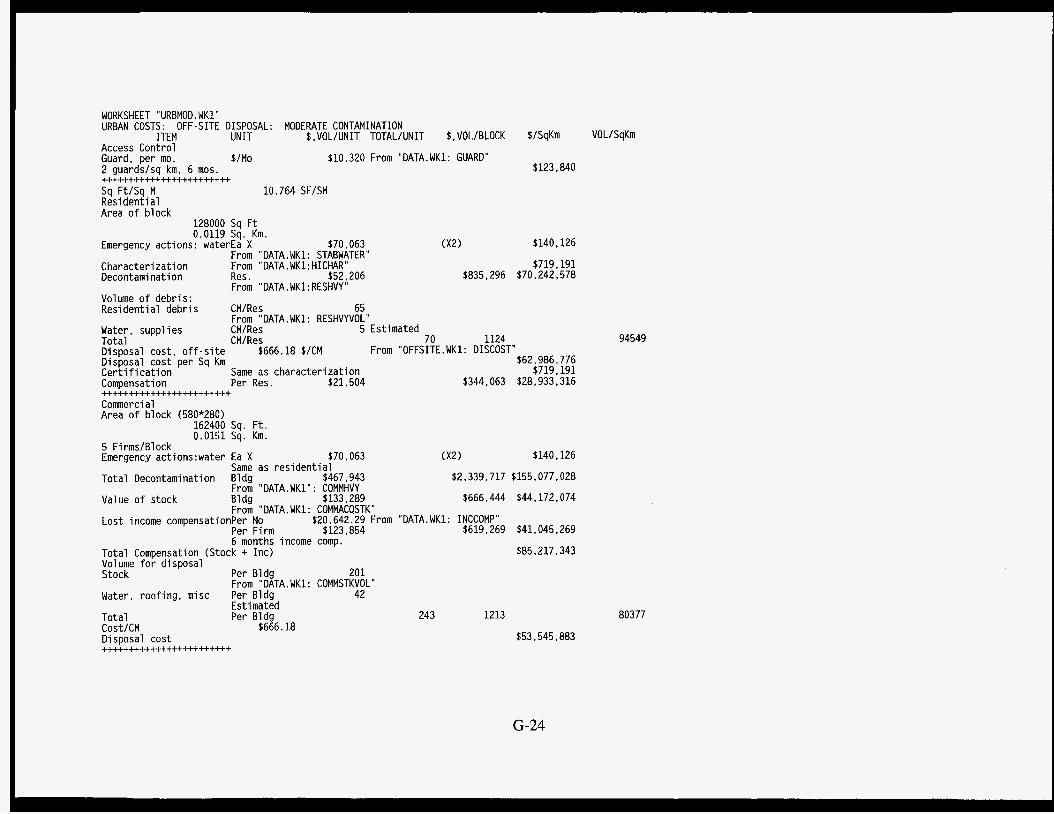
WORKSHEET "URBMOD . WK1"
Access Control Guard, per mo. $/Mo $10,320 From "DATA.WK1: GUARD" 2 guards/sq km, 6 mos.
Sq Ft/Sq M 10.764 SF/SM Residenti a1 Area o f block
128000 Sq F t 0.0119 Sq. Km.
Emergency actions: waterEa X $70,063
URBAN COSTS: OFF-SITE DISPOSAL: MODERATE CONTAMINATION ITEM UNIT $ , VOL/UNIT TOTAL/UNIT $, VOL/BLOCK $/SqKm VOL/SqKm
. . . . . . . . . . . . . . . . . . . . . . . .
From "DATA. WK1: STABWATER" From "DATA. WK1: HICHAR" Character izat ion
Decontamination
Volume o f debr is: Residenti a1 debris
Water, supplies Total Disposal cost, o f f - s i t e Disposal cost per Sq Km C e r t i f i c a t i o n Compensation
Commercial . . . . . . . . . . . . . . . . . . . . . . . .
Res. $52,206 From "DATA. WK1: RESHVY"
$123,840
$140,126
$719,191 $835,296 $70,242,578
94549
Same as character izat ion Per Res. $21,504
$719,191 $344,063 $28,933,316
Area o f block (580*280)
5 Firms/Block Emergency actions:water Ea X $70,063 (X2) $140,126
Same as res ident ia l Total Decontamination Bldg $467,943 $2,339.717 $155.077.028
From "DATA. WK1" : COMMHVY Value o f stock B1 dg $133,289 $666,444 $44,172,074
From "DATA. WK1: COMMACQSTK" Lost income compensationPer Mo $20,642.29 From "DATA.WK1: INCCOMP"
Per F i r m $123,854 $619.269 $41,045,269 6 months income comp.
Total Compensation (Stock + Inc) Volume f o r disposal
Water, roo f ing , misc Per Bldg 42
Total Per Bldg Cost/CM $666.18 Disposal cost
162400 Sq. F t . 0.0151 Sq. Kin.
Stock Per Bldg 201 From "DATA. WK1: COMMSTKVOL"
Est i mated
. . . . . . . . . . . . . . . . . . . . . . . .
243
$85,217,343
1213
$53,545,883
80377
G-24
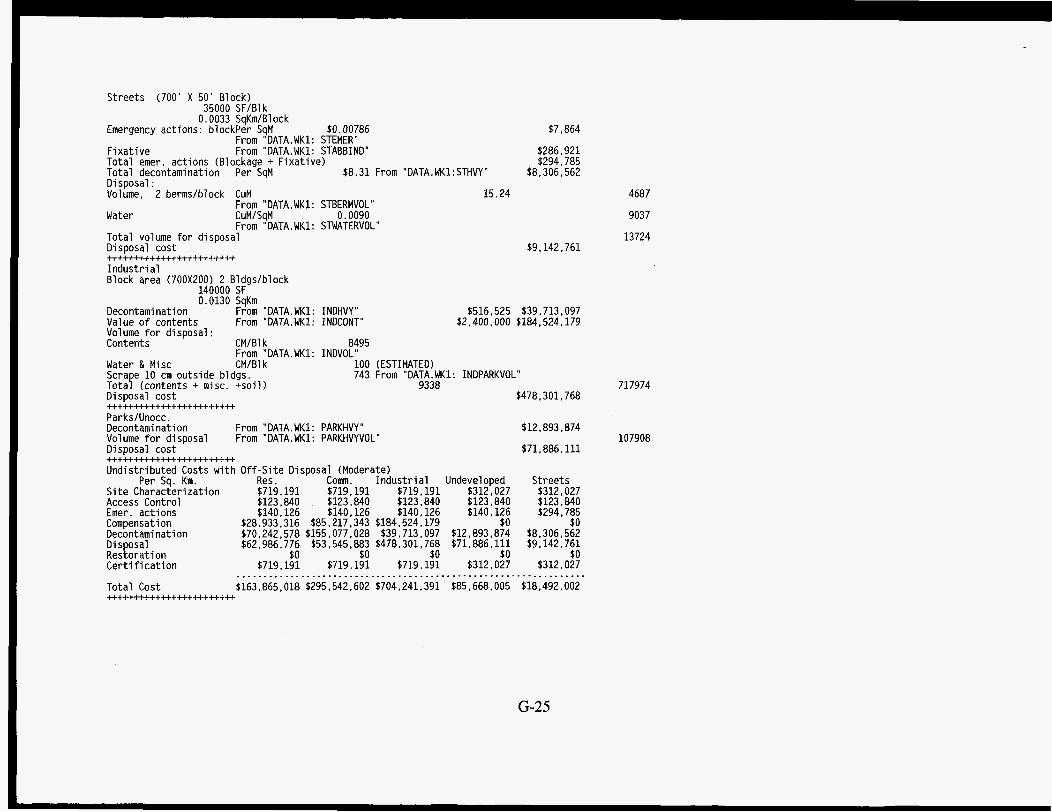
I 15.24
$7,864
$286,921 $294,785
$8,306,562
4687
9037
13724 $9,142,761
Streets (700' X 50' Block) 35000 SF/Blk
Emergency actions: blockper SqM $0.00786 From "DATA.WK1: STEMER"
F ixa t ive From "DATA.WK1: STABBIND" Total emer. actions (Blockage + Fixat ive) Total decontamination Per SqM $8.31 From "DATA. WK1: STHVY" Disposal : Volume, 2 berms/block CUM
0.0033 SqKm/81 ock
From "DATA.WK1: STBERMVOL"
From "DATA.WK1: STWATERVOL" Water CuMISqM 0.0090
Total volume f o r disposal Disposal cost
I ndus t r i a l Block area (700X200) 2 Bldgs/block
Decontamination From "DATA.WK1: INDHVY" Value o f contents From "DATA.WK1: INDCONT" Volume f o r disposal : Contents C M / B l k 8495
Water & Misc CM/B1 k 100 (ESTIMATED) Scra e 10 cm outside bldgs. TotaY (contents + m i x . +so i l ) Disposal cost $478,301,768
..........................
140000 SF 0.0130 SqKm
From "DATA.WK1: INDVOL"
743 From "DATA. WK1: INDPARKVOL" 9338
. . . . . . . . . . . . . . . . . . . . . . . .
$516,525 $39,713,097 $2.400.000 $184,524,179
Parks/Unocc. Decontamination From "DATA.WK1: PARKHVY" Volume f o r disposal From "DATA.WK1: PARKHVYVOL" Disposal cost
Undistr ibuted Costs w i th O f f -S i te D i s Per Sq. Km. Res.
S i t e Characterization $719,191 Access Control $123,840 Emer. act ions $140,126 Compensation $28,933.316 Decontamination $70,242,578 Disposal $62 I 986,776 Restoration $0 Cer t i f i cat ion $719,191
Total Cost $163,865,018
. . . . . . . . . . . . . . . . . . . . . . . .
___._._. ._._.
. . . . . . . . . . . . . . . . . . . . . . . .
iposal (Moderate) Comm. Indus t r i a l $719,191 $719,191 $123,840 $123,840 $140,126 $140,126
585,217,343 $184.524,179 $155,077.028 $39,713,097 $53,545,883 $478,301,768
$0 $0 $719.191 $719.191
$295.542.602 $704.241.391 ......____....--.____....
$12.893.874
$71,886.111
Undeveloped $312,027 $123,840 $140,126
$0 $12,893,874 $71,886,111
$0 $312,027
$85,668.005 . ._.-_..____..
Streets $312,027 $123,840 $294,785
$0 $8,306,562 $9,142,761
$0 $312,027
518,492,002 ..-._.__.....
717974
107908
G-25
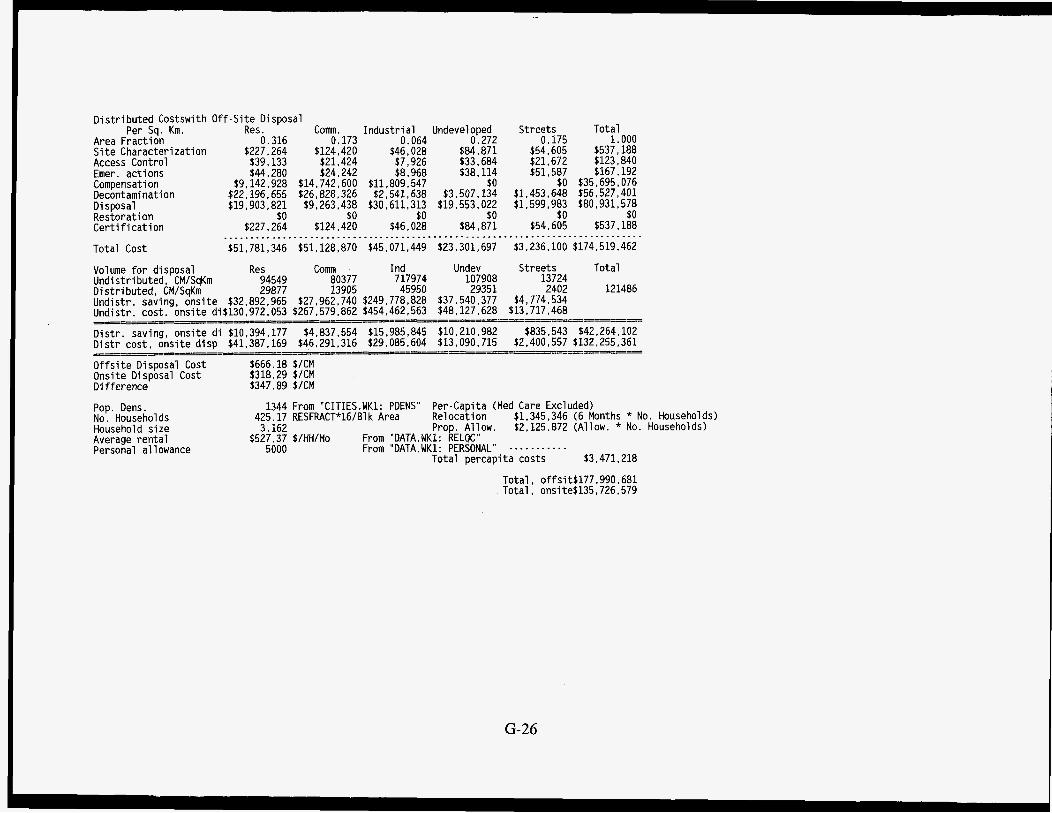
Dis t r ibu ted Costswith O f f - S i t e Disposal
Area Fract ion 0.316 0.173 S i t e Characterization $227,264 $124,420 Access Control $39,133 $21,424 Emer . a c t i ons $44,280 $24,242 Compensation $9,142,928 $14,742,600 Decontamination $22,196,655 $26,828,326 Disposal $19,903,821 $9,263,438 Restorat ion $0 $0 Cer t i f i cat ion $227,264 $124,420
Total Cost $51,781.346 $51,128,870
Per Sq. Km. Res. Comm .
____....._._____..__.....
Indus t r ia l 0.064
$46,028 $7,926 $8,968
$11,809,547 62.541.638
$30,611.313 $0
$46,028
$45,071,449 _______._. . . .
Undeveloped 0.272
$84,871 533,684 $38,114
$0 $3 ~ 507,134
$19,553,022 $0
$84 ~ 871
$23,301,697 ..._......_....
Streets 0.175
$54,605 $21,672 $51,587
SO $1,453,648 $1,599,983
$0 $54,605
$3.236.100 ._._..-..--
Total 1.000
$537,188 $123,840 $167,192
$35,695,076 $56,527,401 $80,931,578
$0 $537,188 .._.......-_.
$174,519,462
Volume f o r disposal Res Comm I nd Undev Streets Total Undistr ibuted, CM/SqKm 94549 80377 717974 107908 13724 D is t r ibu ted , CM/SqKm 29877 13905 45950 29351 2402 121486 Undistr . saving, ons i te $32,892,965 427,962,740 5249,778,828 537,540,377 $4,774,534 Undi s t r . cost. onsi t e d i $130,972,053 $267,579,862 $454,462,563 $48,127,628 $13,717,468
D i s t r . saving, ons i te d i $10,394,177 $4.837.554 115,985,845 $10,210,982 $835.543 $42,264,102 D i s t r cost, ons i te d i sp $41,387,169 $46,291.316 $29.085.604 $13,090,715 $2,400,557 $132,255,361
O f f s i t e Disposal Cost $666.18 $/CM Onsi t e Disposal Cost $318.29 $/CM Di f ference $347.89 $/CM
Pop. Dens. 1344 From "CITIES.WK1: PDENS" Per-Capita (Med Care Excluded) No. Households 425.17 RESFRACT*16/81 k Area Relocation $1,345,346 (6 Months * No. Households) Household s ize 3.162 Prop. Allow. $2,125.872 (Allow. * No. Households) Average ren ta l $527.37 $/HH/Mo From "DATA.WK1: RELOC" Personal a1 lowance 5000 From "DATA. WK1: PERSONAL" - -. - . -. . - . -
---- ---i==iL=--==~==-__----=5-========== --- ____-_____= -- -_- _____=7____-- - -_E__ _I_---_---
Total percapi ta costs 53,471,218
Tota l , offsit$177.990,681 Total , onsite$135,726.579
G-26

WORKSHEET "URBHVY. WK1"
Access Control Guard, per mo. $/Mo 2 guardslsq km. 12 mos. . . . . . . . . . . . . . . . . . . . . . . . . Sq F t l Sq M Acre/SqKm 247.105 ACISqKm Resi dent i a1 Area o f b lock (640' X 200')
128000 Sq F t 0.0119 Sq. Km.
Emergency actions : b i ndeEa X $286,921 From "DATA.WK1: STABBIND"
Characterization From "DATA. WK1: HICHAR" Decontamination Res. $11,239
From "DATA. WK1: RESDEM"
URBAN COSTS: OFF-SITE DISPOSAL: HEAVY CONTAMINATION ITEM UNIT $ ,VOL/UNIT TOTALIUNIT $, VOL/BLOCK $/SqKm
$10,320 From "DATA. WK1: GUARD" $247,680
10.764 SFISM
$573,843
$719,191 $179,828 $15,122,316
Volume o f debris: Residence CM/Res 45
Furnishings CMIRes 10
Water, suppl i e s CMIRes 10
From "DATA. WK1: RESVOL"
From "DATA. WK1: FURNVOL"
From "DATA. WK1: RESLAWNVOL"
Estimated
Lawn s o i l CMIRes 50
Total CM/Res Disposal cost , O f f * S i t e $666.18 $/CM Disposal cost per Sq Km Compensation Residence $/Res $109,226
From "OATA.WK1: RESACQ" Personal ef fects $/Res $21,504
From "DATA.WK1: PERSACQ Total res. compensation Cer t i f i cat ion From "DATA. WK1: LOCHAR" . . . . . . . . . . . . . . . . . . . . . . . .
115 1840 From "OFFSITE.WK1: DISCOST"
$103,087,367
$130,730 $2,091,679 $175,895,665 $312,027
VOLISqKm
154743
G-27

Commercial Area o f block (580*280)
5 Firms/Block
Same as res ident ia l Total Decontamination Bldg $143,036 $715,180 $47,402,324
From "DATA. WK1" : COMMDEM Compensation: Value o f stock Per f i r m $133,289 $666,444 $44,172,074
From "DATA. WK1: COMMACQSTK" Lost income compensationPer Mo
Per Firm $247,707 $1,238,537 $82,090.537 12 months income comp.
Bu i ld ing Per f i r m $1,056,683 From "DATA.WK1: COMMACQBLDG"
162400 Sq. F t . 0.0151 Sq. Km.
Emergency actions: binderEa X $286,921 (X2) $573,843
$20,642 From "DATA. WK1: INCCOMP"
Parking Per firm $49,459 Total Bldg. stock, inc , pkg $1,487,138 $7.435.690 Land:3.73A@25000/A Per block 247.105 Acre/SqKm $93,205 Total $7,528,895 $499,016,939 Volume f o r disposal Bu i ld ing Per bldg 936
From "DATA.WK1: COMMBLDGVOL" Parking l o t Per Bldg 197
From "DATA. WK1: COMMPARKVOL Stock & Equipment Per Bldg 201
From "DATA. WK1: COMMSTKVOL" Water. suml ies , misc Per Bldg 15 . .
Estimated Total Per Bldg Disposal Cost/CM $666.18 Disposal cost
Streets (700' X 50' Block)
0.0033 SqKm/Block Emergency actions: blockper SqM $0.00786
. . . . . . . . . . . . . . . . . . . . . . . . 35000 SF/B1 k
From "OATA.WK1: STEMER"
1348 6741
$297,632,618
F i xa t i ve From "DATA.WK1: STABBIND" Total emer. act ions (Blockage + F ixa t ive) Total decontamination Per SqM $51.36 From "DATA.WK1:STDEM" Disposal : Volume, 2 berms/block CUM
From "DATA.WK1: STBERMVOL" St ree t demo1 i t i o n 0.200 CM/SqM
Water 0.0090 CM/SqM From "DATA.WK1: STDEMVOL"
From "DATA. WK1: STWATERVOL" Total volume f o r disposal Disposal cost Compensation : $/SqKm
From "DATA. WK1: STACQ" . . . . . . . . . . . . . . . . . . . . . . . .
G-28
$7,864
$286,921 $294,785
$51,360,364
15.24
$142,379,235 $47,515,325
446773
4687
200000
9037
213724

I ndus t r i a1 Block area (700X200) 2 Bldgs/block
Decontamination From "DATA.WK1: INDDEM" Value o f contents From "DATA.WK1: INDCONT" Value o f bui ld ings From "DATA.WK1: INDBLDGACQ" Land @20000/Acre Total compensation $/Block Volume f o r disoosal :
140000 SF 3.214 Acre 0.0130 SqKm
$2,989,941 $229,881,839 $2.400.000 $2;400;000
$64,279 $4,864,279 $373,990,465
Contents CM/81 k
Bu i ld ing CM/81 k From "DATA.WK1: INDVOL"
From "DATA. WK1: INDBLDGVOL" Water & Misc CM/81 k Scrape s o i l 10 cm CM/B1 k Total (bu i ld ing +contents + misc.+soi l ) ) Disposal cost
Parks/Unocc . Decontamination From "DATA.WK1: PARKHVY" Volume f o r disposal From "DATA.WK1: PARKHVYVOL" Disposal cost Compensation: @ 15000/A
. . . . . . . . . . . . . . . . . . . . . . . .
8495
2520
80 (Estimated) 1301
12396 $634,911,354
$12,893,874
$71,886,111 $3,706,581
953059
107908
. . . . . . . . . . . . . . . . . . . . . . . . Restoration t o parkland Prepare s o i l $/SqM Plant grass $/SqM Plant t rees $/SqM Total Restoration $/SqM . . . . . . . . . . . . . . . . . . . . . . . .
$3.43 From "DATA. WK1: TOPS $1.51 From "DATA.WK1: GRAS $0.33 From "DATA.WK1: TREE
$5.28 $5,276,008
Undistr ibuted Costs w i th O f f - S i t e Disposal (Heavy)
S i t e Characterization $719,191 $719,191 $719.191 $312,027 $312,027 Access Control $247,680 $247,680 $247.680 $247,680 $247,680 Ewer. act ions $573,843 $573,843 $573.843 $573,843 $294,785 Compensation $175,895,665 $499,016,939 $373,990,465 $3,706,581 $47,515,325 Decontamination $15,122,316 $47,402,324 $229,881,839 $12,893,874 $51,360,384 Disposal $103,087,367 $297,632,618 $634.911.354 $71,886,111 $142,379.235 Restoration $5,276,008 $5,276,008 $5,276,008 65,276,008 $5,276,008 C e r t i f i c a t i o n $312,027 $312,027 $312,027 $312.027 $312,027
Total Cost $301,234.097 $851,180.629 $1,245,912,407 695,208,150 $247,697,471
Per Sq. Km. Res. Comm. Indus t r i a l Undeveloped Streets
.......................................................................... . . . . . . . . . . . . . . . . . . . . . . . .
G-29
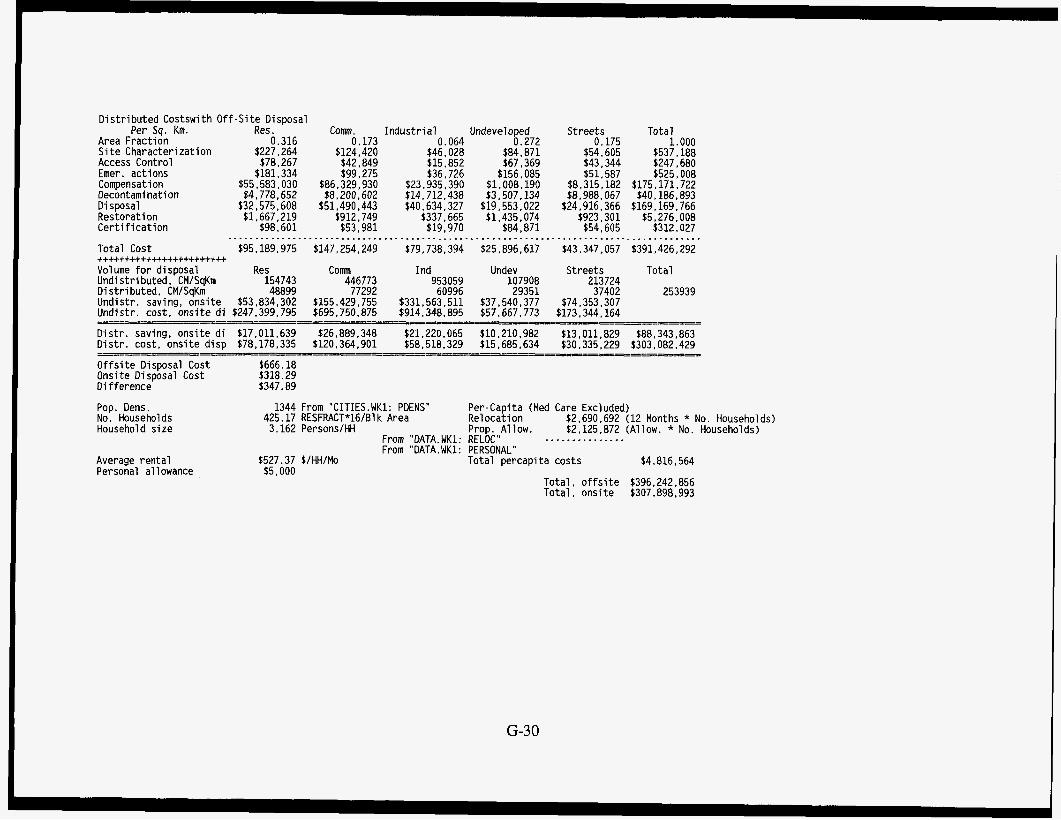
Dis t r ibu ted Costswith O f f
Area Fract ion S i t e Characterization Access Control Emer. actions Compensation Decontamination Disposal Restoration C e r t i f i c a t i o n
Total Cost
Per Sq. Km.
+++++++if++ii++f+fff+++i
- S i t e Disposal Res. Comm. Indust r i a1 Undeveloped
0.316 0,173 0.064 0.272 $227,264 $124,420 $46.028 $84,871 $78,267 $42,849 $15.852 $67,369 $181,334 $99,275 $36,726 $156,085
$55,583,030 $86,329,930 $23.935.390 $1.008.190 $4,778,652 $8,200,602 $14,712,438 $3,507.134 $32,575,608 $51,490,443 540,634,327 $19,553,022 $1,667,219 $912 * 749 $337,665 $1. 435,074
$98,601 $53,981 $19,970 $84,871
$95.189.975 $147,254,249 $79,738,394 $25,896.617 ...........................................................
Volume f o r disposal Res Comm Ind Undev Undistributed, CM/SqKm 154743 446773 953059 107908 Dis t r ibu ted , CM/SqKm 48899 77292 60996 29351 Undistr . saving, ons i te $53,834,302 $155,429.755 $331.563.511 $37,540.377 Undistr . cost , ons i te d i $247.399.795 $695.750.875 $914.348.895 $57.667.773
Streets Total 0.175 1 * 000
$54,605 $537,188 $43 * 344 $247,680 $51,587 $525,008
58,315,182 $175,171.722 $8,988,067 640,186,893 $24,916.366 $169,169,766
$923,301 $5,276,008 $54,605 $312,027
$43,347,057 $391,426,292 ............................
Streets Total 213724
$74,353,307 $173.344.164
37402 253939
_ ~_~ ___ -~ ~ __
D i s t r . saving. ons i te d i $17,011,639 $26,889,348 $21,220,065 $10,210,982 $13,011,829 $88.343.863 D i s t r . cost, ons i te d isp $78,178,335 $120,364,901 $58.518.329 $15,685,634 $30.335.229 5303,082,429
O f f s i t e Disposal Cost 5666.18 Onsite Disposal Cost $318.29 Dif ference 5347.89
Pop. Dens. No. Households Household s ize
Average ren ta l Personal a1 lowance
1344 From "CITIES.WK1: PDENS" Per -Capi t a (Med Care Excluded) 425.17 RESFRACT*l6/Bl k Area Relocation $2.690.692 (12 Months * No. Households) 3.162 Persons/HH Prop. Allow. $2,125,872 (A1 1 ow. * No. Households)
From "DATA. WK1: RELOC" _ _ . _ . . . I . . . _ . . .
From "DATA. WK1: PERSONAL" 5527.37 $/HH/Mo Total percapi ta costs $4,816,564 $5.000
Tota l , o f f s i t e $396,242,856 Total , ons i te $307.898.993
G-30

WORKSHEET "RANGEON. WK1" Rangeland Costs w i th On-Site Disposal
S i te Characterization/Certification
Acquisi t ion: Ranches Total Acqu is i t ion
Access Control
Guards (5 yr, 2 Sq Km/guard) Total Access Control
Ear ly Remediation I r r i g a t i o n (4x1 Windrow
Decontamination Scrape 10 cm Load & haul Total decontamination
D i s osal so i Y Total Disposal
Restoration Return s o i l , add loam Plow and Disk ($40/A) So i l Amendments ($20/A) Seed (Shortgrass P ra i r i e ) ($588/A) I r r i g a t e (4X) Total Restoration
C e r t i f i c a t i o n
TOTAL AREA RELATED COST FOR RANGELAND
Subtotal % o f Tot.
$312,027 0.8%
$84,554 0.2% $84.554 From Worksheet "FARMVAL. WK1"
$10,320 Ea/Mo $309,600 0.8%
$146.036 From Worksheet "DATA. WK1: STABWA $18,137 From Worksheet "DATA.WK1: WINDRO
$164,173 0.4%
$340,067 From Worksheet "DATA.WK1: EXCAV" $375.382 From Worksheet "DATA. WKI.: LOADHA
$715,449 1.9%
$31,828,850 100000 CM * Onsite cost $31,828.850 85.0%
$3,432,139 From Worksheet "DATA.WK1: TDPSOI $9 884 $4,942
$145,298 $146.036 From Worksheet "DATA.WK1: IRRIGA
$3,738,300 10.0%
$312,027 0.8%
537,464,980 100.0%
PER CAPITA (Excl . Medical 1 No. Households : Relocation Personal a1 lowance
0 Persons/SqKm 0
$0 $0
Total per cap i ta
TOTAL Of fs i te Disposal Cost $666.18 Onsite Disposal Cost $318.29 Dif ference $347.89 Increase i n cost f o r offs$34,789,387 TOTAL COST WITH OFFSITE DISPOSAL
$0
$37,464,980
$72,254,367
G-3 1

WORKSHEET "FARMON. WK1" Farmland Costs w i th On-Site Disposal V i l lage fac to r 1344.373 0.00323571
S i t e Character izat i on/Cert312026.9 Compensation : crops 77656.95 Acquis i t ion: Farms Acquis i t i0n:Vi l lages 1.75E+08 Total Acqu is i t ion
Access Control Guards (5 y r , 2 Sq Km/guard) Total Access Control
Subtotal % o f Tot.
$312,027 0.8% $77,657 From Worksheet "DATA.WK1: CROPVAL"
$307,563 From Worksheet "FARMVAL.WK1" $566,805 Vi11 . Fact. X Urban Acq. Cost
$952,024 2.5%
$10,320 Ea/Mo $309,600 0.8%
Emergency Actions Harvest crops I r r i g a t i o n (4X) Windrow
79813.64 36509.1
18136.92
Decontamination Scrape 10 cm 3.400672 Load & haul 3.753818 Farm Bui 1 dings 13159.27 V i 11 ages 41003224 Total decontamination
Disposal Farms ( s o i l ) Farms (bui ld ings) V i 11 ages Total Disposal
318.2885 61.54657 261085.7
Restoration Return s o i l . add loam 3.432139 Plow and Disk ($40/A) 247.1054 So i l Amendments ($20/A) Seed (Longgrass P ra i r i e ) ($588/A) I r r i g a t e (Once) Total Restoration
C e r t i f i c a t i o n
TOTAL AREA RELATED COST FOR FARMLAND
$79.814 From Worksheet "DATA.WK1: HARVEST"
$18.137 From Worksheet "DATA.WK1: WINDROW" $146,036 From Worksheet "DATA.WK1: IRRIGATE" *4
$243,987 0.6%
$340,067 From Worksheet "DATA. WK1: EXCAV" $375,382 From Worksheet "DATA. WK1: LOADHAUL" $32.801 From Worksheet "DATA.WK1:RESDEM"
$132.675 Vi11 . Fact. X Urban Decon. cost $880,925 2.3%
$31.828.850 100000 CM * Onsite cost . . $85,191
$268,889 V i l l . Fact X Urban Vol. X Disp. Cost $32,182,931 82.9%
$3,432.139 From Worksheet "DATA.WK1: TOPSOIL" $9,884 $4.942
$145: 298 $36.509
$3,628,772 9.3%
$312,027 0.8%
$38,822,293 100.0%
G-32

PER CAPITA (Excl. Medical) Total pop densi ty V i 1 1 ages Farm pop densi ty Household s ize 3.162 No. Households : Re1 ocat ion 527.3701 $15.775 Personal allowance 5000 $12.463
Total per capi ta TOTAL Cost o f D f f s i t e Disposal $666.18 $/CM Cost o f Onsite Disposal $318.29 $/CM Dif ference $347.89 $/CM Volume f o r disposal 101112 CM Addit ional cost f o r o f f s i t e d i s os$35,176,401 Total cost w i th o f f s i t e disposa!
_._.._....._
I n f l a t o r , 1988-1995 1.1928
12.2 Persons/SqKm 4.3 7.9
2.5
$28,238 $38,850,531
$74,026,932
G-33
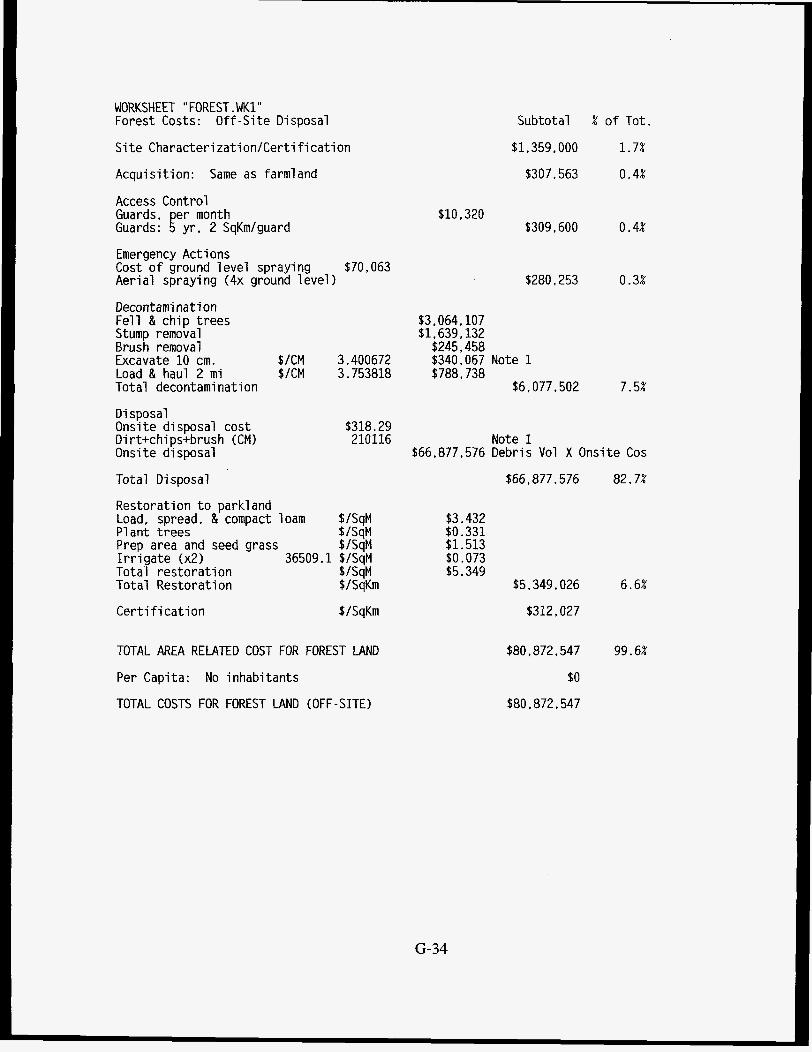
WORKSHEET "FOREST .WK1" Forest Costs: O f f -S i te Disposal
S i te Characteri za t ion lcer t i f i ca t i on
Acquisition: Same as farmland
Access Control Guards, per month Guards: 5 yr, 2 SqKmIguard
Emergency Actions Cost o f ground level spraying Aerial spraying (4x ground level )
$70,063
Decontamination Fe l l & chip trees Stump removal Brush removal Excavate 10 cm. $/CM Load & haul 2 m i $/CM Total decontamination
3.400672 3.753818
Subtotal % o f Tot.
$1,359,000 1.7%
$307,563 0.4%
$10,320 $309,600 0.4%
$280,253 0.3%
$3,064,107 $1,639,132
$245,458 $340,067 Note 1 $788,738
$6,077,502 7.5%
Disposal Onsi t e disposal cost D i rt+chips+brush (CM) Onsi t e disposal
Total Disposal
$318,29 210116 Note 1
$66,877,576 Debris Vol X Onsite Cos
$66.877.576 82.7%
Restoration t o parkland Load, spread, & compact loam P1 ant trees Prep area and seed grass I r r i g a t e (x2) Total restorat ion Total Restoration
Cer t i f i ca t i on
$/SqM
$/SqM
$/SqM $/SqKm
$/SqM
36509.1 $/SqM
$/SqKm
TOTAL AREA RELATED COST FOR FOREST LAND
Per Capita: No inhabitants
TOTAL COSTS FOR FOREST LAND (OFF-SITE)
$3.432 $0.331 $1.513 $0.073 $5.349
$5,349,026
$312,027
6.6%
$80,872,547
$0
$80,872,547
99.6%
G-34

PERIMETER- RELATED COSTS: 15 meter wide perimeter clearing Fell & ch ip trees $3,064,107 $ / M Clear brush $245,458 $/M Load & haul $3.754 $/M Fencing $IM Total fencing: $ l M
$45.96 $3.68 $6.20
$76.12 $131.96
10.7639 SqFt/SqM 35.31467 Cu F t ICu M
Note 1: Volume of Debris Trees: Cyl. 2 f t diam. x 30 f t . h igh
Branches, twigs, leaves, equal t o t r u n k Total each tree Trees @ 30 f t spacing, Brush, stumps, fallen logs (Estimated) Dirt Total debris
Cone 2 f t . diam 30 f t . high Total trunk
11959.9 TreesISqKm
G-35
2.6688 Cu. M 0.8896 C u . M
7.1168 Cu. M 85116 Cu. M 25000 Cu. M
100000 Cu. M 210116 C u . M
3.5584 CU. M 3.5584 CU. M
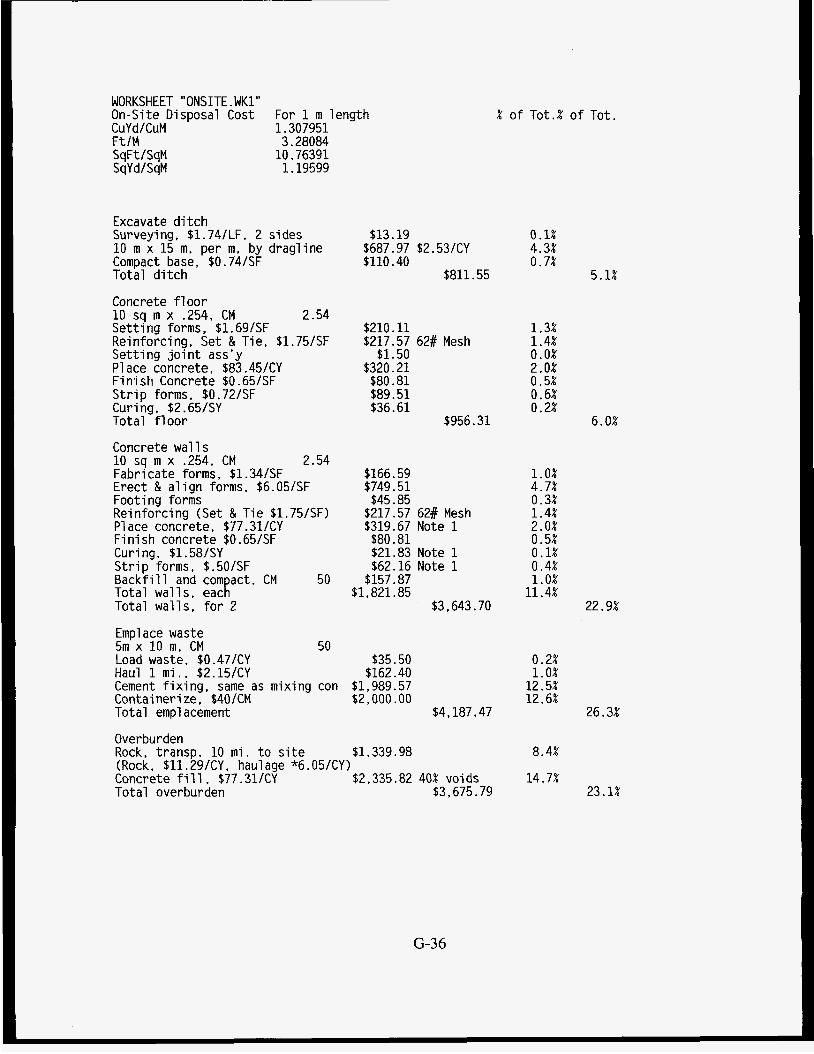
WORKSHEET "ONSITE. WK1" On-Site Disposal Cost CuYdICuM 1.307951 Ft/M 3.28084
For 1 m length
SqFt /SqM SqY d/SqM
10.76391 1.19599
Excavate d i t ch Surveying , $1.74/LF, 2 si des 10 m x 15 m. per m , by dragline Compact base, $0.74/SF Total d i tch
Concrete f loo r 10 sq m x -254, CM 2.54 Se t t i ng forms, $1.69/SF Reinforcing, Se t & Tie, $1.75/SF Se t t ing j o i n t a s s ' y P1 ace concrete, $83.45/CY F i n i s h Concrete $Of65/SF S t r i p forms, $0.72/SF Curing, $2.65/SY Total f l oo r
Concrete wall s 10 sq m x .254, CM Fabricate forms, $1.34/SF Erect & a l ign forms, $6.05/SF Footing forms Reinforcing (Set & Tie $1.75/SF) P1 ace concrete, $77.31/CY F i n i s h concrete $0.65/SF Curing, $1.58/SY S t r i p forms, $.50/SF Backfill and compact, CM 50 Total wall s, each Total walls, fo r 2
2.54
Empl ace waste 5m x 10 m , CM 50 Load waste, $0.47/CY Haul 1 m i . , $2.15/CY Cement f ix ing , same as mixing con Containerize. $40/CM Total emplacement
Overburden
$13.19 $687.97 $2.53/CY $110.40
$811.55
$210.11 $217.57 62# Mesh
$1.50 $320.21 $80.81 $89.51 $36.61
$956.31
$166.59 $749.51 $45.85
$217.57 62# Mesh $319.67 Note i $80.81 $21.83 Note 1 $62.16 Note 1
$157.87 $1,821.85
$3,643.70
$35.50 $162.40
$1,989.57 $2,000.00
$4,187.47
Rock, t ransp . 10 m i . t o si te $1,339.98 (Rock, $11.29/CY, haulage *6.05/CY) Concrete f i l l , $77.31/CY $2,335.82 40% voids Total overburden $3,675.79
G-36
% of Tot.% of Tot.
0.1% 4.3% 0.7%
1.3% 1.4% 0.0% 2.0% 0.5% 0.6% 0.2%
1.0% 4.7% 0.3% 1.4% 2.0% 0.5% 0.1% 0.4% 1.0%
11.4%
0.2% 1.0%
12.5% 12.6%
8.4%
14.7%
5.1%
6.0%
22.9%
26.3%
23.1%
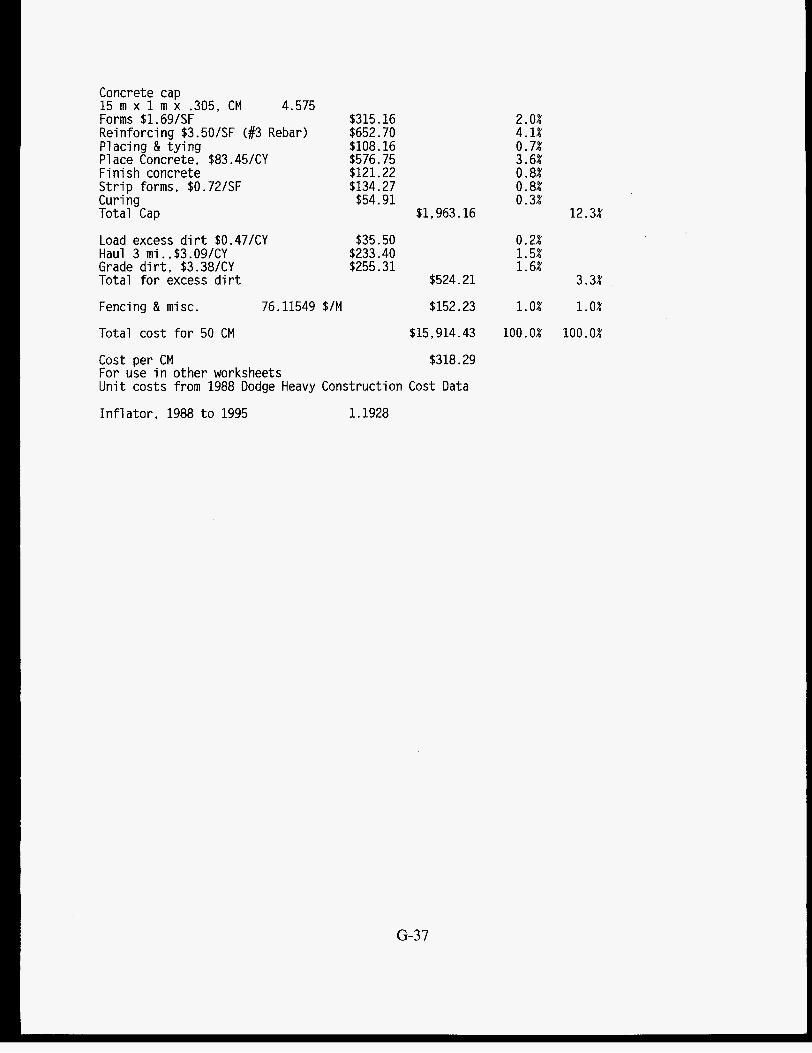
Concrete cap 15 m x 1 m x .305, CM 4.575 Forms $1.69/SF $315.16 Reinforcing $3.50/SF (#3 Rebar) $652.70 Placing & tying $108.16 P1 ace Concrete, $83.45/ CY $576.75 Finish concrete $121.22 Strip forms, $0.72/SF $134.27 Curing $54.91 Total Cap
Load excess di r t $0.47/CY $35.50 Haul 3 m i . ,$3.09/CY $233,40 Grade di r t , $3.38/ CY $255.31 Total for excess dirt
Fencing 81 misc. 76.11549 $/M
Total cost for 50 CM
2.0% 4.1% 0.7% 3.6% 0.8% 0.8% 0.3%
$1,963.16
0.2% 1.5% 1.6%
$524.21
$152.23 1.0%
$15,914.43 100.0%
Cost per CM $318.29 For use i n other worksheets U n i t costs from 1988 Dodge Heavy Construction Cost Data
Inflator, 1988 t o 1995 1.1928
12.3%
3.3%
1.0%
100.0%
G-37

WORKSHEET OFFSITE.WK1 Transportation cost A1 lowabl e wt .=45,000# Cu Ydl Cu M
Ship waste on trip-lease Freightage, $3500; 1000 mi. B $3.50lmi. Return containers (4 per trip) Loading & unl oadi ng ( $ .48/CY, twice) Container-$7000, 50 trips Fasten down cover, .5 hr. .2 riggers,$l9.90lhr Load on truck bed, same Crane & operator, 1 hr. B $192.17/hr
Total trip cost Cost per CY (trip costl16.67) Cost per CM Empl acement cost Cost per CUM
Inflator, 1988 to 1995 1.1928
16.67 CY (NO0 pcf) 1.308 CY ICM
Per trip
$3,500.00 $875.00 $19.08 $140.00 $23.74 $23.74 $229.22
$4.810.78 $288.65 $377.54 $288.00 $666.18
_ _ _ _ - - - - - -
G-38

WORKSHEET “FARMVAL . WK1 I‘ U n i t Value o f Farm Assets
S t a t e Assets Acreage Sq. Km.
IL 5.08E+10 2.80E+07 l.llE+05 OH 2.41E+10 1.50E+07 5.95E+04 MI 1.56E+10 1.03E+07 4.09E+04 MN 3.55E+10 2.66E+07 1.06E+05 IN 2.64E+10 1.60E+07 6.35E+04 IA 5.41E+10 3.30E+07 1.31E+05 NE 3.61E+10 4.70E+07 1.87E+05 KS 3.07E+10 4.80E+07 1.90E+05
’ a . $
Tota l s 2.73E+ll 8.88E+05
Val ue/Sq . Km. 3.08E+05
RANGELAND NM 1.12E+10 4.40E+07 1.75E+05 ID 1.18E+10 1.39E+07 5.52E+04 WY 6.56E+09 3.36E+07 1.33E+05
AZ 1.13E+10 3.60E+07 1.43E+05 NV 2.78E+09 9.00E+06 3.57E+04
Tota l s 4.95E+10 5.85E+05
UT 5. a6~+09 1. io~+o7 4.37~+04
Val ue/Sq. Km. a. 46~+04 Data from Bureau of Census, 1994. Assets for 1992 (Table 1096) Not a d j u s t e d for i n f l a t i o n or farm d Acreage for 1993 (Table 1084)
G-39
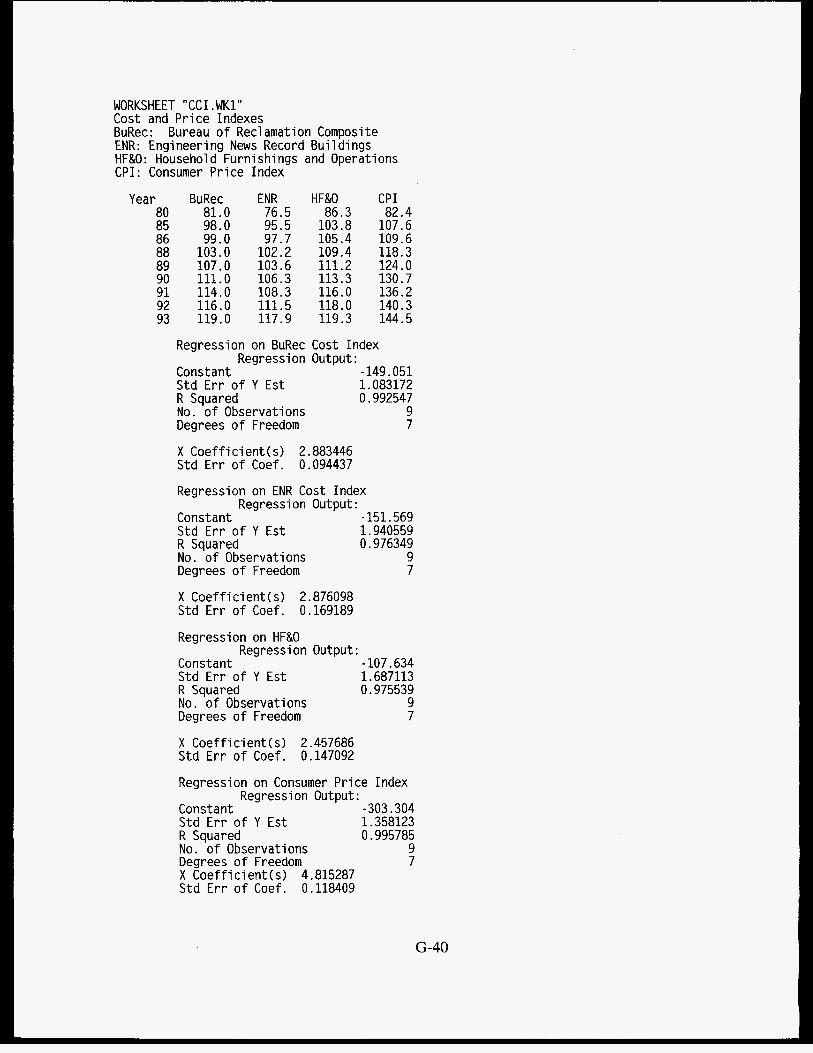
WORKSHEET "CCI .WK1" Cost and Price Indexes BuRec: Bureau of Reclamation Composite ENR: Engi neeri ng News Record Bui 1 dings HF&O: Household Furnishings and Operations CPI: Consumer Price Index
Year 80 85 86 88 89 90 91 92 93
BuRec 81.0 98.0 99.0
103.0 107.0 111.0 114.0 116.0 119.0
ENR HF&O 76.5 86.3 95.5 103.8 97.7 105.4
102.2 109.4 103.6 111.2 106.3 113.3 108.3 116.0 111.5 118.0 117.9 119.3
CPI 82.4
107.6 109.6 118.3 124.0 130.7 136.2 140.3 144.5
Regression on BuRec Cost Index Regression Output:
Constant - 149.051 Std Err of Y Est 1.083172 R Squared 0.992547 No. of Observations 9 Degrees of Freedom 7
X Coefficient(s1 2.883446 Std Err o f Coef. 0.094437
Regression on ENR Cost Index Regression Output:
Constant - 151.569 Std Err of Y Est 1.940559 R Squared 0.976349 No. of Observations 9 Degrees of Freedom 7
X Coefficient(s1 2.876098 Std Err o f Coef. 0.169189
Regression on HF&O Regression Output:
Constant - 107.634 Std Err of Y Est 1.687113 R Squared 0.975539 No. o f Observations 9 Degrees of Freedom 7
X Coefficient(s1 2.457686 Std Err of Coef. 0.147092
Regression on Consumer Price Index Regression Output:
Constant - 303.304 Std Err of Y Est 1.358123 R Squared 0.995785 No. o f Observations 9 Degrees of Freedom 7 X Coefficient (s1 4.815287 Std Err of Coef. 0.118409
G-40

I n f l a to rs Cal CUI ated from Regression 1 ines Year I n f ( BuRecInf (ENR) I n f (HF&O) I n f (CPI 1
75 1.86 1.90 1.64 2.66 76 77 78 79
1.78 1.71 1.65 1.59
1.82 1.74 1.67 1.61
1.59 1.54 1.50 1.45
80 1.53 1.55 1.41 81 1.48 1.49 1.38 82 1.43 1.44 1.34 83 1.38 1.40 1.31 84 1.34 1.35 1.27 85 1.30 1.31 1.24 86 1.26 1.27 1.21 87 1.23 1.23 1.19 88 1.19 1.20 1.16 89 1.16 1.17 1.13 90 1.13 1.13 1.11 91 1.10 1.10 1.08 92 1.07 1.08 1.06 93 1.05 1.05 1.04 94 1.02 1.02 1.02 95 1.00 1.00 1.00
For use i n Worksheet "DATA.WK1"
2.46 2.28 2.13 2.00 1.88 1.78 1.68 1.60 1.52 1.45 1.39 1.33 1.28 1.23 1.19 1.14 1.10 1.07 1.03 1 .00
G-4 1
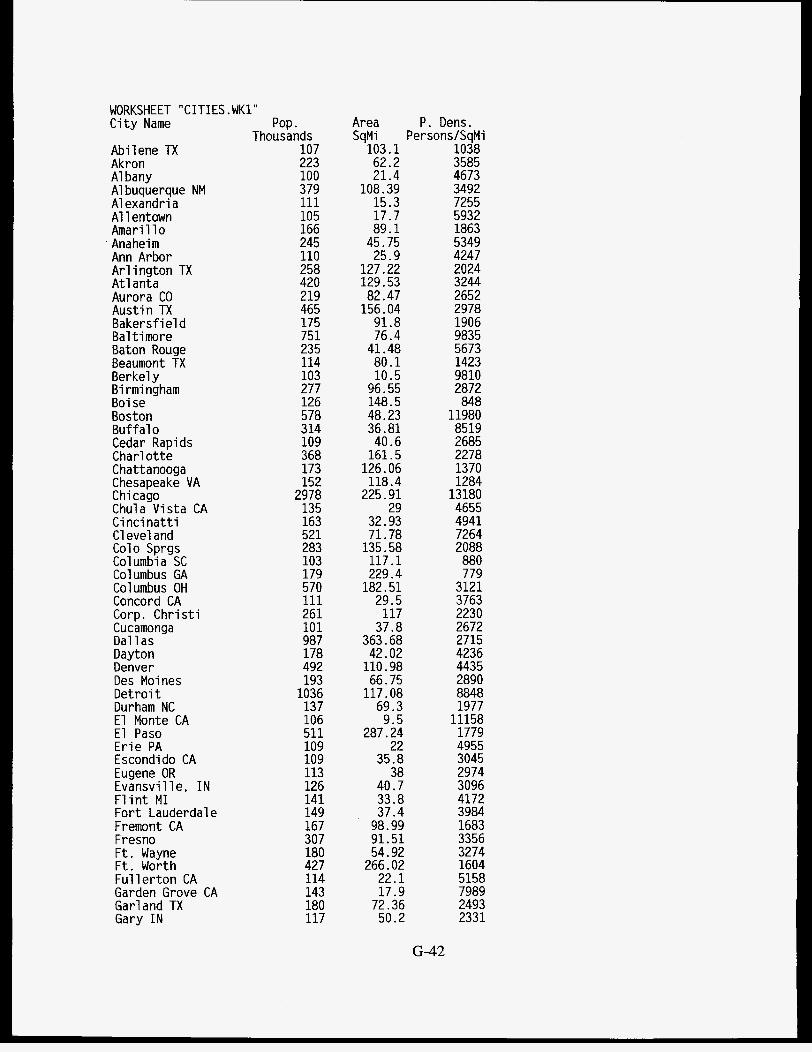
WORKSHEET "CITIES .WK1" C i t y Name
Abilene TX Akron A1 bany A1 buquerque NM A1 exandri a A1 1 entown Amaril lo Anaheim Ann Arbor A r l i ngton TX A t 1 anta Aurora CO Austin TX Bakersfield Baltimore Baton Rouge Beaumont TX Berkel y B i r m i ngham Boise Boston Buf fa1 o Cedar Rapids Char1 o t t e Chattanooga Chesapeake VA Chicago Chula Vista CA C inc ina t t i C1 eve1 and Colo Sprgs Columbia SC Columbus GA Columbus OH Concord CA Corp. Chri s t i Cucamonga D a l l as Dayton Denver Des Moines Det ro i t Durham NC E l Monte CA E l Paso Er ie PA Escondido CA Eugene OR Evansvil le, I N F1 i n t M I Fort Lauderdal e Fremont CA Fresno F t . Wayne F t . Worth Fu l le r ton CA Garden Grove CA Garland TX Gary I N
Pop. Thousands
107 223 100 379 111 105 166 245 110 258 420 219 465 175 751 235 114 103 277 126 578 314 109 368 173 152
2978 135 163 521 283 103 179 570 111 261 101 987 178 492 193
1036 137 106 511 109 109 113 126 141 149 167 307 180 427 114 143 180 117
21.4 108.39
15.3 17.7 89.1
45.75 25.9
127.22 129.53 82.47
156.04 91.8 76.4
41.48 80.1 10.5
96.55 148.5 48.23 36.81 40.6
161.5 126.06
118.4 225.91
29 32.93 71.78
135.58 117.1 229.4
182.51 29.5
117 37.8
363.68 42.02
110.98 66.75
117.08 69.3
9.5 287.24
22 35.8
38 40.7 33.8 37.4
98.99 91.51 54.92
266.02 22.1 17.9
72.36 50.2
Area P. Dens. SqMi PersonsISqMi
103.1 1038 62.2 3585
4673 3492 7255 5932 1863 5349 4247 2024 3244 2652 2978 1906 9835 5673 1423 9810 2872 848
8519 2685 2278 1370 1284
13180 4655 4941 7264 2088 880 779
3121 3763 2230 2672 2715 4236 4435 2890 8848 1977
11158 1779 4955 3045 2974 3096 4172 3984 1683 3356 3274 1604 5158 7989 2493 2331
11980
G-42
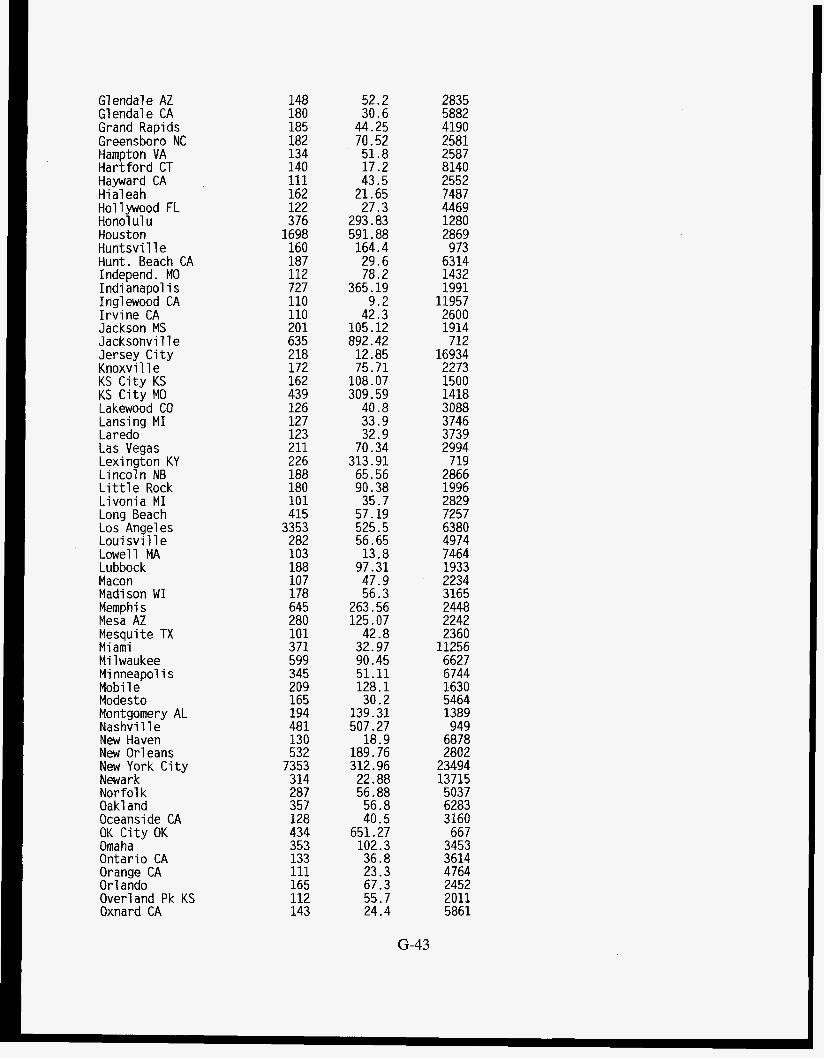
Glendale AZ Glendale CA Grand Rapids Greensboro NC Hampton VA Hartford CT Hayward CA Hialeah Hol 1 ywood FL Honolulu Houston Huntsvi 11 e Hunt. Beach CA Independ. MO Indi anapol i s Ingl ewood CA I r v ine CA Jackson MS Jacksonvi 11 e Jersey City Knoxvi 1 1 e KS City KS KS City MO Lakewood CO Lansing M I Laredo Las Vegas Lexington KY Lincol n N8 L i t t l e Rock Livonia M I Long Beach Los Angeles Loui svi 11 e Lowell MA Lubbock Macon Madison W I Memphis Mesa AZ Mesquite TX M i am i M i 1 waukee M i nneapol i s Mobi 1 e Modesto Montgomery AL Nashvi 11 e New Haven New Orleans New York C i t y Newark Norfolk Oak1 and Oceanside CA OK Ci ty OK Omaha Ontario CA Orange CA Or1 ando Overland Pk KS Oxnard CA
148 180 185 182 134 140 111 162 122 376
1698 160 187 112 727 110 110 201 635 218 172 162 439 126 127 123 211 226 188 180 101 415
3353 282 103 188 107 178 645 280 101 371 599 345 209 165 194 481 130 532
7353 314 287 357 128 434 353 133 111 165 112 143
52.2 30.6
44.25 70.52 51.8 17.2 43.5
21.65 27.3
293.83 591.88 164.4 29.6 78.2
365.19 9.2
42.3 105.12 892.42
12.85 75.71
108.07 309.59
40.8 33.9 32.9
70.34 313.91 65.56 90.38 35.7
57.19 525.5 56.65 13.8
97.31 47.9 56.3
263.56 125.07
42.8 32.97 90.45 51.11 128.1 30.2
139.31 507.27
18.9 189.76 312.96 22.88 56.88 56.8 40.5
651.27 102.3 36.8 23.3 67.3 55.7 24.4
2835 5882 4190 2581 2587 8140 2552 7487 4469 1280 2869 973
6314 1432 1991
11957 2600 1914 712
16934 2273 1500 1418 3088 3746 3739 2994
719 2866 1996 2829 7257 6380 4974 7464 1933 2234 3165 2448 2242 2360
11256 6627 6744 1630 5464 1389 949
6878 2802
23494 13715 5037 6283 3160 667
3453 3614 4764 2452 2011 5861
G-43
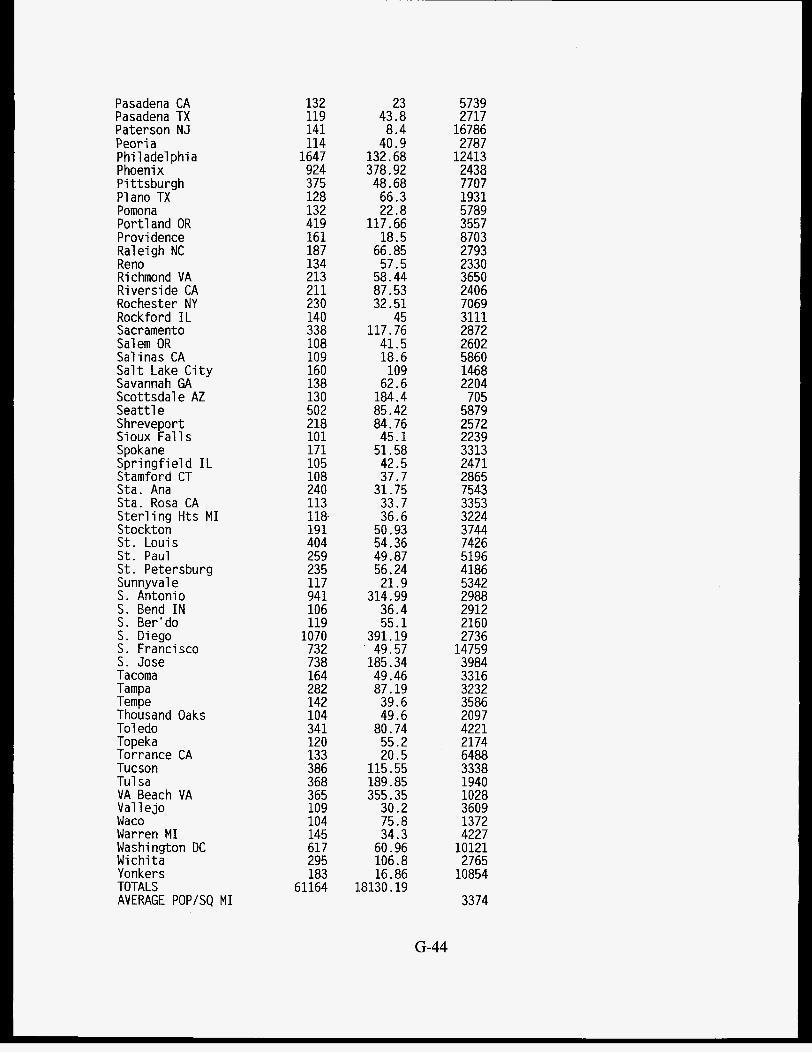
Pasadena CA Pasadena TX Paterson NJ Peoria Phi 1 adel phi a Phoenix Pittsburgh Plano TX Pomona Portland OR Providence Raleigh NC Reno Richmond VA Riverside CA Rochester NY Rockford IL Sacramento Salem OR Salinas CA S a l t Lake City Savannah GA Scottsdal e A2 Seatt le S hreveport Sioux Fal ls Spokane Spr ingf ie ld I L Stamford CT S t a . Ana S t a . Rosa CA Ster l ing Hts M I Stockton S t . Louis S t . Paul S t . Petersburg Sunnyvale S. Antonio S. Bend I N S. Ber'do S. Diego S . Francisco S. Jose Tacoma Tampa Tempe Thousand Oaks To1 edo Topeka Torrance CA Tucson Tu1 sa VA Beach VA Val 1 e j o Wac0 Warren M I Washington DC Wichita Yonkers TOTALS AVERAGE POP/SQ M I
132 119 141 114
1647 924 375 128 132 419 161 187 134 213 211
23 43.8 8.4
40.9 132.68 378.92 48.68
66.3 22.8
117.66 18.5
66.85 57.5
58.44 87.53
230 32.51 140 45 338 117.76 108 41.5 109 18.6 160 109 138 62.6 130 184.4 502 85.42 218 84.76 101 45.1 171 51.58 105 42.5 108 37.7 240 31.75 113 33.7 118 36.6 191 50.93 404 54.36 259 49.87 235 56.24 117 21.9 941 314.99 106 36.4 119 55.1
1070 391.19 732 49.57 738 185.34
5739 2717
16786 2787
12413 2438 7707 1931 5789 3557 8703 2793 2330 3650 2406 7069 3111 2872 2602 5860 1468 2204
705 5879 2572 2239 3313 2471 2865 7543 3353 3224 3 744 7426 5196 4186 5342 2988 2912 2160 2736
14759 3984
164 282 142 104 341 120 133 386 368 365 109 104 145 617 295 183
61164
49.46 87.19 39.6 49.6
80.74 55.2 20.5
115.55 189.85 355.35
30.2 75.8 34.3
60,96 106.8 16.86
18130.19
3316 3232 3586 2097 4221 2174 6488 3338 1940 1028 3609 1372 4227
10121 2765
10854
3374
G-44
Appendix H
Historical Experience Regarding Medical Costs The majority of the epidemiological information on the cancer risks which can result from radiation exposure come from studies involving gamma radiation (low-LET) and X-rays. Most of the available information on the cancer-causing potential of high-LET radiation produced by plutonium has been obtained from alpha-emitting isotopes of radium, radon, and thorium (National Academy of Sciences, 1988). There is very little information available on the cancer risks which result specifically from plutonium.
The best source of data on the cancer-causing potential of plutonium is a long-term study of 26 individuals who worked with 2 3 ~ u during World War I1 at Los Alamos. Estimates of the total plutonium body burdens as of 1987 or at the time of death ranged from 1.4 to 86 nCi (52 to 3 180 Bq, with a median value of 13.5 nCi (500 Bq). After 42 years of follow-up, only one cancer among that group, a bone sarcoma which proved fatal, appears to be attributable to the early plutonium exposure by inhalation. However, Voelz and Lawrence (1991) state that the plutonium deposition in that subject, with an estimated body burden of 15.1 nCi (560 Bq) at the time of death, I ' i s estimated to have been below current guidelines for allowable exposures," indicating that even low exposures to plutonium among the public could warrant long-term medical follow- up for the exposed population.
The bone sarcoma subject is estimated to have received approximately 5 rem effective dose in the forty years following the plutonium intake, a level of exposure the same as the current DOE annual limit on intake established for radiation workers. The current DOE exposure criterion is based on previous recommendations of the ICRP. The ICRP (1991b) has since revised the ALI for 239Pu and % v u , decreasing it by a factor of two, but at this writing the revision has not yet been adopted by the DOE. The ALI represents an upper bound on exposures in the workplace, which must be maintained As Low As Reasonably Achievable (ALARA).
The U.S. experience in the long-term medical monitoring of individuals exposed to radiation dates back to the epidemiological studies of the atom bomb survivors of Hiroshima and Nagasaki by the Atomic Bomb Casualty Commission and its successor, the Radiation Effects Research Foundation (RERF). Those long-term epidemiological studies have provided the principal bases of the dose-response relationships used by the ICRP and other organizations for setting radiation protection standards.
A fixed population of 73,330 atomic bomb survivors is being tracked by the RERF (Neriishi et al., 1991). Eddington (1994) provided information on the cost of the epidemiological program being conducted. Diagnostic medical examinations are provided every other year to approximate- ly one half of the study population. The RERF provides no medical treatment and no compensation for health effects. The annual budget of the RERF, currently 4.3 billion yen, is
H- 1

shared by Japan and the United States. Converting to U.S. currency at the exchange rate of 100 I yen to the dollar, the annual cost of conducting the program in Japan is $587 per-capita for the 73,300 individuals being studied.
Outside of the U.S., evidence of the possible need to provide long-term medical monitoring for a large number of individuals is the fact that Switzerland implemented a law requiring that all nuclear workers, defined as persons subject to the possibility of radiation exposure in the workplace, are required to be provided with annual medical checkups. The annual checkups include a personal history, physical examination, and blood counts (Weickhardt, 1991).
Inquiries into U.S. government-paid medical treatment of radiation exposed individuals identified only one example of such a program. As a result of atmospheric testing of nuclear weapons by the U.S., residents of the northern Marshall Islands were exposed to radiation and subjected to multiple relocations. Titus (1986) gives an extensive account of the associated history. Since 1954 the Medical Department of Brookhaven National Laboratory has been providing free medical care and assessments of the radiation doses received by those residents (Sun et al., 1994).
It is standard health physics practice to quantify plutonium body burdens at the level of the ICRP (1991b) ALI, 2.5 rem. Many laboratories are capable of conducting the analyses; but there could be numerous inconveniences for the individuals being screened. Plutonium excretion rates, even in a single individual, can vary markedly over time (Voelz and Lawrence, 1991). Also, because the quantities of plutonium in the urine at the level of the ALI are so low, cross-contamination from plutonium in the air can occur, even at laboratories with the best reputation for quality.
For quantification of exposures below the ALI a new technology, "fission track analysis" (Boecker et aL, 1991; Sun et aL, 1994) is being used to quantify extremely low levels of plutonium exposure. This technology was developed partly in response to litigation brought by atomic veterans, some of whom incurred exposures during the atmospheric nuclear tests described in Appendix E. Fission track analysis of voided urine is claimed to be so sensitive that it can quantify plutonium body burdens resulting from "background" levels in the environment resulting from the global fallout produced by past atmospheric nuclear testing.
At present, very few laboratories utilize fission track analysis to quantify plutonium body burdens. The estimation of body burdens requires the use of metabolic models which specify the excretion rate of plutonium from the body as a function of time after intake. Those metabolic models are partially based on experiments in which human subjects were injected with plutonium (Sun, 1993). It is possible that plutonium excretion rates in a single individual could vary over time. It is also possible that the excretion rates of plutonium could vary among different individuals.
These variations would introduce uncertainty into the quantification of plutonium body burdens but there appears to be little data on how large these uncertainties might be. The possibility of this problem's occurrence is supported by a recent event where the application of standard
H-2

metabolic models to a radiation worker with an unusual metabolism led to the underestimation of his uranium body burden by two orders of magnitude (DOE, 1994d).’
The body burdens in the northern Marshall Islanders are periodically evaluated with lung counts and fission track analyses of voided urine. Those analyses are performed on a U.S. ship anchored offshore. Sun et aZ. (1993) discusses some of the problems that were encountered in the past when the study population was asked to provide urine samples under unsupervised conditions. The revised protocol for urine sample collection calls for the study individuals to wear provided clothing after being decontaminated by showering. For the 24-hour collection period, they are housed in special quarters on the ship to which access is restricted.
Shinn (1994) stated that the entire population of Palomares, Spain is provided with annual evaluations of plutonium body burdens. These exams continue despite that fact that ambient air concentrations of plutonium in the region have declined to a very low level. The subjects are transported to Madrid on a rotating schedule and housed for several days in order to perform lung counts and urine analyses. The U.S. contributes some of the funds for this program.
An expansion in the scope of medical monitoring programs for U.S. citizens occurred in August 1989, when, in response to a lawsuit by residents near the Fernald Plant, the DOE agreed to a settlement in the amount of $78 million. The residents alleged that they suffered adverse health effects and mental anguish from the plant’s releases of radioactive materials to the environment, principally natural uranium. A major portion of the settlement funds was allocated for the establishment of a program to provide for medical examinations of the nearby residents and the creation of a registry to assemble epidemiological data, see Appendix A.
As the result of legislation, compensation is being paid by the U.S. government to uranium miners and persons exposed to radiation during atmospheric testing of nuclear weapons who develop a health effect that is attributable to the radiation exposure. The list of attributable effects is defined by the government. In FY93, $171 million was appropriated to the Radiation Exposure Compensation Trust Fund and $57 million was paid out for the 947 claims approved that year. The average payment was thus $60,000 per-capita (Office of the President, 1994).
Because of variability in a single individual’s plutonium excretion rate, multiple samples would need to be analyzed. The Los Alamos National Laboratory procedures for the quantification of an individual’s plutonium body burden require five samples of urine, each voided over a 24-hour period (ibid.). In past years, workers undergoing the assessment were housed in a hospital or clinic setting for each 24-hour period, but the high costs, including absence from work, led to a change of procedures. Currently, workers undergoing the assessment are given plastic bottles to carry with them during the sampling period.
’ The urine of the individual in question had a pH of 10, while pH values for a normal adult are typically 6. The initial committed effective dose estimate of 82 mrem was later revised to 23.53 rem after extensive laboratory tests and analysis by a multi-organizational team.
H-3

If the plutonium were in a very insoluble form, excretion rates might be so low as to introduce large uncertainties in the estimated amount of intake. Voelz (1994) indicated that urine analyses would probably be supplemented with in vivo measurements of radiation emitted from the lungs of the subject. There are few facilities in the U.S. which have the capability to perform lung count analyses. Consideration of the possible costs of transportation, housing, and lost income during such evaluations indicate that the costs of performing lung counts could be very high, in terms of both monetary cost and the inconvenience to the subjects.
We believe it is doubtful that screening tests for all individuals within the interdicted area would be scientifically useful, or even medically beneficial. Every test is subject to some errors, including "false positives." Most individuals in the region would be expected to have only minimal plutonium body burdens. In considering the medical ramifications of large-scale screening, the potential harm caused by false positives would need to be balanced against the benefits to each individual being screened.
Consideration of the factors which have been discussed indicates that costs would be incurred in the performance of medical monitoring and assessment for exposed individuals. However, because of the large uncertainty in the number of individuals who might be included in the screening program, and the costs of conducting such a program, the associated expenses cannot be quantified at this time. The generation of such estimates would require additional research.
H-4
Bibliography Note: This bibliography comprises all of the references cited in this report, including the appendices. All of the references have been located contiguously in order to maximize the benefit to other researchers, and to minimize the length of the report.
I Aarkrog, A. (197 l), "Radioecological Investigations of Plutonium in an Arctic Marine Environment," Health Physics, Vol. 20, (January), pp. 31-47.
Adler, Vernon (1993, Personal communication, Federal Emergency Management Agency, Washington, DC.
Adriano, D. C. and J. E. Pinder I11 (1980), "The Effect of Plowing on 241Am Contamination in Sandy Soil," Health Physics, Vol. 38, pp. 699-703.
Agency for Toxic Substances and Disease Registry (1995a), Public Health Assessment for Hanford 1100-Area (USDOE), Richland, Benton County, Washington, for Public Comments, CERCLIS No. WA4890090075, Public Health Service, Atlanta, GA.
Agency for Toxic Substances and Disease Registry (1995b), "Notice of Intent to Revise the Public Health Assessment Process," Federal Register, June 8, 1995, Vol. 60, No. 110, pp. 30303-30304.
Agency for Toxic Substances and Disease Registry (1995c), "Proposed Procedures for Combined Analyses of the Great Lakes Human Health Effects Research Program," Federal Register, June 27, 1995, Vol. 60, No. 123, pp. 33217-33219.
Allot, R. W., M. Kelly, and C. N. Hewitt (1992), "Behavior of Urban Dust Contaminated by Chernobyl Fallout: Environmental Half-Lives and Transfer Coefficients," Envirun. Sci. Technol., Vol. 26, No. 11, pp. 2142-2147.
Alonso, A. and E. Gallego (1987), "Cost-Effectiveness Analysis of Countermeasures Using Accident Consequence Assessment Models," Radiation Protection Dosimetry, Vol. 21, NO. 1/3, pp. 151-158.
Alonso, A., E. Gallego, and J. E. Martin (1990), The Modeling of Ofl-Site Economic Consequences of Nuclear Accidents, CTN-29-90, Universidad PolitEcnica de Madrid, Madrid, Spain.
Anspaugh, L. R., J. H. Shinn, P. L. Phelps, and N. C . Kennedy (1975), "Resuspension and Redistribution of Plutonium in Soils," Health Physics, Vol. 29, (October), 57 1-582.
Bib- 1

Bibliography (Continued) Baes, C. F., 111, C. T. Garten, Jr., and F. G. Taylor (1986), "Long-Term Environmental Problems
of Radioactively Contaminated Land," Environment International, Vol. 12, pp. 545-553.
Barbier, M. M. and C. V. Chester (undated), Decontamination a f h r g e Horizontal Concrete Sugaces Outdoors, Oak Ridge National Laboratory, Oak Ridge, TN.
Barnes, M. G., J. J Giacomini, and H. N. Friesen (1979), "Some Statistical Aspects of the Cleanup of Enewetak Atoll," in 1978 DOE Statistical Symposium, CONF-781108, ERA- 05-012506, held November 1, 1978 in Albuquerque, NM.
Becker, J. and G. Shaw (1970), "FIDLER on the Roof of the World," USAF Nuclear Safety, AFRP 122-1, No. 1, Vol. 65 (Part 2) Special Edition, pp. 52-53, Kirtland AFB, NM.
Boecker, B., R. Hall, K. Inn, J. Lawrence, P. Ziemer, G. Eisele, B. Wachholz, and W. Burr, Jr. (1991), "Current Status of Bioassay Procedures to Detect and Quantify Previous Exposures to Radioactive Materials," Health Physics, Vol. 60, Supp. 1, pp. 45-100.
Boughton, B. A. and J. M. DeLaurentis (1992), "Description and Validation of ERAD: An Atmospheric Dispersion Model for High Explosive Detonations," SAND92-2069, Sandia National Laboratories, Albuquerque, NM.
Bramlitt, E. T. (1982), "Nuclear Weapon Accident Site Restoration," no document #, (DRAFT of June 16, 1982), Field Command Defense Nuclear Agency, Kirtland AFB, NM.
Bramlitt, E. T. (1994), "Experience in Mining Plutonium for Soil Cleanup," 20th Environmental Symposium & Exhibition: Department of Defense Environmental Security--Strategies for the 21st Century, held March 14-17, 1994 in San Antonio, TX.
Brown, J., M. J. Crick, and M. D. Hill (1988), "The Effectiveness of Various Decontamination Techniques For Reducing External Radiation Doses to People Living in an Urban Environment," Joint CEC/OECD(NEA) Workshop on Recent Advances in Reactor Accident Consequence Assessment, EUR 11408 EN, held January 25-29, 1988 in Rome, Italy, pp. 323-332.
Bureau of the Census (1994), Statistical Abstract of the United States: 1995, Washington, DC.
Burke, R. P., D. C. Aldrich, and N. C. Rasmussen (1984), Economic Risks of Nuclear Power Reactor Accidents, NUREGKR-3673, Sandia National Laboratories, Albuquerque, NM.
Burley, G. (1990a), Transuranium Elements, Volume I , Elements of Radiation Protection, EPA 52011-90-015, Environmental Protection Agency, Washington, DC.
Bib-2
Bibliography (Continued) Burley, G. (1990b), Transuranium Elements, Volume 2, Technical Basis for Remedial Actions,
EPA 520/1-90-016, Environmental Protection Agency, Washington, DC.
Cammarano, M. V., C. H. Wheeler, and G. S . Wing (1964a), A Prototype Civil Defense Manual for Radiological Decontamination of Municipalities, Second Edition, Volume I- Decontamination Planning, AD-60364 1 , Curtis Wright Corp., Caldwell, NJ.
Cammarano, M. V., C. H. Wheeler, and G. S. Wing (1964b), A Prototype Civil Defense Manual for Radiological Decontamination of Municipalities, Second Edition, Volume II- Decontamination Operations, AD-603642, Curtis Wright Corp., Caldwell, NJ
ChemRisk (1994a), Project Task 5 Report: Estimating Historical Emissions from Rocky Flats I952-1989, Colorado Dept. of Public Health and Environment, Denver, CO.
ChemRisk ( 1994b), Project Task 6 Report: Exposure Pathway Identijkation and Transport Modeling, Colorado Dept. of Public Health and Environment, Denver, CO.
ChemRisk ( 1 9 9 4 ~ ) ~ Project Task 8 Report: Dose Assessment for Historical Contaminant Releases from Rocky Flats, Colorado Dept. of Public Health and Environment, Denver, CO.
Clinton, W. (1994), "Administration Proposal for CERCLA Reauthorization," EPA Cleanup Standards Outreach BBS, Washington, DC.
Cohen, J., (1982), "Cost-Benefit Analysis for Alternatives for Disposal of Alpha-Contaminated Waste," Proceedings of the Alpha-Contaminated Waste Management Workshop, held August 10-13, 1984 in Gaithersburg, MD, Oak Ridge National Laboratory, Oak Ridge, TN.
Consumer Reports (1995), "Vacuum Cleaners", Consumer Reports, Vol. 60, No. 1, (January), pp. 43-49.
Corn, M. (1961), "The Adhesion of Solid Particles to Solid Surfaces, 11," Air Pollution Control Association Journal, Vol. 11, No. 12, pp. 566-575.
Cowan, F. P. and C. B. Meinhold (1969), "Decontamination," in Survival and the Bomb: Methods of Civil Defense, E. P. Wigner (ed.), Indiana University Press, Bloomington, IN.
Cuddihy, R. G. and G . J. Newton (1985), Human Radiation Exposures Related to Nuclear Weapons Industries, LMF- 1 12, Inhalation Toxicology Research Institute, Albuquerque, NM.
Bib-3
Bibliography (Continued) Current Digest of the Soviet Press (1989), "Politburo Reviews Chernobyl Cleanup," Vol. 41, No.
45, pp. 18-21.
Current Digest of the Soviet Press (1990), "Chernobyl: A New Cleanup Program is Set," Vol. 42, NO. 18, pp. 5-8.
Daily, M. C., A. Huffert, F. Cardile, and J. C. Malaro (1994), Working Draft Regulatory Guide on Release Criteria for Decommissioning: NRC S t a f s Drafl for Comment, NUREG- 1500, Public Draft for Comment, Nuclear Regulatory Commission, Washington, DC.
Dassler, William, COL (1994), Personal communication, Field Command Defense Nuclear Agency, Kirtland AFB, NM.
DoD (1990), Nuclear Weapon Accident Response Procedures (NARP) Manual, DoD 5 100.52-M, Washington, DC.
DoD (1994), DoD NuclearBiologicaVChemical Defense Wa$are - (Readiness, Training, Logistics): Report to Congress, June 1994, AD-A283520, Washington, DC.
DOE (1980), Final Environmental Impact Statement, Rocky Flats Plant Site, DOE/EIS-0064, Washington, DC.
DOE (1988a), "Radioactive Waste Management," DOE Order 5820.2A, issued 9-26-88, Washington, DC.
DOE (1988b), Internal Dose Conversion Factors for Calculation of Dose to the Public, DOERH-007 1, Washington, DC.
DOE ( 1989), "Comprehensive Environmental Response, Compensation, and Liability Act Requirements," DOE Order 5400.4, issued 10-6-89, Washington, DC.
DOE (1990), Effectiveness of Sheltering in Buildings and Vehicles for Plutonium, DOE/EH-DOE ( 1990), Effectiveness of Sheltering in Buildings and Vehicles for Plutonium, DOEIEH- 0159T, Washington, DC.
DOE (1991), Plutonium in Soils Workshop, July 31 -August I , 1991, compilation of presentations, Denver, CO.
DOE (1993), "Radiation Protection of the Public and the Environment," DOE Order 5400.5, issued 2-8-90, Change 2, revised 1-7-93, Washington, DC.
Bib-4

Bibliography (Continued) DOE ( 1994a), Environmental Assessment For Interim Storage of Plutonium Components at
Pantex, DOE/EA-0812, Vols. 1-2, Amarillo, TX.
DOE (1994b), "Finding of No Significant Impact: Interim Storage of Plutonium Components at the Pantex Plant, Amarillo, TX," Federal Register, January 26, 1994, p. 3674.
DOE (19944, Environmental Assessment for the Proposed Interim Storage of Highly Enriched Uranium Above the Maximum Historical Storage Level at the Y-12 Plant Oak Ridge, 2T\I, DOEEA-0929, Vols. 1-2, Oak Ridge, TN.
DOE (1 994d), "Dose Calculations Complicated by Employee Physiology," in Operating Experience Weekly Summary, August 26 - September 1, 1994, Office of Nuclear and Facility Safety, Washington, DC.
DOE ( 1995a), CostlUiskBeneft Analysis of Alternative Cleanup Requirements for Plutonium- Contaminated Soils on and Near the Nevada Test Site, DOE/NV-399, Las Vegas, NV.
DOE (1 995b), Estimating the Cold War Mortgage: The 1995 Baseline Environmental Management Report, Vol. 1, DOEEM-0232, Washington, DC.
Deshler, Barbara (1993, Personal communication, IT Corporation, Las Vegas, NV.
Dick, J. L. and T. P. Baker, Jr. (1967), Operation Plumbbob-Test Group 57, Program 73: Monitoring and Decontamination Techniques for Plutonium Fallout on Large-Area Surfaces, WT-1512, Air Force Special Weapons Command, Kirtland AFB, NM.
Dickman, P. (1982), "Greater Confinement Disposal Methods and Concepts," Proceedings ofthe Alpha-Contaminated Waste Management Workshop, held August 10- 13, 1984 in Gaithersburg, MD, Oak Ridge National Laboratory, Oak Ridge, TN.
DNA (1973, Palomares Summary Report, Field Command Defense Nuclear Agency, Kirtland AFB, NM.
DNA (1981), The Radiological Cleanup of Enewetak Atoll, Defense Nuclear Agency, Washington, DC.
DNA (1991), "Environmental Assessment for the Cleanup of Johnston Atoll Plutonium Contaminated Soil," Memorandum For Assistant Secretary of Defense (Production and Logistics) from Major General Gerald G. Watson, Director of DNA, Alexandria, VA.
DNA (1993a), Site Restoration Seminar-92 (SRS-92), January 15, 1993, After Action Report, Defense Nuclear Agency, Alexandria, VA.
Bib-5
Bibliography (Continued) DNA (1993b), On-Scene Commander's Guide to Site Restoration, DRAFT DNA Pamphlet
52OO.XX-P, September 30, 1993, Defense Nuclear Agency, Alexandria, VA.
Drell, S. D. (1993) In the Shadow of the Bomb: Physics and A r m Control, American Institute of Physics, New York, NY.
Drell, S. D., J. S. Foster, Jr., and C. H. Townes (1990), Report of the Panel on Nuclear Weapons Safety of the House Armed Services Committee, ZOlst Congress, 2nd Session, Committee Print, No. 15, p. 30, Government Printing Office, Washington, DC.
Earl, J. R., R. H. Heiskell, G. L. Smith, Jr., R. L. Stetson, W. E. Strope, L. B. Werner, J. C. Maloney, G. C. Smith, R. H. Reitman, and E. H. Dhein (1952), Operation Jangle, Project 6.2, Protection and Decontamination of Land Targets and Vehicles, WT-400, Naval Radiological Defense Laboratory, San Francisco, CA.
Eckerman, K. F., A. B. Wolbarst, and A. C. B. Richardson (1989), Limiting Values for Radionuclide Intake and Air Concentration and Dose Conversion Factors for Inhalation, Submersion, and Ingestion, Federal Guidance Report 11, EPA 520/1-88-020, second printing with corrections, Washington, DC.
Eckerman, K. F. and J. C. Ryman (1993), External Exposure to Radionuclides in Air, Water, and Soil, Federal Guidance Report 12, EPA 402-R-93-08 1, Washington, DC.
Eddington, Charles (1994), Personal communication, Board on Radiation Effects Research, National Academy of Sciences, Washington, DC.
El-Shobokshy, M. S. and F. M. Hussein (1988), "Correlation Between Indoor-Outdoor Inhalable Particulate Concentrations and Meteorological Variables, Atmspheric Environment, Vol. 22, NO. 12, pp. 2667-2675.
EPA (1977), Summary Report: Proposed Guidance on Dose Limits For Persons Exposed to Transuranium Elements in the General Environment, EPA 52014-77-0 16, Washington, DC.
EPA (1978), The Ecological Impact of Land Restoration and Cleanup, EPA 52013-78-006, Washington, DC.
EPA (1984), Record of Decision: Times Beach, MO (Quail Run, Sontag Road, Minker, Stout, Cashel, Sullins, EPA/RODIR07-84/002, Washington, DC.
Bib-6

Bibliography (Continued) EPA (1 986), "Advance Notice of Proposed Rulemaking: Radiation Protection Criteria for
Cleanup of Land and Facilities Contaminated With Residual Radioactive Materials: 40 CFR 194," Federal Register, June 18, 1986, Vol. 51, p. 22264.
EPA (1987a), Data Quality Objectives for Remedial Response Activities, OSWER Directive 9355.0-07B, PB88-131370, Washington, DC.
EPA (1987b), A Compendium of Superfund Field Operations Methods, OSWER Directive 9355.0-14, PB88-181557, Washington, DC.
EPA (1988), Record of Decision: Times Beach, MO, EPA/ROD/R07-88/015, Washington, DC.
EPA (1989a), Risk Assessment Guidance For Superfund: Volume 1-Human Health Evaluation Manual (Part A), EPA/540/1-89-002, PB90- 15558 1, Washington, DC.
EPA (1989b), Guidance on Preparing Superfund Decision Documents: The Proposed Plan, The Record of Decision, Explanation of Significant Differences, The Record of Decision Amendment, EPN540/G-89/007, OSWER Directive 9355.3-02, Washington, DC.
EPA (1990), A Guide to Selecting Superfund Remedial Actions, OSWER Directive 9355.0-27FS, Washington, DC.
EPA (1991a), Risk Assessment Guidance For Superfund: Volume 1-Human Health Evaluation Manual (Part B), Quick Reference Fact Sheet, PB92-963339, Washington, DC.
EPA (1 991b), Risk Assessment Guidance For Supe@nd: Volume 1-Human Health Evaluation Manual (Part B, Development of Risk-based Preliminary Remediation Goals), PB92- 963333, Washington, DC.
EPA (1991c), Risk Assessment Guidance For Superfund: Volume I-Human Health Evaluation Manual (Part C), Quick Reference Fact Sheet, PB92-963340, Washington, DC.
EPA (1991d), Role of the Baseline Risk Assessment in Supeifund Remedy Selection Decisions, PB91-921359, Washington, DC.
EPA (1991e), Human Health Evaluation Manual, Supplemental Guidance: Standard Default Exposure Factors, PB91-9213 14, Washington, DC.
EPA (1 992a), Manual of Protective Action Guides and Protective Acdons for Nuclear Incidents, PB92-164763, Washington, DC.
Bib-7
Bibliography (Continued) EPA (1992b), Framework for Ecological Risk Assessment Issue Papers, EPN62
Washington, DC.
EPA (1993a), "Advance Notice of Proposed Rulemaking: Radiation Site Cleanup 40 CFR 195," Federal Register, October 21, 1993, Vol. 58, p. 54474.
EPA (1993b), Issues Paper on Radiation Site Cleanup Regulations, Washington, I:
EPA (1993c), Superjknd: Progress at National Priority List Sites, New Jersey, PI Washington, DC.
EPA (1993d), A Review of Federal Authorities for Hazardous Materials Acci EPN550-R-93-002, Washington, DC.
EPA (1994a), "Staff Working Draft of the Radiation Site Cleanup Regulation - Fo Purposes Only," June 2, 1994, EPA Cleanup Standards Outreach BBS, Was1
EPA ( 1994b), "National Contingency Plan (NCP): Final Rule," Federal Register, Sc 1994, Vol. 59, p. 47384.
EPA (1994C), Peer Review Workshop Report on Ecological Risk Assessment IJ EPA/630/R-94/008, Washington, DC.
EPA ( 1994d), Radiation Site Cleanup Regulations: Technical Support Docurr Development of Radionuclide Cleanup Levels for Soil, Review Draft for Pub1 September 26, 1994, EPA Office of Air and Radiation, Washington, DC.
EPA (199k), "Federal Radiation Protection Guidance for Exposure of the Gent Federal Register, December 23, 1994, Vol. 59, FRL-5126-7.
EPA (1995a), "National Priorities List for Uncontrolled Hazardous Waste Sites; RL Register, April 25, 1995, Vol. 60, pp. 20329-20353.
EPA (1995b), "Science Advisory Board; Notification of Public Advisory Commit Open Meeting," Federal Register, April 26, 1995, Vol. 60, FRL-5 197-4.
EPA (1995c), "Proposed Administrative Settlement Under Section 122(h) of the Co Environmental Response, Compensation, and Liability Act; In Re: U Department of Defense; Meddybembs, ME," Federal Register, December 2C 60, FRL-5399-4.
Bib-8

Bibliography (Continued) Exxon Valdez Oil Spill Trustee Council (1994a), Final Environmental Impact Statement for the
Exxon Valdez Oil Spill Restoration Plan, Anchorage, AK.
Exxon Valdez Oil Spill Trustee Council (1994b), Record of Decision for the Exxon Valdez Oil Spill Restoration Plan, Anchorage, AK.
Farris, W. T., B. A. Napier, J. C. Simpson, S. F. Snyder, and D. B. Shipler (1994a), Columbia River Pathway Dosimetry Report: Hanford Environmental Dose Reconstruction Project, PNWD-2227, Public Draft, Pacific Northwest Laboratory, Richland, WA.
Farris, W. T., B. A. Napier, T. A. Ikenberry, J. C. Simpson, and D. B. Shipler (1994b), Atmospheric Pathway Dosimetry Report: Hanford Environmental Dose Reconstruction Project, PNWD-2228, Public Draft, Pacific Northwest Laboratory, Richland, WA.
Federal Civil Defense Administration ( 1952), Radiological Decontamination in Civil Defense, TM- 11-6, Washington, DC.
Feldman, J. (1986), "Site Clean-up Requirements: Where Does One Dispose of 'Dirt'?," in Health Physics Considerations in Decontamination and Decommissioning, Proceedings of the Nineteenth Midyear Topical Symposium, Health Physics Society meeting, held February 2-6 in Knoxville, TN.
FEMA ( 1983, "Federal Radiological Emergency Response Plan (FRERP), Concurrence by All Twelve Federal Agencies and Publication as an Operational Plan," Federal Register, October 30, 1985, p. 46542.
FEMA (1992), Federal Response Plan for Public Law 93-288, As Amended, available from Government Printing Office, Washington, DC.
FEMA (1 994), "Federal Radiological Emergency Response Plan (FRERP); Notice," Federal Register, September 6 , 1994, Vol. 59, No. 171, pp. 46086-46107.
FEMA (1 993, "Environmental Considerations/Categorical Exclusions: Proposed Rule," Federal Register, August 3, 1995, Vol. 60, No. 149, pp. 39694-39698.
Finn, S., V. Dura, and G. L. Simmons (1980), Cost-Risk Analysis of Protective Actions for a Low-Level Deposition of Radionuclides, ORP Contract Report 80-1, Office of Radiation Programs, Environmental Protection Agency, Washington, DC.
Fradkin, P. L. (1989), Fallout: An American Nuclear Tragedy, University of Arizona Press, Tucson, AZ.
Bib-9
Bibliography (Continued) GA Technologies (1986), Transuranic Package Transporter, TRUPACT-I, Safety Analysis Report
for Packging, GA-A16860, SAND83-7077, Sandia National Laboratories, Albuquerque, NM.
GAO ( 1986a), Chemical Wa~are : Progress and Problems in Defensive Capability, GAOIPEMD- 86-1 1, General Accounting Office, Gaithersburg, MD.
GAO (1986b), Nuclear Regulation: Financial Consequences of a Nuclear Power Plant Accident, GAORCED-86- 193BR, General Accounting Office, Gaithersburg, MD.
GAO (1987), Nuclear Regulation: A Perspective on Liability Protection for a Nuclear Power Plant Accident, GAOECED-87- 124, General Accounting Office, Gaithersburg, MD.
GAO (1988), Superfund: Cost Growth on Remedial Construction Activities, GAO/RCED-88-69, General Accounting Office, Gaithersburg, MD.
GAO (1993), Radioactive Waste: EPA Standards Delayed by Low Priority and Coordination Problems, GAOECED-93- 126, General Accounting Office, Gaithersburg, MD.
GAO (1994a), Nuclear Cleanup: Completion of Standards and Eflectiveness of Land Use Planning are Uncertain, GAOECED-94- 144, General Accounting Office, Gaithersburg, MD.
GAO (1994b), Nuclear Health and Safety: Consensus on Acceptable Radiation Risk to the Public is Lacking, GAORCED-94- 190, General Accounting Office, Gaithersburg, MD.
Garger, E. K. (1994), "Air Concentrations of Radionuclides in the Vicinity of Chernobyl and the Effects of Resuspension," Journal of Aerosol Science, Vol. 25, No. 5, pp. 745-753.
Garland, J. A., N. J. Pattenden, and K. Playford (1992), "Resuspension Following Chernobyl," in Modeling Resuspension, Seasonality, and Losses During Food Processing, First Report of VAMP Terrestrial Working Group, IAEA-TECDOC-647, pp. 9-33, Vienna, Austria.
Garland, J. A. and I. R. Pomeroy (1994), "Resuspension of Fall-Out Material Following the Chernobyl Accident," Journal of Aerosol Science, Vol. 25, No. 5, pp. 793-806.
Gasco, C., L. Romero, E. Mingaro, and A. M. Lobo (1992), "Geochemical Aspects and Distribution of Long-Lived Radionuclides in Marine Sediments From Palomares," Journal of Radioanalytical and Nuclear Chemistry, Vol. 161, No. 2, pp. 389-400.
Gibson, Fred (1994), Personal communication, July 26, 1994, Gibson Trucking, La Jara, CO, interview at Technadyne Engineering, Albuquerque, NM.
Bib- 10

Bibliography (Continued) Gilbert, T. L., P. C . Chee, M. J. Knight, J. M. Peterson, C . J. Roberts, J. E. Robinson, S. Y. H.
Tsai, and Y-C Yuan (1983), Pathways Analysis and Radiation-Dose Estimates for Radioactive Residues at Formerly Utilized MEDLAEC Sites, DE830 1 1018, Argonne National Laboratory, Argonne, IL.
Gilbert, T. L., C. Yu, Y. C. Yuan, A. J. Zielen, M. J. Jusko, and A. Wall0 (1989), A Manual for Implementing Residual Radioactive Material Guidelines, DOWCW890 1 , ANL/ES- 160, DE89-0 14333, Argonne National Laboratory, Argonne, IL.
Gogolak, C. V. and A. M. Huffert (1995), A Nonparametric Statistical Methodology for the Design a d Analysis of Final Status Decommissioning Surveys, NUREG- 1505, Public Draft for Comment, Nuclear Regulatory Commission, Washington, DC
Goodman, P. G. and C. E. Vaughan (1988), "The Implications of Times Beach," Journal of Environmental Health, (September/October), pp. 19-21.
Grace, C. S. ( 1 9 9 4 ~ Nuclear Weapons: Principles, Effects, and Survivability, Brassey's, London.
Gregory, S. and A. Edwards (1988), A Handbook of Nuclear Weapons Accidents, Peace Research Report Number 20, School of Peace Studies, University of Bradford, Bradford, England.
Gudiksen, P. H. and 0. D. T. Lynch, Jr, (1973, "Radioactivity Levels in Eniwetak Soil," Health Physics, Vol. 29, (July), pp. 17-25.
Hansen, R. P. ( 1992), NEPAKERCMCRA Integration Strategy for Environmental Restoration Program, Sandia National Laboratories, Albuquerque, NM," SAND92-73 12, Sandia National Laboratories, Albuquerque, NM.
Hanson, W. C. (1972), "Plutonium in Lichen Communities of the Thule Greenland Region During the Summer of 1968," Health Physics, Vol. 22, (January), pp. 39-42.
Hartmann, G., C. Thom, and K. Bachmann (1989), "Sources for Pu in Near Surface Air,'' Health Physics, Vol. 58, No. 1, (January), pp. 55-69.
Hartshorn, T. A. and B. D. Dent (1980), Interpreting the City: An Urban Geography, John Wiley & Sons, New York.
Hastings, T., J. Smith, and M. Ethridge (1994), "Integrating NEPA & CERCLA Requirements at the BOMARC Missile Site, New Jersey," Proceedings, 20th Environmental Symposium and Exhibition: Department of Defense Environmental Security-Strategies for the 21 st Century, held March 14-17, 1994 in San Antonio, TX.
Bib- 1 1
i

Bibliography (Con tin ued) Hayden, J. A., D. W. Rutherford, K. Y. Gallagher, P. M. Arnold, and J. R. Stevens (1980), Soil
Decontamination Criteria Report, RFP-3 162, Rocky Flats Plant, Golden CO.
Haywood, S. M., C. A. Robinson, and C. Heady (1991), COCO-I: Model for Assessing the Cost of Offsite Consequences of Accidental Releases of Radioactivity, NRPB-R243, National Radiological Protection Board, Hanvell, England.
Herzenberg, C. L., L. M. Lewis, R. Haffenden, R. C. Hemphill, K. Lerner, S . A. Meleski, E. A. Tanzman, and J. D. Adams (1994), Recovery j?om a Chemical Weapons Accident or Incident: A Concept Paper on Planning, ANWDISITM- 14, Argonne National Laboratory, Argonne, IL.
Holliinder, W. (1994), "Resuspension Factors of 137Cs in Hannover After the Chernobyl Accident," Journal of Aerosol Science, Vol. 25, No. 5, pp. 789-792.
Howell, J. and V. V. Vandivert (195 l), Contamination-Decontamination of Four Common Building Materials, AD-330(T), Naval Radiological Defense Laboratory, San Francisco, CA.
Howorth, J. M. and F. J. Sandalls (1987), Decontamination and Reclamation of Agricultural Land Following a Nuclear Accident, Environmental and Medical Sciences Division, AERE-R- 12666, Harwell Laboratory, Oxfordshire, England.
Huffert, A. M., R. A. Meck, and K. M. Miller (1994), Background as a Residual Radioactivity Criterion for Decommissioning, NUREG- 1501 , Public Draft for Comment, Nuclear Regulatory Commission, Washington, DC
Huffert, A. M., E. W. Abelquist, and W. S. Brown (1999, Minimum Detectable Concentrations with Typical Radiation Survey Instruments for Various Contaminants and Field Conditions, NUREG- 1507, Public Draft for Comment, Nuclear Regulatory Commission, Washington, DC
Huffert, A. M. and K. M. Miller (1995), Measurement Methods for Radiological Surveys in Support of New Decommissioning Criteria, NUREG- 1506, Public Draft for Comment, Nuclear Regulatory Commission, Washington, DC
ICRP ( 199 1 a), 1990 Recommendations of the International Commission on Radiological Protection, Annals of the ICRP, ICRP 60, Volume 21, Nos. 1-3, Pergamon Press, New York.
Bib-12

Bibliography (Continued) ICRP (1991b), Annual Limits of Intake of Radionuclides by Workers Based on the I990
Recommendations, Annals of the ICRP, ICRP 61, Volume 21, No. 4, Pergamon Press, New York.
Iranzo, E. (1968), "First Results From the Programme of Action Following the Palomares Accident," pp. 446-455 of Proceedings: Radiological Protection of the Public in a Nuclear Muss Disaster, May 26 - June 1, 1968, Interlaken, Switzerland.
Iranzo, E., A. Espinosa, and J. Martinez (1994), "Resuspension in the Palomares Area of Spain: A Summary of Experimental Studies," Journal of Aerosol Science, Vol. 25, No. 5, pp. 833-841.
Jensen, L. and J. Feldman (1986), "Legal and Ethical Issues Raised in Considering Residential Decontamination Options for Technologically-Enhanced Radioactive Contamination," Health Physics Considerations in Decontamination and Decommissioning, Proceedings of the Nineteenth Midyear Topical Symposium, Health Physics Society, held February 2-6, 1986, Knoxville, TN.
James, P. E. and D. E. Wilkins (1969), "Deep Plowing: An Engineering Appraisal," ASAE Paper 69- 152, American Society of Agricultural Engineers, 1969 Summer Meeting, held Purdue University, Lafayette, IN.
Johnson, Nels ( 1994), Personal communication, interview at TMA Eberline, Inc., Albuquerque, NM, May 17, 1994.
Kadlecek, M. (1988), "Love Canal-I0 Years Later," The Conservationist, Vol. 43, No. 3, pp. 40-43.
Kashparov, V. A., V. P. Protsak, Y. A. lvanov, and K. W. Nicholson (1994a), "Resuspension of Radionuclides and the Contamination of Village Areas Around Chernobyl," Journal of Aerosol Science, Vol. 25, No. 5, pp. 755-759.
Kashparov, V. A., V. P. Protsak, V. I. Yoschenko, and J. D. Wrttterson (1994b), "Inhalation of Radionuclides During Agricultural Work in Areas Contaminated as a Result of the Chernobyl Accident, Journal uf Aerosol Science, Vol. 25, No. 5, pp. 761-766.
Kennedy, B. (1984), "Analyses of the Disposal of Alpha-Contaminated Waste at Hanford," Proceedings of the Alpha-Contaminated Waste Management Workshop, held August 10- 13, 1984 in Gaithersburg, MD, Oak Ridge National Laboratory, Oak Ridge, TN.
Bib- I3

Bibliography (Continued) Kennedy, W. E., Jr. and D. L. Strenge (1994), Residual Radioactive Material From Decommis-
sioning: Technical Basis for Translating Contamination Levels to Annual Total Effective Dose Equivalent, NUREGKR-55 12, Vol. 1, Pacific Northwest Laboratory, Richland, WA.
Kercher, J. R. and L. R. Anspaugh (1991), "Analysis of the Nevada Applied-Ecology-Group Model of Transuranic Radionuclide Transport and Dose," J. Environ. Radioactivity, Vol. 13, pp. 191-216.
Kimbrell, Joseph, MAJ (1993, Personal communication, August 14, 1995, Field Command Defense Nuclear Agency, Kirtland AFB, NM.
Kocher, D. C. (1980), "Potential Importance of Resuspension During Chronic Releases of Radionuclides to the Atmosphere," Health Physics, Vol. 39, (October), pp. 687-690.
Kopeykin, V. A. (1994) "Geochemical Consequences of the Chernobyl Accident," Geochemistry International, Vol. 31, No. 5, pp. 134-137.
Kozak, M. W., M. S. Y. Chu, and P. A. Mattingly (1990), A Perjormunce Assessment Methodology for Low-Level Waste Facilities, NUREGKR-5532, Sandia National Laboratories, Albuquerque, NM.
Langham W. H. (1970), "Technical and Laboratory Support," USAF Nuclear Safety, AFRP 122- 1, No. 1, Vol. 65 (Part 2) Special Edition, pp. 36-41, Kirtland AFB, NM.
Langham, W. H., P. S. Harris, and T. L. Shipman (1956), Plutonium Hazards Created by Accidental or Experimental Detonation of Atomic Weapons, AECU-3258, Atomic Energy Commission, Washington, DC.
Langham, W. H. (1971), Plutonium Distribution as a Problem in Environmental Science, LA-756, Los Alamos Scientific Laboratory, Los Alamos, NM.
Layton, D. W., L. R. Anspaugh, K. T. Bogen, and T. Straume (1993), Risk Assessment of Soil- Based Exposures to Plutonium at Experimental Sites Located on the Nevada Test Site and Adjoining Areas, UCRL-ID- 1 12605, Lawrence Livermore National Laboratory, Livennore, CA.
Lee, H., J. D. Sartor, and W. H. Van Horn (1959), Stoneman II Test of Reclamation Pevormunce: Volume IV: Peqormance Characteristics of Land Reclanuztion Procedures, NRDL-TR-337, Naval Radiological Defense Laboratory, San Francisco, CA.
Bib-14

Bibliography (Continued) Levin, G. ( 1984), "Near-Surface Disposal of Alpha-Contaminated Waste," Proceedings of the
Alpha-Contaminated Waste Management Workshop, held August 10- 13, 1984 in Gaithersburg, MD, Oak Ridge National Laboratory, Oak Ridge, TN.
Linsley, G. S. (1978), Resuspension of the Transuranium Elements - A Review of Existing Data, NRPB-R75, National Radiological Protection Board, Harwell, England.
Lonergan, S. C. and R. L. Goble (1990), "Estimating the Financial Consequences of a Severe Reactor Accident in Canada," Energy, Vol. 15, No. 6, pp. 507-522.
Lukashev, V. K. (1993), "Some Geochemical and Environmental Aspects of the Chernobyl Nuclear Accident," Applied Geochemistry, Vol. 8, No. 5, pp. 419-435.
Maloney, J. C., E. H. Dhein, and M. Morgenthau (1955), Operation Castle, Project 6.5, Decontamination and Protection, WT-928, Army Chemical Center, Edgewood Arsenal, MD.
Maloney, J. C., J. L. Meredith, J. Barnard, and C. C. Kilmer (1962), Cold Weather Decontami- nation Study: McCoy-IZ, NDL-TR-32, Army Nuclear Defense Laboratory, Edgewood Arsenal, MD.
Maloney, J. C. and J. L. Meredith (1962a), Cold Weather Decontamination Study: McCoy-I, NDL-TR-24, Army Nuclear Defense Laboratory, Edgewood Arsenal, MD.
Maloney, J. C. and J. R. Meredith (1962b), Simple Decontamination of Residential Areas: McCoy-Ill, NDL-TR-33, Army Nuclear Defense Laboratory, Edgewood Arsenal, MD.
Manning, P. K. (1992), "'Big Bang' Decisions: Notes on a Naturalistic Approach," in The Uses of Discretion, K. Hawkins (ed.), Oxford University Press, New York.
McMahon, L. (1987), I988 Dodge Heavy Construction Cost Data, McGraw-Hill Information Systems Company, Princeton, NJ.
McRaney, W. K. (1970) "Radiological Monitoring," USAF Nuclear Safety, AFRP 122-1, No. 1, Vol. 65 (Part 2) Special Edition, pp. 46-51, Kirtland AFB, NM.
Melloy, Pat (1994), Personal communication, July 22, 1994, Melloy Mobile Storage, Albuquer- que, NM.
Menzel, R. G. and P. E. James (1971), Treatments for Farmland Contaminated with Radioactive Material, Agriculture Handbook No. 395, Department of Agriculture, Washington, DC.
Bib-15

Bib I i og r a p h y (Con t i n u ed) Meredith, J. L., J. C. Maloney, H. G. Bradbury, and W. R. Miller (1964), Cold Weather
Decontamination Study: McCoy-IV, NDL-TR-58, f u m y Nuclear Defense Laboratory, Edgewood Arsenal, MD.
Miller, K. M. ( 1994), "Large-Area Proportional Counter for in Situ Transuranic Measurements," Transactions of the Anierican Nucleur Society, Vol. 70, held June 19-23, 1994 in New Orleans, LA, pp. 47-48.
Miura, T. and Y. Ishida (1957), "Contamination by Radioactive Materials and its Removal," Science of Labor (in Japanese), Vol. 33, No. 9, p. 707 ff (English translation as AEC-TR- 4482).
Monks, V. (1993), "See No Evil," Anzericun Journalisnz Review, (June), pp. 18-25.
Moroney, K. S . , J. D. Moroney, 111, and N. R. Johnson (1993), "Remediation of Transurinic- Contaminated Coral Soil at Johnston Atoll Using the Segmented Gate System," reprint from WM'9.3 Conference Proceedings, Tucson, AZ, February-March, 1993.
Moss, 0. R., E. J. Rossignol, W. C. Cannon, and D. L. Stevens (1980), Environmental Rudiution Safety: PlutoniudSoil Interactions for Pl~rtoniuni Particles in Soil, PNL-3606, Pacific Northwest Laboratory, Richland, WA.
National Academy of Sciences ( 1988), Heulth Eflects uf Rudon unci Other Internull~y Deposited Alpha-Emitters, BEIR IV, Committee on the Biologicul Eflects of Ionizing Rucliutions, National Academy Press, Washington, DC.
National Academy of Sciences ( 1994), Rudiologicul Assessments jbr Resettlement of Rongelup in the Republic of the Marshall Islands, National Academy Press, Washington, DC.
National Academy of Sciences ( 1993, Technicul Busis jbr Yucca Mountuin Stundurrls, National Academy Press, Washington, DC.
National Aeronautics and Space Administdon ( I995), Find Environmentul Impuct Stutement for the Cassini Mission, Washington, DC.
National Oceanic and Atmospheric Adminiswation ( 1996), "Natural Resource Damage Assessments; Final Rule, 15 CFR 990," Federul Register, January 5, 1996, Vol. 61, No. 4, pp. 439-510.
National Public Radio (1994), Morning Edition, story aired July 5, 1994, Washington, DC.
Bib-I6

Bibliography (Continued) Neriishi, K., D. 0. Straum, M. Vaeth, S . Mizuno, and S . Akiba (1991), "The Observed
Relationship Between the Occurrence of Acute Radiation Effects and Leukemia Mortality Among A-Bomb Survivors," Radiation Research, Vol. 125, No. 2, pp. 206-213.
Neuhauser, K. S. and F. L. Kanipe (1992), RADTRAN 4 Volume HI, User's Guide, SAND89-2370, Sandia National Laboratories, Albuquerque, NM.
Nicholson, K. W. (1988), "A Review of Particle Resuspension," Atmospheric Environment, Vol. 22, NO. 12, pp. 2639-2651.
Nordic Liason Committee for Atomic Energy (1990), Environmental Consequences of Releases From Nuclear Accidents, Institutt For Energiteknik, Kjeller, Norway.
Nuclear Engineering International ( 1994), "Costs and Benefits in the Chernobyl Cleanup," Vol. 39, NO. 475, pp. 22-23.
NRC (1973, Reactor Safety Study: Calculations of Reactor Accident Consequences, WASH- 1400, Appendix 6, Nuclear Regulatory Commission, Washington, DC.
NRC (1990), Severe Accident Risks: An Assessment of Five Commercial Nuclear Power Plants, NUREG- 1 150, Nuclear Regulatory Commission, Washington, DC.
NRC (1992), A Summary of NRC's Interim Radiological Cleanup Criteria and Current Dose Bases, Decommissioning and Regulatory Issues Branch, Washington, DC.
NRC (1994a), "Radiological Criteria for Decommissioning: Proposed Rule," Federal Register, August 22, 1994, Vol. 59, No. 161, p. 43200.
NRC (1994b), Generic Environmental Impact Statement in Support of Rulemaking on Radiological Criteria for Decommissioning of NRC-Licensed Nuclear Facilities, NUREG- 1496, Vols. 1-2, Public Draft for Comment, Nuclear Regulatory Commission, Washington, DC.
NRC (1995a), "Joint Nuclear Regulatory CornmissionEnvironmental Protection Agency Guidance on the Storage of Mixed Radioactive and Hazardous Waste," Federal Register, August 7, 1995, Vol. 60, NO. 151, pp. 40204-40211.
NRC (1995b), "Decommissioning of Shieldalloy Metallurgical Corporation's Facility in Cambridge, Ohio: Notice of Revision to the Scope of an Environmental Impact Statement," Federal Register, August 25, 1995, Vol. 60, No. 161, pp. 43477-43479.
Bib- 17

Bib I i og rap h y (Con tin u ed) NRC (1 995c), "Radiological Criteria for Decommissioning: Proposed Rule; Announcement of
Extension in Schedule," Federal Register, August 7, 1995, Vol. 60, No. 161, pp. 401 17- 40118.
Oakes, G. (1994), The Zmaginary War: Civil Defense and American Cold War Culture, Oxford University Press, New York.
Office of Technology Assessment (1988), Are We Cleaning Up? 10 Superjiund Case Studies-A Special Report, OTA-ITE-362, Washington, DC.
Owen, W. L., J. D. Sartor, and W. H. Van Horn (1960), Stonemun II Test of Reclamation Perjiormance, Volume II, Pegormance Characteristics of Wet Decontamination Procedures, NRDL-TR-335, Naval Radiological Defense Laboratory, San Francisco, CA.
Owen, W. L. and J. R. Sartor (1963), Radiological Recovery of Land Target Components - Complex ZIZ, NRDL-TR-700, U.S. Naval Radiological Defense Laboratory, San Francisco, CA.
Owen, W. L., W. C. Cobbin, and W. E. Shelberg (1968), Radiological Reclamation Performance Summary, Vol. 2, Evaluation and Condensation of Data for Preplanning of Recovery Operations, NRDL-TR-68-7 1, Vol. 2, Naval Radiological Defense Laboratory, San Francisco, CA.
Paajanen, A. and J. Lehto (1992), Disposal of Radioactive Wastes fiom the Cleanup of Large Areas Contaminated in Nuclear Accidents - A Literature Survey, Nordic Nuclear Safety Research Program 1990-93, Projekt #AN-2, Nordic Council of Ministers, Copenhagen.
Pantex Plant (1995), EIS News: A Newsletter About the US. Department of Energy's Environmental Impact Statement for the Pantex Plant, Vol. 2, No. 3, (September), Department of Energy, Amarillo, TX.
Parker, Kent (1994), Personal communication, Envirocare of Utah, Salt Lake City, UT.
Pascetta, Paolo ( 1994), Personal communication, Environmental Protection Agency Field Office, Mon tclair, NJ.
Palvlotskaya, F. I., T. A. Goryachenkova, V. V. Yemel'yanov, I. Ye. Kazinskaya, K. V. Barsukova, and B. F. Myasoyedov (1994) "Modes of Occurrence of Plutonium in Hot Particles," Geochemistry International, Vol. 31, No. 2, pp. 62-69.
Rand-McNally ( 1994), Rand-McNally Road Atlas, 70th Edition.
Bib- 18

Bibliography (Con t in ued) Reiman, R.T. (1994) "Mobile in Situ Gamma-Ray Spectroscopy System," Transactions of the
American Nuclear Society, Vol. 70, meeting held June 19-23, 1994 in New Orleans, LA, p. 47.
Reitz, D. A. (1 983, Radiological Contamination and Decontamination Annotated Index, DASIAC-SR-2 18, Defense Nuclear Agency, Washington, DC.
Richmond, C. R. (1975), "Remarks on Palomares-Seven Years Later," Los AIamos Scientific Laboratory, Los Alamos, NM.
Rocky Flats Plant (1994), Rocky Flats Risk Assessment Guide, Rev. 3, Golden, CO.
Roed, J. (1 983, Relationships in Indoor/Outdoor Air Pollution, Risg-M-2476, Risg National Laboratory, Roskilde, Denmark.
Roed, J. and J. Sandalls (1990), "Decontamination in the Urban Area," in Proceedings of the Seminar on Methods and Codes for Assessing the 08-Site Consequences of Nuclear Accidents, EUR 13013/1 EN, held May 7-11, 1990 in Athens, Greece, Commission of the European Communities, Brussels, Belgium.
Sandalls, F. J. (1987), Reinoval of Radiocaesium From Urban &$aces Contaminated as the Result of a Nuclear Accident, AERE-R12355, Harwell Laboratory, Oxfordshire, England.
Segal, M. G. (1 993), "Agricultural Countermeasures Following Deposition of Radioactivity After a Nuclear Accident," f i e Science of the Total Environment, Vol. 137, (September), pp. 31-48.
Sehmel, G. (1984), "Deposition and Resuspension," Atmospheric Science and Power Production, DOE/TIC-27601, D. Randerson (ed.), Department of Energy, Oak Ridge, TN.
Shinn, J. H., D. N. Homan, and C . B. Hofman (1986), "A Summary of Plutonium Aerosol Studies: Resuspension at the Nevada Test Site," UCRL-90476 PREPRINT, submitted to Journal of Environmental Radioactivity, Lawrence Livermore National Laboratory, Livermore, CA.
Shinn, J. H., E. H. Essington, F. L. Miller, T. P. O'Farrell, J. A. Orcutt, E. M. Romney, J. W. Shugart and E. R. Sorom (1989a), "Results of a Cleanup and Treatment Test at the Nevada Test Site: Evaluation of Vacuum Removal of Pu-Contaminated Soil," Health Physics, Vol. 57, No. 5, pp. 771-779.
Bib- 19

Bibliography (Continued) Shinn, J. H., D. N. Homan, and W. L. Robison (1989b), Resuspension Studies at Bikini Atoll,
UCID-18538, Rev. 1, DE890 1775 1, Lawrence Livermore National Laboratory, Livermore, CA.
Shinn, J. H. (1 994), Personal communication, Lawrence Livermore National Laboratory, Livermore, CA.
Shreve, J. D., Jr. and D. M. C. Thomas (1965), Operation Roller Coaster: Scientijic Director's Summary Report, DASA- 1 6 4 , Department of Defense, Washington, DC.
Simmons, R. W., MAJ (1993), "Nuclear Weapons Accident: Learning from the Palomares, Spain 1966 Incident," Ordnance, (February), pp. 5-9.
Smith, C. B. and J. A. Lambert (1978), Technology and Costs for Cleaning Up Land Contaminated with Plutonium, Environmental Protection Agency, Washington, DC.
Sobotovich, E. V. (1994), "Effectiveness of Environmental Protection Measures in the 30 km Zone around Chernobyl," Geochemistry International, Vol. 3 1, No. 2, pp. 73-8 1.
Spangler, M. B. (1980), "Syndromes of Risk and Environmental Protection: The Conflict of Individual and Societal Values," The Environmental Professional, Vol. 2, No. 314, pp. 274-29 1.
Spangler, M. B. (1983), "A Critique of Methods in the Quantification of Risks, Costs, and Benefits in the Societal Choice of Energy Options," Annals of Nuclear Energy, Vol. 10, NO. 314, pp. 119-151.
Sprung, J. L., J. A. Rollstin, J. C. Helton, and H.-N. Jow (1990), Evaluation of Severe Accident Risks: Quantification of Major Input Parameters, MACCS Input, NUREGICR-455 1 , SAND%-1309, Vol. 2, Rev. 1, Part 7, Sandia National Laboratories, Albuquerque, NM.
Stevens, Lee (1994), Personal communication, Department of Energy, Germantown, MD.
Stockholm International Peace Research Institute (1977), World Armaments and Disarmament, SPRI Yearbook 1977, MIT Press, Cambridge, MA.
Straume, T., C. R. Kellner, and K. M. Oswald (1978), "Radioactive Decontamination Methods and Their Effectiveness as a Function of Terrain," Health Physics, Vol. 35, pp. 309-314.
Sun, L. C., J. H. Clinton, J. McDonald, A. R. Moorthy, E. Kaplan, and C. B. Meinhold (1993), "Urine Collection Protocol in the Republic of the Marshall Islands," Radiation Protection Management, Vol. 10, No. 4, pp. 64-72.
Bib-20
Bibliography (Continued) Sun, L. C., A. R. Moorthy, E. Kaplan, J. W. Baum, and C. B. Meinhold (1994), "Assessment of
Plutonium Exposures by Fission Track Analysis of Urine," presented at International Symposium on Plutonium in the Environment, held July 6-8, 1994 in Ottawa, Canada. ,
Swanson, S. R. and J. R. DiPetro (1994), "Recovery of Environmental Restoration Costs from DOD Contractors," in Proceedings, 20th Environmental Symposium and Exhibition: Department af Defense Environmental Security-Strategies for the 21 st Century, held March 14-17, 1994 in San Antonio, TX.
T a s l , J. J., F. C. Bold, B. J. Harrer, and J. W. Currie (1985), 0)-Site Consequences of Radiological Accidents: Methods, Costs and Schedules for Decontamination, NUREGICR- 3413, Pacific Northwest Laboratory, Richland, WA.
~
Tawil, J. J. and D. L. Strenge (1987), "Using Cost/Risk Procedures to Establish Recovery Criteria Following a Nuclear Reactor Accident," Health Physics, Vol. 52, No. 2, pp. 157-169.
Tawil, J. J. and F. C. Bold (1990-DRAFT), "Property Related Costs of Radiological Accidents," Unpublished Draft Report (cited with permission of the author and the contracting agency), Pacific Northwest Laboratory, Richland, WA.
Technical Steering Panel of the Hanford Environmental Dose Reconstruction Project ( 1994), Representative Hanford Radiation Dose Estimates, Draft Information Booklet, Richland, WA.
Technical Steering Panel of the Hanford Environmental Dose Reconstruction Project (1993, TSP Radiation Dose Newsletter, "CDC Awards Contracts for Completion of Dose Project Work," (June), Richland, WA.
Teres, J., H. N. Wellhouser, and M. B. Hawkins (1953), Operation Snapper: Decontamination of Aircraft, Project 6.5, Report to the Scientijic Director, WT-535, Wright Air Development Center, Wright-Patterson AFB, OH.
Titus, A. C. (1986), Bombs in the Backyard: Atomic Testing and American Politics, University of Nevada Press, Reno & Las Vegas, NV.
TMA Eberline ( 1993), A Cost-EfSective Approach to Remediation of Radiologically Contaminated Soil, videotape, TMA Eberline, Albuquerque, NM.
Tornblum, C. L. (1992), Environmental Restoration and Base Closure: How Clean is Clean Enough?, AD-A276559, Industrial College of the Armed Forces, Fort McNair, Washington, DC.
Bib-21

Bibliography (Continued) U.S. Air Force (1992a), Installation Restoration Program Stage 2, Remedial Investigation-Feasi-
bility Study for BOMARC Missile Accident Site, McGuire Air Force Base, New Jersey, Air Force Environmental Restoration Division, Brooks AFB, TX.
US. Air Force (1992b), Record of Decision, BOMARC Missile Accident Site, McGuire Air Force Base, New Jersey, AD-A26 1304, Air Force Environmental Restoration Division, Brooks AFB, TX.
U.S. Army (1995), Disposal of Chemical Agents and Munitions Stored at Pine Bluff Arsenal, Arkansas: Drafi Environmental Impact Statement, Aberdeen Proving Ground, MD.
Udall, S. (1994), The Myths of August: A Personal Exploration of Our Tragic Cold War Afsaair With the Atom, Pantheon Books, New York.
Vesper, B. E., M. Dooley, T. H. Mohaupt, and E. T. Bramlitt (1988), Cleanup of Johnston Atoll Missile Launch Facility, AD-A19299 1, Armed Forces Radiobiology Research Institute, Bethesda, MD.
Voelz, G. L. and J. N. Lawrence (1991), "A 42-Year Medical Follow-Up of Manhattan Project Plutonium Workers," Health Physics, Vol. 61, No. 2, pp. 181-190.
Viscusi, W. K. (1992), Fatal Tradeofss: Public & Private Responsibilities for Risk, p. 25, Oxford University Press, New York.
Wagner, T. P. (1991), n e Complete Guide to the Hazardous Waste Regulations: A Comprehen- sive, Step-by-step Guide to the Regulation of Hazardous Wastes Under RCRA, TSCA, HMTA, OSHA, and Supeifund, Second Edition, Van Nostrand Reinhold, New York.
Wallace, A. and E. M. Romney (1974), Feasibility and Alternate Procedures for Decontamina- tion and Post Treatment Management of Pu-Contaminated Areas in Nevada, UCLA- 12- 973, University of California at Los Angeles, Los Angeles, CA.
Warming, L. ( 1982), Weathering and Decontamination of Radioactivity Deposited on Asphalt Surfaces, Risg-M-2273, Risg National Laboratory, Roskilde, Denmark.
Warming, L. (1987), "Decontamination by Shotblasting of Radioactivity Deposited on an Asphalt Road," Radiation Protection Dosimetry," Vol. 21, No. 1/3, pp. 141-143.
Warming, L. ( 1984a), Forced Decontamination of Fission Products Deposited in Urban Areas: A Literature Review, Risg-M-2472, Risg National Laboratory, Roskilde, Denmark.
Bib-22

Bibliography (Continued) Warming, L. (1984b), Weathering and Decontamination of Radioactivity Deposited on Concrete
Surfaces, Risg-M-2473, Ris@ National Laboratory, Roskilde, Denmark.
Watts, C. P., D. J. Wilburn, and N. Botts (1994), "Characterization of a Department of Defense Facility Contaminated With Plutonium," 20th Environmental Symposium & Exhibition: Department of Defense Environmental Security-Strategies for the 2 I st Century, held March 14-17, 1994 in San Antonio, TX.
Weart, S. R. (1988), Nuclear Fear: A History Of Images, Harvard University Press, Cambridge, MA.
Weickhardt, U. (1 991), "Medical Prophylaxis for Swiss Nuclear Workers," Soz Praventivmed, Vol. 36, No. 4-5, p. 302 (English-language Abstract).
Weisgall, J. M. (1994), Operation Crossroads: The Atomic Tests at Bikini Atoll, Naval Institute Press, Annapolis, MD.
Werner, L. B. and S. R. Sinnreich (1951), Operation Greenhouse: Scientific Director's Report, Annex 6.7, Contamination-Decontamination Studies, WT-27, U. S. Naval Radiological Defense Laboratory, San Francisco, CA and Army Chemical Center, MD.
Western, A., V. Bostic, and T. Roy (1973), Soil Stabilization as a Means of Plutonium Decontamination at the Nevada Test Site, Reynolds Electrical and Engineering Company, Las Vegas, NV.
White, J. M. (1980), "The Decontamination of Radium from a Commercial Building Located in a Large Canadian City," American Industrial Hygiene Journal, Vol. 41, pp. 49-60.
Woolfson 2. (1989), "Decontamination Units of the Soviet Army During and After Chernobyl, Report on the USSR, Vol. 1, No. 22, pp. 9-12.
Yang, J. W., R. C. Dower, and M. Menefee (1984), The Use of Economic Analysis in Valuing Natural Resource Damages, Department of Commerce, Washington, DC.
Zeller, K. F. (1984), T h e Environmental Impact Statement," in Atmospheric Science and Power Production, DOE/TIC-27601, D. Randerson (ed.), Department of Energy, Oak Ridge, TN.
Bib-23

DISTRIBUTION:
10 Department of Energy Attn: Sarbes Acharya (EH-32)
Jeng Chang (DP-21) Dae Y. Chung (DP-311) Thaddis (Ted) Dobry (DP-24) Lisa Gordon-Hagerty (DP-23) Kamiar Jamali (DP-3 1 1) Marty Letourneau (EM-33) Kenneth G. Murphy (EH-53) Harold T. Peterson (EH-412) Andy Wall0 (EH-412)
Washington, DC 20585
2
1
2
1
1
Department of Energy Attn: Glenn Binns
Nanette Founds Albuquerque Operations Office P.O. Box 5400 Albuquerque, NM 87 185
George Apostolakis University of California, Los Angeles Boelter Hall, Room 5532 Los Angeles, CA 90024-1597
Argonne National Laboratory Attn: Caroline Herzenberg
9700 S. Cass Avenue Argonne, IL 60439
Marty Simenon
Edward M. Austin 3017 Matador Drive N.E. Albuquerque, NM 871 11
Robert J. Bartholomew Bartholomew Engineering, Inc. 901 18th St. #20500 LOS Alamos, NM 87544-3009
DIST- 1
Battelle Pacific Northwest Laboratory Attn: Jim Dukelow (K-8-37)
Bruce Napier (K-354) William Kennedy (K-354) Dennis Strenge (K-354)
P.O. Box 999 Richland, WA 99352
Roger Blond Booz-Allen & Hamilton 4330 East West Highway Bethesda, MD 20814
Edward T. Bramlitt 8813 Camino Osito N.E. Albuquerque, NM 871 11
Brookhaven National Laboratory Attn: Vinod Mubayi (Bldg. 130)
Lev Neymotin (Bldg. 130) Caper Sun (Bldg. 703M)
Upton, NY 11973
David M. Brown Paul C. Rizzo Associates 300 Oxford Drive Monroeville, PA 15230
Harold Careway W C 754 General Electric 175 Curtner Ave. San Jose, CA 95129
Defense Nuclear Agency Attn: LTJG John L. Crapo Armed Forces Radiobiology Research Institute Bethesda, MD 20889-5145
DIST-2
DISTRIBUTION (Continued):
3
1
1
1
1
Defense Nuclear Agency Attn: MAJ Carolyn Chorak
MAJ David V. Kramer Harry Stumpf (CSLELEEE)
6801 Telegraph Road Alexandria, VA 223 10-3398
Stephen Dean Environmental Protection Agency 75 Hawthorne Street, Al-1 San Francisco, CA 94129-125044
Barbara Deshler IT Corp. 4330 S. Valley View, Suite 114 Las Vegas, NV 89103
COL Tom Distelhorst U.S. Air Force, AFSC/SEWN 9700 Avenue "G" S.E. Kirtland AFB, NM 87117
Sidney Drell Stanford Linear Accelerator Center P.O. Box 4349 Stanford, CA 94309
1
1
Roy Eckart Mechanical, Industrial, and Nuclear Engineering University of Cincinnati Cincinnati, OH 45221
Michael Emerson PLG Building 3, Suite 210 2201 San Pedro Drive N.E. Albuquerque, NM 87 110
DIST-3
DISTRIBUTION (Continued):
Dave Ericson Ogden Environmental and Energy Services 7301-A Indian School N.E. Albuquerque, NM 87 1 10
Dr. Charles Eddington 1121 Basil Drive New Burn, NC 28562
Environmental Protection Agency Attn: Mike Boyd (6603J)
Gordon Burley (6601 J) Craig Conklin (66025) Brad Nelson (6602J) Allan Richardson (66025) Stuart Walker (6603J)
401 "M" Street, S.W. Washington, DC 20460
Chet Everline Scientech, Inc. 191 Calle Magdelena, Suite 290 Encinitas, CA 92024
Federal Emergency Management Agency Attn: Vernon Adler Room 609 500 "C" Street, S.W. Washington, DC 20472
Field Command Defense Nuclear Agency Attn: COL William Dassler
MAJ Joseph Kimbrell 1680 Texas S.E. Kirtland AFB, NM 87117-5669
Terry Foppe M.H. Chew & Associates 855 Lupine Street Golden, CO 80401
DIST-4
DISTRIBUTION (Continued):
1
1
1
1
1
1
1
1
Wiliam R. Fuller PLG 4590 MacArthur Blvd., Suite 400 Newport Beach, CA 92660
Fred Gibson Gibson Trucking P.O. Box 70 La Jara, CO 88140
Robert Gobel Clark University Center for Technology, Environment, and Development 950 Main Street Worcester, MA 01610-1477
Norm Grandjean 7225 Vivian N.E. Albuquerque, NM 87 109
Vernon H. Guthrie JBF Associates, Inc. Technology Drive 1000 Technology Park Center Knoxville, TN 37932-3353
Roger P. Hansen IT Corp. 5600 South Quebec St., Suite 280 D Englewood, CO 80111
Wayne R. Hansen 557 Bryce Avenue White Rock, NM 87544
Wayne C. Hanson 1902 Yew Street Bellingham, WA 98228
DIST-5

DISTRIBUTION (Continued):
Jon Helton Department of Mathematics Arizona State University Tempe, AZ 85287
Martin Hestmark Environmental Protection Agency 999 18th Street, Suite 500 Denver, CO 80204
Idaho National Engineering Laboratory Attn: Mike Abbott (MS 2110)
P.O. Box 1625 Idaho Falls. ID 83415
Chuck Dobbe (MS 3840)
Inhalation and Toxicology Research Institute Attn: Bruce Boecker
Bill Griffith Bobby Scott
P.O. Box 5890 Albuquerque, NM 87 185
Nels Johnson TMA-Eberline, Nuclear Services 5635 Jefferson N.E. Albuquerque, NM 87109
Pat A. Jonker College of Business & Economics, MS 6001 University of Nevada Las Vegas 4505 Maryland Parkway Las Vegas, NV 89154
William E. Joyce Halliburton NUS Corp. 9 10 Clopper Road Gaithersburg, MD 20878-1399
DIST-6
DISTRIBUTION (Continued):
Mohsen Khatib-Rahbar Energy Research, Inc. P.O. Box 2034 Rockville, MD 20847-2034
Alan Kolaczkowski SAIC 2109 Air Park Road S.E. Albuquerque, NM 87106
Lawrence Livermore National Laboratory Attn: Lynn R. Anspaugh (L-453)
Charles H. Hall (L-085) Steve Homan (L-380) David W. Layton (L-453) William L. Robison (L-453) Joe H. Shinn (L-453) Douglas R. Stephens (L-085) Tore Straume (L-453)
P.O. Box 808 Livermore, CA 94550
Los Alamos National Laboratory Attn: William C. Inkret (K-483)
Bruce Letellier (F-684) Don MacFarlane (K-557) Desmond Stack (K-557) George L. Voelz (K-404)
P.O. Box 1663 Los Alamos, NM 87545
Pat Melloy Melloy Mobile Storage 415 Rankin Road N.E. Albuquerque, NM 87107
John Motsch
U.S. Air Force 1651 First Street S.E. Kirtland AFB, NM 87117-5617
SA- ALC/NWIL
DIST-7
DISTRIBUTION (Continued):
1
5
2
1
1
1
1
Jim Meyer Scientech Suite 100 11 82 1 Parklawn Drive Rockville, MD 20852
Nuclear Regulatory Commission Attn: Mark Cunningham (9F31)
Mary Drouin (10F31) Christiana Lui (9F31) Joe Murphy (RES) Brian Richtor
Washington, DC 20555
Oak Ridge National Laboratory Attn: Steve Fisher (MS-8057)
P.O. Box 2009 Oak Ridge, TN 37831
Sherrel Greene (MS-8057)
Kent Parker Envirocare of Utah, Inc. 46 W. Broadway, Suite 240 Salt Lake City, UT 84101
Paolo Pascetta Environmental Protection Agency 26 Federal Plaza, Room 759 New York, NY 10278
Charles Perrow Institute for Social & Policy Studies Yale University New Haven, CT 06520
Rocky Flats Plant Attn: Vern L. Peterson (T886B) P.O. Box 464 Golden, CO 80402
DIST-8
DISTRIBUTION (Continued):
1
1
1
2
1
1
1
Phil Reardon PCR Technologies 8416 Yeager Drive N.E. Albuquerque, NM 87109
Marc Rothschild Halliburton NUS Suite 202 1303 S. Central Ave. Kent, WA 98032
Pantex Plant Attn: Roy Hedtke (Bldg. 12-127) P.O. Box 30020 Amarillo, TX 79177
SAIC Attn: Roy Karimi
Abe Zeitoun 20201 Century Blvd., Suite 300 Germantown, MD 20874
Donald Seyler Air Force Nuclear Weapons Sys. Safety 9407 Farmingdale Ave. Walkersville, MD 21793-91 18
William Stevens 68 Calle Coyote Road Arroyo Hondo, NM 87514
Jack J. Tawil Research Enterprises, Inc. 2000 Logston Boulevard Richland, WA 99352
DIST-9

DISTRIBUTION (Continued):
4
1
1
1
3
1
Technadyne Engineering Consultants, Inc. Attn: David Chanin
Michael Krawczyk Walter Murfin Burton Newmark
8500 Menaul Blvd. N.E., Suite A225 Albuquerque, NM 87 1 12
LTC Marcia A. Thornton U.S. Air Force, AFSC 9700 Avenue "G" S.E. Kirtland AFB, NM 87117-5670
University of New Mexico Attn: Prof. Eric Haskin Department of Chemical & Nuclear Engineering University of New Mexico Albuquerque, N M 87131
Lee Vetter HQAMCEEGW Room E119 5 10 "B" Street Scott AFB, IL 62225-5020
Westinghouse Hanford Company Attn: Lewis D. Muhlestein (H4-66)
Anthony V. Savino (H4-64) Arlen R. Schade (H4-60)
P.O. Box 1970 Richland, WA 99352
Westinghouse Idaho Nuclear Company, Inc. Attn: Doug R. Wenzel Idaho National Engineering Laboratory Box 4000 Idaho Falls, ID 83415-5209
DIST- 10
DISTRIBUTION (Continued):
2
1
Westinghouse Savannah River Company Attn: Kevin O’Kula (Bldg. 730-2B)
Jacqueline East (Bldg. 730-2B) Savannah River Site P.O. Box 616 Aiken, SC 29802
Keith Woodard PLG Suite 620 East 7315 Wisconsin Ave. Bethesda, MD 20814-3209
DIST- 1 1

DISTRIBUTION (Continued):
1 1 1 1 1 1 1 1 1 1 1 10 1 1 1 1 1 1 1 1 1 1 1 1 1 1 1 1 1 1 1 1 1 5 1 2
MS 0425 MS 0425 MS 0899 MS 0458 MS 0748 MS 0748 MS 0748 MS 0755 MS 0755 MS 0718 MS 0718 MS 0718 MS 0718 MS 0718 MS 0715 MS 1328 MS 1146 MS 1146 MS 1146 MS 0763 MS 0631 MS 0491 MS 0491 MS 0490 MS 0490 MS 0490 MS 0492 MS 0492 MS 0405 MS 0405 MS 0405 MS 0491 MS 9018 MS 0899 MS 0619 MS 0100
L.W. Connell, 5415 A.C. Payne, Jr., 4115 J.A. Kesti, 4415 L.R. Gilliom, 5133 F.T. Harper, 6413 S.L. Humphreys, 6413 M.L. Young, 6413 H.W. Church, 6612 B.D. Zak, 6612 F.L. Kanipe, 6641 G.S. Mills, 6641 K.S. Neuhauser, 6641 J.L. Sprung, 6641 R.H. Y oshimura, 664 1 R.E. Luna, 6652 H.N. Jow, 6741 L.A. Miller, 9364 L.F. Restrepo, 9364 J.S. Philbin, 9365 D.B. Clauss, 9614 W.C. Nickell, 12300 R.E. Smith, 12302 P.E. D’Antonio, 12324 J.A. Cooper, 12331 J.P. Hoffman, Jr., 12331 S.D. Spray, 12331 G.A. Sanders, 12332 C.D. Shirley, 12332 D.E. Bennett, 111, 12333 R.J. Breeding, 12333 D.D. Carlson, 12333 Y.T. Lin, 12333 Central Technical Files, 8523-2 Technical Library, 4414 Print Media, 12615 Document Processing, 76 13-2 For DOWOSTI
DIST- 12