1994: Characterization of Fractures and Multiphase … · CHARACTERIZATION OF FRACTURES AND...
12
CHARACTERIZATION OF FRACTURES AND MULTIPHASE FLOW IN FRACTURED PERMEABLE ROCKS USING NMR IMAGING TECHNIQUES Songhua Chen, Xiaoli Yao, Jinli Qiao, and A. Ted Watson Department of Chemical Engineering, Texas A&M University, College Station, TX 77843 Abstract A new noninvasive method is presented for laboratory characterization of fractures in permeable media using relaxation-weighted NMR imaging techniques. The method is based on the fact that relaxation rates in fractures and those in surrounding porous matrix are substantially different. Thus, by selectively suppressing imaging signals from either fractures or porous matrix, one can highlight fluid distributions in either of these regions so that fractures can be unambiguously iden- tified and surrounding porous structures can be characterized. The advantages over conventional NMR spin-echo imaging are demonstrated. We also demonstrate that the technique can be used to speed acquisitions of images of fluid distributions in porous matrix. In addition, a two-phase displacement experiment was conducted to investigate transport features related to fractured sys- tems. Introduction Many petroleum producing reservoirs and water supplying aquifers around the world are fractured sedimentary rocks. The presence of fractures greatly complicates the dynamics of flow within porous media, particularly in situations for which multiple fluid phases are present. Most models for multiphase flow (see, e.g., Refs. 1&2) are based on simplified or idealized conceptual representations which generally have not yet been sufficiently validated with experimental data. A key reason for this has been the lack of availability of tools to probe the detziled fracture and fluid flow distributions. CT x-ray scanning and nuclear magnetic resonance imaging (MRI) provide unprecedented op- portunity to characterize fractures and flow distributions within porous media. CT scanning is used routinely for sample screening3. It has also been used for detailed fracture characterization and analysis of gas flow within porous media4. Petrophysical applications of MRI, which have generally been less well developed, offers a number of advantages compared to CT scanning. One interesting characteristic is that there is a wider range of operations available so that experiments can be designed to enhance various physical features. Here, we develop relaxation-weighted MRI .techniques for characterizing fractures and flow in fractured media. Through selection of the imag- ing protocol, the signal from either the fractures or matrix can be highlighted, while the other signal can be virtually eliminated. A similar approach5f6has been used previously in medical areas for improving contrasts between lipid and organs or between tumor and fatlmuscle; its petrophysical application has not been explored. The considerable improvement of these techniques compared to conventional spin-echo imaging for investigating fractured media is demonstrated. The method for rapid imaging acquisition using this approach is presented. The use of MRI techniques to monitor multiphase displacement in fractured media is also demonstrated.
Transcript of 1994: Characterization of Fractures and Multiphase … · CHARACTERIZATION OF FRACTURES AND...
CHARACTERIZATION OF FRACTURES AND MULTIPHASE FLOW IN FRACTURED PERMEABLE ROCKS USING NMR IMAGING
TECHNIQUES
Songhua Chen, Xiaoli Yao, Jinli Qiao, and A. Ted Watson Department of Chemical Engineering, Texas A&M University, College Station, TX 77843
Abstract
A new noninvasive method is presented for laboratory characterization of fractures in permeable media using relaxation-weighted NMR imaging techniques. The method is based on the fact that relaxation rates in fractures and those in surrounding porous matrix are substantially different. Thus, by selectively suppressing imaging signals from either fractures or porous matrix, one can highlight fluid distributions in either of these regions so that fractures can be unambiguously iden- tified and surrounding porous structures can be characterized. The advantages over conventional NMR spin-echo imaging are demonstrated. We also demonstrate that the technique can be used to speed acquisitions of images of fluid distributions in porous matrix. In addition, a two-phase displacement experiment was conducted to investigate transport features related to fractured sys- tems.
Introduction
Many petroleum producing reservoirs and water supplying aquifers around the world are fractured sedimentary rocks. The presence of fractures greatly complicates the dynamics of flow within porous media, particularly in situations for which multiple fluid phases are present. Most models for multiphase flow (see, e.g., Refs. 1&2) are based on simplified or idealized conceptual representations which generally have not yet been sufficiently validated with experimental data. A key reason for this has been the lack of availability of tools to probe the detziled fracture and fluid flow distributions.
CT x-ray scanning and nuclear magnetic resonance imaging (MRI) provide unprecedented op- portunity to characterize fractures and flow distributions within porous media. CT scanning is used routinely for sample screening3. It has also been used for detailed fracture characterization and analysis of gas flow within porous media4. Petrophysical applications of MRI, which have generally been less well developed, offers a number of advantages compared to CT scanning. One interesting characteristic is that there is a wider range of operations available so that experiments can be designed to enhance various physical features. Here, we develop relaxation-weighted MRI .techniques for characterizing fractures and flow in fractured media. Through selection of the imag- ing protocol, the signal from either the fractures or matrix can be highlighted, while the other signal can be virtually eliminated. A similar approach5f6 has been used previously in medical areas for improving contrasts between lipid and organs or between tumor and fatlmuscle; its petrophysical application has not been explored. The considerable improvement of these techniques compared to conventional spin-echo imaging for investigating fractured media is demonstrated. The method for rapid imaging acquisition using this approach is presented. The use of MRI techniques to monitor multiphase displacement in fractured media is also demonstrated.
Relaxation-Contrasted Images for Fracture Characterization
Conventional NMR spin-echo images7, for which the intensity is proportional to the amount of the observed fluid phase, can in principle be used to characterize fractures in fluid saturated porous media. The mapping of fracture distributions and estimation of fracture sizes would then require a discrimination method based on assumed properties or other empirical means, similar to those used with CT-scanning4. Accurate fracture characterization will be difficult for systems with very thin fractures, or variations in porosity resulting from other means, such as bedding planes. Also, the conventional spin-echo images may suffer poor signal-to-noise in matrix regions for samples in which the spin-density is much greater in the fractures than in the matrix.
With the imaging method developed here, the NMR signals from the fluid in either the porous matrix region or in the fractures can be virtually eliminated, while the signal intensity from the fluid in the other region is kept high. To achieve this, the method utilizes the feature that the NMR relaxation rate in porous media is dominated by relaxation at surface^^-'^ so that it is sensitive to the surface area-to-pore volume (S/V). Thus, the relaxation times for fluid protons in fractures and in the porous matrix are different since the former has much smaller S/V compared with the latter.
The pulse sequence we used is the inversion-recovery" spin-echo12 sequence (IRSE), which includes two functional parts. The first part (IR) can be used to suppress the signal from the chosen region. Suppose that fluid in one of the regions can be approximately characterized by relaxation time TI. Then, the time evolution of magnetization is described by
provided that the repetition time between acquisitions is much longer than TI. Note that the signal from that region would be suppressed if the inversion time TI were selected so that
Obviously, TIo would be different for signals having different relaxation times TI. Consider now the application of a spin-echo (SE) sequence after the inversion recovery. The
magnetization decay is described by
M(TI + TE) = Mo exp(-TE/Tz){l - 2 exp(-TI/Tl) + 2 exp[-(TR - TE/2)/Tl] - exp(-TRJTl)),
(3) where TR is the repetition time. For fluids in porous media, T2 is short so that a small TE has to be chosen to observe the signal. Therefore, TE (< TR is generally valid, in which case the above expression can be simplified to
M(TI + TE) = Mo exp(-TE/T2)[1- 2 exp(-TI/Tl) 4- exp(-TR/Ti)I- (4)
The signal can be eliminated by selecting T I so that
The above expression is based on the assumption of the validity of a single TI for the entire region under investigation. The spins in the fractures may be suitably treated as relaxing at a single rate. However, the relaxation in the pore matrix usually is not well represented with a single exponential. If one uses a stretched exponential function to describe the decay in the rock matrix, the magnetization in the matrix is minimized at
where the repetition time TR >> TI, is assumed. This assumption is reasonable considering that TI in porous matrix is much shorter than that in fractures, so that the condition is easy to satisfy.
For image acquisition, the signals from fractures and from pore matrix appear in different pixels, so one can use a single exponential function to describe relaxation decay in the fractures,
and a stretched exponential relaxation model for relaxation in the pore matrix,
Mimatri,(TI + T E ) = Mo;{l - 2 e x p [ - ( ~ ~ / ~ ~ , ; ) ~ ' ~ ] ) f (~z; , TE). (8)
Here, the decay function f(T2,TE) could be modeled with a stretched exponential, single-, or multi-exponential function. The approach of using a single exponential representation for fluids in fractures has been tested experimentally. We found that if we use stretched exponential to calculate relaxation in fractures, we obtain TI values within 3% of those calculated with a single exponential, and the stretch exponent is nearly unity.
A schematic diagram of the decay curves for fluids with two characteristic relaxation rates is shown in Fig. 1. In this illustration, the two decay curves differ greatly in TI. For such a case, one can suppress either of the signals by selection of the T I value. While the intensity of one of the signals is suppressed, the intensity of the other signal is not affected significantly. This selection can be used to highlight the signals from either the porous matrix or fractures in fluid saturated porous systems. To highlight the fractures, one can eliminate signals from the porous matrix by choosing the inversion time that satisfies Eq. (5) using Tl = TlfraCt,,. On the other hand, to highlight the details of the porous matrix, one can choose the inversion time to satisfy Eq. (6).
Another advantage of the present approach is the capability for achieving faster image acqui- sitions. From Eq. (5), we see that for shorter repetition times, the null of the signal occurs at shorter TI. For example, if TR = TI were chosen, TIo = 0.387'1, compared to TI0 = 0.69T1 for TR + oo. Thus, a smaller value of TIo can be chosen with a smaller repetition time TR, resulting in a reduction of the total imaging time. We will discuss later the applications of using the short repetition time to highlight the fluid distributions in the matrix without sacrificing signal intensity.
Quantitative determination of the amount of fluid at various locations within a fully saturated sample, from which the porosity distribution could be determined, can be achieved by modeling the relaxation functions and extrapolation to determine intrinsic magnetizations9y13. The relaxation of fluid within the fracture regions should be well represented by single exponential models.
We note that the capability to highlight either fractures and porous matrix is a unique advantage provided by the IRSE sequence. Neither CT scanning technique nor conventional NMRI with TE weighting has similar capabilities.
Experimental Procedures
The samples in the study include several Berea sandstones, an Indiana limestone, two Arkansas- Gold sandstones, and a Calico limestone. Those samples were cored one inch in diameter with lengths ranging from 1.5 inch to 2.25 inch.
The Calico limestone sample contains a natural fracture. For the rest of the samples, artificial fractures were cut parallel to the cylindrical axes of the samples. The width of the fractures were controlled by sandwiching in one or two layers of sieved glassbeads. The sizes of the inserted beads range from 0 (no beads added) to 250 pm for different samples. The pore volume in the fracture can be varied by the amount of beads inserted between the pieces of the core samples. Epoxy-sealant was applied on the cylindrical surface and on the edges of the fractures. During measurements,
the location of the fractures were searched using one-dimensional profiles. Then the sample was oriented so that the fractures were parallel to the horizontal direction.
All NMR measurements were performed in a GE 2-Tesla Omega CSI system with a 1.75 inch i.d. birdcage rf coil under a regulated room temperature. Most of the images were acquired at TE = 3.1 msec, the minimum echo time allowed by the machine for two-dimensional (2D) images, unless stated otherwise. The frequency encoding gradient strengths used in these experiments were 4170 Hz/mm or 2085 Hz/mm for gradients applied in the direction perpendicular, or parallel, to the cylindrical axis, respectively. The slice thicknesses of the one-dimensional ( ID) and 2D images are 5 mm, unless stated otherwise.
Water was used as the saturating fluid for the fracture and porous matrix cha.racterization experiments. For the two-phase experiments, deuterium oxide ( D 2 0 ) and hexadecane were used as the aqueous and oleic phases, respectively. The use of D 2 0 results in the proton NMR images representing only the oil intensities.
Results and Discussion
Fracture Detection
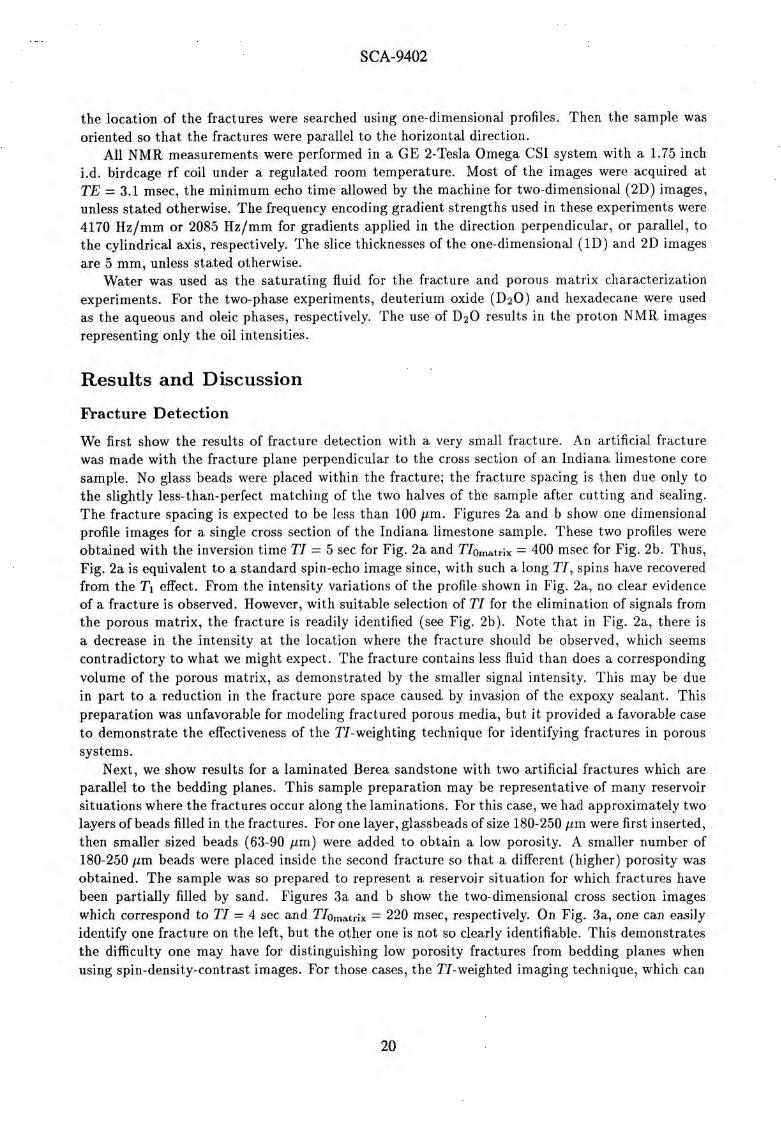
We first show the results of fracture detection with a very small fracture. An artificial fracture was made with the fracture plane perpendicular t o the cross section of an Indiana limestone core sample. No glass beads were placed within the fracture; the fracture spacing is then due only to the slightly less-than-perfect matching of the two halves of the sample after cutting and sealing. The fracture spacing is expected to be less than 100 pm. Figures 2a and b show one dimensional profile images for a single cross section of the Indiana limestone sample. These two profiles were obtained with the inversion time TI = 5 sec for Fig. 2a and TIomtrix = 400 msec for Fig. 2b. Thus, Fig. 2a is equivalent t o a standard spin-echo image since, with such a long TI, spins have recovered from the TI effect. From the intensity variations of the profile shown in Fig. 2a, no clear evidence of a fracture is observed. However, with suitable selection of TI for the elimination of signals from the porous matrix, the fracture is readily identified (see Fig. 2b). Note that in Fig. 2a, there is a decrease in the intensity at the location where the fracture should be observed, which seems contradictory t o what we might expect. The fracture contains less fluid than does a corresponding volume of the porous matrix, as demonstrated by the smaller signal intensity. This may be due in part t o a reduction in the fracture pore space caused. by invasion of the expoxy sealant. This preparation was unfavorable for modeling fractured porous media, but it provided a favorable case t o demonstrate the effectiveness of the TI-weighting technique for identifying fractures in porous systems.
Next, we show results for a laminated Berea sandstone with two artificial fractures which are parallel t o the bedding planes. This sample preparation may be representative of many reservoir situations where the fractures occur along the laminations. For this case, we had approximately two layers of beads filled in the fractures. For one layer, glassbeads of size 180-250 pm were first inserted, then smaller sized beads (63-90 pm) were added t o obtain a low porosity. A smaller number of 180-250 pm beads were placed inside the second fracture so that a different (higher) porosity was obtained. The sample was so prepared to represent a reservoir situation for which fractures have been partially filled by sand. Figures 3a and b show the two-dimensional cross section images which correspond t o TI = 4 sec and TIo,,~,;, = 220 msec, respectively. On Fig. 3a, one can easily identify one fracture on the left, but the other one is not so clearly identifiable. This demonstrates the difficulty one may have for distinguishing low porosity fractures from bedding planes when using spin-density-contrast images. For those cases, the TI-weighted imaging technique, which can
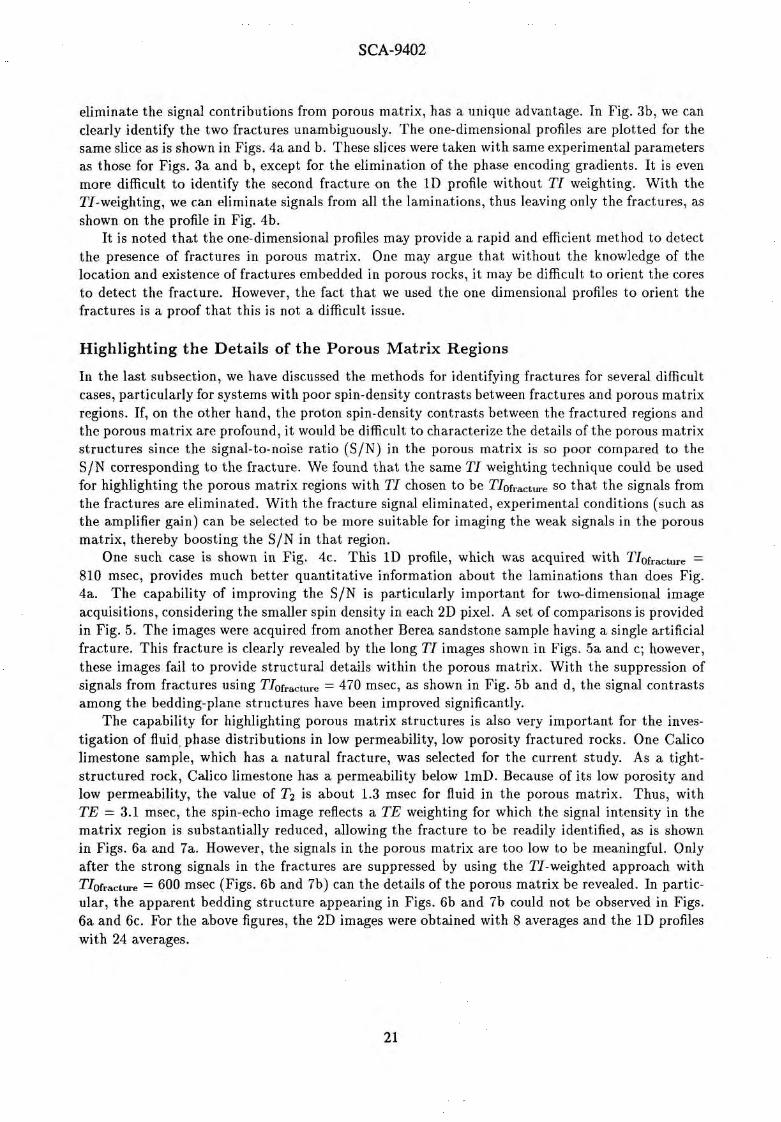
eliminate the signal contributions from porous matrix, has a unique advantage. In Fig. 3b, we can clearly identify the two fractures unambiguously. The one-dimensional profiles are plotted for the same slice as is shown in Figs. 4a and b. These slices were taken with same experimental parameters as those for Figs. 3a and b, except for the elimination of the phase encoding gradients. It is even more difficult to identify the second fracture on the 1D profile without T I weighting. With the TI-weighting, we can eliminate signals from all the laminations, thus leaving only the fractures, as shown on the profile in Fig. 4b.
It is noted that the one-dimensional profiles may provide a rapid and efficient method to detect the presence of fractures in porous matrix. One may argue that without the knowledge of the location and existence of fractures embedded in porous rocks, it may be difficult to orient the cores to detect the fracture. However, the fact that we used the one dimensional profiles to orient the fra.ctures is a proof that this is not a difficult issue.
Highlighting the Details of the Porous Matrix Regions
In the last subsection, we have discussed the methods for identifying fractures for several difficult cases, particularly for systems with poor spin-density contrasts between fractures aad porous matrix regions. If, on the other hand, the proton spin-density contrasts between the fractured regions and the porous matrix are profound, it would be difficult to characterize the details of the porous matrix structures since the signal-to-noise ratio (SIN) in the porous matrix is so poor compared to the S /N corresponding to the fracture. We found that the same T I weighting technique could be used for highlighting the porous matrix regions with T I chosen to be TIofracture SO that the signals from the fractures are eliminated. With the fracture signal eliminated, experimental conditions (such as the amplifier gain) can be selected to be more suitable for imaging the weak signals in the porous matrix, thereby boosting the SIN in that region.
One such case is shown in Fig. 4c. This 1D profile, which was acquired with TIofracture = 810 msec, provides much better quantitative information about the laminations than does Fig. 4a. The capability of improving the SIN is particularly important for two-dimensional image acquisitions, considering the smaller spin density in each 2D pixel. A set of comparisons is provided in Fig. 5. The images were acquired from another Berea sandstone sample having a single artificial fracture. This fracture is clearly revealed by the long T I images shown in Figs. 5a and c; however, these images fail to provide structural details within the porous matrix. With the suppression of signals from fractures using TIofractur, = 470 msec, as shown in Fig. 5b and d, the signal contrasts among the bedding-plane structures have been improved significantly.
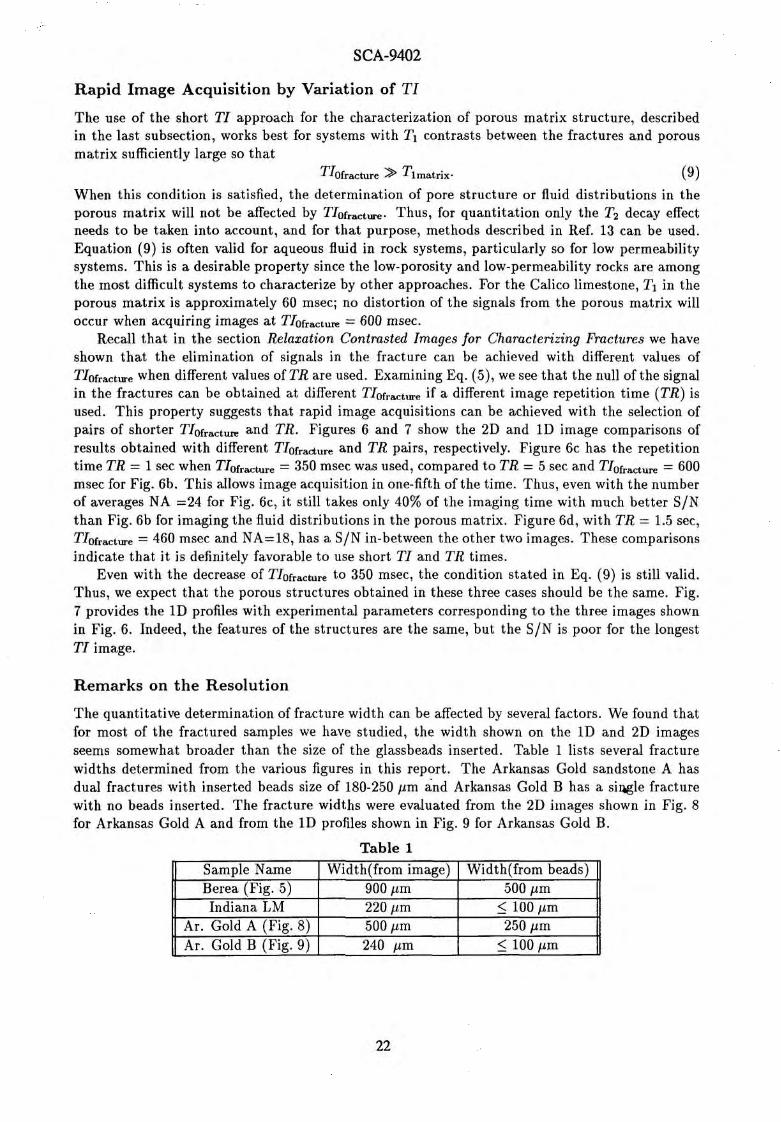
The capability for highlighting porous matrix structures is also very important for the inves- tigation of fluid, phase distributions in low permeability, low porosity fractured rocks. One Calico limestone sample, which has a natural fracture, was selected for the current study. As a tight- structured rock, Calico limestone has a permeability below 1mD. Because of its low porosity and low permeability, the value of T2 is about 1.3 msec for fluid in the porous matrix. Thus, with TE = 3.1 msec, the spin-echo image reflects a TE weighting for which the signal intensity in the matrix region is substantially reduced, allowing the fracture to be readily identified, as is shown in Figs. 6a and 7a. However, the signals in the porous matrix are too low to be meaningful. Only after the strong signals in the fractures are suppressed by using the TI-weighted approach with TIofract,, = 600 msec (Figs. 6b and 7b) can the details of the porous matrix be revealed. In partic- ular, the apparent bedding structure appearing in Figs. 6b and 7b could not be observed in Figs. 6a and 6c. For the above figures, the 2D images were obtained with 8 averages and the 1D profiles with 24 averages.
Rapid Image Acquisition by Variation of TI
The use of the short TI approach for the characterization of porous matrix structure, described in the last subsection, works best for systems with TI contrasts between the fractures and porous matrix sufficiently large so that
TI~fracture T~rnatrix. (9) When this condition is satisfied, the determination of pore structure or fluid distributions in the porous matrix will not be affected by TIofraCt,. Thus, for quantitation only the T2 decay effect needs t o be taken into account, and for that purpose, methods described in Ref. 13 can be used. Equation (9) is often valid for aqueous fluid in rock systems, particularly so for low permeability systems. This is a desirable property since the low-porosity and low-permeability rocks are among the most difficult systems to characterize by other approaches. For the Calico limestone, TI in the porous matrix is approximately 60 msec; no distortion of the signals from the porous matrix will occur when acquiring images at TIofractuR = 600 msec.
Recall that in the section Relaxation Contrasted Images for Characterizing Fractures we have shown that the elimination of signals in the fracture can be achieved with different values of TIofract,e when different values of TR are used. Examining Eq. (5), we see that the null of the signal in the fractures can be obtained at different TIofract, if a different image repetition time (TR) is used. This property suggests that rapid image acquisitions can be achieved with the selection of pairs of shorter TIofract, and TR. Figures 6 and 7 show the 2D and 1D image comparisons of results obtained with different TIofradure and TR pairs, respectively. Figure 6c has the repetition time TR = 1 sec when TIofracture = 350 msec was used, compared to TR = 5 sec and TIofracture = 600 msec for Fig. 6b. This allows image acquisition in one-fifth of the time. Thus, even with the number of averages NA =24 for Fig. 6c, it still takes only 40% of the imaging time with much better S/N than Fig. 6b for imaging the fluid distributions in the porous matrix. Figure 6d, with TR = 1.5 sec, TIofract,, = 460 msec and NA=18, has a S/N in-between the other two images. These comparisons indicate that i t is definitely favorable to use short TI and TR times.
Even with the decrease of TIofractur, to 350 msec, the condition stated in Eq. (9) is still valid. Thus, we expect that the porous structures obtained in these three cases should be the same. Fig. 7 provides the 1D profiles with experimental parameters corresponding to the three images shown in Fig. 6. Indeed, the features of the structures are the same, but the S/N is poor for the longest TI image.
Remarks on the Resolution
The quantitative determination of fracture width can be affected by several factors. We found that for most of the fractured samples we have studied, the width shown on the 1D and 2D images seems somewhat broader than the size of the glassbeads inserted. Table 1 lists several fracture widths determined from the various figures in this report. The Arkansas Gold sandstone A has dual fractures with inserted beads size of 180-250 pm and Arkansas Gold B has a sisgle fracture with no beads inserted. The fracture widths were evaluated from the 2D images shown in Fig. 8 for Arkansas Gold A and from the 1D profiles shown in Fig. 9 for Arkansas Gold B.
Table 1 ..
L.
Width(from image) 900 pm 220 pm 500 pm 240 pm
Sample Name Berea (Fig. 5) Indiana LM
Ar. Gold A (Fig. 8) Ar. Gold B (Fig. 9)
Width(from beads) 500 pm
5 100 pm 250 pm
5 100 pm

There are several factors which can affect the estimate of size. One commonly occurring effect for fluid saturated porous systems arises from the inhomogeneous linebroadening. This effect will be obvious for broad linewidth samples such as Berea sandstone (LW=2300-3440Hz). Since the readout gradients are 4170Hz/mm for cross sectional images and 2085HzJmm for longitudinal images, the corresponding resolutions are 60 and 120 pm/pixel(650 and 1300 Hzlpixel), respectively. Although the resolutions calculated with these imaging gradients are smaller, or approximately equal to, the fracture widths, these resolutions are smaller than the actually achievable image resolutions, which are restricted by the linewidth of several rock samples in the study. Since Arkansas Gold sandstone has narrower spectral linewidths (1260 Hz) than Berea, as does Indiana limestone (320 Hz), it is expected that the effect of linebroadening on the fracture width determination should be less for the Arkansas Gold and Indiana limestone than for Berea. The results in Table 1 seem to support this argument. Also, comparing the two images shown in Fig. 8, the fracture width calculated from the sagittal image is more accurate than that from the longitudinal image, which is consistent with the fact that the pixel resolution is only a half in the longitudinal plane a,s that in the sagittal plane.
The estimation of fracture widths from the images can also be affected by the image slice thickness and the line-up of the fractures with the gradient. However, the line-up problem would not be as important for 2D images as for 1D profiles. Also, the broader fracture width determined from images may be partially caused by the handling during epoxy sealing.
It must be pointed out that these problems do not prohibit us from using the technique to identify fractures embedded in porous matrix. Practically, because of the irregularity and roughness of the fracture surfaces in natural fractures (Figs. 6 and 7), it is inevitable that the determination of fracture width using images carries a small range of error. Nevertheless, the technique presented in this report evidently shows that both the fractures and the underlying porous matrix structures can be well characterized.
Two-Phase Displacement in Fractured Rock
An experiment was conducted for which the fluid distribution was observed during a two-phase displacement experiment on a fractured sample. An Arkansas-Gold sandstone sample with a per- meability of k = 14.6 mD and porosity 4 = 14.4% was selected. The sample was prepared so that the ends of the fracture were sealed with epoxy-sealant, resembling the situation of a fracture being embedded in porous matrix. The sample was initially saturated with oil. During the displace- ment process, D 2 0 was injected consecutively at three different rates, 2 cm3/hr, 8 cm3/hr, and 20 cm3/hr. Each flow rate was kept for a sufficiently long time to achieve an apparent equilibrium saturation before increasing to the next injection rate. Multislice one-dimensional profile images13, representing oil saturations in the different cross sections perpendicular to the flow direction, were used to monitor the saturation variations.
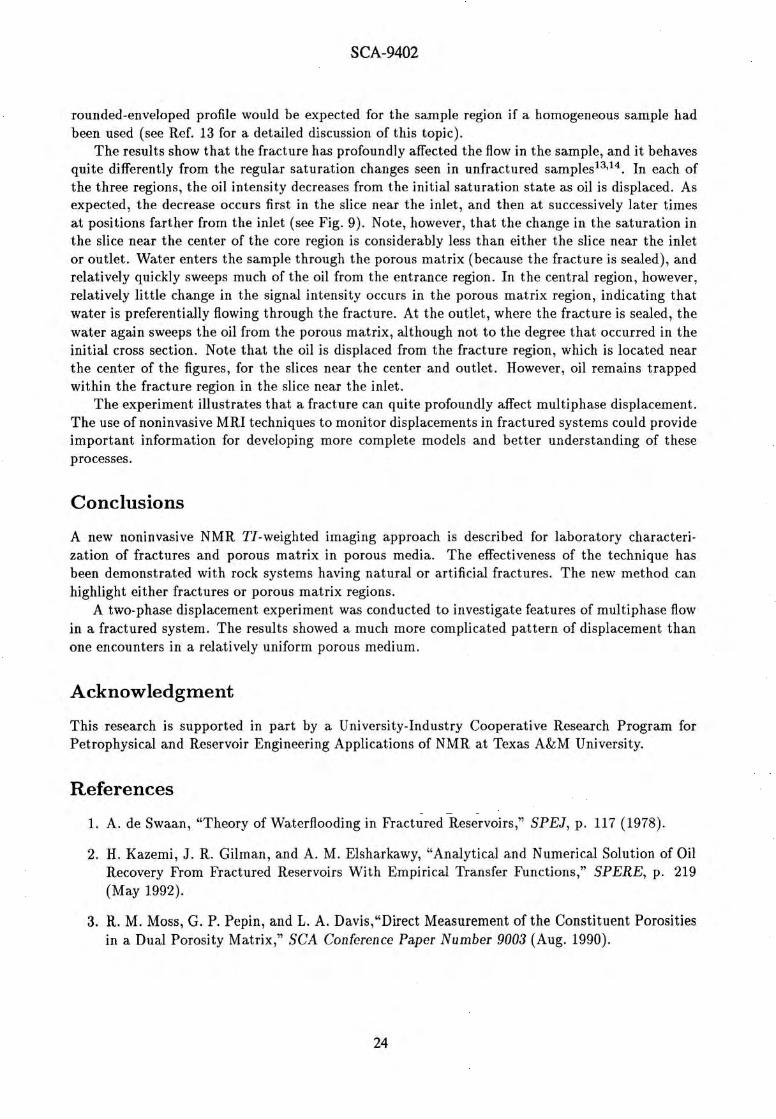
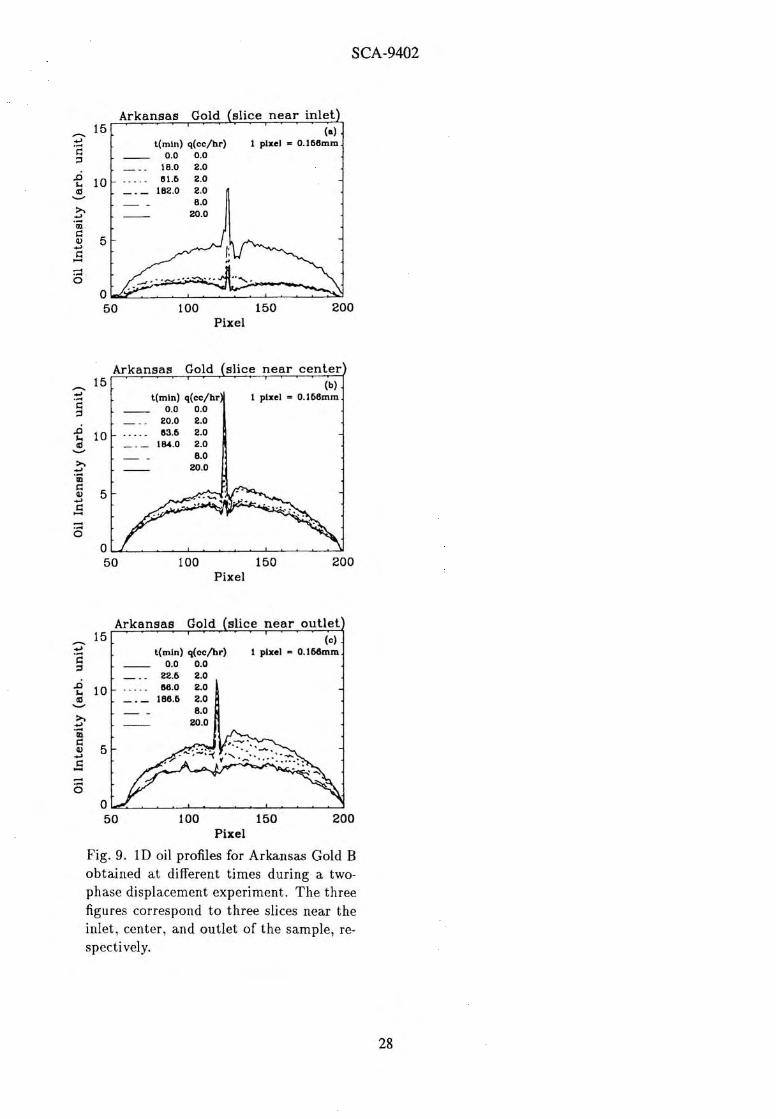
Figures 9 a-c plot the oil intensity profiles for three slices centered a t 2 mm from the inlet, 3 mm off the center (bias to the inlet), and 4 mm from the outlet of the core sample, respectively. The slice thicknesses are Az = 4 mm and the pixel resolution Alp = 0.156 mm. Each profile represents the oil intensity at different times during the displacement experiment. On each figure, the first profile, which has the highest oil intensity, corresponds to So = 1; the next three profiles were all taken during the displacement with flow rate q = 2 cm3/hr, but a t different times; the final two profiles were obtained at the ends of the displacement stages with flow rates q = 8 cm3/hr and q = 20 cm3/hr, respectively. Since a cylindrical sample was used in the study, the intensities on the profiles for the circular cross sections correspond to the hypotenuse-weighted intensities; thus, the intensities of each pixel do not represent the same size of sample volume. Therefore, a
rounded-enveloped profile would be expected for the sample region if a homogeneous sample had been used (see Ref. 13 for a detailed discussion of this topic).
The results show that the fracture has profoundly affected the flow in the sample, and it behaves quite differently from the regular saturation changes seen in unfractured ~ a m ~ l e s ' ~ * ~ ~ . In each of the three regions, the oil intensity decreases from the initial saturation state as oil is displaced. As expected, the decrease occurs first in the slice near the inlet, and then at successively later times at positions farther from the inlet (see Fig. 9). Note, however, that the change in the saturation in the slice near the center of the core region is considerably less than either the slice near the inlet or outlet. Water enters the sample through the porous matrix (because the fracture is sealed), and relatively quickly sweeps much of the oil from the entrance region. In the central region, however, relatively little change in the signal intensity occurs in the porous matrix region, indicating that water is preferentially flowing through the fracture. At the outlet, where the fracture is sealed, the water again sweeps the oil from the porous matrix, although not to the degree that occurred in the initial cross section. Note that the oil is displaced from the fracture region, which is located near the center of the figures, for the slices near the center and outlet. However, oil remains trapped within the fracture region in the slice near the inlet.
The experiment illustrates that a fracture can quite profoundly affect multiphase displacement. The use of noninvasive MRI techniques to monitor displacements in fractured systems could provide important information for developing more complete models and better understanding of these processes.
Conclusions
A new noninvasive NMR TI-weighted imaging approach is described for laboratory characteri- zation of fractures and porous matrix in porous media. The effectiveness of the technique has been demonstrated with rock systems having natural or artificial fractures. The new method can highlight either fractures or porous matrix regions.
A two-phase displacement experiment was conducted to investigate features of multiphase flow in a fractured system. The results showed a much more complicated pattern of displacement than one encounters in a relatively uniform porous medium.
Acknowledgment
This research is supported in part by a University-Industry Cooperative Research Program for Petrophysical and Reservoir Engineering Applications of NMR at Texas A&M University.
References
1. A. de Swaan, "Theory of Waterflooding in Fractured Reservoirs," SPEJ, p. 117 (1978).
2. H. Kazemi, J. R. Gilman, and A. M. Elsharkawy, "Analytical and Numerical Solution of Oil Recovery From Fractured Reservoirs With Empirical Transfer Functions," SPERE, p. 219 (May 1992).
3. R. M. Moss, G. P. Pepin, and L. A. Davis,"Direct Measurement of the Constituent Porosities in a Dual Porosity Matrix," SCA Conference Paper Number 9003 (Aug. 1990).
4. X. Lu, P. Miao, A. T. Watson, G. P. Pepin, R. M. Moss, and M. Semmelbeck, "X-Ray Computed Tomography Studies of Gas Storage and Transport in Devonian Shale," AlChE J., in press (July 1994).
5. G. M. Bydder and I. R. Young, "MR Imaging: Clinical Use of the Inversion Recovery Se- quence," J. Comp. Assit. Tomogr. 9(6), p. 659 (1985).
6. A. J . Dwyer, J . A. Frank, V. J . Sank, J . W. Reinig, A. M. Hickey, J . L. Doppman, "Short- T I Inversion-Recovery Pulse Sequence: Analysis and Initial Experience in Cancer Imaging," Ra.diology, 168 , p. 827 (1988).
7. P. T. Callaghan, Principles of Nuclear Magnetic Resonance Microscopy ( Clarendon, Oxford, 1991).
8. K. R. Brownstein, and C. E. Tarr, "Spin-1a.ttice Relaxation in a System Governed by Diffu- sion," J. Mag. Reson., 26, p. 17 (1977).
9. J . R. Banavar and L. M. Schwartz, Mo1ecula.r Dynamics in Restricted Geometries, edited by J . Klafter and J . M. Drake, Ch. 10, p. 273, John Wiley, New York, NY (1989).
10. S. Chen, H.-K. Liaw, and A. T . Watson, "Saturation Dependent Nuclear Magnetic Resonance Spin-Lattice Relaxation in Porous Media and Pore Structure Analysis," J. Appl. Phys. 74, p. 1473 (1993).
11. E. Fukushima and S. B. W . Roeder, Experimental Pulse NMR (Addison-Wesley, 1981).
12. E. Hahn, "Spin Echoes," Phys. Rev., 80, p. 1168 (1950).
13. S. Chen, F. Qin, K.-H. Kim, and A. T . Watson, "NMR Ima,ging of Multiphase Flow in Porous Media,"ATChE J. 39(6), p. 925 (1993).
14. S. Chen, F. Qin, and A. T. Watson, "Determining Fluid Saturation During Multiphase Flow Experiments by NMR Imaging Techniques," AIChE J., in press (July 1994).

BEREA SANDSTONE
Fig. 1. Schematic diagram of fast and slow relaxation decay curves.
Indiana Limestone
I
Pixel
Fig. 2. 1D slice profiles of a single cross section for Indiana limestone. (a) T I = 5 sec and ( b ) TIomatrix = 400 msec.
Fig. 3. 2D images of a single cross section for Berea sandstone A .
Berea A I
TI = 4s
Pixel
Fig. 4. 1D profiles of the same sample and cross section as shown in Fig. 3. The three profiles correspond to (a) T I = 4 sec; (b)
- TIornatrix = 220 msec, and (c) TI~iracture - 810 msec.

Fig. 5. Comparison of images using regular spin-echo sequence [(a) and (c)] and using IRSE sequence with a selected TIofr,t,, so that fluid distribution in the porous matrix is highlighted [(b) and (d)]. The sample is Berea sandstone B.
Calico Limestone
Pixel
Fig. 7. Comparison of 1D profiles obtained with different TI and TR.
ARKANSAS COLD A
Fig. 8. Detection of the width of the frac- tures in Arkansas Gold A.
,Fig. 6. Images of Calico limestone with a naturally-occurred fracture.
50 100 150 200 Pixel
Arkansas Gold (slice near inletL
- . . 22.6 2.0
-. - 166.6 2.0
50 100 150 200 Pixel
h 15
~ d 3
$ 10 V
h 3 .- m
Fig. 9. 1D oil profiles for Arkansas Gold B obtained a t different times during a two- phase displacement experiment. The three
50 100 150 200 Pixel
" ' " ' " " "
(4 . t(m1n) q(cc/hr) 1 pixel = 0.166mm.
. - 0.0 0.0
. - . . 18.0 2.0 01.6 2.0 -
figures correspond to three slices near the
. -. - 102.0 2.0 8.0
- 20.0
inlet, center, and outlet of the sample, re- spectively.
'