1990- OUTPLOW TURBINE FOB SOLBF RANKTIIIE … Power Conversion System Efficiency Part Load Operation...
74
DOE/NASA/0086-79/1 NASA CR 159695 ET1 1279 (?VASA<R-lS969?) STUr)Y OP ADVfiWCED PADIAL 1990- 96483 OUTPLOW TURBINE FOB SOLBF STEAM RANKTIIIE EHGIWES (Energy Technology, TRC., Cleveland, Ohio.) ?4 p RC AQQ/HP A07 CSCL ?OB vnclas G3/44 11943 STU.Iv OF AL.I'J+JCED RADIAL OUTFLOW TURBINE K)R SbLAR STEAPl RANKINE ENGINES CECIL MARTIN TERRY KOLENC ENERGY TECHNOLOGY INCORPORATED DECEMBER 1979 PREPARED FOR NATIONAL AERONAUTICS AND SPACE ADMINISTRATION LEW I s RESEARCH CENTER UNDER CONTRACT DEN 3-86 FOR U,S, DEPARTMENT OF ENERGY ENERGY TECHNOLOGY OFF I CE CENTRAL SOLAR TECHNOLOGY DIVISION https://ntrs.nasa.gov/search.jsp?R=19800008223 2018-06-05T19:39:59+00:00Z
Transcript of 1990- OUTPLOW TURBINE FOB SOLBF RANKTIIIE … Power Conversion System Efficiency Part Load Operation...

DOE/NASA/0086-79/1 NASA CR 159695
ET1 1279
(?VASA<R-lS969?) STUr)Y OP ADVfiWCED PADIAL 1990- 96483 OUTPLOW TURBINE FOB SOLBF STEAM RANKTIIIE EHGIWES (Energy Technology, TRC., Cleve land , O h i o . ) ?4 p RC A Q Q / H P A 0 7 CSCL ?OB vnc las
G3/44 11943
STU.Iv OF AL.I'J+JCED RADIAL OUTFLOW TURBINE K)R SbLAR STEAPl RANKINE ENGINES
C E C I L MARTIN TERRY KOLENC ENERGY TECHNOLOGY INCORPORATED
DECEMBER 1 9 7 9
PREPARED FOR NATIONAL AERONAUTICS AND SPACE ADMINISTRATION LEW I s RESEARCH CENTER UNDER CONTRACT DEN 3-86
FOR U,S, DEPARTMENT OF ENERGY ENERGY TECHNOLOGY OFF I CE CENTRAL SOLAR TECHNOLOGY DIV IS ION
https://ntrs.nasa.gov/search.jsp?R=19800008223 2018-06-05T19:39:59+00:00Z

FOREWAm
The work described herein was conducted by
Energy Technology Incorporated under NASA
Contract DEX3-86.
vided by the Department of Energy (DOE)
Advanced Solar Technology Division. The
DOE Program Manager was Martin Gutstein.
Robert Hyland, of the NASA Lewis Research
Center, served as the Contract Manager for
NASA, and Terry Kolenc was the Project
Manager for ETI.
Project funding was pro-

TABLE OF COdTENTS SECTION Summary
Introduction Concept of Radial Outflow Turbine Turbine Analysis
Assumptions (re, Blade Angle, Tip Speed, etc.) Efficiency -- Last Stage Turbine Efficiency ( D r y ) Turbine Efficiency (Wet) Shaft Speed Limitations Turbine Efficiency as a Function of Number of Stages
Effect of Reheat Effect of Feedwater Heating Minimizing Configurations Over Power Range
Power Conversion Subsystem Efficiency Gearbox and Generator Boiler Feed Pump Condenser Auxiliaries Power Conversion System Efficiency Part Load Operation and Performance
Engine Controls System Control and Power Output
Steam Rankine Cycle Parametrical Analysis Effect of Reheat
Controls
Conclusions Symbols Figures References
PAGE 1 2 3 4
4
5 6 7 8
9
13 14 14 16 18 18 18 la 19 20 20 23 23 24 26 28 30 69
LIST OF FIGURE
1
2
3
4
5
6
7
8
9
10
11
1 2
13
1 4
15
16
17
18
1 9
20
2 1
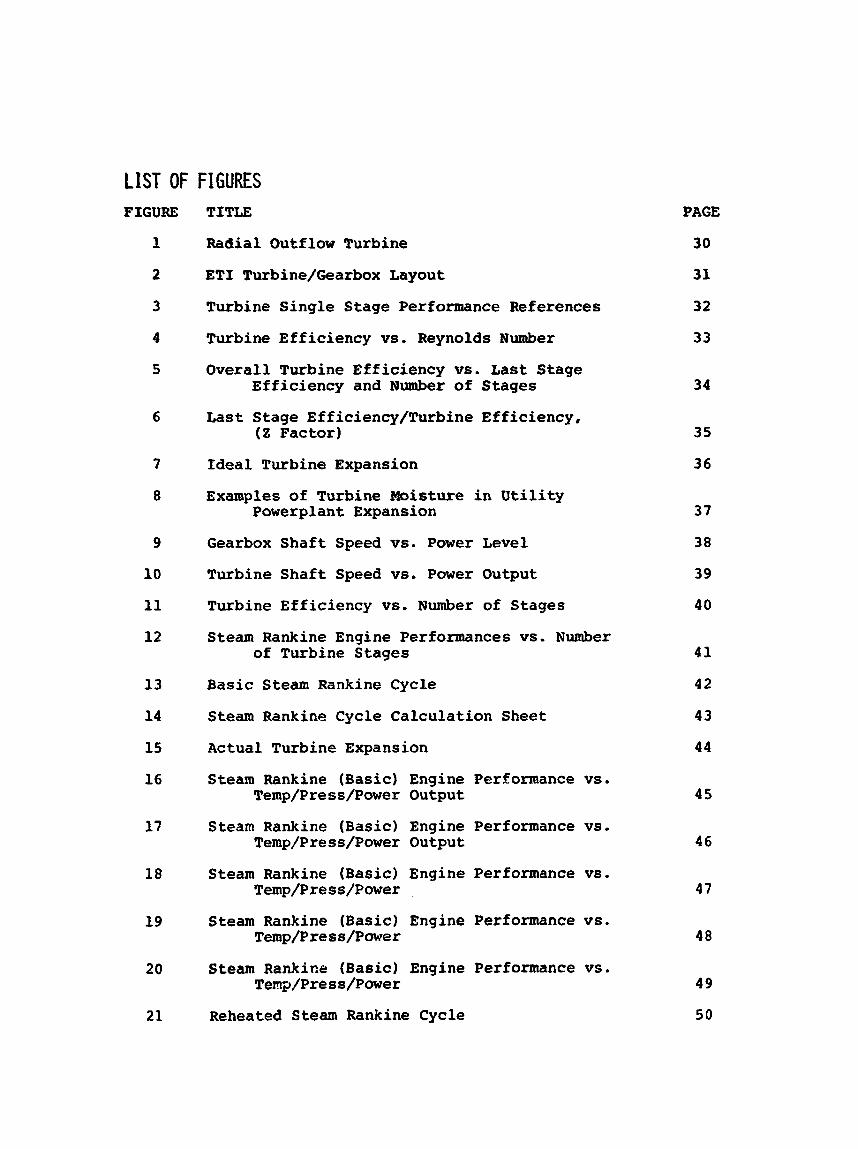
FIGURES TITLE
Radial O u t f l o w Turbine
ET1 Turbine/Gearbox Layout
Turbine S ingle Stage Performance References
Turbine Eff ic iency vs. Reynolds N u m b e r
Overall Turbine Eff ic iency vs. Last Stage Eff ic iency and Number of Stages
L a s t Stage Efficiency/Turbine Eff ic iency, ( 2 Factor)
I d e a l Turbine Expansion
Examples of Turbine Moisture i n U t i l i t y
Gearbox Sha f t Speed vs. Power Level
Turbine Sha f t Speed vs. Power Output
Turbine Eff ic iency vs. N u m b e r of Stages
Steam Rankine Engine Performances vs. Number of Turbine Stages
Basic Steam Rankine Cycle
Steam Rankine Cycle Calcu la t ion Sheet
Actual Turb ine Expansion
Steam Rankine (Basic) Engine Performance vs.
Steam Rankine (Basic) Engine Performance vs.
Steam Rankine (Basic) Engine Performance vs.
Steam Rankine (Basic) Engine Performance vs.
Steam Rankine (Basic) Engine Performance vs.
Reheated Steam Rankine Cycle
Powerplant Expansion
Temp/Press/Power Output
Temp/Press/Power Output
Temp/Press/Power
Temp/P re 8 s/Power
Temp/Press/Power
PAGE
30
31
32
33
34
35
36
37
38
39
40
41
42
43
44
45
46
47
4 8
49
5 0

TITLE FIGURE
22
23
24
25
26
27
28
29
30
3 1
32
33
34
35
36
37
38
39
Reheated Steam Rankine Cycle Calculation Sheet
Comparison of Reheated C Basic Rankine Cycle Performance
Steam Rankine Cycle With Feedwater Heating
Steam Rankine Engine With Feedwater Heating
Feedwater Heating Steam Rankine Cycle Calculation Sheet
Actual Turbine Expansion With Extraction For Feedwater Heating
Steam Rankine Performance With Feedwater Heating
Turbine Family Concept
Gearbox and Generator Efficiency vs. Power Output
Steam Rankine Engine Efficiency Calculation Sheet
Engine Efficiency vs. Turbine Inlet Temperature 6 Power Output
Engine Efficiency vs. Turbine Temperature & Power output
Gearbox Part Load Performance
Turbine Part Load Performance
Rankine Engine Part Load Performance
Steam Rankine Engine Part Load Performance vs. Power Output
Power Conversion Subsystem and Plant Performance vs. Load
Solar Insolation Model
PAGE
51
52
53
54
55
56
57
53
59
60
61
62
63
64
65
66
67
68

An analytical investigation was conducted to determine the performance characteristics of various s t e m Rankine engine con- figurations for solar electric power generation. based upon an advanced steam turbine developed by Energy Technology Inc. the following parameters:
The analysis was
The range of interest for the study was defined by limiting
Turbine Inlet Temperature: Turbine Inlet Pressure: 400 PSIA to 2000 PSIA Condensing Temperature: 6S0F to 130°F Power Output: 100 KW to 5000 KW.
6OOOP to 1300OF
The engine configurations analyzed resulted in Rankine cycle effi- ciencies from 25 percent to 44 percent not including losses.
The effects of rotating equipment losses and auxiliary power requirements were analyzed to obtain engine efficiencies for a complete power conversion subsystem. the above losses resulted in engine efficiencies 9 to 17 percent less than the computed cycle efficiencies.
Off design engine efficiency was studied based on component part load performance. Engine part load efficiency was found to decline uniformly until approximately 20 percent of full load, where the rate of decrease of engine efficiency increased significantly.
Within the range of interest,
ETI's steam turbine was investigated to determine: (1) a method for predicting performance from experimental data, (2 ) tie flexibility of a single design with regard to power output and pressure ratio, and (3) the effect of varying the number of turbine stages. commercially available gearboxes and generators.
All turbine designs were restricted to be compatible with
Several operating methods and control schemes for the steam Rankine engine were investigated. simplicity standpoint, the best approach was: (1) hold turbine inlet temperature constant, (2) vary turbine inlet pressure to match load, and (3) allow condenser temperature to float main- taining constant heat rejection load.
From an efficiency and control
1

With our nation's interest in switching to renewakie energy sources, the Department of Energy has been pursuing +ke ~enerati~n of electric power from solar energy. It has been fowd that ar, engine with a high conversion efficiency of thermal to electrlc power is required to make this concept economically viable. To produce the level of efficiency required with a steam Rankine engine, a high temperature, high pressure cycle - and a high efficiency, low cost expander is needed.
Since 1972, Energy Technology Inc. has worked on the devel- opment or' an advanced, small (under 5000 KW) steam turbine. The objective of the R&D effort has been to provide, at low cost, characteristics not available in commercial small steam turbines: these being the capability to: (1) accommodate inlet temperatures to 130O0F, (2) provide high efficiency throughout the complete load range for applications with pressu_-e ratios greater than 40 to 1, and (3) accommodate extraction ports for feedva,ter heat- ing. Because of these characteristics, ETI's turbine was ideally suited for solar electric power generation and thus became the basis for this study.
The investigation was directed towards modeling the perfor- mance of a turbine driven, steam Rankine power conversion sub- system to provide useful information for solar electric power system designers. A highly simplified design procedure for the turbine was built upon experimental data and previous design experience. cycles within the study's wide range of interest to be analyzed on a desktop computer.
This was done tc permit the large number of Ranlkine
A sufficient number of Rankine cycles were evaluated to per- mit cycle efficiency to be obtained for any combination of the four basic parameters, which were the following:
Turbine Inlet Temperature Turbine Inlet Pressure Condensing Temperature Power Output.
A limited number of Rankine cycles was evaluated to show repre- sentative results for:
Reheated Cycles Feedwater Heating Cycles O f f Design Performance Overall Engine Efficiency Effect of No. of Turbine Stages.
2

CONCEPT OF THE RADIAL OUTFLOW TURBINE The basic geometry of the radial outflow (ROF) turbine under
development at ET1 is shown in Figure 1. The turbine is a multi- stage design, with each stage composed of one stationary and one rotating blade row. The working fluid, steam, in the case of this study, enters the turbine at the center of the fixed stator. The fluid then expands radially outward through alternating, concen- tric stator and rotor blade rows, where its enthalpy drop is con- verted to shaft power by the rotating blade rows. geometry has several advantageous characteristics as follows:
The ROF turbine
1.
2.
3.
4.
5.
6.
In most cases, only a single rotor disc is required to carry the required number of blade rows. produces a lightweight rotor permitting an overhung rotor arrangement, reducing bearing and seal requirements.
This
Due to the compact arrangement, described above, thermal losses are minimized.
Because the flow is radial, the turbine blades have a constant untwisted profile along their length. obtained from low cost manufacturing methods, and a simple and accurate aerodynamic analysis can be used for the design.
High precision blades can therefore be
In most cases, full admission can be used on all stages due to the radial arrangement which puts the low volumetric flow stages at a small diameter.
With almost negligible change to the turbine hous- ing, the power output of a given unit can be adjusted by changing the turbine blade heights by a propor- tionate amount. in more detail later.
The ability to do this is discussed
Because of the simplicity of the assembly, tight tolerances and thus small clearances between the rotor and stator can be easily maintained. This minimizes leakages of the working fluid in the tur- bine-one of the principal losses of expander efficiency.
A typical turbine/gearbox with an overhung rotor arrangement is shown in Figure 2. gearbox shown is representative of the units contained in this study. typical of 100 KW--5 MW gearboxes; most use journal bearings. The electric generator will have its own bearing system.
The nine stage turbine and single reduction
The rolling element bearings shown, however, are not
3

TURBINE ANALYSIS A method for estimating the efficiency for ETI's radial out-
flow (ROF) turbine design was needed to be able to evaluate overall power conversion suba,stem performance. Within the program's work scope, it was not possible to do a detailed turbine design for all the parametric Rankine engine combinations. Therefore, a scheme was deyLsed which would give a good rough approximation of the expected turbine performance,
A decision was made to use the turbine's last stage as a basis and to compute the performance of that stage utilizing the design experience alid test data of €TI and others. Reynolds number was $elected as the best indicator of stage efficiency. In a multi-stage turbine, the energy release per stage generally increases from inlet to exit. As a result, the last stage has the greatest effect on the turbine's overall performance.
for estimating the efficiency of ETI's radial outflow turbine. The four sections that follow describe M e procedure developed
ASSUMPTIONS (Re, BLADE ANGLE8 TIP SPEED, ETC.)
Reynolds number is a dimensionless parameter conunccly used to correlate turbine performance. Re data was collected to be used as a basis for the turbine cal- culations. Sources containing data defining the current state of the art in small turbomachinery were selected from this reference pool. This data is listed in Figure 3. Much of this information was obtained from experimental work conducted at the WA-Lewis Research Center. The references of Figure 3 define Re with the following equation:
Experimental efficiency vs.
Re = lJrt
This is different from the classical definition of Re, which is usually specified as follows:
K
The hydraulic diameter (Dh) being defined as:
By using the continuity equation (m = pVA), the definition of hydraulic diameter from the first Re equation can be separated out, yielding:
Dh 0 - A
=t
4

Due to the difficulty of translating all of the reference data, a decision was made to utilize the Re definition based on the tur- bine tip radius (rt), rather than the conventional one based on the wetted perimeter (W) of the flow area.
To maintain relative simplicity in the turbine efficiency calculation procedure, some assumptions were made regarding the radial outflow turbine geometry. These resulted in compromises on the optimum turbine efficiency, but produced results of suffi- cient accuracy for the objectives of the study. are summarized as follows:
These assumptions
1. A blade exit angle of 18O was used. structed blade rows with exit angles less than l8O, but due to the high exit volumetric flow rates associated with many of the cycles within the range of interest, the above value was specified.
ET1 has con-
2. The last stage tip speed was specified as 90 percent of the spouting velccity. This compromise was necessitated by the fact tSat the majority of the turbines investigated would be exhausting wet steam.
3 . A ratio of the turbine rotor tip radius to the last stage rotor blade height of 11.5 was specified. was an average value taken from past radial outflow design experienca. mechanical design.
This
The ratio is related to the rotor's
Substitution of these values into the Re equation produces this result:
b2N Re = 2.59 - K
The turbine rotor last stage exit blade height (b) can be defined using the continuity equation as follows:
b = m v e N 60060 (Vsp)*
Turbine shaft speed (N) selection is ?iscussed in detail in a later section. It is based on these factors:
1. 2. Turbine mechanical design limits.
Available commercial gearboxes and generators.
EFFICIENCY--LAST STAGE
Turbine state-of-the-art performance, listed in Figure 3 , is shown plotted as a function of Reynolds number in Figure 4. data of Figure 4 is for single stage subsonic flow turbines of both radial and axial flow configurations. The fact that all the turbines of this correlation are subsonic is significant. For solar electric power generation, a multi-stage, subsonic flow
The
5

turbine is needed to: (1) accommodate the high design pressure ratios, and ( 2 1 deliver good part load efficiency. The aero- dynamics of radial and axial flow turbine configurations differ only in that three dimensional blades are needed in the axial turbine to handle the centrifugal effect.
A best fit curve was drawn through the data of Figure 4. Also on this graph, points were plotted which represent the last stage of several ET1 radial outflow turbines. The ET1 turbines show a slight improvement over the previous state of the art. This is primarily the result of the development of manufacturing techniques to produce more accurate blade profiles and the use of proportionately smaller blade tip clearances. A curve represent- ing the last stage performance of ETI's radial outflow turbine was drawn on Figure 4-parallel to the state-of-the-art curve. The equation of the curve which determines the last stage effi- ciency is as follows:
0 . 0266 Q1 0.650 Re
TURBINE EFFICIENCY (DRY)
To estimate overall turbine ?fficiency from the last stage efficiency, two principal factors must be accounted for:
1. The number of stages. 2.
Turbine performance, as a function of the number of stages for a fixed pressure ratio, is discussed in a later section. optimum performance in a subsonic, multi-stage design occurs at a stage pressure ratio (inlet pressure divided by exit pressure) of approximately a value of two. Based upon this assumption, an equation for the number of stages in a civen turbine design was writ ten :
?he level of moisture in the turbine expansion.
Near
x = 1.4 In (Pi/Pe)
In the above equation, X is always rounded to the nearest integ;.r.
Several attempts were made to develop an equation for averall (dry) turbine efficiency as a function of last stage efficiency and the number of stages. No satisfactory solutions could be obtained, nor were any available in ETI's library of turbine design references. The design of a multi-stage turbine is relatively complex. The overall efficiency is greater than a weighted (by power output) average of the stage efficiencies, because of the reheat effect from the mixing of the leakage flow.
The ratio of the overall (dry) turbine efficiency divided by the turbine's last: stage efficiency was designated as the "2" factor. Far a single stage turbine, it is obvious that the 2 factor is equal to a value of one. For the multi-stage designs of this study, other 2 factors were determined empirically using a graphical method.
6
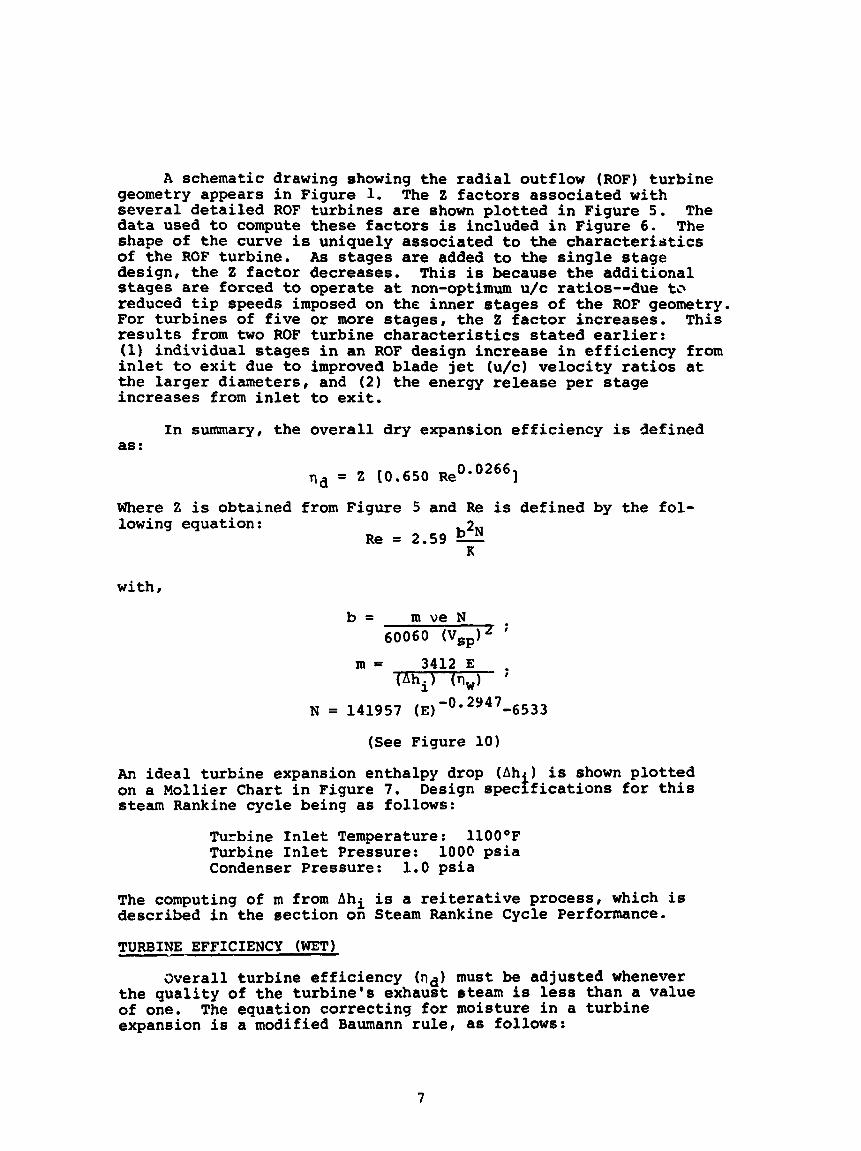
A schematic drawing showing the radial outflow (ROF) turbine
The geometry appears in Figure 1. The 2 factors associated with several detailed ROF turbines are shown plotted in Figure 5. data used to compute these factors is included in Figure 6. The shape of the curve is uniquely associated to the characteristics of the ROF turbine. As stages are added to the single stage design, the 2 factor decreases. This is because the additional stages are forced to operate at non-optimum u/c ratios--due to reduced tip speeds imposed on the inner stages of the ROF geometry. For turbines of five or more stages, the 2 factor increases. This results from two ROF turbine characteristics stated earlier: (1) individual stages in an ROF design increase in efficiency from inlet to exit due to improved blade jet (u/c) velocity ratios at the larger diameters, and (2) the energy release per stage increases from inlet to exit,
In summary, the overall dry expansion efficiency is aefined as :
0.02661 10.650 Re
Where 2 is obtained from Figure 5 and Re is defined by the fol- lowing equation:
with,
b 'N Re = 2.59 - K
b = m ve N 60060 (VSp)'
N = 141957 (E)-0*2947-6533
(See Figure 10)
An ideal turbine expansion enthalpy drop (Ah-) is shown plotted on a Mollier Chart in Figure 7. Design spectfications for this steam Rankine cycle being as follows:
Turbine Inlet Temperature: llOOOF Turbine Inlet Pressure: 1000 psia Condenser Pressure: 1.0 psia
The computing of m from Ahi is a reiterative process, which is described in the section on Steam Rankine Cycle Performance.
TURBINE EFFICIENCY (WET) -- ;>vera11 turbine efficiency (nd) must be adjusted whenever
the quality of the turbine's exhaust steam is less than a value of one. expansion is a modified Baumann rule, as follows:
The equation correcting for moisture in a turbine
7

The p r i n c i p a l parameters being: (1) the Baumann factor [or = 0.351 which is discussed i n Reference 3, ( 2 ) t he exhaust steam q u a l i t y ( 0 1 0 and ( 3 ) the f r a c t i o n of the tu rb ine expansion i n the s a t u r a t e d vapor region [AhJAhtlo
The opera t ing l ife of t h e tu rb ine is s t rong ly l inked to the moisture i n the expansion. U t i l i t y powerplant p r a c t i c e , examples of which are shown i n Figure 8, has been t o l i m i t turbj-e exhaust moisture t o maintain tu rb ine blade erosion rates cons i s t en t w i t h design l i f e i n t h e 20-30 year range.
A l l of t h e tu rb ines shown i n Fic.are 8 are of a n a x i a l f l o w configurat ion. With this type of tu,aine geometry, the c e n t r i f u g a l force from the s h a f t r o t a t i o n causes moisture droplets t o collect near the blade t i p s . To countexact this problem, a x i a l f h w tu rb ines opera t ing w i t h high exhaust moisture have p o r t s i n t h e blade shrouds to extract the moisture. W i t h the radial outflow configurat ion, t h e ten-rifugal force f i e ld is i n the d i r e c t i o n of the expansion. As a r e s u i t , moisture d r o p l e t s are not as e a s i l y formed i n the ROF turb ine , and highe tolerated before blade eros ion becomes s i g n i f i c a n t .
rcoisture levels can be
I n order t o have ROF t u rb ine designs cons i s t en t w i t h a minimum 20-year design l ife, tu rb ine exhaust moisture w a s restricted t o a maximum of 1 5 percent for t h e stem Rankine cyc le s i n v a t i g a t e d . A l l charts showing Rankine cycle per- formance have an 85 percent t u rb ine ex;laust q u a l i t y l i n e , which l i m i t s t he cyc le parameter combinatit23 that can be specified.
SHAFT SPEED LIMITATiOIVS
Within the 100 KW to S MW power range of the study, the maximum generator speed r e a d i l y ava i l ab le i n commercial u n i t s is 1800 rpm, for most manufactu.*.?rs, 100 KW was the cutof f po in t for 3600 rpm generators . As a r!&ul , t , t u rb ine shaf t speed is l imi t ed by the ava i l ab le gear ratio ani; pinion speeds from the gearbox suppl ie rs . A a.rvey of these parameters as a funct ion of power l e v e l produced t h e da t a shown i n Figure 9. Gear manufacturers are l imi t ed by the smallest diameter s h a f t t h a t can be c u t and the maximum p i t c h l i n e ve loc i ty . For these reasons, few l o w power, high speed gearboxes are ava i lab le .
A l e s t f i t curve was drawn through tl?e da ta of F i g u r e 9. T h i s curve, shown i n Figure 10, was used tc, de f ine tu rb ine s h a f t speed (N) as a funct ion of power l e v e l (Ej. An equat ion for t h i s curve was determined to be t h e following:
N = 141957 (E)-0*2947-6533
I n most cases, the above equation is used t o spec i fy the tu rb ine s h a f t speed, except when tu rb ine stress l imi ta t ions would be exceeded. the bending stress on the blades of t h e l a s t t u rb ine rotor s tage .
I n the ROF t u rb ine design, the l i m i t i n g f a c t o r is
8
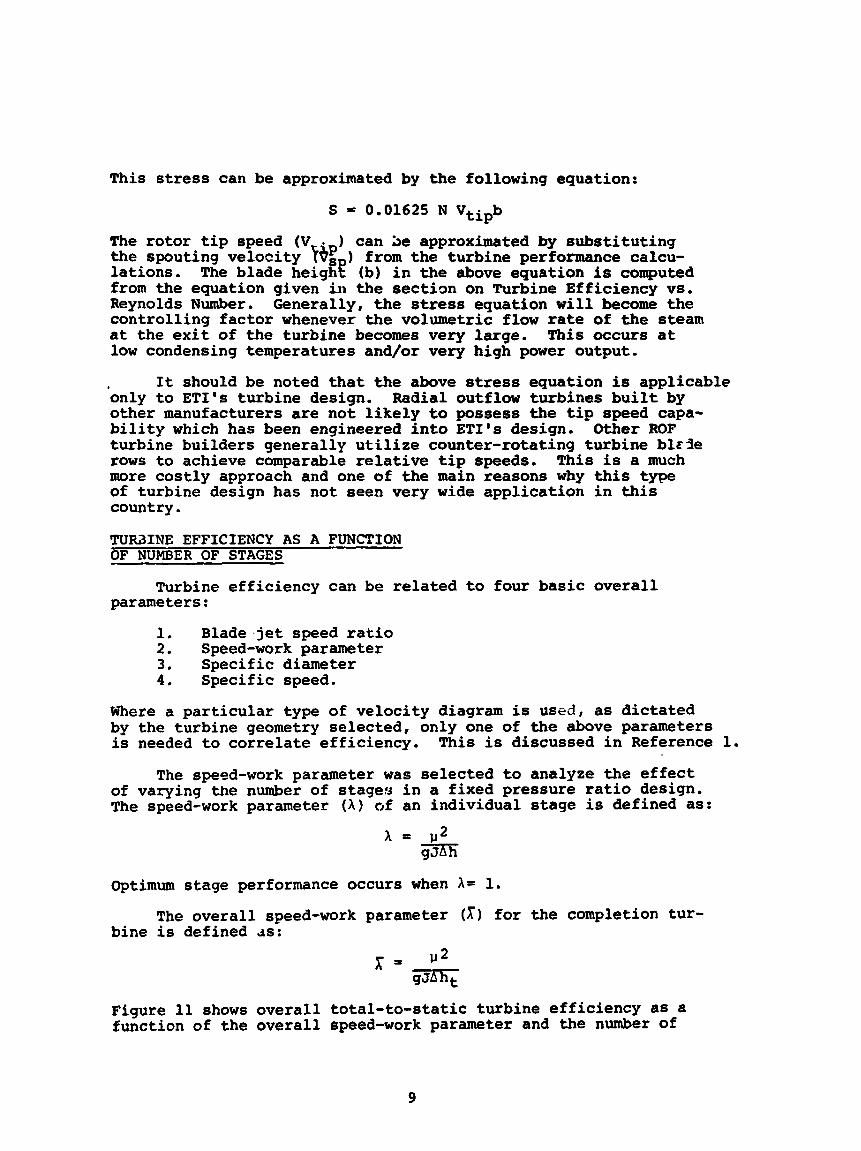
This stress can be approximated by the following equation:
S = 0.01625 N Vtipb
The rotor tip speed (V . 1 can be approximated by substituting the spouting velocity k*i ) from the turbine performance calcu- lations. The blade heighf (b) in the above equation is computed from the equation given in the section on Turbine Efficiency vs. Reynolds Number. Generally, the stress equation will become the controlling factor whenever the volumetric flow rate of the steam at the exit of the turbine becomes very large. low condensing temperatures and/or very high power output.
This occurs at
It should be noted that the above stress equation is applicable only to ETI's turbine design. other manufacturers are not likely to possess the tip speed capa- bility which has been engineered into ETI's design. turbine builders generally utilize counter-rotating turbine bh9e rows to achieve comparable relative tip speeds. more costly approach and one of the main reasons why this type of turbine design has not seen very wide application in this country.
Radial outflow turbines built by
Other ROF
This is a much
TUEWINE EFFICIENCY AS A FUNCTION OF NUMBER OF STAGES
Turbine efficiency can be related to four basic overall parameters:
1. Blade.jet speed ratio 2, Speed-work parameter 3, Specific diameter 4. Specific speed.
Where a particular type of velocity diagram is used, as dictated by the turbine geometry selected, only one of the above parameters is needed to correlate efficiency. This is discussed in Reference 1.
The speed-work parameter was selected to analyze the effect of varying the nwnber of stage!; in a fixed pressure ratio design. The speed-work parameter ( A ) af an individual stage is defined as:
a = p 2
Optimum stage performance occurs when A = 1.
bine is defined ds: The overall speed-work parameter (XI for the completion tur-
x = lJ* aq
Figure 11 shows overall total-to-static turbine efficiency as 8 function of the overall speed-work parameter and the number of
9

t u rb ine stages. was used as the basis for study of the effect of the number of turb ine stages on Rankine cycle performance.
and a condensing temperature of llO°F w a s chosen for a sample. Rankine cyc le e f f i c i e n c y a8 a funct ion of tu rb ine i n l e t condi t ions and the number of tu rb ine stages is shown i n Figure 12. of the three i n l e t pressures of Figure 12, the highes t number of s t ages shown corresponds w i t h the number used for the basic Ran- kine cyc le ca l cu la t ions discussed earlier. the number of stages, cyc le e f f i c i ency decreases betveen 1.5 and 3.0 percent. I n a 1000 KBJ s o l a r - e l e c t r i c p lan t , each percentage poin t change i n cyc le e f f i c i ency could r e s u l t i n a d i f fe rence of $60,000 i n solar rece iver cost. (This is based on data from Reference 4. ) The tc ta l cost of a 1000 KW, 10-stage tu rb ine is approximately $300,000 for prototype uni ts : production u n i t s would be s i g n i f i c a n t l y lower i n cost. The cost of the turb ine is net: l i n e a r l y related t o the number of stages, 1000 KW tu rb ine would cost near ly $200,000. t h a t reducing the number of stages i n the tu rb ine has a pro- nounced negative effect on o v e r a l l system cost.
Figure 11, which is reproduced from Reference 1,
A family of Rankine cycles having a power output of 1000 KW
For each
For each reduct ion i n
A s i n g l e stage, It is e a s i l y seen
With the radial outflow tu rb ine geometry, there is a l i m i t to t h e number of stages that can be specified for a s i n g l e rotor disc design. speeds to values of 1500 ft/sec or less depending on t u rb ine exhaust steam conditions. To obta in a larger diameter disc, permit t ing more stages t o be mounted, the shaft speed must be lowered. It has been E T I ' s experience that t o obta in optimum tu rb ine performance, the highest shaf t speed possible should be u t i l i z e d a t a given power leve l . Otherwise, design of high e f f i c i ency inner stages becomes d i f f i c u l t .
The mechanical design of the rotor limits t i p
The rough t u r b i n e designs computed for the basic Rankine cycle ca l cu la t ions were reviewed regarding their adap tab i l i t y t o var ious condenser pressures . Spec i f i ca l ly , the effect of adding or removing a stage a t the e x i t of a p a r t i c u l a r t u rb ine design w a s studied.
"ne f i n a l starjes of a multi-stage radial ou t f low tu rb ine have pressure r a t i o s of approximately 2.3 t o 1 for optimum per- formance. Holding s h a f t speed constant , the addi t ion of another s t age a t t h e tu rb ine e x i t would cause the turb ine blade stress t o near ly double (using the equation defined previously) . For the majority of tu rb ines w i t h i n the parametric bounds of this study, an addi t iona l stage would put t h e stress beyond the design l i m i t .
Another problem w i t h adding a stage t o the e x i t is that the spouting ve loc i ty from the added stator blade row would l i k e l y be lower than the r e l a t i v e velocity of the rotor-thus prohib i t ing steam from enter ing the rotor. T h i s problem results from the r e l a t i v e l y low t i p speeds of the turb ines of this study, which is the r e s u l t of operat ing w i t h s a tu ra t ed exhaust steam.
1 0

Removing a stage at the exit of the turbine, such as to adapt a water-cooled to an air-cooled condensing design, poses no design problems. The overall turbine efficiency would decrease by about 3 percent, because the turbine's most efficient stage would be deleted. To remove a stage and maintain the same power output, the blade heights of the remaining stages would have to be i..creased. To accomplish this, mass flow would be increased by 6 to 12 percent. the same power turbine with the lower exhaust pressure.
However, blade stress would still be lower than
11

STEAPl RANKINE CYCLE P A M T R I C A L ANALYSIS The steam Rankine cycle, in its simplest form, consists of
these elements:
1. PreheatermiLer 2. Expander 3- Condenser 4. Feed pump.
These elements were designated as 'the basic steam Rankine cycle" and are shown on a temperature-entropy (T-S) diagram in Figure 13.
The critical poht temperature for steam is 305OF. The temperature range of interest for this solar electric power study is from 600°F to 13@SaF. Therefore, another element must be added to the basic cycle--a superheater, This is shown on the T-S dia- gram in Figure 13. Both diagrams in Figure 13 are shown without the feed pump, which would be nearly invisible if drawn to scale. The power required to drive this pump will be covered later. For now, it will be deleted for simplicity, since it is a relatively insignificant effect, which is not true of some other Rankine cycle working fluids.
The basic steam Rankine cycle was analyzed to be able to compare the relative performance as related to these parameters:
1. Turbine Inlet Temperature ( C O O O F to 1300°F) 2. Turbine Inlet Pressure (400 psia to 2000 psia) 3. Condensing Temperature (6S0F to 13OOF) 4. Output Power (100 KW to 5 MW).
Shown above is the range of interest for these parameters for steam Rankine driven solar-electric power applications as jointly determined by DOE, NASA and ETI.
A sample cycle efficiency calculation sileet is shown in Figure 14. Each calculation was begun by specifying values for the four parameters named above. ~ext, values for inlet enthalpy and entropy, and exit enthalpy for an ideal isentropic expansion were obtained from the 1967 ASME Steam Tables. Turbine shaft speed was computed as described in a previous section. reiterative process and the previously derived equations, turbine last stage efficiency was recomputed until the actual turbine Gxhaust steam conditions matched the estimated values within a tolerance of 2 0.25 percent.
Using a
Once the turbins exhaust conditions were established, the last stage blade stress was checked to make sure it was within limits. 56,500 psi which was satisfactory.
For the sample calculation of Figure 1 4 , the value was Had this value exceeded the
design limit of would have been
Next the 2
- 70,000 psi, a new, lower turbine shaft speed specified.
factor for the conversion from stage efficiency
12
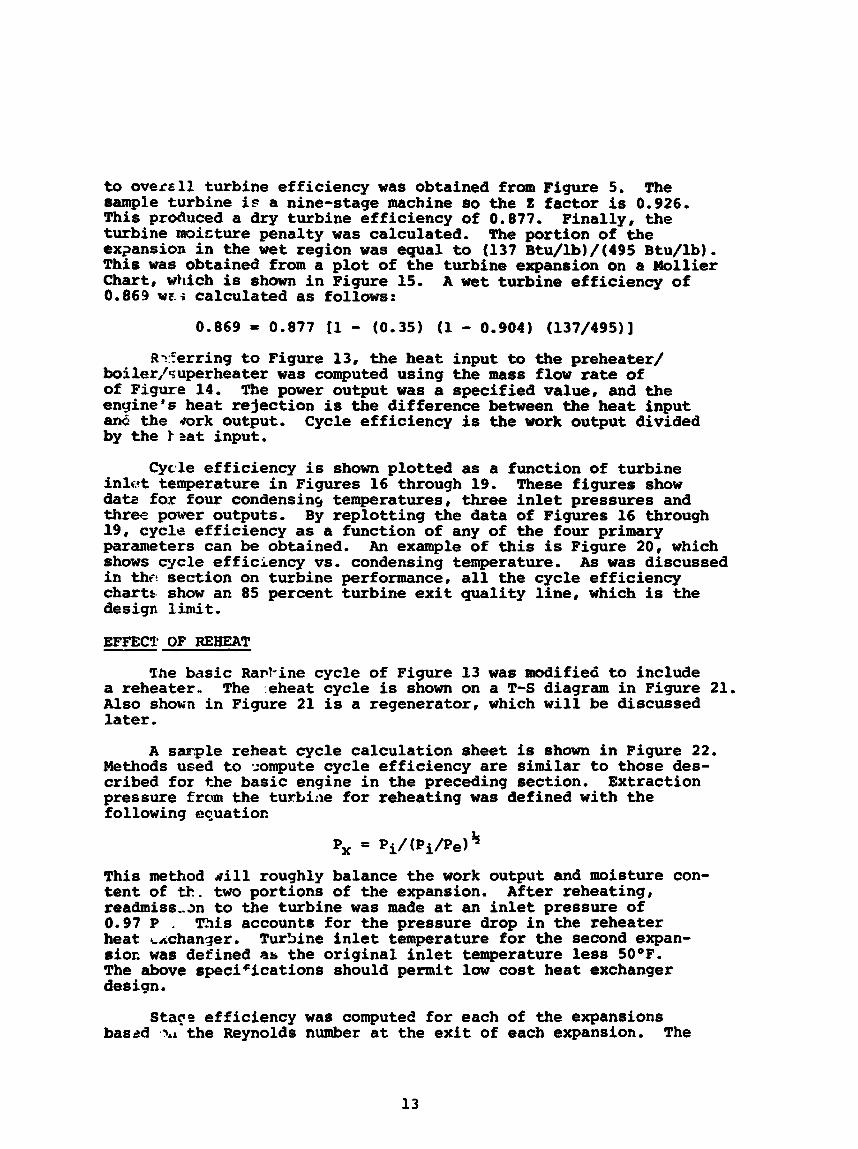
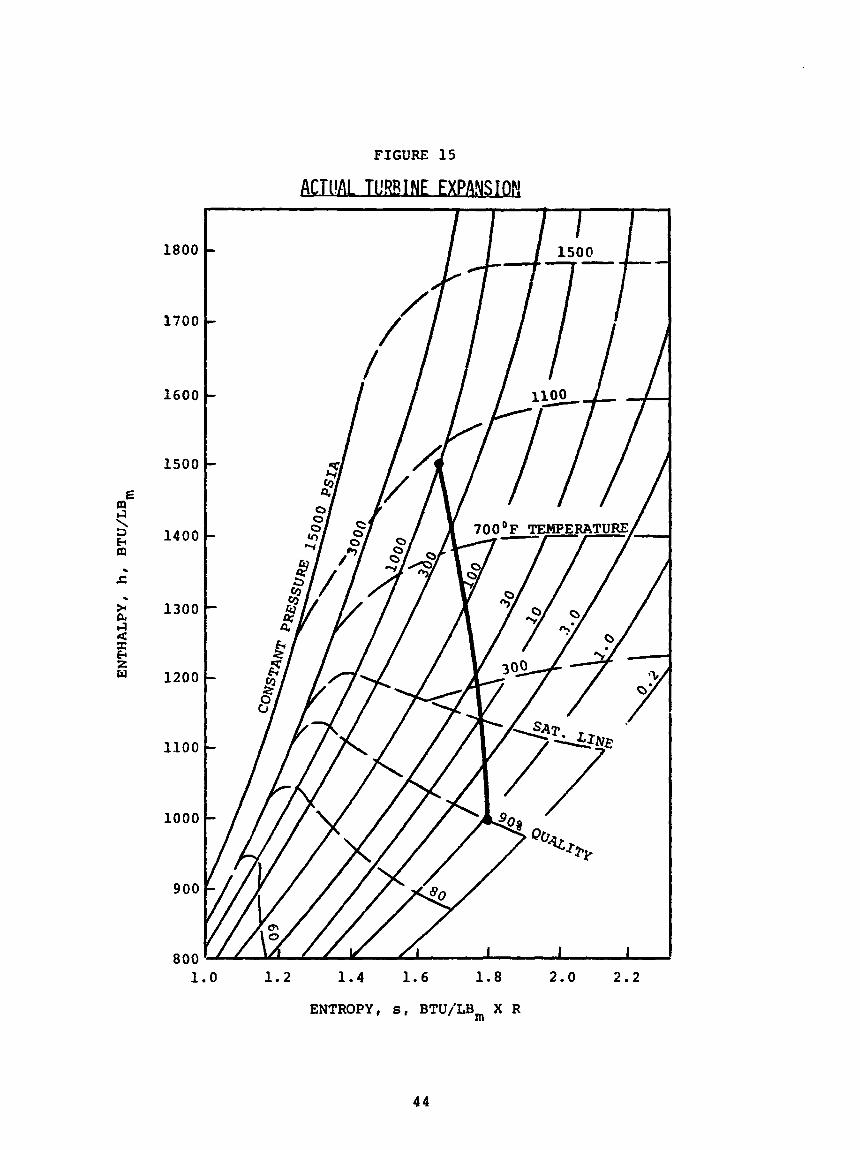
to overs11 turbine efficiency was obtained from Figure 5. The sample turbine is a nine-stage machine so the Z factor is 0.926. This produced a dry turbine efficiency of 0.877. Finally, the turbine moisture penalty was calculated. The portion of the ex2ansioa in the wet region was equal to (137 Btu/lb)/(495 Btu/lb). This was obtained from a plot of the turbine expansion on a Mollier Chart, which is shown in Figure 15. A wet turbine efficiency of 0.869 w c i calculated as follows:
0.869 = 0.877 11 - (0.35) (1 - 0.904) (137/495)1
RCerring to Figure 13, the heat input to the preheater/ boi1err”uperheater was computed using the mass flow rate of of Figure 14. enyine’s heat rejection is the difference between the heat input an& the mrk output. Cycle efficiency is the work output divided by the t nat input.
The power output was a specified value, and the
Cycle efficiency is shown plotted as a function of turbine These figures show inlet temperature in Figures 16 through 19.
dats fox four condensinq temperatures, three inlet pressures and three power outputs. 19, cycle efficiency as a function of any of the four primary parameters can be obtained. shows cycle efficiency vs. condensing temperature. As was discussed in th~! section on turbine performance, all the cycle efficiency chartt. show an 85 percent turbine exit quality line, which is the design limit.
By replotting the data of Figures 16 through
An example of this is Figure 20, which
EFFECT OF REHEAT
The basic Rapl-ine cycle of Figure 13 was modified to include a reheater- The :eheat cycle is shown on a T-S diagram in Figure 21. Also shovin in Figure 21 is a regenerator, which will be discussed later .
A sanple reheat cycle calculation sheet is shown in Figure 22. Methods used to zompute cycle efficiency are similar to those des- cribed for the basic engine in the preceding section. Extraction pressure from the turbine for reheating was defined with the following equation
This method rill roughly balance the work output and moisture con- tent of th, two portions of the expansion. After reheating, readmiss,m to the turbine was made at an inlet pressure of 0.97 P . T3is accounts for the pressure drop in the reheater heat t~changer. TurSine inlet temperature for the second expan- sion was defined .ab the original inlet temperature less SOOF. The above speciCications should permit low cost heat exchanger design.
ba8;d ‘3.1 the Reynolds number at the exit of each expansion. Staqs efficiency was computed for each of the expansions
The
13

Z factor for converting from stage efficiency to overall turbine efficiency was selected based on the total number of stages.
In analyzing the reheated cycles, it was found that the use of reheat alone will generelly effect a decrease in cycle per- formance. For the lower inlet temperature cycles under considera- tion, reheating will change the expansion from partially wet to dry. Thus the turbine efficiency is increased through elimination of the moisture penalty. However, a decrease in turbine perfor- mance is simLltaneously caused because of the lower Reynolds number from the smaller volumetric flow rate at the turbine exit. The efficiency loss being primarily due to an increase of the relative leakage flow in the turbine. The net result of these two opposing effects was found to be reduction in turbine performance.
For reheated cycles at the upper end of the temperature range, the turbine exhaust after the second expansion contains a signifi- cant amount of residual useful energy. In these cases, a regen- erator can be used to recover this energy and utilize it for liquid preheating. A minimum temperature differential of 50°F was specified for the regenerator.
In Figure 23, the change in cycle performance relative to This data is for a 1000 KW turbine the basic engine is shown.
output with a llO°F condensing temperature and a turbine exhaust regenerator where applicable. From the graph, the following conclusions can be drawn:
1. Reheating permits the use of lower temperature cycles without exceeding the 85 percent exit quality limit. For example :
INLET P R E R .-(PSIAT
400 1000 2000
MINIMUM* INLET TEMPERATURE (OF) BASIC CYCLE REHEAT CYCLE
680 800 1060
-0
500 700
*Based on turbine moisture limitations.
2. Reheating at higher inlet temperatures (above 1000OF) can improve Rankine cycle efficiency up to 12 percent.
EFFECY OF FEEDWATER HEATING
Another modification that can be made to the basic engine is the addition of feedwater heaters for preheating of the boiler inlet fluid. diagram in Figure 24. A portion of the steam flow expanding through the turbine is extracted between stages. fed to a heat exchanger where it is condensed and subcooled, and finally mixed with the condenser inlet flow. condensing steam is transferred to the fluid exiting the conde-ser.
Feedwater heating is shown schematically on a T-S
This steam is
The heat from the
1 4
Multiple extractions can be used depending upon the turbine geom- etry. powerplants to improve cycle efficiency. been largely applied to steam engines in the power range of this study due to the fact that commercially available turbomachinery in this power range generally has not been designed to accommodate the extraction ports required.
Feedwater heating is almost universally used in large steam The technique has not
ETI's ROF turbine is readily adaptable to the addition of
This is not as.easily accom-
steam extraction ports. Individual turbine stage blade heights can be altered to account for the change in mass flow without drastically changing the design. plished in an axial flow turbine. The pressures at which steam is available for extraction, however, are restricted by the tur- bine's configuration, which is dictated by the individual stage pressure ratios. For the purpose of this study, a rough turbine design was worked out for a turbine with a 2,000 psia inlet pressure and a 1.275 psia exhaust pressure. Pour potential extraction ports were identified at these pressures: 4008 110, 3 0 , and 7.5 psia. with four feedwater heaters is shown in Figure 25.
A schematic drawing for a steam Rankine engine
A sample calculation for a steam cycle with feedwater heat- ing is shown in Figure 26. The enthalpy at the turbine extraction points was determined by using a Mollier Chart. expansion line was laid out using the specified inlet conditions and exhaust pressure, and an estimated overall turbine efficiency. This process was reiterated until the computed turbine efficiency, includipg the feedwater extraction flows, matched the estimate within - 0.25 percent. The enthalpies at the intersection of the appropriate extraction pressure lines were determined. This is shown in Figure 27. extraction pressure and subcooled to within 20eF of the satura- tion temperature of the succeeding extraction. liquid was then mixed with that of the succeeding extraction and subcooled again. extraction flows had been subcooled to within 20°F of the condens- ing temperature: then they are mixed with the condenser inlet flow. On the liquid side of the feedwater heaters, the flow is assumed to be at turbine inlet pressure. No allowance for pressure drop in the feedwater heaters, boiler, or superheater was accounted for. In each feedwater heater, the liquid was heated to within 20°F or the temperature of the condensing steam on the vapor side of the heat exchanger.
formula:
A first trial
The extracted steam was condensed at the
The subcooled
This process was continued until the mixed
The mass flow extracted at each port was calculated from this
hl - h2 h3 - h4 mi
= me
The enthalpy values for the above equation are defined as follows:
15

hl = enthalpy of liquid at feedwater heater exit at temperature = Te - 20°F
h2 = enthalpy of liquid at feedwater heater inlet at temperature = condenser exit or preceding feedwater heater exit
h3 = enthalry of vapor at turbine extraction port
h4 = enthalpy of liquid at exit of vapor side of feedwater heater at temperature = condensing temperature of succeeding feedwater heater or condenser + 20°F.
Once the extraction flows were determined, the turbine mass flows were computed for each portion of the expansion. With these mass flows and the enthalpies from the Mollier Chart (Figure 27) , the turbine work output was computed.
feedwater heating is shown in Figure 28. power output of 1000 KW and a condenser temperature of llO°F were selected. The results plotted show the effect of using one or more of the available extraction ports (discussed earlier) for the full study range of turbine inlet temperature and pressure conditions. additional feedwater heater steadily decreases. However, even the last feedwater heater produces almost a 3 percent improve- ment in cycle efficiency. The cost savings from the reduction in size of the solar receiver should more than offset the cost of even the fourth feedwater heater. A note should also be made of the fact that turbine efficiency decreased by 1 to 5 percent for the cycles analyzed. The turbine efficiency was computed from the last stage efficiency which is based upon a low mass flow rate. This is conservative because the average mass flow in the turbine is about 20 percent higher than at the last stage exit.
The effect on basic cycle efficiency from the addition of For this analysis, a
As can be seen, the relative value of using an
MINIMIZING CONFIGURATIONS OVER POWER RANGE
From a commercialization viewpoint, a study was conducted to determine the number of basic radial outflow turbine designs that i,-uld be required to cover the power range between 100 KW and 5MW. T:..e number of designs required depends upon the performance varia- tion specified for each individual design.
In a fixed geometry turbine with a fixed set of Rankine cycle qarameters, shaft speed should be held constant while varying power output to maintain good performance. stage design, the individual stages should remain matched by holding the inletlexit velocity triangles constant.
This is because in a multi-
For a sample case chosen, the analysis was begun with a 5 MW turbine design. Holding the shaft speed constant, the turbine blade heights (and thus power output) were reduced until the tur- bine efficiency had decreased by 3 percentage points. Turbine
16

efficiency was computed by the methods described earlier. power level corresponding to the reduced power output of the fixed turbine design, the process was restarted with a new design. speed and turbine efficiency were recomputed for an optimized design.
At the
Shaft
A sample cycle with turbine inlet conditions of lOOOOF and 1000 psia and a condensing temperature of llO°F das utilized for the analysis. The turbine family which resulted for the 5 MW to 100 KW power range is shown in Figure 29. With a 3 percentage point deviation between designs, seven ROF turbines are needed to cover the above power range. For lesser variations between designs, a nearly linear relationship exists, i.e., 20 designs would be required with only a 1 percentage point deviation on each design.
17
POWER CONVERSION SUBSYSTEM EFFIC IEYCY The complete Power Conversion Subsystem (PCS) was analyzed
to determine the amount of heat energy required to produce a given amount of electrisity.
GEARBOX AND GENERATOR
Data was obtained for commercial gearbox and generator effi- ciencies as a function of power output. plotted in Figure 30. generator efficiency decreases at an increasing rate below the 1000 KW power level.
This data is shown As can be seen in Figure 30, gearbox/
The power consumed by the gearbox lube pump was specified by the manufacturers to be approximately 0.05 percent of the output power. For the PCS efficiency calculations, the power consumption of this pump was assigned to a category of other PCS low power consumers which is discussed later. pumps: in some cases, one shaft driven and one motor driven, to prevent the loss of oil pressure which csn be very damaging to this equipment.
Most gearboxes have dual
BOILER FEED PUMP
Boiler feed pump power for the cycles of this study ranged between 0.2 to 1.5 percent of the turbine power output. equation for feed pump pcwer was defined as follows:
The
m (Pi-Pe) Ef = 806000
This equation is based upon a 70 percent pump efficiency. No electric motor efficiency was accounted for because this pump could potentially be shaft driven from either the turbine or gearbox. For the sample cycle used in this report having inlet conditions of 1000°F, 1000 psia and llO°F (1.275 psia) condensing, the feed p m p power represents 0.8 percent of the power output.
CONDENSER
The steam condenser power consumption is dependent upon the
1. Direct contact, air-cooled 2. Cooling tower, evaporative-cooled 3. Shell and tube, water-cooled.
type of unit selected, which is one of the following:
In the above list, equipment cost and power consumption increase from top to bottom. In the table below, the approximate .cost of the three condenser types is shown as a function of the heat rejection load and the differential between condensing steam and ambient temperature
18

CONDENSER TYPE -
Air-cooled Evaporative Water-cooled
EQUIPMENT COST (DOLLARS=*F/BTU/HR)
0.50 0.25 0.05
The water-cooled condenser option is by far the most economical; however, very large quantities of water are required. The cool- ing water flow rate is defined as follows:
For the sample engine shown in Figure 31, a cooling water flow of 317 GPM would be required for a water temperature of 70°F. Assuming a 100 ft. head for transport of the cooling water to the condenser and SO percent pump/motor efficiency, the power required for the circulation pump would be:
26.5
For an air-cooled condenser, the cooling fan as a function of the heat differential between condensing steam as fallows: -
power required to drive the rejection load and the and ambient temperature is
c E = 6900 (AT)
For the sample engine shown in Figure 31, the fan power consump- tion would be 36.8 KW for an 85'F ambient. This results in a loss factor of 0.963 on the steam Rankine cycle efficiency. For a water-cooled condenser, this factor would only be 0.988. The penalty factor for an evaporative cooling system would fall some- where between the two above values. Prior to the start of the study, however, a decision was made not to evaluate cooling tower performance . AUXILIARIES
Other PCS power consumers have been grouped into a category labeled "PCS Auxiliary Power." The estimated power consumption as a function of the overall power output of items in this category would be the following:
19

PCS AUXILIARY POWER REQUIRED/ POWER OUTPUT
1. TGG* instrumentation and controls 0.0005
3. Gearbox oil cooler water pump 0 . 0005 4. Condenser vacuum pump 0.0025 5. Steam generator instrumentation and
2. TGG* lube pumps 0.0010
controls 0.0005
6. Total 0.0050
*Turbine/gearbox/generator.
As shown in the sample engine efficiency calculation which follows, a loss factor of 0.995 was applied to the cycle efficiency to account for the PCS auxiliary power consumption.
POWER CONVERSION SYSTEM EFFICIENCY
Shown in Figure 31 is a sample steam Rankine engine efficiency calculation sheet, which is based upon the steam Rankine cycle of Figure 10. Loss factors were computed as described above for the following:
1. Gearbox 2. Generator 3. Stem generator feed pump 4. Condenser 5. Plant auxiliaries.
For the sample calculation shown in Figure 31, the overall engine efficiency of the power conversion subsystem was calculated to be 0.309 for an air-cooled unit and 0.317 for a water-cooled unit. For a 1000 KW engine condensing at llO°F, which is compatible with air or water cooling, engine efficiency is shown as a function of turbine inlet conditions in Figures 32 and 33.
PART LOAD OPERATION AND PERFORMANCE
The ideal load curve, from an economic standpoint, for a solar electric powerplant would be to operate at or near full power all of the time. In the early systems, it may be possible to connect them to the electrical grid in such a manner that would permit this type of operation. Eventually, however, the system will have to be designed to respond to a load curve like that of the large elcctric utilities. Typically, this means an annual load factor of approximately 65 percent and the ability to turn- down to 20 percent load. at part load is therefore an important design criteria.
The capability to operate efficiently
Three methods of operating the steam Rankine engine at part load were investigated. These being the following:
20

1. Turbine inlet temperature held constant, inlet pressure throttled to match load.
2. Turbine inlet temperature and pressure decreased to match load.
3. Turbhj inlet pressure held constant, inlet temperature decr2a:ed to match load.
For each of the above operating methods, a set of assumptions was applied: these include:
Turbine inlet volumetric flow rate held constant through- out the load range.
Condenser heat rejection load divided by the differentis1 between condensing and ambient temperatures was hr'' constant.
Turbine shaft speed was held constant. ET1 and NP ur- bine part load efficiency was used to define the Rur' turbine off-design performance.
Gearbox losses were held constant; thus, gearbox efficiency decreases with load as shown in Figure 31.
Generator part load performance was taken from commercial data as shown in Figure 34.
Feed pump and condenser power requirements were computed as defined in the section on Power Conversion Subsyskem Perf orxnance . Control and instrumentation power were held at a constant value of 0.5 percent of the full load power output.
By holding the turbino inlet volumetric flow rate constant, the change in the turbine blade-jet (u/c) ratios is minimized dur- ing part load operation. This optimizes the turbine's off-design performance, as turbine efficiency is very sensitive to changes in this dimensionless parameter.
cause the condensing temperature of the steam to decrease with load. Thi;s, as the load decreases, the specific volume of the turbine exhaust steam will increase maintaining a volumetric flow rate near the design value. This also will contribute to good turbine part load efficiency.
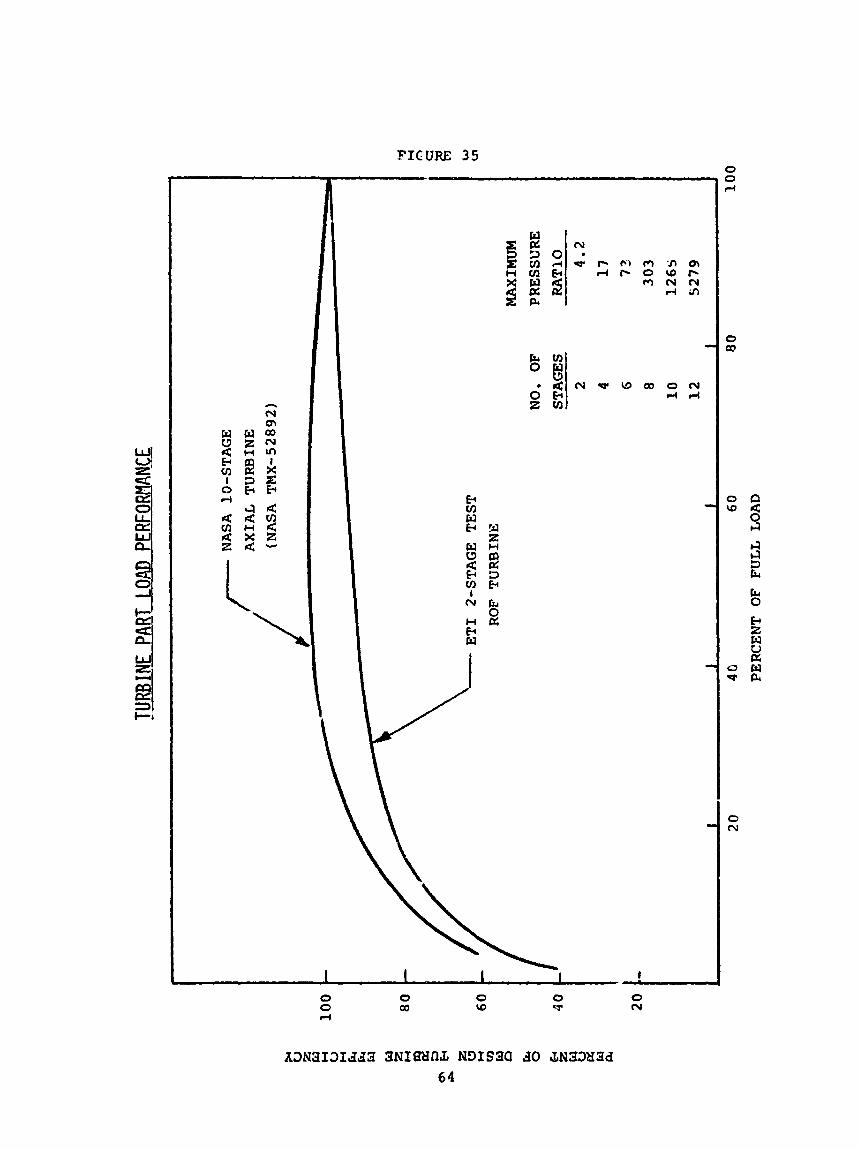
stages and load is shown in Figure 35. built into Figure 35, which is: all turbine stages are subsonic. Thus, the maximum design pressure ratio varies as 3 Cunction of the number of stages. Using the equation defined previously, a chart showing pressure ratio vs. number of stages in Figure 35
OperaLing the condenser as described in Point 2 above will
Turbine part load efficiency as a function of the number of A very key assumption is
21
can be derived.
Steam Rankine engine performance as a funct ion of load w a s analyzed using the sample Rankine cyc le of Figure 1 4 as a basis. The r e s u l t s of t h e Pnalysis are shown p l o t t e d i n Figure 36. The va r i ab le superheat ( t 3 ) method is not p l o t t e d because a t p a r t load, t h e moisture i n t h e tu rb ine exhaust steam was excessive from t h e s tandpoint of lony tu rb ine b!sde life. For most of t he itankine cyc le s of t h i s study, t h i s is l i k e l y t o be t h e case for t h e variable superheat method, which can only be appl ied when t h e fu!' y3al)r t u r - b ine exhaust is superheated steam.
The cons tan t i n l e t temperature (#l) method produces t h e h ighes t p a r t load e f f i c i ency . I n addi t ion , this,method has these advantages: (1) cf t h e t h r e e methods, w i l l draw down t h e s to rage subsystem t o the lowest temperature, (2) r equ i r e s a very simple c o n t r o l system, a..S (3) produces t h e least exposure of tu rb ine t o w e t steam
Steam Rankine engine p a r t load performance vs. t h e power out- pu t of the u n i t i s shown i n Figure 37. The r e s u l t s i n d i c a t e t h a t u n i t s i z e is not a s i g n i f i c a n t e f f e c t on t h e rate of deterioration of engine performance a t p a r t load. Also shown i n Figure 3" i s p a r t load steam Rankine cyc le performance, which i s based onIy on tu rb ine off-design e f f i c i e n c y from a t h r o t t l e d steam supply.
22

ENGINE CONTROLS
This section will discuss the controls required for successful Primary emphasis will operation of the power conversion subsystem.
be on the turbine/gearbox/generator.
Conventional hydraulic-mechanical governors operate at speeds below the 1800 rpm generator speed standard for the 100 KW to 5 MW power range. Thus, they require a small auxiliary gearbox mounted on the turbine or gearbox. Governor shaft power requirements are low, approximately 0.00025 of the turbine shaft power. Commercial equipment has the capabilit3 to respond to 0.02 percent change in speed. Other control capabilities include the following:
1. Synchronization of speed of multiple units.
2. Overspced emergency shutdown actuation (Electrical Engi- neer's Handbook calls for a design limit of 13.0 percent maximum overspeed) .
3. Operating range down to 25 percent of design speed.
When feedwater heating is used to improve engine efficiency, control of the turbine extraction ports must be considered. maintain optimum turbine efficiency throughout the load range, it is necessary to control the extraction flows from the turbine.
To
For the case where single or dual extractions are used, comercially available electronic controls exist which will:
1. Yodulate the turbine inlet and extraction valves to hold shaft speed constant.
2. Maintain turbine horsepower output at a fixed optimum value .
In large electric powerplants, which may have eight or more feed- water heaters, the turbine manufacturer will specify the extrac- tion flows as a function of turbine power output. extraction flows are then maintained by an operator.
The correct
In the design of a solar elec-tric powerplant, several cost and reliability tradeoffs will have to be studied to determine the best approach. tion of feedwater heaters will always be economic on a system's :asis. is required. control logic may become prohibitive. complex automatic control would have to be traded off against that of th2 solar receiver it would replace. the system has storage, excess enerb be available. In that case, uncontrolled extraction ports could be utilized.
Earlier, a statement was made that the addi-
However, this may not be true if fully automatic control The cost of addition of the Nth feedwater heater
The reliability of this
In the case where at part load is likely to
23

According to the Edison Electric Institute, the three major
1. Solid particle erosion (from steam generator tube
causes of turbine failure are the following:
exfoliation).
2. Water induction (through feedwater extraction lines) . 3. Corrosion (from water impurities).
The problem of water induction can largely be overcome by placing check valves in the feedwater extraction lines, and by isolating the turbine from the steam generator during startup The other two problems are related principally to material selection and water quality control.
the use of a demineralizer system for use with the once-through type steam generators likeli- to be used for solar electric power generation. A deep bed of hydrogen or amnonium cations is used to remove ionized solids from the system. This method of water quality control is also known as condensate polishing.
asd shutdown.
Both Babcock and Wilcox and Combustion Engineering recommend
SYSTEM CONTROL AND POWER OUTPUT
To achieve the most cost effective solar electric power system, a configuration and operating method must be devised which derives the optimum power output from a fixed collector field. design feature of any system is the optimum value for this ratio:
A key
- Powerplant Nameplate Rating R - Solar Receiver Design Output
First order effects on the above ratio come from the following:
1. Average system load 2. 3. Collector output vs. time of day 4. Power conversion system efficiency vs. output.
Le3gth of the operating period
It is beyond the scope of this study tn provide detailed analysis of the above design problem, which will dictate the control strat- egy to be used. However, some basic systems were investigated to illustrate the interaction of the above factors.
To analyze the R ratio above, the energy requirements of the total solar electric powerplant must be known. A study contained in Reference 4 estimated the plant auxiliary power, exclusive of that required by the PCS, to be approximately 4 percent of the plant nameplate rating. The plant auxiliary power should remain relatively constant and independent of PCS output. PCS and plant performance vs. load are shown in Figure 38. Note that in Figure 3P. the full load efficiency of the PCS and the plant has been set equal to 100 percent. tion of performance.
Thus, the curves shown represent the rete of degrada-
24

On a given day for a system having only buffer type storage,
A sample curve representing insolation at Barstow,
the optim8m solar receiver/PCS combination occurs at an R value on one. This is due to the shape of the solar insolation vs. t h e of day curve. California, the site of DOE'S 10 H e pilot solar electric plant, is shown in Figure 39. Frum sunrise to sunset, the relative receiver effectiveness as a function of R value is as follows:
POWERPLANT RATING R VALUE
1.00 1.00 1-00 0.80 1-00 0.40
ELECTRICAL ELECTRICAL OUTPUT t OUTPUT RECEIVER SIZE
1.00 1.08 1.22
1-00 0.86 0.49
For this minimal storage type system, decreasing the R value increases the daily output of a given PCS unit. increase is relatively insignificant compared to increase in size of the solar receiver. This would be economically undesirable.
However, this
25
This report covers the results of a study investigatinq the application of ETI's radial outflow (ROF) turbine to solar steam Rankine engines.
Over the range of engine parameters studied, it was found that high efficiency multi-stage ROF turbine designs could be achieved with the speed capability of commercial gearboxes and electric generators. possible in most cases, all turbine stages being located on a single disc.
An overhung turbine/gearbox configuration would be
For the steam Rankine cycles of interest, the moisture toler- ance of the expander is an important design criteria. Much data Is available regarding this design limitation with axial flow turbomachinery. However, it is suspected that this data may be somewhat conservative when applied to the IEOF turbine geometry. When high turbine inlet pressure is utilized, reheating of the steam will be required in many cases to maintain control of the moisture in the expander.
In solar steam Rankine engines, the use of steam extracted from the turbine for feedwater heating can produce $Ae following results :
1. Improvement of cycle efficiency up to 10 percent, yielding savings in solar receiver size and total system cost.
system cost especially in cases where air-cooled condezsing is utilized.
2. Reduction in cofidenser size, effecting savings in
3. Reduction in turbine blade height on last stage, lowering principal stress factor in turbine.
For the above reasons, feedwater heating should be included in any solar steam turbine driven Rankine engines.
The method of operation and control of the solar steam engine can have significant effects on the gross power output over an operatin5 period. Points to consider are the following:
1. Engine performance is more sensitive to turbine inlet temperature variations than inlet pressure variations.
2. Engine efficiency decreases at an increased rate below 20 percent of full load.
3. Engine off-design operating procedure should not cause moisture in the expander to exceed the design limiting value.
26

In the 100 KW to 5 MW power range, a steam Rankine engine with a ROF turbine primemover should deliver 30 percent conversion efficiency of heat input to electrical power output including losses when turbine inlet temperature exceeds l O O O O F and condensing temperature i s llO°F or less. needed to produce such a system being the ROF turbine. The tech- nology base developed f r o m work on smaller ROF turbines, however, considerably reduces the time and risk elements associated with the development of the turbines discussed in this study.
The only major developmental item
27
A
b
C
Dh E
E f
9
A h '
Ahi
Aht
AhW
J
K
M
m
me mi
a, N
re
Pi
Px
Q Re
rt
S
T
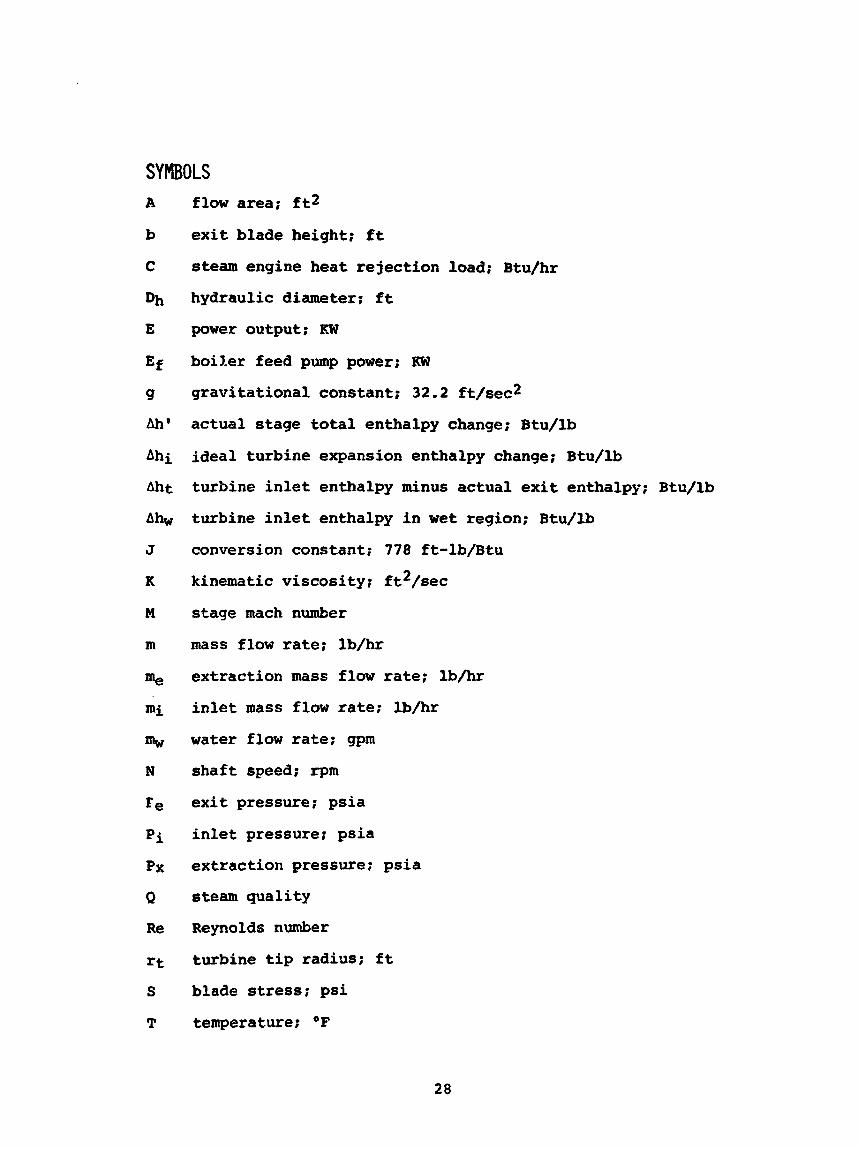
flow area; ft2
exit blade height; ft
steam engine heat rejection load; Btu/hr
hydraulic diameter: ft
power output; KW
boiler feed pump power; RW
gravitational constant; 32.2 ft/sec2
actual stage total enthalpy change; Btu/lb
ideal turbine expansion enthalpy change; Btu/lb
turbine inlet enthalpy minus actual exit enthalpy; Btu/lb
turbine inlet enthalpy in wet region; Btu/lb
conversion constant; 778 ft-lb/Btu
kinematic viscosity; ft2/sec
stage mach number
mass flow rate; lb/hr
extraction mass flow rate; lb/hr
inlet mass flow rate; lb/hr
water flow rate; gpm
shaft speed; r p m
exit pressure; psia
inlet pressure; psia
extraction pressure: psia
steam quality
Reynolds number
turbine t i p radius; ft
blade stress: psi
temperature; OF
28

TX
V
vSP
vt W
X
z
x qd
‘I1
‘IW
v V
P
saturation temperature at Px; OF
velocity; ft/sec
spouting velocity; ft/sec
tip velocity; ft/sec
wetted perimeter: ft
number of turbine stages
overall (dry) turbine efficiency/last stage efficiency
Gymarthy’s Factor = 0.35
stage speed-work parameter
overall speed-work parameter
dry turbine efficiency
last stage efficiency
wet turbine efficiency
viscosity; lb/ft-sec
specific volume at turbine exit; ft3/lb
density; lb/ft3
29
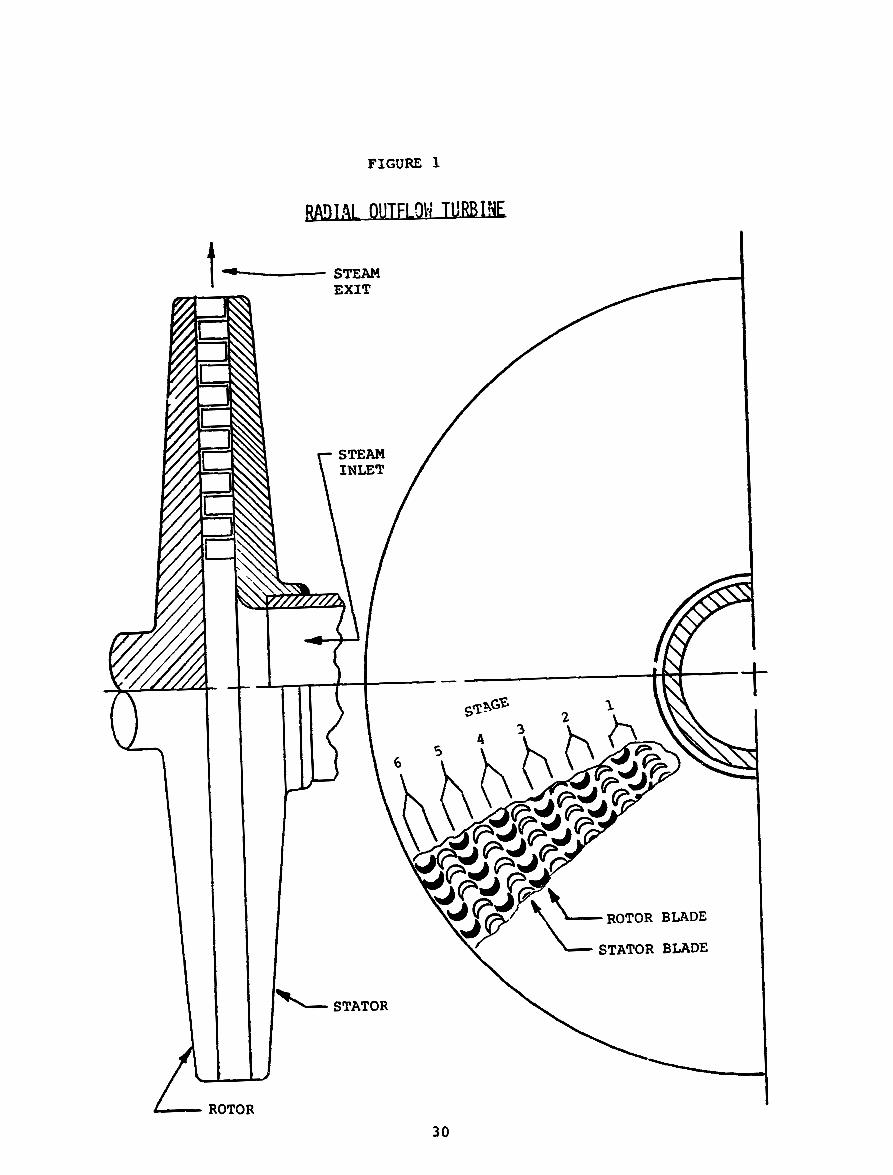
FIGURE 1
- ROTOR 30

FIGURE 2
2
‘ I
31

FIGURE 3
NO. - 1
2
3
4
5
6
7
8
9
10
11
12
13
14
NTIS NO.
N71-17354
N70-10746
AD- 8 5 9- 7 0 2L
N68-37263
N68-18501
N68-16228
N67-17626
N67-16694
N67-15558
N67-10799
AD-642-767
N66-16056
N66-15642
N62-148 19
AUTHOR
KOFSKEY
KOFSKEY
N I CBOLS
FUTRAL
NUSBAUN
KLASSEN
NUSBAUM
HOLESKI
ODIVANOV
KOFSKEY
BALJE
KOFSKEY
WASSERBAUER
WONG
TYPE - RADIAL
AXIAL
AXIAL
AXIAL
AXIAL
AXIAL
RADIAL
RADIAL
RADIAL
RADIAL
AXIAL
RADIAL
RADIAL
AXIAL
32

FIGURE 4
I I 1 , I I I 0 0 d
0 0 m 00
0 3 t- w 0
m
3 3

FIGURE 5
m
0 0
4 0
00 dr
0
9 dr
0
9 dr
0
N m 0
I
0 m 0
0
34

FIGURE 6
REFERENCE NO. OF E T 1 ROF TURBINE NUMBER STAGES DESCIZIPTION
1
2
6
1 A l l s i n g l e s t a g e turbines
2 8 KW test turbine of 1976
LAST
STAGE TURBINE - -
EFF. - EFF . -
0.74
5 22 KW s o l a r c o o l i n g 0 . 8 5 turbine of 1979
7 9 KW gas heat pump 0 . 6 5 turbine of 1 4 i 5
10 68 KW automotive 0.7:
turbine of 1 9 7 3
1 2 1100 IW s o l a r electric 0 . 9 4 turbine of 1979
0 .69
0 .78
0.60
0 .70
0.90
35

FIGURE 7
1800
1700
1600
1500
1400
1300
1200
110 0
1000
900
800 1.0 1.2 1.4 1.6 1.8 2.0 2.2
ENTROPY (BTU/LB- R)
36
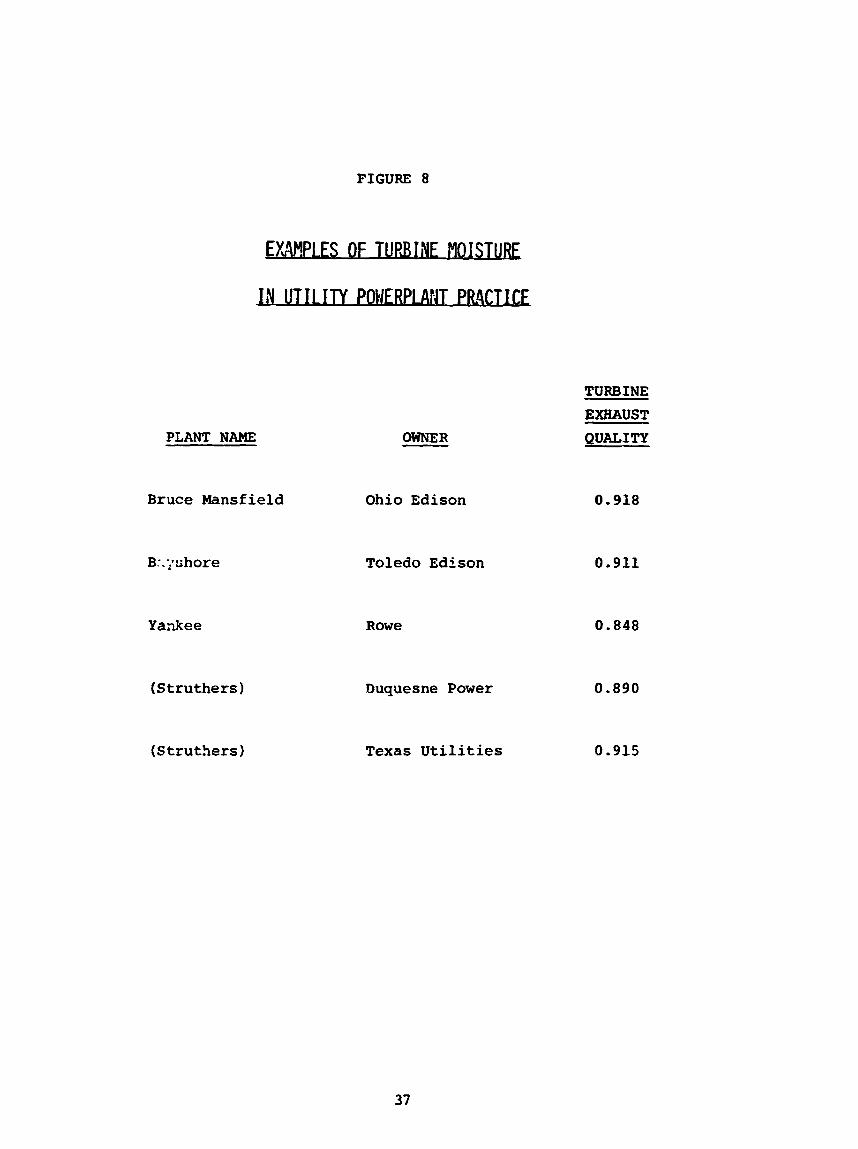
FIGURE 8
PLANT NAME
Bruce Mansf i e l d
B:.;.shore
Yankee
(Struthers)
(S t ruthers )
OWNER
Ohio Edison
Toledo EdFson
Rowe
Duquesne Power
Texas U t i l i t i e s
TURBINE EXHAUST QUALITY
0.918
0 .911
0.848
0.890
0.915
37

FIGURE 9
GFARROX SHA rT SPW VS. PO-
REF. NO. - -
1
2
3
4
5
6
7
8
9
10
POWER RATING - -mm-
280
3i5
1000
5000
1390
373
130
750
810
1877
MANUFACTURER AND MODEL
NUMBER
COTTA- 4 12D
COTTA- 712D
WESTERN-11406
WESTERN-12212
LOHMAN-ITG32H
SUNDYNE-SKO
COTTA-215D
WESTERN-11104
LOHMAN-ITG25H
Far-IIPC
MAXIMUM PINION -6PEEB - 19,200
17 , 400
11,700
10,400
12,600
11,700
30,600
13,700
13,500
9,000
NUMBER OF
REDUCTIONS
2
2
1
1
1
1
2
1
1
1
ovrpuT SPEED- - 1800
1800
1800
1800
1800
1800
3600
1800
1800
1800
38
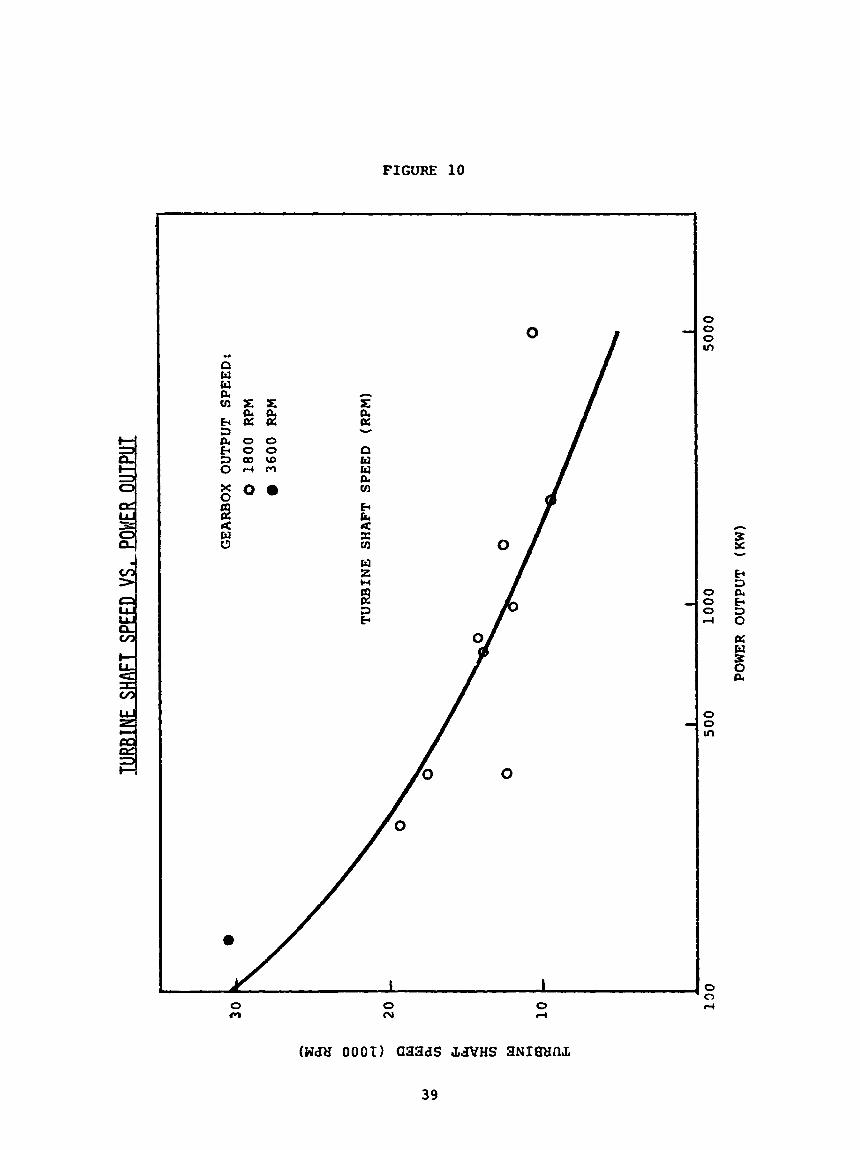
FIGURE 10
.. n w
ti W
Y
n tl w R rn E E R 1: [I)
w z
0 m
0
0
0 N
0 d
0 0 0 In
0 0 0 I 4
0 0 m
0 0 4
39
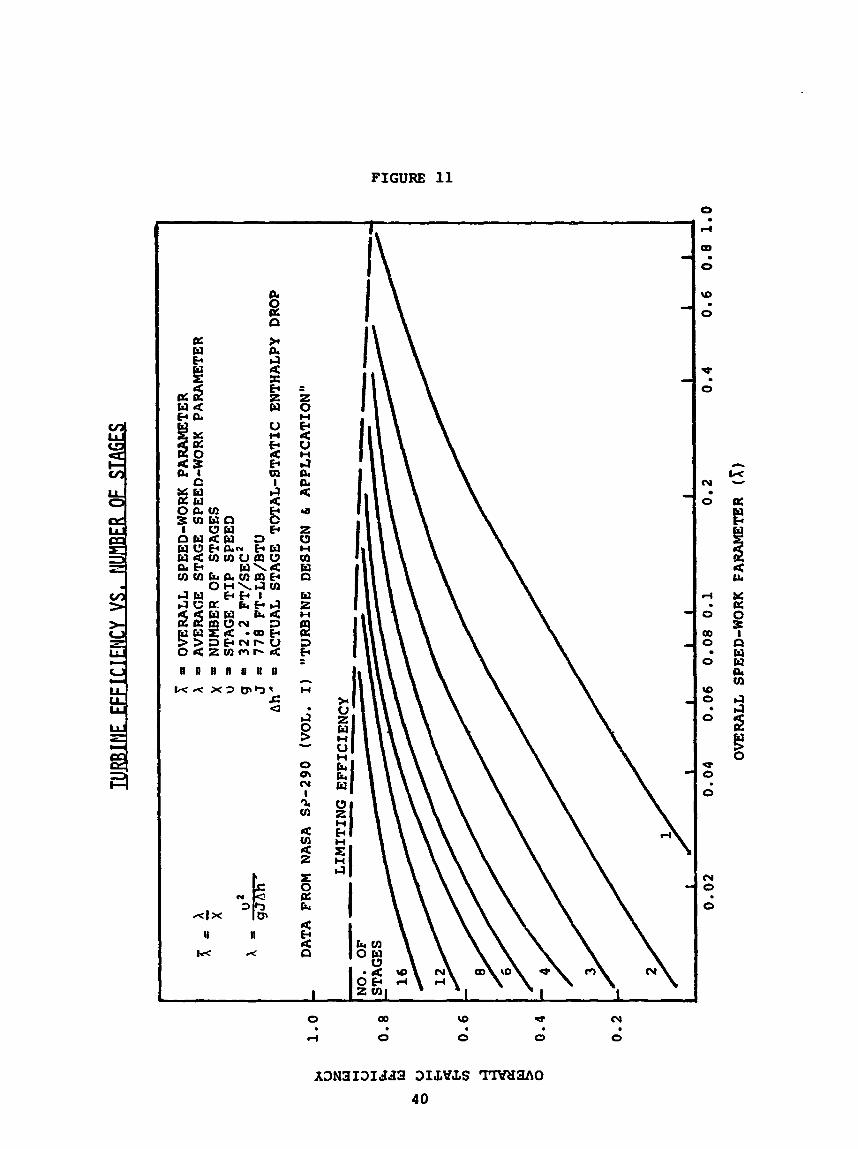
FIGURE 11
0
d
PD
0
W
0 .
d
0
N
0
d
0
00 0
0
.
W 0
0 0
0 0
0
ry 0
0
L w
E E
n n n t t u ~ n
II kc r<
I
I I\
0 Q)
rl 0 . W *
0 0 . (v
0

FIGURE 12
" \
I a . I 1
al m
r- m
m m
rl m
0 9 N
I- N
0 0 N rl
0 0 0 rl
0 0 Q)
D

FIGURE 13
ENTROPY
ENTROPY
42
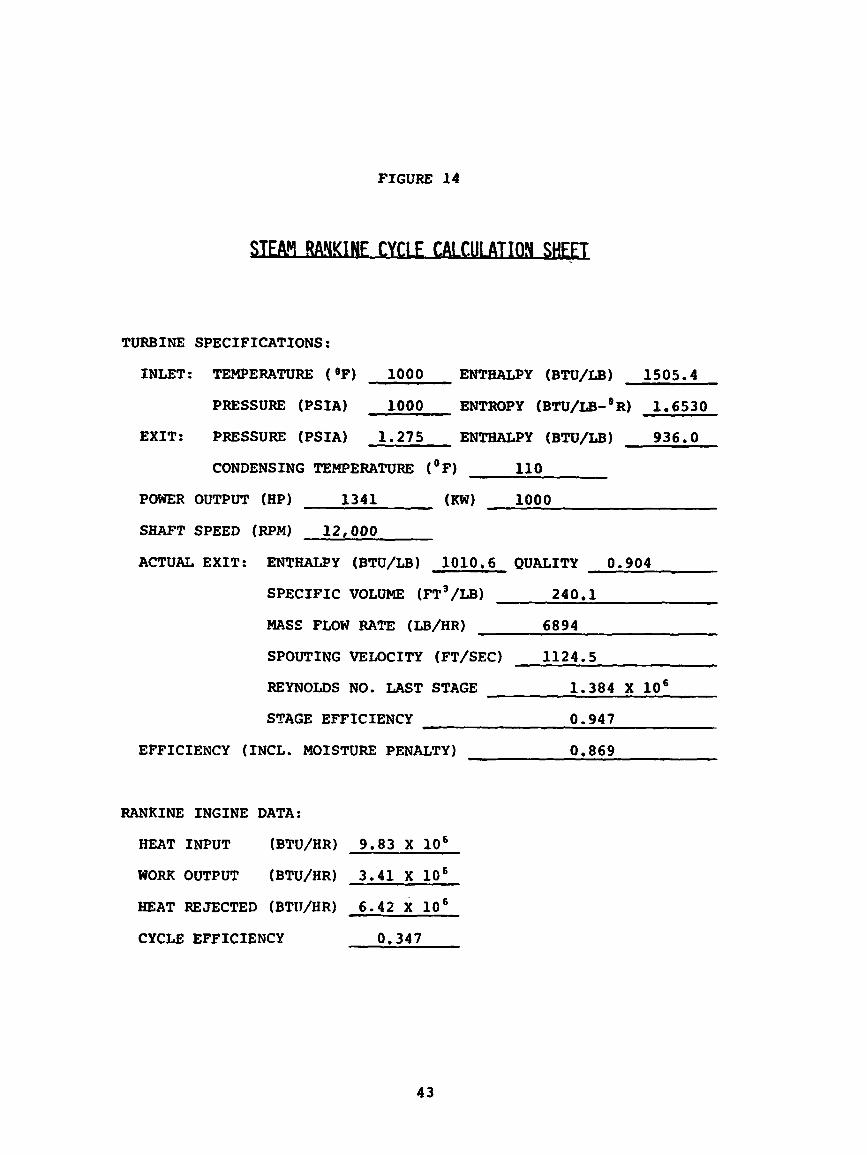
FIGURE 14
Y m F CY-I CUI ATJON SHEET
TURBINE SPECIFICATIONS:
INLET: TEMPERATURE (OF) 1000 ENTHALPY (BTU/LB) 1505.4
PRESSURE (PSIA) 1000 ENTROPY (BTU/LB-OR) 1.6530
EXIT: PRESSURE (PSIA) 1.275 EN!lWGPY (BTU/LB) 936.0
CONDENSING TEMPERATURE (OF) 110
POWER OUTPUT 1341 1000
SHAFT SPEED (RPM) 12,000
ACTUAL EXIT: ENTHALPY (BTU/LB) 1010.6 QUALITY 0.904
240.1 SPECIFIC VOLUME (FT3/LB)
MASS FLOW RATE (LB/HR) 6894
SPOUTING VELOCITY (FT/SEC) 1124.5
REYNOLDS NO. LAST STAGE 1.384 X lo6
STAGE EFFICIENCY 0.947
EFFICIENCY (INCL. MOISTURE PENALTY) 0.869
RANKINE INGINE DATA:
HEAT INPUT (BTU/HR) 9.83 X lo6
WORK OUTPUT (BTU/HR) 3.41 X lo6
HEAT REJECTED (BTU/HR) 6.42 X lo6
CYCLE EFFICIENCY 0.347
43
1800
1700
1600
1500
E Lp d \ 3 E m
1400
. c . * 1300 al d 4 X B z w 1200
1100
1000
900
800 1.0 1.2 1.4 1.6 1.8 2.0 2.2
ENTROPY, s 1 BTU/LBm X R
4 4

FIGURE 16
0 0 ry cl
0 0 0 rl
0 0 00
N tr
0 tr
QD m
w m
6 m
N 0 m m
45

FIGURE 17
0 0 (v rl
0 0 0 rl
0 0 00
i

FJGURE 18
3 0 0 +
I I I I I I I
0 0 N cl
0 0 0 d
0 0 00
0 0 w

FIGURE 19
0 0 d rl
0 0 cv rl
0 0 0 rl
0 0 00
in m
m d m m m
N
4 8

FIGURE 20
/ n N
QI CI In m d al m m m m m N
(aN332I3d) A3N313Idd3 3NI3N3
0 e rl
0 N rl
0 0 4
0 co
0 W
49

FIGURE 21
R EHE A TED STEA9 RAPIMIHE CYCL6:
ENTRC)PY
50
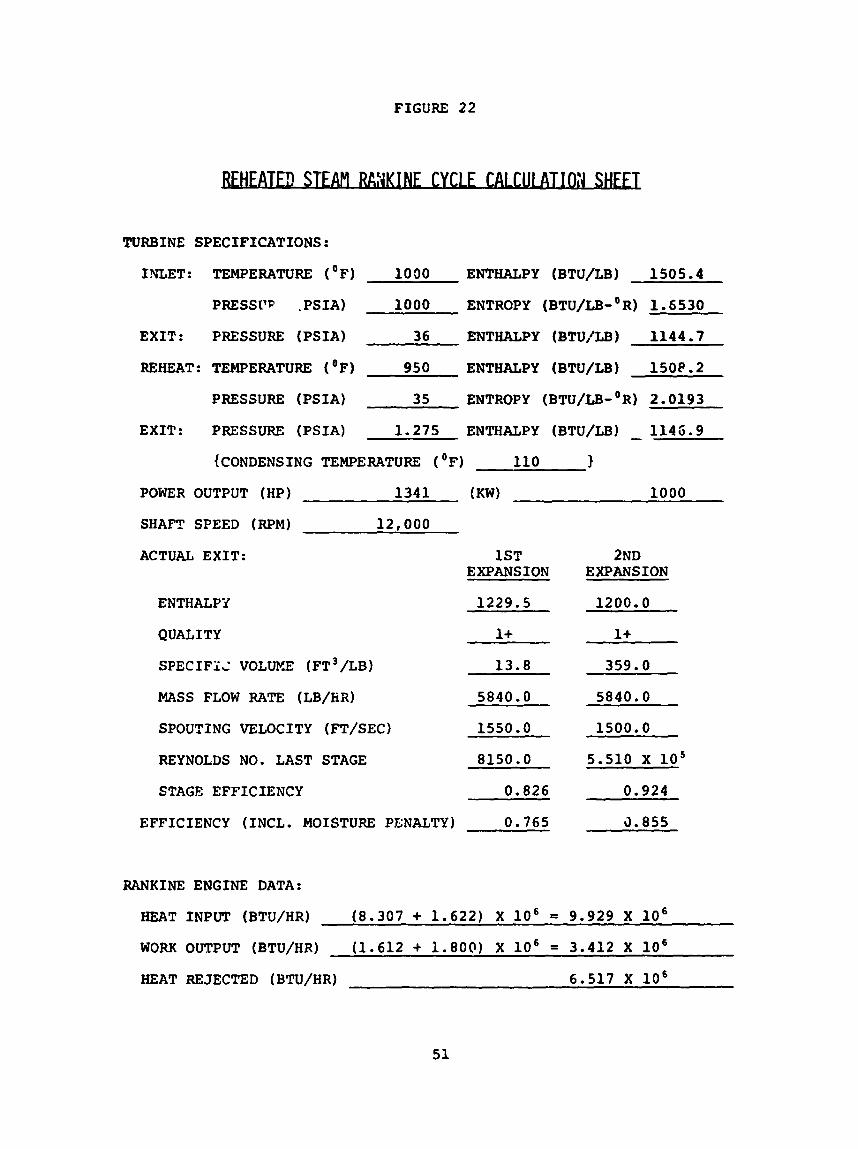
FIGURE 22
TURBINE SPECIFICATIONS:
INLET: TEMPERATURE (OF) 1030 ENTHALPY (BTU/LB) 1505.4
PRESSI'C . PSIA) 1000 ENTROPY (BTU/LB-'R) 1.6530
EXIT: PRESSURE (PSIA) 36 ENTHALPY (BTU/LB) 1144.7
REHEAT: TEMPERATURE (OF) 950 ENTIIALPY (BTU/LB) isoe.2
PRESSURE (PSIA) 35 ENTROPY (BTU/LB-'R) 2.0193
EXIT: PRESSURE (PSIA) 1.275 ENTHALPY (BTU/LB) - 1146.9 {CONDENSING TEMPERATURE (OF) 110 1
POWER OUTPUT (HP) 1341 (KW) 1000
SHAFT SPEED (RPM) 12,000
ACTUAL EXIT: 1ST 2ND EXPANSION EXPANSION
ENTHALPY 1229.5 1200.0
QUALITY 1+ 1+
SPECIFI,' VOLUEX (FT3/LB) 13.8 359.0
5840.0 MASS FLOW RATE (LB/BR) 5840.0
SPOUTING VELOCITY (FT/SEC) 1550.0 1500.0
REYNOLDS NO. LAST STAGE 8150.0 5.510 X 10'
STAGE EFFICIENCY 0.826 0.924
EFFICIENCY (INCL. MOISTURE PENALTY 0.765 3.855
RANKINE ENGINE DATA:
HEAT INPUT (BTU/HR) (8.307 + 1.622) X lo6 = 9.929 X lo6
WORK OUTPUT (BTU/HR) (1.612 + 1.800) X lo6 = 3.412 X lo6
HEAT REJECTED (BTU/HR) 6.517 X lo6
51
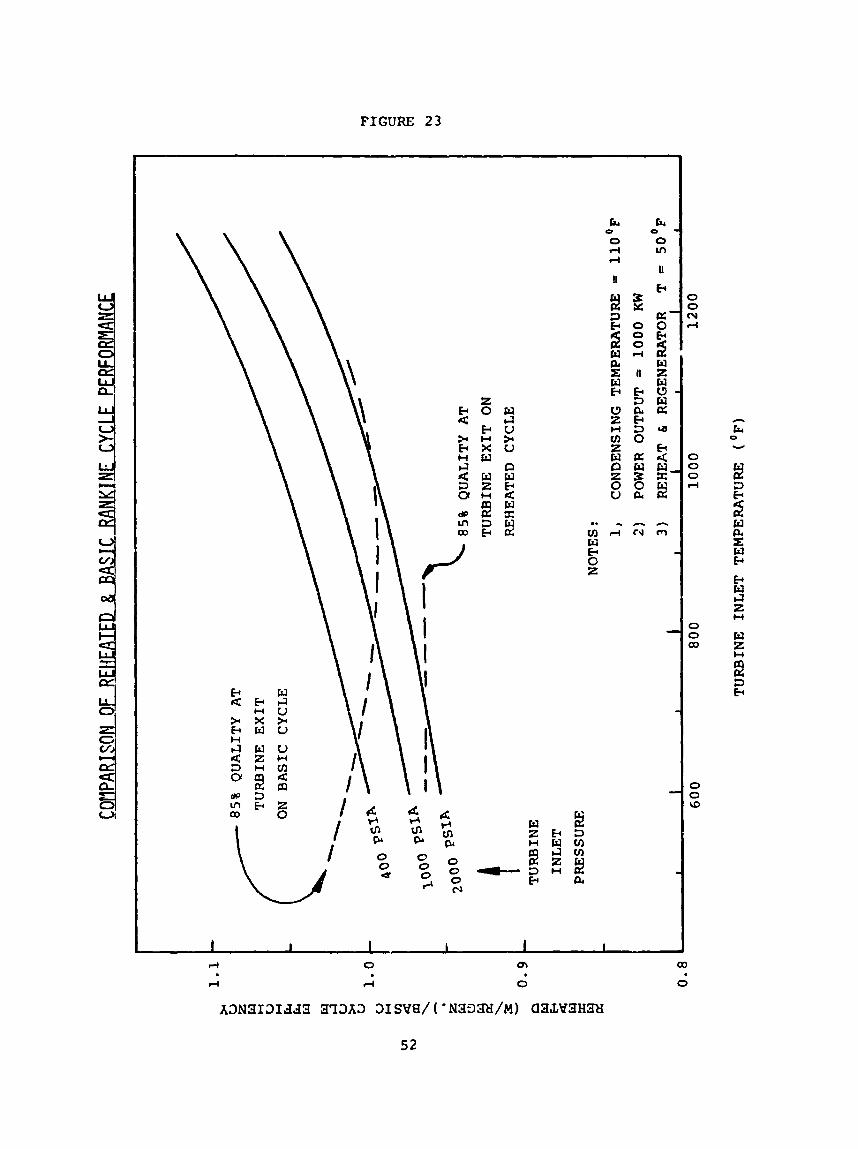
FIGURE 23
tc tc 0 0 rl Ln l-l
U
0 0
!I k
0 0 N -r

FIGURE 24
ENTROPY
53

FIGURE 25
f f
a
a
W [;1 r4
5 n
54
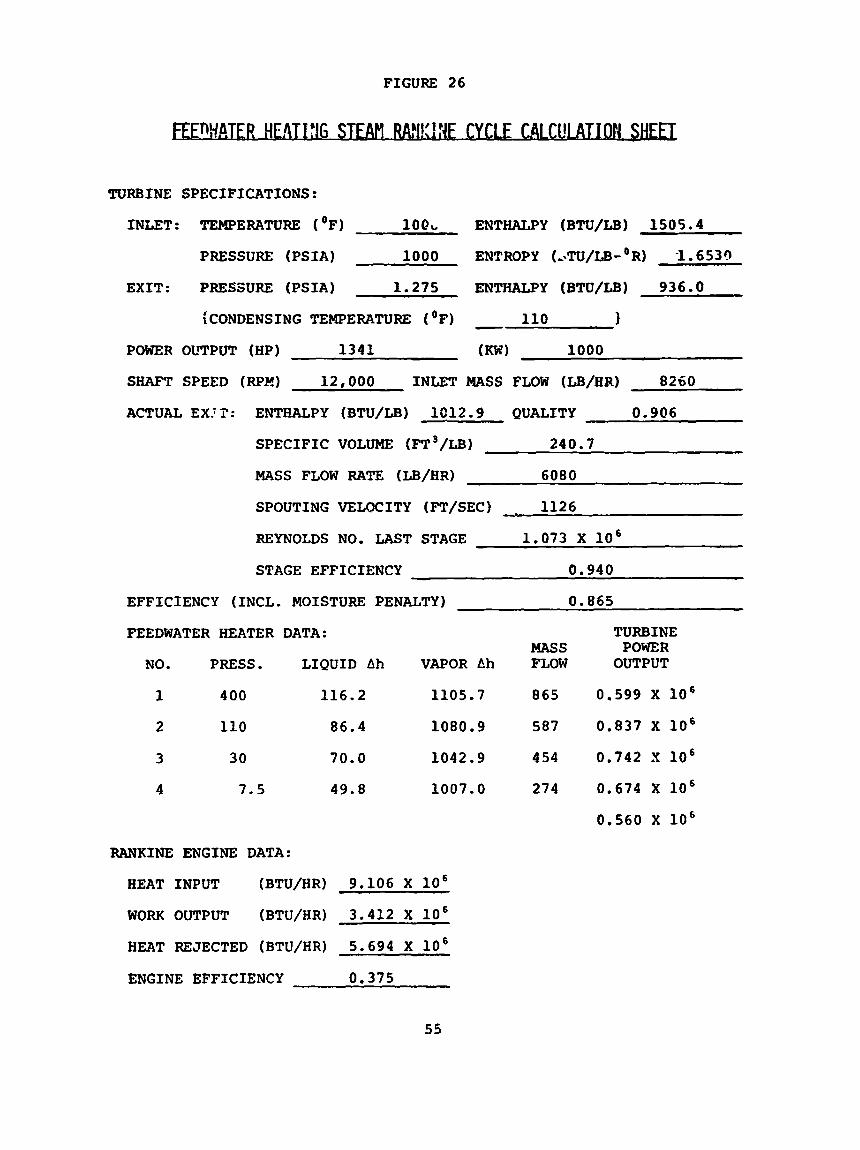
FIGURE 26
TURBINE SPECIFICATIONS:
INLET: TEMPERATURE (OF) 10Qb ENTHALPY (BTU/LB) 1505.4
PRESSURE (PSIA) 1000 ENTROPY (L.TU/LB-oR) -1.653Q
EXIT: PRESSURE (PSIA) 1.275 ENTHALPY (BTU/LB) 936.0
110 1 - ~CONDENSING TEMPERATURE ( O F )
POWER OL'TPUT (HP) 1341 (Kk" 1000
SHAFT SPEED ( W E ) 12,000 INLET MASS FLOW (LB/HR) 8260
ACTUAL EX'T: ENTHALPY (BTU/LB) 1C12.9 QUALITY 0.906
SPECIFIC VOLUME (FT3/LB) 240.7
MASS FLOW RATE (LB/HR) 6080
SPOUTING VELOCITY (F"/SEC) 1126
REYNOLDS NO. LAST STAGE 1.073 X lo6
STAGE EFFICIENCY 0.940
EFFICIENCY (INCL. MOISTURE PENALTY) 0.865 >
FEEDWATER HEATER DATA: TURBINE MASS POWER
NO. PRESS. LIQUID Ah VAPOR Ah FLOW OUTPUT
1 400 116.2 1105.7 865 0.599 X l o 6 2 110 86.4 1080.9 587 0.837 X lo6
3 30 70.0 1042.9 4 54 0.742 X lo6
4 7.5 49.8 1007.0 274 0.674 X lo6
0.560 X lo6
RANKINE E N G I N E DATA:
HEAT INPUT (BTU/HR) 9.106 X lo6
WORK OUTPUT (BTU/HR) 3.412 X 10
HEAT REJECTED (BTU/HR) 5.694 X lo6
ENGINE EFFICIENCY 0.375
55

FIGURE 27
ACTUAI T U B E EXPANSION WITH EXTRACTIOih ' ! FOR FmlEATER HEATIIIG I
1800
1700
1600
1500
1400
1300
1200
1100
1000
900
800 1.0 1.2 1.4 1.6 1.8 2.0 2.2
ENTROPY, s, BTU/LB, X R
56

FIGURE 28
0 4 O W NPI
O H 04 O H O W rcpc
m m
p. m
m m
0 m
r( m
0 0 (v r(
0 0 0 4
0 0 (D
0 0 W

FIGURE 29
T [ P
DEFINITION
Beginning with a 5 ROF turbine design, power output is
decreased until efficiency is reduced by 3 percenta7e points. A
new ROF turbine design is then computed based on 8 higher shaft
speed.
STEW. RANKINE CYCLE SPECIFICATIONS :
Turbine Inlet Conditions:
Temperature: lOOO'F
Pressure: 1000 PSIA
Condensing Temperature: llO°F
- 5, COO
2,800
1,570
880
500
285
160
5,000
5,000
7 , 150
9,700
12,720
16,210
20,300
OPTIMIZED ROF SHAFT
TUETNE SPEED E-CY m
0.880 - 0.850 7 , 150 0.848 9,700
0.842 12 , 720 0.834 16,210
0.825 20 , 300 0.814 25,280
OPTIMIZED ROF
EFFICIENCY TURBINE
- 0.878
0.872
0.864
0.855
0.844
0.833
58

FIGURE 30
0 0 0 ln
0 0 0 c\1
0 0 0 d
0 0 In
0 0 hl
0 0 rl
5 9

FIGURE 31
TURBINE SPECIFICATIONS:
INLET TEMP. ( OF) 1000 EXIT PRESS. (PSIA) 1.275
PRESS. (PSIA) 1000 COND. TEMP. ( OF) 110
POWER OUTPUT (HP) 1341 (Kw) 1000
SHAFT SPEED (RPM) 12 ,000
EFFICIENCY 0.869
RANKINE INGINE DATA:
HEAT INPUT (BTU/HR) 9.83 X lo6
WORK OUTPUT (BTU/HR) 3.41 X l o 6 HEAT REJECTED (BTU/HR) 6.42 X l o 6 CYCLE EFFICIENCY 0.347
GEARBQX EFFICIENCY 0.980
GENERATOR EFFICIENCY 0.955
FEED PUMP POWER (KW) 8.44 (0.992)
CONDENSER POWER:
AIR-COOLED (KW) 36.59 (0.963)
WATER-COOLED (KW) 12.0 (0.988)
PCS AUXILIARY POWER (KW) 5 (0.995)
(LUBE SUPPLY, INSTRUMENTATIONS, CONTROLS)
OVERALL ENGINE EFFICIENCY: 0.309 (air-cooled)
0.317 (water-cooled)
60

FIGURE 32
.
.. m w
z 8
0 6
~
0 0 N r(
0 0 0 4
0 0 (xj
0 0 W
n Fr 0 Y
2
2
E
3
3 w
w E
c3 2 H
w
i 3 E
( L N 3 3 t r 3 d ) T 3 N 3 1 3 I d J 3 3 N I 9 N 3
61

FIGURE 3 3
f m
0 0 0
J\ 00
0 m
LD N
A
E 0 rl Fl
0
N hl
( L N 3 3 t l 3 d ) A 3 N 3 1 3 I A i d 3 3 N 1 3 N 3
62
0 0 N rl
0 0 0 rl
0 0 a,
0 0 \o

FIGURE 34
&4PH!X PAFIT IC *kQ !?E.!-
Gearbox losses are primarily a function of speed, not load. In a
solar electric power application, speed is a constant. A loss
curve for the gearbox can therefore be predicted based on fixed
losses irrespective of load:
LOAD (PERCENT)
25
50
75
100
GEARBOX EFFICIENCY
0.902
0.941
0.954
0.980
Generator off-design efficiency is taken to be defined by commer-
cial data:
LOAD (PERCENT) GENERATOR EFFICIENCY
25 0.920 0,639
50 0 .952 0.905
75 0.957 0.911
100 0.955 0.908
(1000 Kw) (100 Kw)
Low load generator efficiency falls off more quickly in lower
power units as evidenced in the above chart.
63
0 0 rl
FICURE 35 0
E B H z
k
3 3 v) cn w 05 pc
N
c t r r 0 .
E, r- rl
0 0 m
.n u, N d
0 0 00 u,
0 cs
0 h(
A3N313Id&? 3N1an1L N3IS30 do 1lN33tI3d 64

FIGURE 36
0 hl
0 4
0 0 rl
0 OD
0 \D
0
0 h3
65
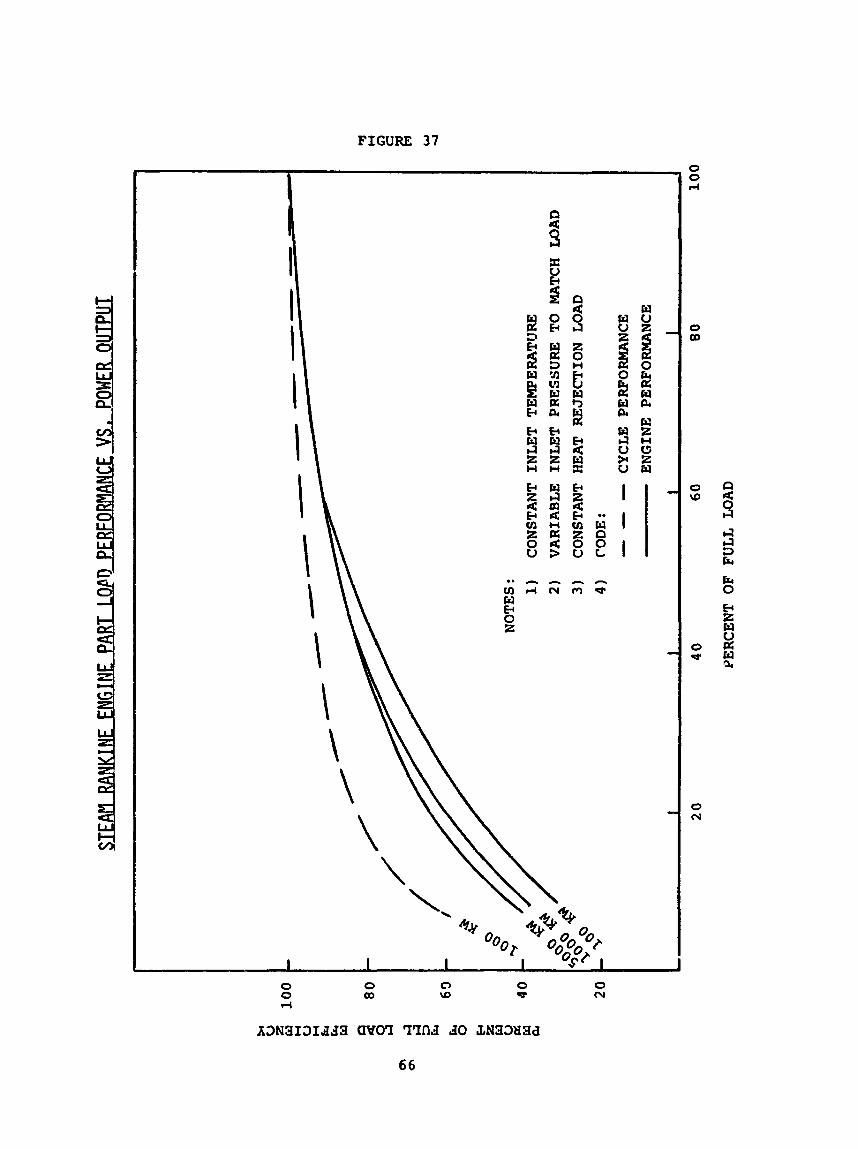
FIGURE 37
I
w u
ii iii w a w d U * U
I I 1
w u
ii 3 w P4 t: z U c5 z w
0 OD
0 w
0 (v
0 0 d
0 00
0 W
0 w
0 hl
66
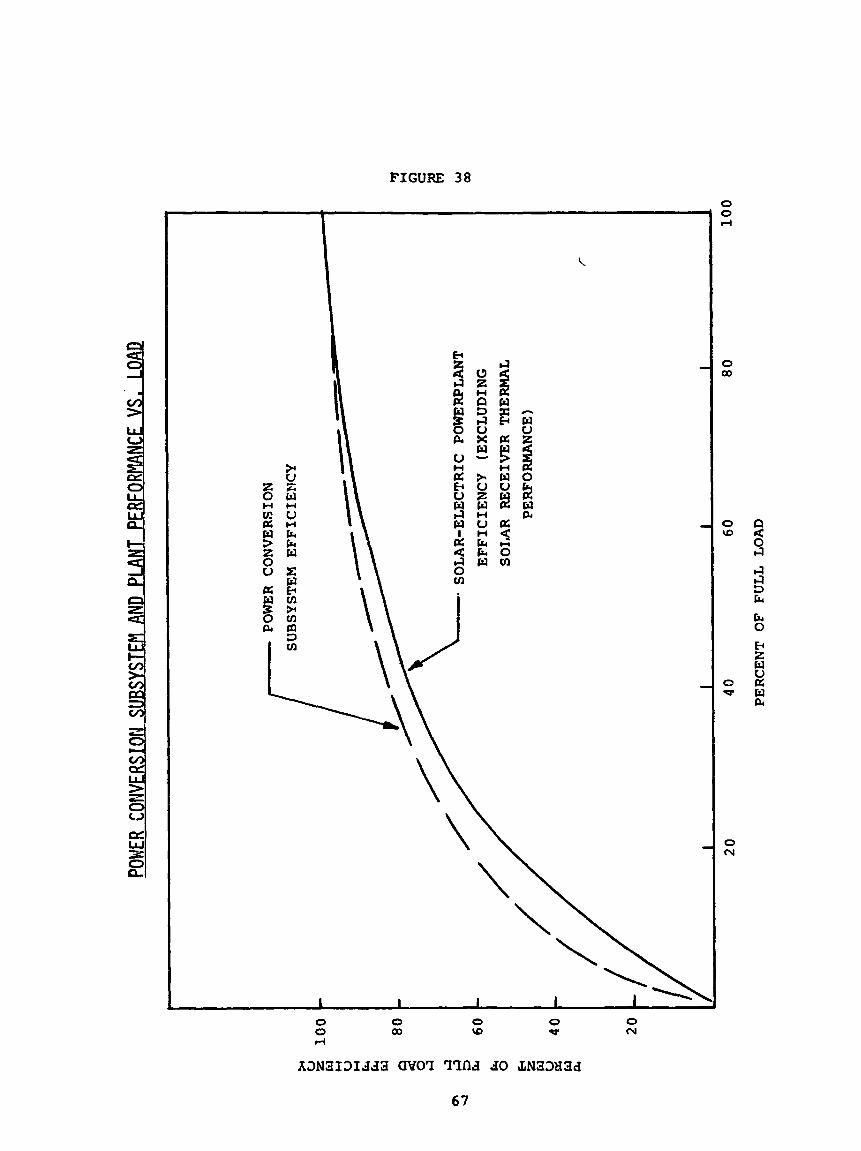
FIGURE 38
Q J e
0 0 d
0 a0
0 W
0 w
0 cv
0 0 d
0 OD
0 W
0 v
0 (v
67

FIGURE 39
1
0 0 m
0 0 hl
0 0 rl
68

REFERENCES
1.
2.
3.
4.
Turbine Design and Application. A. Glassman, NASA Lewis Research Center. NASA SP-290. 1972.
Basic Investigation o f Turbine Erosion Phenomena. W. D. Pouchot et al, Westinghouse Electric Corporation. NASA
CR-1830. November 1971.
Foundations of a Theory of the Wet - Steam Turbine. G. Gyarmathy. AD-489-324. August 1966.
Phase I of the First Small Power System Experiment - Second Quarterly Technical Status Report. R. 3. Holl and R. P. Dawson, McDonnell Douglas Astronautics Company. January 1979.
69