1955 Cesare Emiliani (1922-1995), Geochemist He used the newly established technique of...
73
1955 Cesare Emiliani (1922-1995), Geochemist He used the newly established technique of investigating different isotopes of oxygen (Oxygen-18 vs. Oxygen-16). By measuring how much of these two different isotopes there is, one can determine the temperature at which sea shells (like a clam) grew. She sells sea shells by the sea shore. 1 (Photo: Archives of the Rosenstiel School of Marine and Atmospheric Science, University of Miami) From Wikipedia .
-
Upload
amice-peters -
Category
Documents
-
view
259 -
download
0
Transcript of 1955 Cesare Emiliani (1922-1995), Geochemist He used the newly established technique of...
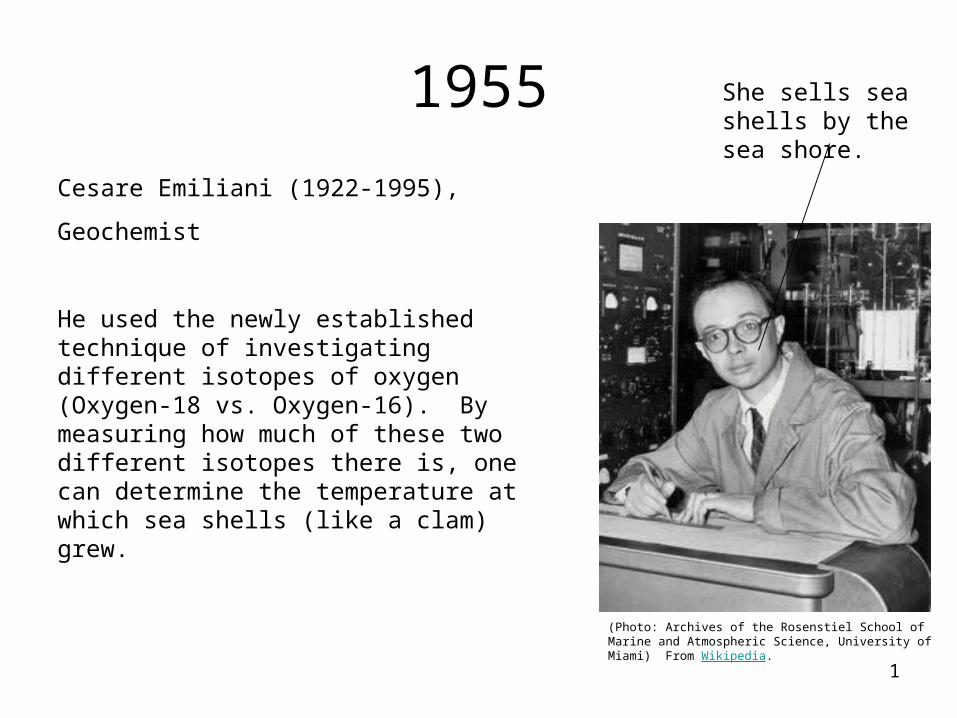
1955
Cesare Emiliani (1922-1995),
Geochemist
He used the newly established technique of investigating different isotopes of oxygen (Oxygen-18 vs. Oxygen-16). By measuring how much of these two different isotopes there is, one can determine the temperature at which sea shells (like a clam) grew.
She sells sea shells by the sea shore.
1
(Photo: Archives of the Rosenstiel School of Marine and Atmospheric Science, University of Miami) From Wikipedia.

1955Looking at fossil shells in a core, he looked back over 1,000,000 years of geologic time and realized that there are lots of ice ages, that they happened every 100,000 years.
This meant that Milankovic was right about variations in Earth’s orbits causing major climate changes, but wrong about which orbital variation was the most important.
Drat.
2
(Photo: Archives of the Rosenstiel School of Marine and Atmospheric Science, University of Miami) From Wikipedia.
Portrait by Paja Jovanovic

1955It turns out that Emiliani was also wrong in detail. He was completely sure that the Oxygen isotope record provided temperatures. It turns out that it does not – it provides an estimate of the evaporation from the ocean, because the heavier Oxygen-18 sticks around in the ocean when there are large ice sheets.
Another great example of how scientists can be wrong in detail, but very useful.
Drat.
3
(Photo: Archives of the Rosenstiel School of Marine and Atmospheric Science, University of Miami) From Wikipedia.

"The young specialist in English Lit ... lectured me severely on the fact that in every century people have thought they understood the Universe at last, and in every century they were proved to be wrong. It follows that the one thing we can say about our modern 'knowledge' is that it is wrong. ... My answer to him was, '... When people thought the Earth was flat, they were wrong. When people thought the Earth was spherical they were wrong. But if you think that thinking the Earth is spherical is just as wrong as thinking the Earth is flat, then your view is wronger than both of them put together.”
- Isaac Asimov

1956
Maurice Ewing
Ewing and Donn explain the connection of feedbacks on the Earth’s globe. This includes the single most important feedback: Solar radiation and albedo.
Did someone say libido?
No! Albedo, albedo, you psychologist.
A random Freud appearance 5
Image from LIFE photo Archive
Photo from Columbia University

Albedo
Albedo - extent to which an object reflects light (the ratio of reflected to incident electromagnetic radiation)
In short, white objects reflect a lot (absorb a little) and black objects reflect little (absorb a lot). This was figured out a long time ago by……
6

Benjamin Franklin, again.
The year, about 1729.
I’m back.
". . . AS to our other subject, the different degrees of heat imbibed from the sun's rays by cloths of different colors, since I cannot find the notes of my experiment to send you I must give it as well as I can from memory…
My experiment was this. I took a number of little square pieces of broad cloth from a tailor's pattern-card, of various colors. There were black, deep blue, lighter blue, green, purple, red, yellow, white, and other colors, or shades of colors. I laid them all out upon the snow in a bright sunshiny morning. In a few hours (I cannot now be exact as to the time) the black, being warmed most by the sun, was sunk so low as to be below the stroke of the sun's rays; the dark blue almost as low, the lighter blue not quite so much as the dark, the other colors less as they were lighter; and the quite white remained on the surface of the snow, not having entered it at all.”
7
Image from Wikimedia Commons.

Although, in 1761, it is Johann Heinrich Lambert in Germany who introduces the term "albedo" in order to describe the differing reflective properties of planets
PlanetsLambert
Ima
ge
fro
m W
ikip
ed
ia
Image from NASA

9
Credit: Steve Ackerman and Tom Whittaker

1957
Sputnik satellite, launched by the Russians (the old USSR).
The political response was to allocate an enormous amount of money for basic science research in the US for the next ~30 years. Science became a priority.
11
Image from Wikipedia.
Source: Air Force photo, from Wikipedia

Promising students were encouraged to become scientists, with the highest form of scientists being a physicists (this will come up later). Hence the term…
She’s so smart that she’ll grow up to be a rocket scientist.
Source: Air Force photo, from Wikipedia
Image: Wikipedia, from Bronisław Duda

1957-The first GCM (Global Climate
Model)
Charney Phillips
Phillips and Charney (atmospheric scientists) run the first GCM, in an attempt to model the Earth’s atmosphere. It was amazing for its time.
Although, in the simulation, after 20 days of model time it started to look a little funky and after 30 days it looked like nothing that ever happened on Earth.
For the first time scientists could see, for example, how giant eddies spinning through the atmosphere played a key role in moving energy and momentum from place to place. Philips's and Charney’s model was quickly hailed as the first true General Circulation Model (GCM).
13
Source: AIP Emilio Segrè Visual Archives

What is a GCM (General Circulation Models)?
These models consist of connected sub-modules that deal with radiative transfer, the circulation of the atmosphere and oceans, the physics of moist convection and cloud formation, sea ice, soil moisture, etc..
14Source: Australian Bureau of Meteorology

1957
2 major events
-Launching of Sputnik
-The first GCM (Global Climate Model)
CO2 in the atmosphere: ~312 ppm
Year
1940 1945 1950 1955 1960 1965 1970 1975 1980
CO
2 C
once
ntra
tion
(ppm
)
308
310
312
314
316
318
320
322
324
15

Mauna Loa, Hawaii
Keeling(atmospheric scientist)
16
1960
The Person
The Place
The Breakthrough
Ima
ge
: NS
F, fro
m W
ikipe
dia
Sou
rce: N
OA
A

1960
The Keeling curve is first published.17
Image from Wikipedia
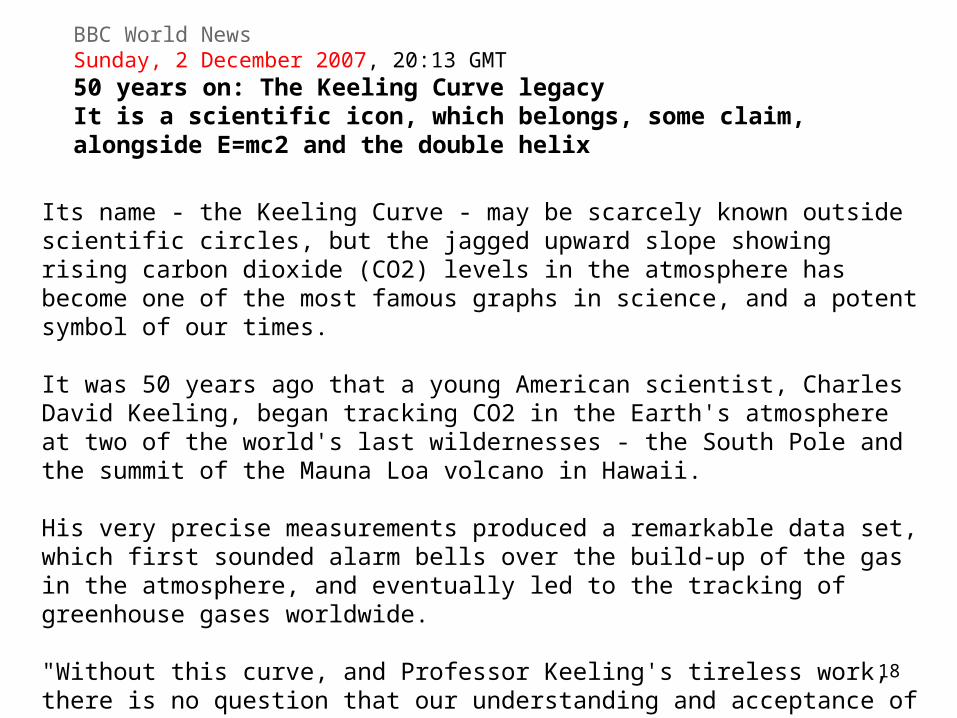
BBC World NewsSunday, 2 December 2007, 20:13 GMT
50 years on: The Keeling Curve legacyIt is a scientific icon, which belongs, some claim, alongside E=mc2 and the double helix
Its name - the Keeling Curve - may be scarcely known outside scientific circles, but the jagged upward slope showing rising carbon dioxide (CO2) levels in the atmosphere has become one of the most famous graphs in science, and a potent symbol of our times.
It was 50 years ago that a young American scientist, Charles David Keeling, began tracking CO2 in the Earth's atmosphere at two of the world's last wildernesses - the South Pole and the summit of the Mauna Loa volcano in Hawaii.
His very precise measurements produced a remarkable data set, which first sounded alarm bells over the build-up of the gas in the atmosphere, and eventually led to the tracking of greenhouse gases worldwide.
"Without this curve, and Professor Keeling's tireless work, there is no question that our understanding and acceptance of human-induced global warming would be 10-20 years less advanced than it is today," adds Dr Manning.
18

"Keeling's data put the capstone on the structure built by Tyndall, Arrhenius, Callendar, Plass, and Revelle and Seus. This was not quite the discovery of global warming. It was the discovery of the possibility of global warming".
- Weart
Human-induced addition of CO2 to the atmosphere becomes a legitimate scientific theory.
. 19
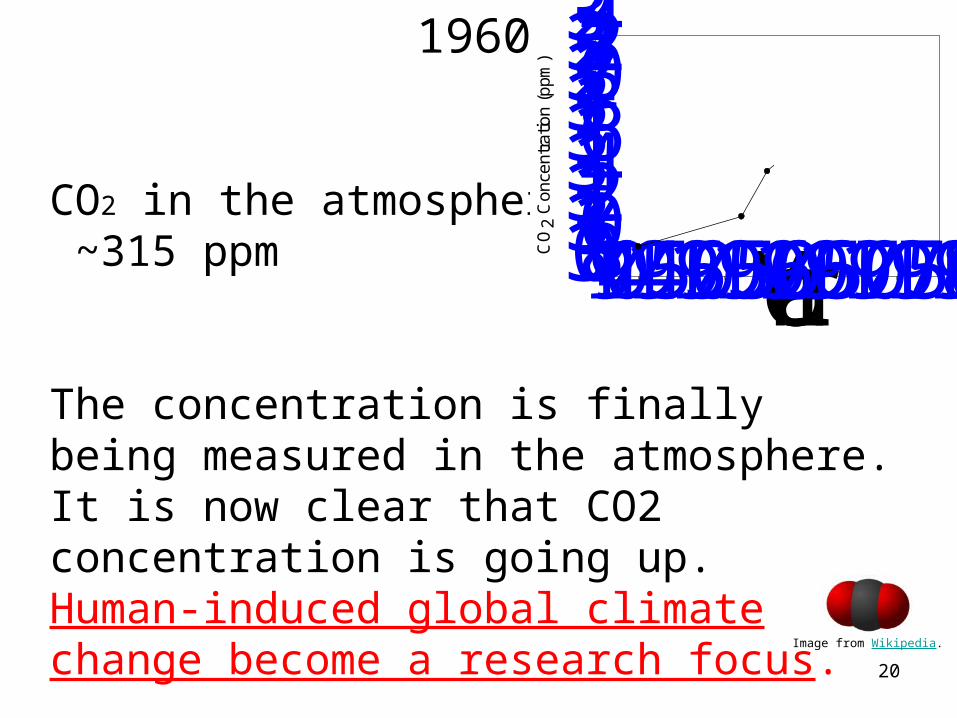
1960
CO2 in the atmosphere: ~315 ppm
The concentration is finally being measured in the atmosphere.It is now clear that CO2 concentration is going up.Human-induced global climate change become a research focus.
Year
1940 1945 1950 1955 1960 1965 1970 1975 1980
CO
2 C
once
ntra
tion
(ppm
)
308
310
312
314
316
318
320
322
324
20
Image from Wikipedia.
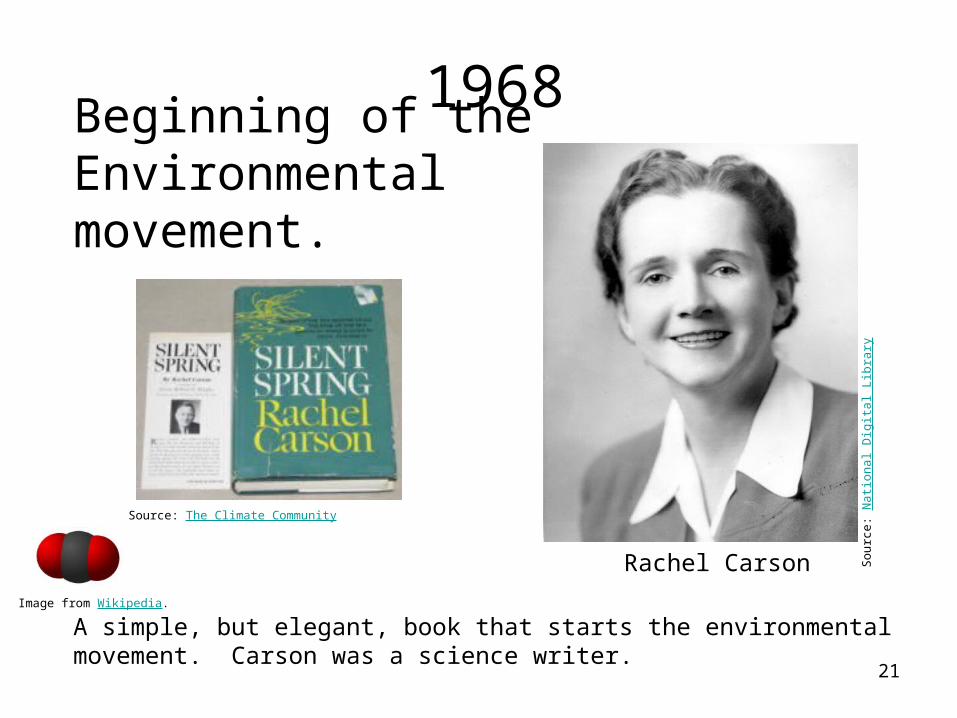
1968
A simple, but elegant, book that starts the environmental movement. Carson was a science writer.
Rachel Carson
Beginning of the Environmental movement.
21
Image from Wikipedia.
Sou
rce
: N
atio
na
l Dig
ital L
ibra
ry
Source: The Climate Community
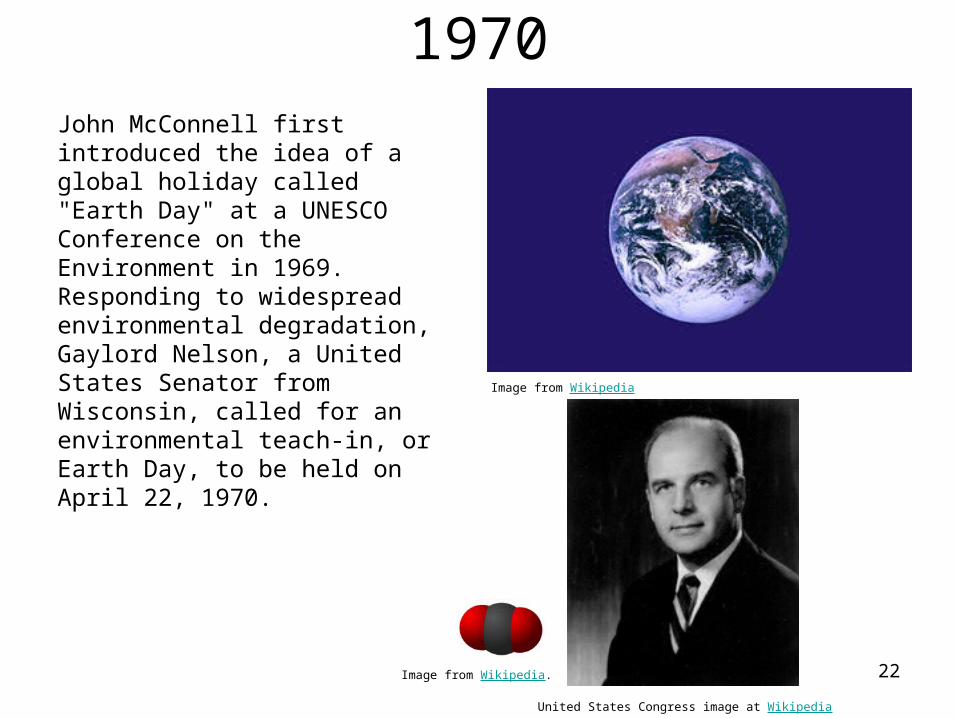
1970John McConnell first introduced the idea of a global holiday called "Earth Day" at a UNESCO Conference on the Environment in 1969. Responding to widespread environmental degradation, Gaylord Nelson, a United States Senator from Wisconsin, called for an environmental teach-in, or Earth Day, to be held on April 22, 1970.
22Image from Wikipedia.
United States Congress image at Wikipedia
Image from Wikipedia

1970
CO2 in the atmosphere:~ 328 ppm
Year
1940 1945 1950 1955 1960 1965 1970 1975 1980
CO
2 C
once
ntra
tion
(ppm
)
305
310
315
320
325
330
335
340
23

On October 24, 2009, environmental activists around the world gathered in support of a geophysical data point. With their bodies, banners, and balloons, they formed the numeral 350, advocating that governments should adopt 350 ppm as a target for atmospheric carbon dioxide concentration (some climate scientists suggest that this is the highest amount of CO2 possible not cause significant climate change).
Ima
ge
fro
m W
ikip
ed
ia
Source: The Standard

The 450 number came from the various graphs and tables of the 2007 report of the Intergovernmental Panel on Climate Change—but Rajendra Pachauri, who chairs the IPCC, has said repeatedly in the last year that that science is out of date. Recently, asked why he’d endorsed a 350 target instead, he said: “As a human being, I just couldn’t keep quiet in the face of all this overwhelming evidence. I know it’s probably not right for me to take a position such as this, but on the other hand, I think it would be totally immoral on my part not to take a position, so I came out and said so.”
Source: The Standard

The AtmosphereBryson’s chapter: Into the Troposphere
Source: NASA
Source: NASA

Source: National Business Aviation Association

Aftern 1975, it is all about Global Climate Models
• 1956 – first GCM (Phillips)• 1975 – model of 2xCO2 predicts several
degree warming (Manabe)• 1981 – models show sulfate aerosols =
cooling (Hansen)• 1991-1995 – model predicts cooling via
Pinnatubo. Verified in 1995. (Hansen)• 1998 – models can recreate ice-age
climates

1988
The community acceptance that that human-induced global warming is likely accurate,
results in the formation of a group - the IPCC (or Intergovernmental Panel on
Climate Change) - that meets every 5 years to discuss the state of the Earth’s climate.

IPCC
-Consists of more than 2500 scientific and technical experts from more than 60 countries all over the world.
-The scientists are from widely divergent research fields including climatology, ecology, economics, medicine, and oceanography.
-The IPCC is the largest peer-reviewed scientific cooperation project in history.
-It has issued 4 reports:1992, 1996, 2001, and 2007.

Images from IPCC report
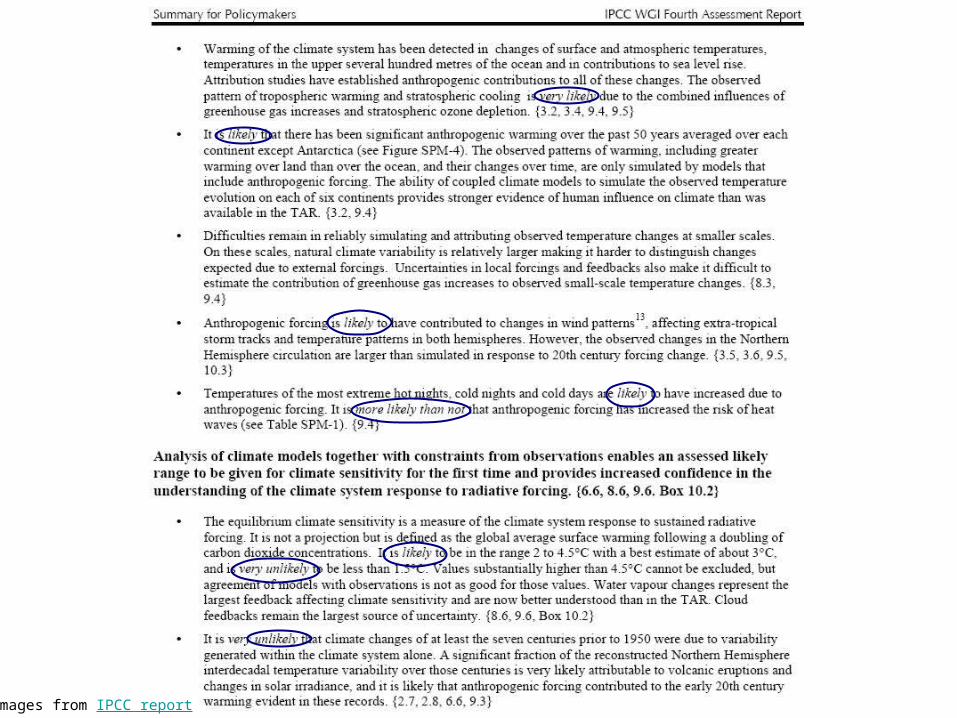
Images from IPCC report

IPCC
1992: Still trying to sort out effects of natural variation and human impacts
1996: “The balance of evidence suggests a discernible human influence on global climate”
2001: Humans are “likely” to cause global warming2007: Humans are “very likely” to cause global warming.
Two notes: 1) In scientific talk, it does not get much more certain than “very likely”; and 2) The IPCC is inherently conservative and often supports minimum possible climate change (rather than maximum possible change).

Why the change?
• More research
• Better Global Climate models
• More available data: 1998 is globally the warmest year on record, followed by 2002, 2003, 2001 and 1997. The 10 warmest years on record have all occurred since 1990.

Images from IPCC report

Radiative Forcing
To compare different variables, you need a common unit (to compare apples with apples, as
the saying goes).
Radiative forcing is the difference between the incoming radiation energy and the outgoing radiation energy in a given climate system.
A positive forcing (more incoming energy) tends to warm the system, while a negative
forcing (more outgoing energy) tends to cool it.36

37
Credit: Steve Ackerman and Tom Whittaker

A Watt (as in James)
A unit of power = Work / time(Your standard household bulb uses 60 Watts)
Because we care about the Earth’s surface, we use Watts/meters2
I like steam engines. A lot.
38
Image from Thinkquest

So, what causes radiative forcing?
Solar input - relatively constant, but can be slightly higher or lower than usual

Sunspots
Chinese records of sunspots go back to Book of Changes (800 B.C.E.): "A dou is seen in the Sun" and "A mei is seen in the Sun". ”Dou" and "mei" are taken to mean darkening or obscuration.
Author: Hans Bernhard
Image from nasa.gov
So, what causes radiative forcing?
Solar input - relatively constant, but can be slightly higher or lower than usual
CO2 (& other greenhouse gases) - increases radiative forcing
Aerosols - decreases radiative forcing

Year AD
1800 1850 1900 1950 2000
W/m
2
-1.0
-0.5
0.0
0.5
1.0
1.5
2.0
2.5
CO2
Temperature
Solar
Aerosols

Components of a fully coupled general circulation model
GCMs contain our best current understanding for how the physical processes interact (for instance, how evaporation depends on the wind and surface temperature, or how clouds depend on the humidity and vertical motion) while conserving basic quantities like energy, mass and momentum. These estimates are based on physical theories and empirical observations made around the world.
Removed image due to copywright. It can be found at the Australian Department of Meteorology.

Development of climate models over time
IPCC, adopted by Australian Department of Climate Change and Energy Efficiancy

Models
We cannot predict how one variable will inherently influence another. Therefore, we have to make models. Models lead to “emergent” properties, which is large scale behavior that is not a priori predictable from the small scale interactions that make up the system.
Models are inherently theoretical. As such, they are often very quantitative.

Models (con’t)All models are wrong; some models are useful.
-G.E. Box (UW Professor)
These models are all simplifications of the actual phenomena. But these models can still be valuable.
The problem with models (or any theoretical approach) lie in the assumptions.
Image removed due to copyright; available at Data Analysis Australia

IPCC: Critical aspects
Validation - assessment of the accuracy of the model
Attribution - the ability to assign causes to effects (distinguish causation from
correlation)
Prediction - specification, in advance, of events or changes in a system

Validation
Validation reflects an assessment of the accuracy (not precision) of the model.
This is done by attempting to duplicate current climate data, or “backcasting” (as
opposed to forecasting) past climates when the Earth was very different (such as 18,000 years ago, during the maximum extent of the
ice age).

Image from IPCC
Science is the investigation of the natural world, based on
the rules of reason and logic. Science is testable and/or
predictable.
How do you test a model, particularly of a GCM (Global
Climate Model)?
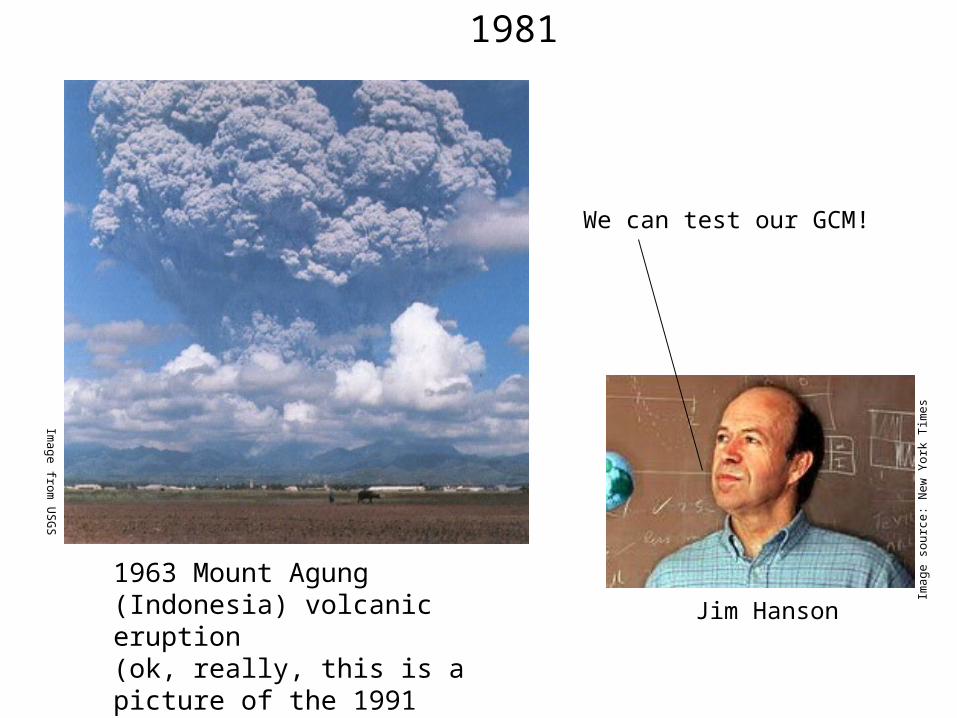
1963 Mount Agung (Indonesia) volcanic eruption(ok, really, this is a picture of the 1991 Mount Pinatubo eruption)
1981
Jim Hanson
We can test our GCM!
Ima
ge
from
US
GS
Ima
ge
sou
rce
: Ne
w Y
ork
Tim
es
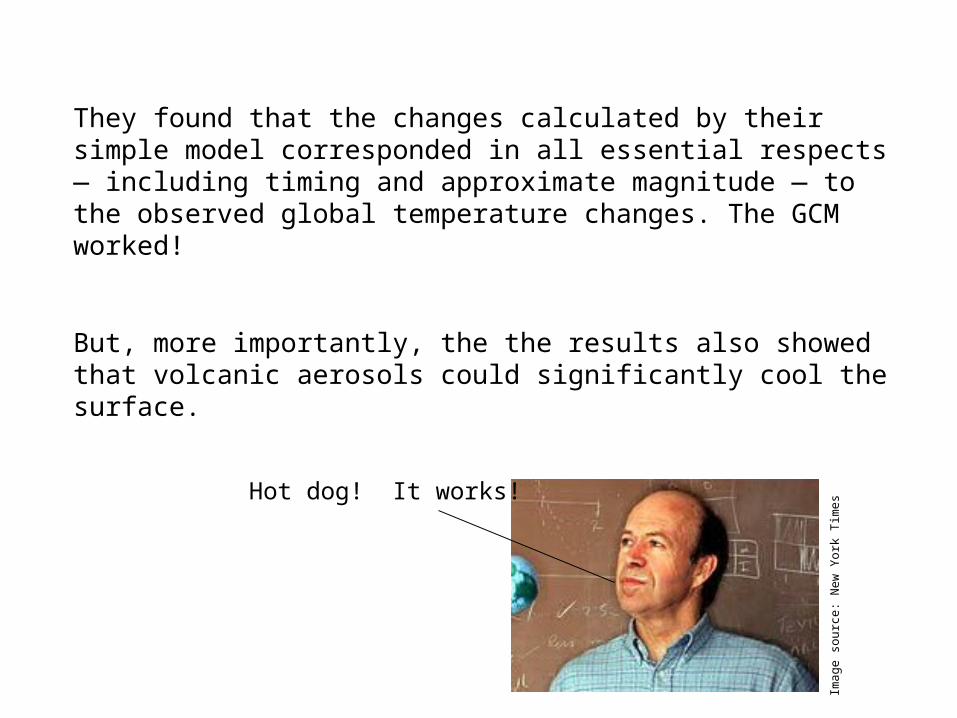
They found that the changes calculated by their simple model corresponded in all essential respects — including timing and approximate magnitude — to the observed global temperature changes. The GCM worked!
But, more importantly, the the results also showed that volcanic aerosols could significantly cool the surface.
Hot dog! It works!
Ima
ge
sou
rce
: Ne
w Y
ork
Tim
es

AttributionThe ability to assign causes to
effects.
This is a problem inherent in systems with multiple variables.
The simplest approach is “sensitivity analysis”, in which each variable is tested for its
possible effect. The IPCC report is all about attribution.

Is CO2 the only greenhouse gas that is important?

It turns out (unfortunately), no.
1) Methane (CH4) - From rice paddies and cows.2) N2O - from agriculture, including fertilizer3) Ozone (O3) - not anthropogenicand…4) CFCs (Chloroflorocarbons) - From refrigeration
and spray (and fire retardant)
The big problem is that these gases could be much more potent than CO2. But, an even bigger problem was,……

Image from NOAA
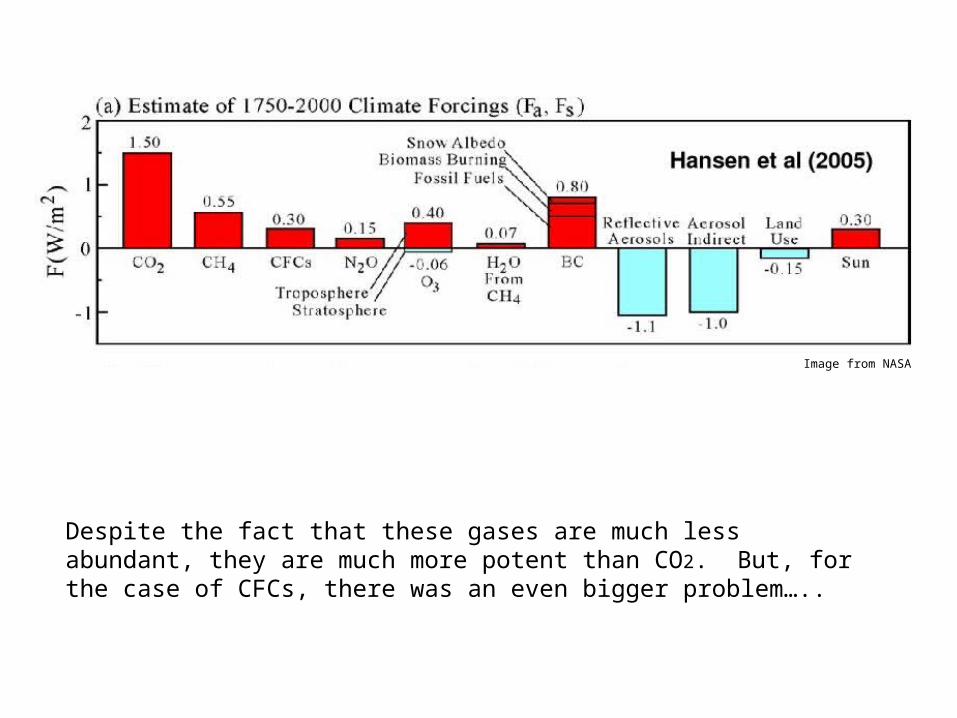
Despite the fact that these gases are much less abundant, they are much more potent than CO2. But, for the case of CFCs, there was an even bigger problem…..
Image from NASA

The Ozone hole
In addition to being greenhouse gases, CFCs destroy ozone (O3). Consequently, they cause an ozone hole over the South Pole.
Note that the ozone hole has no effect on global warming (except that the presence of CFCs both destroys the ozone AND causes global warming).
Source: NASA
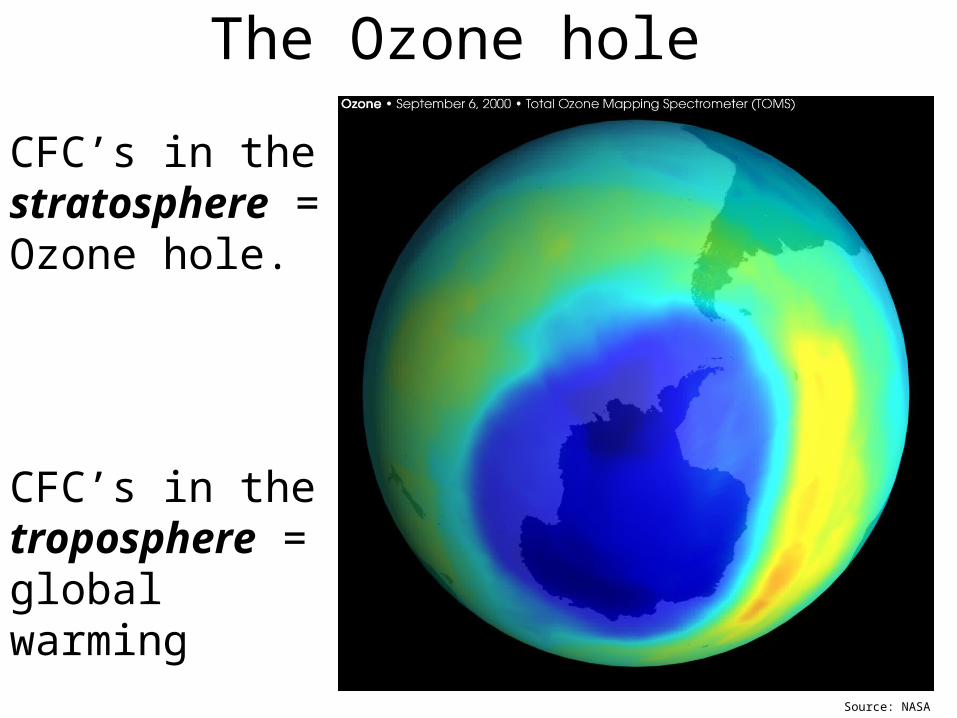
The Ozone hole
CFC’s in the stratosphere = Ozone hole.
CFC’s in the troposphere = global warming
Source: NASA

The Ozone hole
This ozone debate plays out like this:
1. Scientists report that CFCs are causing problems with ozone layer.
2. Industry denies that this is a problem.
3. Scientists confirm this problem.
4. Industry maintains that it is too expensive to switch to other propellants in spray bottles.
5. Under international pressure, CFCs are outlawed* in the 1997 Montreal accords.
6. Industry finds new propellants (there is no major loss in the spray industry and some indications that there is some economic gain by switching away from CFCs).
*CFCs are still being produced in some third world countries.
Source: NASA

IPCC

Prediction
Specification, in advance, of events or changes in a system.
Again, the IPCC includes many predictions, based on the outcomes of the GCMs.

IPCC & GCMs
The IPCC reports are based on the composite
results of a variety of different GCMs.
It is important to realize that the GCMs just act to quantifiy (“put numbers on”) the effects that are
already occurring.
National Center for Atmospheric Research laboratory in Boulder, Colorado
Source: Wikipedia
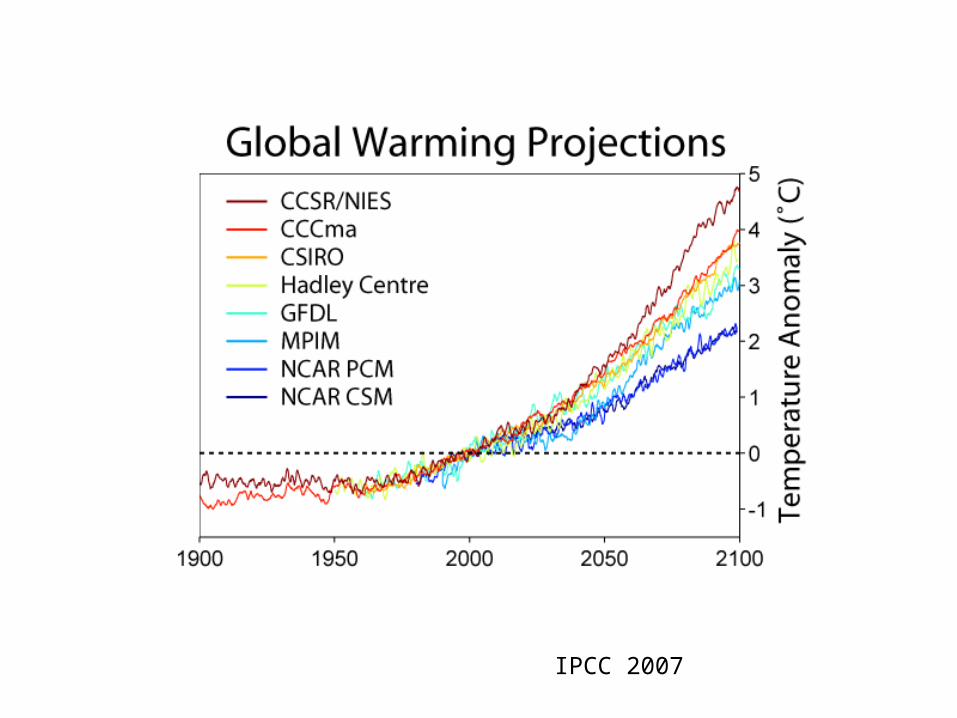
IPCC 2007

Image from NASA
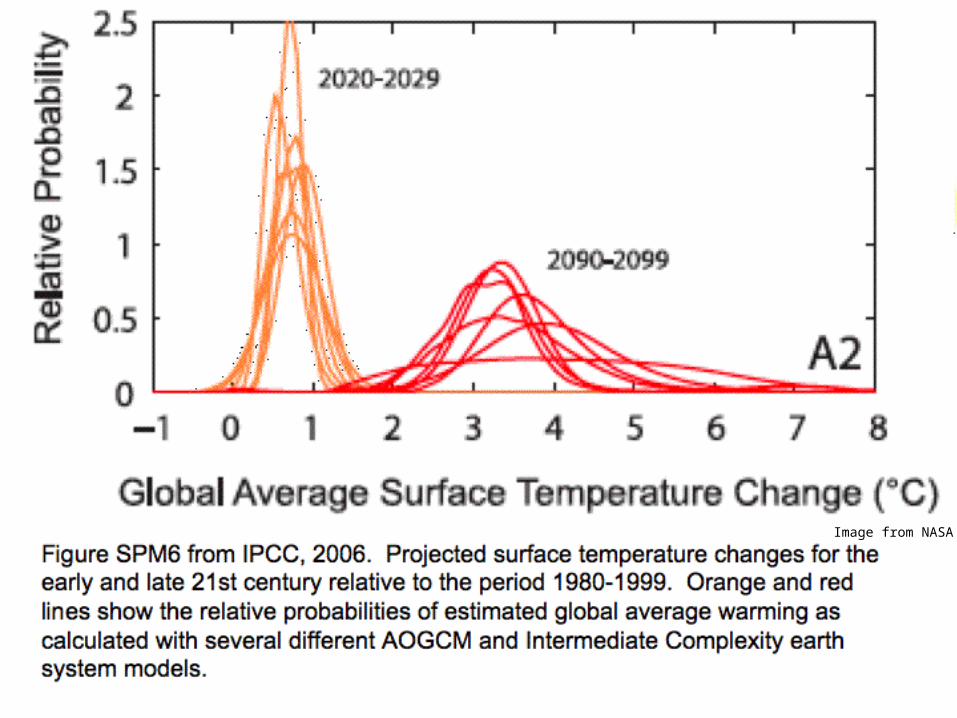
Image from NASA

Image by Robert A. Rohde for Global Warming Art
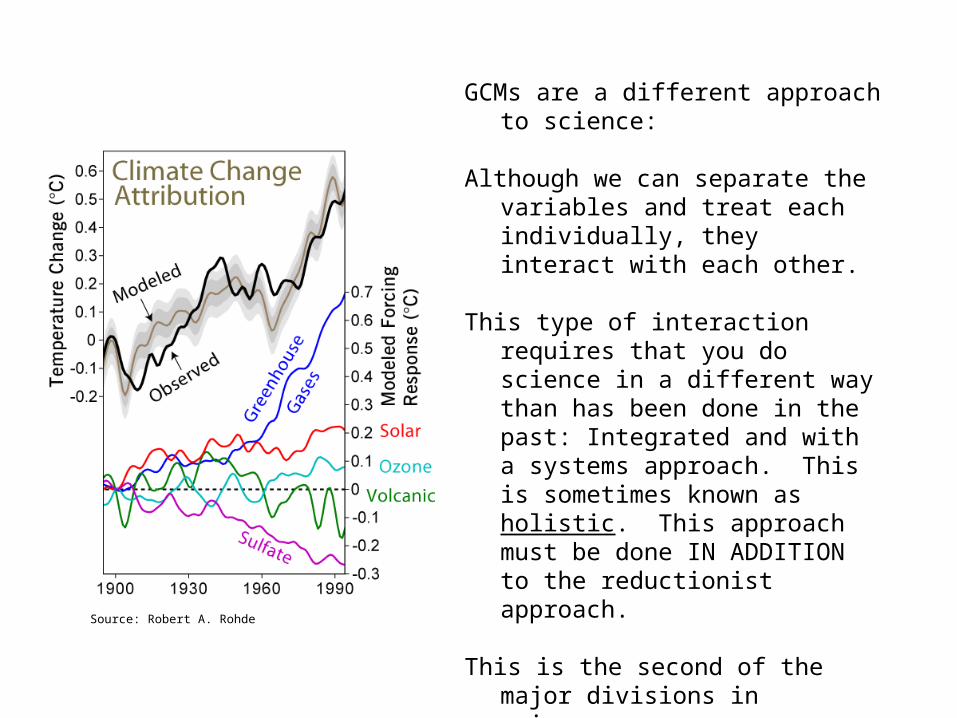
GCMs are a different approach to science:
Although we can separate the variables and treat each individually, they interact with each other.
This type of interaction requires that you do science in a different way than has been done in the past: Integrated and with a systems approach. This is sometimes known as holistic. This approach must be done IN ADDITION to the reductionist approach.
This is the second of the major divisions in science:
1) Empirical-theoretical2) Reductionistic-holistic
Source: Robert A. Rohde

Holistic scienceAn analogy
The doctor can help a patient who has cancer. But, this solves a symptom, not the cause. Society is usually willing to solve a symptom.
But, if you want to really solve the problem, you have to study the system. This requires a systematic approach, looking at environmental, genetic predisposition, and individual facts (the field of epidemiology) as well as basic understanding of cell processes (molecular biology).
The medical community has been extremely successful at getting both funded. This is less true for the scientific community.
(Image of doctor and patient)
(Image of scientists studying a town)

Holistic science & Science of the future
Problem based
Interdisciplinary
Problems of society, not problems of science (such as, How do we maintain a habitable Earth?)
Emphasis on predictive power of science

Systems with multiple variables
1) Sensitivities
2) Positive feedbacks
3) Negative feedbacks
4) Thresholds (“Tipping points”)
5) Complexity (non-linear feedbacks)

Thresholds
Side view Back view
Source: Wikimedia Commons, Bart de Goeij Source: Wikimedia Commons, Gertjan R.
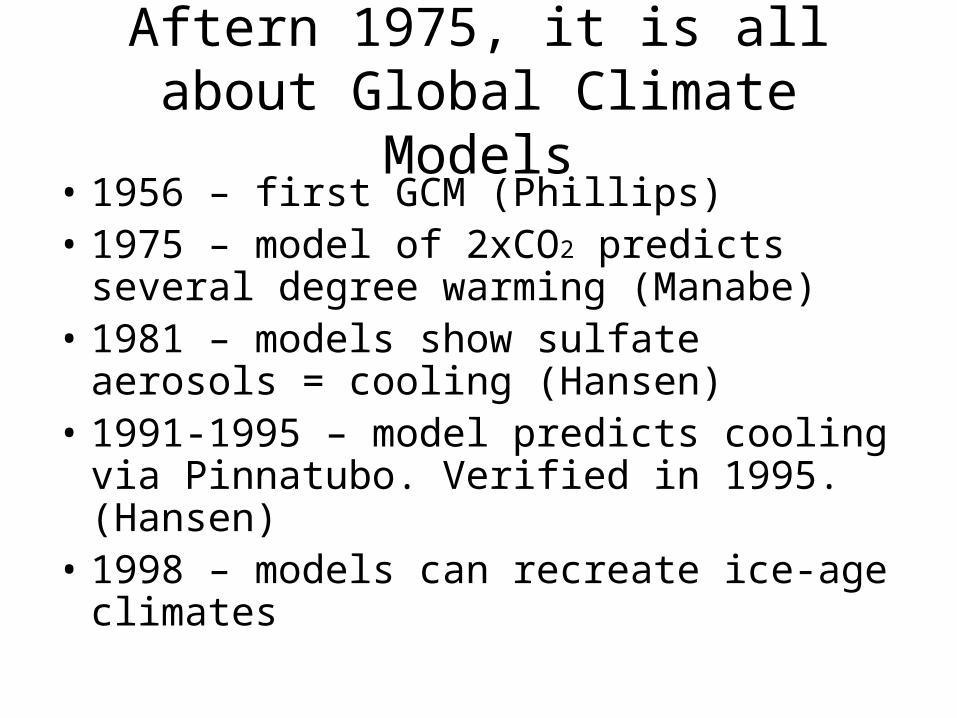
Aftern 1975, it is all about Global Climate Models
• 1956 – first GCM (Phillips)• 1975 – model of 2xCO2 predicts several
degree warming (Manabe)• 1981 – models show sulfate aerosols =
cooling (Hansen)• 1991-1995 – model predicts cooling via
Pinnatubo. Verified in 1995. (Hansen)• 1998 – models can recreate ice-age
climates