1932-17 Winter College on Micro and Nano Photonics for...
49
1932-17 Winter College on Micro and Nano Photonics for Life Sciences Martina Havenith 11 - 22 February 2008 Ruhr University Bochum Bochum, Germany Scanning IR-nearfield optical microscopy (SNIM)
Transcript of 1932-17 Winter College on Micro and Nano Photonics for...

1932-17
Winter College on Micro and Nano Photonics for Life Sciences
Martina Havenith
11 - 22 February 2008
Ruhr University BochumBochum, Germany
Scanning IR-nearfield optical microscopy (SNIM)

IR-nearfield microscopyM. Havenith
Physical Chemistry, Ruhr-Universität Bochum, GermanyMünster, 17.12.07
www.rub.de/pc2

wav
elen
gth
ener
gy
OpticalOptical
FIRFIR
THzTHz
MIRMIR
Taking a closer look on surfaces and interfaces: Spectral Fingerprints
Determination of structure
Skeleton motionsBreathing modesLarge amplitude vibrations
Intermolecular modesPhonons

Biology: a “physicist” view
Cytosol: High concentration of Protein (1650 cm-1 Amid I band)
Membrane: Strong absorption of lipids at 2920 cm-1
Nucleus with DNA in high concentration: Strong absorption at 1240 cm-1
Water: percentage of water 60-98%: high absorption coefficient in the IR and NIR
DNACytosol
Lipids

Absorption
wavenumber [cm-1]
Fingerprint region of infrared vibration bands
A cheap chemical microscope

Measurement of intracellular water
• Intracellular water concentration is important for cell function
• Hormone, Oxidative stress, miniomla dosis of pharmaceuticals can alter the intracellular water concentration
• Change of osmotic pressure causes cell swelling or cell shrinkage
• Intracellular water concentration influences protein syntheses, cell proliferation, cell death (apotheosis)
• Dream of medicine: control of intracellular water concentration

Insulin + cAMPcAMP/HypoosmolarityGlucagon/HypoosmolarityGlucagon/InsulinHyperosmolarity/InsulincAMP + VasopressinHypoosmolarityGlutamineGlycineAlanineGlutamine + GlycineInsulinInsulin/BumetanideEthanolAcetaldehydeEthanol/BumetanideEthanol/MethylpyrazolTaurocholateGlycerolIGF1BaCl2Glucagon + HypoosmolarityGlucagon + Insulin
Liver Cell Hydration and ProteolysisStudy of Prof. Häussinger (medicine)
% change of cell water
% inhibition of proteolysis
Influence of minimum dosages of pharmaceuticals on single cell

A non-invasive method to quantify water in living cells
• Water: most abundant substance in organisms
• Chemical reactions of all organism take place in aqueous solution
• Transport of solutes• Temperature regulation• NIR overtone transition
(∆v=2), weaker than ∆v=1Absorption, but still penetrating

Experimental Results:
reference: absorption by HBSS
absorption by intra-cellularwater + HBSS
Swelling: volume increases by a factor of 3Intracellular water concentration: first increase (dilution), followed by a decreaseExplanation: Onset of protein synthesis yields a decreasein relative water concentration
I(ν) = I0 exp(-α(ν)l)
E. Bründermann, E. Bründermann, A. Bergner, F. Petrat, R. Schiwon, G. Wollny,I. Kopf, H. de Groot, M. Havenith, Analyst, 129, 893 (2004)

Future potential for medical applications:Monitoring the influence of pharmaceuticals on a single cell
level in real time
Future improvements:
Tomography
Tracking drugs in single cells„A non-invasive methodTo quantify water in livingcells is being pioneerd in Germany“
by the Royal Society, November 2004

Spectralfingerprints
Confocal Raman microscopyof human skin (WITEC)

measurementof hydrationin human skin
hydrationin dependenceof depth

„Chemical Microscopy“ in the IR-and THz :advantage: Marker free
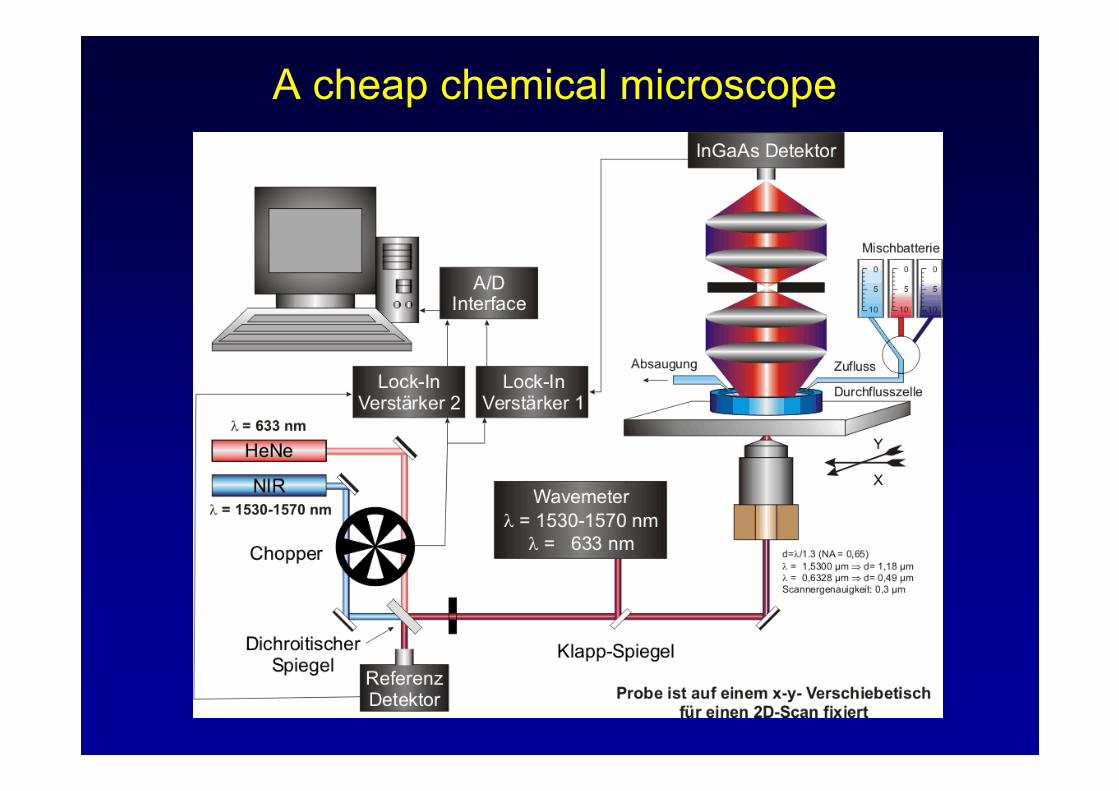
disadvantage: diffraction limited
Abbe Limit: lateral resolution > λ/2
Abs
orba
nce
1800 1500wavenumber cm-1
Senterra Raman microscope

Atomic force field microscopy (AFM)measurement of topography
nm lateral resolution
1986:G. Binning, C. Quate,Ch. Gerber
Infrared Near field microscopyChemical imaging beyond the wave length limit
Far fieldPlane wave

Infrared Near field microscopyChemical imaging beyond the wave length limit
Near field

Infrared Near field microscopyChemical imaging beyond the wave length limit
Nano antennaNano aperature

evanescent field withexponential decay
cut-offpointλ/2
e.g. glass fiber coatedwith metal
z max. 0.1·d
angle : 10 - 20°d : 100 - 50 nm
10 -3 - 10 -6transmissionVIS
IR d : 100 nm 10 -25
transmission
Near field microscopyMicroscopy beyond the wave length limit
Aperture d
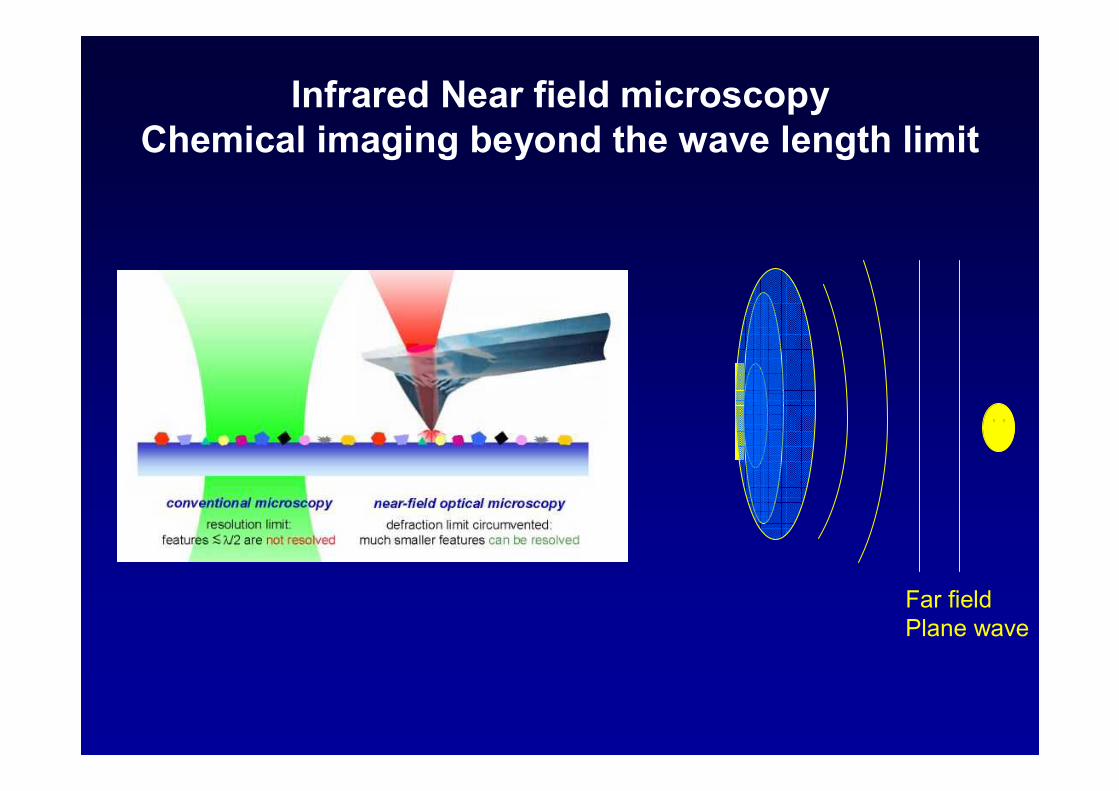
Pump laser: Master Oscillator Power Amplifier: output power: 20 W at 1064 nm Periodically Poled Lithium Niobate (quasiphase matched) 19 poling areasend caps are tilted to prevent back reflection; tripe band antireflection coatingcw IR radiation 2.9 Wresonant for signal wavelength (1485-1.665 nm) ; idler (3000-4000 nm)Faraday isolator; three lens system for proper phase matching
High power IR-radiationIR-cw Opto Parametric Oscillator (2.9 W)
35 db
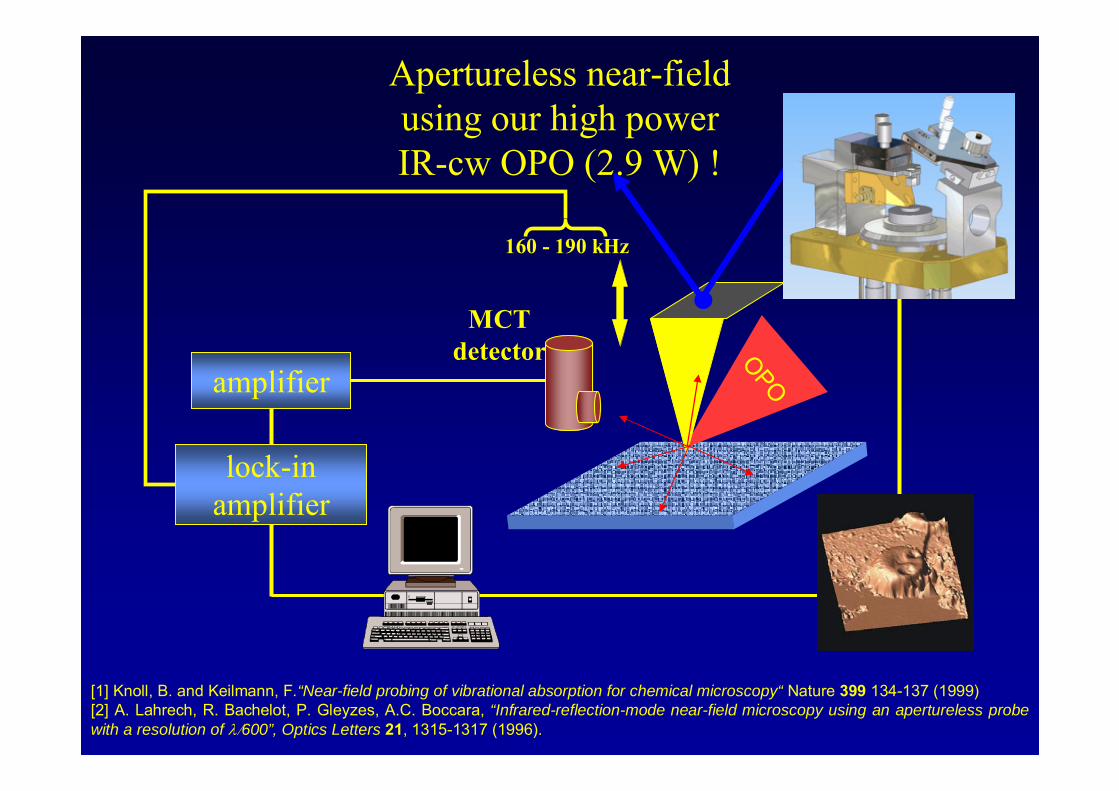
Apertureless near-fieldusing our high powerIR-cw OPO (2.9 W) !
[1] Knoll, B. and Keilmann, F.“Near-field probing of vibrational absorption for chemical microscopy“ Nature 399 134-137 (1999)[2] A. Lahrech, R. Bachelot, P. Gleyzes, A.C. Boccara, “Infrared-reflection-mode near-field microscopy using an apertureless probe with a resolution of λ/600”, Optics Letters 21, 1315-1317 (1996).
OPO
160 - 190 kHz
MCTdetector
lock-inamplifier
AFM
amplifier

pp
ps
εprobe
probe dipole (∅ = a)
sample dipole
r = distance
OPO( )( )pincss
sincpp
EEp
EEp
+=
+=
α
α
p-polarization
62
3
14
1
1
r
rsp
spsp
eff
⋅−
⋅++=
πααπαα
ααα
62
3
116
1
1
r
rsp
spsp
eff
⋅−
⋅−+=
πααπαα
ααα
dipole
• r >> a, sum of the polarizabilities
• otherwise, dipole-dipole interaction
• p-polarization : increase
• s-polarization : decrease
• σscatt ∝ k4 αeff׀ 2׀ • absorption ∝ Im (αeff)
of α ∝ Esca
s-polarization
A chemical nanoscope: contrast mechanism
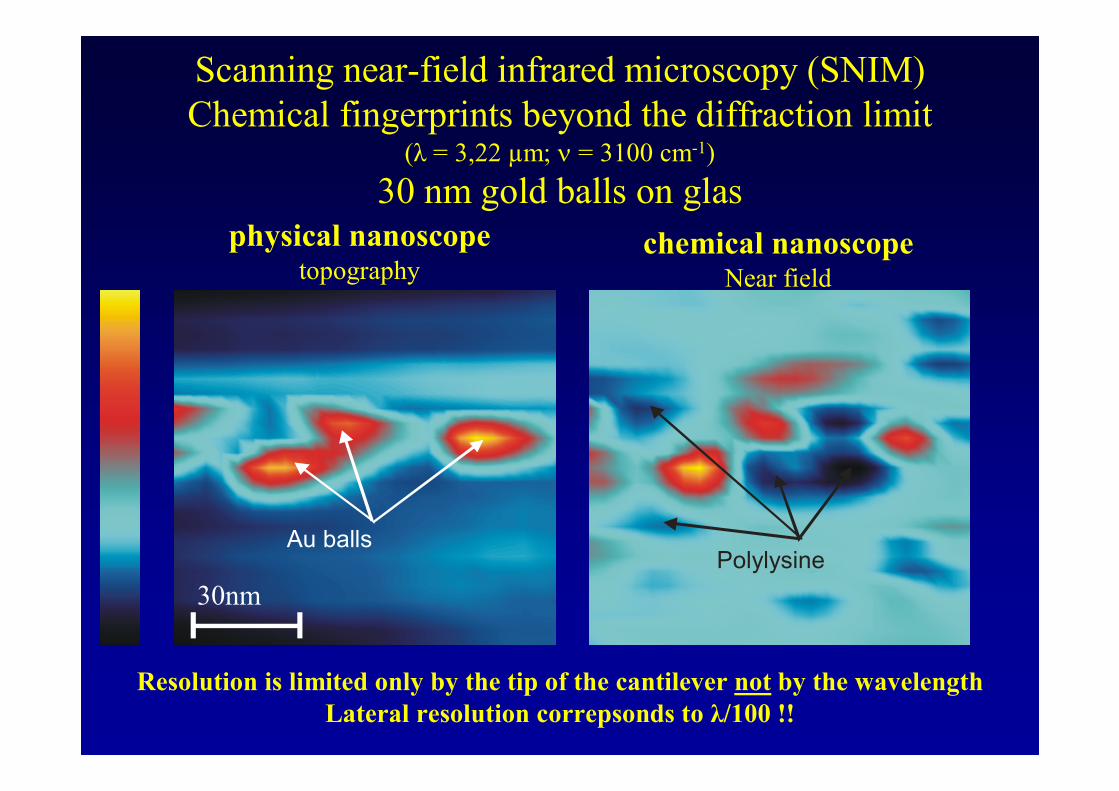
Scanning near-field infrared microscopy (SNIM)Chemical fingerprints beyond the diffraction limit
(λ = 3,22 µm; ν = 3100 cm-1)30 nm gold balls on glas
chemical nanoscopeNear field
physical nanoscopetopography
PolylysineAu balls
30nm
Resolution is limited only by the tip of the cantilever not by the wavelengthLateral resolution correpsonds to λ/100 !!
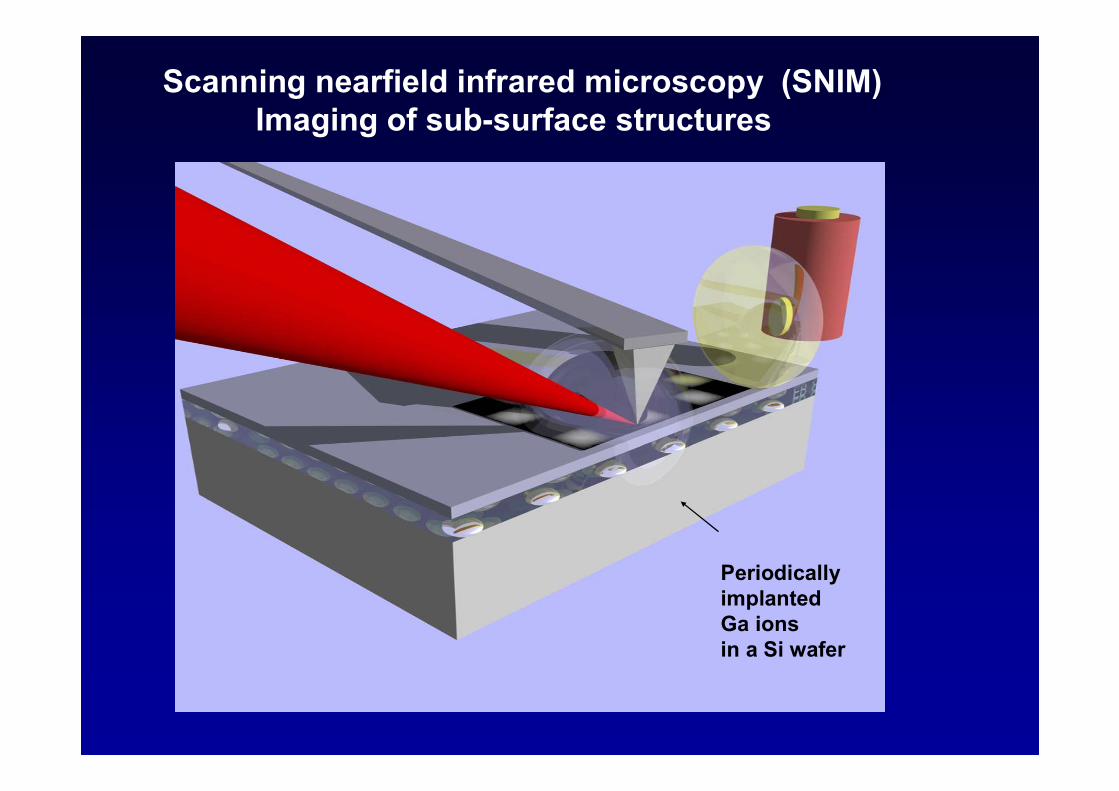
Scanning nearfield infrared microscopy (SNIM)Imaging of sub-surface structures
PeriodicallyimplantedGa ionsin a Si wafer

5 µm
1 µm 1 µm
5 µma) b)
c) d)
2004e) f)
AFM SNIM
Ga:SiN(Ga)=4,4.1019cm3
λ=3,22 µm
Measurement of implanted Ga-ionsin a Si wafer
Imaging with a „chemical nanoscope“Observation of subsurface structures(Phys. Chem. Chem. Phys. 8, 753 - 758 (2006))

Chemical imaging of monolayers
S S
CH3CH3
S S
CH3CH3
S SS S
biotin
biotin
biotin
biotin
S SS SS S
CH3CH
S S
CH3CH33 biotin
biot
in
biotin
biot
in
AuTiSi
Electron microscope image of stamp and structured surface
PDMS stamp
biotinylated alkylthiol (BAT)
1-octadecanthiol (ODT)
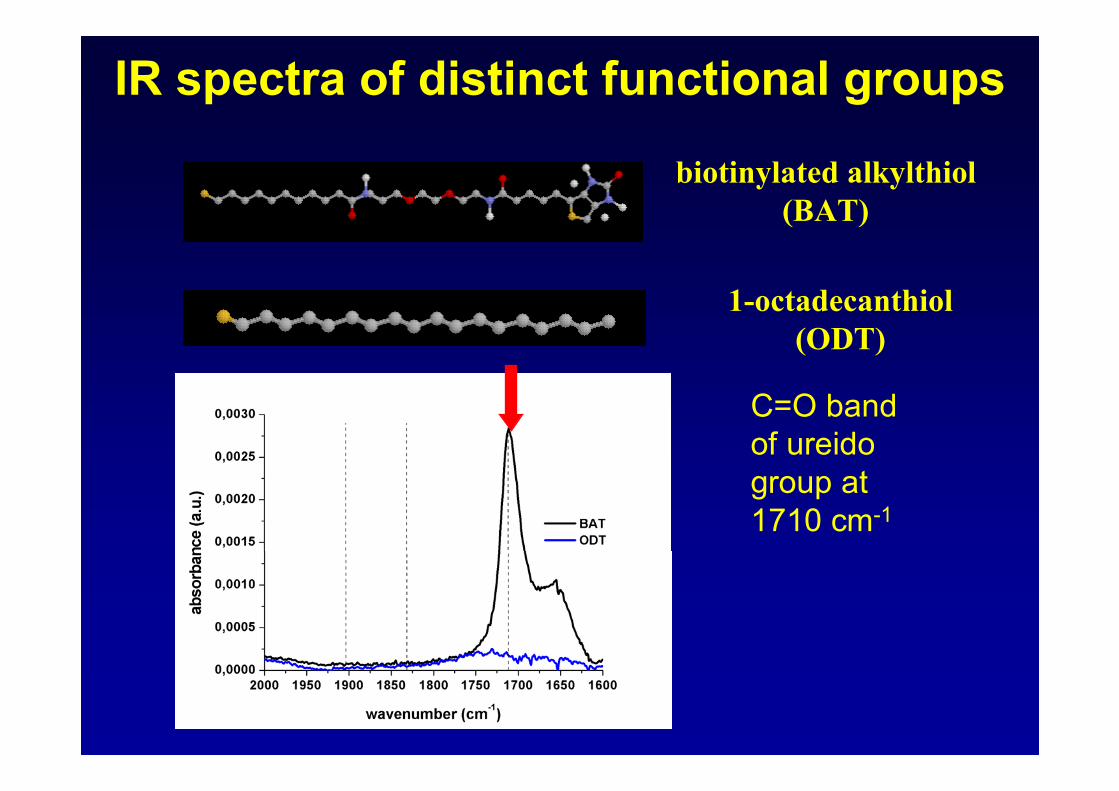
biotinylated alkylthiol(BAT)
1-octadecanthiol(ODT)
IR spectra of distinct functional groups
C=O bandof ureidogroup at1710 cm-1
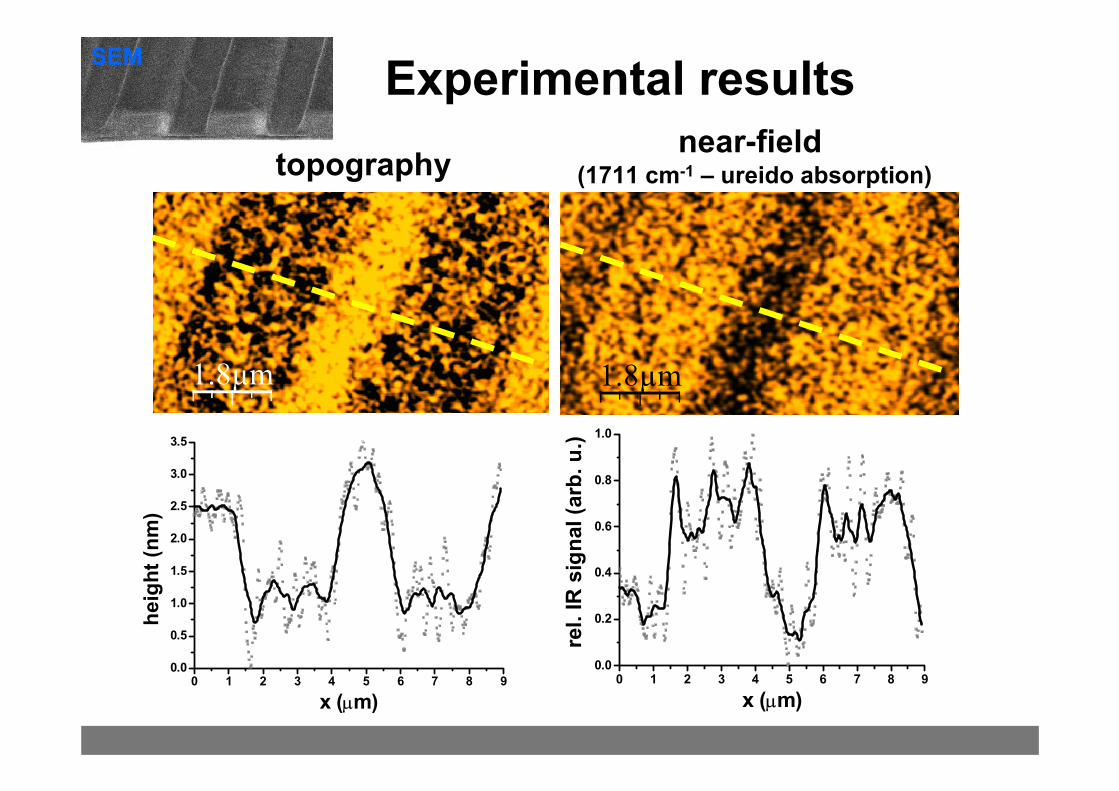
1.8µm 1.8µm
Experimental results
0 1 2 3 4 5 6 7 8 90.0
0.5
1.0
1.5
2.0
2.5
3.0
3.5
heig
ht (n
m)
x (µm)
topographynear-field
(1711 cm-1 – ureido absorption)
SEM
0 1 2 3 4 5 6 7 8 90.0
0.2
0.4
0.6
0.8
1.0
rel.
IR s
igna
l (ar
b. u
.)
x (µm)

A „chemical nanoscope“Fingerprint spectra with nm lateral resolution
(Kopf, Samson, Wollny, Grunwald,Bründermann and Havenith,
J. Phys. Chem. C 111, 8166-8171 (2007)
Detection limit: 5 10-20 mol/90 mm2
27 attogramm
Contrast mechanism:Dipole- mirror dipole coupling:αmirror = β αtip ; Β = (εprobe-1) / (εprobe +1)
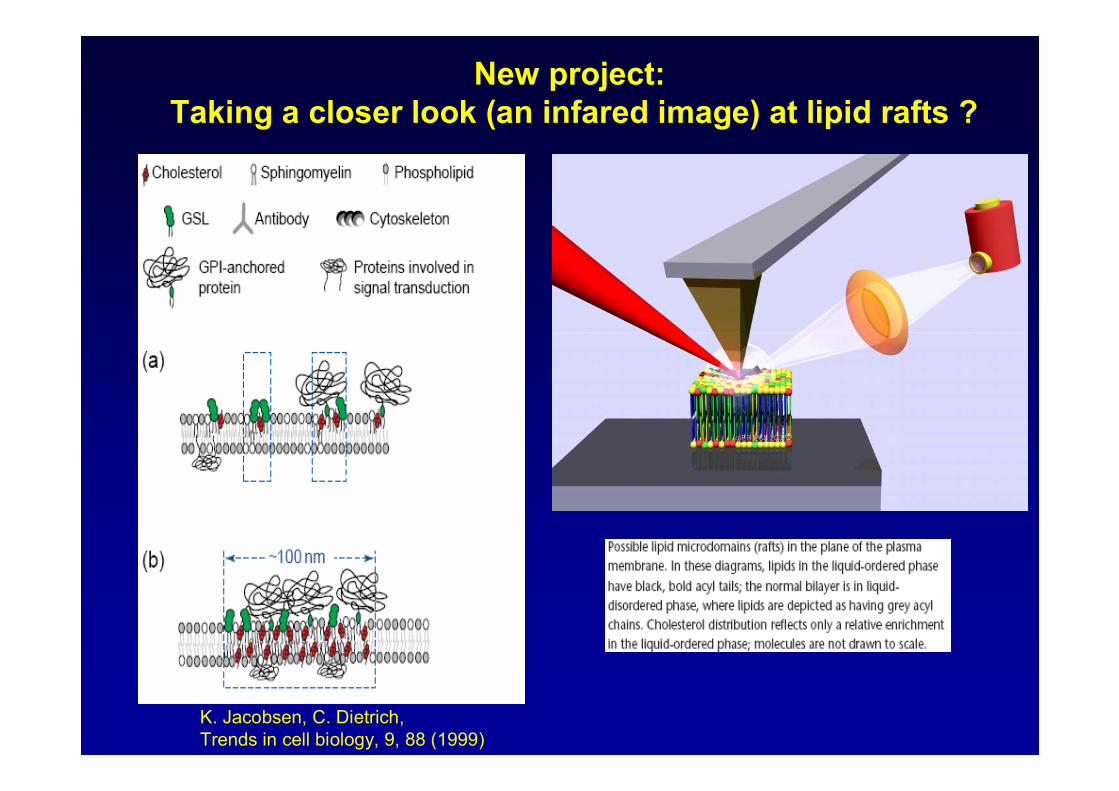
K. Jacobsen, C. Dietrich,Trends in cell biology, 9, 88 (1999)
New project: Taking a closer look (an infared image) at lipid rafts ?
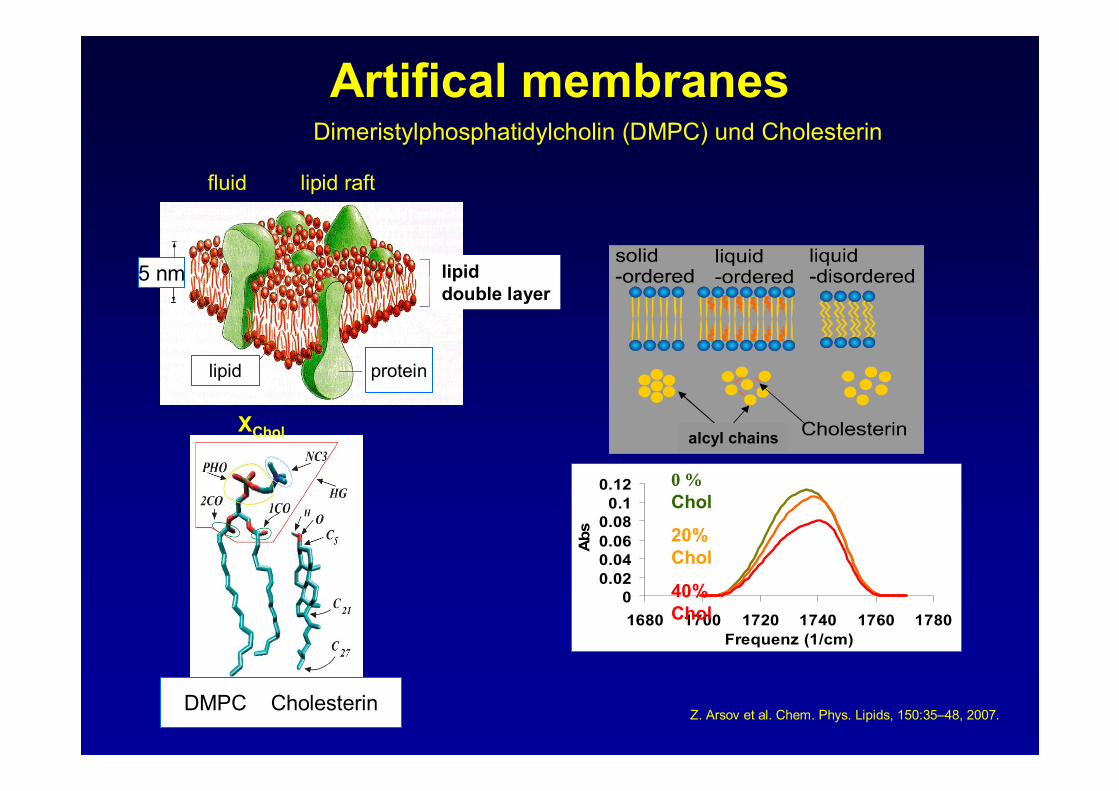
Artifical membranes
00.020.040.060.08
0.10.12
1680 1700 1720 1740 1760 1780Frequenz (1/cm)
Abs
0% Chol
20% Chol
40% Chol
Dimeristylphosphatidylcholin (DMPC) und Cholesterin
DMPC CholesterinZ. Arsov et al. Chem. Phys. Lipids, 150:35–48, 2007.
XChol
proteinlipid
fluid lipid raft
5 nm lipiddouble layer
alcyl chains

Experimental set-up
CantileverLinse
MCT-Detektor
Piezo-ScannerProbe
Diodenlaser4-QuadrantenDetektor
11kV
CO
-laser
4 squaredetector
lense

FTIR Spektren: DMPC
κε in +=
Frequenz [cm ]-1
Abs
orpt
ion
1000 1500 2000 2500 3000 3500 40000,0
0,2
0,4
0,6
0,8 FTIR
ATR-FTIR
κ n
effαπα
ασ6
)Im(24
eff
eff
kk +=
abs. scattering
absorption refraction
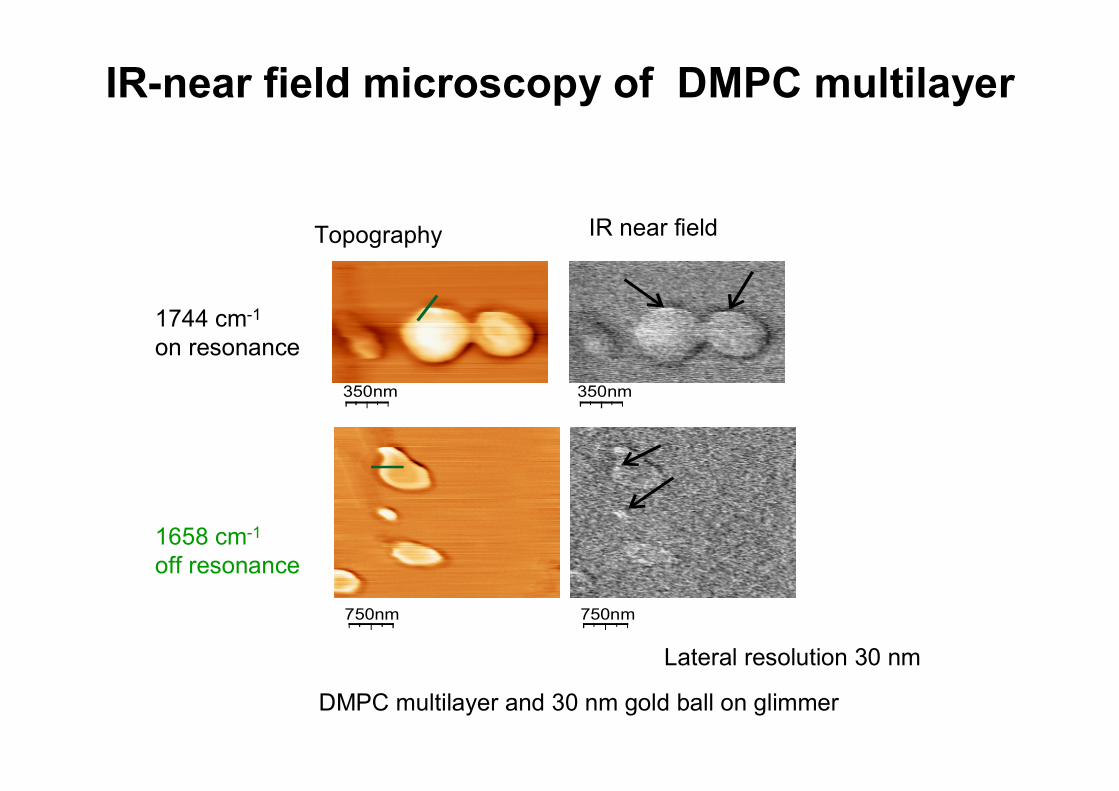
IR-near field microscopy of DMPC multilayer
Topography
1744 cm-1
on resonance
DMPC multilayer and 30 nm gold ball on glimmer
1658 cm-1
off resonance
350nm
6004002000
403020100
-10-20-30
DMPC
Gold
2001000
40200
-20
DMPC
Gold
X [nm]
X [nm]
Nah
feld
sign
al [m
V]N
ahfe
ldsi
gnal
[mV]
750nm750nm
350nm
Lateral resolution 30 nm
IR near field

IR near field: Lipid double layerG. Wollny, E. Bründermann et al.
1500 1600 1700 1800 1900 20000,000,010,020,030,040,050,06
Abs
orpt
ion
Frequenz [cm-1]
FTIR-Spektrum von DMPC
DMPC
IR near field images
1.0µm
300nm
0,80,40
8
4
0
X[µm]
Z [n
m]

near field-contrast: DMPC on silicon
1650 1700 1750 1800 1850 1900 1950
0,5
0,0
0,5
1-I
/ILi
pid
Si
Frequenz [cm ]-1
Experimental result
Si
DMPC
IIC −=1
contrast
1650 1700 1750 1800 1850 1900 1950
() L
ipid
σN
Frequenz [cm ]-1
9
10
11
12
predictedscattering cross section
πα
ασ6
)Im(24
eff
eff
kk +=
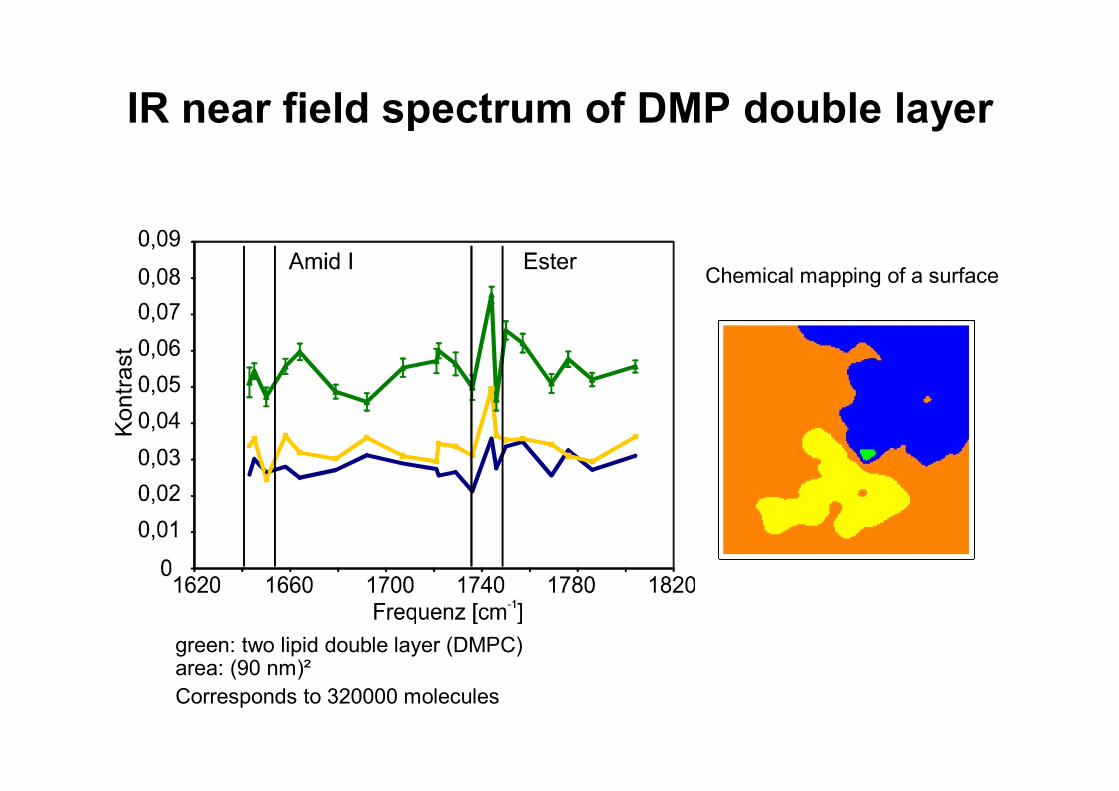
Chemical mapping of a surface
green: two lipid double layer (DMPC) area: (90 nm)²Corresponds to 320000 molecules
IR near field spectrum of DMP double layer

K. Jacobsen, C. Dietrich,Trends in cell biology, 9, 88 (1999)
Taking a closer look (an infared image) of proteins in membranes

Topograpy31 31 dots
1658 cm-1 1740 cm-1 1804 cm-1
512 512 dots
15 m
15 m
Near field-signals recorded with a tapping-mode-frequency of 172,8 kHz
The bright spot has an extension of ca. 300-400 nm and a height of ca. 50 nm
3.0µm
190nm
190nm
190nm 190nm
Each dot correspondsto ca. 30 nm
Imaging proteins inartificial membranes
Cooperation withHeberle group

0 100 200 300 400 500 600
0.6
0.7
0.8
0.9
1.0
nm
brig
htne
ssHa.u.L
Grundfrequenz 172.8 kHz
Topography
Protein absorption (1658 cm-1)
Lipid absorption (1740 cm-1)
Off resonance 1804 cm-1
DMPC Cytochrome C Oxidase
Ni-NTA
First experimental resultsF. Ballout, I. Kopf, et al

IR mapping of a single tobacco virusBrehm, Taubner, Hillebrand, Keilmann
Nanoletter 6, 1308 (2006)
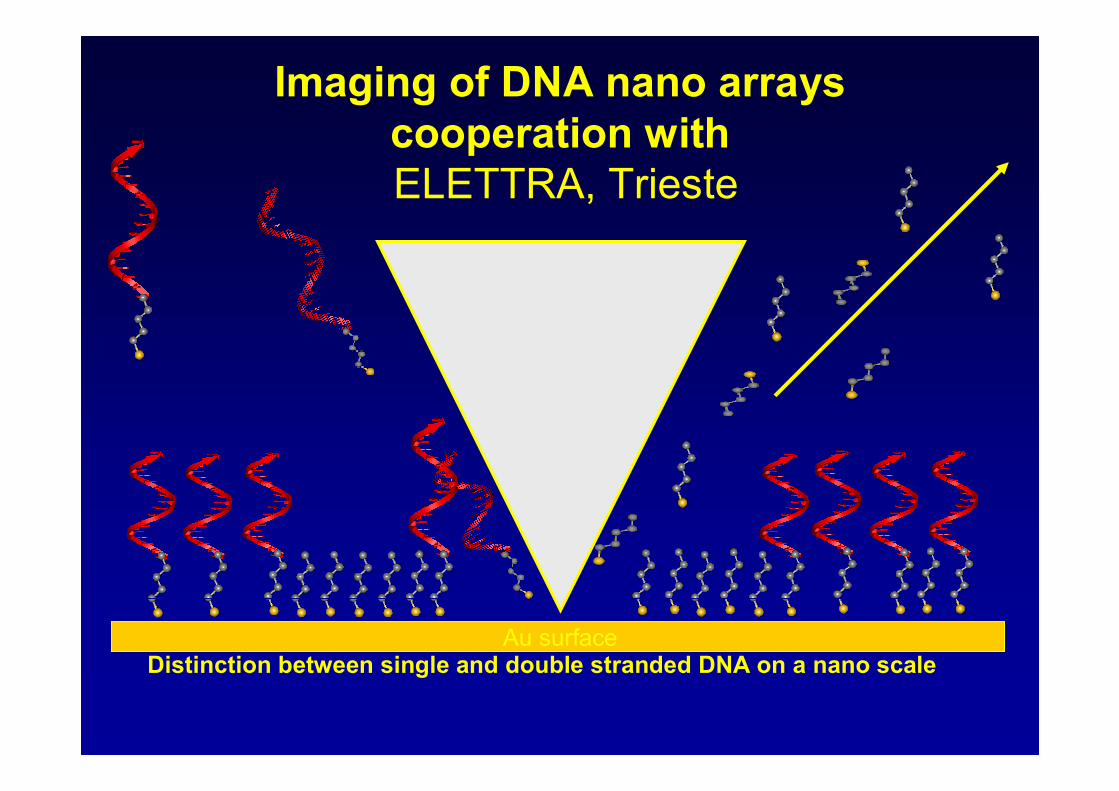
Imaging of DNA nano arrayscooperation withELETTRA, Trieste
Distinction between single and double stranded DNA on a nano scaleAu surface
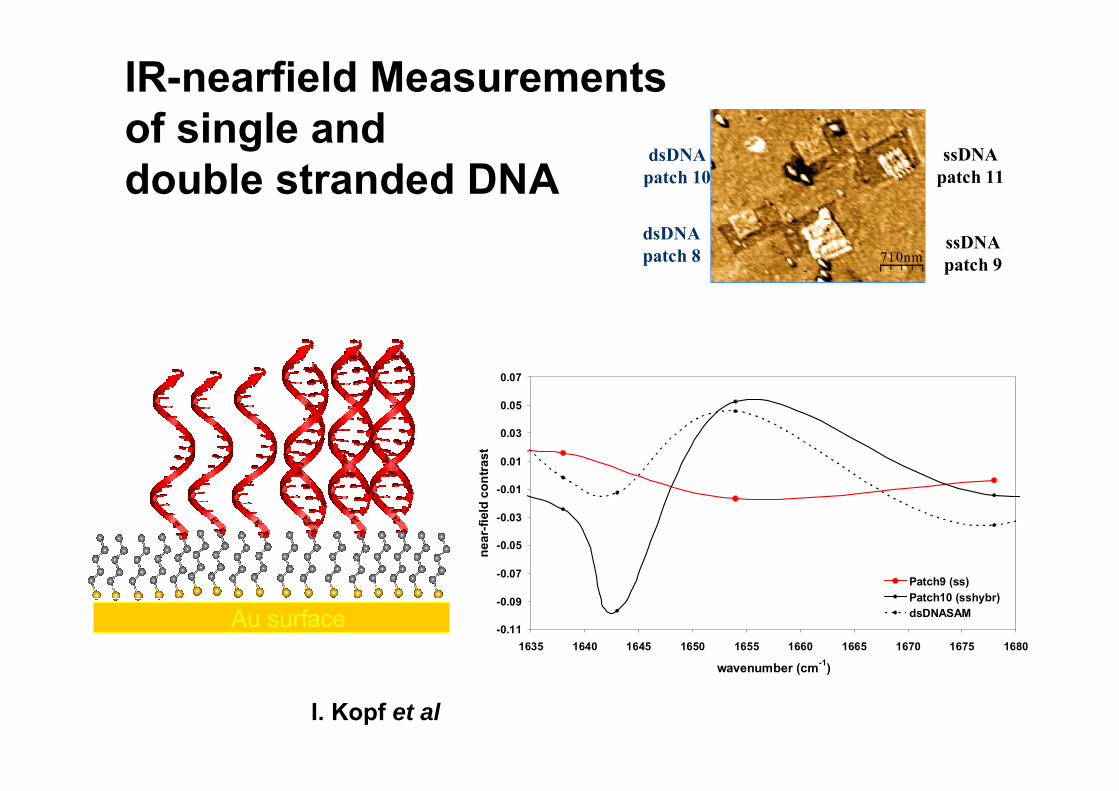
IR-nearfield Measurementsof single and double stranded DNA
-0.11
-0.09
-0.07
-0.05
-0.03
-0.01
0.01
0.03
0.05
0.07
1635 1640 1645 1650 1655 1660 1665 1670 1675 1680
wavenumber (cm-1)
near
-fiel
d co
ntra
st
Patch9 (ss)Patch10 (sshybr)dsDNASAM
710nm
dsDNApatch 10
ssDNApatch 9
ssDNApatch 11
dsDNApatch 8
Au surface
I. Kopf et al

Core:- Diamond-like stucture (DL) - Hard material- No water- 50-100 nm diameter
Shell:- Polymer-like structure (PL)- Soft material- Intersticial water- Diameter depends on growing time (450 nm)
50 nm
250 nm
Chemical mapping of nano particlesCooperation with plasma physics (J. Winter, RUB)
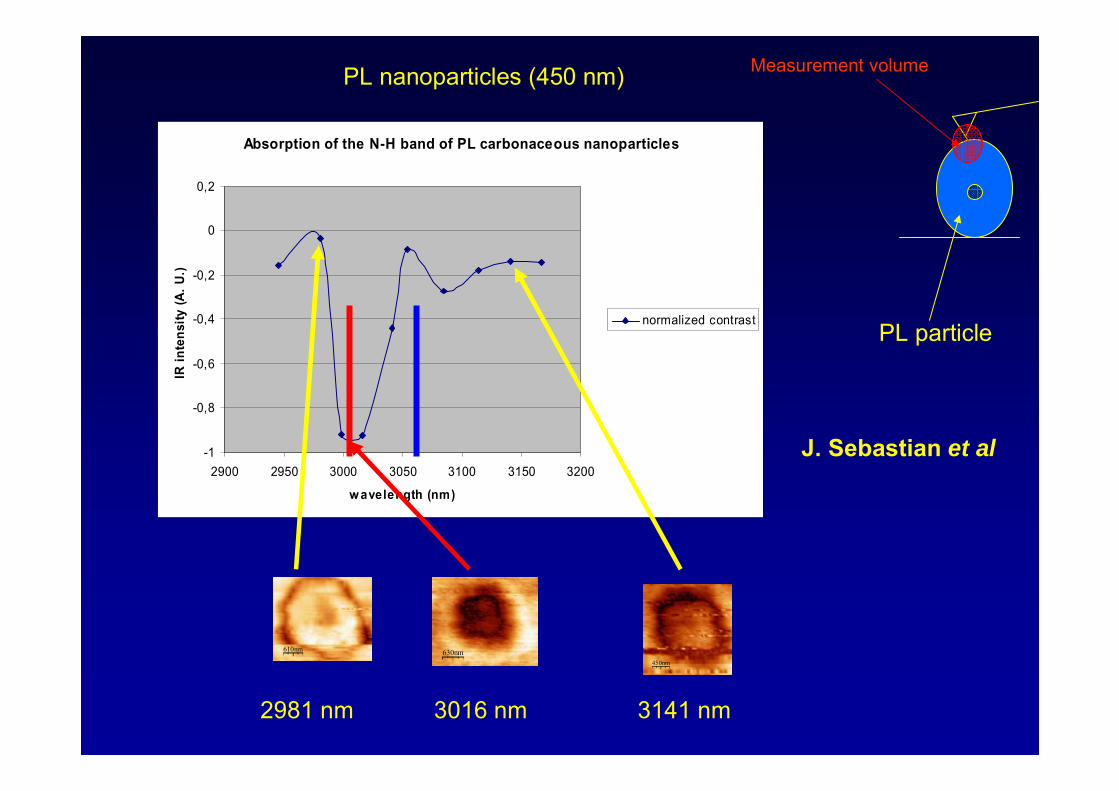
PL nanoparticles (450 nm)
630nm610nm
450nm
3016 nm2981 nm 3141 nm
PL particle
Measurement volume
Absorption of the N-H band of PL carbonaceous nanoparticles
-1
-0,8
-0,6
-0,4
-0,2
0
0,2
2900 2950 3000 3050 3100 3150 3200
w avelength (nm)
IR in
tens
ity (A
. U.)
normalized contrast
J. Sebastian et al

3051 nm2998 nm 3148 nm
DL nanoparticles (56 nm)
DL particle
Measurement volume
140nm120nm 150nm
absorption of the N-H band of DL carbonaceous nanoparticles
-1
-0,8
-0,6
-0,4
-0,2
0
0,2
0,4
2900 2950 3000 3050 3100 3150 3200
w avelength (nm)
IR in
tens
ity
normalized contrast
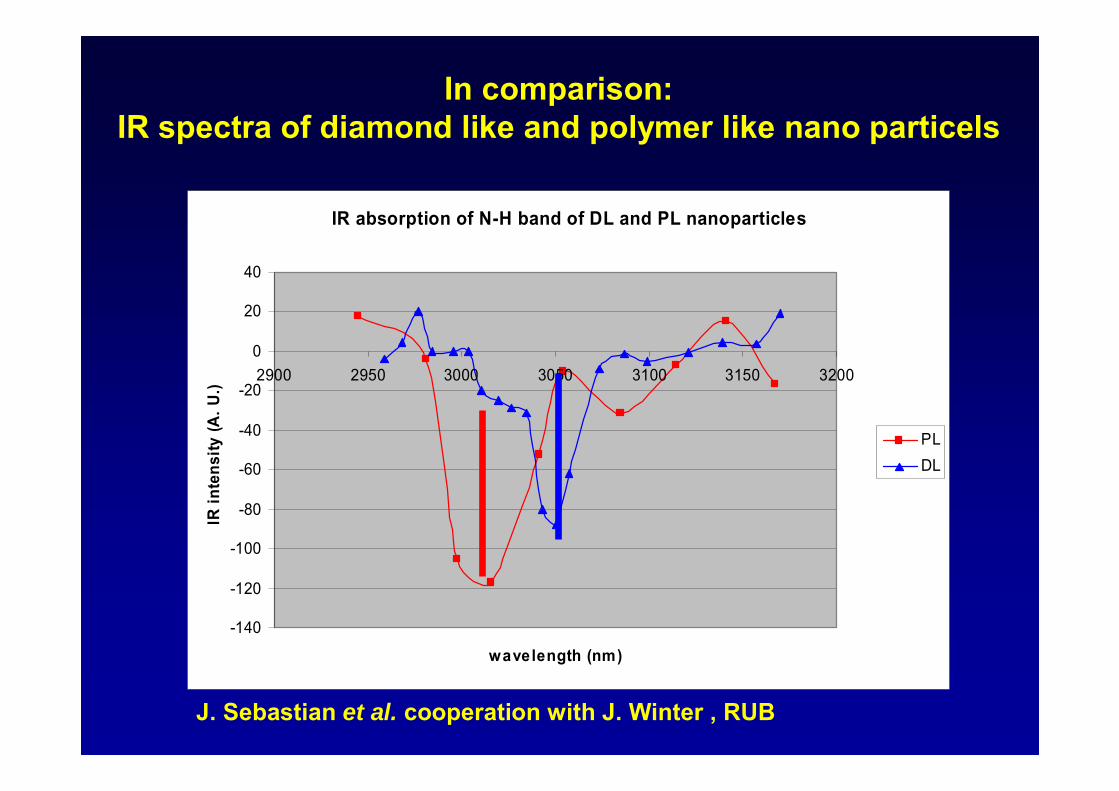
IR absorption of N-H band of DL and PL nanoparticles
-140
-120
-100
-80
-60
-40
-20
0
20
40
2900 2950 3000 3050 3100 3150 3200
wavelength (nm)
IR in
tens
ity (A
. U.)
PLDL
In comparison: IR spectra of diamond like and polymer like nano particels
J. Sebastian et al. cooperation with J. Winter , RUB

SummaryChemical Imaging on the nm scale
• Set-up of a „chemical nanoscope“ (SNIM) using new IR laser sources in the amid, C-H and O-H spectral region
• Chemical Imaging without the need of extrinsic labels• Demonstration of high lateral resolution (10 nm)• Sub-surface structures can be imaged (up to 100nm)
penetration depth scales with wavelength• IR spectra of 30 nm x 30 nm area can be recorded• High detection sensitivity:
Observation of monolayers• Detection limit:
4 molecules/nm2 (6.6 ·10-24 mol/nm2 )• Observation of protein in membranes or lipid rafts ?

Pump laser: Master Oscillator Power Amplifier: output power: 20 W at 1064 nm Periodically Poled Lithium Niobate (quasiphase matched) cw IR radiation 2.9 Wresonant for signal wavelength (1485-1.665 nm) ; idler (3000-4000 nm)
High power IR-radiationIR-cw OPO (2.9 W)
Aufbau einer leistungstarken Strahlungsquelle im IR Bereich


![PMD PhotonICs® 19k-S3 - pmdtec.com · Reference Design PMD[vision]® CamBoard nano The PMD[vision]®CamBoard nano with dimensions of 37x30x25mm is the smallest depth sensor refe-rence](https://static.fdocuments.net/doc/165x107/5ae222be7f8b9a097a8c8905/pmd-photonics-19k-s3-design-pmdvision-camboard-nano-the-pmdvisioncamboard.jpg)