190304 ESG Report 2019 EN - LGT Group · topics in this report give investors a snapshot of how ESG...
36
ESG Report 2019
Transcript of 190304 ESG Report 2019 EN - LGT Group · topics in this report give investors a snapshot of how ESG...

ESG Report2019

Fron
t co
ver:
Orm
at, g
eoth
erm
al p
lant
, Nev
ada,
Uni
ted
Stat
es
“We are encouraged to see progress on ESG by managersin all regions, albeit from very different starting points.”

Contents
4 Introduction
7 Private equity
16 Private debt
18 Hedge funds
24 Long-only managers
27 Public equity and fixed income
34 Long-held commitment to ESG

Tycho Sneyers(Chairman of the ESG Committee)
Introduction
We are pleased to share this year’s ESG report with our investors
and stakeholders, giving an update on the state of ESG practices
in our portfolios. In this report, we provide an overview of the
key findings of our annual ESG assessment of 218 private equity
managers and 86 hedge fund and long-only managers with
whom we partner. We also share the ESG key performance
indicators (KPIs) of our private equity co-investments and private
debt portfolio companies.
For our sustainable bond and equity offerings, we show the
carbon footprints of our various portfolios and highlight some
of the innovations we are carrying out with our ESG Cockpit,
the engine that drives our sustainability assessments. We also
look at the growth of green and sustainable bonds within our
portfolios and the broader financial market.
In addition, we zoom in on a number of special topics, such as
how we monitor ESG risk in our private equity portfolios, how
to execute a long/short hedge fund portfolio with an ESG tilt
and how to embed the Sustainable Development Goals (SDGs)
into a globally diversified equity portfolio. Taken together, the
topics in this report give investors a snapshot of how ESG and
sustainability is being implemented in our portfolios and also
provide a glimpse of where we are headed in the future.
One clear theme that stands out this year is the growing
importance of the SDGs. Investors are increasingly turning
to the SDGs to make their sustainable investment activities
more outcome oriented, and they have high expectations for
the goals. We have responded by developing an innovative
assessment module in our ESG Cockpit, which calculates the
impact of investee companies, and whole portfolios, on the
SDGs. We see it as the starting point – and a template – for how
we will integrate the SDGs into other asset classes in the future.
As always, we would be pleased to discuss with you any
questions or comments you may have on the information
presented.
On behalf of LGT Capital Partners,
4

Facts and figures
304 MANAGERS ASSESSED ON ESG
46%OF THE LGT SUSTAINABLE BOND STRATEGY IS COMPRISED OF GREEN BONDS
81METRIC TONS OF CARBON ARE SAVED BY OUR GLOBAL EQUITY STRATEGY OVER THE BENCHMARK1
65%OF PRIVATE EQUITYMANAGERS ARERATED EXCELLENTOR GOOD ON ESG
1 CO2 equiv./USDm
OF PRIVATE EQUITY CO-INVESTMENT COMPANIES HAVE DIVERSITY INITIATIVES IN PLACE
59%
1,426NET JOBS CREATED INOUR PRIVATE DEBTPORTFOLIO COMPANIES
5

Rating Description
1Manager is genuinely committed to ESG, with institutional processes in place. Applies ESG criteria in investment decision-making, is an active owner and reports on ESG
2Manager has taken steps to integrate ESG into its approach and investment process. Process is institutionalized, but manager may not follow through on all levels (e.g. reporting)
3 Manager demonstrates some commitment to ESG or has begun some initiatives, but lacks institutionalized processes
4 Manager demonstrates little or no commitment to ESG
Each year we conduct an assessment of managers, which
forms part of the firm’s larger ESG due diligence, monitoring
and manager engagement process. The assessment serves a
two-fold purpose. First, it shows our investors the extent to
which managers are considering ESG factors in their
investment, ownership and reporting practices. Second, the
assessment facilitates our engagement with managers on
ESG, highlighting excellence in implementation and flagging
areas for improvement.
In the assessment, we ask managers about, and score them
on, four key measures of ESG practice:
� Manager commitment – the extent to which they have
demonstrated their commitment to ESG through actions
such as defining a policy, committing to an industry
initiative like PRI and engaging with their portfolio
companies
� Investment process – the extent to which they have
formally integrated ESG into their investment processes,
using it as a framework for evaluating investments and
identifying areas for improvement
� Ownership – the extent to which they have exhibited
active ownership through activities like defining ESG
guidelines, establishing key performance indicators (KPIs)
or assigning ESG responsibilities for portfolio companies
� Reporting – the extent to which they have provided
regular and relevant reporting on ESG on a portfolio
company level and on the aggregate fund level
Managers receive a score of 1 to 4 (where 1 = excellent and
4 = poor) on each of the four measures, resulting in an
overall rating for each manager, which is then documented
in our monitoring system. Managers who receive low scores
(3 or 4) on specific indicators are encouraged to improve
over time.
ESG assessment of managers – how we do it
6
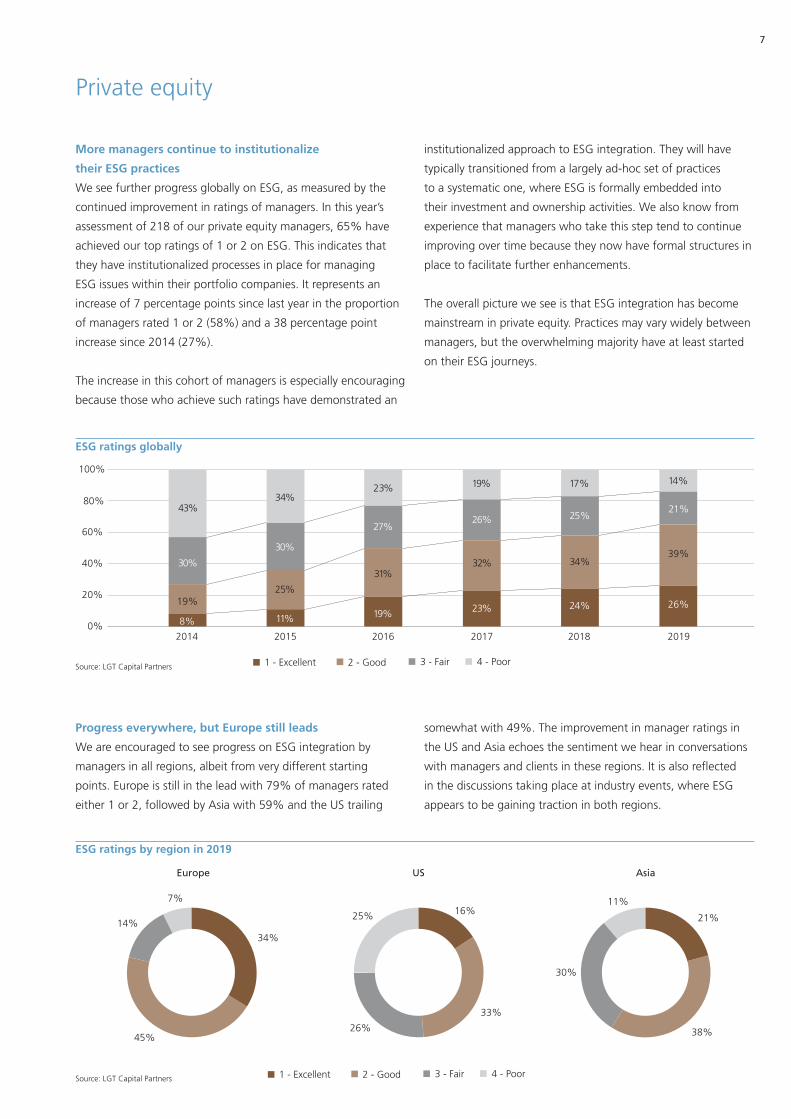
More managers continue to institutionalize
their ESG practices
We see further progress globally on ESG, as measured by the
continued improvement in ratings of managers. In this year’s
assessment of 218 of our private equity managers, 65% have
achieved our top ratings of 1 or 2 on ESG. This indicates that
they have institutionalized processes in place for managing
ESG issues within their portfolio companies. It represents an
increase of 7 percentage points since last year in the proportion
of managers rated 1 or 2 (58%) and a 38 percentage point
increase since 2014 (27%).
The increase in this cohort of managers is especially encouraging
because those who achieve such ratings have demonstrated an
institutionalized approach to ESG integration. They will have
typically transitioned from a largely ad-hoc set of practices
to a systematic one, where ESG is formally embedded into
their investment and ownership activities. We also know from
experience that managers who take this step tend to continue
improving over time because they now have formal structures in
place to facilitate further enhancements.
The overall picture we see is that ESG integration has become
mainstream in private equity. Practices may vary widely between
managers, but the overwhelming majority have at least started
on their ESG journeys.
Progress everywhere, but Europe still leads
We are encouraged to see progress on ESG integration by
managers in all regions, albeit from very different starting
points. Europe is still in the lead with 79% of managers rated
either 1 or 2, followed by Asia with 59% and the US trailing
somewhat with 49%. The improvement in manager ratings in
the US and Asia echoes the sentiment we hear in conversations
with managers and clients in these regions. It is also refl ected
in the discussions taking place at industry events, where ESG
appears to be gaining traction in both regions.
ESG ratings by region in 2019
34%
14%
45%
7%16%
33%
26%
25%
2 - Good1 - Excellent 3 - Fair 4 - Poor
21%
30%
38%
11%
Europe US Asia
Source: LGT Capital Partners
ESG ratings globally
Source: LGT Capital Partners 2 - Good1 - Excellent 3 - Fair 4 - Poor
0%
20%
40%
60%
80%
100%
19%
30%
43%
8%
2014
25%
30%
34%
11%
2015
31%
27%
23%
19%
2016
32%
26%
19%
23%
2017
39%
21%
14%
26%
2019
34%
25%
17%
24%
2018
Private equity
7

Institutionalized ESG efforts prevail in Europe
Europe has long led the way on ESG development, as asset
owners there made it a priority early on. For example, many
large European pension funds see their responsibility to
beneficiaries more broadly than simply providing financial
security, but also contributing to a “good retirement” in a world
with clean air and water, as well as stable communities. It is
also often taken as a given by businesses and investors in these
countries that companies have a responsibility to a wide array
of stakeholders. This includes not only shareholders, but also
the communities in which they operate as well as others who
may be affected by the social and environmental externalities of
business activities.
With seven years of ESG ratings data, it is our longest time series
for viewing the evolution of ESG practices in our portfolios. In
2019, we have arrived at a place where only a small minority
of managers, the 21% rated 3 or 4, have yet to develop
institutional approaches to managing ESG considerations in
their portfolio companies. With 79% achieving ratings of 1 or
2, it is now largely assumed that private equity managers in
Europe take a systematic approach to managing ESG risks and
capturing the ESG opportunities.
ESG ratings in Europe
Source: LGT Capital Partners
2 - Good1 - Excellent 3 - Fair 4 - Poor
0%
20%
40%
60%
80%
100%
20%
31%
41%
8%
2013 2016
24%
33%
34%
9%
2014
33%
31%
23%
13%
37%
23%
16%
24%
2015
34%
23%
11%
32%
2017
42%
16%
9%
33%
2018
45%
14%
7%
34%
2019
8 ESG in private equity
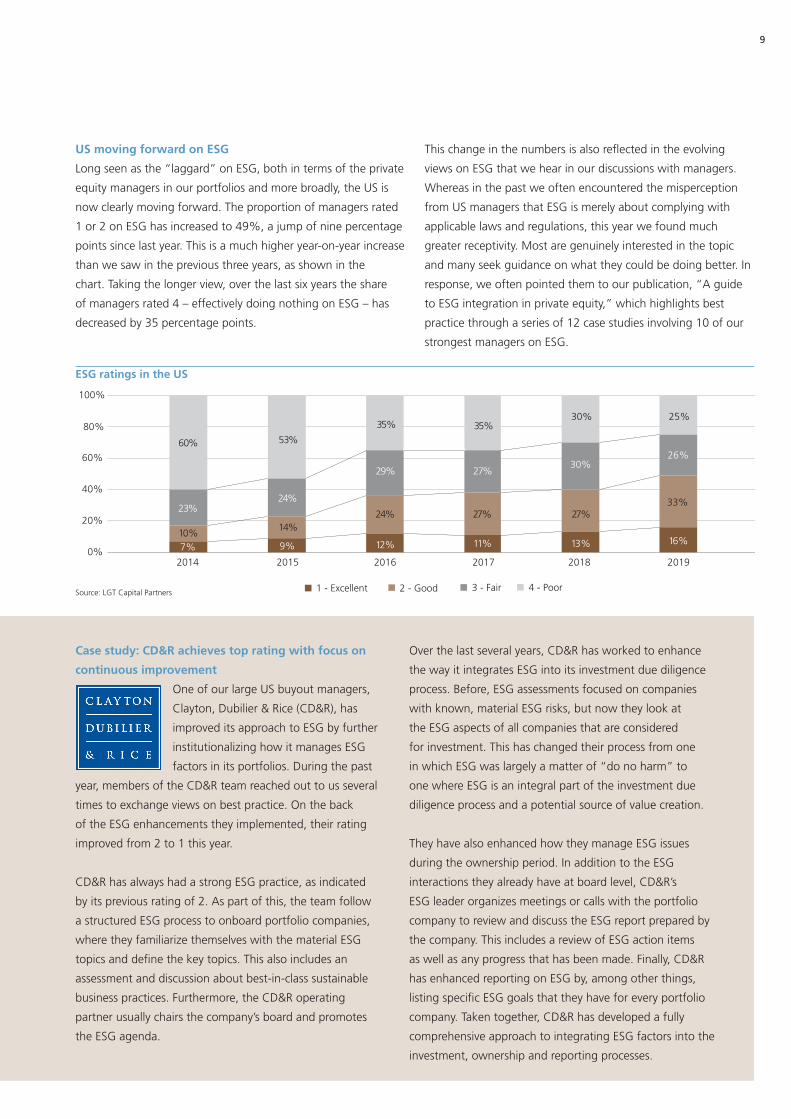
US moving forward on ESG
Long seen as the “laggard” on ESG, both in terms of the private
equity managers in our portfolios and more broadly, the US is
now clearly moving forward. The proportion of managers rated
1 or 2 on ESG has increased to 49%, a jump of nine percentage
points since last year. This is a much higher year-on-year increase
than we saw in the previous three years, as shown in the
chart. Taking the longer view, over the last six years the share
of managers rated 4 – effectively doing nothing on ESG – has
decreased by 35 percentage points.
This change in the numbers is also reflected in the evolving
views on ESG that we hear in our discussions with managers.
Whereas in the past we often encountered the misperception
from US managers that ESG is merely about complying with
applicable laws and regulations, this year we found much
greater receptivity. Most are genuinely interested in the topic
and many seek guidance on what they could be doing better. In
response, we often pointed them to our publication, “A guide
to ESG integration in private equity,” which highlights best
practice through a series of 12 case studies involving 10 of our
strongest managers on ESG.
Case study: CD&R achieves top rating with focus on
continuous improvement
One of our large US buyout managers,
Clayton, Dubilier & Rice (CD&R), has
improved its approach to ESG by further
institutionalizing how it manages ESG
factors in its portfolios. During the past
year, members of the CD&R team reached out to us several
times to exchange views on best practice. On the back
of the ESG enhancements they implemented, their rating
improved from 2 to 1 this year.
CD&R has always had a strong ESG practice, as indicated
by its previous rating of 2. As part of this, the team follow
a structured ESG process to onboard portfolio companies,
where they familiarize themselves with the material ESG
topics and define the key topics. This also includes an
assessment and discussion about best-in-class sustainable
business practices. Furthermore, the CD&R operating
partner usually chairs the company’s board and promotes
the ESG agenda.
Over the last several years, CD&R has worked to enhance
the way it integrates ESG into its investment due diligence
process. Before, ESG assessments focused on companies
with known, material ESG risks, but now they look at
the ESG aspects of all companies that are considered
for investment. This has changed their process from one
in which ESG was largely a matter of “do no harm” to
one where ESG is an integral part of the investment due
diligence process and a potential source of value creation.
They have also enhanced how they manage ESG issues
during the ownership period. In addition to the ESG
interactions they already have at board level, CD&R’s
ESG leader organizes meetings or calls with the portfolio
company to review and discuss the ESG report prepared by
the company. This includes a review of ESG action items
as well as any progress that has been made. Finally, CD&R
has enhanced reporting on ESG by, among other things,
listing specific ESG goals that they have for every portfolio
company. Taken together, CD&R has developed a fully
comprehensive approach to integrating ESG factors into the
investment, ownership and reporting processes.
ESG ratings in the US
Source: LGT Capital Partners 2 - Good1 - Excellent 3 - Fair 4 - Poor
0%
20%
40%
60%
80%
100%
10%
23%
60%
7%
2014
14%
24%
53%
9%
2015
24%
29%
35%
12%
27%
27%
35%
11%
2016 2017
33%
26%
25%
16%
2019
27%
30%
30%
13%
2018
9
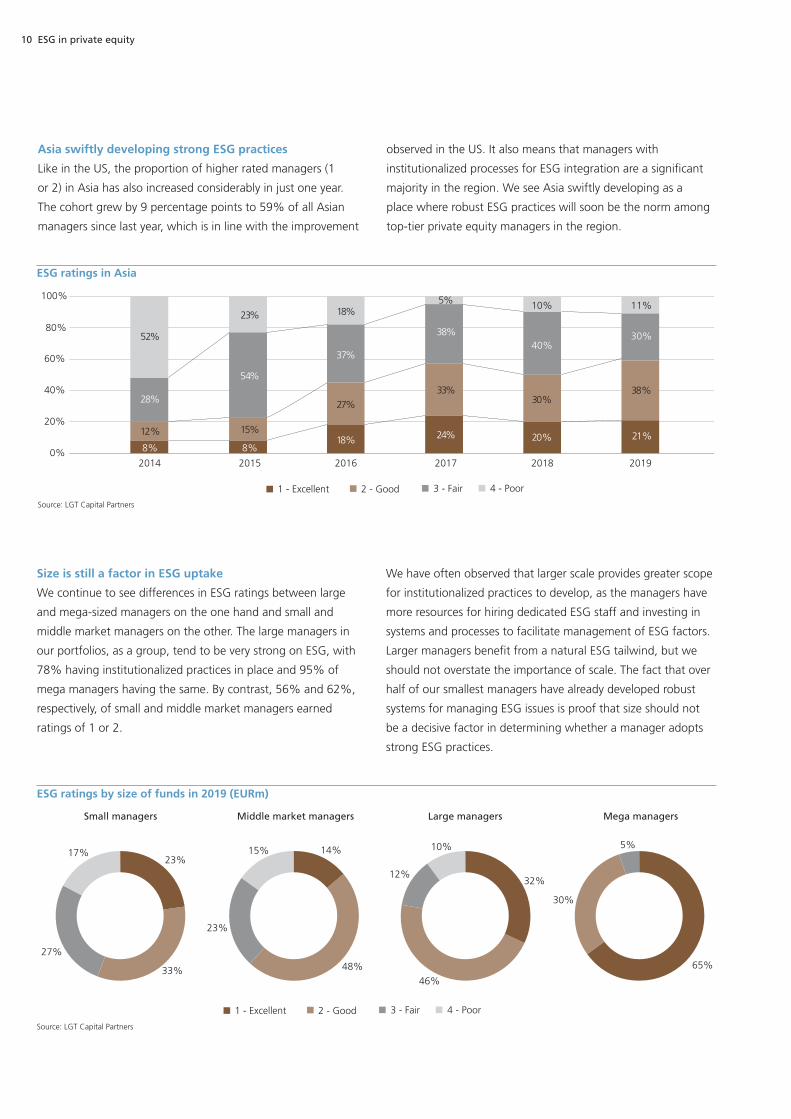
Asia swiftly developing strong ESG practices
Like in the US, the proportion of higher rated managers (1
or 2) in Asia has also increased considerably in just one year.
The cohort grew by 9 percentage points to 59% of all Asian
managers since last year, which is in line with the improvement
observed in the US. It also means that managers with
institutionalized processes for ESG integration are a signifi cant
majority in the region. We see Asia swiftly developing as a
place where robust ESG practices will soon be the norm among
top-tier private equity managers in the region.
Size is still a factor in ESG uptake
We continue to see differences in ESG ratings between large
and mega-sized managers on the one hand and small and
middle market managers on the other. The large managers in
our portfolios, as a group, tend to be very strong on ESG, with
78% having institutionalized practices in place and 95% of
mega managers having the same. By contrast, 56% and 62%,
respectively, of small and middle market managers earned
ratings of 1 or 2.
We have often observed that larger scale provides greater scope
for institutionalized practices to develop, as the managers have
more resources for hiring dedicated ESG staff and investing in
systems and processes to facilitate management of ESG factors.
Larger managers benefi t from a natural ESG tailwind, but we
should not overstate the importance of scale. The fact that over
half of our smallest managers have already developed robust
systems for managing ESG issues is proof that size should not
be a decisive factor in determining whether a manager adopts
strong ESG practices.
ESG ratings by size of funds in 2019 (EURm)
2 - Good1 - Excellent 3 - Fair 4 - Poor
23%
27%
33%
17%
Small managers
14%
48%
23%
15%
Middle market managers
65%
30%
5%
Mega managersLarge managers
32%
46%
12%
10%
Source: LGT Capital Partners
ESG ratings in Asia
Source: LGT Capital Partners
2 - Good1 - Excellent 3 - Fair 4 - Poor
0%
20%
40%
60%
80%
100%
12%
28%
52%
8% 8%
2014
15%
54%
23%
2015
27%
37%
18%
18%
33%
38%
5%
24%
2016 2017
30%
40%
10%
20%
2018
38%
30%
11%
21%
2019
10 ESG in private equity
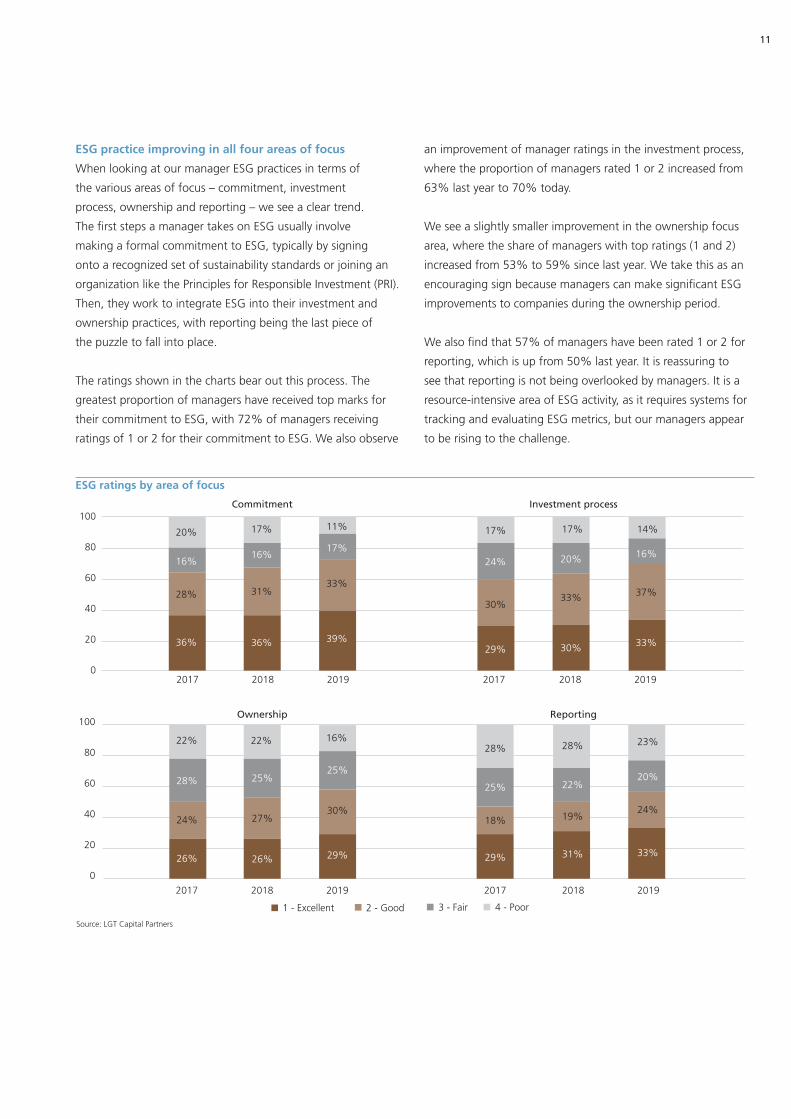
ESG practice improving in all four areas of focus
When looking at our manager ESG practices in terms of
the various areas of focus – commitment, investment
process, ownership and reporting – we see a clear trend.
The first steps a manager takes on ESG usually involve
making a formal commitment to ESG, typically by signing
onto a recognized set of sustainability standards or joining an
organization like the Principles for Responsible Investment (PRI).
Then, they work to integrate ESG into their investment and
ownership practices, with reporting being the last piece of
the puzzle to fall into place.
The ratings shown in the charts bear out this process. The
greatest proportion of managers have received top marks for
their commitment to ESG, with 72% of managers receiving
ratings of 1 or 2 for their commitment to ESG. We also observe
an improvement of manager ratings in the investment process,
where the proportion of managers rated 1 or 2 increased from
63% last year to 70% today.
We see a slightly smaller improvement in the ownership focus
area, where the share of managers with top ratings (1 and 2)
increased from 53% to 59% since last year. We take this as an
encouraging sign because managers can make significant ESG
improvements to companies during the ownership period.
We also find that 57% of managers have been rated 1 or 2 for
reporting, which is up from 50% last year. It is reassuring to
see that reporting is not being overlooked by managers. It is a
resource-intensive area of ESG activity, as it requires systems for
tracking and evaluating ESG metrics, but our managers appear
to be rising to the challenge.
ESG ratings by area of focus
Source: LGT Capital Partners
0
20
40
60
80
100
0
20
40
60
80
100
2017
16%
28%
20%
36%
2 - Good1 - Excellent 3 - Fair 4 - Poor
Commitment
2018
16%
31%
17%
36%
2017
24%
30%
17%
29%
20%
33%
17%
30%
2018
2017
28%
24%
26%
2018
25%
27%
26%
22% 22%
2017
25%
18%
28%
29%
22%
19%
28%
31%
2018
2019
17%
33%
11%
39%
16%
37%
14%
33%
2019
2019
25%
30%
29%
16%
20%
24%
23%
33%
2019
Investment process
Ownership Reporting
11

How managers think about diversity
Workforce diversity has become an increasingly important topic
in both ESG investing and business operations. With this in
mind, in this year’s ESG assessment, we asked our private equity
managers to tell us about their approach to diversity. We find
that 45% of our managers have a diversity policy in place. This
can range from a simple acknowledgement of the importance
of a diverse workforce to policies that actively seek to adjust
the balance towards greater inclusivity. By comparison, 36% of
managers consider diversity and inclusion at board level in their
investment process, seeking to ensure that the companies they
own reflect the full range of talent available.
Does the manager have a diversity policy?
Source: LGT Capital Partners
45%
55%
Yes No
Does the manager consider diversity in its investment process?
Source: LGT Capital Partners
36%
64%
Yes No
LGT Capital Partners and diversity
LGT Capital Partners (LGT CP) is committed to maintaining
and further developing the diversity of its team in order to
draw from the widest pool of talent for our business. The
effort is led by the firm’s Diversity Committee, which is
comprised of senior professionals, including a managing
partner who represents the Committee on our Executive
Management Team. Early initiatives have included joining
Advance – Women in Swiss Business to cultivate female
talent and create opportunities for women to thrive in their
careers. For example, Advance conducts skill-building
workshops for women at all levels of the organization, and
it facilitates mentorships for select staff members who have
high potential for senior management.
In 2018, we revised our recruiting roadmap and processes
to increase awareness of gender equality in recruiting
decisions. This has included a greater focus on recruitment
of female graduates through targeted campaigns, such
as networking events, presence at university job fairs
and engagement with recruitment agencies. We are also
introducing a dedicated management training on diversity
and inclusion. Finally, we aim to foster an open dialogue
around diversity to better understand the diversity concerns
of our staff.
12 ESG in private equity
Manager engagement
Our annual assessment of managers, which is the basis for
the preceding data and analysis, also acts as a springboard
for engagement on ESG. Over the past year, we set out to
engage specifically with our lower rated (3 and 4) private equity
managers, as they have the most scope for improvement.
Towards this end, we held meetings and conference calls to
discuss what ESG activities these managers are undertaking and
where their challenges lie. During the course of the year, we
were able to discuss ESG with the large majority of our 3- and
4-rated managers.
The discussions provided us with additional insights – beyond
what we gain from our annual ESG assessment – into how
managers think about ESG and what they focus on. For
example, we learned that some managers have strong records
in promoting health and safety practices within their portfolio
companies, but some do not think of this as being part of their
ESG efforts. During our discussions, we were able to clarify
activities that are in scope for ESG, thereby supporting them in
further institutionalizing their approach.
In another example, a US manager mentioned that ESG efforts
are a logical extension of the business transformation work that
they anyway undertake with portfolio companies. To them,
adding ESG-related KPIs, such as energy consumption, staff
retention and anti-bribery, serve to strengthen their existing
reporting framework.
In our experience, the engagement discussions can help us
better understand a manager’s activities and perspectives on
ESG. Importantly, engagement facilitates developing practical
approaches helping our managers become better equipped to
carry out their ESG activities.
Monitoring ESG controversies
Last year, we put in place a solution to monitor over 6,000
companies in our private equity portfolios for ESG controversies.
We work together with our partner, RepRisk, which has a
proprietary platform for tracking more than 80,000 online
information sources in 20 languages. Monitoring these sources
helps to flag controversial ESG issues, ranging from allegations
of environmental or social harm caused by a company to claims
of corruption or other governance issues.
During the last six months of 2018, our monitoring solution
identified 56 ESG incidents that we deemed to be material,
either from a reputational risk perspective or in terms of
a potential threat to company value. The incidents were
concentrated in three sectors: consumer discretionary, financials
and health care. The incidents included, amongst others, various
accidents, environmental damage and workplace harassment.
Within our process, we make an initial assessment of the
incident to determine whether follow-up is required, based on
a risk assessment of the incident and whether investors and
management can influence or change future behavior. We
also consider the impact on net asset value and reputational
risk. The monitoring solution provides timely insights on the
ESG controversies that companies in our private equity
portfolios face.
13

ESG in co-investments
This marks the first year we are covering our private equity
co-investment activities in our ESG Report. We typically co-invest
alongside high-quality private equity managers we know well
and with whom we are already invested. In total, over 30
different portfolio companies are included in this year’s analysis.
ESG in our co-investment due diligence process
ESG is an important part of our investment and monitoring
process for co-investments. We look at both the individual
portfolio company as well as our co-investing private equity
manager. LGT CP has a structured assessment of ESG topics for
each co-investment opportunity we consider, which consists of
three main steps:
Step 1. ESG screening
In the initial phase, we assess and evaluate the investment
opportunity, undertaking an ESG screening to identify risks
and opportunities early on in the process. This is based on
a pre-defined checklist covering various areas, as well as
consideration of any ESG controversies identified by our risk
monitoring solution (as described on the previous page). It tracks
more than 80,000 online information sources in 20 languages,
flagging controversial ESG issues. The team also considers
LGT CP’s ESG assessment of the private equity manager.
Step 2. ESG due diligence
Ahead of the final investment committee meeting, the
co-investment team conducts a detailed analysis of ESG-related
due diligence reports. This often comprises environmental
due diligence, a legal and compliance review and human
resources due diligence. When the co-investment team
identifies an ESG-sensitive issue, it seeks the advice of the
firm’s ESG Committee, which is subsequently reflected in
the final investment recommendation. Each year certain
co-investment opportunities are not pursued at this stage
due to ESG factors. Materiality considerations of ESG issues
are always part of the analysis.
Step 3. Ongoing monitoring
In the context of the regular monitoring activities of
co-investments, the co-investment team monitors ESG aspects
of the investment and follows up as required. This includes
monitoring for ESG controversies, as described earlier.
Portfolio company KPIs
This is the first year that we have collected and aggregated
a set of ESG key performance indicators (KPIs) for our
co-investments.2 This provides us with insights on where
companies and management teams are focusing and what
indicators are relevant to our portfolio companies. The exercise
also shows which KPIs are more developed and which ones need
more attention in terms of general monitoring, data availability
or data comparability.
2 Based on responses to our survey of our private equity portfolio companies as of 31 December 2018 or most recent data available, featuring a selection of key items
ESG KPIs
Item Score Comment
General
ESG policy 44% 44% of the companies have an ESG policy in place.
ESG training 56% 56% of the companies provided some sort of ESG training to their employees.
Absence of litigation on ESG topics 91% 91% of the companies had no ESG-related litigation in 2018.
Environment Existence of an environmental policy 41% 41% of the companies have an environmental policy.
SocialDiversity initiatives 59% 59% of the companies have initiatives in place that focus on diversity topics.
Remuneration committee 52% 52% of the companies have a remuneration committee in place.
Governance
Code of Conduct or Ethics 82%82% of the companies have a Corporate Code of Conduct or Corporate Code of Ethics in place.
Women in executive management 24% Women comprise 24% of executive management teams.
Independent board members 28% At board level, 28% are independent board members.
Independent audit committee 55% 55% of the companies have a separate and independent audit committee.
Source: LGT Capital Partners
14 ESG in private equity

Generally, we find that the governance KPIs are the most
advanced and most closely monitored. This is not surprising,
given that investors have long had an interest in governance
issues, well before ESG came to prominence. Social KPIs also
have relatively good coverage among our co-investment
companies, and seem to be in sync with growing investor
concern, for instance, over diversity.
Among our portfolio companies, environmental KPIs are
the least closely tracked, as many companies have not yet
established systems for capturing their environmental footprints.
This is in part due to the tilt of the portfolio towards services
and technologies businesses, rather than traditional industrial
companies. For many of our companies, tracking waste volumes
and recycling rates would not provide meaningful insights on
the business because the footprints are relatively small.
The KPIs reveal several examples of ESG best practice among our
portfolio companies. For example, Tendam is a leading European
fashion company that monitors its carbon footprint closely,
including its supply chain. It reports to investors on all levels
of CO2 emissions (scopes 1, 2 and 3) on an annual basis, with
the help of an external environmental advisor.3 The company
also publishes a sustainability report reflecting the company’s
commitment to sustainable growth. Another example is Milani
Cosmetics, a US-based cosmetics business that is strong on
governance, with a full-time director for regulatory affairs. The
role is much broader than simply overseeing legal compliance,
as it extends to ensuring compliance with the company’s high
environmental and ethical standards for products, as well as
maintaining relevant industry certifications.
3 Scope 1 are direct emissions caused by a company’s own production of products and services, scope 2 accounts for indirect emissions from the generation of purchased electricity and scope 3 comes from purchased products and services
15

Private debt
Portfolio company KPIs
Each year we collect a range of ESG KPIs on the companies in
our private debt portfolio, which provide us with insights on
how companies are responding to their ESG challenges and
opportunities. The portfolio is comprised of small and mid-sized
European companies, with a tilt towards those in the service,
technology and light industrial sectors. In addition to collecting
KPIs, we regularly engage with portfolio companies on ESG to
gain a better understanding of how they approach the topic.
Below we aggregate a selection of KPIs across our portfolio
of more than 40 companies to provide a snapshot of how our
private debt portfolio overall is performing on ESG.4
ESG overview
A relatively small proportion of our portfolio companies,
29%, currently report on CO2 emissions, but this has been
steadily rising over the last four years, as seen in the chart
below.5 We take that as an encouraging sign that more
companies are starting to measure it, clearly acknowledging
the growing importance of this KPI in the global fight against
climate change.
ESG KPIs
Item Score Comment
General
Existence of an ESG policy 51%51% of the companies have an ESG policy. Four companies stated they are currently developing one.
Tracking of ESG initiatives 46% 46% of the companies track their ESG initiatives with specific KPIs and reports.
Absence of litigation on ESG topics 90%Three companies dealt with ESG-related litigations in 2018 (one environmental, two social-related).
Environment
Existence of an environmental policy 44%44% of the companies have an environmental policy. Four companies are currently implementing one.
Estimation of carbon footprint 29% 29% of the companies have assessed their carbon footprint at least once.
Water or energy consumption 46%46% of the companies track their consumption of water and energy (primarily electricity and fuel).
Waste volumes, cost, and % recycled 46%46% of the companies track their waste volumes. 28% of the companies monitor waste recycling.
Social
Job creation 70%Net 2018 job creation across the portfolio was 1,426, with 70% of companies having increased their headcount.
Diversity – female headcount 41% 41% of the portfolio’s headcount are female.
Availability of training opportunities 85%85% of the companies provide training opportunities to a significant portion of their employees.
Company-wide profit sharing 54%54% of the companies grant extra bonuses to their employees depending on financial performance.
Governance
Independent member(s) at Board 54% 54% of the companies have boards comprising at least one independent member.
Board/Supervisory Board annual frequency 7 Board meetings are scheduled seven times per year on average.
Existence of a corporate code of ethics 59% 59% of the companies have a corporate code of ethics.
Existence of other specific committees 61%61% of the companies use specific committees (management, audit, remuneration, etc.) to assist the board.
Source: LGT Capital Partners
0%
20%
40%
60%
80%
100%
2016 2017 2018 2019
9%
20% 23%29%
Proportion of companies assessing their carbon emissions
Source: LGT Capital Partners
4 Based on responses to our survey of LGT CP private debt portfolio companies as of 31 December 2018, featuring a selection of key items 5 Companies having initiated a process for assessing their carbon footprints, including first-time assessments scheduled in 2019
16
ZyroFisher is a UK-based distributor of cycling clothes
and accessories, with more than 50 different brands in its
portfolio, including their own well-known brand Altura.
Funds managed by Palatine Private Equity are the majority
owners of the business, and ZyroFisher’s term debt is held
by LGT CP managed funds. In addition to 232 employees
at four locations in the UK, the company operates a large
supply chain across Asia to source hundreds of different
products. Managing the ESG implications of its supply chain
has been a major focus of its overall ESG efforts, encouraged
by its private equity owners and LGT CP. In discussions with
ZyroFisher management, we were able to reflect on ESG
progress and discuss key priorities for the short and medium
term. Their work in ensuring the sustainability of their
Altura-branded products illustrates the company’s approach.
For the Altura brand, ZyroFisher works with 10 vendors, who
between them operate a multitude of factories in China,
Vietnam, Portugal, Taiwan and South Korea. In managing
these relationships from an ESG perspective, the company
focuses on:
� Vendor sustainability – ensuring that the vendor main-
tains high standards of supply chain reliability, service
and product quality with a verifiable history of delivering
according to the agreed terms
� Vendor contracts – ensuring that the vendor adheres
to ZyroFisher’s code of conduct, which requires adhe-
rence to the UN’s International Labor Organization (ILO)
conventions, a safe and hygienic working environment
for employees, cooperation with ZyroFisher’s audit and
inspection practices
� Employee welfare – checking whether companies treat
employees in a fair and ethical way, in terms of working
times and salary structures, and whether companies main-
tain safe working conditions
Potential new suppliers of Altura products face a high
bar when they wish to join the supply chain. ZyroFisher
completes detailed due diligence on each new factory,
checking references from other brands with whom the
company works. These activities illustrate that supply
management of ESG factors is an active process, requiring
companies to make changes in their suppliers when they can
no longer be sure that standards are being maintained.
The supply chain has been a key area of focus for ZyroFisher
in the last 18 months, as it was identified as the most critical
ESG topic the company faced. It is just one item of many on
the ambitious ESG agenda that ZyroFisher and its owners
have set for the years to come.
Case study: ZyroFisher focuses on the sustainability of its supply chain
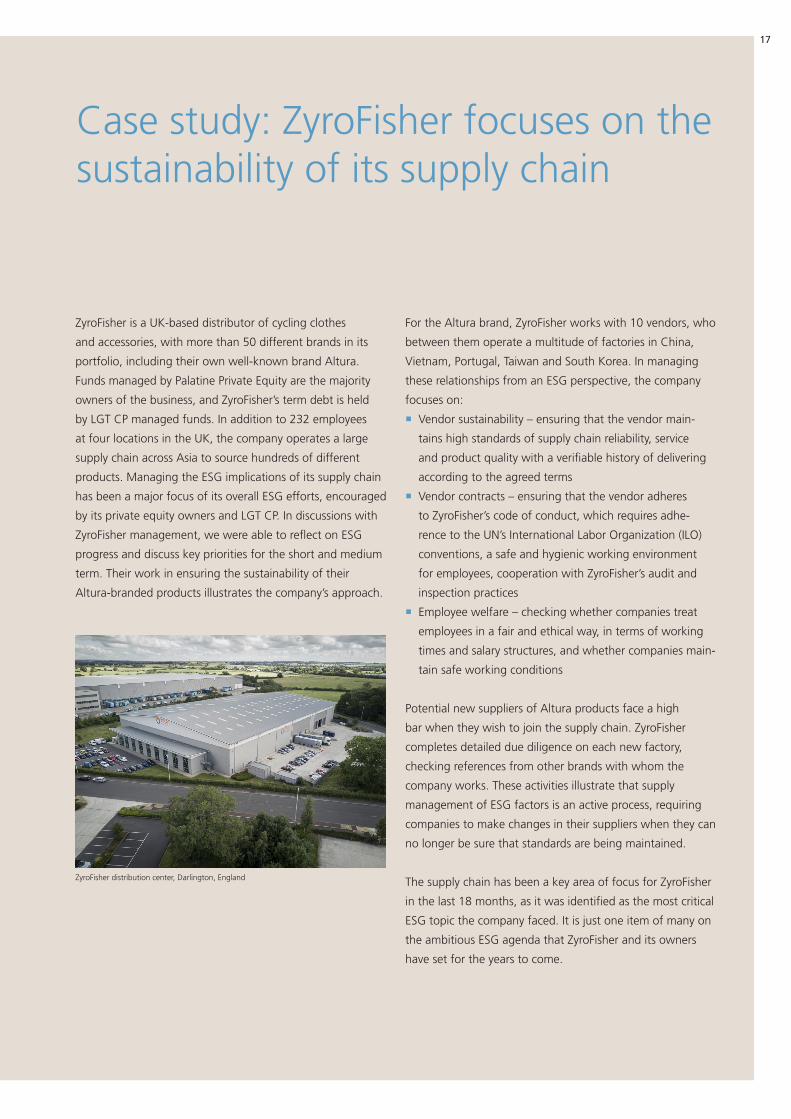
ZyroFisher distribution center, Darlington, England
17

Hedge funds
Engagement starting to pay off – with the help of better
ESG data
The hedge fund industry has made further progress in
integrating ESG into investment decision-making and embracing
the sustainability topic over the last 12 months. While there
remain many challenges to ESG integration into certain
hedge fund and other alternative investment strategies, our
engagement with managers has generally been met with
support and creative collaboration.
One thing driving progress, besides the push from asset owners,
is the greater availability of quality ESG data on public market
companies. It seems as if the race has started among the large
data providers to deliver detailed information on all aspects
of ESG. Coupled with continued progress in the area of big
data, the new data sets allow for much better ESG analysis, as
well as enabling quantitative hedge fund managers to identify
strategies building on correlations between corporate ESG data
and price developments.
A number of managers in our portfolio have taken up this
challenge and have developed models that integrate ESG
company data into a corporate valuation model, driving stock
selection on the long and the short side. Such managers tend to
receive high ratings in our annual ESG assessment, as they set
new standards for ESG integration. We elaborate on this further
in the case study later in this section.
Finally, it was encouraging to see that managers did not let the
challenging market environment for hedge funds slow their
progress on ESG innovation. Rather, it was seen as a way to
substantiate the value proposition for clients.
ESG ratings by number of managers
Source: LGT Capital Partners
3 - Fair1+2 - Excellent & Good 4 - Poor
0%
20%
40%
60%
80%
100%
2013 20162014 2015 2017
82%
9%
9%
75%
16%
9%
62%
33%
5%
61%
34%
5%
68%
22%
10%
54%
42%
4%2018
82%
3%
15%
2019
18

Current ratings and long-term development
The results of our 2019 ESG assessment of hedge fund
portfolios show progress among almost all types of managers.
While hedge fund managers are still less likely to receive our top
ESG ratings (1 or 2) than other managers of liquid assets, the
arrival of ESG-oriented quantitative equity managers opens new
possibilities. Many of them will be well positioned to receive our
top ratings as their ESG offerings evolve.
This year’s assessment of hedge fund managers shows an
increase in the proportion of top-rated managers (rated 1 or
2) to 15%, up from 9% last year. At the same time, the assets
invested by us with those managers rose to 15% of total hedge
fund assets, up from 9% last year. For the first time, we have
given a quantitative equity manager an ESG rating of 1, based
on the strength of its new dedicated ESG offering, which is
highlighted in the case study that follows. The sophistication
of the manager’s approach to integrating ESG criteria into
stock selection justified the top rating, and we take it as an
encouraging sign of what is possible on ESG in the industry.
Similar to last year, the vast majority of our hedge fund
managers, 82%, are rated 3, and we invest 83% of our
hedge fund assets with such managers (versus 87% last year).
The changing proportions are the result of several managers
improving their ratings, as well as the overall number of
managers decreasing during the reporting period. We continue
to reduce the number of hedge fund managers with the lowest
ESG rating, so we now only have one manager rated 4, down
from four such managers last year. We have also reduced the
amount of assets invested with these managers to 2%, down
from 4% last year. The last remaining 4-rated manager operates
an Asian relative value fund, in which they have found it difficult
to develop a valid ESG framework for the investment strategy.
ESG ratings by AuM
Source: LGT Capital Partners
3 - Fair1+2 - Excellent & Good 4 - Poor
0%
20%
40%
60%
80%
100%
2013 20162014 2015 2017
87%
4%
9%
76%
12%
12%
69%
25%
6%
67%
24%
9%
74%
15%
11%
64%
32%
4%2018
83%
2%
15%
2019
19
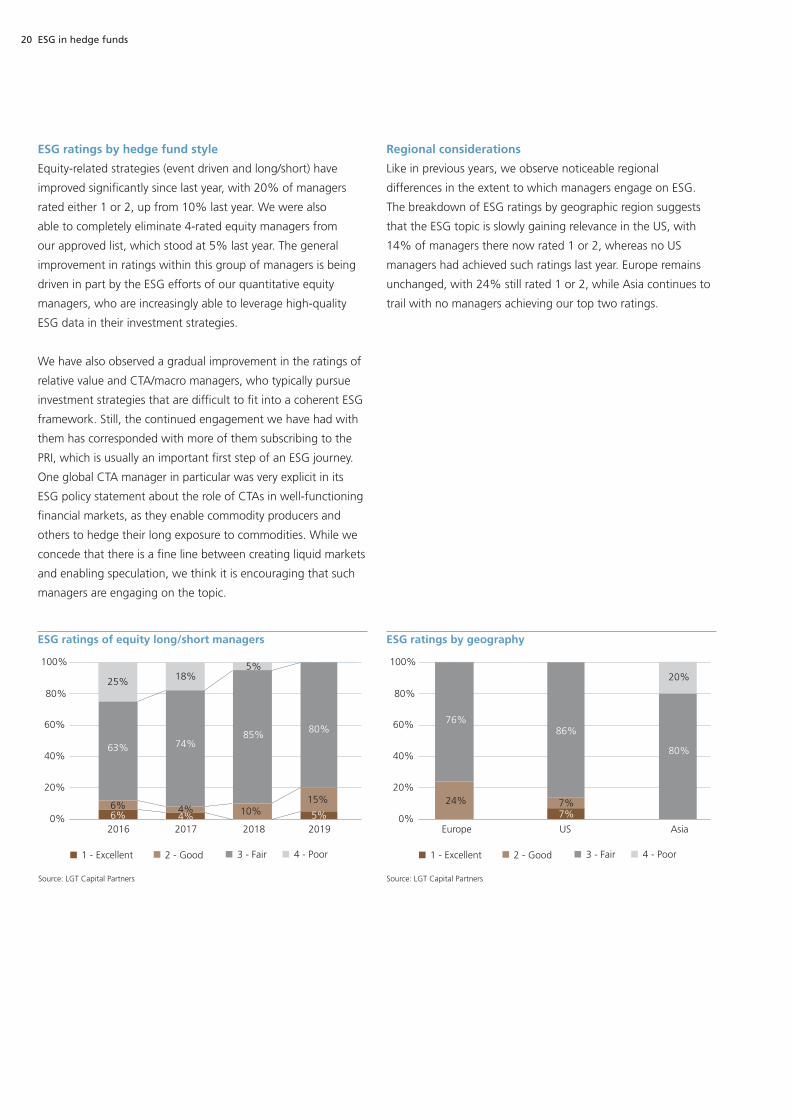
ESG ratings by hedge fund style
Equity-related strategies (event driven and long/short) have
improved significantly since last year, with 20% of managers
rated either 1 or 2, up from 10% last year. We were also
able to completely eliminate 4-rated equity managers from
our approved list, which stood at 5% last year. The general
improvement in ratings within this group of managers is being
driven in part by the ESG efforts of our quantitative equity
managers, who are increasingly able to leverage high-quality
ESG data in their investment strategies.
We have also observed a gradual improvement in the ratings of
relative value and CTA/macro managers, who typically pursue
investment strategies that are difficult to fit into a coherent ESG
framework. Still, the continued engagement we have had with
them has corresponded with more of them subscribing to the
PRI, which is usually an important first step of an ESG journey.
One global CTA manager in particular was very explicit in its
ESG policy statement about the role of CTAs in well-functioning
financial markets, as they enable commodity producers and
others to hedge their long exposure to commodities. While we
concede that there is a fine line between creating liquid markets
and enabling speculation, we think it is encouraging that such
managers are engaging on the topic.
Regional considerations
Like in previous years, we observe noticeable regional
differences in the extent to which managers engage on ESG.
The breakdown of ESG ratings by geographic region suggests
that the ESG topic is slowly gaining relevance in the US, with
14% of managers there now rated 1 or 2, whereas no US
managers had achieved such ratings last year. Europe remains
unchanged, with 24% still rated 1 or 2, while Asia continues to
trail with no managers achieving our top two ratings.
ESG ratings of equity long/short managers
Source: LGT Capital Partners
2 - Good1 - Excellent 3 - Fair 4 - Poor
0%
20%
40%
60%
80%
100%
2016
25%
63%
6%6%
4%4%
2017
18%
74%
5%
85%
10%
2018
80%
5%
15%
2019
ESG ratings by geography
2 - Good1 - Excellent 3 - Fair 4 - Poor
0%
20%
40%
60%
80%
100%
Europe
76%
24%
US
86%
7%7%
20%
80%
Asia
Source: LGT Capital Partners
20 ESG in hedge funds

Dut
chPo
wer
Com
pany
, can
al a
nd r
iver
cle
anin
g eq
uipm
ent,
Net
herl
ands
In last year’s ESG Report, we sketched out a new concept
for a long/short hedge fund portfolio with an ESG focus. We
wanted to bring the ESG know-how we have acquired over
the years with our sustainable equity portfolios to a hedge
fund solution. The portfolio would use ESG as an important
criterion for selecting companies with strong ESG profiles,
while shorting those that are weak on ESG.
We are pleased to report that we have found a partner to
implement such a strategy. Arrowstreet Capital is a Boston-
based asset manager focusing on quantitative investing
in equity markets, which manages over USD 90 billion on
behalf of investors globally. The firm employs a quantitative
investment process that is well suited to incorporating ESG
considerations in a systematic and measurable way. Over
the course of 2018, we held discussions with them about
how to develop an ESG-focused long/short equity portfolio.
As a result of this collaboration, they are in the process of
launching a fund that will integrate ESG factors in its stock
selection process, and LGT CP will act as a seed investor.
Enhancing the ESG profile of the portfolio
The starting point is Arrowstreet’s existing market neutral
strategy, which is then adapted to include ESG factors
in its investment decision-making. It aims to significantly
improve the ESG profile of the portfolio without significantly
altering the strategy’s expected risk and return. Towards
this end, Arrowstreet introduced stock selection criteria
that favor long positions in companies with desirable ESG
characteristics, as defined by externally sourced ESG ratings.
It also overweights short positions in companies that are
weak on ESG.
The ratings are based on thousands of data points across
more than 30 key issues, which show the ESG risks and
opportunities that a company faces. Companies are given
ratings on a scale that includes Excellent, Good, Average,
Low and Poor relative to their industry peers.
The result is a portfolio that is heavily weighted towards
long positions in companies that are ESG leaders as well as
short positions in ESG laggards, as shown in the charts. The
comparison with the MSCI ACWI Investable Market Index
shows the extent of the ESG strategy’s overweight in the
two kinds of positions.
Key takeaways
The key takeaway from this analysis is two-fold. First, it is
possible to improve the portfolio ESG score significantly,
while maintaining a diversified portfolio. This is explained
by the fact that Arrowstreet can select from a very broad
equity universe, allowing them to select stocks with very
similar attributes and better ESG scores. Second, the analysis
confirmed that overweighting long positions in ESG leaders
and short positions in laggards is an effective way of building
up an ESG-focused portfolio without resorting to exclusion
lists, which can potentially constrain the investment universe
in detrimental ways.
We at LGT CP believe that these results are very
encouraging, so we are pleased to seed Arrowstreet’s first
market neutral strategy with an ESG focus.
New hedge fund strategy incorporates ESG “leaders” and “laggards”
22

23
MSCI benchmarkESG strategy
Excellent Good Average Low Poor
0%
-100%
-80%
-60%
-40%
-20%
Short portfolio weight by ESG rating
Source: LGT Capital Partners/Arrowstreet Capital
MSCI benchmarkESG strategy
Excellent Good Average Low Poor0%
20%
40%
60%
80%
100%
Long portfolio weight by ESG rating
Source: LGT Capital Partners/Arrowstreet Capital

We see a positive long-term trend in the ESG practices of our
long-only managers (equity, REIT, insurance-linked strategies,
high-yield and commodities), as the share of managers rated
4 has decreased from 22% in 2016 to 10% today. Over the
same time period, the proportion of managers rated 1 or 2 has
increased from 36% to 40%. Looking shorter term, the chart
also shows an apparent dip in the proportion of managers rated
1 or 2 since last year, and a corresponding increase in those
rated 4. This is the result of several new managers focusing on
insurance-linked strategies (ILS) entering our portfolios in 2018.
Most of them have not yet started actively integrating ESG
into their investment strategies, resulting in low ESG ratings
within our assessment framework. This is in line with what we
see more broadly in the ILS asset class, where there is still little
agreement on how ESG considerations should be applied. We
view the new ILS managers as an opportunity for engagement
to see how we can raise the bar on ESG within the asset class.
When adjusting for the effect of the new managers, the ESG
ratings within our long-only portfolios are largely in line with
last year. The same managers who were doing good work on
ESG last year, as indicated by their ratings of 1 or 2, are still in
the portfolio.
Beyond the shifts in manager ratings, we have seen in our
multi-manager portfolios individual instances of ESG
engagement paying off. For example, during the reporting
period the team decided to add trade finance as a new
investment strategy in the portfolio, which set off the search
for high-quality managers that also integrate ESG to their
investment decision-making. This led to our collaboration with
TransAsia, a Hong Kong-based manager operating in a market
segment that has historically seen little focus on ESG. TransAsia,
however, has made ESG integration a priority, as described in
the manager interview that follows.
Long-only managers
ESG ratings of long-only managers
Source: LGT Capital Partners
2 - Good1 - Excellent 3 - Fair 4 - Poor
0%
20%
40%
60%
80%
100%
2016
22%
42%
22%
2017
20%
44%
26%
10%
50%
21%
19%10%14%
2019
6%
54%
25%
15%
2018
24

TransAsia Private Capital is a Hong Kong-based direct
lending manager specializing in trade finance solutions to
Asian middle market enterprises. They have made ESG a
priority in their investment approach, so we spoke with
TransAsia managing partner, Jiffriy Chandra, to get his
insights on the topic.
Jiffriy Chandra
Managing Partner
TransAsia Private Capital
LGT CP: You strengthened your responsible investment
approach and updated your policy last year. Could you
elaborate on some of the reasons for doing this?
Chandra: It has always been TransAsia’s corporate DNA to
conduct business in a socially, environmentally, and ethically
responsible manner. We know that to be successful in the
long term, we have to build a sustainable business that is
both a profitable investment proposition and an effective
driver of job creation and long-term sustainable economic
development. It was clear from the start that our borrowers
are both the foundation and the building blocks for
sustained economic growth.
We had set the objective of developing a formal responsible
investment initiative after our assets under management had
exceeded USD 1 billion. With the addition of team members
with responsible investing backgrounds, we were able to
analyze the implications of responsible investment for trade
financing and revise our investment policy accordingly.
LGT CP: Could you please share some insights on how
you incorporate responsible investment considerations
within trade finance?
Chandra: TransAsia believes that a holistic assessment
of the borrower is critical to understanding the potential
risk and return of the investment. In addition to carrying
out financial analysis during the initial credit assessment,
we ensure that a borrower’s business does not fall under
the International Finance Corporation’s (IFC) Exclusion List
for prohibited industries and economic activities. We also
evaluate the company’s ESG policies and practices relating to
its stewardship of the environment, treatment of employees,
local suppliers, contractors and local communities. In our
assessment, we analyze evidence of the company’s intent
to create positive economic, social, and/or environmental
impact in the course of carrying out its business activities.
This is based on various criteria specific to the UN
Sustainable Development Goals (SDGs).
By developing this screening strategy, which continues to
evolve, we are in a better position to track the responsible
business aspects of our borrowers. It has also enabled us
to, for example, structure an impact mandate for one
client by filtering the borrowers and/or transactions on
specific criteria.
LGT CP: Are there any challenges of implementing
responsible investment criteria and how do you
overcome them?
Chandra: Due to differences in local practices and varying
industry benchmarks, our approach to implementing
responsible investment criteria is largely qualitative at this
stage. Aside from ensuring the borrower adheres to the
IFC Exclusion List, we have created our own framework
for assessing global and local economic, environmental,
and social contexts, as well as international and domestic
regulatory standards and best practices. During our initial
Interview: Asian direct lender focusing on trade finance makesESG a priority
25

assessment, we screen the borrower with this set of criteria,
and we assess the borrower’s commitment to international
ESG best practices and whether it has sustainable and ethical
business policies and practices in place. This involves active
engagement between TransAsia and the borrower.
LGT CP: What is your experience concerning
responsible investment with clients/partners?
Chandra: Through our work of managing a global impact
mandate with TriLinc Global, we have had the opportunity
to refine our reporting and investment standards to track
and report on baseline impact metrics. There is no one-size-
fits-all approach, so we have had to gather the appropriate
data to evaluate each borrower’s policies and practices; and
to assess, monitor and report on specific impact results.
Although this takes more time and resources, TransAsia
has been able to build on our existing framework – which
continues to evolve – and incorporate new findings into our
strategic decision-making process.
LGT CP: What do you see as the big driver for
responsible investing considerations? Has it been
management led or investor led? Who’s really driving
the key issues?
Chandra: Truth be told, everyone has a stake in responsible
investing in the long run and as such, we see that interest
is coming from all the stakeholders: from our firm principals
and family, to our staff, our investors, our investors’
investors, the regulators, etc. While initially driven by
investors with a responsible investment mandate, the trend
is now common for the entire market. TransAsia plays an
important role, in particular in Asia, in bridging the needs
of the investor and borrower as part of our relationship
management and responsible investment policy evaluation.
26

Public equity and fixed income
6 Revenues pertaining to one specific SDG do not comprise 100% of company revenues
27
Making the SDGs investable
With the SDGs gaining increasing attention in the last several
years, we at LGT CP began exploring how they could be
integrated into our sustainable equity and bond portfolios.
The collection of 17 global goals was approved by 193 United
Nations member countries in September 2015, and they address
topics like poverty, hunger, health, education, climate change,
gender equality, water, sanitation, energy, environment and
social justice. Achieving them is estimated to require investment
of USD 5 to 7 trillion per year until 2030.
The SDGs themselves were designed as a set of environmental
and social goals defined by governments and nongovernmental
organizations, not as an investment framework. We have
been working on an approach to make the SDGs investable by
developing a framework that assesses the impact of companies
on achieving the SDGs. It takes a broad approach to assessment
by incorporating information on companies’ products and
services. In doing so, we leveraged an existing tool, our ESG
Cockpit, which is a proprietary system for assessing public
companies on their ESG attributes. Assessing companies on their
SDG impact was a natural extension of what the tool already
does on ESG.
Assessing companies for SDG impact
The starting point for our framework is the ability to assess both
the positive and negative impacts of companies’ products and
services on the various SDGs. Towards this end, we sourced
a consistent and comparable set of data from one of the
large data providers, and we sorted it into approximately 300
different categories of products and services, covering broadly
all of the possible business activities of listed companies. Based
on the pre-assessment of the data provider, we then attributed
an SDG impact measure ranging from -10 to +10 to each
product and service category on the respective SDG. To use a
very simple example, a company that focuses on the production
of renewable energy will have an impact score of +10 on
Climate Action (Goal 13), whereas coal-fired energy production
will have a score of -10.
The overall impact of a company on a certain SDG is then
calculated by summing up the impact of all relevant business
activities weighted with their respective revenue share.6 The
table shows an example for a utility company.
Assessing a utility company’s impact on Climate Action (Goal 13)
Product category
Energy production (renewable)
Energy production (hydro)
Coal-fired energy generation
Impact measure
10 32.0% 3.20
3 13.0% 0.39
-10 24.0% -2.4
1.19
Revenue share(% of revenue)
Contribution tototal impact
x =
Source: LGT Capital Partners
28
The company used in the example has an overall impact of
1.19, which can be considered its “SDG footprint” on Goal
13. Energy production from renewables has a strong positive
impact, given its sizeable revenue share, but this is partly offset
by producing energy from coal, which also contributes 24% to
total revenues.
Using this framework, we can derive an overall SDG footprint
of individual companies by calculating their impact on each of
the 17 SDGs. As the final step, a footprint can be calculated
for an entire investment portfolio by aggregating the individual
investments. This shows the investor the total impact of their
portfolio on the various SDGs, whether positive or negative,
which can then be compared to the impact of a benchmark
portfolio.
The footprints of companies in our sustainable bond and equity
portfolios reveal some insights on how companies impact the
SDGs:
� Certain SDGs are more strongly affected than others –
Goal 3 (Good Health & Wellbeing), Goal 7 (Affordable and
Clean Energy) and Goal 13 (Climate Action) are much more
impacted by the companies in our portfolio than the other
goals. For example, companies in the health care and phar-
maceutical sector tend to make a significant positive contri-
bution to Goal 3 because their business models are so closely
aligned with the goal. Similarly, producers of renewable
energy and providers of clean technology positively impact
Goals 7 and 13, again because of the close fit between their
business activities and the goals themselves. At the same
time, producers of fossil fuels generally have a strong nega-
tive impact on Goal 13.
� Companies vary widely in their SDG impact – some, such as
our renewable energy example, have a strong impact on just
one or two SDGs (Goals 7 and 13), so they can be viewed as
“pure play” SDG investments. Other companies, such as large
food producers, may have a very diverse set of business acti-
vities that have a relatively small impact on many different
SDGs.
Applications of our SDG framework
The framework we have developed enables us to analyze
the current SDG footprint of an investment portfolio, which
allows an investor to understand both the positive and
negative SDG impacts of their investment decisions. In doing
so, it enables an investor to identify allocation decisions that
could increase the portfolio’s positive impact on specific SDGs
or the goals overall. This does not have to be limited to
dedicated sustainable investment portfolios, but can also
be applied to larger, generalist portfolios that currently do
not incorporate sustainable considerations. Investors in such
portfolios could use the framework to make adjustments in
security selection to enhance the SDG impact, while preserving
the overall strategic allocation.
ESG in public equity and fixed income
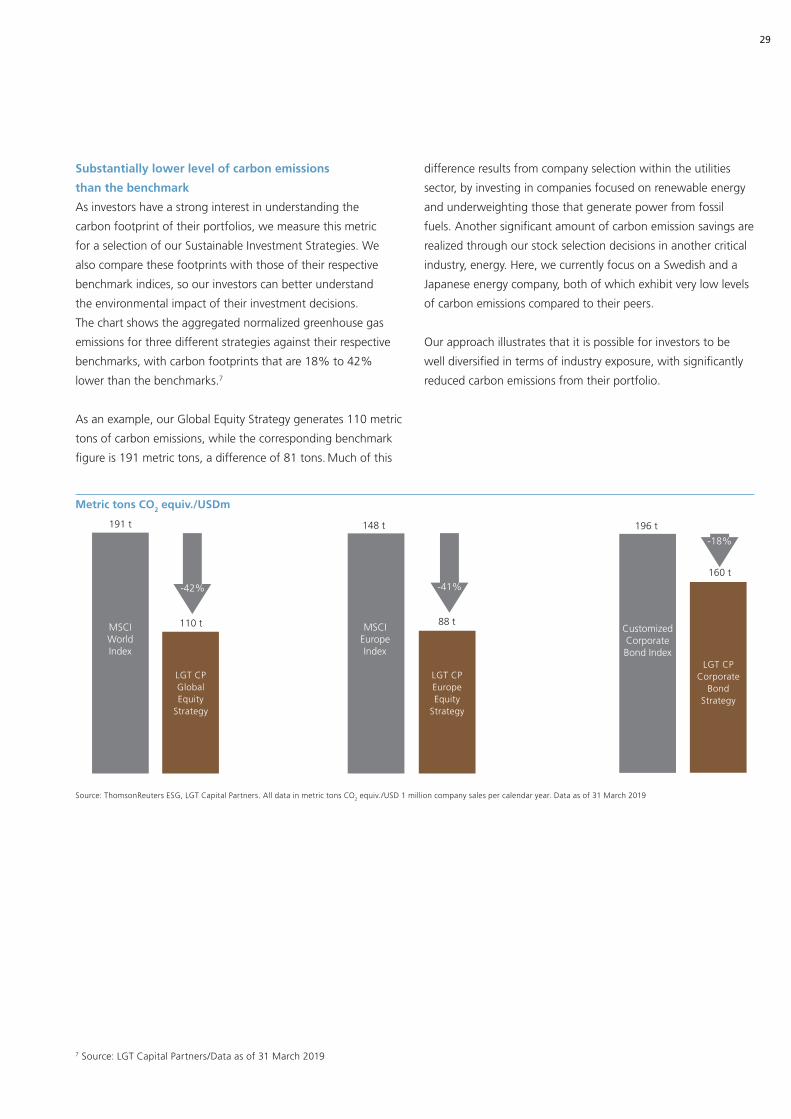
Substantially lower level of carbon emissions
than the benchmark
As investors have a strong interest in understanding the
carbon footprint of their portfolios, we measure this metric
for a selection of our Sustainable Investment Strategies. We
also compare these footprints with those of their respective
benchmark indices, so our investors can better understand
the environmental impact of their investment decisions.
The chart shows the aggregated normalized greenhouse gas
emissions for three different strategies against their respective
benchmarks, with carbon footprints that are 18% to 42%
lower than the benchmarks.7
As an example, our Global Equity Strategy generates 110 metric
tons of carbon emissions, while the corresponding benchmark
figure is 191 metric tons, a difference of 81 tons. Much of this
difference results from company selection within the utilities
sector, by investing in companies focused on renewable energy
and underweighting those that generate power from fossil
fuels. Another significant amount of carbon emission savings are
realized through our stock selection decisions in another critical
industry, energy. Here, we currently focus on a Swedish and a
Japanese energy company, both of which exhibit very low levels
of carbon emissions compared to their peers.
Our approach illustrates that it is possible for investors to be
well diversified in terms of industry exposure, with significantly
reduced carbon emissions from their portfolio.
Metric tons CO2 equiv./USDm
Source: ThomsonReuters ESG, LGT Capital Partners. All data in metric tons CO2 equiv./USD 1 million company sales per calendar year. Data as of 31 March 2019
-42% -41%
MSCIWorldIndex
LGT CPGlobalEquity
Strategy
LGT CPCorporate
BondStrategy
LGT CPEuropeEquity
Strategy
MSCIEuropeIndex
CustomizedCorporateBond Index
191 t
110 t
metric tons CO equiv./USDm
88 t
160 t
148 t 196 t
-18%
2
7 Source: LGT Capital Partners/Data as of 31 March 2019
29

The approach to assessing SDG impact described in the
preceding pages can be applied to a diversified “plain
vanilla” portfolio to improve the SDG footprint, while
retaining diversification and attractive risk-adjusted returns.
Our starting point is the MSCI World Index, comprising
1,600 stocks. As the spider chart shows, the impact of the
MSCI World on the SDGs in most cases is negative or zero.
The only area in which these companies in aggregate have
a significant positive effect is on SDG 3 (Good Health &
Well-Being), due to the large exposure to pharmaceutical
and health care companies. A smaller positive impact is
achieved on SDG 11 (Sustainable Cities and Communities),
driven by public services (utilities) companies, public
transport and real estate.
In short, there is a significant opportunity to improve the
SDG impact potential of a globally diversified portfolio,
without fundamentally changing the strategy. In order
to test this thesis, we used our SDG impact framework
to identify the 500 stocks within the MSCI World Index
with the highest SDG impact, and then we refocused
the portfolio on just these stocks. We kept the industry
weightings identical to those in the original index in
order to make a fair comparison, with the goal of keeping
diversification high and tracking error low. We also did
not do any portfolio optimization based on risk and return,
as the 500 stocks were selected solely based on their
SDG impact.
Improving SDG footprint while retaining diversification and attractive risk-adjusted returns
Source: LGT Capital Partners, un.org
SDG 500 impact comparison
MSCI World IndexSDG 500 strategy
-3
-2
-1
1
2
0
30

The spider chart shows a significant increase in positive
impact on most of the SDGs. Whereas the MSCI World
negatively affects seven different SDGs, the SDG 500
strategy has only a small negative effect on Goal 14 (Life
below Water). The biggest improvement with the optimized
strategy comes with Goal 7 (Affordable and Clean Energy)
and Goal 13 (Climate Action), topics that are very high on
the agenda of many investors.
Critical to many investors will be how these changes affect
risk-adjusted returns. In this case, the SDG 500 portfolio
shows increased returns over both a one and three-year
time frame, as shown in the table.8 Moreover, it does not
result in a material increase in the risk profile over either
time frame. It demonstrates that an investor can improve the
SDG impact profile of a portfolio, while also enhancing risk-
adjusted returns.
An important benefit of this approach is that it allows
investors to calculate a SDG baseline for their current
portfolio, showing exactly how their portfolio helps, or
hinders, achieving the SDGs. This enables them to plot
an actionable and targeted path for improvement for the
future. For example, a board of trustees or an investment
committee can clearly assess where their portfolio stands
on the SDGs and make decisions on how to improve either
their overall footprint or prioritize specific SDGs, with clear
timelines and milestones.
Performance (total return) 1 year 3 years
SDG 500 strategy 11.8% 44.8%
MSCI World 7.9% 39.3%
Outperformance 3.9% 5.5%
Risk 1 year 3 years
SDG 500 strategy 13.5% 9.4%
MSCI World 13.2% 9.2%
8 Source: LGT Capital Partners, data as of 31 March 2019. Past performance is not a guarantee, nor an indication of current or future performance. Returns may increase or decrease as a result of currency fluctuations9 Source: LGT Capital Partners, data as of 31 March 2019
Performance of SDG 500 strategy vs. MSCI World9
150.00
140.00
130.00
120.00
110.00
100.00
90.00
SDG 500 strategy
3/16 9/16 3/17 9/17 3/18 9/18 3/19
MSCI World IndexSDG 500 strategy
31
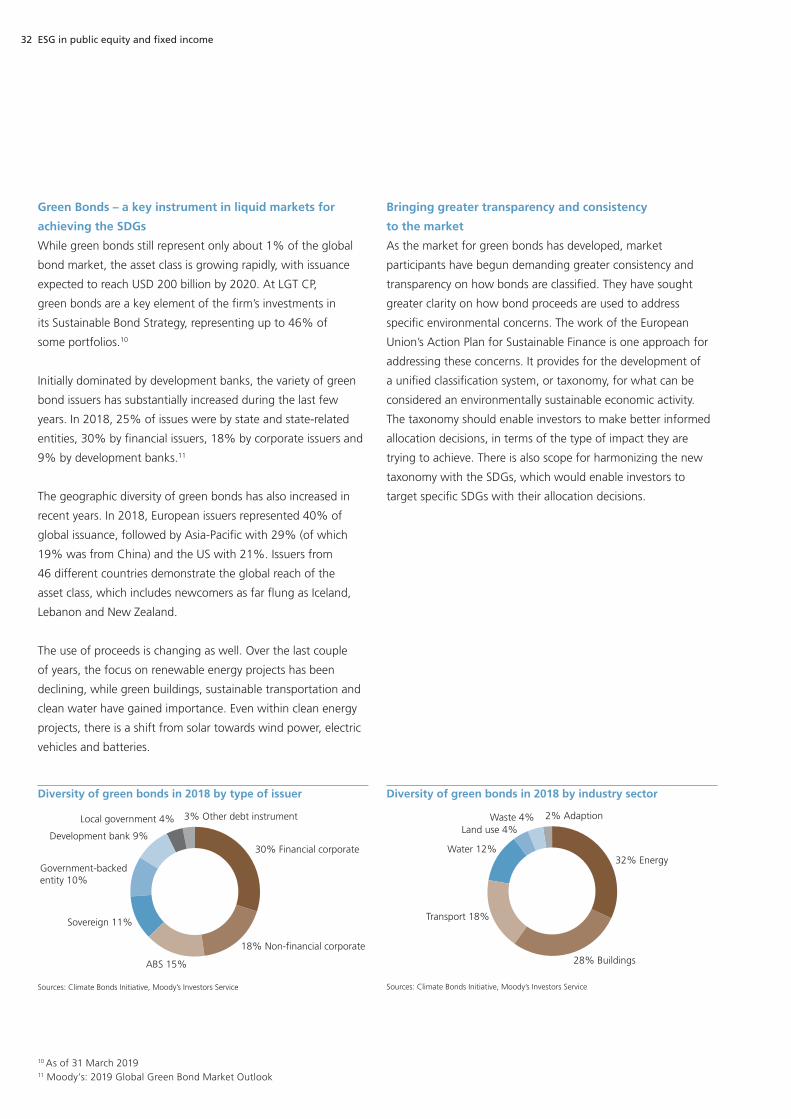
Green Bonds – a key instrument in liquid markets for
achieving the SDGs
While green bonds still represent only about 1% of the global
bond market, the asset class is growing rapidly, with issuance
expected to reach USD 200 billion by 2020. At LGT CP,
green bonds are a key element of the firm’s investments in
its Sustainable Bond Strategy, representing up to 46% of
some portfolios.10
Initially dominated by development banks, the variety of green
bond issuers has substantially increased during the last few
years. In 2018, 25% of issues were by state and state-related
entities, 30% by financial issuers, 18% by corporate issuers and
9% by development banks.11
The geographic diversity of green bonds has also increased in
recent years. In 2018, European issuers represented 40% of
global issuance, followed by Asia-Pacific with 29% (of which
19% was from China) and the US with 21%. Issuers from
46 different countries demonstrate the global reach of the
asset class, which includes newcomers as far flung as Iceland,
Lebanon and New Zealand.
The use of proceeds is changing as well. Over the last couple
of years, the focus on renewable energy projects has been
declining, while green buildings, sustainable transportation and
clean water have gained importance. Even within clean energy
projects, there is a shift from solar towards wind power, electric
vehicles and batteries.
Bringing greater transparency and consistency
to the market
As the market for green bonds has developed, market
participants have begun demanding greater consistency and
transparency on how bonds are classified. They have sought
greater clarity on how bond proceeds are used to address
specific environmental concerns. The work of the European
Union’s Action Plan for Sustainable Finance is one approach for
addressing these concerns. It provides for the development of
a unified classification system, or taxonomy, for what can be
considered an environmentally sustainable economic activity.
The taxonomy should enable investors to make better informed
allocation decisions, in terms of the type of impact they are
trying to achieve. There is also scope for harmonizing the new
taxonomy with the SDGs, which would enable investors to
target specific SDGs with their allocation decisions.
Diversity of green bonds in 2018 by type of issuer
Sources: Climate Bonds Initiative, Moody’s Investors Service
30% Financial corporate
18% Non-financial corporate
ABS 15%
Sovereign 11%
3% Other debt instrument
Government-backedentity 10%
Development bank 9%
Local government 4%
Diversity of green bonds in 2018 by industry sector
Sources: Climate Bonds Initiative, Moody’s Investors Service
32% Energy
28% Buildings
Transport 18%
Water 12%
Land use 4%Waste 4% 2% Adaption
32
10 As of 31 March 201911 Moody’s: 2019 Global Green Bond Market Outlook
ESG in public equity and fixed income

Social, sustainable and blue bonds still in their infancy
New kinds of “mission-oriented” bonds have emerged in the
last three years, which are considered the offspring of green
bonds. For example, social bonds are used to finance projects
like basic infrastructure, access to health care and education or
affordable housing, in the same way that green bonds support
projects to benefit the environment. These bonds saw issuance
of USD 14 billion in 2018.
We have also seen the emergence of sustainable bonds, with
USD 17 billion of issuance in 2018, which are used to finance
projects with both social and environmental targets. Occupying
a smaller niche are blue bonds, which is a new breed promoted
by the World Bank. Blue bonds are designed to finance marine
and ocean-based projects that have positive environmental,
economic and climate benefits. Whether social, sustainable or
blue, these bonds provide investors with more choice in the
types of projects they can support with their sustainable
investment decisions.
Towards achieving the SDGs
Achieving the SDGs by 2030 will require a significant amount of
private capital, and green bonds along with their offspring can
play an important role in achieving them. The evolution of green
bonds has shown that large amounts of capital can be raised
to target specific environmental outcomes, and this is likely to
increase as standards for transparency and reporting improve.
Green, social, sustainable and blue bonds can be mapped
to specific SDGs, so we expect them to play an increasingly
important role in investors’ SDG allocation decisions.
33
LGT CP is a leading alternative investment specialist with over
USD 60 billion in assets under management and more than 500
institutional clients in 37 countries. An international team of
over 450 professionals is responsible for managing a wide range
of investment programs focusing on private markets, liquid
alternatives and multi-asset class solutions. Headquartered in
Pfaeffi kon (SZ), Switzerland, the fi rm has offi ces in New York,
Dublin, London, Paris, Vaduz, Dubai, Beijing, Hong Kong, Tokyo
and Sydney.
LGT CP has a long-held commitment to incorporating ESG
considerations into its client programs and its business overall.
Since 2003, many of our programs have had a responsible
investment clause written into their governing documents,
authorizing us to exclude investments that are substantially
exposed to arms-related activities, violations of human rights,
irresponsible treatment of the natural environment or other
non-ethical conduct of business. Consideration of ESG
issues is an integral part of our investment process, as
our investment teams are responsible for taking into
account ESG considerations when performing due diligence
on investments. Any opportunity that is pursued will have been
vetted for such issues.
LGT CP has been a signatory to the Principles for Responsible
Investment (PRI) since 2008. In 2018, Tycho Sneyers, a managing
partner and chairman of the fi rm’s ESG Committee, joined the
board of directors of PRI. LGT CP also participates in the Carbon
Disclosure Project (CDP), the European Sustainable Investment
Forum (Eurosif), the Montreal Carbon Pledge and Institutional
Investors Group on Climate Change (IIGCC).
In 2018, the PRI awarded LGT CP scores of A or A+ across all
modules evaluated in its annual RI Assessment Report.
Long-held commitment to ESG
34
Refutura FSC® recycled, matte, ISO white 100,
100% recycled paper, carbon-neutral, Blue Angel
Legal InformationThis document is intended solely for the recipient and may not be passed on or disclosed to any other person. This document is for information only and is not an offer to sell or an invitation to invest. In particular, it does not constitute an offer or solicitation in any jurisdiction where it is unlawful or where the person making the offer or solicitation is not qualified to do so or the reci-pient may not lawfully receive any such offer or solicita-tion. It is the responsibility of any person in possession of this document to inform themselves of, and to obser-ve, all applicable laws and regulations of relevant juris-dictions.The information and any opinions contained herein have been obtained from or are based on sources which are believed to be reliable, but their accuracy cannot be
guaranteed. No responsibility can be accepted for any consequential loss from this information. Prospective in-vestors should rely only on the information contained in a prospectus. Prospective investors should also inform themselves, and should take appropriate advice, on the legal requirements and as to the possible tax conse-quences, foreign exchange restrictions or exchange con-trol requirements that they may encounter under the laws of the countries of their citizenship, residence or domicile and that may be relevant to the subscription, purchase, holding, exchange, redemption or disposal of any investments.The value of investments and income derived thereof can decrease as well as increase (this may be partly due to exchange rate fluctuations in investments that have an exposure to currencies other than the base currency
of the fund). Performance numbers shown are records of past performance and as such do not guarantee future performance. Please note that information and data regarding your relationship with LGT Capital Partners AG may be trans-ferred to or accessed by authorized persons at affiliated companies or select third parties that are located in va-rious countries, including the United States and Hong Kong, whose legislation may not provide for the same standards of data protection as Switzerland does. Such transfer or access may occur by means of various tech-nologies, including the use of mobile phones or laptops. LGT Capital Partners AG will take reasonable steps and measures to ensure the adequate security and protec-tion of your information and data.
LGT Capital Partners Ltd.Schuetzenstrasse 6CH-8808 PfaeffikonPhone +41 55 415 96 00Fax +41 55 415 96 99
LGT Capital Partners (USA) Inc.1133 Avenue of the AmericasNew York, NY 10036 Phone +1 212 336 06 50Fax +1 212 336 06 99
LGT Capital Partners (Ireland) Ltd.Third floor30 Herbert StreetDublin 2Phone +353 1 433 74 20Fax +353 1 433 74 25
LGT Capital Partners (U.K.) Ltd.1 St. James’s MarketLondon W1S 4NQPhone +44 20 7484 2500Fax +44 20 7484 2599
LGT European Capital Ltd. 1 St. James’s MarketLondon W1S 4NQPhone +44 20 7484 2500Fax +44 20 7484 2599
LGT European Capital Ltd.37 Avenue Pierre 1er de Serbie75008 ParisPhone +33 1 40 68 06 66Fax +33 1 40 68 06 88
LGT Capital Partners (FL) Ltd. Herrengasse 12 FL-9490 Vaduz Phone +423 235 25 25 Fax +423 235 25 00
LGT Capital Partners (Dubai) LimitedOffice 7, Level 3, Gate Village 10Dubai International Financial CentreP.O. Box 125115 DubaiPhone +971 4 401 9900 Fax +971 4 401 9991
LGT Investment Consulting (Beijing) Ltd.Suite 1516, 15th FloorChina World Tower 1No. 1 Jianguomenwai AvenueChaoyang DistrictBeijing Phone +86 10 6505 82250Fax +86 10 5737 2627
LGT Capital Partners (Asia-Pacific) Ltd.Suite 4203 Two Exchange Square8 Connaught PlaceP.O. Box 13398Central Hong Kong, HK Phone +852 2522 2900Fax +852 2522 8002
LGT Capital Partners (Japan) Co., Ltd.17th Floor Stage Building2-7-2 Fujimi, Chiyoda-ku102-0071 Tokyo Phone +81 3 6272 6442Fax +81 3 6272 6447
LGT Capital Partners (Australia) Pty Limited Level 36 Governor Phillip Tower 1 Farrer PlaceSydney NSW 2000 Phone +61 2 8823 3301
35

LGT Capital Partners Ltd.Schuetzenstrasse 6, CH-8808 PfaeffikonPhone +41 55 415 96 00, [email protected]
www.lgtcp.com
0519
1H
LG
T