(19) United States (12) Patent Application Publication (10 ... · obtained from the updated density...
18
(19) United States (12) Patent Application Publication (10) Pub. No.: US 2014/0052376 A1 Guo et al. US 20140.052376A1 (43) Pub. Date: Feb. 20, 2014 (54) (71) (72) (21) (22) (60) METHOD FORCEMENT EVALUATION WITH ACOUSTIC AND NUCLEAR DENSITY LOGS Applicants: Pingjun Guo, Bellaire, TX (US); Richard J. Smith, Calgary (CA) Inventors: Pingjun Guo, Bellaire, TX (US); Richard J. Smith, Calgary (CA) Appl. No.: 13/945,441 Filed: Jul.18, 2013 Related U.S. Application Data Provisional application No. 61/683,528, filed on Aug. 15, 2012. . : r 1 3.2% . s: Publication Classification (51) Int. Cl. E2IB 47/00 (2006.01) (52) U.S. Cl. CPC ...................................... E2IB 47/00 (2013.01) USPC ............................................................ 702/11 (57) ABSTRACT Method for evaluating cement quality in a cased well. A density log of the well is obtained using, for example, a GammaRay sources and detectors (51). The detector count rates are inverted to provide initial estimates of cement den sity and thickness (53). Acoustic waveform data are obtained from the well using an acoustic logging tool (52). The acous tic data are inverted (54-56), using the initial estimates of cement density and thickness obtained from the density logs, and an updated density log is inferred. Cement images are obtained from the updated density log, and cement bond quality can be estimated (57). Casing Centent ratio ACO listic o -Density O -Weibore
Transcript of (19) United States (12) Patent Application Publication (10 ... · obtained from the updated density...

(19) United States (12) Patent Application Publication (10) Pub. No.: US 2014/0052376 A1
Guo et al.
US 20140.052376A1
(43) Pub. Date: Feb. 20, 2014
(54)
(71)
(72)
(21)
(22)
(60)
METHOD FORCEMENT EVALUATION WITH ACOUSTIC AND NUCLEAR DENSITY LOGS
Applicants: Pingjun Guo, Bellaire, TX (US); Richard J. Smith, Calgary (CA)
Inventors: Pingjun Guo, Bellaire, TX (US); Richard J. Smith, Calgary (CA)
Appl. No.: 13/945,441
Filed: Jul.18, 2013
Related U.S. Application Data Provisional application No. 61/683,528, filed on Aug. 15, 2012.
. :
r 1
3.2%
.
s:
Publication Classification
(51) Int. Cl. E2IB 47/00 (2006.01)
(52) U.S. Cl. CPC ...................................... E2IB 47/00 (2013.01) USPC ............................................................ 702/11
(57) ABSTRACT Method for evaluating cement quality in a cased well. A density log of the well is obtained using, for example, a GammaRay sources and detectors (51). The detector count rates are inverted to provide initial estimates of cement den sity and thickness (53). Acoustic waveform data are obtained from the well using an acoustic logging tool (52). The acous tic data are inverted (54-56), using the initial estimates of cement density and thickness obtained from the density logs, and an updated density log is inferred. Cement images are obtained from the updated density log, and cement bond quality can be estimated (57).
Casing Centent
ratio
ACO listic o
-Density O
-Weibore
Patent Application Publication Feb. 20, 2014 Sheet 1 of 12 US 2014/0052376 A1
Casing Cement ornation
2O K-2 asnitter Amplitude
3 ft. Receiver -
f 5 ft. Y
Receiver se
T 2 w x 8.
F.G. 1 (Prior Art)
|--
- Casing Wai
Transducer
first Reflection . . . . ax--> -- --> --> --> --- --- --> ---> ---> ---- a--> ----a - um)-
Reso, --a Ref
irst Ariwai Casing ickness
Casing - fl- M. A - -, fiv/VVN/N-ra^*...*. Radius resonance impedance
Wiriciosy Widow Widow
F.G. 2 (Prior Art)

US 2014/0052376 A1 Feb. 20, 2014 Sheet 2 of 12 Patent Application Publication
No.dia papuoš

US 2014/0052376 A1 Feb. 20, 2014 Sheet 3 of 12 Patent Application Publication
ACOustic o
Wiece
-Density O

Patent Application Publication Feb. 20, 2014 Sheet 4 of 12 US 2014/0052376 A1
s
Nuclear density og
?wellbore model (casing and centent
s e- riversion
Match Y-C acoustic
Cerett Orci interpretation
F.G.

Patent Application Publication Feb. 20, 2014 Sheet 5 of 12 US 2014/0052376 A1
fucicake with a rite
viudicake without arite
frnc ^: y pre-N' f” 3f4.
O
4.
Short spacing detector coLifting rate
F.G. 6 (Prior Art)
Casing Cerne t Fornation -- 2:sai Detector 3 W.
Detector 2
Detect
Source
(Prior Art)

Patent Application Publication Feb. 20, 2014 Sheet 6 of 12 US 2014/0052376 A1
Fornation
racia distance
G. 8 (Prior Art)
Transducer Forfatic
% Z
G. (Prior Art)

Patent Application Publication Feb. 20, 2014 Sheet 7 of 12 US 2014/0052376 A1
x 5
Good Ond
Simulated
50 SS 8 83 7 75 80 85 time - is
F.G. 10
x 05 2.5
26
5
10 - Free Pipe k -0.5
-OS Measured
- {
-S
50 SS 8 85 70 75 80 85 Time - as
F.G. 11

Patent Application Publication Feb. 20, 2014 Sheet 8 of 12 US 2014/0052376 A1
ROS 85 RC3 3.85
2.0 gfcc 2.65 gfcc
Azimuth - deg 38
F.G. 12 (Prior Art)

Patent Application Publication Feb. 20, 2014 Sheet 9 of 12 US 2014/0052376 A1
- ratic Rock
Centert
Casig ric
F.G. 13
Fratic reck
Ceet
-Casing A-Fuici
F.G. 14

Patent Application Publication Feb. 20, 2014 Sheet 10 of 12 US 2014/0052376 A1
oratio Rock
Ceet
Casing -
is:
F.G. 15
FOatio C.
--Ceet
-Casing
Fic: Containiated Ceet
F.G. 16

US 2014/0052376 A1 Feb. 20, 2014 Sheet 11 of 12 Patent Application Publication
S S S
S SS S
F.G. 18 (Prior Art)

US 2014/0052376 A1 Feb. 20, 2014 Sheet 12 of 12 Patent Application Publication
S &
S &
19 FG. (Prior Art)
Source
G. 20 (Prior Art)
US 2014/0052376 A1
METHOD FORCEMENT EVALUATION WITH ACOUSTIC AND NUCLEAR DENSITY
LOGS
CROSS-REFERENCE TO RELATED APPLICATION
0001. This application claims the benefit of U.S. Provi sional Patent Application 61/683,528, filed Aug. 15, 2012, entitled METHOD FOR CEMENT EVALUATION WITH ACOUSTIC AND NUCLEAR DENSITY LOGS, the entirety of which is incorporated by reference herein.
FIELD OF THE INVENTION
0002 This invention relates generally to the field of pro duction of oil or gas, and more particularly to well drilling. Specifically, the invention is a method for evaluating cement density in cementing around well casings.
BACKGROUND OF THE INVENTION
0003. When a well is drilled and steel casing is placed, cement slurry is pumped into the annular space between casing and formations. The primary objectives of cementing are to provide mechanical Support for the steel casing string and Zonal isolation between earth strata or formations. Mul tiple-stage casing and cementing operations are common pro cedures to establish pressure barriers during drilling a well. It allows the use of heavier drilling muds in drilling deeper sections without damaging or fracturing the shallowerforma tions due to hydrostatic pressure gradient. An ideal cementing job would fill the casing and formation annulus completely with cement. Less than ideal cementing can result in fluid filled channels within the cement sheath and fluid contami nated cement due to incomplete replacement or Sweep of drilling mud with cement slurry. Zonal isolation assessment is a critical aspect of well integrity tests to ensure hydrocarbon production in a safe manner. Cement evaluation measure ments are relied upon to demonstrate that fluid cross flow will not occur from unwanted Zones, i.e. Zones other than the producing intervals. This invention relates to in situ evalua tion of cement quality between steel casing and formations in a wellbore.
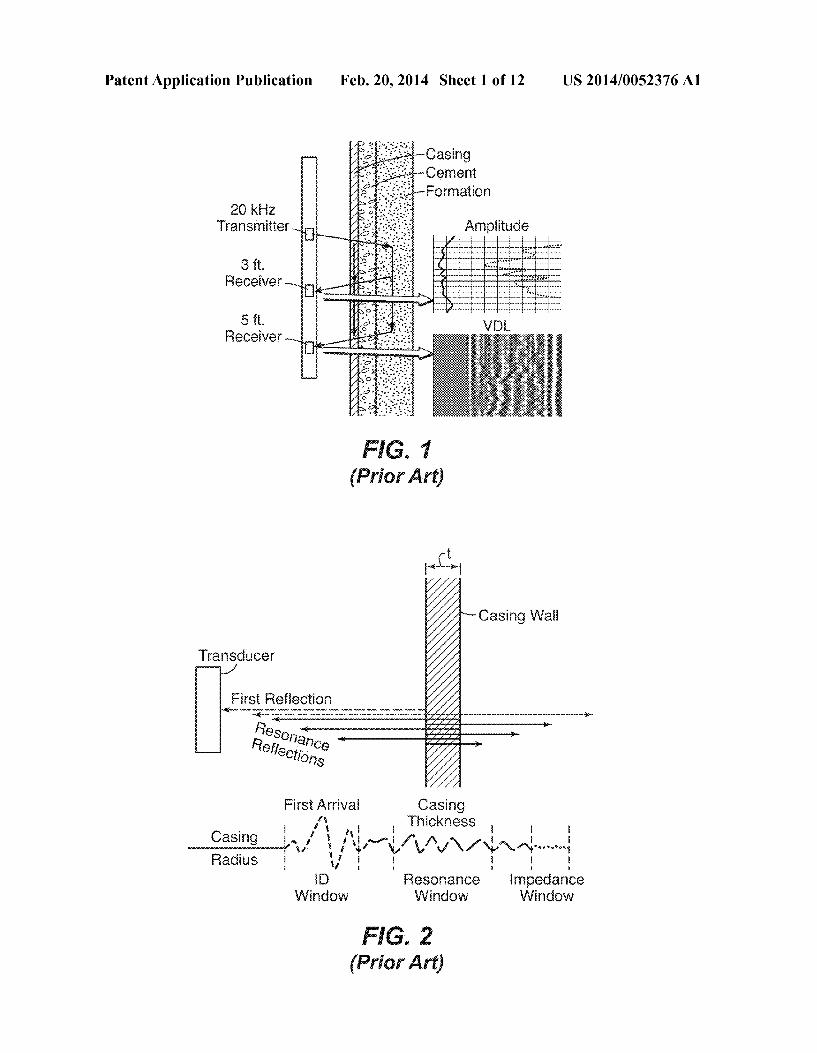
0004 Shown in FIG. 1 is a traditional cement bond tool (CBL). It has an acoustic transducer and two receivers located three and five feet from the transmitter, respectively. The 3 ft receiver records the amplitude of the acoustic signal and the 5 ft receiver records a variable density log (VDL), which is the pressure waveform data measured by the receivers. Typically, the 5 ft receiver may measure both amplitude and phase as a function of time. The variable density log, also called a microseismograph, is recorded and plotted as a function of time as each logging depth. Interpreters may qualitatively inspect these plots and look for certain "chevron’ patterns due to Sonic wave attenuation as evidence of a good bond. Parallel or “railroad' tracks often indicate the presence of free pipe or fluid behind casing. The cement bond logging tools generally do not have azimuthal sensitivity and instead provide the averaged attenuation and impedance measurements around the wellbore. The newer ultrasonic cement bond tools are typically configured with either multiple arms or a rotating head that have collocated transmitter and receivers. These types of tools are operated in pulsed mode and are capable of recording waveform data in multiple sectors around the well
Feb. 20, 2014
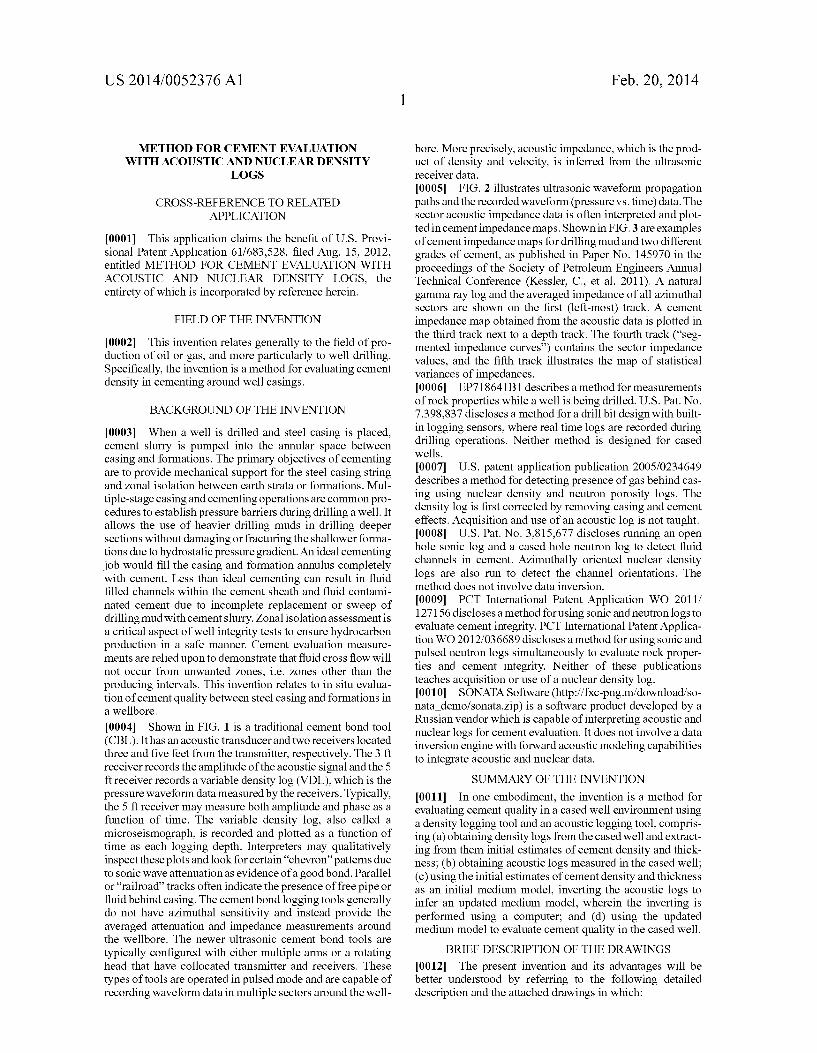
bore. More precisely, acoustic impedance, which is the prod uct of density and velocity, is inferred from the ultrasonic receiver data. 0005 FIG. 2 illustrates ultrasonic waveform propagation paths and the recorded waveform (pressure vs. time) data. The sector acoustic impedance data is often interpreted and plot ted in cement impedance maps. Shown in FIG.3 are examples of cement impedance maps for drilling mud and two different grades of cement, as published in Paper No. 145970 in the proceedings of the Society of Petroleum Engineers Annual Technical Conference (Kessler, C., et al. 2011). A natural gamma ray log and the averaged impedance of all azimuthal sectors are shown on the first (left-most) track. A cement impedance map obtained from the acoustic data is plotted in the third track next to a depth track. The fourth track (“seg mented impedance curves) contains the sector impedance values, and the fifth track illustrates the map of statistical variances of impedances. 0006 EP718641B1 describes a method for measurements of rock properties while a well is being drilled. U.S. Pat. No. 7,398.837 discloses a method for a drill bit design with built in logging sensors, where real time logs are recorded during drilling operations. Neither method is designed for cased wells. 0007 U.S. patent application publication 2005/0234649 describes a method for detecting presence of gas behind cas ing using nuclear density and neutron porosity logs. The density log is first corrected by removing casing and cement effects. Acquisition and use of an acoustic log is not taught. 0008 U.S. Pat. No. 3,815,677 discloses running an open hole Sonic log and a cased hole neutron log to detect fluid channels in cement. Azimuthally oriented nuclear density logs are also run to detect the channel orientations. The method does not involve data inversion. 0009 PCT International Patent Application WO 2011/ 127156 discloses a method for using Sonic and neutron logs to evaluate cement integrity. PCT International Patent Applica tion WO 2012/03.6689 discloses a method for using sonic and pulsed neutron logs simultaneously to evaluate rock proper ties and cement integrity. Neither of these publications teaches acquisition or use of a nuclear density log. 0010 SONATA Software (http://fxc-png.m/download/so nata demo/sonata.Zip) is a software product developed by a Russian vendor which is capable of interpreting acoustic and nuclear logs for cement evaluation. It does not involve a data inversion engine with forward acoustic modeling capabilities to integrate acoustic and nuclear data.
SUMMARY OF THE INVENTION
0011. In one embodiment, the invention is a method for evaluating cement quality in a cased well environment using a density logging tool and an acoustic logging tool, compris ing (a) obtaining density logs from the cased well and extract ing from them initial estimates of cement density and thick ness; (b) obtaining acoustic logs measured in the cased well; (c) using the initial estimates of cement density and thickness as an initial medium model, inverting the acoustic logs to infer an updated medium model, wherein the inverting is performed using a computer, and (d) using the updated medium model to evaluate cement quality in the cased well.
BRIEF DESCRIPTION OF THE DRAWINGS
0012. The present invention and its advantages will be better understood by referring to the following detailed description and the attached drawings in which:

US 2014/0052376 A1
0013 FIG. 1 is a schematic diagram illustrating a Cement bond logging tool (CBL); 0014 FIG. 2 is a schematic diagram illustrating ultrasonic wave propagation paths and waveforms; 0015 FIG. 3 shows an example of acoustic impedance maps in drilling mud, regular cement, and light weight cement; 0016 FIG. 4 is a schematic diagram illustrating an inte grated cement evaluation system with acoustic and nuclear density tools; 0017 FIG. 5 is a flowchart showing basic steps in the present inventive method for integrated cement evaluation with acoustic and nuclear density logs; 0018 FIG. 6 is a “spine-and-ribs' response plot of a two detector density tool as shown in the book by Ellis and Singer: Well Logging for Earth Scientists, Elsevier, page 210 (1987); 0019 FIG. 7 is a schematic diagram of a three-detector density tool showing the different regions that each detectoris predominantly sensitive to: 0020 FIG. 8 is a plot showing Density sensitivity as a function of radial distance from a gamma ray Source; 0021 FIG.9 is a schematic diagram illustrating ultrasonic wave propagation within a wellbore; 0022 FIG. 10 shows a comparison of modeled and mea sured ultrasonic waveforms in a “good bond' interval: 0023 FIG. 11 shows a comparison of modeled and mea Sured ultrasonic waveforms in a free pipe interval; 0024 FIG. 12 shows a pair of examples of borehole den sity image logs obtained with tools using a gamma ray Source and detectors; 0025 FIGS. 13-16 illustrate wellbore models with casing but with differing quality cement bonds; 0026 FIG. 17 illustrates how acoustic impedance may be computed from waveforms provided by an acoustic logging tool; 0027 FIG. 18 shows the response of a short-spaced detec tor in the form of measured density as function of formation density and cement thickness; 0028 FIG. 19 shows the response of a long-spaced detec tor in the form of measured density as function of formation density and cement thickness; and 0029 FIG. 20 is a schematic diagram illustrating a density tool with a gamma ray source, a short-spaced detector, and a long-spaced detector. 0030 Depending upon patent law restrictions, some of the drawings may be black-and-white reproductions of colored originals. The invention will next be described in connection with example embodiments. However, to the extent that the following detailed description is specific to a particular embodiment or a particular use of the invention, this is intended to be illustrative only, and is not to be construed as limiting the scope of the invention. On the contrary, it is intended to cover all alternatives, modifications and equiva lents that may be included within the scope of the invention, as defined by the appended claims.
DETAILED DESCRIPTION OF EXAMPLE EMBODIMENTS
0031. The present invention is a method for evaluating cement quality in a wellbore completed with casing and cement, where the method uses acoustic logs and nuclear density logs. More particularly, acoustic waveform data are acquired with Sonic or ultrasonic tools, and bulk density data are acquired with a nuclear density tool, in a cased and
Feb. 20, 2014
cemented wellbore. One example of a conceptual system design is illustrated in FIG. 4. Sonic and density logs may be further analyzed with an integrated multi-physics analysis method to quantify density and thickness of casing and cement as well as to provide traditional cement bond logs. An underlying principle of the new method is that a nuclear density tool measures bulk density, p, and an acoustic tool measures acoustic impedance, Z, which is defined as
where v is acoustic velocity. There is a fundamental coher ence among the density and acoustic impedance measure ments. The method may be implemented in a practical inter pretation workflow consisting of one or more forward acoustic (Sonic or ultrasonic) models and a nuclear density inversion algorithm. 0032. In more detail, the acoustic velocities of steel, cas ing and fluid are close to constant and do not vary much. The cement acoustic velocity, for example, can be estimated using density, p, from density log and acoustic impedance, Z, cal culated from field data as illustrated in FIG. 17. The velocity values can then be adjusted in an iterative fashion within the workflow. A system of wave propagation equations are then built with material properties of borehole mud casing, cement, and formation under proper boundary conditions at material interfaces. For example, an equation describing propagation of incident and reflection wave potentials, p, has the following form,
where a and a are amplitudes. The wavenumber Kequals co/v, (angular frequency divided by acoustic velocity), and X is distance. 0033. The current invention provides a method to quanti tatively evaluate cement quality with acoustic and nuclear density tools. The nuclear density log provides a Volumetric density measurement of Surrounding media. In theory, a nuclear density tool may be constructed with a gamma ray Source and one gamma ray detector, and its density response is calibrated to bulk density in a homogeneous and infinite medium. However, density tools, in practice, have multiple detectors in place to provide accurate density measurements in layered media, Such as mud cake, casing, and cement. Shown in FIG. 6 is “spine-and-ribs' response plot of a two detector density tool behind mud cakes. The two axes repre sent the short-spaced and long-spaced density values. The primary curve 61, also called the spine, represents the forma tion density response line along which the short-spaced detector and long-spaced detector read the identical forma tion density values, or bulk density, e.g. p. 1.9 g/cc, 2.0 g/cc, etc., and the departure "ribs' curves 62 indicate the charac teristics of tool response to mud cake properties. The short (SS) and long-spaced (LS) detectors respond to mud cake in different manners due to the difference in distance to the gamma ray source. Depending upon the formation density values, the SS and LS densities follow distinct rib lines. In general, SS and LS densities respond oppositely to mud cakes with or without barite. As illustrated in FIG. 6, the rib lines on the left side of the spine correspond to the SS and LS densities reading lower density values in front of heavy barite mud cakes, and the rib lines on the right side of the spine corre spond to the SS and LS densities reading higher density values in front of non-barite mud cakes. The tables in FIG. 6 list the mud cake density, p, and mud cake thickness, p. values that define the rib curves.

US 2014/0052376 A1
0034. A density tool with three or more detectors as shown in FIG. 7 provides count rates from each detector. The draw ing illustrates in a qualitative way how distance from the Source increases penetration sensitivity. With known casing weight and dimension, the density log is capable of simulta neously solving cement density and thickness as well as for mation density. A mathematical inversion algorithm can be devised to accomplish these objectives. One embodiment of Such an algorithm would be to establish a set of multi-param eter regression equations between detector spectral count rates and cement density and thickness using a database built by either Monte Carlo modeling or laboratory experiments for specific well completions. With more than two measured parameters, a graphical representation similar to FIG. 6 for the three detector tool response is no longer feasible. FIG. 8 depicts a typical nuclear density measurement sensitivity as a function of the distance from gamma ray source. This follows the radiation attenuation law in which gamma ray intensity decreases exponentially as a function of distance from the Source,
where C is the detector count rate, W is a factor to account for gamma ray detection efficiency, So is source strength in pho tons/sec, LL is gamma ray attenuation coefficient, and L is distance from source to detector.
0035) Shown in FIGS. 18 and 19 are examples of density tool response to formation density and cement thickness for a density tool with two detectors placed in a well with 7"OD steel casing and 16 lb/gal cement. FIG. 18 illustrates the short-spaced (SS) detector response in the form of measured density in the Z-axis as function of formation density and cement thickness. FIG. 19 illustrates the long-spaced (LS) detector response in the form of measured density in the Z-axis as function of formation density and cement thickness. The SS and LS detector density are used in these plots to illustrate one form of detector response. Detector count rates would be too complicated to display in a 3D surface plot. Similar graphs can also be constructed to demonstrate the sensitivity of density tool response to cement density. FIG. 20 illustrates Schematically an example of a density tool with two detectors.
0036 FIG. 9 illustrates schematically how the acoustic tool interacts with the cased well environment. The develop ment of the integrated acoustic and density interpretation method of the present invention realizes the underlying prin ciple wherein both the acoustic and nuclear sensors measure a common earth model consisting of the casing and cement as well as part of the formation. A true wellbore model should satisfy both acoustic and nuclear transport physics. 0037 FIG. 5 shows basic steps in one embodiment of the present inventive method. The two primary input logs to the workflow are detector count rates recorded by a nuclear den sity tool 51 and waveform (pressure) data recorded by an acoustic tool 52. The acoustic tool includes a small seismic Source and one or more seismic receivers, and may, for example, be the Ultrasonic Imager Tool (USIT) marketed by Schlumberger. The nuclear density tool typically has a gamma ray Source and at least one gamma ray detector, and may, for example, be the Litho-Density Tool (LDT) with two gamma ray detectors marketed by Schlumberger. However, the standard density processing algorithms in these commer cial devices use raw detector count rates as input and produce formation density logs that are corrected for borehole effects
Feb. 20, 2014
Such as casing, cement, and mud cake. Shown in FIG. 12 are examples of a logging-while-drilling (LWD) density image log and a wireline density log. The LWD density image log, shown on the left in FIG. 12, was acquired while the tool rotated in the wellbore and describes the azimuthal formation density distribution around the wellbore, and the density val ues are color-coded. The wireline density log, shown on the right in FIG. 12, was acquired while the tool was pulled with a cable in the well and it describes the formation density along the tool path, but only at aparticular azimuth. Both the density tool 51 and the acoustic tool 52 may be adapted to be lowered on a wireline into a wellbore, as shown in FIG. 4. 0038. At step 53, a computer is programmed with a nuclear density algorithm that performs mathematical inver sions on detector count rates recorded with preferably three or more detectors and calculates casing and cement density and thickness as well as formation density. At step 54, this infor mation is used to define a wellbore model with casing and cement properties and thickness. Schematic examples of wellbore models are shown in FIGS. 13 and 14. FIG. 13 illustrates a wellbore model constructed with density and geometric parameters calculated using the nuclear density algorithm 53. These parameters include formation density, cement density and thickness, and steel casing size and weight. In many cases, casing parameters are readily avail able in the well completion data, and formation density is known from open hole density logs and/or core data if open hole log data is acquired before the well is cased and com pleted. With formation density and casing parameters known, the number of unknown parameters is reduced to cement density and thickness only, therefore, the nuclear density solution in step 53 is greatly simplified. FIG. 14 illustrates a wellbore model constructed with model parameters calcu lated using nuclear density in which annulus between casing and formation is partially filled with fluid, i.e. a poor cement bond. Then, starting with the predefined wellbore model, the Sonic and/or ultrasonic modeling codes perform (step 54) forward modeling and calculate waveforms. Without an ini tial wellbore model 53 that is close to correct, it would be extremely difficult to model the sonic or acoustic tool response and update the wellbore model in an efficient man ner. Inversion of the nuclear density log provides the needed good starting guess. To understand the value of this, assume that FIG. 14 represents close to the actual state of affairs, i.e. the cement bond is poor. If the iteration cycle 56 were started assuming an initial guess Such as FIG. 13, the convergence process would be greatly impeded. 0039. The forward modeling code (54) solves a wave equation (partial differential equation) governing propaga tion of acoustic waves in a medium with boundary conditions (see FIG.9), given as input the numerical model from step 53 whose parameters are values of the physical properties that governs such propagation, i.e. the acoustic impedances of the borehole fluid, casing, cement, and formation as well as thick ness of casing and cement as described, for example, in FIGS. 13 and 14. The modeled acoustic response is further com pared with the field waveform data using a predefined cost function. An example of Such acoustic modeling codes is described in “Numerical simulation of sector bond log and improved cement bond image.” by Song et al. in Geophysics 77, pp. D95-D104 (July-August 2012). The cost function is used as a convergence tool to decide whether further itera tions are required (step 55). During each iteration 56, the wellbore model is modified within the framework of the
US 2014/0052376 A1
nuclear density solution range. A converged solution may require several iterations, depending greatly on the accuracy of the initial model from step 53. The converged solution provides (56) cement density and thickness vs. depth in the wellbore. Together (optionally) with an amplitude and cement quality map inferred from conventional bond log interpretation and a neutron log interpretation method dis closed in a related application, “Method for cement evalua tion with neutron logs' (U.S. Provisional Patent Application No. 61/664,544) the present inventive method provides an improved cement evaluation indicating cement bond quality, Zone isolation and presence of fluid contaminations and/or fluid-filled channels. The output of the embodiment of the present inventive method illustrated in FIG. 5 will be an updated wellbore model as a function of wellbore depth. Examples of possible output wellbore models at certain depths are, in addition to FIGS. 13 and 14, shown in FIGS. 15 and 16. As described above, FIG. 13 illustrates a wellbore fully cemented casing annulus that has a good bond and provides Zone isolation. FIG. 14 illustrates a wellbore with partially cemented casing annulus and fluid behind the pipe, and therefore Zone isolation is not achievable. FIG. 15 illus trates a wellbore with a fluid filled channel behind the casing. FIG.16 illustrates a wellbore in which a fraction of the casing annulus is filled with fluid contaminated cement. Specifically, the output at step 57 will be a computation of density as a function of radius for different depths in the wellbore. From these density numbers, the interpreter can conclude whether the annular region between the formation rock and the casing is solid cement, fluid contaminated cement, or fluid, and determine the corresponding Volumes and locations of each. The Volumes and locations of channels such as shown in FIGS. 15 and 16 may be computed using the azimuthal geom etry data in the final wellbore model, because the nuclear density and acoustic tools have directional sensitivity. 0040 Thus, the present inventive method is a quantitative analysis method and provides a much more accurate interpre tation of cement quality than traditional cement bond log interpretation which is qualitative and is Subject to individual interpreter's observations. The final output 57 may also include the Sonic amplitudes/attenuation curves, cement impedance curves and maps. Although not needed for a cement bond interpretation 60, the output of the present inventive method may be Supplemented by neutron log results obtained by the method disclosed in the aforementioned com panion patent application entitled “Method forcement evalu ation with neutron logs' (U.S. provisional patent application No. 61/664,544). The neutron log 58 is especially useful when lightweight or foam cement is encountered where both density or acoustic impedance contrasts between cement and fluid become very small. It is standard industry practice to run a CBL tool 59; it would be optional if the present inventive method is being utilized, but it may add some value to the interpretation 60.
EXAMPLES
0041. The present inventive method is tested using an ultrasonic modeling software program that simulates the acoustic waveforms 52. A well with fully cemented casing and free pipe was selected to mock up for the modeling study. Actual acoustic data from the subject well was also obtained. The modeling code essentially predicts the field measure ments that would result in an actual experiment. The modeled and field ultrasonic waveform data are in good agreement as
Feb. 20, 2014
shown in FIGS. 10 and 11, proving that the modeling code works well. For FIG. 10, a fully cemented well with a good cement bond was modeled and also measured experimentally. FIG. 13 shows a wellbore model with a good cement bond that is very similar to the model in the calculation. For FIG. 11, free pipe (no cement at all) was modeled and measured. FIG. 14 shows a wellbore model with fluid behind casing that is not far off the model used in the FIG. 11 calculation. The waveforms in FIGS. 10 and 11 depict the cement bond quality accurately. Good cement bond is characterized by a high rate of attenuation over time as the wave amplitudes decay very fast. Free pipe is characterized by little attenuation as the wave signal rings within the Steel casing and there is very little energy transfer from casing to the fluid behind the casing. 0042. The foregoing application is directed to particular embodiments of the present invention for the purpose of illustrating it. It will be apparent, however, to one skilled in the art, that many modifications and variations to the embodi ments described herein are possible. All such modifications and variations are intended to be within the scope of the present invention, as defined in the appended claims. Persons skilled in the art will readily recognize that in preferred embodiments of the invention, at least some of the steps in the present inventive method are performed on a computer, i.e. the invention may be computer implemented. For example, the entire inversion module (FIG. 5) will be programmed and run on a computer in all practical applications of the present inventive method.
1. A method for evaluating cement quality in a cased well environment using a density logging tool and an acoustic logging tool, comprising:
obtaining density logs from the cased well and extracting from them initial estimates of cement density and thick neSS,
obtaining acoustic logs measured in the cased well; using the initial estimates of cement density and thickness
as an initial medium model, inverting the acoustic logs to infer an updated medium model, wherein the inverting is performed using a computer; and
using the updated medium model to evaluate cement qual ity in the cased well.
2. The method of claim 1, wherein the inversion comprises using a forward-modeling algorithm to predict the acoustic logs with the initial medium model as input data, then com paring the predicted logs to the measured logs and updating the initial medium model to reduce misfit.
3. The method of claim 2, wherein the method is iterative, continuing until the misfit is less than a preselected amount or other stopping condition is reached.
4. The method of claim 1, wherein the cement quality evaluation is based at least partly on cement density and thickness images obtained from the updated medium model.
5. The method of claim 1, wherein the cement quality evaluation includes evaluating cement bond.
6. The method of claim 1, wherein the density logging tool and the acoustic logging tool are adapted to be lowered into a wellbore on a wireline.
7. The method of claim 1, wherein the density tool com prises a gamma ray source and at least one detector.
8. The method of claim 7, wherein the initial estimates of cement density and thickness are obtained by inversion of the density logs, said density logs comprising gamma ray count rates measured by the at least one detector.

US 2014/0052376 A1
9. The method of claim 8, wherein the inversion of the density logs is performed on a computer using an algorithm comprising forward-modeling predicted gamma ray count rates using an assumed density model, comparing the pre dicted count rates to the measured count rates, and updating the assumed density model to reduce misfit.
k k k k k
Feb. 20, 2014