19 Annual Report 2018/ - Fraser Coast Region
136
Annual Report 2018/19 www.frasercoast.qld.gov.au
Transcript of 19 Annual Report 2018/ - Fraser Coast Region

AnnualReport
2018
/19
www.frasercoast.qld.gov.au

2 | Annual Report 2018/19
cont
entsWELCOME 4
Mayor’s Message 6
CEO’s Message 7
Councillors and Executive Leadership Team 8
Snapshot of Region 10
OUR YEAR IN REVIEW 12
STATUTORY INFORMATION 14
Mayor and Councillors 15
Councillor Remuneration and Expenses 15
Council Meeting Attendance 16
Councillor Conduct 16
Corporate Governance 18
Senior Management Remuneration 18
Administrative Action Complaints 18
Beneficial Enterprises 19
Significant Business Activities 19
Competitive Neutrality Complaints 19
Particular Resolutions 19
Overseas Travel 19
Expenditure on Grants to Community Organisations 20
Details of Special Rates and Charges 34
Summary of Concessions for Rates and Charges 34
Changes to Council Tenders 35
Council Registers 35
Internal Audit Function 35
Audit Committee 36
Public Sector Ethics 37
COMMUNITY FINANCIAL REPORT 39
FINANCIAL STATEMENTS 51
Index of Legislative Requirements 112
Glossary of Terms 113
Attachment 1 – Commercial Business Unit report
| 3Annual Report 2018/19

wel
com
e Welcome to the Fraser Coast Regional Council Annual Report for 2018/19.
In this report we provide an overview of our performance in serving the Fraser Coast community and share some of the challenges, our financial performance as well as our aspirations to continuously strive towards our vision of
Our Annual Report provides:
• an overview of our performance in achieving Council’s Corporate Plan while providing a glance into Council’s role in serving our communities; and
• an opportunity to report on various statutory information pertaining to our financial, as well as governance obligations.
4 | Annual Report 2018/19

Performance ReportingEnablers
CORPORATE PLAN 2018-2023
ANNUAL OPERATIONAL PLAN
ANNUAL BUDGET
» Long term financial forecast
» Planning Scheme
» Long term Asset Management Plan
» Annual Report
» Quarterly Operational Plan Progress Reports
» Statutory Reporting
Planning FrameworkTo ensure that Council has a clear understanding of our purpose and how we utilise our resources, we utilise a planning framework that consists of three planning instruments:
1. Corporate Plan that sets out our broad strategic intentions;
2. Annual Operational Plan that sets out the specific works to be undertaken and services to be provided in order to progress the goals and objectives set out in the corporate plan; and
3. Supportive Annual Budget that ensure we have sufficient financial resources.
| 5Annual Report 2018/19

Mayor's message
The 2018/19 year saw Council continue to focus on building better communities by seeking to strike the right balance between carefully managing our finances and delivering the improved services and infrastructure our growing region needs.
Council is determined to ensure we have a strong, resilient and diversified economy and it was pleasing to see green shoots on the local jobs front this year, with announcements of plans for a $60 million munitions factory in Maryborough and an aircraft manufacturing plant at Hervey Bay Airport.
We’re keen to attract more business investment to the Fraser Coast and worked
closely with the companies involved and the Australian and Queensland Governments to bring these projects to fruition.
The Fraser Coast has such a colourful and vibrant cultural life, and Council supports an array of initiatives to ensure the community values its arts, heritage and cultural diversity.
The international touring exhibition Da Vinci Machines and the By The C rock concert each attracted more than 5000 people, while we also opened The Story Bank – a creative hub celebrating the life of Mary Poppins author P.L. Travers and the art of story-telling.
Having a safe, healthy and active community remains a focus for Council, and it was a red-letter day for the region when the gates of the Fraser Coast Sports and Recreation Precinct were thrown open with the completion of the first stage.
Thousands of football, netball and OzTag players now have access to the high quality sporting fields they desperately needed, while the new precinct will also help us attract more major sporting events and entertainment to the region into the future.
Council made its first foray into ‘deliberative democracy’ to develop a 20 year community vision for the Hervey Bay Esplanade, and we continued to support our smaller communities with Council meetings held in Burrum Heads, Tiaro, Aldershot and Teebar.
I am proud of what the Council team achieved in 2018/19, but we know there is more to do. We look forward to working together on your behalf to keep ‘Building Better Communities’ here on the Fraser Coast.
Cr George SeymourMayor
6 | Annual Report 2018/19
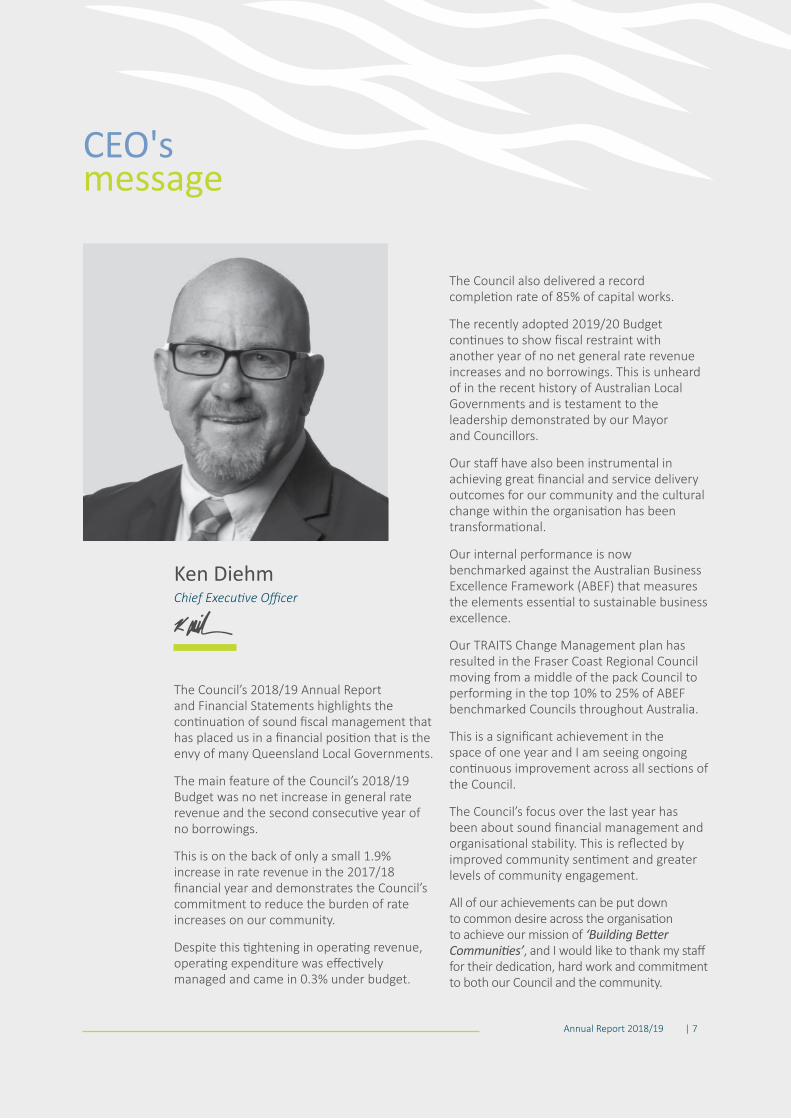
CEO's message
The Council’s 2018/19 Annual Report and Financial Statements highlights the continuation of sound fiscal management that has placed us in a financial position that is the envy of many Queensland Local Governments.
The main feature of the Council’s 2018/19 Budget was no net increase in general rate revenue and the second consecutive year of no borrowings.
This is on the back of only a small 1.9% increase in rate revenue in the 2017/18 financial year and demonstrates the Council’s commitment to reduce the burden of rate increases on our community.
Despite this tightening in operating revenue, operating expenditure was effectively managed and came in 0.3% under budget.
The Council also delivered a record completion rate of 85% of capital works.
The recently adopted 2019/20 Budget continues to show fiscal restraint with another year of no net general rate revenue increases and no borrowings. This is unheard of in the recent history of Australian Local Governments and is testament to the leadership demonstrated by our Mayor and Councillors.
Our staff have also been instrumental in achieving great financial and service delivery outcomes for our community and the cultural change within the organisation has been transformational.
Our internal performance is now benchmarked against the Australian Business Excellence Framework (ABEF) that measures the elements essential to sustainable business excellence.
Our TRAITS Change Management plan has resulted in the Fraser Coast Regional Council moving from a middle of the pack Council to performing in the top 10% to 25% of ABEF benchmarked Councils throughout Australia.
This is a significant achievement in the space of one year and I am seeing ongoing continuous improvement across all sections of the Council.
The Council’s focus over the last year has been about sound financial management and organisational stability. This is reflected by improved community sentiment and greater levels of community engagement.
All of our achievements can be put down to common desire across the organisation to achieve our mission of ‘Building Better Communities’, and I would like to thank my staff for their dedication, hard work and commitment to both our Council and the community.
Ken DiehmChief Executive Officer
| 7Annual Report 2018/19

Councillors and Executive Leadership Team
DIVISION 2 Cr Anne Maddern
HOWARD HERVEY BAY
TIARO
DIVISION 8 Cr Denis Chapman
DIVISION 3 Cr Paul Truscott
MARYBOROUGH
DIVISION 4 Cr Daniel Sanderson
DIVISION 7 Cr Darren Everard
DIVISION 1 Cr James Hansen
DIVISION 6 Cr David Lewis
DIVISION 10 Cr Zane O’Keefe DIVISION 9
Cr Stuart Taylor
DIVISION 5 Cr Rolf Light
Meet our CouncillorsThe Fraser Coast Regional Council is served by eleven Councillors who represent the various divisions within the Fraser Coast.
Councillors are elected for a four-year term and our Councillors were elected on the 19 March 2016 and officially sworn in on the 18 April 2016. Councillor Zane O’Keefe joined our Councillor team in 2018 and was officially sworn in on the 3 August 2018.
Councillors serve various divisions within our Fraser Coast region and provide a valuable platform in representing the community and in promoting a democracy.
8 | Annual Report 2018/19

From left: Mark Vanner Director Wide Bay Water & Waste Services; Gerard Carlyon Director Development and Community; Ken Diehm Chief Executive Officer; Keith Parsons Director Organisational Services; and Davendra Naidu Director Infrastructure Services
Meet our Executive Team Council’s Executive Management Team consists of the Chief Executive Officer and four Directors who provide advice to the local government and ensure the effective management of Council.
The Executive Management Team is responsible for the day to day administration of the Council and also strategically steers the Council toward our vision of building better communities.
Front from left: Cr Daniel Sanderson;
Cr Denis Chapman; Cr Paul Truscott; Mayor
George Seymour; Cr Rolf Light; Cr Anne MaddernBack from left: Cr David
Lewis; Cr James Hansen; Cr Stuart Taylor; Cr Zane O'Keefe; Deputy Mayor
Darren Everard
| 9Annual Report 2018/19

Airports
1 Security controlled with jet capacity
Snapshot of Our Region
Branch Libraries
City Hall
Landfills Transfer Stations
Aquatic Centres
Libraries
Administration Centres
Depots
Public Amenity blocks
Caravan Parks
Playgrounds
Park Structures
Buildings and Community Facilities
1
6
2
8
2
7
100
4
96
500+
400+
2
2 3
10 | Annual Report 2018/19

of roads
Population
105,4632,700km
332km293km
To Bundaberg
To Lady Elliott Island
The
region spans
7,102.9km2
of coastline and foreshore of footpaths and bike lanes(ABS erp 2018 est)
| 11Annual Report 2018/19

Our Year In Review
$167,500
426,527 Library visits
161,200 passengers
PROSPERITYLIFESTYLE
Spent on library area refurbishments
Our airport welcomed over
We hosted eight small community governance
workshops to build capacity and skills within our communities
We celebrated the completion of Stage 1 of
the Fraser Coast Sports and Recreation Precinct worth
$11.8M We welcomed over 2000 sports enthusiasts at the
official opening day
We completed the restoration of the Maryborough Story Bank
heritage site worth
$1.5Mproviding a theatrette, gallery,
workshop and storytelling space
We placed:
12 trainees12 apprentices
1 cadet
12 | Annual Report 2018/19

$53,104,445174,194 tonnes
39,258 Library members
GOVERNANCE NATURALENVIRONMENT
$5.17M Project
spent on Capital Works
Our friendly customer service team received
104,353 calls of materials were received at our waste facilities
59.76%of tonnage was diverted
from landfill
Provided the community with a dedicated Land For Wildlife
Support Officer as part of Council’s Conservation Program
We visited two schools to deliver four mosquito
education sessions
Almost 20km of Fraser Coast sewers were lined as part of a major upgrade of the
wastewater network
$4,086,171 was spent on footpaths
and cycle paths
8,400m of additional pathway was
added to the network
Our facebook page has seen a 30% increase in
likes with over
11,800 likesfrom our community
The top five requests included:
Animals 4466Roads 3732
Compliance 3177Water 2895Parks 2418
BUILTENVIRONMENT
| 13Annual Report 2018/19

Stat
utor
y In
form
atio
nSTATUTORY INFORMATION
14 | Annual Report 2018/19

Mayor and CouncillorsCouncillor Remuneration and ExpensesFraser Coast Mayor and Councillors were remunerated in accordance with the maximum remuneration rates published by the Local Government Remuneration and Discipline Tribunal.
Superannuation contributions were paid at a rate of 12% of a Councillor’s base remuneration.
In accordance with section 186 (a) and 186 (b) of the Local Government Regulation 2012, the total remuneration paid to each Councillor, superannuation contributions and the total expenses incurred by, and the facilities provided to each Councillor under the Expenses Reimbursement and Provision of Facilities for Mayor and Councillors Policy during the financial year are as shown below.
Councillor Remuneration Superannuation Expense TotalCr George Seymour $ 151,814 $ 18,218 $ 26,799 $ 196,831Cr James Hansen $ 87,892 $ 10,547 $ 27,300 $ 125,739Cr Anne Maddern $ 87,892 $ 10,547 $ 13,558 $ 111,997Cr Paul Truscott $ 87,892 $ 10,547 $ 18,465 $ 116,904Cr Daniel Sanderson $ 87,892 $ 10,547 $ 18,300 $ 116,739Cr Rolf Light $ 87,892 $ 10,547 $ 12,115 $ 110,554Cr David Lewis $ 87,892 $ 10,547 $ 13,089 $ 111,528Cr Darren Everard * $ 99,879 $ 11,986 $ 23,321 $ 135,186Cr Denis Chapman $ 87,892 $ 10,547 $ 24,530 $ 122,969Cr Stuart Taylor $ 87,892 $ 10,547 $ 17,294 $ 115,733Cr Zane O’Keefe** $ 77,783 $ 9,334 $ 12,123 $ 99,240Total $1,032,612 $ 123,914 $ 206,894 $1,363,420
*Includes Deputy Mayor Allowance **Councillor O’Keefe was officially sworn in as a Councillor on the 3 August 2018
Expenses were incurred for vehicle usage, conference registrations, accommodation, meals, travel expenses, telecommunication and professional development.
| 15Annual Report 2018/19
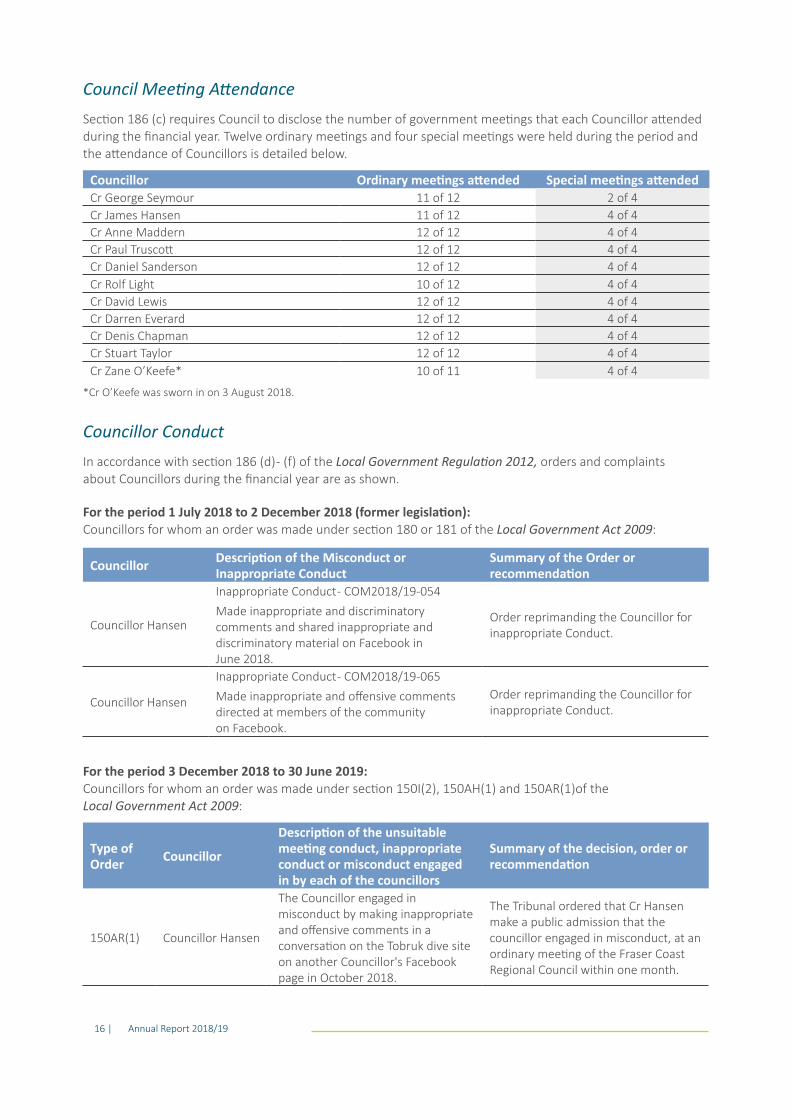
Councillor Conduct In accordance with section 186 (d) - (f) of the Local Government Regulation 2012, orders and complaints about Councillors during the financial year are as shown.
For the period 1 July 2018 to 2 December 2018 (former legislation):Councillors for whom an order was made under section 180 or 181 of the Local Government Act 2009:
Councillor Description of the Misconduct or Inappropriate Conduct
Summary of the Order or recommendation
Councillor Hansen
Inappropriate Conduct - COM2018/19-054 Made inappropriate and discriminatory comments and shared inappropriate and discriminatory material on Facebook in June 2018.
Order reprimanding the Councillor for inappropriate Conduct.
Councillor Hansen
Inappropriate Conduct - COM2018/19-065Made inappropriate and offensive comments directed at members of the community on Facebook.
Order reprimanding the Councillor for inappropriate Conduct.
Councillor Ordinary meetings attended Special meetings attendedCr George Seymour 11 of 12 2 of 4Cr James Hansen 11 of 12 4 of 4Cr Anne Maddern 12 of 12 4 of 4Cr Paul Truscott 12 of 12 4 of 4Cr Daniel Sanderson 12 of 12 4 of 4Cr Rolf Light 10 of 12 4 of 4Cr David Lewis 12 of 12 4 of 4Cr Darren Everard 12 of 12 4 of 4Cr Denis Chapman 12 of 12 4 of 4Cr Stuart Taylor 12 of 12 4 of 4Cr Zane O’Keefe* 10 of 11 4 of 4
Type of Order Councillor
Description of the unsuitable meeting conduct, inappropriate conduct or misconduct engaged in by each of the councillors
Summary of the decision, order or recommendation
150AR(1) Councillor Hansen
The Councillor engaged in misconduct by making inappropriate and offensive comments in a conversation on the Tobruk dive site on another Councillor's Facebook page in October 2018.
The Tribunal ordered that Cr Hansen make a public admission that the councillor engaged in misconduct, at an ordinary meeting of the Fraser Coast Regional Council within one month.
Council Meeting Attendance Section 186 (c) requires Council to disclose the number of government meetings that each Councillor attended during the financial year. Twelve ordinary meetings and four special meetings were held during the period and the attendance of Councillors is detailed below.
*Cr O’Keefe was sworn in on 3 August 2018.
For the period 3 December 2018 to 30 June 2019:Councillors for whom an order was made under section 150I(2), 150AH(1) and 150AR(1)of the Local Government Act 2009:
16 | Annual Report 2018/19

Section and requirement Number
176C(2) Complaints about Councillor conduct or performance for which no action was taken. 3
176C(3)(a)(i) Complaints referred to the department’s Chief Executive about inappropriate conduct by the Mayor or Deputy Mayor. 0
176C(3)(a)(ii) or (b)(i)
Complaints referred to the Mayor about inappropriate conduct by a Councillor other than the Mayor or Deputy Mayor. 4
176C(4)(a) Complaints about misconduct referred to the department's chief executive. 4176C(4)(b) Complaints about misconduct heard by the regional conduct review panel. 0176C(4)(b) Complaints about misconduct heard by the tribunal. 1
176C(5) Complaints assessed by the Chief Executive Officer as being about corrupt conduct under the Crime and Corruption Act. 0
176C(6) Complaints about another matter 0180(2) and (4) Orders and recommendations made about misconduct 0181 Orders made for inappropriate conduct 2
For the period 3 December 2018 to 30 June 2019:
Section and requirement Number
150P(2)(a)Complaints referred to the assessor under section 150P (2)(a) of the Act by the local government; a councillor of the local government and the Chief Executive Officer of the local government.
1
150P(3) Matters, mentioned in section 150P (3) of the Act, notified to the Crime and Corruption Commission. 0
150R(2)Notices given to the assessor when a local government official becomes aware of information indicating a councillor may have engaged in conduct that would be inappropriate conduct or misconduct under section 150R(2) of the Act.
1
150S(2)(a)
Notices given to the assessor under section 150S(2)(a) of the Act when a local government decides under section 150AG to take action to discipline the councillor for inappropriate conduct on three occasions during a period of one year; or the local government has previously made an order that a particular type of conduct engaged in by a councillor will be dealt with as misconduct and reasonably suspects the councillor has engaged in the same type of conduct again.
0
150W (a) Decisions made by the assessor to dismiss the complaint about the conduct under section 150X. 2
150W (b) Decisions made by the assessor to refer the suspected inappropriate conduct to the local government to deal with. 0
150W (d) Decisions made by the assessor to take no further action in relation to the conduct under section 150Y. 3
150AC(3)(a)Referral notices accompanied by a recommendation that the conduct should be referred to another entity for consideration as mentioned in section 150AC (3)(a) of the Act.
0
150AF(4)(a) Occasions information was given by the local government to the assessor under section 150AF (4)(a) of the Act. 0
Chapter 5A, part 3, division 5
Occasions the local government asked another entity to investigate, under chapter 5A, part 3, division 5 of the Act for the local government, the suspected inappropriate conduct of a councillor.
0
150AJ Applications heard by the conduct tribunal about the alleged misconduct of a councillor. 1
150I(2) Orders made by the chairperson under section 150I(2) of the Act 0150AH(1) Orders made by the local government under section 150AH(1) of the Act 0
150AR(1) Decisions, orders and recommendations made by the conduct tribunal under section 150AR(1) of the Act. 1
For the period 1 July 2018 to 2 December 2018 (former legislation):
| 17Annual Report 2018/19
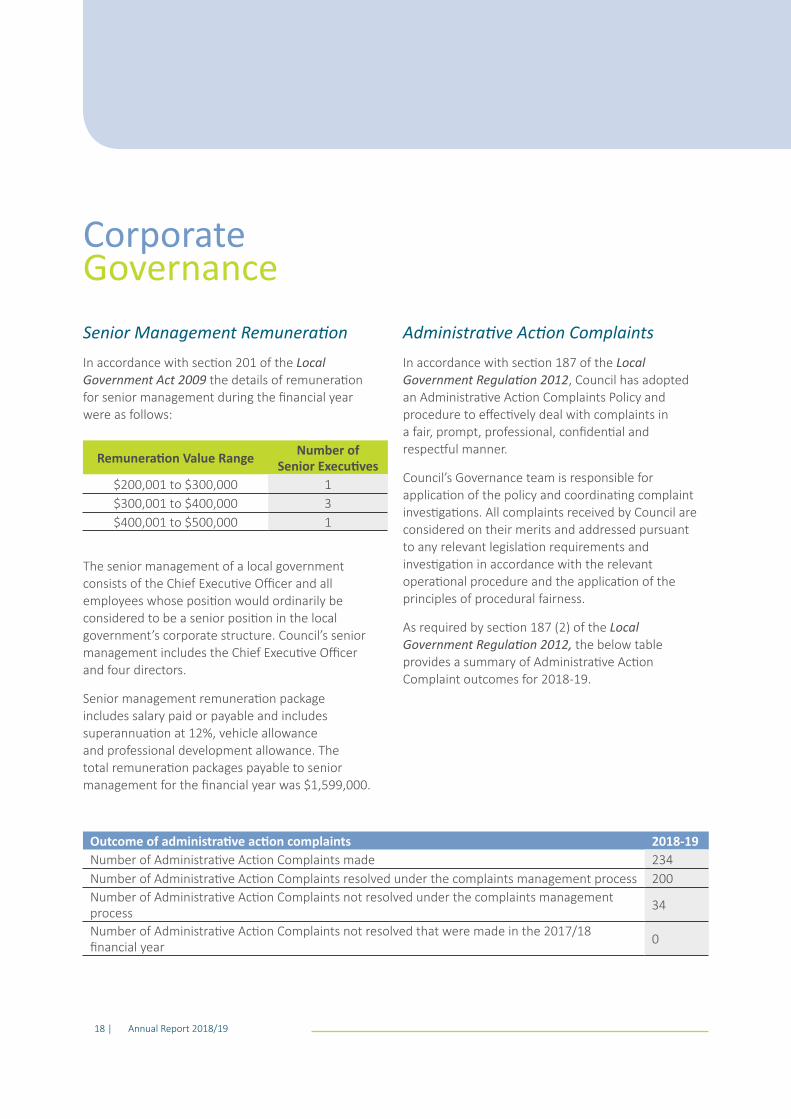
Corporate GovernanceSenior Management Remuneration In accordance with section 201 of the Local Government Act 2009 the details of remuneration for senior management during the financial year were as follows:
Remuneration Value Range Number of Senior Executives
$200,001 to $300,000 1$300,001 to $400,000 3$400,001 to $500,000 1
The senior management of a local government consists of the Chief Executive Officer and all employees whose position would ordinarily be considered to be a senior position in the local government’s corporate structure. Council’s senior management includes the Chief Executive Officer and four directors.
Senior management remuneration package includes salary paid or payable and includes superannuation at 12%, vehicle allowance and professional development allowance. The total remuneration packages payable to senior management for the financial year was $1,599,000.
Outcome of administrative action complaints 2018-19Number of Administrative Action Complaints made 234Number of Administrative Action Complaints resolved under the complaints management process 200Number of Administrative Action Complaints not resolved under the complaints management process 34
Number of Administrative Action Complaints not resolved that were made in the 2017/18 financial year 0
Administrative Action ComplaintsIn accordance with section 187 of the Local Government Regulation 2012, Council has adopted an Administrative Action Complaints Policy and procedure to effectively deal with complaints in a fair, prompt, professional, confidential and respectful manner.
Council’s Governance team is responsible for application of the policy and coordinating complaint investigations. All complaints received by Council are considered on their merits and addressed pursuant to any relevant legislation requirements and investigation in accordance with the relevant operational procedure and the application of the principles of procedural fairness.
As required by section 187 (2) of the Local Government Regulation 2012, the below table provides a summary of Administrative Action Complaint outcomes for 2018-19.
18 | Annual Report 2018/19

Significant Business Activities In accordance with section 45 (a) of the Local Government Act 2009, Council conducted the following business activities during the financial year:• Caravan Park Operations (Scarness, Torquay, Pialba
and Burrum Heads)• Wide Bay Water• Fraser Coast Waste • Fraser Coast Airports• Brolga Theatre
In accordance with section 45 (b), Council identifies the following business activities as significant business activities:• Wide Bay Water• Fraser Coast Waste
In accordance with Section 45 (c) of the Local Government Act 2009, the competitive neutrality principle was applied to both significant business activities. Both activities were conducted in the preceding financial year, pursuant to section 45 (d)
Competitive Neutrality ComplaintsSection 190 (i) and (j) of the Local Government Regulation 2012 require Council to provide a summary of investigation notices for competitive neutrality complaints during the financial year. No competitive neutrality complaints were received during the reporting period.
Particular Resolutions In accordance with section 185 of the Local Government Regulation 2012, Council must advise of particular resolutions made under section 250(1) and section 206(2) of the Local Government Regulation 2012. Council did not make any resolutions during the financial year under section 250 (1) or section 206(2) of the Local Government Regulation 2012.
Overseas TravelIn accordance with section 188 of the Local Government Regulation 2012 the following overseas travel expenses were incurred by Councillors or Council employees in an official capacity during the financial year.
Beneficial Enterprises In accordance with section 41 of the Local Government Act 2009, Council conducted the following beneficial enterprises during the financial year: Fraser Coast Tourism and Events Ltd; and Widelinx Pty Ltd which was deregistered with the Australian Securities & Investment Commission in January 2019.
Councillor/Council Employee
Cost Date Destination Purpose
Mayor George Seymour
$1,745.54
2 – 10 September
2018China - Sichuan
Sister City Visit to build public relations and
tourism and attendance of Sichuan International
Travel Expo
Councillor Paul Truscott
$1,499.80
Chief Executive Officer Ken Diehm
$1,441.26
The flight cost incurred (including flights nationally and internationally, visa cost and travel insurance) was sponsored by the Fraser Coast Tourism and Events Ltd. Other cost incurred such as accommodation and travel cost in Sichuan were sponsored by the Leshan City Council and the Sichuan International Travel Expo Committee.
| 19Annual Report 2018/19

Programme Expenditure
Australia Day $6,836
Anzac Day $9,872
Festive Fraser Coast (Christmas and New Year) $9,750
Community Grants Projects $99,594
Community Grants Events $52,287
Community Grants Environment $2,902
Individual Excellence Sport and STEAM $3,650
Sport and Recreation Capital Assistance Grants $400,084
$584,975
Programme Expenditure
Regional Events Sponsorship 2018-19 (cash) $163,872
Regional Events Sponsorship 2018-19 (in-kind) $88,971
RADF Round 1 $10,505
RADF Fraser Coast Creative $8,770
RADF Round 2 $33,622
Youth Week Grant $10,500
Expenditure on Grants to Community Organisations In accordance with section 189 (a) of the Local Government Regulation 2012, the following table outlines a summary of the funds supplied through community grants:
Outside the Community Grants Program, Council has also supported the following in the financial year:
Councillors’ Discretionary Fund Expenditure
In accordance with section 189(b) of the Local Government Regulation 2012, the annual report for a financial year must contain a summary of expenditure from each Councillor’s discretionary fund, including:• the name of each community organisation to which
an amount was allocated from the fund; and• the amount and purpose of the allocation.
Operational Discretionary funding for community purposes for the financial was: • Total budget $825,000.00• Total amount funded $790,555.62• Total amount spent $789,857.61
20 | Annual Report 2018/19

The following pages include tables summarising the expenditure from each Councillors’ operational discretionary fund:
Project Amount Funded ($)
Amount Spent ($)
Hervey Bay Art Society - to assist with monies towards a new computer system $3,078.70 $3,078.70Margaret Wroe for Friends of Maryborough Cemetery c/- Maryborough District Family History Society Inc.- to assist with monies towards Armistice Day 2018 Poppy Project
$1,040.00 $1,040.00
Yarrilee State School - to assist with monies towards Writing Extension Program $800.00 $800.00Fraser Coast Artslink - to assist with monies towards the Enchanted Evening in the Chinese Garden $1,336.00 $1,336.00
The Maryborough Mural Charitable Trust - monies towards mural of Aboriginal elder Uncle Wilfie $6,000.00 $6,000.00
Cool Country Inc. - to assist with monies towards the purchase of new sound equipment $5,000.00 $5,000.00
Burrum District Community Men's Shed - to assist with monies towards the purchase and installation of a sliding glass door $1,000.00 $1,000.00
Hervey Bay Squash Incorporated - to assist with costs towards Queensland Masters tournament $1,000.00 $1,000.00
Hervey Bay Historical Heritage and Museum - monies towards publishing book $17,651.00 $17,651.00Football Queensland Wide Bay - monies towards the Representative Program to be held for 22 week season $6,000.00 $6,000.00
Hervey Bay Square Dance Club - monies towards event to celebrate clubs 30th Birthday $200.00 $200.00
Maryborough Aboriginal Corporation for Housing and Cultural Development - monies towards the Moonaboola Arts Festival $1,000.00 $1,000.00
Ngabanjah Arts and Cultural Co-operative - to assist with monies for the mural at Stockland's Hervey Bay $2,000.00 $2,000.00
Hervey Bay Australian Football - Bombers - monies towards installing a water bore $5,000.00 $5,000.00Hervey Bay Netball Association - monies towards a shade structure $7,000.00 $7,000.00Maryborough BMX Club Inc. - monies to assist with Open Day in June 2019 $3,274.00 $3,274.00Fraser Coast Artists for Change Inc. – Monies towards the scholarship $5,000.00 $5,000.00Autism Kids Fraser Coast – Monies towards transport costs for resident to attend Sensory Olympics $1,760.00 $1,760.00
St Helens State School P and C Association – Monies towards the School Family Field Day $250.00 $250.00
Community Lifestyle Agency Inc. – Monies towards basic Key Word sign workshops across the Fraser Coast $1,000.00 $1,000.00
Maryborough BMX Club Inc. – monies to assist with septic contractor costs at June Open Bay $350.00 $350.00
Norma House Incorporated – monies towards counselling for clients $1,000.00 $1,000.00Maryborough Eisteddfod Inc. - monies towards the Maryborough Eisteddfod $2,000.00 $2,000.00 $72,739.70 $72,739.70
MAYOR – Cr George Seymour: 2018-19 Allocation - $75,000
| 21Annual Report 2018/19

DIVISION 1 – Cr James Hansen: 2018-19 Allocation - $75,000
Project Amount Funded ($)
Amount Spent ($)
Burrum Recreation Reserve Association Inc. - to assist with monies towards the annual Rodeo and Ute Show 2018 $500.00 $500.00
Maryborough Clay Target Club Inc. - to assist with monies towards creating a multi discipline clay shooting range $1,500.00 $1,500.00
Maryborough City Progress Association Inc. - to assist with monies 4650 Extravaganza $1,000.00 $1,000.00
Maryborough Chamber of Commerce Inc. - to assist with monies toward the City Spirit Street Party $875.00 $875.00
Rockin’ Maryborough Vintage Festival Inc. - to assist with monies towards the Festival and volunteers $500.00 $500.00
Burrum Recreation Reserve Association Inc. - to assist with monies towards the Annual Picnic Races at Torbanlea 2018 $3,000.00 $3,000.00
The Returned Services League of Australia - Burrum District Sub Branch - to assist with monies for Armistice Day $500.00 $500.00
Rotary Club of Maryborough City Inc. - to assist with monies towards the RYDA Program 2019 $5,000.00 $5,000.00
Burrum District Community Men's Shed Inc. - to assist with monies towards a new laptop $832.00 $832.00
The Foodbasket - to assist with monies towards facilities to feed the low income members of community $1,818.00 $1,818.00
Hervey Bay Neighbourhood Centre Inc. - with monies towards Lovebites Respectful Relationships $500.00 $500.00
The Not Forgotten Ones Inc. - to assist with monies to purchase air-conditioning $4,388.00 $4,388.00Maryborough Aboriginal Corporation for Housing and Cultural Development - to assist with monies towards the Moonaboola Arts Festival April 2019 $5,000.00 $5,000.00
Aldershot and District Community Association Inc. – monies for Australia Day celebrations $1,000.00 $1,000.00
The Maryborough Mural Project Charity Trust - monies towards mural 'Peace' $6,000.00 $6,000.00Maryborough State High School P&C - FraserPop 2019 $2,000.00 $2,000.00Tiaro Landcare and Tiaro Field Day - Tiaro Field Day 20 July 2019 $3,000.00 $3,000.00Aldershot Rural Fire Brigade - to assist with the purchase of an All-Terrain Vehicle $20,000.00 $20,000.00Woocoo Historical Society - monies towards Pioneer Day 22 June 2019 $5,000.00 $5,000.00Burrum Coal Discovery Festival - monies towards the Burrum Coal Festival $5,000.00 $5,000.00Maryborough and District Rifle Club Inc. - monies towards reports and repairs to building $3,000.00 $3,000.00
Burrum District Golf Club - monies towards facilities at the Golf Club $2,586.82 $2,586.82Aldershot District Community Association - monies towards purchasing bowling mats, balls, table tennis bats, darts and board $600.00 $600.00
$73,599.82 $73,599.82
DIVISION 2 – Cr Anne Maddern: 2018-19 Allocation - $75,000
Project Amount Funded ($)
Amount Spent ($)
Maaroom Ratepayers and Progress Association Inc. - to assist with the purchase of a gerni 2.4kw high pressure cleaner $598.00 $598.00
Wide Bay District Veteran Golfers Association - To assist with monies towards the carnival $1,000.00 $1,000.00
22 | Annual Report 2018/19

Tinana State School - to assist with monies towards catering for Sustainability Schools Symposium $500.00 $500.00
Maryborough City Whistlestop Inc. - to assist with monies toward training for volunteers $3,500.00 $3,500.00
Maryborough City Progress Association Inc. - to assist with monies 4650 Extravaganza $1,000.00 $1,000.00
Tinnanbar Progress Association - to assist with monies for the installation of an extra flag pole at the memorial site $1,800.00 $1,800.00
Maryborough Chamber of Commerce Inc. - to assist with monies toward the City Spirit Street Party $875.00 $875.00
Rockin’ Maryborough Vintage Festival Inc. - to assist with monies towards the Festival and volunteers $500.00 $500.00
Endeavour Foundation - to assist with the purchase of checker pieces for Disability Action Week $435.60 $435.60
Rotary Club of Maryborough City Inc. - to assist with monies towards the RYDA Program 2019 $5,000.00 $5,000.00
Burrum District Community Men's Shed - to assist with monies towards the purchase of a Wavecom "test and tag" Portable Appliance Tester $798.00 $798.00
Poona Community Progress Association Inc. - to assist with monies to purchase and install CCTV to the Poona Centenary Hall and surrounds $17,143.50 $17,143.50
The Foodbasket - to assist with monies towards facilities to feed the low income members of community $1,818.18 $1,818.18
The Munna Creek Hall and Recreation Association Inc. - to assist with monies to clean after the Munna Creek Country Music Festival $430.00 $430.00
Poona Community Progress Association Inc. - to assist with monies towards the annual Christmas Lights competition $500.00 $500.00
Bauple Progress Association Inc. - monies towards a BBQ for Bauple Community Christmas $250.00 $250.00
Hervey Bay Neighbourhood Centre Inc. - with monies towards Lovebites Respectful Relationships $500.00 $500.00
Maryborough State High School - FraserPop 2019 $1,000.00 $1,000.00Tiaro Landcare and Tiaro Field Day - Tiaro Field Day 20 July 2019 $5,800.00 $5,800.00Sporting Wheelies and Disabled Association - monies towards the purchase of club/beginners sports wheelchairs $4,000.00 $4,000.00
Boonooroo Progress Association Inc. - monies towards air-conditioning in the hall $8,500.00 $8,500.00Burrum District Community Men's Shed - to assist with monies to purchase a Laguna Bobbin Sander $850.00 $850.00
Maryborough city Progress Association Inc. - to assist with monies towards the Christmas Carols Event for Tiaro $3,000.00 $3,000.00
QCWA Burnett Division - monies towards the QCWA State Conference to be held at Brolga Theatre $1,000.00 $1,000.00
Brooweena District Rural Fire Brigade - monies towards new laptop computer $1,135.00 $1,135.00Glenwood Progress Association Inc. - monies towards replacement of signs at entrance to Glenwood $2,331.64 $2,331.64
Tinana State School – to assist with monies towards catering for Sustainability Schools Symposium $500.00 $500.00
Bauple Band Hall Inc. – monies to repair the entry ramp and side hand rails to the Band Hall $5,960.00 $5,960.00
Glenwood Progress Association Inc. – monies towards costs of toilets, bins, first Aid Attendees and fliers for Annual Glenwood Swap Meet $2,602.00 $2,602.00
$73,326.92 $73,326.92
| 23Annual Report 2018/19

DIVISION 3 – Cr Paul Truscott: 2018-19 Allocation - $75,000
Project Amount Funded ($)
Amount Spent ($)
Maryborough Community Kindergarten and Pre-prep Schooling Association Inc. - to assist with the purchase of equipment $6,300.00 $6,300.00
Maryborough Hospital Auxiliary - to assist with the purchase of a Coagucheck machine and equipment for the Rehabilitation Unit $2,816.95 $2,816.95
Maryborough and District Animal Refuge - to assist with monies to provide power to the meeting hub shed and to provide concrete pathway and apron $7,136.36 $7,136.36
Maryborough Aero Club Inc. - to assist with funds towards the event Fraser Coast Wings and Wheels $3,162.27 $3,162.27
Maryborough Clay Target Club Inc. - to assist with monies towards creating a multi discipline clay shooting range $1,500.00 $1,500.00
Maryborough Military Aviation Museum Association Inc. -monies to assist for printing of RAAF Maryborough Wartime Memories 1941 to 1945 and other associated wear
$3,000.00 $3,000.00
Maryborough Special School P & C Association - monies towards the installation of liberty swing in school for children in wheelchairs $1,000.00 $1,000.00
St Helens State School P & C - to assist with monies towards the St Helens School Family Field Day $250.00 $250.00
Maryborough West Football Club - to assist with monies towards the Tombola Event $300.00 $300.00
Maryborough City Progress Association Inc. - to assist with monies 4650 Extravaganza $1,000.00 $1,000.00
Maryborough Community Recreation Centre Inc. - to assist with monies towards a hot water system $3,294.50 $3,294.50
Maryborough Chamber of Commerce - to assist with monies to towards Wi-Fi access for Tech Challenge $1,200.00 $1,200.00
Maryborough Excelsior City Band - to assist with monies to purchase new equipment $3,000.00 $3,000.00
Maryborough Chamber of Commerce Inc. - to assist with monies toward the City Spirit Street Party $875.00 $875.00
Rockin’ Maryborough Vintage Festival Inc. - to assist with monies towards the Festival and volunteers $500.00 $500.00
Aldridge State High School P&C Association - to assist with monies towards transportation for students to attend Kids Alive Do the Five $1,138.50 $1,138.50
Rotary Club of Maryborough City Inc. - to assist with monies towards the RYDA Program 2019 $2,000.00 $2,000.00
The Maryborough Mural Charitable Trust - to assist with monies for mural of Maryborough's Crest and Panels $6,214.34 $6,214.34
The Foodbasket - to assist with monies towards facilities to feed the low income members of community $1,956.58 $1,956.58
The Maryborough and District Committee on the Ageing Inc. - to assist with the purchase of an auto boil unit $2,190.00 $2,190.00
Hervey Bay Neighbourhood Centre Inc. - with monies towards Lovebites Respectful Relationships $500.00 $500.00
Victory Care Services Maryborough - to assist for food relief for families in need this Christmas 2018 $500.00 $500.00
FraserPop Maryborough State High School P&C - to assist with Son of Obiwan Saber Academy advertising July 2019 $3,500.00 $3,500.00
Maryborough State High School P&C - FraserPop 2019 $3,000.00 $3,000.00
24 | Annual Report 2018/19

Tiaro Landcare and Tiaro Field Day - Tiaro Field Day 20 July 2019 $2,000.00 $2,000.00Maryborough Youth and Show Choirs - monies towards the purchase of an iPad to store sheet music $2,077.00 $2,077.00
Maryborough City Church - monies towards Youth Event in Maryborough $3,000.00 $3,000.00RSL Sub Branch Maryborough - 9 RQR Reunion in April $1,027.36 $1,027.36Maryborough Aboriginal Corporation for Housing & Cultural Development - monies towards the Moonaboola Arts Festival $1,000.00 $1,000.00
Maryborough and District Rifle Club Inc. - monies towards reports and repairs to building $4,170.00 $4,170.00
Riverside Christian College - monies towards purchase of shirts for students travelling to Japan $2,000.00 $2,000.00
Butchulla Men's Business Aboriginal Association Inc. - monies towards Rites of Passage $500.00 $500.00
Maryborough City Progress Association Inc. – monies towards Maryborough Street Parties $2,000.00 $2,000.00
St Helens State School P & C – to assist with monies towards the St Helens School Family Field Day $250.00 $250.00
Maryborough City Progress Association Inc. – monies towards advertising costs for sensory Olympics $250.00 $250.00
The Maryborough and District Committee on the Ageing Inc. – monies towards Maryborough’s First Mobility Scooter Convey. $250.00 $250.00
$74,858.86 $74,858.86
| 25Annual Report 2018/19

DIVISION 4 – Cr Daniel Sanderson: 2018-19 Allocation - $75,000
Project Amount Funded ($)
Amount Spent ($)
Maryborough City Progress Association Inc. - to assist with monies 4650 Extravaganza $1,000.00 $1,000.00
Maryborough Chamber of Commerce Inc. - to assist with monies toward the City Spirit Street Party $875.00 $875.00
Rockin’ Maryborough Vintage Festival Inc. - to assist with monies towards the Festival and volunteers $500.00 $500.00
Aldridge State High School P&C Association - to assist with monies towards transportation for students to attend Kids Alive Do the Five $1,138.50 $1,138.50
Rotary Club of Maryborough City Inc. - to assist with monies towards the RYDA Program 2019 $3,000.00 $3,000.00
The Foodbasket - to assist with monies towards facilities to feed the low income members of community $1,818.18 $1,818.18
Hervey Bay Neighbourhood Centre Inc. - with monies towards Lovebites Respectful Relationships $500.00 $500.00
Victory Care Services Maryborough - to assist for food relief for families in need this Christmas 2018 $500.00 $500.00
FraserPop Maryborough State High School P&C - to assist with Son of Obiwan Saber Academy advertising July 2019 $3,500.00 $3,500.00
Maryborough State High School P&C - FraserPop 2019 $2,000.00 $2,000.00RSL Sub Branch Maryborough - 9 RQR Reunion in April $1,000.00 $1,000.00Victory Church Maryborough - monies towards National Youth Week - 5 April 2019 $3,000.00 $3,000.00
Maryborough Chamber of Commerce Steampunk Committee - monies towards Timeless Mary's Tiffin Party event $1,000.00 $1,000.00
Maryborough Eisteddfod Inc. - monies towards the Maryborough Eisteddfod $6,000.00 $6,000.00Maryborough State Schools Under 8s - monies towards attendance to participate at the Under 8s Activity Day $1,200.00 $1,200.00
Rotary Club of Hervey Bay - Fraser Coast Regional Science and Engineering Challenge - monies towards the Fraser Coast Regional Science and Engineering Challenge Event
$2,500.00 $2,500.00
Maryborough Aero Club Inc. – to assist with funds for the Wings Wheels and Warbirds Event. $5,000.00 $5,000.00
Point Lookout Croquet Club – monies to purchase new equipment $3,920.00 $3,920.00Maryborough Chamber of Commerce Steamfesta – monies towards costs for entertainment marketing and promotion for Steamfesta $1,500.00 $1,500.00
Maryborough City Whistle Stop Inc. – monies towards the formulation of a Feasibility Study $6,050.00 $6,050.00
The Maryborough Mural Project Charity Trust – monies towards ‘street and style’ mural $6,000.00 $6,000.00
Football Maryborough – monies towards new mower for Federation Park $7,500.00 $7,500.00Urangan State High School – monies towards U-Can Program $7,500.00 $7,500.00Hervey Bay Orchid Society Inc. – monies towards expenses associated with the Hervey Bay Spring Orchid and Garden Spectacular $500.00 $500.00
Rotary Club of Maryborough – Sunrise – monies for Maryborough Peace Pole public art $2,500.00 $2,500.00
$70,001.68 $70,001.68
26 | Annual Report 2018/19

DIVISION 5 – Cr Rolf Light: 2018-19 Allocation - $75,000
Project Amount Funded ($)
Amount Spent ($)
Toogoom and District RSL Sub-Branch - to assist with monies towards the mural of Vietnam War on the front of the museum $900.00 $900.00
Toogoom and District Community Association Inc. - to assist with monies towards the installation on internal toilets $30,000.00 $30,000.00
Burrum District Community Men's Shed - to assist with monies towards the supply and install of Solar System to the shed at Steley Street Howard $7,344.00 $7,344.00
Burrum District Community Centre Association Inc. - to assist with monies towards the Annual Howard Community Christmas Carnival 2018 $500.00 $500.00
Burrum District Community Centre Association Inc. and Rotary Club of Hervey Bay - to assist with monies towards the Burrum Heads Community Christmas Event
$1,500.00 $1,500.00
Toogoom and District Sub-Branch Inc. - to assist with monies towards BBQ lunch for Vietnam Veterans day 18 August 2018 $400.00 $400.00
The Salvation Army - monies to assist towards community members with school children $1,500.00 $1,500.00
Victory Care Services Maryborough - to assist for food relief for families in need this Christmas 2018 $500.00 $500.00
Returned and Services League of Australia Toogoom - to assist with monies towards damage to museum $2,545.45 $2,545.45
Burrum District Community Centre Association Inc. - relocate security cameras $500.00 $500.00Maryborough Military Aviation Museum Association Inc. - to include an AFC WW1 Exhibit to the Museum $2,000.00 $2,000.00
Older Men Unlimited Hervey Bay Inc. - monies towards kitchen facilities $2,365.50 $2,365.50Toogoom and District Community Association Inc. - monies towards the Toogoom Easter Fair $500.00 $500.00
Toogoom and District Community Association Inc. - to assist with monies toward project Linus $3,164.00 $3,164.00
Burrum Districts RSL Sub Branch - monies towards signage $980.00 $980.00Rotary Club of Hervey Bay - Fraser Coast Regional Science and Engineering Challenge - monies towards the Fraser Coast Regional Science and Engineering Challenge Event
$2,500.00 $2,500.00
Older Men Unlimited Hervey Bay Inc. – monies towards purchase of 2 defibrillators $5,990.00 $5,990.00
Older Men Unlimited Hervey Bay Inc. – monies towards kitchen facilities 3m cupboard with bench top $1,218.83 $1,218.83
Burrum District Community Men’s Shed – monies to install insulation, also flashing and a 3D printer $5,000.00 $5,000.00
Older Men Unlimited Hervey Bay Inc. – monies to purchase four heavy duty Gazebos $727.27 $727.27
Burrum Districts RSL Sub Branch – monies towards a basic security system. $1,350.00 $1,350.00 $71,485.05 $71,485.05
| 27Annual Report 2018/19

DIVISION 6 – Cr David Lewis: 2018-19 Allocation - $75,000
Project Amount Funded ($)
Amount Spent ($)
Fraser Coast Malayalee Association Inc. - to assist with monies towards a cultural event $1,000.00 $1,000.00
Hervey Bay State High School P&C Association - to assist with monies towards Swap and Meet to be held 3 November 2018 $602.00 $602.00
Hervey Bay Neighbourhood Centre - monies to assist the celebrations of the Chinese New Year 2019 $1,800.00 $1,800.00
Maryborough State High School P&C - FraserPop 2019 $1,000.00 $1,000.00Maryborough Aboriginal Corporation for Housing & Cultural Development - to assist with monies towards the Moonaboola Arts Festival April 2019 $5,000.00 $5,000.00
Proud Mary's Association Inc. - monies towards the cost of creating, producing and launching a Mary Register $900.00 $900.00
Fraser Coast Artslink - monies towards the Festival of Youth Arts $10,000.00 $10,000.00Fraser Coast Artslink - monies towards monthly workshops for local youth $6,000.00 $6,000.00Taking Back the Night - C/ Hervey Bay Neighbourhood Centre - monies to assist events and activities $8,000.00 $8,000.00
Zonta Club Of Hervey Bay - to assist with monies towards hosting the Area 2 Meeting $280.00 $280.00
Rotary Club of Hervey Bay City Inc. - to assist with monies towards hosting a Science and Engineering Challenge $1,000.00 $1,000.00
Fraser Coast Artists for Change Inc. – to assist with monies towards the Art Enrichment Program $5,000.00 $5,000.00
Greater Mary Association Inc. – To assist with monies towards banners, corflutes, pump and drone $2,105.00 $2,105.00
Fraser Coast Artists for Change Inc. – monies to assist with Scholarship $5,000.00 $5,000.00Fraser Coast Artslink Inc. – Funds towards Enchanted Evening in the Gardens expenses $5,650.00 $5,650.00
Hervey Bay City Musicians Inc. –funds towards the replacement of light fittings in the Hall $3,600.00 $3,600.00
Hervey Bay touch Association – monies to purchase line markers to prepare for junior State Cup $2,137.04 $2,137.04
Rotary Club of Maryborough – Sunrise – monies for Maryborough Peace Pole public art. $2,500.00 $2,500.00
$61,574.04 $61,574.04
DIVISION 7 – Cr Darren Everard: 2018-19 Allocation - $75,000
Project Amount Funded ($)
Amount Spent ($)
Football Hervey Bay Inc. - to assist with the purchase of a defibrillator $1,995.00 $1,995.00Gems B Grade Basketball Team - to assist with the purchase of new uniforms $350.00 $350.00Wide Bay District Veteran Golfers Association - To assist with monies towards the carnival $1,000.00 $1,000.00
28 | Annual Report 2018/19

Hervey Bay Seagulls Rugby League Football Club Inc. - to assist with monies towards the event to hold Sunshine Coast Falcons Home Game $5,000.00 $5,000.00
CPL Choice Passion Life - to assist with monies towards the Exhibition to assist people with disabilities to actively participate in the Art Affair and Disability Action Week.
$4,283.26 $4,283.26
Hervey Bay Woodcrafts Club Inc. - to assist with monies towards the stormwater connects for shed $1,000.00 $1,000.00
Tinana Football Club Inc. - to assist with monies toward purchasing computers $500.00 $500.00Fraser Coast Malayalee Association Inc. - to assist with monies towards a cultural event $1,000.00 $1,000.00
Hervey Bay Swimming Club Inc. -to assist with monies towards the swimming meet - Wide Bay Swimming Development $1,312.40 $1,312.40
Butchulla Aboriginal Corporation - to assist with monies towards the Butchulla Celebration Day $2,000.00 $2,000.00
Musicians Making a Difference - to assist with monies towards the Hervey Bay Musicians Making a Difference $10,000.00 $10,000.00
Urangan State High School - monies towards the Awards Night Celebrations $200.00 $200.00Down Syndrome Queensland - to assist with monies towards Step Up for Down Syndrome events $600.00 $600.00
The Hervey Bay Neighbourhood Centre - monies towards events leading up to Neighbourhood Day March 2019 $1,500.00 $1,500.00
Poona Community Progress Association Inc. - monies towards replacement of curtains and benchtops Poona Centenary Hall $5,000.00 $5,000.00
Hervey Bay Animal Refuge - to assist with monies towards a Christmas Party for the volunteers $1,000.00 $1,000.00
Hervey Bay Swimming Club - to assist with monies towards Qld Water Polo come and try day $750.00 $750.00
Bundaberg Fraser Coast Branch of Maroon Arm Bowlers - monies towards 2 day event in March and April $1,200.00 $1,200.00
Maryborough Amateur Basketball Association Inc. - monies towards purchase of two portable scoreboards $2,498.00 $2,498.00
Maryborough State High School P&C - FraserPop 2019 $2,000.00 $2,000.00Sporting Wheelies and Disabled Association - monies towards the purchase of club/beginners sports wheelchairs $4,000.00 $4,000.00
Maryborough Aboriginal Corporation for Housing and Cultural Development - monies towards the Moonaboola Arts Festival $5,000.00 $5,000.00
Rally for a Cause Inc. - monies towards Dunga Derby $10,000.00 $10,000.00Football Hervey Bay Inc. - to assist with the purchase of water for fields $2,000.00 $2,000.00Fraser Coast Tourist Radio - monies toward labour and miscellaneous materials $1,200.00 $1,200.00Fraser Coast Anglican College - monies towards Year 12 Formal event $450.00 $450.00Hervey Bay Bowls Club - To assist with monies towards the Men’s Classic Pairs Carnival $1,000.00 $1,000.00
Hervey Bay Archers Inc. - monies towards project for facilities $1,600.00 $1,600.00Fraser Coast Artists for Change Inc. – monies towards gallery exhibition and prizes $1,200.00 $1,200.00
Hervey Bay Sea Scouts – monies towards hiking tents and gates around the Den $3,000.00 $3,000.00Burrum District Active Riders Inc. – monies towards shade sails. $1,200.00 $1,200.00 $73,838.66 $73,838.66
| 29Annual Report 2018/19
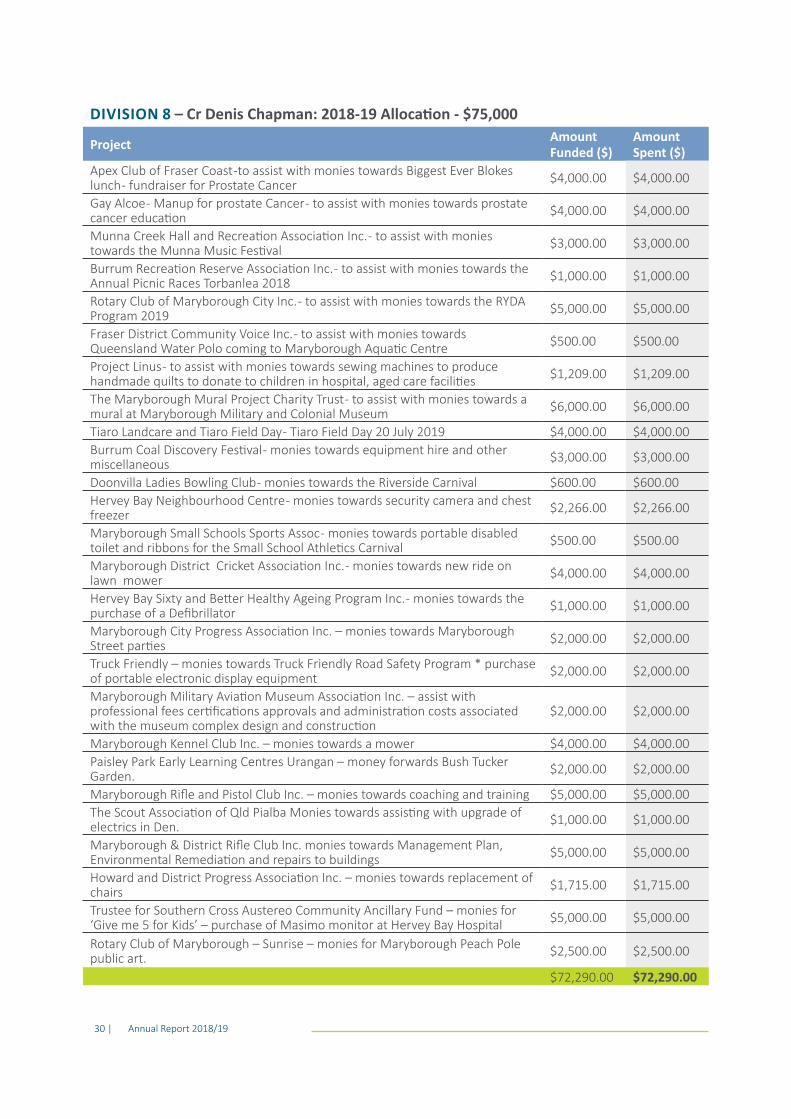
DIVISION 8 – Cr Denis Chapman: 2018-19 Allocation - $75,000
Project Amount Funded ($)
Amount Spent ($)
Apex Club of Fraser Coast -to assist with monies towards Biggest Ever Blokes lunch - fundraiser for Prostate Cancer $4,000.00 $4,000.00
Gay Alcoe - Manup for prostate Cancer - to assist with monies towards prostate cancer education $4,000.00 $4,000.00
Munna Creek Hall and Recreation Association Inc. - to assist with monies towards the Munna Music Festival $3,000.00 $3,000.00
Burrum Recreation Reserve Association Inc. - to assist with monies towards the Annual Picnic Races Torbanlea 2018 $1,000.00 $1,000.00
Rotary Club of Maryborough City Inc. - to assist with monies towards the RYDA Program 2019 $5,000.00 $5,000.00
Fraser District Community Voice Inc. - to assist with monies towards Queensland Water Polo coming to Maryborough Aquatic Centre $500.00 $500.00
Project Linus - to assist with monies towards sewing machines to produce handmade quilts to donate to children in hospital, aged care facilities $1,209.00 $1,209.00
The Maryborough Mural Project Charity Trust - to assist with monies towards a mural at Maryborough Military and Colonial Museum $6,000.00 $6,000.00
Tiaro Landcare and Tiaro Field Day - Tiaro Field Day 20 July 2019 $4,000.00 $4,000.00Burrum Coal Discovery Festival - monies towards equipment hire and other miscellaneous $3,000.00 $3,000.00
Doonvilla Ladies Bowling Club - monies towards the Riverside Carnival $600.00 $600.00Hervey Bay Neighbourhood Centre - monies towards security camera and chest freezer $2,266.00 $2,266.00
Maryborough Small Schools Sports Assoc - monies towards portable disabled toilet and ribbons for the Small School Athletics Carnival $500.00 $500.00
Maryborough District Cricket Association Inc. - monies towards new ride on lawn mower $4,000.00 $4,000.00
Hervey Bay Sixty and Better Healthy Ageing Program Inc. - monies towards the purchase of a Defibrillator $1,000.00 $1,000.00
Maryborough City Progress Association Inc. – monies towards Maryborough Street parties $2,000.00 $2,000.00
Truck Friendly – monies towards Truck Friendly Road Safety Program * purchase of portable electronic display equipment $2,000.00 $2,000.00
Maryborough Military Aviation Museum Association Inc. – assist with professional fees certifications approvals and administration costs associated with the museum complex design and construction
$2,000.00 $2,000.00
Maryborough Kennel Club Inc. – monies towards a mower $4,000.00 $4,000.00Paisley Park Early Learning Centres Urangan – money forwards Bush Tucker Garden. $2,000.00 $2,000.00
Maryborough Rifle and Pistol Club Inc. – monies towards coaching and training $5,000.00 $5,000.00The Scout Association of Qld Pialba Monies towards assisting with upgrade of electrics in Den. $1,000.00 $1,000.00
Maryborough & District Rifle Club Inc. monies towards Management Plan, Environmental Remediation and repairs to buildings $5,000.00 $5,000.00
Howard and District Progress Association Inc. – monies towards replacement of chairs $1,715.00 $1,715.00
Trustee for Southern Cross Austereo Community Ancillary Fund – monies for ‘Give me 5 for Kids’ – purchase of Masimo monitor at Hervey Bay Hospital $5,000.00 $5,000.00
Rotary Club of Maryborough – Sunrise – monies for Maryborough Peach Pole public art. $2,500.00 $2,500.00
$72,290.00 $72,290.00
30 | Annual Report 2018/19

DIVISION 9 – Cr Stuart Taylor: 2018-19 Allocation -$75,000
Project Amount Funded ($)
Amount Spent ($)
Shed Happens - To assist with funds towards Feed the Man Meat community event $2,000.00 $2,000.00
Bay Break Inc. - to assist with monies towards the event Bay Break Multisports Weekend $15,000.00 $15,000.00
Hervey Bay Australian Football and Cricket Club Inc. - to assist with monies to purchase Irrigation pop-up sprinklers and controller $5,000.00 $5,000.00
The Hervey Bay Neighbourhood Centre - monies towards events leading up to Neighbourhood Day March 2019 $1,500.00 $1,500.00
Fraser Coast Regional Council - funds allocated to provide signage for Cooper's Walk $6,974.00 $6,340.00
Fraser Coast Rugby Union Inc. - to assist with monies for sporting equipment and first aid kit $7,700.07 $7,700.07
Hervey Bay Netball Association - monies towards purchase of 8x4 bleachers $18,181.82 $18,181.82Maryborough State High School P&C - FraserPop 2019 $2,000.00 $2,000.00Fraser Coast Malayalee Association Inc. - monies towards Indian Cultural programs $5,950.00 $5,950.00
Fraser Coast Regional Council - funds allocated to provide signage for Parkrun Hervey Bay $2,100.00 $2,035.99
Tribe Multisport – monies towards defibrillator, First Aid Kits, safety flags, communication radios and insurance $6,775.00 $6,775.00
$73,180.89 $72,482.88
| 31Annual Report 2018/19

DIVISION 10 – Cr Zane O'Keefe : 2018-19 Allocation -$75,000
Project Amount Funded ($)
Amount Spent ($)
Hervey Bay Triathlon Club - monies towards purchasing High Vis Vests with Printing and Bucket Hats for Hervey Bay 100 Triathlon $1,860.00 $1,860.00
Maryborough Aboriginal Corporation for Housing and Cultural Development - to assist with monies towards the Moonaboola Arts Festival April 2019 $6,000.00 $6,000.00
Urangan State High School - Leadership workshop $1,500.00 $1,500.00Hervey Bay Athletic Club - monies towards covers for long jump and triple jump $4,500.00 $4,500.00Sporting Wheelies and Disabled Association - monies towards purchase of club/beginner sports wheelchairs $4,000.00 $4,000.00
Riverside Christian College - monies towards students shirts to travel to Japan $1,000.00 $1,000.00Urangan State High School and Other High Schools - monies towards the Urangan High School U-can program $10,000.00 $10,000.00
Urangan State High School - monies towards the Hervey Bay Annual Under 8s Community Event $2,000.00 $2,000.00
Butchulla Men's Business Aboriginal Association Inc. - monies towards Rites of Passage $1,000.00 $1,000.00
Hervey Bay Seafood Inc. - monies towards the Hervey Bay Seafood Festival $8,000.00 $8,000.00The Scout Association of Australia Queensland Branch Inc. - Pialba Scout Group $4,450.00 $4,450.00AFL Wide Bay Inc. - monies towards participants in the AFL Auskick program $1,600.00 $1,600.00Maryborough Eisteddfod Inc. - monies towards the Maryborough Eisteddfod $6,000.00 $6,000.00Bayside Transformations - monies towards Local Drug and Alcohol Residential Recovery Program $5,000.00 $5,000.00
Riverside Christian College - monies towards travel to Normanton for annual Aboriginal Mission trip $4,000.00 $4,000.00
Hervey Bay Men’s Shed Inc. – monies used to pay for a set of engineers drawings for a proposed extension. $2,000.00 $2,000.00
Fraser Coast Artslink Inc. – Funds towards Enchanted Evening in the Gardens expenses $4,250.00 $4,250.00
Hervey Bay Men’s Shed Inc. – monies to buy materials needed to build the carriages that ride on Bogies $4,000.00 $4,000.00
Rotary Club of Maryborough – Sunrise – monies for Maryborough Peach Pole public art $2,500.00 $2,500.00
$73,660.00 $73,660.00
32 | Annual Report 2018/19

Mayor’s Community Benefit Fund
The Mayor’s Community Benefit fund is available to provide assistance or relief to people in the Community.
The objects and purpose for which the fund is established are to:
• respond to needs beneficial to the community;
• assist community organisations and groups in order to pursue charitable purposes and/or other activities beneficial to the community;
• emergency support situations, including essential food items, emergency accommodation and/or repairs for life threatening situations; and
• do anything incidental or helpful to either of the above.
Mayor’s Donations and Sponsorship
Council is required to report on the total donations and sponsorships as outlined below for the financial year:
Donations Received - $0.00 Donations Granted - $2,000
Date Recipient Narrative Amount
04/07/2018 Riverside Christian CollegeSponsorship - Science & Engineering Challenge in Darwin
$500.00
18/07/2018 Manup for Prostate CancerSponsorship - Prostrate Cancer Manup Fundraiser
$200.00
09/08/2018Science Teachers Association of QLD
Sponsorship - Local Schools Queensland Science Contest
$500.00
13/08/2018 Torbanlea State School Sponsorship - Major fund raiser $100.00
23/08/2018 Aldridge State High SchoolSponsorship - "Humanities Award" Annual Awards Night
$100.00
23/08/2018 Urangan State High SchoolSponsorship -"Caltex Best All Rounder" Awards Night
$250.00
12/09/2018 Andrew DeathSponsorship - Ryan Death State School Athletics
$200.00
01/11/2018 Tiaro State SchoolSponsorship - 2018 Awards & Graduation Nights
$100.00
28/11/2018 Bayside Transformations Sponsorship - Christmas Festivities 2018 $300.0029/11/2018 Margaret Wroe Expenses for Poppy Project $96.70
09/01/2019Burrum Heads Amateur Fishing Club Inc.
Sponsorship - Burrum Heads Amateur Fishing Easter Classic 2019
$750.00
10/01/2019 Mansong Qld Inc.Sponsorship - Performance at Australia Day 2019
$500.00
17/01/2019 The Cancer Council QueenslandSponsorship - Raffle and auction prizes for Wide Bay Burnett Fundraiser
$250.00
18/03/2019 Hervey Bay Art SocietySponsorship - Prize for 2019 Annual Members Art Exhibition
$700.00
22/05/2019 Aldridge State High School Sponsorship - Golf Day $300.00
27/05/2019Maryborough Active Riders Club Inc.
Sponsorship - 2019 Fraser Coast Dressage Championships
$200.00
12/06/2019 Natasha StevensonSponsorship - Lucy to attend 24th World Scout Jamboree
$250.00
19/06/2019 The Country RamblersSponsorship - Performances across Aged Care Homes
$250.00
$5,546.70
| 33Annual Report 2018/19

Details of Special Rates and Charges In accordance with section 190(1)(d)(i) of the Local Government Regulation 2012, there was no action taken for, or expenditure on, a service, facility or activity supplied by another local government under an agreement for conducting a joint government activity.
In accordance with section 190(1)(d)(ii) of the Local Government Regulation 2012, a summary of special rates or charges levied by Council during the reporting period is provided below.
Council Rural Fire LevyCouncil Rural Fire Levy on rateable land not included in the Urban Fire Brigade area to raise funds for the purchase and maintenance of buildings, land and/or equipment for the rural brigades. The levy was based on the requirements of the brigades as set out in their budgets and agreed to annually by Council.
Sanitary Conversion ChargeSanitary Conversion Charge on all rateable land in the town of Howard that had an existing nightsoil service as at 30 June 2003, to fund the cost of an alternative sewerage treatment system to those properties.
Kingfisher Parade Toogoom Revetment Seawall LevyA special charge for the purposes of funding the costs to Council for a Kingfisher Parade, Toogoom revetment seawall aimed at protecting private properties and 20 metres of Esplanade on properties within the defined benefited area, charged at different levels according to the degree of benefit to which the owner of the land is deemed to derive.
Summary of Concessions for Rates and ChargesIn accordance with section 190(1)(g) of the Local Government Regulation 2012, a summary of all concessions for rates and charges granted by Council during the reporting period is provided in the following section and table.
In considering the application of concessions under Section 190(1)(g), Council was guided by the principles of:• Equity - having regard to the different levels of
capacity to pay within the local community; • Consistency - the same treatment for ratepayers
receiving concessional rating; and• Transparency - making clear the requirements
necessary to receive concessions.
In accordance with the above principles, Council developed policies in respect of the following:
Concessions for pensioners Council accepted certain classes of pensioners had contributed rates over a period of time and/or are restricted by a fixed income and should be afforded a concession in respect of rates and charges.
Community Groups ConcessionCouncil recognises there were organisations which operate for the general benefit of the community with limited financial resources including schools, churches, welfare, youth organisations, emergency services, aged care and sporting organisations.
Conservation Areas ConcessionA rebate was considered for conservation areas in which Council provides a concession to responsible land owners who are responding to the growing impacts of climate change by preserving, restoring and protecting the natural environment.
34 | Annual Report 2018/19

Local Heritage Register ConcessionCouncil has also committed to providing assistance for the preservation, restoration and maintenance of properties of local heritage significance. These properties receive a Local Heritage Register Rebate.
Changes to Council TendersIn accordance with section 190 (e) of the Local Government Regulation 2012, Council advises that there were no changes to tenders under section 228(7) of the Local Government Regulation 2012 during the financial year.
Council Registers In accordance with section 190 (f) of the Local Government Regulation 2012, Council kept the following registers:
• Register of Beneficial Enterprises• Register of Business Activities to which Competitive
Neutrality Principles Apply• Register of Contracts • Register of Cost-recovery Fees on Council • Register of Interests of a Councillor and their
Related Persons • Register of Interests for CEO and Senior Executive
Employees • Register of Delegations - Council to CEO and
CEO to Officers and/or Contractors • Register of Local Laws • Register of Roads
• Register of Assets • Testable Backflow Prevention Devices Register• Infrastructure Charges Register
Internal Audit FunctionThe internal audit function is established under section 105 (1) of the Local Government Act 2009 and is an integral component of Council’s corporate governance framework.
The Internal Audit Unit operates in accordance with the Internal Audit Policy and Charter, which is endorsed by the Audit Committee each year. The Charter sets out the mandate, roles and responsibilities of the internal audit function. The key role of the internal audit function is to assist Council, the Audit Committee, the Chief Executive Officer and other levels of Management, to properly discharge their responsibilities and achieve sound managerial control over all Council activities.
Audits provide independent advice and assurance to Council and management that policies, operations, systems and procedures meet appropriate standards of accountability, regulatory compliance, effectiveness, efficiency and propriety.
In accordance with section 190 (1) (h) of the Local Government Regulation 2012, audits and other activities undertaken during the financial year included:
• Internal audit reviews: » Rates and Charges Framework » Payroll » Cyber Security » Arboriculture Operations » Workplace Health and Safety
• Audit Committee preparation, facilitation and assistance
• Consulting, advice, assistance and presentations• Internal Audit planning• Management of Audit Actions Register
Type of Concession Concessions granted
Pensioner Concession $2,305,208.17Other concessions including Community Groups, Conservation Areas and Local Heritage Register $854,466.05
$3, 159, 674.22
| 35Annual Report 2018/19

Audit Committee The Audit Committee operates independently of management and plays a key role in assisting Council to discharge its responsibilities for the efficient, effective, economical, and ethical use of ratepayer’s resources. The Committee does this by providing independent oversight of the Council’s governance and internal control frameworks, financial reporting, and compliance with relevant legislation.
It is required by Local Government Regulation 211(1) (b) to examine:
• the internal audit plan for each financial year;• reports of internal audit activity including any
recommendations in the report and the actions to which the recommendations relate;
• a draft of the local government’s financial statements before the statements are certified and given to the auditor-general; and
• the auditor-general’s audit report and auditor-general’s observation report about the local government’s financial statements for the preceding financial year.
MeetingsIn the period 1 July 2018 to 30 June 2019, the Audit Committee formally met on four occasions.
Member attendance at meetings was as follows:
The meetings are open to interested Councillors and are attended by a range of staff.
Attendee Meetings attended
Possible Meetings
Cr David Lewis 4 4Cr James Hansen 0 3Cr Paul Truscott 1 1Mr Michael Parkinson 3 4Mr Ron Richards* 2 2Ms Alison D’Costa 4 4Mr David Lee** 2 2
* Mr Richards term of appointment finished in November 2018 ** Mr Lee was appointed to the Committee in November 2018
36 | Annual Report 2018/19
Public Sector Ethics
In accordance with section 23 of the Public Sector Ethics Act 1994, Council must include an implementation statement giving details pertaining to the actions taken to prepare employees in regard to the code of conduct, our education, training, procedures and practices of public sector entities.
Below information pertaining to Council’s actions taken:
Employees’ Code of Conduct Fraser Coast Regional Council employees work under the principles and ethics of a Code of Conduct which outlines the four ethics values in accordance with the Public Sector Ethics Act 1994 which requires employees within the public service to have:
• Integrity and impartiality;• Promoting the public good;• Commitment to the system of government; and • Accountability and transparency.
Education and TrainingDuring the period 1 July 2018 to 30 June 2019 Fraser Coast Regional Council employees were provided with various education and training programmes, which included but are not limited to: • training on the Code of Conduct during induction
of new employees as well as refresher courses available for existing employees; and
• an online learning portal providing learning on a range of skills development such work health and safety and the management of record systems.
Procedures and Practices of Public Sector EntitiesFraser Coast Regional Council administrative procedures and management practices have due regard to the Public Sector Ethics Act 1994 and the Code of Conduct when considering best practice policies, procedures and guidelines which outline and support the ethics obligations of employees in the public sector.
| 37Annual Report 2018/19


COMMUNITY FINANCIAL REPORT
Com
mun
ity Fi
nanc
ial R
epor
t The Community Financial Report is a plain English summary of Council’s financial statements prepared in accordance with Section 179 of the Local Government Regulation 2012.
| 39Annual Report 2018/19

About your Council’s End of Year Financial Statements
What you will find in the financial statementsThe audited financial statements of Council set out the financial performance, financial position, cash flows and the net wealth of Council for the financial year ended 30 June 2019.
About the management certificateThe financial statements must be certified by both the Mayor and the Chief Executive Officer as presenting fairly Council’s financial results for the year, and are required to be adopted by Council, ensuring both responsibility for and ownership of the financial statements by management and elected representatives.
About the financial statementsThe financial statements incorporate four primary financial statements and accompanying notes. The statements assist in providing a high level picture of Council finances for the 2018/19 year. In addition, there are three ratios which must be reported by all local governments, for both the current year and a forecast for the next ten financial years. These ratios are measures of financial sustainability and the calculations are required to be audited.
1. A Statement of Comprehensive Income A summary of Council’s financial performance for the year, listing both regular income and expenses and other comprehensive income which records items such as changes in the fair values of Council’s assets and investments.
2. A Statement of Financial Position This is a snapshot of Council’s financial position as at 30 June 2019 which includes its assets and liabilities.
3. A Statement of Changes in Equity The overall change for the year (in dollars) of Council’s net worth.
4. A Statement of Cash Flows Indicates where Council’s cash came from and where it was spent.
5. Notes to the Financial Statements Provides greater detail to the four primary financial statements which is referenced by line numbers.
6. Financial Sustainability Statements Special purpose statements reporting three financial sustainability measures: operating surplus ratio, asset sustainability ratio and net financial liabilities ratio as required by the Local Government Regulation 2012 and the Financial Management Sustainability Guideline 2013.
About the auditor’s reportCouncil’s financial statements are required to be audited by the Queensland Audit Office. The audits of many Queensland councils are contracted to audit firms that specialise in Local Government. The auditor provides an audit report which gives an opinion on whether the financial statements present fairly Council’s financial performance and position.
40 | Annual Report 2018/19

The purpose and relationship between the four key financial statements is set out in the diagram below.
Statement of Comprehensive Income 2019 2018 Purpose$'000 $'000
Shows the extent to which communityequity has been increased or decreased, showing all revenue earned and expenses incurred for the financial year.
Total income 274,737 270,339Total expenses (231,104) (233,791)Net result for year 43,633 36,548Other comprehensive income 15,801 86,636Total comprehensive income for year 59,434 123,184
Statement of Changes in Equity 2019 2018 Purpose$'000 $'000
Shows the movement in total community equity (what the Council is worth) as at 30 June 2019.
Opening balance 2,525,984 2,402,800Net result for year 43,633 36,548Asset revaluations 15,801 88,225Other movements 0 (1,589)Total community equity at end of year 2,585,418 2,525,984
Statement of Cash Flows 2019 2018 Purpose$'000 $'000
Shows the nature and amount of Council's cash inflows and outflows from all activities. At 30 June 2019, Council had $73.17 million in cash, in addition it had a further $141.70 million invested in term deposits greater than 3 months. Total cash and investments was $214.87 million, up from $214.54 million at 30 June 2018.
Operating activities 79,863 69,542Investing activities (11,055) (248,957)Financing activities (17,167) (16,333)Net increase (decrease) in cash held 51,641 (195,748)Cash at beginning of the year 21,533 217,281Cash at end of the year 73,174 21,533
Statement of Financial Position 2019 2018 Purpose$'000 $'000
Shows the assets and liabilities whichmake up the community equity as at30 June 2019.
Cash and cash equivalents 73,174 21,533Cash investments 141,700 193,006Other current assets 37,127 42,167Non-current assets 2,477,245 2,423,872Total assets 2,729,246 2,680,578Current liabilities 53,954 47,486Non-current liabilities 89,874 107,108Total liabilities 143,828 154,594Net community assets 2,585,418 2,525,984Asset revaluation surplus 651,526 635,725Capital and retained surplus 1,933,892 1,890,259Total community equity 2,585,418 2,525,984
| 41Annual Report 2018/19

An Overview of this Year’s Financial Result and Financial Position
Council’s Statement of Comprehensive Income (Profit & Loss) Revenue (in) less expenses (out) = Net result for the yearThe statement of comprehensive income includes ordinary revenues and expenses from the operating activities of Council and capital income and expenditure.
Capital income and expenditure is money received or spent on assets and infrastructure items such as parks, roads, drains, coastal walls, water and sewerage infrastructure, land, buildings and plant and equipment. Capital income is usually sourced from grants, subsidies and developers contributions.
Operating expenditures are those required to run the day to day operations of Council, such as wages, maintenance costs, materials, depreciation and finance costs.
The statement of comprehensive income also shows other comprehensive income which includes increases to Council’s asset revaluation surplus.
Council’s operating position reflects its ability to meet its day to day running costs from operating revenue. This includes the ability to fully fund the depreciation of assets.
Council’s operating position is a surplus for the period ended 30 June 2019 of $6.82 million, compared to the 30 June 2018 surplus of $8.91 million.
Council’s result at a glance
2019$‘000
2018$‘000
Operating revenueOperating expenditure
211,417204,595
208,298199,388
Net result before capital revenue 6,822 8,910Capital revenue 63,320 62,041Capital expenses 26,509 34,403Net result 43,633 36,548
42 | Annual Report 2018/19

Council’s operating revenue at a glance
2019$‘000
2018$‘000
Rates, levies and charges 167,335 164,148Fees and charges 20,308 19,877Interest revenue 7,882 7,607Operating grants and subsidies 9,051 8,358Other income 6,841 8,308Total operating revenue 211,417 208,298
RevenueFraser Coast Regional Council aims to raise money in order to maintain the delivery of services during the current and future years.
Council’s main source of revenue is rates and charges, which totalled $167.34 million or 79% of Council operating revenue for the financial year.
The major sources of rates income include general rates, water access charges, water consumption charges and waste and sewerage disposal charges.
79% Rates, levies and charges10% Fees and charges4% Grants and subsidies4% Interest revenue3% Other
Where did the money come from?Council Operating Revenue
79%
10%
4%4%
3%
| 43Annual Report 2018/19
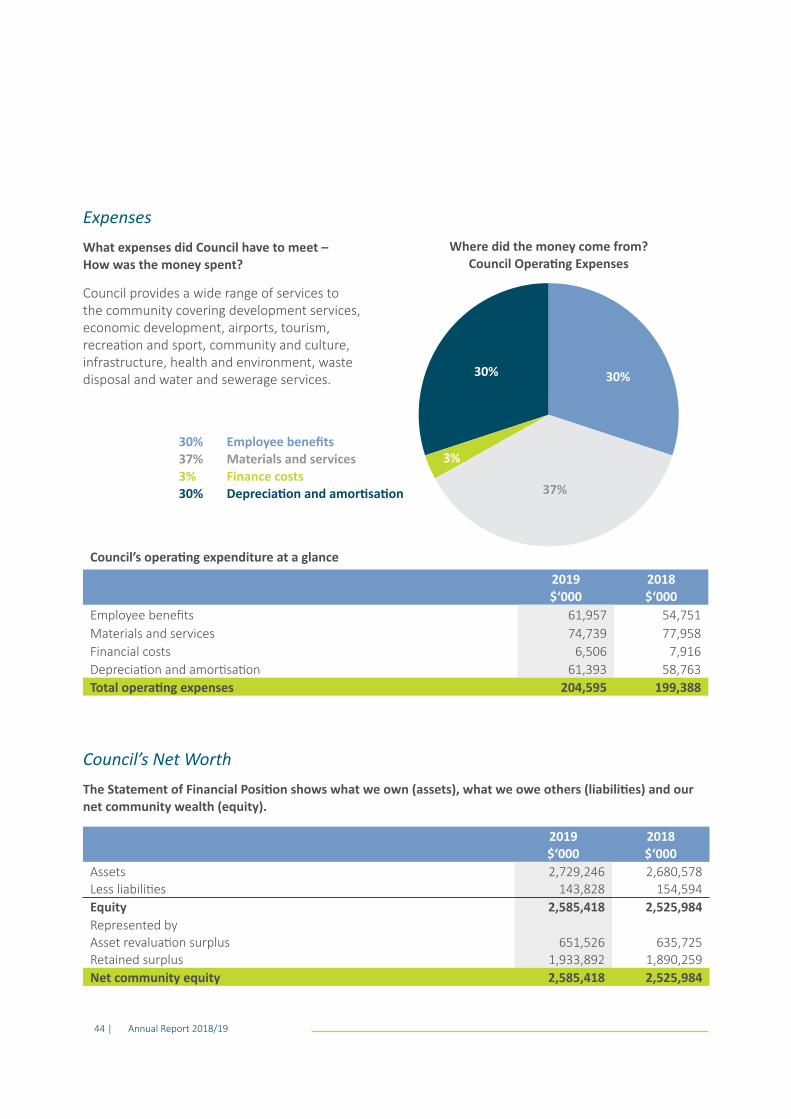
ExpensesWhat expenses did Council have to meet – How was the money spent?
Council provides a wide range of services to the community covering development services, economic development, airports, tourism, recreation and sport, community and culture, infrastructure, health and environment, waste disposal and water and sewerage services.
Council’s Net WorthThe Statement of Financial Position shows what we own (assets), what we owe others (liabilities) and our net community wealth (equity).
Council’s operating expenditure at a glance
2019$‘000
2018$‘000
Employee benefits 61,957 54,751Materials and services 74,739 77,958Financial costs 6,506 7,916Depreciation and amortisation 61,393 58,763Total operating expenses 204,595 199,388
2019$‘000
2018$‘000
Assets Less liabilities
2,729,246143,828
2,680,578154,594
Equity 2,585,418 2,525,984Represented by Asset revaluation surplus Retained surplus
651,5261,933,892
635,7251,890,259
Net community equity 2,585,418 2,525,984
30% Employee benefits37% Materials and services3% Finance costs30% Depreciation and amortisation
Where did the money come from?Council Operating Expenses
30%30%
37%
3%
44 | Annual Report 2018/19

AssetsNew infrastructure is acquired through Council investment and contributions by developers. Council takes ownership and responsibility for replacement of community assets built by developers on completion of the development. These include roads, drainage, water and sewerage infrastructure and parklands. The value of community assets (property, plant and equipment) has increased by about $53.8 million due to the construction of Council’s infrastructure assets (Roads, Drainage, Water and Sewerage) and an increase in the assessed value of its assets following a review of the valuation of Council land assets and a condition assessment on Council’s bridge network.
In addition, Council holds other short term assets including cash assets held in bank accounts and investments of $214.87 million (2018 $214.54 million). During the 2018/19 financial year, in order to maximise investment returns, Council had invested over $141.7 million in term deposits greater than 3 months. The cash reserves include funds Council is required to put aside for future projects such as replacement of roads, stormwater drainage, water and sewerage systems, in addition to funds raised for specific purposes (environment and disaster management).
LiabilitiesCouncil’s largest liability is its interest bearing loans with Queensland Treasury Corporation (QTC), which at 30 June 2019 was $90.01 million (2018 $107.18 million).
Council undertakes a loan borrowing program to fund new major facilities that are constructed to service community needs. In the current financial year, Council did not borrow any money, but repaid $17.17 million. For the first time in the history of the Fraser Coast Regional Council, debt is lower than it was immediately prior to the council amalgamations in 2008. Affordability indicators show that Council continues to be able to service its debt position.
EquityThis represents the net value of total community assets, i.e. what our community owns. Part of equity includes the cash held by Council, of which there are both external and internal restrictions on some of the cash it holds (e.g. developer contributions and grants and subsidies for future capital and other works).
Capital Works (Investment in Community Infrastructure)Total gross capital additions to Council’s non-current assets during the period totalled $128.72 million (2018 $105.06 million). The majority of these were a result of the construction of new assets, funded from surplus funds, grants, subsidies and cash reserves.
1% Land12% Buildings and improvements9% Plant and equipment52% Road and drainage network10% Water Infrastructure15% Sewerage infrastructure1% Other
Council Capital Additions at Cost
52%
10%
15%
9%
1%1%
12%
| 45Annual Report 2018/19

Financial Sustainability Measures
The financial sustainability of councils is now a cornerstone of the Local Government Act and a core responsibility of individual councils across Queensland.
Financial sustainability is defined as when a “Local Government is able to maintain its financial capital and infrastructure capital over the long term” [source: Financial Management (Sustainability) Guideline 2013].
There are three financial sustainability indicators (in accordance with the Local Government Regulation 2012 and the Financial Management Sustainability Guideline 2013 that Council must prepare (calculations of which are required to be audited along with the financial statements).
The results are shown below:
Financial sustainability indicator How the measure is calculated Target 2019 2018
Operating surplus ratioNet result (excluding capital items) divided by total operating revenue (excluding capital items)
0%-10% 3.23% 4.28%
Asset sustainability ratioCapital expenditure on the replacement of assets (renewals) divided by depreciation expense
Greater than 90%
96.68% 71.86%
Net financial liabilities ratioTotal liabilities less current assets divided by total operating revenue (excluding capital items)
Less than +60%
(51.17%) (50.35%)
The three financial sustainability indicator ratios can be explained as follows:
• Operating surplus ratio – indicates the extent to which revenues raised by Council (rates, fees and charges) cover operational expenses (employee, materials and services costs, depreciation and loan interest payments), which is then available for capital funding or other purposes.
• Asset sustainability ratio - is an approximation of the extent to which the infrastructure assets
managed by a local government (roads, drainage, water and sewerage assets) are being replaced as they reach the end of their useful lives, so as not to create a burden on future ratepayers to have to replace assets in poor condition.
• Net financial liabilities ratio - indicates the extent to which the net financial liabilities (mostly loan borrowings) of Council can be covered by its operating revenues (rates, fees and charges).
46 | Annual Report 2018/19

Council Performance Indicator How the measure is calculated Target 2019 2018
Current ratioCurrent assets divided by current liabilities
Greater than 1:1
4.67:1 5.41:1
Council Performance IndicatorIn addition to the statutory ratios, Council also utilises a liquidity ratio (current ratio) to assist in better understanding its long-term sustainability and demonstrating Council’s ability to meet its payment obligations as they fall due.
| 47Annual Report 2018/19

Financial Management Strategy
Fraser Coast Regional Council is continuing its commitment to advance its forward financial planning processes. Council has developed a strategic Long Term Financial Plan (LTFP) which defines the high level financial policies, commitments and parameters that guide the development of service levels, rating and other income, expenditure and treasury management decisions.
The strategic Long Term Financial Plan is a ten year rolling plan adopted each year with the annual budget.
The key objective of the strategic Long Term Financial Plan is:
“To ensure that Council is financially sustainable in the short, medium and long term”
Council is focused on delivering a strategic Long Term Financial Plan that focuses on the long term financial sustainability of the region, as well as consideration of the needs of the community with regards to the delivery of services and facilities. All financial decisions are made in the context of long term financial sustainability, ensuring that the region remains prosperous into the future. They are guided by corporate polices, strategies and principles of effective financial management.
Funding decisions are made having regard to intergenerational equity, so that those enjoying the benefit of assets and services provided by Council contribute to the funding of those assets and services. Assets and services that are consumed in the short term should also not place a financial burden on future generations.
Further enhancement and integration of the Long Term Financial Plan and Asset Management Plans, will assist Council in meeting its strategic objectives through the delivery of efficient and effective essential community services and the provision of key infrastructure that meets community expectations.
To ensure the robustness of the Long Term Financial Plan, Council is focused on addressing the following strategic issues:
Asset Management and infrastructure investment• Refine a fully integrated LTFP that incorporates the
elements of financial sustainability and integrates with Asset Management Plans;
• Commit to a forward funding strategy that underpins the LTFP;
• Prioritising and a focus on asset renewal and replacement rather than new assets, taking into consideration future life cycle costs before investing in new infrastructure;
• Fund all capital renewals and replacements from operating cash flows and borrow only for new or upgrade capital projects with priority on assets that will provide a return whilst keeping borrowings within reasonable debt limits;
• Surplus funds directed to infrastructure investment or loan repayments;
• Undertake review of desired levels of services to ensure balance between community expectations and the region’s capacity to pay.
48 | Annual Report 2018/19
Funding strategy • Review level of service provision to the community
in line with funding strategies;
• Deliver balanced or surplus operating position with affordable rate rises;
• Meet Council’s strategic objectives through delivery of efficient and effective essential community services and provision of key infrastructure to meet community expectations;
• Ensure LTFP remains financially sustainable in the delivery of core functions and services;
• Commit to reviewing and setting fees and charges based on underlying cost of providing services and on principle of full cost recovery;
• Investigate alternative revenue stream opportunities;
• Commit to intensive continuous improvement program and service level review to identify efficiency and productivity gains;
• Regularly review the organisational structure to align resources with service delivery priorities.
| 49Annual Report 2018/19


FINANCIAL STATEMENTS
Fina
ncia
l St
atem
ents
| 51Annual Report 2018/19

2 3 4 5 6 7 8 9 # # # # # # # # # # # # # # # # # # # # # # # # # # # # # # # # # # # # # # # # # # # # # # # # # # # # # # # # # # #
Fraser Coast Regional Council
General purpose financial statementsfor the year ended 30 June 2019
Contents
1. Primary financial statements:
- Statement of Comprehensive Income- Statement of Financial Position- Statement of Changes in Equity- Statement of Cash Flows
2. Notes to the financial statements
3. Management Certificate
4. Independent Auditor's report
Overview
(i)
(ii) All figures presented in these financial statements are presented in Australian currency.
(iii)
Page
5455
53
56
These financial statements are general purpose financial statements and cover the operations for Fraser
Coast Regional Council.
These financial statements were authorised for issue by Council on 14 October 2019.
101
57
100
52 | Annual Report 2018/19

Fraser Coast Regional Council
Statement of Comprehensive Incomefor the year ended 30 June 2019
IncomeRevenueRecurrent revenueRates, levies and chargesFees and chargesRental incomeInterest revenueSales revenueOther incomeGrants, subsidies, contributions and donationsTotal recurrent revenue
Capital revenueGrants, subsidies, contributions and donationsOther capital income
Total capital revenue
Total income
ExpensesRecurrent expensesEmployee benefitsMaterials and servicesFinance costsDepreciation and amortisationTotal recurrent expenses
Capital expenses
Total expenses
Net result
Other comprehensive income for the year
Increase in asset revaluation surplus
Total other comprehensive income for the year
Total comprehensive income for the year
Items that will not be reclassified subsequently to net result
16,360
123,184
4,029
3(d)
3(a)
Note
3(b)
3(c)
2018
19,877
1,035
7,882
20,308
1,107
7,607
2,376
167,335 164,148
$'000$'0002019
270,339
43,633
199,388
The above statement should be read in conjunction with the accompanying notes and significant accounting policies.
62,041
86,636
59,434
15,801
54,75161,957
77,958
6,506 7,916
58,763
36,548
3,244
45,681
211,417
63,320
58,541
208,298
3,358
8,3589,051
34,403
233,791
9
7
6
4(a)
5
8
4(b)
231,104
10
274,737
74,739
204,595
15,801
4,779
61,393
26,509
19 86,636
| 53Annual Report 2018/19

Fraser Coast Regional Council
Statement of Financial Position as at 30 June 2019
AssetsCurrent assetsCash and cash equivalentsInvestmentsTrade and other receivablesInventories
Total current assets
Non-current assetsTrade and other receivablesLand held for development and resaleProperty, plant and equipmentIntangible assetsBiological assets
Total non-current assetsTotal assets
LiabilitiesCurrent liabilitiesTrade and other payablesBorrowingsProvisionsOther liabilities
Total current liabilities
Non-current liabilitiesBorrowingsProvisions
Total non-current liabilities
Total liabilities
Net community assets
Community equityAsset revaluation surplusRetained surplus
Total community equity
The above statement should be read in conjunction with the accompanying notes and significant accounting policies.
$'000 $'000
1,382
73,174
2019
770
252,001
4,229 5,518
1,735
2018
1,193
2,680,578
2,423,872
5,307
17,382
23,604
785 740
2,729,246
26,685
4,43318
17
16
17
15
19
16
3,301
2,477,245
17,016
1,062
2,467,868
1,890,259
635,725
2,525,984
47,48653,954
5,820
2,585,418
143,828
89,874
1,933,892
2,585,418
651,526
89,79872,997
16,877 17,310
2,525,984
107,108
154,594
2,414,068
193,006
21,533
40,785
2,776
256,706
35,392
141,70011(b)
Notes
11(a)
12
12
14
13
54 | Annual Report 2018/19

Fraser Coast Regional Council
Statement of Changes in Equityfor the year ended 30 June 2019
Balance as at 1 July 2018Net result
Other comprehensive income - increase in asset revaluation surplus
Total comprehensive income
Balance as at 30 June 2019
Balance as at 1 July 2017Net result
Other comprehensive incomeIncrease in asset revaluation surplus- Impairment (loss) reversal relating to PP&E
Total comprehensive income
Balance as at 30 June 2018
36,548
43,633
1,890,259 2,525,984
86,636 36,548
635,725
123,184
-14 (1,589) (1,589)
19 88,225 -
15,801 43,633
$'000
Note
2019
-19
43,633
Totalequity
$'000 $'000
Assetrevaluation
surplussurplusRetained
88,225
2,525,984
651,526 1,933,892
36,548
2018
549,089 1,853,711
-
635,725 1,890,259
15,801 15,801
The above statement should be read in conjunction with the accompanying notes and significant accounting policies.
2,402,800
2,585,418
-
59,434
| 55Annual Report 2018/19

Fraser Coast Regional Council
Statement of Cash Flowsfor the year ended 30 June 2019
Cash flows from operating activities
Receipts from customersPayments to suppliers and employees
Investment and interest revenue receivedRental incomeNon-capital grants and contributionsOther incomeBorrowing costs
Net cash inflows from operating activities
Cash flows from investing activities
Proceeds from sale of land held for resaleProceeds from sale of property, plant and equipmentCapital grants, subsidies, contributions and donationsNet movement in investmentsPayments for property, plant and equipmentProceeds from wind-up of controlled entityPayments for intangible assets
Net cash outflows from investing activities
Cash flows from financing activities
Repayment of borrowings
Net cash outflows from financing activities
Net increase (decrease) for the year
16
8,625
1,1011,132
(7,633)
10,244
(6,061)
1,659
69,542
(93,802)
188,082
(133,882)(135,689)
193,430
54,200
4,860
8,389
57,741
7,697
9,110
Note
24
5(c)
5(a)
11(a)
Total cash and cash equivalents at the end of the
financial year
30,104
319
1,375
(11,055)
(17,167)
(16,333)
1,418
217,281
21,533
(16,333)
(195,748)
(248,957)
(92,553)
(152)
2019
21,533
73,174
51,641
(17,167)
$'000 $'000
-
(357)
51,306
79,863
525
Cash and cash equivalents at the beginning of the financial year
2018
The above statement should be read in conjunction with the accompanying notes and significant accounting policies.
33,152
(193,006)
56 | Annual Report 2018/19

2 3 4 5 6 7 8 9 # # # # # # # # # # # # # # # # # # # # # # # # # # # # # # # # # # # # # # # # # # # # # # # # 58 # # # # # # # # # # # #
Fraser Coast Regional Council
Notes to the financial statementsfor the year ended 30 June 2019
Contents of the notes accompanying the financial statements
Details
Summary of significant accounting policiesAnalysis of results by functionRevenue analysisGrants, subsidies, contributions and donationsCapital incomeEmployee benefitsMaterials and servicesFinance costsDepreciation and amortisationCapital expensesCash, cash equivalents and investmentsTrade and other receivablesLand held for development and resaleProperty, plant and equipmentTrade and other payablesBorrowingsProvisionsOther liabilitiesAsset revaluation surplusCommitments for expenditureContingent liabilitiesSuperannuation - Regional Defined Benefit FundControlled entities that have not been consolidated
Reconciliation of liabilities arising from finance activitiesCorrection of errorsEvents after the reporting periodFinancial instruments and financial risk managementNational competition policyTransactions with related parties
14
106767
11 68
137012
72
6666
4
967
5
87
71
Page
1
Note
6
32
6364
58
65
61
15
82
1617 81
8080
24
27
29
2021
28
22
25
84
1982
23
26
85
Reconciliation of net result for the year to net cash inflows from operating activities86
83
18
88
90
89
96
88
30 97
90
| 57Annual Report 2018/19

Fraser Coast Regional Council
Notes to the financial statements for the year ended 30 June 2019
Note 1. Summary of significant accounting policies
(a) Basis of preparation
These general purpose financial statements are for the period 1 July 2018 to 30 June 2019. They have been prepared in accordance with the requirements of the Local Government Act 2009 and the Local Government Regulation 2012.
They comply with Australian Accounting Standards and Interpretations issued by the Australian Accounting Standards Board (AASB). Council is a not-for-profit entity and the Australian Accounting Standards include requirements for not-for-profit entities which are inconsistent with International Financial Reporting Standards (IFRS). Therefore in some instances these financial statements do not comply with IFRS. The main impacts are the offsetting of revaluation and impairment gains and losses within a class of assets, and the timing of the recognition of non-reciprocal grant revenue.
These financial statements have been prepared under the historical cost convention except where stated.
(b) Basis of consolidation
Council forms the economic entity which is referred to in these financial statements as the Council. The financial statements of controlled entity, Fraser Coast Tourism and Events Ltd is included in Note 23 but is not consolidated as it does not have a material effect on the results. The financial statements of controlled entities are included in the consolidated financial statements only where material by size or nature, from the date when control commences until the date when control ceases.
Council entered into a joint venture agreement on 14 April 2015 for a development being conducted by Fraser Coast Residential Airpark Pty Ltd. This development is currently on hold at the request of Fraser Coast Residential Airpark Pty Ltd. As the impact of this joint venture is not expected to be material to Council’s overall operations, no separate disclosures have been made in relation to this joint venture.
(c) Constitution
Fraser Coast Regional Council is constituted under the Local Government Act 2009 and is domiciled in Australia.
(d) Adoption of new and revised Accounting Standards
In the current year, Council adopted all of the new and revised Standards and Interpretations issued by the Australian Accounting Standards Board (AASB) that are relevant to its operations and effective for the current reporting period. The adoption of the new and revised Standards and Interpretations has not resulted in any material changes to Council's accounting policies.
Council has not applied any Australian Accounting Standards and Interpretations that have been issued but are not yet effective.
(i) AASB 9 Financial Instruments, which replaces AASB 139 Financial Instruments: Recognition and Measurement is effective for reporting periods beginning on or after 1 January 2018, and addresses the classification, measurement and disclosure of financial assets and liabilities.
This year Council has adopted AASB 9 Financial Instruments for the first time. Council has reviewed the standard and based on the assets and liabilities it holds, the only impact is in respect of impairment of trade receivables. AASB 9 changes the way impairment provisions for Trade and Other Receivables are calculated, which are now based on expected credit losses instead of incurred credit losses.
Council has reviewed its various classes of Trade and Other Receivables and assessed the impact of the new impairment model. The majority of receivables consist of rates and deferred infrastructure charges which are subject to Council’s statutory powers of recovery and therefore not subject to impairment. Historically, impairment of other classes of receivables has been negligible and as such the impact of the new impairment model is not material and Council is not subject to material credit risk.
(ii) AASB 15 Revenue from Contracts with Customers, AASB 1058 Income of Not-for-Profit Entities and AASB 2016-8 Amendments to Australian Accounting Standards - Australian Implementation Guidance for Not-for-Profit Entities are effective from periods beginning on or after 1 January 2019.
AASB 1058 clarifies and simplifies the income recognition requirements that apply to not-for-profit (NFP) entities, in conjunction with AASB 15, and AASB 2016-8. These Standards supersede the majority of income recognition requirements relating to public sector NFP entities, previously in AASB 1004 Contributions.
58 | Annual Report 2018/19

Fraser Coast Regional Council
Notes to the financial statements for the year ended 30 June 2019
Note 1. Summary of significant accounting policies continued
Identifiable impacts at the date of this report are:
• Some grants received by Council will be recognised as a liability, and subsequently recognised revenue progressively as Council satisfies its performance obligations under the grant. At present, such grants are recognised as revenue upfront.
• Grants that are not enforceable and/or not sufficiently specific will not qualify for deferral, and continue to be recognised as revenue as soon as they are controlled. Council receives several grants from the Federal Government and State Government for which there are no sufficiently specific performance obligations. These are expected to continue being recognised as revenue upon receipt assuming no change to the current grant arrangements.
• Depending on the respective contractual terms, the new requirements of AASB 15 may potentially result in a change to the timing of revenue from sales of Council's goods and services such that some revenue may need to be deferred to a later reporting period to the extent that Council has received payment but has not met its associated performance obligations (such amounts would be reported as a liability in the meantime).
• Prepaid rates will not be recognised as revenue until the relevant rating period starts. Until that time these receipts will be recognised as a liability (unearned revenue). There will be no impact upon the recognition of other fees and charges.
Based on Council’s assessment, if Council had adopted the new standards in the current financial year it would have had the following impacts:
• Revenue decrease of $7,112,902 due to deferral of grant funding, pre-paid rates, and other sales related revenue (based on the facts available to Council at the date of assessment).
• There would be an equal reduction in the reported equity as the reduced revenue will
require an increase in recognition of contract liabilities, and statutory receivables.
• The net result would be lower on initial application as a result of decreased revenue.
• A range of new disclosures required by the new standards in respect of Council’s revenue.
Transition method
Council intends to apply AASB 15, AASB 1058 and AASB 2016-8 initially on 1 July 2019, using the modified retrospective approach. The recognition and measurement principles of the standards will be retrospectively applied with the cumulative effect of initially applying the standards recognised as an adjustment to the opening balance of retained earnings. There will be no restatement of comparative information.
(iii) AASB 16 Leases is effective for periods beginning on or after 1 January 2019.
AASB 16 introduces a single, on-balance sheet lease accounting model for lessees. A lessee recognises a right-of-use asset representing its right to use the underlying asset and a lease liability representing its obligation to make lease payments. There are recognition exemptions for short-term leases and leases of low-value items. Lessor accounting remains similar to the current standard – i.e. lessors continue to classify leases as finance or operating leases.
Council has assessed the impacts that initial application of AASB 16 will have on its financial statements.
Leases in which the Council is a lessee
Council has three 1-year commercial building leases with renewal options for 1-year at Council’s discretion. Council also holds a further 20-year commercial building lease ending 30 September 2020. The application of AASB 16 requires Council to recognise new assets and liabilities for these operating leases. The nature of expenses related to those leases would change to a depreciation charge for right-of-use assets and interest expense on lease liabilities.
Council currently recognises an operating lease expense on a straight-line basis over the term of the lease, and recognises assets and liabilities only to the extent that there was a timing difference between actual lease payments and the expense recognised.
| 59Annual Report 2018/19

Fraser Coast Regional Council
Notes to the financial statements for the year ended 30 June 2019
Note 1. Summary of significant accounting policies continued
Council does not currently have any finance leases.
Based on Councils assessment, it is expected that the first-time adoption of AASB 16 for the year ending 30 June 2020 would have had the following impacts:
- Lease assets and financial liabilities on the balance sheet would increase by $157,844 and $153,221 respectively (based on the facts available to Council at the date of assessment).
- Net result would be $4,623 higher on initial application as depreciation and lease liability interest would be initially lower than the operating lease expense previously recognised due to leases being close to the end of their term.
Leases in which the Council is a lessor
No significant impact is expected for other leases in which the Council is a lessor.
Peppercorn Leases
Council is the lessee of a number of Deed of Grant in Trust leases, for which no or little lease payments are made. These have been identified as peppercorn leases which are currently not recognised in Council's financial statements. Council intends to elect to not apply the fair value measurement requirements to these leases until such time as this requirement is mandated.
Transition method
Council has assessed the impact of applying AASB 16, and determined that the effect will not be material to the financial statements.
Other amended Australian Accounting Standards and Interpretations which were issued at the date of authorisation of the financial statements, but have future commencement dates are not likely to have a material impact on the financial statements.
(e) Critical accounting judgements and key sources of estimation uncertainty
Where necessary, judgements, estimates and assumptions that have a potential significant effect are outlined in the following financial statement notes:
• Valuation and depreciation of property, plant and equipment - Note 14b, 14c and 14e
• Impairment of property, plant and equipment - Note 14d
• Employee benefits and provisions - Note 17
• Contingent liabilities - Note 21
• Financial instruments and financial assets - Note 28.
(f) Rounding and comparatives
Amounts included in the financial statements have been rounded to the nearest $1,000, or where that amount is $500 or less, to zero.
Comparative information has been restated where necessary to be consistent with disclosures in the current reporting period.
(g) Taxation
Income of local authorities and public authorities is exempt from Commonwealth taxation except for Fringe Benefits Tax and Goods and Services Tax (‘GST’) and payroll tax on certain activities. The net amount of GST recoverable from the ATO or payable to the ATO is shown as an asset or liability respectively.
60 | Annual Report 2018/19

Fraser Coast Regional Council
Notes to the financial statementsfor the year ended 30 June 2019
Note 2. Analysis of results by function
(a) Components of Council functions
Details relating to Council's functions as reported in Note 2(b) are as follows:
Governance and administration
Economic development
Roads infrastructure and operations
Stormwater drainage
Commercial activities
Community and recreation
Development services
Environment and health
Solid waste management
Water management
Sewerage management
Operations and maintenance of sewerage infrastructure throughout the region - controlled by Council's
commercial business unit - Wide Bay Water.
The provision of information and advice to Council members, public relations, corporate development and
covers the areas of financial services, human resources, administration, asset management, information
systems, right to information, legal services and land development.
To increase business activity and employment by promoting opportunities for the region and attributes to
attract investment.
The construction and maintenance of roads, footpaths, parking facilities, traffic signals and bus shelters,
including the provision of street cleaning services.
The maintenance and provision of stormwater drainage.
Covering the areas of airports and caravan park management.
Covering a variety of community related areas including community development, community housing, parks
and recreation facilities management, tourism, museums, art galleries, libraries and coastal management.
Development control processes including town planning, building and plumbing services.
Areas covered include public health, cemeteries, pest control, swimming pools and environmental protection.
The provision of rubbish collection, recycling and operation of refuse sites.
Operations and maintenance of water infrastructure throughout the region - controlled by Council's commercial
business unit - Wide Bay Water.
| 61Annual Report 2018/19

Fras
er C
oas
t R
egio
nal
Co
un
cil
No
tes
to t
he
fin
anci
al s
tate
men
tsfo
r th
e ye
ar e
nd
ed
30
Ju
ne
20
19
No
te 2
. An
alys
is o
f re
sult
s b
y fu
nct
ion
co
nti
nu
ed
(b)
Inco
me
and
exp
en
ses
de
fin
ed b
etw
ee
n r
ecu
rren
t an
d c
apit
al a
re a
ttri
bu
ted
to
th
e f
ollo
win
g fu
nct
ion
s:
(16
,04
8)
4,5
77
3,8
90
19
,03
0
Envi
ron
men
t an
d h
ealt
h-
3,3
62
--
Solid
was
te m
anag
emen
t-
19
,93
8-
-1
9,9
38
(15
,36
1)
(68
7)
(37
,37
9)
(7,5
02
)(3
83
)4
41
,84
93
6,9
96
(35
,80
3)
(1,5
76
)
36
,73
4(2
3,5
74
)(3
,62
4)
(26
,50
9)
(50
,68
2)
(8,6
86
)(5
,32
4)
(5,3
24
)
(9,9
65
)
27
0,3
39
(19
9,3
88
)
(5,4
65
)
3,3
62
(8,6
86
)-
10
,38
13
70
,07
6
(21
,62
6)
1,6
11
38
3
39
5,4
23
88
3,2
54
11
0,4
46
46
9,4
05
32
,78
1
$'0
00
$'0
00
-
(2,4
91
)
(20
,38
1)
(67
9)
15
,01
4
38
5,1
49
recu
rre
nt
op
era
tio
ns
fro
mN
et
resu
ltTo
tal a
sse
ts
71
,16
87
0,2
49
$'0
00
Ne
t re
sult
1,3
69
11
0,8
80
$'0
00
(2,3
21
)
Tota
l
exp
en
ses
(8,4
61
)(1
8,4
34
)
(98
6)
(14
,61
4)
$'0
00 (9
86
)
$'0
00
$'0
00
66
5
20
,21
1
5,8
15
(2,1
79
)
exp
en
ses
Gro
ss p
rogr
am
(31
,43
8)
(95
4)
(39
,71
2)
(37
,39
1)
(3,1
15
)
(36
,06
8)
30
,30
1
(5,2
69
)-
11
,88
4
1,7
88 -
(5,3
44
)(8
)
3,8
70
(5,2
69
)-
(28
)
1,0
21
6,2
18
74
17
,95
4
Cap
ital
Re
curr
en
t
Tota
l
inco
me
Cap
ital
Gra
nts
(9,3
23
)
-
62
9,4
89
73
28
,22
8
33
,46
6
-
7,4
93
3,8
04
65
2,6
39
$'0
00
Cap
ital
2,8
48
3,7
76
20
19
Fun
ctio
ns
-
7,4
93
2,7
29
$'0
00
10
7,5
17
52
0-
Oth
er
78
6
5,1
56
2,7
28
17
,14
8-
Sew
erag
e m
anag
emen
tW
ater
man
agem
ent
$'0
00
Re
curr
en
t
-6
,97
5
Cap
ital
Tota
l
-
Co
mm
erci
al a
ctiv
itie
sSt
orm
wat
er d
rain
age
Eco
no
mic
dev
elo
pm
ent
Go
vern
ance
an
d a
dm
inis
trat
ion
-
--
-
19
,86
52
02
,36
6
Solid
was
te m
anag
emen
t
Ro
ads
infr
astr
uct
ure
an
d o
per
atio
ns
1,7
06
Dev
elo
pm
ent
serv
ices
5
43
,45
5
(12
,99
2)
(5,1
02
)
(41
,59
2)
(2,4
97
)
1
45
7
3,7
71
(91
1)
(27
,88
6)
6,9
75
(20
4,5
95
)
5,5
49
6
Envi
ron
men
t an
d h
ealt
h
Co
mm
un
ity
and
rec
reat
ion
10
5
9,0
51
Gro
ss p
rogr
am
(33
,12
5)
11
8,2
50
$'0
00
$'0
00
Tota
l
inco
me
(5,5
16
)
$'0
00
exp
en
ses
Re
curr
en
t O
the
r$
'00
0
Gro
ss p
rogr
amin
com
e
Gra
nts
-
(5,1
02
)
40
6,5
84
79
,60
9
Tota
l ass
ets
$'0
00
$'0
00
recu
rre
nt
op
era
tio
ns
Ne
t re
sult
$'0
00
Ne
t
resu
lt
79
,54
8
fro
mTo
tal
exp
en
ses
$'0
00
(53
8)
(1,0
58
)
90
5,0
68
40
3,6
05
(21
,11
8)
(7,5
99
)
(38
,64
1)
(54
,58
4)
24
8
(10
6)
(9,3
51
)
(5,3
52
)
(28
,79
7)
(37
,15
8)
(5,5
18
)
1,6
31
(1,4
93
)(1
,49
3)
35
,64
6
(15
,87
6)
(23
1,1
04
)
(27
,19
8)
(1,0
58
)1
,30
6
20
,32
2
27
4,7
37
64
3(1
6,5
19
)
1,6
23
(23
,24
8)
(5,4
81
)
4,4
46
-
38
5,6
56
6,8
22
2,7
29
,24
6
20
,90
1
11
4,9
89
14
,94
8
3,7
97
(26
,76
4)
5,9
21
9,5
36
43
,63
3
Eco
no
mic
dev
elo
pm
ent
-
Ro
ads
infr
astr
uct
ure
an
d o
per
atio
ns
Sto
rmw
ater
dra
inag
e-
7,0
76
-
Co
mm
erci
al a
ctiv
itie
s-
8
Co
mm
un
ity
and
rec
reat
ion
(1,5
22
)(2
5,5
18
)4
35
-7
,07
6
(8,4
69
)
2,7
78
32
10
2,5
89
$'0
00
(24
,49
0)
(4,2
53
)(6
79
)
(1,9
96
)
-3
,57
4
(27
,04
0)
(34
,16
8)
35
,96
3
(5,4
65
)1
,61
1
31
(4,2
53
)
5,4
14
36
,51
9(2
3,0
23
)
38
,72
12
3,3
20
19
9,9
40
(34
,40
3)
1,3
04
Oth
er
$'0
00
3,0
82
3,4
65
32
6
-
- -
-
Gra
nts
18
0
Oth
er
1,3
37
3,0
60
-
5,0
51
inco
me
Gro
ss p
rogr
am
Gra
ntsR
ecu
rre
nt
$'0
00
$'0
00
Go
vern
ance
an
d a
dm
inis
trat
ion
1,8
52
8,3
58
13
,90
1
-
15
,93
5-
11
,77
0
28
,83
8
20
18
Fun
ctio
ns
Tota
l
Dev
elo
pm
ent
serv
ices
3,5
43
Wat
er m
anag
emen
t6
,06
7
63
32
,10
9
59
3
Sew
erag
e m
anag
emen
t1
,61
4
15
,94
3
(36
,34
7)
36
,54
82
,68
0,5
78
(38
4)
-
(26
,13
8)
(23
3,7
91
)8
,91
0
62 | Annual Report 2018/19

Fraser Coast Regional Council
Notes to the financial statementsfor the year ended 30 June 2019
Note 3. Revenue analysis
(a) Rates, levies and charges
General ratesRural fire levyDisaster levyToogoom seawall revetment levyInfrastructure levyWater chargesWater consumption chargesSewerage chargesSewerage trade waste chargesWaste charges
Less: discounts *Less: pensioner remissions and concessions
(b) Fees and charges
Nil
Change of ownership feesBuilding and development feesCaravan park feesLicences and registrationsPool feesAirport landing feesRefuse tip feesPlumbing and drainage feesSearch feesInterment feesLodgement feesPassenger head taxesPlanning feesSecurity screening revenueSpecial water meter reading feesWater allocation feesTrade waste compliance feesOther fees and charges
Note
* In the previous reporting period, an early payment discount was available for ratepayers (10% on General rates and Waste
charges, 7.5% on Water charges, Water consumption charges, Sewerage charges and Sewerage trade waste charges). The
early payment discount was removed as part of Council's 2018-19 budget.
549
74,247
(12,514)
85
Revenue is recognised at the fair value of the consideration received or receivable, at the time indicated below.
Rates, levies and charges are recognised as revenue when levied. If a ratepayer pays their rates before they are levied, they
are recognised as revenue when they are received.
Fees and charges are recognised when Council is unconditionally entitled to those funds. Generally this is upon lodgement of
the relevant applications or documents, issuing of the infringement notice or when the service is provided.
530
(3,160)
609
1,286
554
134
1,749
19,877
879
1,456
1,127
1,003
1,421 1,258
157
19,985
538
13,203
$'000
214
617
3,294
(3,205)
161
131
1,068 812
24,393
837
164,148
4,526
196
18,493
79,673
22,630
15,100
556
$'000
552
2018
325
3,840
85
1,048
170,495
4,590
285
325
2019
229
1,895
167,335
313
3,297
117
179,867
3,814
1,369
34,670
-
37,299
20,308
249
211
1,152
1,411
| 63Annual Report 2018/19

Fraser Coast Regional Council
Notes to the financial statementsfor the year ended 30 June 2019
Note $'000$'00020182019
Note 3. Revenue analysis continued
(c) Interest revenue
Interest received on investments and term depositsInterest received on State Government fire levyInterest from overdue rates and utility charges
(d) Other income
Airport incomeBrolga theatre performance incomeCommission incomeFuel tax creditsInsurance receiptsExpense reimbursementsVector control incomeOther income
Note 4. Grants, subsidies, contributions and donations
(a) Recurrent
General purpose grantsGovernment grants and subsidies
(b) Capital
(i) Monetary revenue designated for capital funding:Government grants and subsidiesContributions
Developer contributed assets
TOTAL CAPITAL GRANTS, SUBSIDIES,
359277
12,529
7,196
9,832
-
12,529
45,681
177
3,358
428
105
1,377
1,1471,216
205
Grants, subsidies and contributions that are non-reciprocal in nature are recognised as revenue in the year in which Council
obtains control over them, which is usually upon receipt of funds.
Physical assets contributed to Council by developers in the form of roadworks, stormwater, water and wastewater
infrastructure and park equipment are recognised as revenue when the development becomes "on maintenance" (i.e. Council
obtains control of the assets and becomes liable for any ongoing maintenance) and there is sufficient data in the form of
drawings and plans to determine the approximate specifications and values of such assets. All non-cash contributions are
recognised at the fair value of the contribution received on the date of acquisition.
Where grants are received that are reciprocal in nature, revenue is recognised as the various performance obligations under
the funding agreement are fulfilled. Council does not currently have any reciprocal grants.
Capital revenue includes grants and subsidies received which are tied to specific projects for the replacement or upgrade of
existing non-current assets and/or investment in new assets. It also includes non-cash contributions which are usually
infrastructure assets received from developers.
10,239
-
x - do not use for mapping
58,541
Interest received from term deposits is accrued over the term of the investment.
1,777
171
5,998
107
3,244
7,674
105
28,437
19,865
(ii) Non-monetary revenue:
1,162
30,104
28,437
23,320
33,152
8,3589,051
207
534
467 480
564
5,865
7,882
160
1,662
80
7,607
64 | Annual Report 2018/19
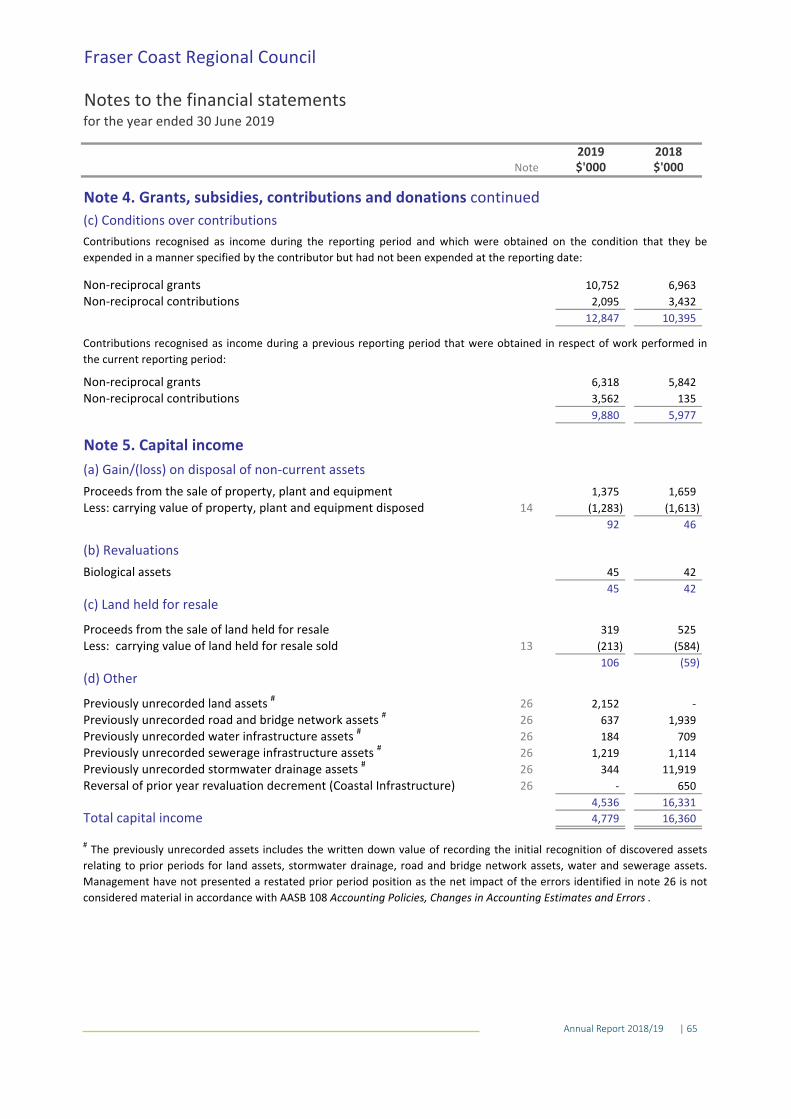
Fraser Coast Regional Council
Notes to the financial statementsfor the year ended 30 June 2019
Note $'000$'00020182019
Note 4. Grants, subsidies, contributions and donations continued
(c) Conditions over contributions
Non-reciprocal grantsNon-reciprocal contributions
Non-reciprocal grantsNon-reciprocal contributions
Note 5. Capital income
(a) Gain/(loss) on disposal of non-current assets
Proceeds from the sale of property, plant and equipmentLess: carrying value of property, plant and equipment disposed
(b) Revaluations
Biological assets
(c) Land held for resale
Proceeds from the sale of land held for resaleLess: carrying value of land held for resale sold
(d) Other
Previously unrecorded land assets #
Previously unrecorded road and bridge network assets #
Previously unrecorded water infrastructure assets #
Previously unrecorded sewerage infrastructure assets #
Previously unrecorded stormwater drainage assets #
Reversal of prior year revaluation decrement (Coastal Infrastructure)
Total capital income
26
26
26
26
26
26
709
14
9,880
13
319
10,395
1,375
(1,613)
46
10,752 6,963
3,562
5,842
1,659
5,977
(1,283)
6,318
Contributions recognised as income during the reporting period and which were obtained on the condition that they be
expended in a manner specified by the contributor but had not been expended at the reporting date:
92
Contributions recognised as income during a previous reporting period that were obtained in respect of work performed in
the current reporting period:
3,4322,095
135
525
-
(59)
45
4,536
12,847
45
#The previously unrecorded assets includes the written down value of recording the initial recognition of discovered assets
relating to prior periods for land assets, stormwater drainage, road and bridge network assets, water and sewerage assets.
Management have not presented a restated prior period position as the net impact of the errors identified in note 26 is not
considered material in accordance with AASB 108 Accounting Policies, Changes in Accounting Estimates and Errors .
- 650
1,939
2,152
16,360
42
4,779
16,331
184
42
(584)
106
(213)
637
1,219 1,114
344 11,919
| 65Annual Report 2018/19
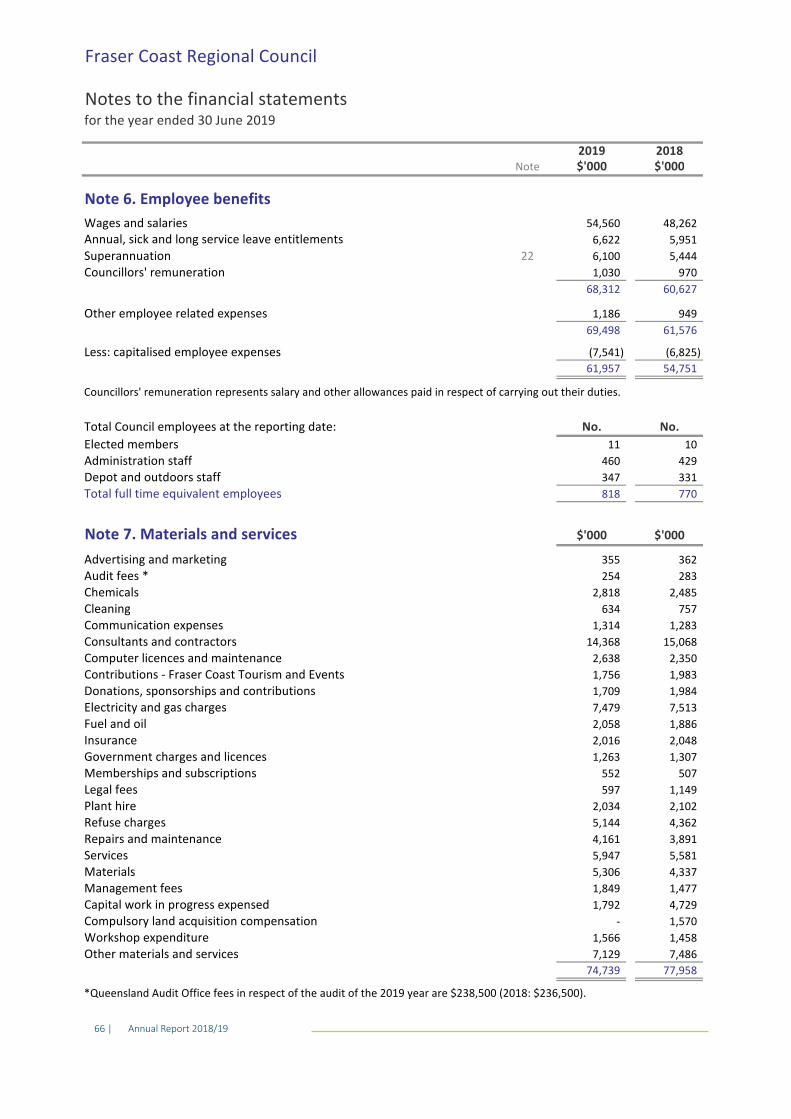
Fraser Coast Regional Council
Notes to the financial statementsfor the year ended 30 June 2019
Note $'000$'00020182019
Note 6. Employee benefits
Wages and salaries
SuperannuationCouncillors' remuneration
Other employee related expenses
Less: capitalised employee expenses
Total Council employees at the reporting date:
Elected membersAdministration staffDepot and outdoors staffTotal full time equivalent employees
Note 7. Materials and services
Advertising and marketingAudit fees *ChemicalsCleaningCommunication expensesConsultants and contractorsComputer licences and maintenanceContributions - Fraser Coast Tourism and EventsDonations, sponsorships and contributionsElectricity and gas chargesFuel and oilInsuranceGovernment charges and licencesMemberships and subscriptionsLegal feesPlant hireRefuse chargesRepairs and maintenanceServicesMaterialsManagement feesCapital work in progress expensedCompulsory land acquisition compensationWorkshop expenditureOther materials and services
77,958
7,129
*Queensland Audit Office fees in respect of the audit of the 2019 year are $238,500 (2018: $236,500).
1,458
757
1,283
1,792
1,566
74,739
22
2,485
2,048
7,479
61,957
4,362
6,100
429
54,560
10
$'000
2,058
552
No.
1,030
5,951
5,444
Councillors' remuneration represents salary and other allowances paid in respect of carrying out their duties.
1,886
362
1,849
15,068
5,947
1,709
283
5,306
2,818
4,729
1,477
-
2,034 2,102
254
5,581
1,570
14,368
1,263
507
2,016
1,314
4,161 3,891
$'000
1,983
970
347
1,186
6,622Annual, sick and long service leave entitlements
460
68,312
61,576
597
770
60,627
11
355
69,498
No.
949
(6,825)
48,262
331
(7,541)
7,486
1,984
7,513
1,756
54,751
5,144
818
634
1,149
2,638
1,307
4,337
2,350
66 | Annual Report 2018/19

Fraser Coast Regional Council
Notes to the financial statementsfor the year ended 30 June 2019
Note $'000$'00020182019
Note 8. Finance costs
Finance costs - Queensland Treasury Corporation (QTC)Bank chargesImpairment of receivablesRefuse restoration - unwinding of discount
Note 9. Depreciation and amortisation
(a) Depreciation of non-current assets
Buildings and site improvementsPlant and equipmentRoad and bridge networkWater infrastructureSewerage infrastructureStormwater drainageCoastal infrastructureOther assets
(b) Amortisation of intangible assets
Computer software
Total depreciation and amortisation
Note 10. Capital expenses
(a) Loss on impairment
Total impairment losses
(b) Provision for restoration of land
687(764)
The loss on impairment of assets classified as held for sale arises as the land is measured at the lower of its carrying amount
and fair value less disposal costs (note 13).
Discount rate adjustment - refuse restoration 17
(764)
-
687
799
4,354
518
58,685
799 -
590
7865
11,671
7,051
4,656
58,763
20,372
10,682
61,328
65
765
10,307
14
Non-current assets classified as held for sale
5,162
25
7,916
17
61,393
445
5,807
12,462
719
283
6,640
78
19,363
6,506
235
758
5,089
6,252
229
13
| 67Annual Report 2018/19

Fraser Coast Regional Council
Notes to the financial statementsfor the year ended 30 June 2019
Note $'000$'00020182019
Note 10. Capital expenses continued
(c) Other capital expenses
Loss on write-off of assetsLoss on derecognition of property, plant and equipmentResidual value / useful life adjustmentLoss/(gain) on write-down on investment in associateAggregated asset adjustments in respect of prior years (assets derecognised)
Total capital expenses
Loss on write-off of assets
LandBuildings and site improvementsPlant and equipmentRoad and bridge networkWater infrastructureSewerage infrastructureStormwater drainageCoastal infrastructure
Aggregated asset adjustments in respect of prior years*
LandBuildings and site improvementsRoad and bridge networkWater infrastructureSewerage infrastructureStormwater drainage
Note 11. Cash, cash equivalents and investments
(a) Cash and cash equivalents
Cash in operating bank accountCash on handInvestments with Queensland Treasury Corporation (QTC)Term deposits less than 3 monthsBalance per Statement of Cash Flows
2,500
35
73,174
26
3,1063,738
26,509
19,854
-
-
38
3,738
Cash and cash equivalents include cash on hand, all cash and cheques receipted but not banked at year end, deposits held at
call with financial institutions, and other short-term and highly liquid investments with original maturities of three months or
less that are readily convertible to known amounts of cash and which are subject to an insignificant risk of changes in value.
1,644
15,766
26
69
12,018
14
678
26
26 15,766
* The previously unrecorded write-offs includes the written down value of recording assets written off relating to periods
prior to the year ended 30 June 2019 for land (30 June 2018 - buildings and site improvements, land, drainage, road and
bridge network assets, water and sewerage assets) carried out in previous financial periods. Management had not presented
a restated prior period position for that period, as the net impact of the errors identified in note 26 is not considered material
in accordance with AASB 108 Accounting Policies, Changes in Accounting Estimates and Errors .
2,529
19,933
1,553
-
-
-
(62)
8,474
3,738
678
-
692
27
1,747
-
18,012
29
3,625
1,469
387
12,086
752
243
2,416
68,354
-
18,012
2,001
29
-
956
26,474
19,933
26
-
34,403
33,716
26
26
2,282
950
21,533
68 | Annual Report 2018/19

Fraser Coast Regional Council
Notes to the financial statementsfor the year ended 30 June 2019
Note $'000$'00020182019
Note 11. Cash, cash equivalents and investments continued
(b) Investments
Term deposits greater than 3 months
(c) Restricted cash, cash equivalents and investments
Unspent government grants and subsidiesUnspent developer contributions Funds restricted for aged housingFunds restricted for Environmental LevyFunds restricted for Disaster management levyWaste levy refund received in advance *Total unspent restricted cash
(d) Trust funds held for outside parties
Security deposits
193,006
141,700
Council's cash and cash equivalents are subject to a number of external restrictions that limit amounts available for
discretionary or future use. These include:
193,006
Term deposits with a term in excess of three months are reported as investments, with deposits of less than three months
being reported as cash equivalents.
141,700
Cash in operating bank account is held at the Commonwealth Bank of Australia in a normal business cheque account.
Investments with QTC are on call. Term deposits are held with various institutions. Term deposits earn fixed interest over
varying terms at interest rates of between 2.01% and 2.91% (2018: 2.50% and 2.93%).
469
27,675
In accordance with the Local Government Act 2009 and Local Government Regulation 2012 , a separate trust bank account
and separate accounting records are maintained for funds held on behalf of outside parties. Funds held in the trust account
include those funds from the sale of land for arrears in rates, deposits for the contracted sale of land, security deposits lodged
to guarantee performance and unclaimed monies (e.g. wages). The Council performs only a custodian role in respect of these
monies and because the monies cannot be used for Council purposes, they are not considered revenue nor brought to
account in the financial statements.
* Cash at bank and on hand at 30 June 2019 includes $2,857,492 received from the State government to mitigate the direct
impacts on households of the State Waste Levy, which comes into effect from 1 July 2019. This money has been set aside to
help fund the Council's 2019-20 waste levy expense.
7,901
409
1,089
3,352
Monies collected or held on behalf of other entities yet to be paid
out to or on behalf of those entities
348
41,510
9,191
348
2,857
3,914
1,115
Externally imposed expenditure restrictions at the reporting date
relate to the following cash assets:
4,495
1,143
29,162
38,935
350
-
4,383
| 69Annual Report 2018/19

Fraser Coast Regional Council
Notes to the financial statementsfor the year ended 30 June 2019
Note $'000$'00020182019
Note 12. Trade and other receivables
Current
Rates and utility chargesFees and chargesDeferred infrastructure chargesOther debtors
Less: impairmentLoss allowance
Non-Financial Instruments
Water charges not yet levied
Accrued interest
Other accrued revenue
GST recoverable
Prepayments
Movement in accumulated impairment losses
Balance as at 1 JulyLess: impairment debts written off during the year
Balance as at 30 June
Non-current
Deferred infrastructure charges3,301
Interest is charged on outstanding rates at 9% per annum (2018: 11%). No interest is charged on other debtors. There is no
concentration of credit risk for rates and utility charges, fees and other debtors receivable.
Additional impairments recognised
3,301
Council applied AASB 9 for the first time this year. As a result Council has calculated the impairment of receivables in a
different way for 2019, using a lifetime expected loss allowance. The opening balance of impairment, as at 1 July 2018, has
been recalculated using this new methodology and noted the difference between methodologies was immaterial. As such, no
opening balance adjustment has been made. Further details of Council's expected credit loss assessment are contained in
note 28.
4,904 4,719
14,777
1,439
1,362
Council is empowered under the provisions of the Local Government Act 2009 to sell an owner's property to recover
outstanding rate debts. Council undertakes an annual assessment of rates receivables to ascertain if the recoverable amount
is likely to be less than the debt which would result in an impairment.
27,287
19,515 32,995
Receivables are amounts owed to council at year end. They are recognised at the amount due at the time of sale or service
delivery. Settlement is required within 30 days after the invoice is issued.
Debts are regularly assessed for collectability and allowance is made, where appropriate, for impairment. All known bad debts
were written-off at 30 June. If an amount is recovered in a subsequent period it is recognised as revenue.
768
8
40,785
5,861 -
50
1,506
32,227
1,152
(768)
768
19,465
-
10
758
(50)
25
15,927
35,392
769 7
2,855
2,776
(743)
2,072
1,538 1,760
8,558
1,937 3,050
2,776
70 | Annual Report 2018/19

Fraser Coast Regional Council
Notes to the financial statementsfor the year ended 30 June 2019
Note $'000$'00020182019
Non-current
Land held for development and sale
Movement in assets during the reporting periodBalance as at 1 JulyCarrying value of land disposedTransfers to other asset categoriesImpairment adjustment in periodBalance as at 30 June
Land classified as held for sale during the reporting period was measured at the lower of its carrying amount and fair value
less cost to sell at the time of reclassification. The fair value of the land was determined using the sales comparison approach.
The land is categorised as a level 2 valuation.
5,518
(584)
5,518
5,5184,229
6,102
4,229
-(277)
5,518
(213)
4,229
10(a) -(799)
Note 13. Land held for development and resale
14
| 71Annual Report 2018/19

Fras
er C
oas
t R
egio
nal
Co
un
cil
No
tes
to t
he
fin
anci
al s
tate
men
ts
for
the
year
en
ded
30
Jun
e 20
19
No
te 1
4. P
rop
ert
y, p
lan
t an
d e
qu
ipm
en
t
Mea
sure
men
t b
asis
Fair
Val
ue
Fair
Val
ue
Co
stFa
ir V
alu
eFa
ir V
alu
eFa
ir V
alu
eFa
ir V
alu
eFa
ir V
alu
eC
ost
Co
st/F
V
$'0
00$'
000
$'00
0$'
000
$'0
00
$'0
00
$'0
00
$'0
00
$'0
00
$'0
00
$'0
00
Op
enin
g gr
oss
bal
ance
- a
t co
st-
-72
,21
2-
--
--
8,1
80
35
,05
91
15,
451
Op
enin
g gr
oss
bal
ance
- a
t fa
ir v
alu
e89
,21
82
64
,970
-1
,20
0,47
96
90,1
51
58
2,7
445
79,9
91
29
,733
--
3,4
37,
286
Op
enin
g gr
oss
bal
ance
89,2
18
26
4,9
7072
,21
21
,20
0,47
96
90,1
51
58
2,7
445
79,9
91
29
,733
8,1
80
35
,05
93
,55
2,7
37
Wo
rk in
pro
gres
s tr
ansf
ers
to p
rop
erty
, pla
nt
and
eq
uip
men
t *
1,7
59
15
,125
11,3
44
42,
290
9,1
53
12
,628
6,3
37
156
1,1
37
(99
,92
9)-
Co
ntr
ibu
ted
ass
ets
at v
alu
atio
n-
535
-1
1,83
53
,45
06
,062
6,5
55
--
-2
8,4
37
Dis
po
sals
(12
6)-
(4,1
27
)-
--
--
--
(4,2
53)
Wri
te-o
ffs
-(2
,473
)(4
,30
2)
(20,
471
)(5
,87
2)(1
0,6
67)
(1,3
18
)(8
9)
--
(45,
192
)
Wri
te-o
ffs
(pri
or
per
iod
ad
just
men
t)**
(3,7
38)
--
--
--
--
-(3
,738
)
Der
eco
gnit
ion
of
asse
ts w
ith
no
fu
ture
eco
no
mic
ben
efit
-(4
,943
)-
(1,0
38
)-
--
(368
)-
-(6
,349
)
Rev
alu
atio
n in
crem
ents
to
oth
er c
om
pre
hen
sive
inco
me
(ass
et r
eval
uat
ion
su
rplu
s)9
,54
7-
--
--
--
--
9,5
47
Wo
rk in
pro
gres
s ad
dit
ion
s-
--
--
--
--
93
,80
29
3,8
02
Tran
sfer
s b
etw
een
cla
sses
27
71
76(1
76
)-
--
--
--
277
Init
ial r
eco
gnit
ion
of
dis
cove
red
ass
ets
**2
,15
21
-86
22
20
1,3
593
74
--
-4,
968
Tota
l gro
ss v
alu
e o
f p
rop
erty
, pla
nt
and
eq
uip
men
t -
at c
ost
--
74,9
51
--
--
-9
,31
72
8,9
32
11
3,2
00
Tota
l gro
ss v
alu
e o
f p
rop
erty
, pla
nt
and
eq
uip
men
t -
at f
air
valu
e99
,08
92
73
,391
-1
,23
3,95
76
97,1
02
59
2,1
265
91,9
39
29
,432
--
3,5
17,
036
Tota
l gro
ss v
alu
e o
f p
rop
erty
, pla
nt
and
eq
uip
men
t99
,08
92
73
,391
74,9
51
1,2
33,
957
697
,10
25
92
,126
591
,93
92
9,4
329
,31
72
8,9
32
3,6
30,
236
Op
enin
g ac
cum
ula
ted
dep
reci
atio
n-
51
,221
44,2
54
33
4,27
92
71,8
40
22
9,5
581
91,6
51
10
,307
5,5
59
-1
,13
8,6
69
Dep
reci
atio
n p
rovi
ded
in t
he
per
iod
-5
,089
6,2
52
20,
372
12,4
62
10
,682
5,1
62
590
719
-6
1,3
28
Dep
reci
atio
n o
n d
isp
osa
ls-
-(2
,97
0)
--
--
--
-(2
,970
)
Dep
reci
atio
n o
n w
rite
-off
s-
(726
)(4
,05
9)
(8,4
53
)(4
,31
9)(7
,042
)(6
40
)(2
0)
--
(25,
259
)
Der
eco
gnit
ion
of
asse
ts w
ith
no
fu
ture
eco
no
mic
ben
efit
-(3
,084
)-
(54
6)
--
-(3
03)
--
(3,9
33)
Rev
alu
atio
n in
crem
ents
to
oth
er c
om
pre
hen
sive
inco
me
(ass
et r
eval
uat
ion
su
rplu
s)-
--
(6,2
54
)-
--
--
-(6
,254
)
Tran
sfer
s b
etw
een
cla
sses
-71
(71
)-
--
--
--
-
Ad
just
men
ts a
nd
tra
nsf
ers
(ch
ange
in la
nd
fill
asse
ts -
no
te 1
7)
-(3
2)
--
--
--
--
(32
)
Init
ial r
eco
gnit
ion
of
dis
cove
red
ass
ets
**-
1-
225
36
140
30
--
-4
32
Res
idu
al v
alu
e /
use
ful l
ife
adju
stm
ent
-1
172
84
(14
)-
-9
(18
)9
-3
87
Tota
l acc
um
ula
ted
dep
reci
atio
n o
f p
rop
erty
, pla
nt
and
eq
uip
men
t-
52
,657
43,6
90
33
9,60
92
80,0
19
23
3,3
381
96,2
12
10
,556
6,2
87
-1
,16
2,3
68
Tota
l net
bo
ok
valu
e o
f p
rop
erty
, pla
nt
and
eq
uip
men
t99
,08
92
20
,734
31,2
61
89
4,34
84
17,0
83
35
8,7
883
95,7
27
18
,876
3,0
30
28
,93
22
,46
7,8
68
Ran
ge o
f es
tim
ated
use
ful l
ife
in y
ears
Lan
d -
no
t
de
pre
ciat
ed
30
-10
03-
10
15
-15
02
0-8
01
2-1
00
60-
140
30-
90
7-1
00
*Ass
et a
dd
itio
ns
com
pri
se
Ass
et r
enew
als
-5
,430
2,8
20
28,
405
7,1
93
7,9
283
,58
711
345
-5
5,7
19
Oth
er a
dd
itio
ns
1,7
59
9,6
958
,52
41
3,88
51
,96
04
,700
2,7
50
145
792
-4
4,2
10
Tota
l ass
et a
dd
itio
ns
1,7
59
15
,125
11,3
44
42,
290
9,1
53
12
,628
6,3
37
156
1,1
37
-9
9,9
29
30
Ju
ne
20
19
Lan
d
Bu
ildin
gs a
nd
site
imp
rove
men
ts
Pla
nt
and
equ
ipm
ent
Ro
ad a
nd
bri
dge
net
wo
rk
Wat
er
infr
astr
uct
ure
Sew
erag
e
infr
astr
uct
ure
Sto
rmw
ater
dra
inag
e
Co
asta
l
infr
astr
uct
ure
Oth
er a
sset
sW
ork
s in
pro
gres
sTo
tal
**Th
ea
bo
veta
ble
incl
ud
esth
en
etim
pa
cto
fre
cord
ing
the
init
ial
reco
gn
itio
no
fd
isco
vere
da
sset
s,a
nd
ass
ets
wri
tten
off
rela
tin
gto
pri
or
per
iod
s.M
an
ag
emen
th
ave
no
tp
rese
nte
da
rest
ate
dp
rio
rp
erio
dp
osi
tio
na
sth
en
etim
pa
cto
fth
eer
rors
iden
tifi
ed is
no
t co
nsi
der
ed m
ate
ria
l in
acc
ord
an
ce w
ith
AA
SB 1
08
Acc
ou
nti
ng
Po
licie
s, C
ha
ng
es in
Acc
ou
nti
ng
Est
ima
tes
an
d E
rro
rs.
72 | Annual Report 2018/19

Fras
er C
oas
t R
egio
nal
Co
un
cil
No
tes
to t
he
fin
anci
al s
tate
men
tsfo
r th
e y
ear
en
de
d 3
0 Ju
ne
201
9
No
te 1
4. P
rop
ert
y, p
lan
t an
d e
qu
ipm
en
t co
nti
nu
edB
uild
ings
an
d
Ro
ad a
nd
Mea
sure
men
t b
asis
Fair
Val
ue
Fair
Val
ue
Co
stFa
ir V
alu
eFa
ir V
alu
eFa
ir V
alu
eFa
ir V
alu
eFa
ir V
alu
eC
ost
Co
st/F
V
$'0
00$'
000
$'00
0$'
000
$'0
00
$'0
00
$'0
00
$'0
00
$'0
00
$'0
00
$'0
00
Op
enin
g gr
oss
bal
ance
- a
t co
st-
-66
,99
8-
--
--
7,1
69
34
,88
91
09,
056
Op
enin
g gr
oss
bal
ance
- a
t fa
ir v
alu
e92
,34
42
47
,624
-1
,13
1,54
86
52,1
69
57
0,2
205
30,7
92
22
,948
--
3,2
47,
645
Op
enin
g gr
oss
bal
ance
92,3
44
24
7,6
2466
,99
81
,13
1,54
86
52,1
69
57
0,2
205
30,7
92
22
,948
7,1
69
34
,88
93
,35
6,7
01
Wo
rk in
pro
gres
s tr
ansf
ers
to p
rop
erty
, pla
nt
and
eq
uip
men
t *
75
24
,855
9,5
44
44,
643
14,2
66
3,4
048
,05
45
,854
1,0
11
(92
,38
3)-
Co
ntr
ibu
ted
ass
ets
at v
alu
atio
n-
--
4,96
11
,42
13
,332
2,8
15
--
-1
2,5
29
Dis
po
sals
(20)
(344
)(4
,28
1)
--
--
--
-(4
,645
)
Wri
te-o
ffs
(75
2)(9
61)
(12
1)
(19,
472
)(5
,18
3)(4
,108
)(1
,37
1)
(207
)-
-(3
2,1
75)
Wri
te-o
ffs
(pri
or
per
iod
ad
just
men
t)**
(3,1
06)
(36
)-
(2,9
07
)(1
,65
6)(1
,511
)(1
3,5
77
)-
--
(22,
793
)
Rev
ersa
l of
pri
or
per
iod
rev
alu
atio
n d
ecre
men
ts t
o in
com
e-
--
--
--
1,1
38-
-1,
138
Rev
alu
atio
n in
crem
ents
to
oth
er c
om
pre
hen
sive
inco
me
(ass
et r
eval
uat
ion
su
rplu
s)-
13
,904
-3
9,67
827
,73
99
,675
37,8
87
--
-1
28,
883
Wo
rk in
pro
gres
s ad
dit
ion
s -
--
--
--
--
92
,55
39
2,5
53
Tran
sfer
s b
etw
een
cla
sses
-(7
2)
72
--
--
--
--
Init
ial r
eco
gnit
ion
of
dis
cove
red
ass
ets
**-
--
2,02
81
,39
51
,732
15,3
91
--
-2
0,5
46
Tota
l gro
ss v
alu
e o
f p
rop
erty
, pla
nt
and
eq
uip
men
t -
at c
ost
--
72,2
12
--
--
-8
,18
03
5,0
59
11
5,4
51
Tota
l gro
ss v
alu
e o
f p
rop
erty
, pla
nt
and
eq
uip
men
t -
at f
air
valu
e89
,21
82
64
,970
-1
,20
0,47
96
90,1
51
58
2,7
445
79,9
91
29
,733
--
3,4
37,
286
Tota
l gro
ss v
alu
e o
f p
rop
erty
, pla
nt
and
eq
uip
men
t89
,21
82
64
,970
72,2
12
1,2
00,
479
690
,15
15
82
,744
579
,99
12
9,7
338
,18
03
5,0
59
3,5
52,
737
Op
enin
g ac
cum
ula
ted
dep
reci
atio
n-
43
,672
40,0
87
31
1,09
72
53,3
40
21
8,0
821
76,3
40
9,4
794
,79
4-
1,0
56,
891
Dep
reci
atio
n p
rovi
ded
in t
he
per
iod
-4
,354
7,0
51
19,
363
11,6
71
10
,307
4,6
56
518
765
-5
8,6
85
Dep
reci
atio
n o
n d
isp
osa
ls-
(212
)(2
,82
0)
--
--
--
-(3
,032
)
Dep
reci
atio
n o
n w
rite
-off
s-
(269
)(9
4)
(7,3
86
)(3
,71
4)(2
,107
)(4
15
)(1
78)
--
(14,
163
)
Dep
reci
atio
n o
n w
rite
-off
s (p
rio
r p
erio
d a
dju
stm
ent)
**-
(7)
-(3
78
)(9
78)
(561
)(5
,10
3)
--
-(7
,027
)
Imp
airm
ent
adju
stm
ent
to a
sset
rev
alu
atio
n s
urp
lus
(no
te 1
9)
-(1
,589
)-
--
--
--
-(1
,589
)
Rev
ersa
l of
pri
or
per
iod
rev
alu
atio
n d
ecre
men
ts t
o in
com
e-
--
--
--
488
--
488
Rev
alu
atio
n in
crem
ents
to
oth
er c
om
pre
hen
sive
inco
me
(ass
et r
eval
uat
ion
su
rplu
s)-
5,5
87-
11,
494
10,8
35
3,2
1912
,70
1-
--
43,
836
Tran
sfer
s b
etw
een
cla
sses
-(3
0)
30
--
--
--
--
Ad
just
men
ts a
nd
tra
nsf
ers
(ch
ange
in la
nd
fill
asse
ts -
no
te 1
7)
-(2
85)
--
--
--
--
(285
)
Init
ial r
eco
gnit
ion
of
dis
cove
red
ass
ets
**-
--
89
68
66
183
,47
2-
--
4,8
65
Tota
l acc
um
ula
ted
dep
reci
atio
n o
f p
rop
erty
, pla
nt
and
eq
uip
men
t-
51
,221
44,2
54
33
4,27
92
71,8
40
22
9,5
581
91,6
51
10
,307
5,5
59
-1
,13
8,6
69
Tota
l net
bo
ok
valu
e o
f p
rop
erty
, pla
nt
and
eq
uip
men
t89
,21
82
13
,749
27,9
58
86
6,20
04
18,3
11
35
3,1
863
88,3
40
19
,426
2,6
21
35
,05
92
,41
4,0
68
Ran
ge o
f es
tim
ated
use
ful l
ife
in y
ears
Lan
d -
no
t
de
pre
ciat
ed
30
-10
03-
10
15
-15
02
0-8
01
2-1
00
60-
140
30-
90
7-1
00
*Ass
et a
dd
itio
ns
com
pri
se
Ass
et r
enew
als
-2
,284
2,6
67
19,
205
6,6
55
1,9
242
,46
04
,028
275
-3
9,4
98
Oth
er a
dd
itio
ns
75
22
,571
6,8
77
25,
438
7,6
11
1,4
805
,59
41
,826
736
-5
2,8
85
Tota
l ass
et a
dd
itio
ns
75
24
,855
9,5
44
44,
643
14,2
66
3,4
048
,05
45
,854
1,0
11
-9
2,3
83
30
Ju
ne
20
18
Lan
d
Bu
ildin
gs a
nd
site
imp
rove
men
ts
Pla
nt
and
equ
ipm
ent
Ro
ad a
nd
bri
dge
net
wo
rk
Wat
er
infr
astr
uct
ure
Sew
erag
e
infr
astr
uct
ure
Sto
rmw
ater
dra
inag
e
Co
asta
l
infr
astr
uct
ure
Oth
er a
sset
sW
ork
s in
pro
gres
sTo
tal
**Th
ea
bo
veta
ble
incl
ud
esth
en
etim
pa
cto
fre
cord
ing
the
init
ial
reco
gn
itio
no
fd
isco
vere
da
sset
s,a
nd
ass
ets
wri
tten
off
rela
tin
gto
pri
or
per
iod
s.M
an
ag
emen
th
ave
no
tp
rese
nte
da
rest
ate
dp
rio
rp
erio
dp
osi
tio
na
sth
en
etim
pa
cto
fth
eer
rors
iden
tifi
ed is
no
t co
nsi
der
ed m
ate
ria
l in
acc
ord
an
ce w
ith
AA
SB 1
08
Acc
ou
nti
ng
Po
licie
s, C
ha
ng
es in
Acc
ou
nti
ng
Est
ima
tes
an
d E
rro
rs.
| 73Annual Report 2018/19

Fraser Coast Regional Council
Notes to the financial statementsfor the year ended 30 June 2019
Note 14. Property, plant and equipment continued
14 (a) Recognition
14 (b) Measurement
14 (c) Depreciation
Direct labour, materials and direct overheads incurred in the acquisition or construction of assets are also included in their
cost.
Property, plant and equipment received in the form of contributions, are recognised as assets and revenues at fair value.
Assets are depreciated from the date of acquisition or, in respect of internally constructed assets, from the time an asset is
completed and commissioned ready for use, at which time they are reclassified from work in progress to the appropriate
property, plant and equipment class.
Land is not depreciated as it has an unlimited useful life. Depreciation on other property, plant and equipment assets is
calculated on a straight-line basis so as to write-off the net cost or revalued amount of each depreciable asset, less its
estimated residual value, progressively over its estimated useful life to the Council. Management believe that the straight-line
basis appropriately reflects the pattern of consumption of all Council assets.
Plant and equipment with a total value of less than $5,000, and infrastructure assets and buildings with a total value of less
than $5,000 are treated as an expense in the year of acquisition. All other items of property, plant and equipment are
capitalised.
Replacement of a major component of an asset, in order to maintain its service potential, is treated as the acquisition of a new
asset. However, routine operating maintenance, repair costs and minor renewals to maintain the operational capacity and
useful life of the non-current asset is expensed as incurred.
Expenditure incurred in accordance with Natural Disaster Relief and Recovery Arrangements on road assets is analysed to
determine whether the expenditure is capital in nature. The analysis of the expenditure requires Council engineers to review
the nature and extent of expenditure on a given asset. For example, expenditure that patches a road is generally maintenance
in nature, whereas a kerb to kerb rebuild is treated as capital. Material expenditure that extends the useful life or renews the
service potential of the asset is capitalised.
Property, plant and equipment assets are initially recorded at cost. Subsequently, each class of property, plant and equipment
is stated at cost or fair value less, where applicable, any accumulated depreciation and accumulated impairment loss.
Cost is determined as the fair value of the assets given as consideration plus costs incidental to the acquisition, including
freight in, architect's fees and engineering design fees and all other establishment costs.
Where assets have separately identifiable components that are subject to regular replacement, these components are
assigned useful lives distinct from the asset to which they relate. Any expenditure that increases the originally assessed
capacity or service potential of an asset is capitalised and the new depreciable amount is depreciated over the remaining
useful life of the asset to the Council.
Depreciation methods, estimated useful lives and residual values of property, plant and equipment assets are reviewed at the
end of each reporting period and adjusted where necessary to reflect any changes in the pattern of consumption, physical
wear and tear, technical or commercial obsolescence, or management intentions. The condition assessments performed as
part of the annual valuation process for assets measured at written down current replacement cost are used to estimate the
useful lives of these assets at each reporting date.
74 | Annual Report 2018/19
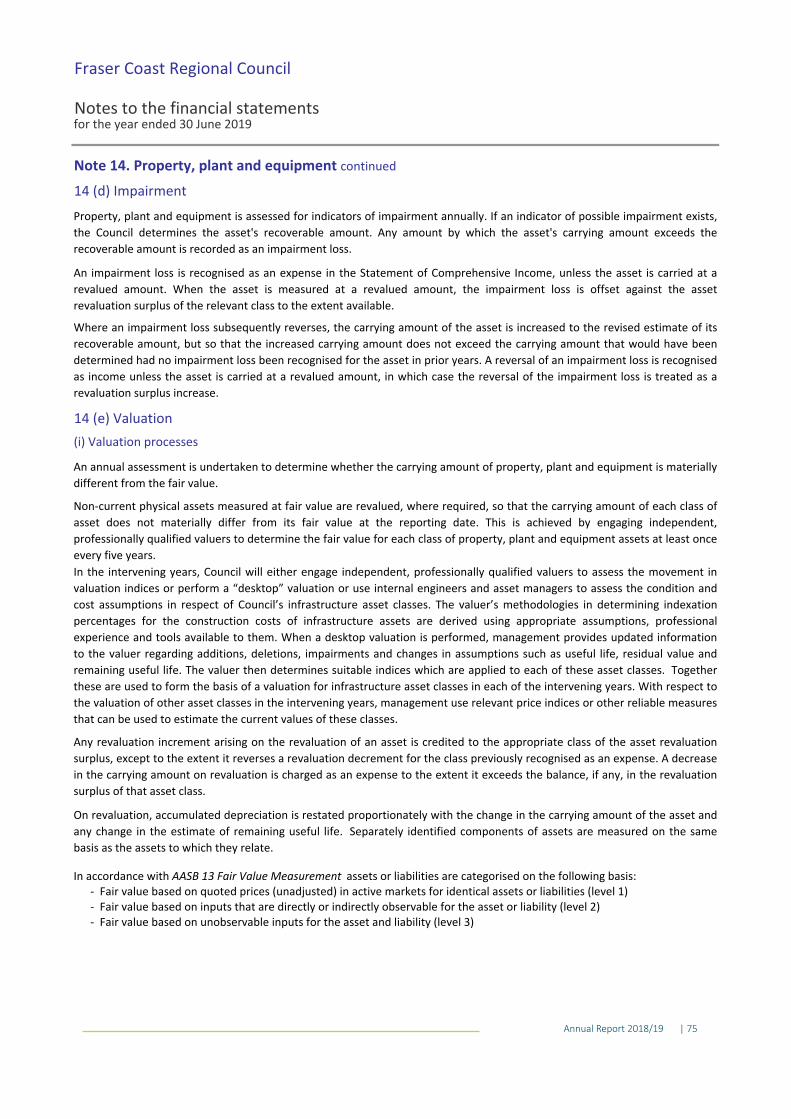
Fraser Coast Regional Council
Notes to the financial statementsfor the year ended 30 June 2019
Note 14. Property, plant and equipment continued
14 (d) Impairment
14 (e) Valuation
(i) Valuation processes
Any revaluation increment arising on the revaluation of an asset is credited to the appropriate class of the asset revaluation
surplus, except to the extent it reverses a revaluation decrement for the class previously recognised as an expense. A decrease
in the carrying amount on revaluation is charged as an expense to the extent it exceeds the balance, if any, in the revaluation
surplus of that asset class.
On revaluation, accumulated depreciation is restated proportionately with the change in the carrying amount of the asset and
any change in the estimate of remaining useful life. Separately identified components of assets are measured on the same
basis as the assets to which they relate.
Property, plant and equipment is assessed for indicators of impairment annually. If an indicator of possible impairment exists,
the Council determines the asset's recoverable amount. Any amount by which the asset's carrying amount exceeds the
recoverable amount is recorded as an impairment loss.
An impairment loss is recognised as an expense in the Statement of Comprehensive Income, unless the asset is carried at a
revalued amount. When the asset is measured at a revalued amount, the impairment loss is offset against the asset
revaluation surplus of the relevant class to the extent available.
Where an impairment loss subsequently reverses, the carrying amount of the asset is increased to the revised estimate of its
recoverable amount, but so that the increased carrying amount does not exceed the carrying amount that would have been
determined had no impairment loss been recognised for the asset in prior years. A reversal of an impairment loss is recognised
as income unless the asset is carried at a revalued amount, in which case the reversal of the impairment loss is treated as a
revaluation surplus increase.
In accordance with AASB 13 Fair Value Measurement assets or liabilities are categorised on the following basis: - Fair value based on quoted prices (unadjusted) in active markets for identical assets or liabilities (level 1) - Fair value based on inputs that are directly or indirectly observable for the asset or liability (level 2)
Non-current physical assets measured at fair value are revalued, where required, so that the carrying amount of each class of
asset does not materially differ from its fair value at the reporting date. This is achieved by engaging independent,
professionally qualified valuers to determine the fair value for each class of property, plant and equipment assets at least once
every five years.
In the intervening years, Council will either engage independent, professionally qualified valuers to assess the movement in
valuation indices or perform a “desktop” valuation or use internal engineers and asset managers to assess the condition and
cost assumptions in respect of Council’s infrastructure asset classes. The valuer’s methodologies in determining indexation
percentages for the construction costs of infrastructure assets are derived using appropriate assumptions, professional
experience and tools available to them. When a desktop valuation is performed, management provides updated information
to the valuer regarding additions, deletions, impairments and changes in assumptions such as useful life, residual value and
remaining useful life. The valuer then determines suitable indices which are applied to each of these asset classes. Together
these are used to form the basis of a valuation for infrastructure asset classes in each of the intervening years. With respect to
the valuation of other asset classes in the intervening years, management use relevant price indices or other reliable measures
that can be used to estimate the current values of these classes.
An annual assessment is undertaken to determine whether the carrying amount of property, plant and equipment is materially
different from the fair value.
- Fair value based on unobservable inputs for the asset and liability (level 3)
| 75Annual Report 2018/19

Fraser Coast Regional Council
Notes to the financial statementsfor the year ended 30 June 2019
Note 14. Property, plant and equipment continued
2019
Recurring fair value measurementsLandBuildings and site improvementsRoad and bridge networkWater infrastructureSewerage infrastructureStormwater drainageCoastal infrastructureBiological assetsTotalNon-recurring fair value measurementsLand held for development and resale
2018
Recurring fair value measurementsLandBuildings and site improvementsRoad and bridge networkWater infrastructureSewerage infrastructureStormwater drainageCoastal infrastructureBiological assetsTotalNon-recurring fair value measurementsLand held for development and resale
353,186
5,518
89,218
-
418,311
-
740
866,200
19,426
353,186
14 89,218 -
425 213,324
- 19,426
Total
14
866,200
-
-
Level 3
14 213,749
395,727
14
2,349,170
14
2,305,921 2,405,430
13 4,229 - 4,229
14 -
13
- 740
2,259,527
5,518
89,643
14
14
417,083
14 - 358,788 358,788
- 395,727
14 420 220,314 220,734
18,876
894,34814 - 894,348
There were no transfers between levels 1 and 2 during the year, nor between levels 2 and 3.
Council's policy is to recognise transfers in and out of the fair value hierarchy levels as at the end of the reporting period.
The following table categorises fair value measurements as either level 2 or level 3 in accordance with AASB 13. Council does
not have any assets or liabilities measured at fair value which meet the criteria for categorisation as level 1.
The fair values of the assets are determined using valuation techniques which maximise the use of observable data, where it is
available, and minimise the use of entity specific estimates. If all significant inputs required to fair value an asset are
observable, the asset is included in level 2. If one or more of the significant inputs is not based on observable market data, the
asset is included in level 3. This is the case for Council infrastructure assets, which are of a specialist nature for which there is
no active market for similar or identical assets. These assets are valued using a combination of observable and unobservable
inputs.
18,876
The table below presents Council's assets measured and recognised at fair value at 30 June 2019.
-
Level 2 Level 3 Total
14
14
$'000
Level 2
14 99,089 - 99,089
$'000 $'000
785
- 417,083
418,311
-
$'000 $'000 $'000
388,340 388,340
785
99,509
76 | Annual Report 2018/19

Fraser Coast Regional Council
Notes to the financial statementsfor the year ended 30 June 2019
Note 14. Property, plant and equipment continued
(ii) Valuation techniques used to derive fair values for level 2 and level 3 valuations
The estimates of residual value, useful life, pattern of consumption and asset condition that are used to calculated
accumulated depreciation comprise unobservable inputs (level 3). Where these other inputs are significant to the valuation,
the overall valuation has been classified as level 3.
The cumulative change in the overall fair value of buildings for the period mentioned above was between 1.5% and 2.0%. As
this is below Council's threshold for accounting for the impact of revaluation of 5%, it has been determined that there had not
been a material change in the fair value of building and site improvement assets at 30 June 2019.
Buildings and site improvements (level 2 and 3)
The fair value of buildings and site improvements of Council were determined by independent valuer, APV, effective 30 June
2016, with fair value of buildings of the former Wide Bay Water Corporation (WBWC) also being determined by APV, effective
30 June 2015. Indices were supplied by APV for the period 1 July 2016 to 30 June 2018 for Council and 1 July 2015 to 30 June
2018 for the former WBWC building assets and applied to building values effective 30 June 2018. For the current reporting
period, APV supplied indices for the period 1 July 2018 to 30 June 2019.
Land (level 2)
Land fair values of Council were determined by independent valuer, APV, effective 30 June 2019. The land fair values have
been measured by the market approach by direct comparison, an accepted valuation methodology under AASB 13. Level 2
valuation inputs were utilised, being sales transactions of other properties within the region, and adjusted for differences
between key attributes of the properties. The main input is the price per square metre or price per hectare of land area. The
market approach is deemed a level 2 input.
Specific valuation techniques used to value Council assets comprise:
Land classified as held for sale during the reporting period (Council) was measured at the lower of its carrying amount and fair
value less cost to sell at the time of reclassification. The fair value of the land was determined using the sales comparison
approach.
All assets valued using only level 2 valuation inputs were physically inspected to assess the physical condition and how they
may impact the assets highest and best use to potential market participants and ultimately its market value. For assets valued
using the cost approach, all were physically inspected at the time of the comprehensive valuations in 2015 (WBWC) and 2016
(Council), which included validation of physical dimensions and characteristics.
Where there is an active and liquid market as evidenced by sales transactions of similar property types, the Market Approach
by direct comparison, Income or Summation methods can be utilised, and is an accepted valuation methodology under AASB
13. If a Market Approach is adopted, the building valuation is deemed to be a level 2 input.
Level 2 valuation inputs - Market (direct comparison) was used to determine the fair value of a range of properties. This
included residential properties where the relevant inputs were able to be observed from current market evidence. The
residential properties fair value was derived from sales prices of comparable properties after adjusting for differences in key
attributes such as property size.
Level 3 valuation inputs - Due to the predominantly specialised nature of local government buildings, as well as some
residential properties that were located in isolated locations where there was no evidence to support a market approach, the
valuations have been undertaken on a cost approach (current replacement cost), an accepted valuation methodology under
AASB 13. Various sources were utilised by APV in calculating replacement cost including actual construction or purchase prices
for projects paid by Council, Rawlinson's Construction Guide or similar guides (such as Cordells), development of costs using
first principles. APV have also developed a number of models for specific asset types, and benchmarking against other
valuations as well as a database built up from research of building and site improvement costs.
| 77Annual Report 2018/19

Fraser Coast Regional Council
Notes to the financial statementsfor the year ended 30 June 2019
Note 14. Property, plant and equipment continued
All road and bridge network and stormwater drainage network infrastructure assets were valued by independent valuer APV as
at 30 June 2016 using level 3 valuation inputs under the cost approach. Indices were supplied by independent valuer, APV, for
the period 1 July 2016 to 30 June 2018 for these asset classes and applied to the value of the assets. For the current reporting
period, APV supplied indices for the period 1 July 2018 to 30 June 2019. Those indices suggested that there were changes in
the components of this class of assets of between 0.8% and 3.3%. As Council's threshold for accounting for the impact of
revaluation is 5%, it was determined that there had not been a material change in the fair value of road, bridge and
stormwater drainage network infrastructure assets at 30 June 2019 resulting from the change in indices.
The main level 3 input used was derived and evaluated as follows:
Coastal infrastructure assets
The approach estimated the replacement cost for each asset by componentising the assets into significant parts with different
useful lives and taking into account a range of factors. While the unit rates based on square metres or similar capacity could
be supported from market evidence (level 2) other inputs (such as estimates of residual value, useful life, pattern of
consumption and asset condition) required extensive professional judgement and impacted significantly on the determination
of fair value. As such these assets were classified as having been valued using level 3 valuation inputs.
Road, and bridge network and stormwater drainage infrastructure assets (level 3)
Asset condition - The nature of road network and stormwater network infrastructure is that there is a very large number of
assets which makes up the networks and as a result it is not physically possible to inspect every asset for the purposes of
completing a valuation. As a consequence reliance is placed on the accuracy of data held in the asset management system and
its associated internal controls. This includes regular planned inspections and updates to the system following maintenance
activities and renewal treatments. Likewise, especially for stormwater network infrastructure, a large portion of the portfolio
is located underground and may only be inspected on an irregular basis. During the reporting period, a condition assessment
was undertaken on Council's bridge network by Roadtek. This was carried out in accordance with the Department of Transport
and Main Roads Structures Inspection Manual. As a result, the fair value of the bridge network assets increased by $6.1 million.
A desktop valuation of coastal infrastructure assets was undertaken by independent valuers, APV, effective 30 June 2016. Each
asset is assessed individually, with the valuation varying according to the material type used for construction, condition and
size. Indices were supplied by independent valuer, APV for the period 1 July 2016 to 30 June 2018 and applied to this asset
class. APV supplied indices for the period 1 July 2018 to 30 June 2019. The indices suggested that there were changes in the
components of this class of assets of 2.0%. As Council's threshold for accounting for the impact of revaluation is 5.0%, it was
determined that there had not been a material change in the fair value of coastal infrastructure assets at 30 June 2019.
The coastal infrastructure asset class is wholly comprised of specialised assets. These specialised assets were valued using the
cost approach using professionally qualified registered valuers. The approach estimated the replacement cost for each asset by
componentising the asset into significant parts with different useful lives and taking into account a range of factors. These
include the average cost of construction and consumption score for each component. As these are supported by observable
market evidence they have been classified as level 2 inputs. The unobservable inputs (such as estimates of residual value,
useful life, pattern of consumption and asset condition and its relationship to the assessed level of remaining service potential
of the depreciable amount) required extensive professional judgement and impacted significantly on the final determination of
fair value. As such these assets were classified as having been valued using level 3 valuation inputs.
Fraser Coast Regional Council
Notes to the financial statementsfor the year ended 30 June 2019
Note 14. Property, plant and equipment continued
• Depth factors - The depth of the trench (e.g. trenching above 1.5m requires shoring/trench cage which increases costs and
slows production).
Accumulated depreciation
APV cost models were derived from the following sources:
For sewer gravity mains, the assumption that the pipes will be relined was adopted. The fair value for sewer gravity mains was
determined as follows.
• APV database• Development of costs models by APV• Benchmarking against other valuations
Water and sewerage infrastructure fair values were determined by an independent valuer, APV, as at 30 June 2016. All water
network infrastructure assets were valued using level 3 valuation inputs using the cost approach. Indices were supplied by
independent valuer, APV, for the period 1 July 2016 to 30 June 2018 and applied to these asset classes. APV supplied indices
for water and sewerage infrastructure assets for the period 1 July 2018 to 30 June 2019. The indices suggested that there were
changes in the components of this class of assets of between 0.0% and 2.7%. As Council's threshold for accounting for the
impact of revaluation is 5%, it was determined that there had not been a material change in the fair value of water and
sewerage infrastructure assets at 30 June 2019.
The approach estimated the replacement cost for each asset by componentising the assets into significant parts with different
useful lives and taking into account a range of factors. While the unit rates based on length, square metres or similar capacity
could be supported from market evidence (level 2) other inputs (such as estimates of residual value, useful life, pattern of
consumption and asset condition) required extensive professional judgement and impacted significantly on the final
determination of fair value. As such these assets were classified as having been valued using level 3 valuation inputs.
The Fraser Coast region is split into 4 distinct areas based on geographic (rural/urban/high density urban/CBD) and
environmental factors (sand/acid/sulphate, soil/soft, rock/hard rock). Council assumes that these factors are consistent across
each of the 4 regions and that costs of labour are consistent within each of these regions, depending on the materials used.
Valuation unit rates (replacement costs) allow for factoring in project overheads including survey, environmental and
investigation costs, engineering design, engineering supervision and project management.
In determining accumulated depreciation, assets were either subject to a site inspection or an assessment to determine
remaining useful life.
Where site inspections were not conducted (i.e. for passive assets and active assets for which no site inspections were
undertaken), the remaining useful life was calculated on an age basis after taking into consideration current and planned
maintenance records.
• For all pipes, replacement cost was determined based on replacement value by trench excavation, useful life was determined
as the pipe useful life plus the reline useful life, and the pipe fair value was based on age.
• Where pipes have been relined, the total pipe useful life was determined as the pipe age when the reline occurred plus the
reline life.
• Suppliers' quotations and actual prices paid by Council• Rawlinson's rates for building and construction, and
Water and sewerage infrastructure assets (level 3)
• The relining of pipes was valued at reline unit rates and depreciated over the reline life (50 years). The reline fair value was
based on age.
Factors taken into account in determining replacement costs included:
• Development factors - The area in which development takes place (e.g. rural areas would have little or no restoration
requirements, whereas a high density area would have large amounts of high quality footpaths, road pavements and
associated infrastructure that would require reinstatement, and would also require traffic control).
• Soil factors - The types of soil or other surface material (e.g. areas where soil is sandy are difficult to excavate and would
require shoring while areas where the soil is generally free of rock would not present any great difficulty for excavation).
78 | Annual Report 2018/19

Fraser Coast Regional Council
Notes to the financial statementsfor the year ended 30 June 2019
Note 14. Property, plant and equipment continued
• Depth factors - The depth of the trench (e.g. trenching above 1.5m requires shoring/trench cage which increases costs and
slows production).
Accumulated depreciation
APV cost models were derived from the following sources:
For sewer gravity mains, the assumption that the pipes will be relined was adopted. The fair value for sewer gravity mains was
determined as follows.
• APV database• Development of costs models by APV• Benchmarking against other valuations
Water and sewerage infrastructure fair values were determined by an independent valuer, APV, as at 30 June 2016. All water
network infrastructure assets were valued using level 3 valuation inputs using the cost approach. Indices were supplied by
independent valuer, APV, for the period 1 July 2016 to 30 June 2018 and applied to these asset classes. APV supplied indices
for water and sewerage infrastructure assets for the period 1 July 2018 to 30 June 2019. The indices suggested that there were
changes in the components of this class of assets of between 0.0% and 2.7%. As Council's threshold for accounting for the
impact of revaluation is 5%, it was determined that there had not been a material change in the fair value of water and
sewerage infrastructure assets at 30 June 2019.
The approach estimated the replacement cost for each asset by componentising the assets into significant parts with different
useful lives and taking into account a range of factors. While the unit rates based on length, square metres or similar capacity
could be supported from market evidence (level 2) other inputs (such as estimates of residual value, useful life, pattern of
consumption and asset condition) required extensive professional judgement and impacted significantly on the final
determination of fair value. As such these assets were classified as having been valued using level 3 valuation inputs.
The Fraser Coast region is split into 4 distinct areas based on geographic (rural/urban/high density urban/CBD) and
environmental factors (sand/acid/sulphate, soil/soft, rock/hard rock). Council assumes that these factors are consistent across
each of the 4 regions and that costs of labour are consistent within each of these regions, depending on the materials used.
Valuation unit rates (replacement costs) allow for factoring in project overheads including survey, environmental and
investigation costs, engineering design, engineering supervision and project management.
In determining accumulated depreciation, assets were either subject to a site inspection or an assessment to determine
remaining useful life.
Where site inspections were not conducted (i.e. for passive assets and active assets for which no site inspections were
undertaken), the remaining useful life was calculated on an age basis after taking into consideration current and planned
maintenance records.
• For all pipes, replacement cost was determined based on replacement value by trench excavation, useful life was determined
as the pipe useful life plus the reline useful life, and the pipe fair value was based on age.
• Where pipes have been relined, the total pipe useful life was determined as the pipe age when the reline occurred plus the
reline life.
• Suppliers' quotations and actual prices paid by Council• Rawlinson's rates for building and construction, and
Water and sewerage infrastructure assets (level 3)
• The relining of pipes was valued at reline unit rates and depreciated over the reline life (50 years). The reline fair value was
based on age.
Factors taken into account in determining replacement costs included:
• Development factors - The area in which development takes place (e.g. rural areas would have little or no restoration
requirements, whereas a high density area would have large amounts of high quality footpaths, road pavements and
associated infrastructure that would require reinstatement, and would also require traffic control).
• Soil factors - The types of soil or other surface material (e.g. areas where soil is sandy are difficult to excavate and would
require shoring while areas where the soil is generally free of rock would not present any great difficulty for excavation).
| 79Annual Report 2018/19

Fraser Coast Regional Council
Notes to the financial statementsfor the year ended 30 June 2019
Note 15. Trade and other payables
Creditors and accrualsAnnual leaveOther employee entitlementsEmployee related accruals
Note 16. Borrowings
Current
Loans - QTC
Non-current
Loans - QTC
Reconciliation of loan movements for the year
Balance as at 1 JulyPrincipal repaymentsBalance as at 30 June
72,997
2019 2018
17,382
$'000$'000
123,513
266
As Council does not have an unconditional right to defer settlement of the annual leave beyond twelve months after the
reporting date, annual leave is classified as a current liability.
23,604
Creditors are recognised when goods or services are received, at the amount owed. Amounts owing are unsecured and are
generally settled on 30 day terms.
17,016
17,016
Liabilities are recognised for employee benefits such as wages and salaries, annual and long service leave in respect of
services provided by the employees up to the reporting date. The liability is calculated using the present value of
remuneration rates that will be paid when the liability is expected to be settled and includes related on-costs.
89,798
5,533
72,997 89,798
17,382
17,831
5,059
20,250
26,685
548
354
448
Borrowings are initially recognised at fair value plus any directly attributable transaction costs. Thereafter, they are
measured at amortised cost. Principal and interest repayments are made quarterly in arrears.
All borrowings are denominated in Australian dollars and interest is expensed as it accrues. No interest has been capitalised
during the current or comparative reporting period. Expected final repayment dates vary from 15 September 2019 to 15
December 2030. There have been no defaults or breaches of the loan agreement during the period.
No assets have been pledged as security by Council for any liabilities, however all loans are guaranteed by the Queensland
Government.
107,180
Council adopts an annual debt policy that sets out Council's planned borrowings for the next nine years. Council's current
policy is to only borrow for capital projects and for a term no longer than the expected life of the asset. Council also aims to
comply with the Queensland Treasury Corporation's borrowing guidelines and ensure that sustainability indicators remain
within acceptable levels at all times.
(16,333)
107,180
(17,167)
The QTC loan market value at the reporting date was $103,425,193 (2018: $119,072,643). This represents the value of the
debt if Council repaid it at that date. As it is the intention of Council to hold the debt for the term, no provision is required
to be made in these statements.
90,013
Note
Fraser Coast Regional Council
Notes to the financial statementsfor the year ended 30 June 2019
Note 17. Provisions
Current
Long service leaveRefuse restoration
Non-current
Long service leaveRefuse restoration
Balance as at 1 JulyAmount provided for in the periodAmount paid in the periodBalance as at 30 June
Balance as at 1 July
Balance as at 30 June
Refuse restoration
(928)
687
Details of movements in refuse restoration provision:
Increase/(decrease) in provision due to change in discount rate
8Increase in provision due to unwinding of discount
779
5,810
Long service leave
Refuse restoration
16,877
This is the present value of the estimated cost of restoring Council's landfill sites to a useable state at the end of their useful
lives. The projected cost is the present value of the estimated cost of restoring the landfill sites after closure and allowing a
period for settlement. Expected closure dates to the public of the sites range from 2020 to 2030 and expenditure is
expected from 2020 to 2065.
Note
16,463
Where employees have met the prerequisite length of service and council does not have an unconditional right to defer this
liability beyond 12 months long service leave is classified as a current liability. Otherwise it is classified as non-current.
285
16,668
The provision for long service leave represents the present value of the estimated future cash outflows to be made in
respect of services provided by employees up to the reporting date. The liability is calculated using current pay rates and
projected future increases in those rates and includes related employee on-costs. The estimates are adjusted for the
probability of the employee remaining in the Council's employment or other associated employment which would result in
the Council being required to meet the liability. Adjustments are then made to allow for the proportion of the benefit
earned to date, and the result is discounted to present value. The interest rates attaching to Commonwealth Government
guaranteed securities at the reporting date are used to discount the estimated future cash outflows to their present value.
16,520
The provision represents the present value of the anticipated future costs associated with the closure of the landfill sites,
decontamination and monitoring of historical residues and leaching on these sites. The calculation of this provision requires
assumptions such as application of environmental legislation, site closure dates, available technologies and engineering cost
estimates. These uncertainties may result in future actual expenditure differing from amounts currently provided. Because
of the long-term nature of the liability, the most significant uncertainty in estimating the provision is the costs that will be
incurred. The provision recognised for landfill sites is reviewed at least annually and updated based on the facts and
circumstances available at the time. Changes in the provision are recognised as an expense.
17,310
10(b)
5,820
16,807
32
6,079
(1,048)
6,177
(764)
15,552
5,168
A provision is made for the cost of restoration in respect of landfill sites where it is probable Council will be liable, or
required, to incur such a cost on the cessation of use of these facilities. The provision is measured at the expected cost of
the work required; discounted to current day values using the average interest rate of Council’s term investments at
30 June 2019.
2019
414 642
$'000 $'0002018
14
445
Change in the value of landfill assets
13957
5,810
5,763
16,807
5,307
1,295
Details of movements in long service leave provision:
283
80 | Annual Report 2018/19

Fraser Coast Regional Council
Notes to the financial statementsfor the year ended 30 June 2019
Note 17. Provisions
Current
Long service leaveRefuse restoration
Non-current
Long service leaveRefuse restoration
Balance as at 1 JulyAmount provided for in the periodAmount paid in the periodBalance as at 30 June
Balance as at 1 July
Balance as at 30 June
Refuse restoration
(928)
687
Details of movements in refuse restoration provision:
Increase/(decrease) in provision due to change in discount rate
8Increase in provision due to unwinding of discount
779
5,810
Long service leave
Refuse restoration
16,877
This is the present value of the estimated cost of restoring Council's landfill sites to a useable state at the end of their useful
lives. The projected cost is the present value of the estimated cost of restoring the landfill sites after closure and allowing a
period for settlement. Expected closure dates to the public of the sites range from 2020 to 2030 and expenditure is
expected from 2020 to 2065.
Note
16,463
Where employees have met the prerequisite length of service and council does not have an unconditional right to defer this
liability beyond 12 months long service leave is classified as a current liability. Otherwise it is classified as non-current.
285
16,668
The provision for long service leave represents the present value of the estimated future cash outflows to be made in
respect of services provided by employees up to the reporting date. The liability is calculated using current pay rates and
projected future increases in those rates and includes related employee on-costs. The estimates are adjusted for the
probability of the employee remaining in the Council's employment or other associated employment which would result in
the Council being required to meet the liability. Adjustments are then made to allow for the proportion of the benefit
earned to date, and the result is discounted to present value. The interest rates attaching to Commonwealth Government
guaranteed securities at the reporting date are used to discount the estimated future cash outflows to their present value.
16,520
The provision represents the present value of the anticipated future costs associated with the closure of the landfill sites,
decontamination and monitoring of historical residues and leaching on these sites. The calculation of this provision requires
assumptions such as application of environmental legislation, site closure dates, available technologies and engineering cost
estimates. These uncertainties may result in future actual expenditure differing from amounts currently provided. Because
of the long-term nature of the liability, the most significant uncertainty in estimating the provision is the costs that will be
incurred. The provision recognised for landfill sites is reviewed at least annually and updated based on the facts and
circumstances available at the time. Changes in the provision are recognised as an expense.
17,310
10(b)
5,820
16,807
32
6,079
(1,048)
6,177
(764)
15,552
5,168
A provision is made for the cost of restoration in respect of landfill sites where it is probable Council will be liable, or
required, to incur such a cost on the cessation of use of these facilities. The provision is measured at the expected cost of
the work required; discounted to current day values using the average interest rate of Council’s term investments at
30 June 2019.
2019
414 642
$'000 $'0002018
14
445
Change in the value of landfill assets
13957
5,810
5,763
16,807
5,307
1,295
Details of movements in long service leave provision:
283

Fraser Coast Regional Council
Notes to the financial statementsfor the year ended 30 June 2019
Note 18. Other liabilities
CurrentUnearned revenueConstruction retentionsWaste levy refund received in advanceOther LiabilitiesTOTAL CURRENT OTHER LIABILITIES
Note 19. Asset revaluation surplus
Movements in the asset revaluation surplus:
Balance as at 1 July
LandBuildings and site improvementsRoad and bridge networkWater infrastructureSewerage infrastructureStormwater drainage
Less impairment:Buildings and site improvements
Net movements in the asset revaluation surplus
Balance as at 30 June
Asset revaluation surplus analysis
LandBuildings and site improvementsRoad and bridge networkWater infrastructureSewerage infrastructureStormwater drainage
Balance as at 30 June
170
2,857
-
2019
-
183
$'000
15,801
-
6,254
When an asset is disposed of, the amount reported in surplus in respect of that asset is retained in the asset revaluation
surplus and not transferred to retained surplus.
14
14
Net adjustment to non-current assets at end of period to reflect a
change in current fair value:
-
100,102
69,049
635,725
207,371
100,102
(1,589)
651,526
549,089635,725
Where a class of assets is decreased on revaluation, that decrease is offset first against the amount remaining in the asset
revaluation surplus in respect of that class. Any excess is treated as an expense.
25,186
6,456
88,225
28,184
-
-
16,904
135,433
-
The asset revaluation surplus comprises adjustments relating to changes in value of property, plant and equipment that do
not result from the use of those assets. Net incremental changes in the carrying value of classes of non-current assets since
their initial recognition are accumulated in the asset revaluation surplus. Increases and decreases on revaluation are offset
within a class of assets.
1,193
2018
The State government made an advance payment to Council in June 2019 to mitigate the impacts on households for 2019-
20 of the State Waste Levy, which takes effect from 1 July 2019. The Council will be liable to the State for payment of the
Levy on most forms of commercial and household waste delivered to its disposal sites from 1 July 2019. The State is
required to make an annual payment to the Council that essentially refunds the Council for the portion of the Levy that
relates to households. Council will fund the portion of the Levy that relates to commercial waste through charges to
commercial users of disposal sites from 1 July 2019. As the receipt from the State in June 2019 is for a refund of Council's
2019-20 Levy expense, the full amount has been recognised as a liability as at 30 June 2019.
$'000
-
1,151 1,010
9,547
4,433
11,495
Note
255
(1,589)
-
86,636
24,973
135,433
114,598
201,117
69,049
635,725
15,801
651,526
15,426
The closing balance of the asset revaluation surplus comprises the
following asset categories:
114,598
14

Fraser Coast Regional Council
Notes to the financial statementsfor the year ended 30 June 2019
Note 20. Commitments for expenditure
(a) Contractual commitments (exclusive of GST)
Infrastructure contractsPest controlGarbage collection contractCleaning, landscaping and ranger servicesSecurity screening
These expenditures are payable as follows:Within the next yearLater than one year and not later than 5 yearsTotal payable
(b) Operating leases (non-cancellable)
Within one yearOne to five years 155
Payments made under operating leases are expensed in equal instalments over the accounting periods covered by the lease
term, except where an alternative basis is more representative of the pattern of benefits to be derived from the leased
property.
Council has three 1-year commercial building leases ending between 14 January 2020 and 30 April 2020 with renewal
options for 1 year at Council's discretion. Council holds a further 20-year commercial building lease ending 30 September
2020.
During the year an amount of $248,083 (2018: $101,702) was recognised as an expense in the Statement of Profit or Loss in
respect of operating leases.
1,474
9,601
38,633
38,633
689413
14,621
41,104
846
2018
24,012
779
Contractual expenditure committed for as at 30 June but not recognised in the financial statements as liabilities:
41,104
18,102
$'000
31,503
2019
26,331
367
$'000
13,602
2525
18,186
279
Note
Minimum lease payments in relation to non-cancellable operating leases are as follows:
410
258
| 83Annual Report 2018/19

Fraser Coast Regional Council
Notes to the Financial Statementsfor the year ended 30 June 2019
Note 21. Contingent liabilities
Legal claims
Local Government Mutual
Local Government Workcare
Council has not provided for any amounts to date in relation to these claims on the basis that it has either
assessed that no material outflow of economic benefit is probable, or that such outflows cannot be reliably
estimated at this stage. Further information in respect of individual claims has not been disclosed in accordance
with AASB 137 Provisions, Contingent Liabilities and Contingent Assets on the basis that Council considers such
disclosures would seriously prejudice the outcome of the claims.
Details and estimates of maximum amounts of contingent liabilities are as follows:
Council is a member of the local government mutual liability self-insurance pool, LGM Queensland. In the event
of the pool being wound up or it is unable to meet its debts as they fall due, the trust deed and rules provide
that any accumulated deficit will be met by the individual pool members in the same proportion as their
contribution is to the total pool contributions in respect to any year that a deficit arises.
As at 30 June 2018 the financial statements reported an accumulated surplus and it is not anticipated any
liability will arise.
Council is subject to a number of claims that arise as a result of its operations relating to ownership of public
assets, past and present employees and compensation with regards to the compulsory acquisition of land.
Management is currently considering a claim made by a Councillor.
Council is a member of the Queensland local government worker's compensation self-insurance scheme, Local
Government Workcare. Under this scheme Council has provided an indemnity towards a bank guarantee to
cover bad debts which may remain should the self insurance licence be cancelled and there was insufficient
funds available to cover outstanding liabilities. Only the Queensland Government’s Workers Compensation
Authority may call on any part of the guarantee should the above circumstances arise. Council's maximum
exposure to the bank guarantee is $1,292,220.
84 | Annual Report 2018/19

Fraser Coast Regional Council
Notes to the financial statementsfor the year ended 30 June 2019
Note 22. Superannuation - Regional Defined Benefit Fund
Superannuation contributions made to the Regional Defined Benefits FundOther superannuation contributions for employees
Contributions Council expects to make to the Regional Defined Benefits Fund for 2019-20
883
There are currently 62 entities contributing to the scheme and any changes in contribution rates would apply
equally to all 62 entities. Fraser Coast Regional Council made less than 4% of the total contributions to the plan
in the 2018-19 financial year.
Any amount by which the scheme is over or under funded may affect future benefits and result in a change to
the contribution rate but has not been recognised as an asset or liability of the Council.
The next triennial actuarial review is not due until 1 July 2021.
The most significant risks that may result in LGIAsuper increasing the contribution rate, on the advice of the
actuary, are:
Council contributes to the LGIAsuper Regional Defined Benefits Fund (the scheme), at the rate of 12% for each
permanent employee who is a defined benefit member. This rate is set in accordance with the LGIAsuper trust
deed and may be varied on the advice of an actuary. The Regional Defined Benefits Fund is a complying
superannuation scheme for the purpose of the Commonwealth Superannuation Industry (Supervision)
legislation and is also governed by the Local Government Act 2009 .
The scheme is a defined benefit plan; however, Council is not able to account for it as a defined benefit plan in
accordance with AASB119 because LGIAsuper is unable to account for its proportionate share of the defined
benefit obligation, plan assets and costs.
2019$'000
6,100
Technically Fraser Coast Regional Council can be liable to the scheme for a portion of another local governments’
obligations should that local government be unable to meet them. However the risk of this occurring is
extremely low and in accordance with the LGIAsuper trust deed changes to council's obligations will only be
made on the advice of an actuary.
The last completed actuarial assessment of the scheme was undertaken as at 1 July 2018. The actuary indicated
that “At the valuation date of 1 July 2018, the net assets of the scheme exceeded the vested benefits and the
scheme was in a satisfactory financial position as at the valuation date." The Council is not aware of anything
that has happened since that time that indicates the assets of the scheme are not sufficient to meet the vested
benefits, as at the reporting date.
5,217
Salary growth risk - The risk that wages or salaries will rise more rapidly than assumed, increasing vested benefits
to be funded.
2020
$'000
Investment risk - The risk that the scheme's investment returns will be lower than assumed and additional
contributions are needed to fund the shortfall.
No changes have been made to prescribed employer contributions which remain at 12% of employee assets and
there are no known requirements to change the rate of contributions.
855
6
$'000
5,444Total superannuation contributions paid by Council for employees
825
4,589
Note
2018

Fraser Coast Regional Council
Notes to the financial statementsfor the year ended 30 June 2019
Note 23. Controlled entities that have not been consolidated
Joint ventures
Unconsolidated controlled entities
Widelinx Pty Ltd
A maximum upper limit of Council's liability under the agreement is set at $4,859,235 which represents the
forfeiting of Council fees and nominal land value of the project. As the impact of this joint venture is not
expected to be material to Council's overall operations, and as there have only been minor set-up transactions
and development application fees incurred to the reporting date ($154,217 to 30 June 2017, nil in subsequent
reporting periods), no separate disclosures are intended to be made in the 2018/19 financial statements in
relation to this joint venture. Due to a number of ongoing issues with the development application, this joint
venture project is currently on hold.
Fraser Coast Regional Council has two controlled entities (one was deregistered in the reporting period) that are
not consolidated, because of their size and nature means they are not material to Council operations.
At the ordinary Council meeting held 25 March 2015, Council delegated to the CEO the authority to enter into a
Joint Venture Agreement and Deed of Consent to Security for the development of a residential airpark at the
Maryborough Airport. The joint venture agreement details that the relationship of the parties is that of a joint
venture and is limited to carrying out of the development. The development is being conducted by the
development entity Fraser Coast Residential Airpark Pty Ltd. The agreement is dated 14 April 2015. Works were
initially scheduled to commence in November 2015 and sales were not anticipated until the 2015/16 year.
However this was delayed due to the discovery of a boundary discrepancy which required minor zoning
amendments to be made to the town planning scheme. An operational works application has been lodged, with
works currently on hold.
Council is responsible for providing the land on which the joint venture is going to be developed. The agreement
states that land remains an asset of Council until sold. As the contractual arrangement dictates each parties
share in the profit or loss relating to the activities, and that each party is liable to the arrangement only to the
extent of their investments in the arrangement or their respective obligations to contribute to the arrangement,
this is an indication of a joint venture rather than a joint operation.
Following a number of changes to the ownership and corporate structure of IP systems between 2010 and 2016,
which saw that entity taken over and merged to initially become part of Amcom Telecommunications followed
by a takeover by Vocus Communications in addition to the expiry of a number of contracts that were entered
into by Widelinx, Vocus Communications ceased its business relationship with Widelinx during the previous
reporting period. Following a recommendation from the Board, Widelinx Pty Ltd ceased operations and was
deregistered effective January 2019.
Widelinx Pty Ltd was established by the then Hervey Bay City Council in January 2005 to oversee the operations
of a local communications venture. The Council formed a business relationship (the business venture to trade
under the name Widelinx) with a broadband internet provider (IP Systems) in February 2005 to address
opportunities for network solutions in Hervey Bay and Wide Bay to provide householders and businesses with
voice, data and other information and communications technology (ICT) services.
Fraser Coast Regional Council
Notes to the financial statementsfor the year ended 30 June 2019
Note 23. Controlled entities that have not been consolidated continued
Unconsolidated controlled entities continued
Fraser Coast Tourism and Events Ltd
Income and expensesOperating revenueOperating expensesNet result
AssetsCurrent assetsNon-current assets
LiabilitiesCurrent liabilitiesNon-current liabilities
Net assets
Fraser Coast and Events Ltd (FCTE) is a controlled entity of Council initially formed to undertake the functions of
Investment Attraction, Marketing, Events and Tourism Services on behalf of Council for the direct benefit of the
Fraser Coast Region. FCTE is a not-for-profit company limited by guarantee constituted under the Corporations
Act 2001 . The entity commenced operations on 1 July 2013 with transfer of Tourism Fraser Coast to the entity
on 1 September 2013. An interim board was appointed, with the permanent board appointed in February 2014.
The board currently consists of seven directors, including the Council CEO who was appointed in February 2018
following a vacancy arising on the board in December 2017.
Fraser Coast
Tourism and
Events Ltd
2019
32
949
109
1,058
440
292
732
The assets, liabilities and net results of operations for the year ended 30 June 2019 (unaudited) for Fraser Coast
Tourism and Events Ltd are summarised below:
$'000
3,299
326
On 4 May 2016, Council resolved that it should retain Fraser Coast Opportunities as a Registered Tourism
Organisation for Tourism, Events and Marketing, with the Investment Attraction function transferred back to
Council's Economic Development area. A 3-year funding agreement with the new entity commenced 1 July 2016
which expired 30 June 2019. At its meeting of 22 May 2019, Council endorsed a new 5-year Funding and
Accountability Agreement with FCTE.
(3,267)
86 | Annual Report 2018/19

Fraser Coast Regional Council
Notes to the financial statementsfor the year ended 30 June 2019
Note 23. Controlled entities that have not been consolidated continued
Unconsolidated controlled entities continued
Fraser Coast Tourism and Events Ltd
Income and expensesOperating revenueOperating expensesNet result
AssetsCurrent assetsNon-current assets
LiabilitiesCurrent liabilitiesNon-current liabilities
Net assets
Fraser Coast and Events Ltd (FCTE) is a controlled entity of Council initially formed to undertake the functions of
Investment Attraction, Marketing, Events and Tourism Services on behalf of Council for the direct benefit of the
Fraser Coast Region. FCTE is a not-for-profit company limited by guarantee constituted under the Corporations
Act 2001 . The entity commenced operations on 1 July 2013 with transfer of Tourism Fraser Coast to the entity
on 1 September 2013. An interim board was appointed, with the permanent board appointed in February 2014.
The board currently consists of seven directors, including the Council CEO who was appointed in February 2018
following a vacancy arising on the board in December 2017.
Fraser Coast
Tourism and
Events Ltd
2019
32
949
109
1,058
440
292
732
The assets, liabilities and net results of operations for the year ended 30 June 2019 (unaudited) for Fraser Coast
Tourism and Events Ltd are summarised below:
$'000
3,299
326
On 4 May 2016, Council resolved that it should retain Fraser Coast Opportunities as a Registered Tourism
Organisation for Tourism, Events and Marketing, with the Investment Attraction function transferred back to
Council's Economic Development area. A 3-year funding agreement with the new entity commenced 1 July 2016
which expired 30 June 2019. At its meeting of 22 May 2019, Council endorsed a new 5-year Funding and
Accountability Agreement with FCTE.
(3,267)
| 87Annual Report 2018/19
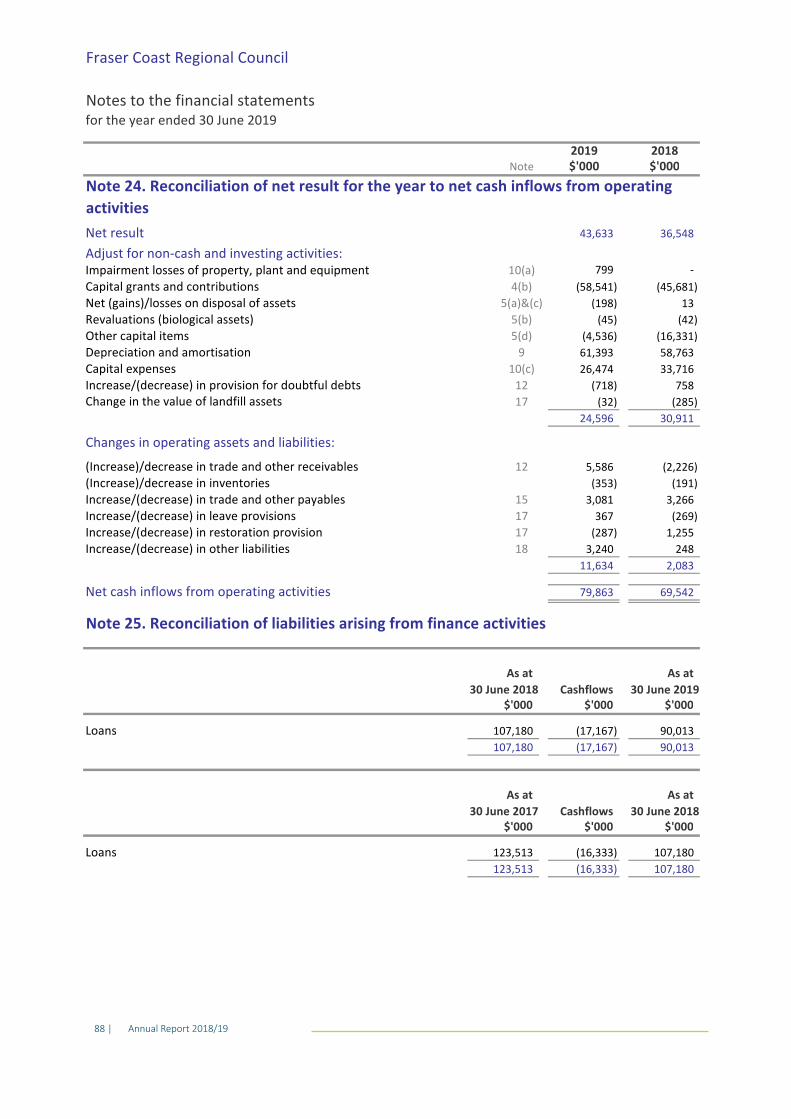
Fraser Coast Regional Council
Notes to the financial statementsfor the year ended 30 June 2019
Net result
Adjust for non-cash and investing activities:Impairment losses of property, plant and equipmentCapital grants and contributionsNet (gains)/losses on disposal of assetsRevaluations (biological assets)Other capital itemsDepreciation and amortisationCapital expensesIncrease/(decrease) in provision for doubtful debts
Changes in operating assets and liabilities:
(Increase)/decrease in trade and other receivables(Increase)/decrease in inventoriesIncrease/(decrease) in trade and other payablesIncrease/(decrease) in leave provisionsIncrease/(decrease) in restoration provisionIncrease/(decrease) in other liabilities
Net cash inflows from operating activities
Note 25. Reconciliation of liabilities arising from finance activities
Loans
Loans
3,266
(287)
30,911
Note
(198)
61,393
12
5(d)
Note 24. Reconciliation of net result for the year to net cash inflows from operating
activities
-
(718)
(191)
10(a)
13
17
24,596
(45)
(58,541)
(16,331)
(45,681)
12
5(b)
4(b)
758
58,7639
5,586
(4,536)
(32)Change in the value of landfill assets
10(c)
As at
(353)
367
As at
As at
2483,240
(285)17
$'000
30 June 2018Cashflows
107,180
17
2,083
3,081
As at
18
15
(17,167)
1,255
Cashflows
30 June 2017
(16,333)
90,013107,180 (17,167)
$'000$'000
107,180
$'000
$'000
90,013
69,542
30 June 2019
123,513
30 June 2018$'000
5(a)&(c)
43,633
$'0002019 2018
(2,226)
11,634
79,863
(269)
26,474
(42)
36,548
799
33,716
$'000
123,513 (16,333) 107,180
88 | Annual Report 2018/19

Fraser Coast Regional Council
Notes to the financial statementsfor the year ended 30 June 2019
2019 2018Note 26. Correction of errors
Correction of errors relating to a previous reporting period
Initial recognition of previously unrecorded non-current assets
Land assets
Road and bridge network assets
Water infrastructure assets
Sewerage infrastructure assets
Stormwater drainage assets
Total
Initial derecognition of non-current assets
Land assets
Building and site improvement assets
Road and bridge network assets
Water infrastructure assets
Sewerage infrastructure assets
Stormwater drainage assets
Total
Net prior period correction
• A review was conducted on freehold land that was held on the register and a number of assets were identified
as not being owned by Council;
1,939
10(c)
3,106
15,766
3,738
5(d)
709
637
1,114
$'0002019
344 11,919
4,536
-
1,219
8,474
950
798
-
3,738
• As part of the Wide Bay Water commercial business unit ongoing review of infrastructure assets, assets are
identified that are not previously appropriately accounted for or recognised. These items predominantly relate
to the records of historic underground network assets. Asset record corrections are confirmed through
acquisition of new information during excavation and maintenance work or subsurface visual inspections via
CCTV pipe survey.
10(c)
(85)
2,152
15,681
-
-
10(c)
10(c)
10(c)
10(c)
(a) Initial recognition and derecognition of non-current assets
29
- 2,529
-
Note $'000
5(d)
184
• A number of road, bridge and drainage infrastructure assets that had been recognised in prior periods were
found to be either duplicate entries or assets that were controlled by entities other than Council, and as such
were derecognised;
2018
5(d)
5(d)
5(d)
678
• As part of a review of freehold Council land provided for valuation purposes, a number of land assets were
found that were not owned by Council and were derecognised, and a number of land assets were identified as
owned by Council not previously recorded were also identified;
Details of errors identified in the previous year are set out below:
• A review was conducted on the Open Drainage assets which resulted in a number of building and site
improvement assets being discovered;
• Certain road, bridge and drainage infrastructure assets were identified that related to prior periods. Some of
which was due to the ongoing verification of the existence of items that had been spatially recognised in the
mapping systems, but not contained in asset registers;
• In conjunction with the verification process in relation to roads and stormwater assets, certain adjustments
relating to changes in stormwater pipe lengths and construction materials as well as lengths and widths of some
road segments had been processed in the previous financial year.
The initial recognition and derecognition of non-current assets relates to assets that should have been included
or excluded in previous years' financial statements but have only been identified and placed into (or removed
from) the financial asset register during the current reporting period. Where the net written down value impact
of these errors is not considered material in accordance with AASB 108 Accounting Policies, Changes in
Accounting Estimates and Errors , management have not presented a restated prior period position. Details of
errors identified in the current year are set out below:

Fraser Coast Regional Council
Notes to the financial statementsfor the year ended 30 June 2019
2019 2018Note 27. Events after the reporting period
Note 28. Financial instruments and financial risk management
Credit riskLiquidity riskMarket riskInterest rate risk
Risk management framework
Credit risk exposure
Cash and cash equivalents and term depositsCouncil may be exposed to credit risk through its investments in term deposits and the QTC Cash Fund. Term
deposits are held with financial institutions, which are rated A1+ to A2 based on rating agency Standard and
Poor's and Moody ratings, and whilst not capital guaranteed, the likelihood of a credit failure is assessed as
remote. The QTC Cash Fund is an asset management portfolio that invests with a wide range of high credit rated
counterparties. Deposits with the QTC Cash Fund are capital guaranteed.
Fraser Coast Regional Council's risk management policies are established to identify and analyse the risks faced,
to set appropriate limits and controls and to monitor these risks and adherence against limits. Council aims to
manage volatility to minimise potential adverse effects on the financial performance of Council.
Council does not enter into derivative contracts.
Credit risk is the risk of financial loss if a counterparty to a financial instrument fails to meet its contractual
obligations. These obligations arise principally from Council's investments and receivables from customers.
The Council's Audit Committee oversees how management monitors compliance with the Council's risk
management policies and procedures, and reviews the adequacy of the risk managements framework in relation
to the risks faced by the Council. The Council Audit Committee is assisted in its oversight role by internal audit.
Internal audit undertakes both regular and ad hoc reviews of risk management controls and procedures, the
results of which are reported to the Audit Committee.
Fraser Coast Regional Council is responsible for the establishment and oversight of the risk management
framework, together with developing and monitoring risk management policies.
Council approves policies for overall risk management, as well as specifically for managing credit, liquidity and
market risk.
The carrying amounts of financial assets at the end of the reporting period represent the maximum exposure to
credit risk for the Council.
This note provides information (both qualitative and quantitative) to assist financial statement users evaluate
the significance of financial instruments on Council's financial position and financial performance, including the
nature and extent of risks and how Council manages these exposures.
Fraser Coast Regional Council has exposure to the following risks arising from financial instruments:
There were no material adjusting events after the reporting date.
No collateral is held as security relating to the financial assets held by Council.
Exposure to credit risk is managed through regular analysis of credit counterparty ability to meet payment
obligations. The carrying amount of financial assets represents the maximum credit exposure.
Investments in financial instruments are required to be made with Queensland Treasury Corporation (QTC) or
similar State/Commonwealth bodies or financial institutions in Australia, in line with the requirements of the
Statutory Bodies Financial Arrangements Act 1982.
90 | Annual Report 2018/19

Fraser Coast Regional Council
Notes to the financial statementsfor the year ended 30 June 2019
2019 2018
Note 28. Financial instruments and financial risk management continued
Trade and other receivables
Financial InstrumentsRates and utility chargesState and Commonwealth GovernmentOther
Non-Financial Instruments
Water charges not yet leviedState and Commonwealth Government (GST recoverable)Other
Subject to impairment
Fully performingPast due:- 30 to 60 days overdue- 61 to 90 days overdue- Over 90 days overdueTotal gross carrying amountLoss allowance
Not subject to impairment
Rates and utility chargesFees and chargesDeferred infrastructure charges
1,937 3,050
2018
35,003
1,887
2,694
151
220
2019
18
29
2,282
4,282
1,152
12
(50)
Note
166
27,287
22,766
14,777
12
12
$'000
1,439
20,879
6,486
14,777
2019
975
22,766
2,855
35,003
2,072
8,558
1,070
Note
$'000
(768)
4,663
1,533
32,721
$'000
12
In the case of rate receivables, Council has the power to sell the property to recover any defaulted amounts. In
effect this power protects Council against credit risk in the case of defaults.
In other cases, Council assesses the credit risk before providing goods or services and applies normal business
credit protection procedures to minimise the risk.
By the nature of Council's operations, there is a geographical concentration of risk in the Council's area. Because
the main activity of the region is tourism, there is also a concentration of risk in the tourism sector.
-
12
7,014
5,861
38,693
12
A summary of Council's exposure to credit risk at period ending 30 June 2019 for which impairment
requirements of AASB 9 - Financial Instruments have been applied, being for other debtors.
7,211
2018
Council does not require collateral in respect of trade and other receivables. Council does not have trade
receivables for which no loss allowance is recognised because of collateral.
$'000
176
At 30 June 2019, the exposure to credit risk for receivables by type of counterparty was as follows:
15,927
6,646
43,561
12
27,287

Fraser Coast Regional Council
Notes to the financial statementsfor the year ended 30 June 2019
2019 2018Note 28. Financial instruments and financial risk management continued
Fees and charges: fees and charges have been identified as a separate debtor group, mainly consisting of
statutory charges. Internal historical data shows no defaults have occurred, even in the event of a default
occurring, Council has determined expected credit losses for this receivables grouping to be immaterial,
accordingly an expected credit loss of fees and charges is not calculated.
Deferred infrastructure charges: Council is empowered under the Planning Act 2016 to register a charge over
the property for outstanding adopted infrastructure charges. Internal historical data shows no defaults have
occurred. Council does not impair deferred infrastructure charges. Impairment will exist only if arrears are
deemed to be greater than the proceeds Council will receive from the sale of respective property.
The maximum exposure to credit risk at balance date for receivables is the gross carrying amount of those
assets. No collateral is held as security.
Trade debtors are recognised at the amounts due at the time of sale or service delivery i.e. the agreed purchase/
contract price. Settlement of these amounts is required within 30 days from invoice date.
When Council has no reasonable expectation of recovering an amount owed by a debtor, and has ceased
enforcement activity, the debt is written-off by directly reducing the receivable against the loss allowance. If the
amount of debt written off exceeds the loss allowance, the excess is recognised as an impairment loss.
Accounting for impairment losses is dependent upon the individual group of receivables subject to impairment.
The loss allowance for grouped receivables reflects lifetime expected credit losses and incorporates reasonable
and supportable forward-looking information. Economic changes impacting debtors, and relevant industry data
form part of the impairment assessment.
Council has identified four distinctive groupings of its receivables: rateable revenue, fees and charges, deferred
infrastructure charges and other debtors.
Rateable revenue: Council is empowered under the provisions of the Local Government Act 2009 to sell an
owner's property to recover outstanding rate debts. This results in immaterial Expected Credit Losses. Council
does not impair rates and charges. Impairment will exist only if arrears are deemed to be greater than the
proceeds Council will receive from the sale of the respective property.
Other debtors: Council identifies other debtors as receivables which are not rateable revenue, fees and charges
or deferred infrastructure charges.
Council reviews individual debtors to measure the expected credit losses on other debtors. Loss rates are
determined giving consideration to individual debtor recovery issues and Council's past experience. Other
debtors includes amounts receivable from State and Commonwealth governments and their agencies. A credit
enhancement exists as these amounts are effectively government guaranteed and both the state and
Commonwealth governments have high credit ratings, accordingly Council does not calculate an expected credit
loss. Although expected credit losses on other debtors are not material, disclosure is being made for the purpose
of public interest and transparency.
92 | Annual Report 2018/19

Fraser Coast Regional Council
Notes to the financial statementsfor the year ended 30 June 2019
2019 2018
Note 28. Financial instruments and financial risk management continued
Liquidity risk
Trade and other payablesLoans - QTC
Trade and other payablesLoans - QTC
Market risk
Interest rate risk
-
Council has access to a mix of variable and fixed rate funding options through QTC so that interest rate exposure
can be minimised.
Fraser Coast Regional Council is exposed to liquidity risk through its normal course of business and through its
borrowings with QTC and other financial institutions.
The outflows in the above table are not expected to occur significantly earlier and are not expected to be for
significantly different amounts than indicated in the table.
110,811
125,459
16
18,279 -
38,559
38,559
20,798
107,180
Note
Market risk is the risk that changes in market prices, such as interest rates, will affect Council's income or the
value of its holdings of financial instruments.
Council is exposed to interest rate risk through its investments and borrowings with QTC and other financial
institutions.
2019
42,568
71,321
18,279
132,853
Liquidity risk is the risk that Council will encounter difficulty in meeting the obligations associated with its
financial liabilities that are settled by delivering cash or another financial asset.
Carrying
amount
-
1 to 5 years
$'000
25,727
Over 5 years
$'000
90,01362,383 109,880
0 to 1 year
$'000
The Council's approach to managing liquidity is to ensure, as far as possible, that it will have sufficient liquidity to
meet its labilities when they are due, under both normal and stressed conditions, without incurring
unacceptable losses or risking damage to the Council's reputation.
The following table sets out the liquidity risk of financial liabilities held by Council. It represents the remaining
contractual cashflows (principal and interest) of financial liabilities at the end of the reporting period, excluding
the impact of netting agreements:
21,770
20,798
71,321
25,727
15
18,279
2018
16
62,383
151,132
22,973
41,252
20,798-
Council manages its exposure to liquidity risk by maintaining sufficient cash deposits, both short and long term,
to cater for unexpected volatility in cash flows.
Total
contractual
cash flows
15
130,678
| 93Annual Report 2018/19

Fraser Coast Regional Council
Notes to the financial statementsfor the year ended 30 June 2019
2019 2018Note 28. Financial instruments and financial risk management continued
Sensitivity
Investments with QTC 11(a)
Other cash 11(a)
Loans - QTC*Net
Investments with QTC 11(a)
Other cash 11(a)
Loans - QTC*Net
Fair value
16
(85,682) (215)
The fair value of borrowings with QTC is based on the market value of debt outstanding. The market value of a
debt obligation is the discounted value of future cash flows based on prevailing market rates and represents the
amount required to be repaid if this was to occur at the reporting date. The market value of debt is provided by
QTC and is discussed below.
-
-
(16)
68,354
16 -
2018
19,854
In relation to the QTC loans held by Council, the following has been applied:
*QTC Fixed Rate Loan - financial instruments with fixed interest rates which are carried at amortised cost are not
subject to interest rate sensitivity.
215
1,644
The fair value of trade and other receivables and payables is assumed to approximate the value of the original
transaction, less any allowance for impairment.
215
-
(707)
2019
-
QTC applies a book rate approach in the management of debt and interest rate risk, to limit the impact of
market value movements to clients' cost of funding. The book value represents the carrying value based on
amortised cost using the effective interest method.
(16) 16
-
(199)
-
199 (199)
684
(707)707
2,282
16
(684)
(23)23
-
(19,377)
(90,013)
Effect on equity
Sensitivity to interest rate movements is shown for variable financial assets and liabilities based on the carrying
amount as at the reporting date.
Effect on net result Net carrying
amount
$'000
1% increase
$'000
1% decrease
$'000 Note
(684)
(23)
199
684
The following interest rate sensitivity analysis depicts what effect a reasonably possible change in interest rates
(assumed to be 1%) would have on the profit and equity, based on the carrying values at the end of the
reporting period. The calculation assumes that the change in interest rates would be held constant over the
period.
1% decrease
$'000
(215)
1% increase
$'000
The Council does not account for any fixed-rate financial assets or financial liabilities at Fair Value through Profit
or Loss, therefore a change in interest rates at the reporting date would not affect profit or loss.
(107,180)
23
707
Fraser Coast Regional Council
Notes to the financial statementsfor the year ended 30 June 2019
2019 2018Note 28. Financial instruments and financial risk management continued
Fair value hierarchy
Level 1 - quoted prices (unadjusted) in active markets for identical instruments.Level 2 - inputs other than quoted prices included in Level 1 that are observable either directly or indirectly.Level 3 - valuation techniques for which any significant input is not based on observable market data.
2019
Financial assetsCash and cash equivalentsInvestments with QTCTerm deposits greater than 3 monthsTotal financial assets
Financial liabilitiesLoans - QTCTrade and other payablesTotal financial liabilities
2018
Financial assetsCash and cash equivalentsInvestments with QTCTerm deposits greater than 3 monthsTotal financial assets
Financial liabilitiesLoans - QTCTrade and other payablesTotal financial liabilities
-
4,820
141,700
Total
According to the above hierarchy, the fair values of each class of asset recognised at fair value are as follows:
90,013
15
-
The recognised fair values of financial assets and liabilities are classified based on the lowest level of input
significant to the overall fair value:
Level 3Level 2
$'000
116,698
11(a)
11(b)
-
193,006
116,698
19,854
Level 1
15
214,539 -
16
68,354
Note
26,685
141,700-
11(b)
-
-
214,874
-
1,679
16
-
$'000 $'000$'000
4,820
68,354
11(a) -
-
-
90,013
26,685
23,604
11(a) -
193,006
11(a)
-
--
23,604
214,874
- 19,854
- 130,784
- 214,539
130,784 -
-
1,679
-
-
-
107,180 - -
- -
107,180
94 | Annual Report 2018/19

Fraser Coast Regional Council
Notes to the financial statementsfor the year ended 30 June 2019
2019 2018Note 28. Financial instruments and financial risk management continued
Fair value hierarchy
Level 1 - quoted prices (unadjusted) in active markets for identical instruments.Level 2 - inputs other than quoted prices included in Level 1 that are observable either directly or indirectly.Level 3 - valuation techniques for which any significant input is not based on observable market data.
2019
Financial assetsCash and cash equivalentsInvestments with QTCTerm deposits greater than 3 monthsTotal financial assets
Financial liabilitiesLoans - QTCTrade and other payablesTotal financial liabilities
2018
Financial assetsCash and cash equivalentsInvestments with QTCTerm deposits greater than 3 monthsTotal financial assets
Financial liabilitiesLoans - QTCTrade and other payablesTotal financial liabilities
-
4,820
141,700
Total
According to the above hierarchy, the fair values of each class of asset recognised at fair value are as follows:
90,013
15
-
The recognised fair values of financial assets and liabilities are classified based on the lowest level of input
significant to the overall fair value:
Level 3Level 2
$'000
116,698
11(a)
11(b)
-
193,006
116,698
19,854
Level 1
15
214,539 -
16
68,354
Note
26,685
141,700-
11(b)
-
-
214,874
-
1,679
16
-
$'000 $'000$'000
4,820
68,354
11(a) -
-
-
90,013
26,685
23,604
11(a) -
193,006
11(a)
-
--
23,604
214,874
- 19,854
- 130,784
- 214,539
130,784 -
-
1,679
-
-
-
107,180 - -
- -
107,180
| 95Annual Report 2018/19

Fraser Coast Regional Council
Notes to the financial statementsfor the year ended 30 June 2019
Note 29. National competition policy
Business activities to which the code of competitive conduct is applied
Wide Bay WaterCaravan parksFraser Coast Waste
The following activity statements are for activities subject to the code of competitive conduct:
Less : expenditure
Surplus/(deficit)
Description of CSO's provided to business activities:
Fraser Coast Waste
Caravan ParksAs Council caravan parks are managed by third parties on a commercial
basis, no CSOs are recognised.-
The CSO value is determined by Council, and represents an activity's cost(s) which would not be incurred if the
primary objective of the activities was to make a profit. Council provides funding from general revenue to the
business activity to cover the cost of providing non-commercial community services or costs deemed to be CSO's
by Council.
- 256 860
$'000 $'000
23,780
Caravan
parks
2019
(16,573)
1,186
Fraser Coast Regional Council applies the code of competitive conduct to the following activities:
This requires the application of full cost pricing, identifying the cost of community service obligations (CSO) and
eliminating the advantages and disadvantages of public ownership within that activity.
Activities
18,980
3,414
(59,570)
3,414 24,036 79,285
(2,171)
Community service obligations
Revenue for services provided to external clients
Wide Bay
Water
Revenue
$'000CSO description
256
Fraser
Coast
Waste
78,425
$'000
Council has identified a number of CSO's in relation to the provision of waste
services throughout the region. Council provides and services street litter
bins throughout the region. Public recycling services are also provided in
high profile, high use areas. These services are recognised as a CSO. In
addition, Council provides vouchers to charitable organisations and schools
allowing those organisations to dispose of a certain amount of waste for
free. This service is also recognised as a CSO.
(735)
Wide Bay Water
Council provides discounted water and sewerage services to community and
sporting bodies which is identified as a Community Service Obligation (CSO).
In addition, the State Government sets the maximum regulated
infrastructure charges able to be collected from developers, to which Council
has provided certain discounts and incentives to developers, this has also
been identified by Council as a CSO for the Wide Bay Water commercial
business unit.
860
Less: Net competitive neutrality adjustments (57) (119)
7,344
Fraser Coast Regional Council
Notes to the financial statementsfor the year ended 30 June 2019
Note 30. Transactions with related parties
(a) Subsidiaries
Widelinx Pty Ltd Telecommunication services supplied to Council
Widelinx Pty Ltd Proceeds from deregistration and wind-up of subsidiary *
Tourism and events services supplied to CouncilTotal goods and services supplied to Council
Total
(b) Transactions with joint ventures
(c) Transactions with key management personnel (KMP)
Total
The group consists of Council and two subsidiaries - Widelinx Pty Ltd. (now deregistered) and Fraser Coast
Tourism and Events Ltd. Neither of these subsidiaries are consolidated, details are disclosed in Note 23.
The following transactions occurred with subsidiaries:
KMP include the Mayor, Councillors, Council's Chief Executive Officer and Council's Executive Management
team. The compensation paid to KMP comprises:
Fraser Coast Tourism & Events Ltd
87
Council established a joint venture agreement with Fraser Coast Residential Airpark Pty Ltd in 2015. Details of
this arrangement are disclosed in Note 23.There have been no transactions with Fraser Coast Residential Airpark Pty Ltd in the reporting period.
2018
$'000
6
$'000Payments by FCTE to FCRC
Reimbursements for outgoings
Other reimbursements
Motor vehicle hire
2019
2,769
3,806
259
42
736
16
-
2,947
SubsidiaryGoods and services supplied to Council on normal terms
and conditions
2018
2019
-
1,972
1,972
$'000
In addition, FCTE utilises fleet items from Council. They are hired to FCTE on the same basis as Council's internal
plant and fleet hire rates. Further, FCTE pay nominal rental costs for use of the Hervey Bay Cultural Centre for
$5,500 annually. The total of these transactions are listed below:
In accordance with its Deed of Agreement for Funding, Fraser Coast Tourism & Events (FCTE) utilises Council
facilities, buildings and services. Under that Deed, FCTE are required to reimburse Council for outgoings such as
electricity, repairs and maintenance, rates and charges, security services, advertising, recruitment costs and
cleaning. Other reimbursements include the payment of fees collected from and the hire of certain venues and
events and merchandise sales.
2018
2,253
3,758
$'000
Short-term employee benefits
Post-employment benefits
Long-term benefits
Termination benefits
2019
$'000
2,679
252
- 1,418
* The operations of Council's wholly owned subsidiary, Widelinx Pty Ltd ceased during the previous reporting period. All
cash held by the subsidiary was transferred to Council after outstanding debts of the company at the end of the previous
reporting period had been paid. Widelinx Pty Ltd was deregistered in the current reporting period.
$'000
54
13
26
6
99 147
9
21
111
Rent of premises
96 | Annual Report 2018/19
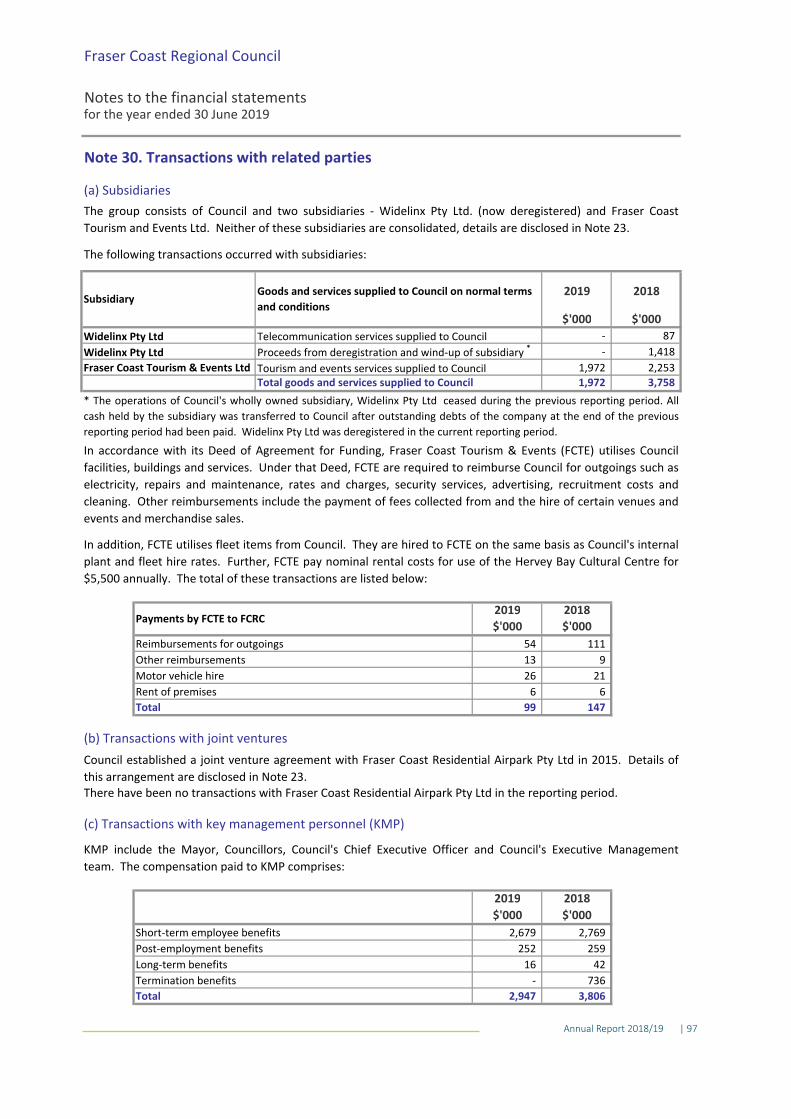
Fraser Coast Regional Council
Notes to the financial statementsfor the year ended 30 June 2019
Note 30. Transactions with related parties
(a) Subsidiaries
Widelinx Pty Ltd Telecommunication services supplied to Council
Widelinx Pty Ltd Proceeds from deregistration and wind-up of subsidiary *
Tourism and events services supplied to CouncilTotal goods and services supplied to Council
Total
(b) Transactions with joint ventures
(c) Transactions with key management personnel (KMP)
Total
The group consists of Council and two subsidiaries - Widelinx Pty Ltd. (now deregistered) and Fraser Coast
Tourism and Events Ltd. Neither of these subsidiaries are consolidated, details are disclosed in Note 23.
The following transactions occurred with subsidiaries:
KMP include the Mayor, Councillors, Council's Chief Executive Officer and Council's Executive Management
team. The compensation paid to KMP comprises:
Fraser Coast Tourism & Events Ltd
87
Council established a joint venture agreement with Fraser Coast Residential Airpark Pty Ltd in 2015. Details of
this arrangement are disclosed in Note 23.There have been no transactions with Fraser Coast Residential Airpark Pty Ltd in the reporting period.
2018
$'000
6
$'000Payments by FCTE to FCRC
Reimbursements for outgoings
Other reimbursements
Motor vehicle hire
2019
2,769
3,806
259
42
736
16
-
2,947
SubsidiaryGoods and services supplied to Council on normal terms
and conditions
2018
2019
-
1,972
1,972
$'000
In addition, FCTE utilises fleet items from Council. They are hired to FCTE on the same basis as Council's internal
plant and fleet hire rates. Further, FCTE pay nominal rental costs for use of the Hervey Bay Cultural Centre for
$5,500 annually. The total of these transactions are listed below:
In accordance with its Deed of Agreement for Funding, Fraser Coast Tourism & Events (FCTE) utilises Council
facilities, buildings and services. Under that Deed, FCTE are required to reimburse Council for outgoings such as
electricity, repairs and maintenance, rates and charges, security services, advertising, recruitment costs and
cleaning. Other reimbursements include the payment of fees collected from and the hire of certain venues and
events and merchandise sales.
2018
2,253
3,758
$'000
Short-term employee benefits
Post-employment benefits
Long-term benefits
Termination benefits
2019
$'000
2,679
252
- 1,418
* The operations of Council's wholly owned subsidiary, Widelinx Pty Ltd ceased during the previous reporting period. All
cash held by the subsidiary was transferred to Council after outstanding debts of the company at the end of the previous
reporting period had been paid. Widelinx Pty Ltd was deregistered in the current reporting period.
$'000
54
13
26
6
99 147
9
21
111
Rent of premises
| 97Annual Report 2018/19

Fraser Coast Regional Council
Notes to the financial statementsfor the year ended 30 June 2019
Note 30. Transactions with related parties continued
(d) Transactions with other related parties
1 Employee expenses for close family members of KMP
2
3
4 Key management personnel services provided by an external entity98 763
Details of Transaction
Purchase of materials and services from entities controlled by KMP or close family members
of KMP
$'000
- 130
94 105
$'000
4 198
2019 2018
Sale of Council property to KMP - 330
2.(a) Hotlight Marketing Pty Ltd, a company controlled by Councillor Rolf Light purchased the Torquay Post
Office franchise in May 2016. The post office provides services in relation to Council’s outgoing mail for which
Council pays Australia Post directly (to which the franchise is entitled to a commission). Commission is also
payable by Australia Post to the franchise on payments made in person at the post office on eligible Post BillPay
branded Council invoices (e.g. rates and animal registration notices). In addition, postal services provided by the
franchise to Council’s Commercial Business Unit – Wide Bay Water are paid direct to Hotlight Marketing. The
total for these services were $3,877 (2018: $5,121). These services were all pre-existing arrangements that had
been provided by the Torquay post office branch prior to Hotlight Marketing’s purchase of the franchise. All
services were at arm’s length, on normal terms and conditions and were in the normal course of Council
operations. As at 30 June 2019 $535 was owed by Council to the company.
2.(b) Mr Sydney Shang, Council's Executive Manager Governance & Customer Service relieved in the position of
Director Organisational Services (a member of Council's Executive Management team) for approximately three
and a half weeks during the previous reporting period. A close family member of Mr Shang controls The
Workers Wardrobe, a small business that provides uniforms, industrial and high visibility workwear and safety
footwear to Council. All services were at arm’s length, on normal terms and conditions and were in the normal
course of Council operations.
3. Mr Davendra Naidu, Council's Director of Infrastructure Services purchased a property owned by the Council
during the previous reporting period. The property had been listed for sale along with other Council properties
with a local real estate agent. The sale was carried out at arm's length under normal terms and conditions for
such a transaction.
4. Payments were made in the previous reporting period to The Sustainable Advantage Pty Ltd for the services of
Mr Keith Parsons who acted in the position of Director of Organisational Services for the period 25 July 2017
until he was permanently appointed to the position on 8 January 2018. This amount has been excluded from the
KMP compensation disclosures in (c) above.
Other related parties include the close family members of KMP and any entities controlled or jointly controlled
by KMP or their close family members. Close family members include a spouse, child and dependent of a KMP or
their spouse.
1. During the reporting period there were 2 employees that are close family members of key management
personnel employed by Council (2018: 3 employees). All close family members of key management personnel
were employed through an arm's length process, one on a casual basis, one on a full time basis (2018: two
casual, one full time). They are paid in accordance with the Award for the work they perform.
98 | Annual Report 2018/19

Fraser Coast Regional Council
Notes to the financial statementsfor the year ended 30 June 2019
Note 30. Transactions with related parties continued
(e) Outstanding balances
(f) Loans and guarantees to/from related parties
(g) Commitments to/from other related parties
(h) Transactions with related parties that have not been disclosed
There are no commitments outstanding at the end of the reporting period to/from related parties.
- Payment of rates and utility charges- Use of Council's aquatic centres
Council does not make loans to or receive loans from related parties. No guarantees have been provided.
- Borrowing books from Council libraries
The majority of the entities and people that are related parties of Council live and operate within the Fraser
Coast Region. Therefore, on a regular basis ordinary citizen transactions occur between Council and its related
parties. Some examples include:
Council has not included these types of transaction in its disclosure, where they are made on the same terms
and conditions available to the general public.
- Attending events or performances at Council venues such as the Brolga Theatre or Showgrounds
There are no balances outstanding at the end of the reporting period in relation to transactions with related
parties.
| 99Annual Report 2018/19

100 | Annual Report 2018/19

To the Councillors of Fraser Coast Regional Council
Report on the audit of the financial report Opinion
I have audited the accompanying financial report of Fraser Coast Regional Council (the
council).
In my opinion, the financial report:
a) gives a true and fair view of the c June 2019, and of
the financial performance and cash flows for the year then ended
b) complies with the Local Government Act 2009, the Local Government Regulation 2012
and Australian Accounting Standards.
The financial report comprises the statement of financial position as at 30 June 2019, the
statement of comprehensive income, statement of changes in equity and statement of cash
flows for the year then ended, notes to the financial statements including significant
accounting policies and other explanatory information, and the management certificate given
by the Mayor and the Chief Executive Officer.
Basis for opinion
I conducted my audit in accordance with the Auditor-General of Queensland Auditing Standards, which incorporate the Australian Auditing Standards. My responsibilities under
those standards are further described in the responsibilities for the audit of the financial report section of my report.
I am independent of the council in accordance with the ethical requirements of the
Code of Ethics for Professional Accountants (the Code) that are relevant to my audit of the financial report in
Australia. I have also fulfilled my other ethical responsibilities in accordance with the Code
and the Auditor-General of Queensland Auditing Standards.
I believe that the audit evidence I have obtained is sufficient and appropriate to provide a
basis for my opinion.
Other information
Other information comprises the information included in Fraser Coast Regional Council
annual report for the year ended 30 June 2019, but does not include the financial report and
eport
current year financial sustainability statement and the long-term financial sustainability
statement.
My opinion on the financial report does not cover the other information and accordingly I do
not express any form of assurance conclusion thereon. However, as required by the Local
Government Regulation 2012, I have expressed a separate opinion on the current year
financial sustainability statement.
| 101Annual Report 2018/19

In connection with my audit of the financial report, my responsibility is to read the other
information and, in doing so, consider whether the other information is materially inconsistent
with the financial report and my knowledge obtained in the audit or otherwise appears to be
materially misstated.
If, based on the work I have performed, I conclude that there is a material misstatement of
this information, I am required to report that fact. I have nothing to report in this regard.
Responsibilities of the council for the financial report
The council is responsible for the preparation of the financial report that gives a true and fair
view in accordance with the Local Government Act 2009, the Local Government Regulation
2012 and Australian Accounting Standards, and for such internal control as the council
determines is necessary to enable the preparation of the financial report that is free from
material misstatement, whether due to fraud or error.
The council is also responsible for assessing the council's ability to continue as a going
concern, disclosing, as applicable, matters relating to going concern and using the going
concern basis of accounting unless it is intended to abolish the council or to otherwise cease
operations of the council.
inancial report
My objectives are to obtain reasonable assurance about whether the financial report as a
whole is free from material misstatement, whether due to fraud or error, and to issue an
l of assurance,
but is not a guarantee that an audit conducted in accordance with the Australian Auditing
Standards will always detect a material misstatement when it exists. Misstatements can arise
from fraud or error and are considered material if, individually or in aggregate, they could
reasonably be expected to influence the economic decisions of users taken on the basis of
this financial report.
As part of an audit in accordance with the Australian Auditing Standards, I exercise
professional judgement and maintain professional scepticism throughout the audit. I also:
� Identify and assess the risks of material misstatement of the financial report, whether
due to fraud or error, design and perform audit procedures responsive to those risks,
and obtain audit evidence that is sufficient and appropriate to provide a basis for my
opinion. The risk of not detecting a material misstatement resulting from fraud is higher
than for one resulting from error, as fraud may involve collusion, forgery, intentional
omissions, misrepresentations, or the override of internal control.
� Obtain an understanding of internal control relevant to the audit in order to design audit
procedures that are appropriate in the circumstances, but not for expressing an opinion
on the effectiveness of the council's internal control.
� Evaluate the appropriateness of accounting policies used and the reasonableness of
accounting estimates and related disclosures made by the council.
102 | Annual Report 2018/19

| 103Annual Report 2018/19

Fraser Coast Regional Council
Sustainability statementsfor the year ended 30 June 2019
Contents
Sustainability statements
1. Current-year financial sustainability statement
2. Auditor's report on the current-year sustainability statement
3. Long-term financial sustainability statement (unaudited) 110
105
107
Page
104 | Annual Report 2018/19

Fraser Coast Regional Council
Current year financial sustainability statement
for the year ended 30 June 2019
Measures of financial sustainability
Council's performance at 30 June 2019 against key financial ratios and targets
Performance indicators
1. Operating surplus ratioNet result (excluding capital items)
Total operating revenue (excluding capital items)
2. Asset sustainability ratio
Capital expenditure on the replacement of assets (renewals)Depreciation expense
3. Net financial liabilities ratio
Total liabilities less current assets
Total operating revenue (excluding capital items)
Note 1 - Basis of preparation
more
than 90%
0 - 10%
An indicator of the extent to which revenues raised cover operational expenses only or are available for
capital funding purposes or other purposes.
2019
3.23%
The current year financial sustainability statement is a special purpose statement prepared in accordance
with the requirements of the Local Government Regulation 2012 and the Financial Management
(Sustainability) Guideline 2013 .
Target
(51.17%)less than
60%
96.68%
An approximation of the extent to which the infrastructure assets managed are being replaced as these reach
the end of their useful lives.
The amounts used to calculate the three reported measures are prepared on an accrual basis and are drawn
from Council's audited general purpose financial statements for the year ended 30 June 2019.
An indicator of the extent to which the net financial liabilities can be serviced by its operating revenue.
| 105Annual Report 2018/19
106 | Annual Report 2018/19
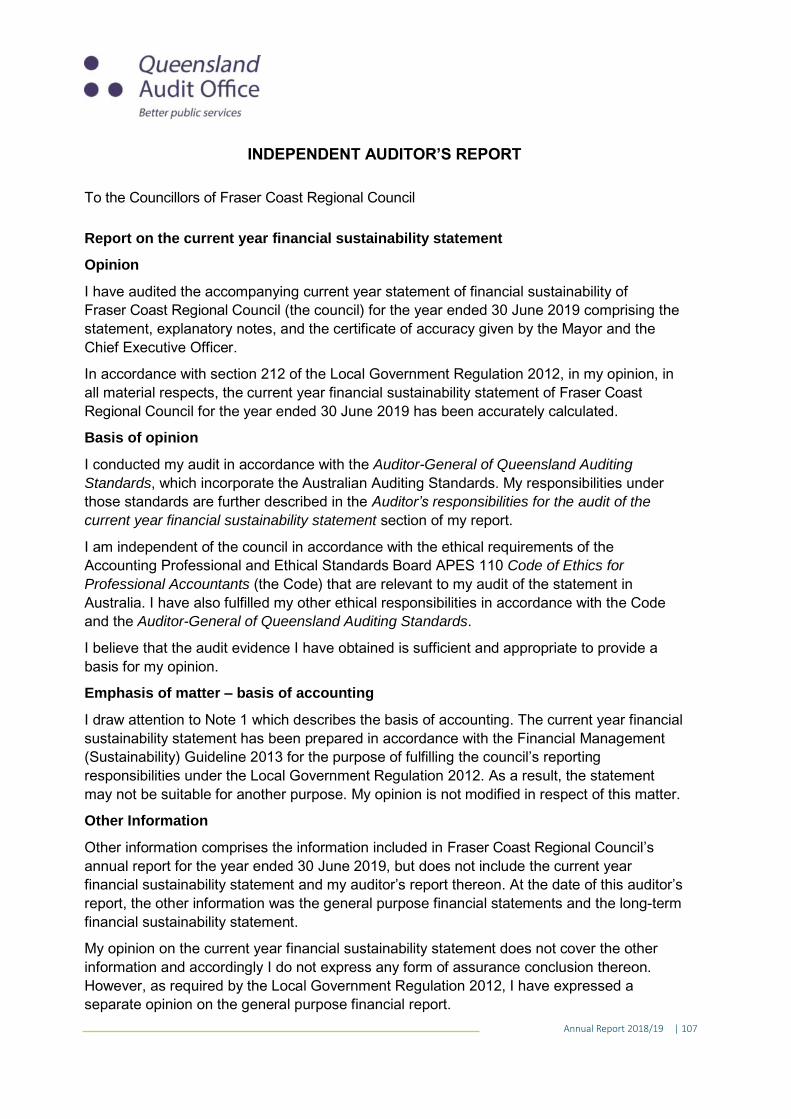
To the Councillors of Fraser Coast Regional Council
Report on the current year financial sustainability statement
Opinion
I have audited the accompanying current year statement of financial sustainability of
Fraser Coast Regional Council (the council) for the year ended 30 June 2019 comprising the
statement, explanatory notes, and the certificate of accuracy given by the Mayor and the
Chief Executive Officer.
In accordance with section 212 of the Local Government Regulation 2012, in my opinion, in
all material respects, the current year financial sustainability statement of Fraser Coast
Regional Council for the year ended 30 June 2019 has been accurately calculated.
Basis of opinion
I conducted my audit in accordance with the Auditor-General of Queensland Auditing Standards, which incorporate the Australian Auditing Standards. My responsibilities under
those standards are further described in the responsibilities for the audit of the current year financial sustainability statement section of my report.
I am independent of the council in accordance with the ethical requirements of the
Accounting Professional and Ethical Standards Board APES 110 Code of Ethics for Professional Accountants (the Code) that are relevant to my audit of the statement in
Australia. I have also fulfilled my other ethical responsibilities in accordance with the Code
and the Auditor-General of Queensland Auditing Standards.
I believe that the audit evidence I have obtained is sufficient and appropriate to provide a
basis for my opinion.
Emphasis of matter basis of accounting
I draw attention to Note 1 which describes the basis of accounting. The current year financial
sustainability statement has been prepared in accordance with the Financial Management
(Sustainability) Guideline 2013 for the purpose of fulfilling the c
responsibilities under the Local Government Regulation 2012. As a result, the statement
may not be suitable for another purpose. My opinion is not modified in respect of this matter.
Other Information
Other information comprises the information included in Fraser Coast Regional Council
annual report for the year ended 30 June 2019, but does not include the current year
financial sustainability statement report
report, the other information was the general purpose financial statements and the long-term
financial sustainability statement.
My opinion on the current year financial sustainability statement does not cover the other
information and accordingly I do not express any form of assurance conclusion thereon.
However, as required by the Local Government Regulation 2012, I have expressed a
separate opinion on the general purpose financial report.
| 107Annual Report 2018/19

In connection with my audit of the financial report, my responsibility is to read the other
information and, in doing so, consider whether the other information is materially inconsistent
with the financial report and my knowledge obtained in the audit or otherwise appears to be
materially misstated.
If, based on the work I have performed, I conclude that there is a material misstatement of
this information, I am required to report that fact. I have nothing to report in this regard.
Responsibilities of the council for the current year financial sustainability statement
The council is responsible for the preparation and fair presentation of the current year
financial sustainability statement in accordance with the Local Government Regulation 2012.
The councils responsibility also includes such internal control as the council determines is
necessary to enable the preparation and fair presentation of the statement that is accurately
calculated and is free from material misstatement, whether due to fraud or error.
udit of the current year financial sustainability statement
My objectives are to obtain reasonable assurance about whether the current year financial
sustainability statement as a whole is free from material misstatement, whether due to fraud
my opinion. Reasonable assurance is
a high level of assurance, but is not a guarantee that an audit conducted in accordance with
the Australian Auditing Standards will always detect a material misstatement when it exists.
Misstatements can arise from fraud or error and are considered material if, individually or in
the aggregate, they could reasonably be expected to influence the economic decisions of
users taken on the basis of this statement.
My responsibility does not extend to forming an opinion on the appropriateness or relevance
of the reported ratios, nor on the c
As part of an audit in accordance with the Australian Auditing Standards, I exercise
professional judgement and maintain professional scepticism throughout the audit. I also:
� Identify and assess the risks of material misstatement of the statement, whether due to
fraud or error, design and perform audit procedures responsive to those risks, and
obtain audit evidence that is sufficient and appropriate to provide a basis for my
opinion. The risk of not detecting a material misstatement resulting from fraud is higher
than for one resulting from error, as fraud may involve collusion, forgery, intentional
omissions, misrepresentations, or the override of internal control.
� Obtain an understanding of internal control relevant to the audit in order to design audit
procedures that are appropriate in the circumstances, but not for the purpose of
expressing an opinion on the effectiveness of the council
� Evaluate the appropriateness of accounting policies used and the reasonableness of
accounting estimates and related disclosures made by the council.
� Evaluate the overall presentation, structure and content of the statement, including the
disclosures, and whether the statement represents the underlying transactions and
events in a manner that achieves fair presentation.
108 | Annual Report 2018/19
| 109Annual Report 2018/19

Fras
er C
oas
t R
egio
nal
Co
un
cil
Lon
g-te
rm f
inan
cial
su
stai
nab
ility
sta
tem
ent
(un
aud
ited
)p
rep
ared
as
at 3
0 J
un
e 2
01
9
Mea
sure
s o
f fi
nan
cial
su
stai
nab
ility
Co
un
cil's
pe
rfo
rman
ce a
t 3
0 J
un
e 2
01
9 a
gain
st k
ey f
inan
cial
rat
ios
and
tar
gets
an
d p
roje
cted
fo
reca
st p
erf
orm
ance
.
Act
ual
20
19
20
20
20
21
20
22
20
23
20
24
20
25
20
26
20
27
20
28
20
29
Per
form
ance
ind
icat
ors
1. O
pe
rati
ng
surp
lus
rati
oN
et r
esu
lt (
excl
ud
ing
cap
ital
item
s)
Tota
l op
erat
ing
reve
nu
e (e
xclu
din
g ca
pit
al it
em
s)
An
ind
icat
or
of
the
exte
nt
to w
hic
h r
even
ues
rai
sed
co
ver
op
erat
ion
al e
xpen
ses
on
ly o
r ar
e av
aila
ble
fo
r ca
pit
al f
un
din
g p
urp
ose
s o
r o
ther
pu
rpo
ses.
2. A
sse
t su
stai
nab
ility
rat
ioC
apit
al e
xpen
dit
ure
on
th
e re
pla
cem
ent
of
asse
ts
Dep
reci
atio
n e
xpen
se (
infr
astr
uct
ure
ass
ets
)
An
ap
pro
xim
atio
n o
f th
e ex
ten
t to
wh
ich
th
e in
fras
tru
ctu
re a
sset
s m
anag
ed a
re b
ein
g re
pla
ced
as
thes
e re
ach
th
e en
d o
f th
eir
use
ful l
ives
.
3. N
et
fin
anci
al li
abili
tie
s ra
tio
Tota
l lia
bili
ties
less
cu
rren
t as
sets
Tota
l op
erat
ing
reve
nu
e (e
xclu
din
g ca
pit
al it
em
s)
An
ind
icat
or
of
the
exte
nt
to w
hic
h t
he
net
fin
anci
al li
abili
ties
can
be
serv
iced
by
its
op
erat
ing
reve
nu
e.
Fras
er C
oas
t R
egio
nal
Co
un
cil f
inan
cial
man
agem
ent
stra
tegy
The
fin
anci
alsu
stai
nab
ility
fram
ewo
rko
fth
elo
ng
term
fin
anci
alfo
reca
stfo
rms
the
bas
isfo
rth
ep
rep
arat
ion
of
the
Co
un
cils
ann
ual
bu
dge
t.Th
eta
rget
sse
td
uri
ng
the
lon
gte
rmfi
nan
cial
fore
cast
pro
cess
mu
stb
ead
her
edto
du
rin
gth
eb
ud
get
pro
cess
toen
sure
con
sist
ency
bet
wee
nth
ean
nu
alco
mm
itm
ents
of
the
curr
ent
year
bu
dge
tan
dth
elo
ng
term
fin
anci
alfo
reca
st.
This
will
ass
ist
Co
un
cil i
n e
nsu
rin
g fu
ture
via
bili
ty a
nd
fin
anci
al s
ust
ain
abili
ty f
or
the
regi
on
.
Co
un
cil
mea
sure
sre
ven
ue
and
exp
end
itu
retr
end
so
ver
tim
eas
agu
ide
tofu
ture
req
uir
emen
tsan
dto
mak
ed
ecis
ion
sab
ou
tth
eef
fici
ent
allo
cati
on
of
reso
urc
esto
ensu
reth
em
ost
effe
ctiv
ep
rovi
sio
no
fse
rvic
es.
Co
un
cile
nsu
res
that
its
fin
anci
alm
anag
emen
tst
rate
gyis
pru
den
tan
dth
atit
slo
ng-
term
fin
anci
alfo
reca
stsh
ow
sa
sou
nd
fin
anci
alp
osi
tio
nw
hils
tal
sob
ein
g
able
to
mee
t th
e co
mm
un
ity’
s cu
rren
t an
d f
utu
re n
eed
s.
1.0
9%
12
2.8
8%
mo
re
than
90
%
less
th
an
60
% (
26
.36
%)
(1
9.0
7%
)
3.0
6%
2.9
8%
2.8
2%
3.7
0%
94
.19
%8
9.4
2%
(2
5.0
0%
) (
31
.10
%)
(4
1.3
5%
) (
51
.97
%)
Fore
cast
1.3
5%
1.7
8%
1.7
1%
14
0.5
2%
91
.97
%9
0.9
0%
78
.49
%9
3.7
4%
1.3
0%
(1
4.3
1%
) (
15
.00
%)
Targ
et
Ever
yfi
nan
cial
year
the
Co
un
cil
mu
stp
rep
are
alo
ng
term
fin
anci
alfo
reca
stin
acco
rdan
cew
ith
sect
ion
17
1o
fth
eLo
cal
Go
vern
men
tR
egu
lati
on
20
12
.Th
ish
igh
leve
lp
lan
nin
gd
ocu
men
t
sets
the
fin
anci
alsu
stai
nab
ility
fram
ewo
rkin
wh
ich
the
Co
un
cils
ho
uld
op
erat
ew
ith
inth
en
ext
ten
fin
anci
alye
ars.
On
eo
fth
eke
yo
utc
om
esfr
om
this
pla
nn
ing
pro
cess
isto
ensu
reth
atth
e
thre
ere
leva
nt
mea
sure
so
ffi
nan
cial
sust
ain
abili
tyth
atar
ed
iscl
ose
d(a
bo
ve)
are
wit
hin
the
targ
etra
nge
sas
set
by
the
Dep
artm
ent
of
Infr
astr
uct
ure
,Lo
cal
Go
vern
men
tan
dP
lan
nin
gin
acco
rdan
ce w
ith
th
e Fi
na
nci
al M
an
ag
emen
t (S
ust
ain
ab
ility
) G
uid
elin
e 2
01
3.
80
.34
%
(1
1.7
3%
)
3.2
3%
0.4
2%
0 -
10
%
96
.68
%1
34
.73
%
(5
1.1
7%
) (
45
.45
%)
110 | Annual Report 2018/19

| 111Annual Report 2018/19

Local Government Act 2009
Section Title Heading Page41 Identifying beneficial enterprises Beneficial Enterprises 1945 Identifying significant business
activitiesSignificant Business Activities
19
201 Remuneration senior management Senior Management Remuneration 18
Local Government Regulation 2012
183 Financial Statements Financial Statements 51184 Community Financial Report Community Financial Report 39185 Particular resolutions Particular Resolutions 19
186 Councillors• Councillor Remuneration and Expenses• Council Meeting Attendance • Councillor Conduct
15 16 16
187 Administration Action Complaints Administrative Action Complaints 18188 Overseas Travel Overseas Travel 19
189Expenditure on grants to community organisations
• Expenditure on Grants to Community Organisations
• Councillors’ Discretionary Fund Expenditure
• Mayor’s Community Benefit Fund • Mayor’s Donations and Sponsorship
20
20 33 33
190 (1)(a)(b)Assessment of operations and performance
• Our Year in Review • CEO’s Message
12 7
190 (1)(c) Annual Operations Report Commercial Business Unit Report Attachment 1
190 (1)(d)(i)(ii)
Details of special rates and charges Details of Special Rates and Charges 34
190 (1)(e) Tenders Changes to Council Tenders 35190 (1)(f) Register Council Registers 35
190 (1)(g) Concessions for rates and chargesSummary of Concessions for Rates and Charges
34
190 (1)(h) Report on Internal AuditInternal Audit Function Audit Committee
35 36
190 (1)(i)(j) Competitive neutrality complaints Competitive Neutrality Complaints 19
Public Sector Ethics Act 1994
23 Public Sector Ethics • Employees’ Code of Conduct • Education and Training• Procedures and Practices of Public
Sector Entities
37 37
37
Index of Legislative Requirements
112 | Annual Report 2018/19

Annual Budget – A statutory requirement outlining the financial estimates to deliver the Corporate Plan.
Annual Report – Council’s report on its annual performance, including statements about annual performance, financial statements and disclosures required under legislation.
Beneficial Enterprises – is an enterprise that a local government considers is directed to benefiting, and can reasonably be expected to benefit, the whole or part of its local government area.
Capital works program – Program of scheduled infrastructure works generally encompassing capital works for road, drainage and building assets.
Community Plan – Council’s 10 year strategic document identifying community needs articulating council’s and the community’s long term vision, aspirations and priorities for the city.
Corporate Plan – A strategic document that sets out Councils plans over a five year period. It outlines the strategies to be undertaken to achieve the vision and outcomes within the Fraser Coast Community Plan. It is a legal requirement under the Local Government Act 2009 for Council to adopt a Corporate Plan.
Corporate Themes – Five strategic themes that form the basis of Council’s corporate and operations plans.
External Audit – An official inspection of an organisation’s accounts, processes and procedures, typically by an independent body. (QAO – Queensland Audit Office)
Full-time equivalent (FTE) – The hours worked by one or more staff members that are the equivalent of a full-time employee. For example, this may involve a full-time employee working 36.25 hours per week or two part-time employees each working 18.13 hours per week.
Governance – How decisions are made and implemented and how organisations are managed and controlled to achieve objectives. Governance also describes the ways an organisation can be held accountable.
Key performance indicator – Evidence of the degree to which Council’s actions are achieving intended objectives, for the purposes of monitoring progress.
Local Laws – The laws adopted by Council that prohibit, regulate and control activities, events, practices and behaviours with the Fraser Coast Region.
Operational Plan – A one year plan that sets out activities to be undertaken in that particular year to achieve the corporate Plan. An Operations Plan is a legal requirement for Queensland councils under the Local Government Act 2009.
Statutory Information – Information or activities that are required to be reported on under the Local Government Act 2009 and Local Government Regulation 2012.
Councillors – Elected representatives of council who serve a 4 year term.
Risk Management – The process of identifying, evaluating and controlling risk via the method outlined in the Principles and Guidelines AS/NZS ISO 31000:2009, Standards Australia.
Glossary of Terms
| 113Annual Report 2018/19

Fraser Coast Regional Council77 Tavistock Street, Hervey Bay
211-213 Adelaide Street, MaryboroughForgan Terrace, Tiaro
PO Box 1943, Hervey Bay QLD 4655
Phone: 1300 79 49 29Fax: (07) 4197 4455
Email: [email protected]

A LOOK BACK
2018/19ANNUAL OPERATIONS REPORT

CONTENTS
OVERVIEW ABOUT US 5 ANNUAL PERFORMANCE PLAN 5 LOCAL GOVERNMENT DIRECTIONS 5
OBJECTIVES VISION 6 BUSINESS OBJECTIVES 6
GOVERNANCE STRUCTURE & COMMITTEE COMMITTEE PROFILES 8 MEMBERS ATTENDANCE AT MEETINGS 9 MEETING DATES 9
EXECUTIVE TEAM PROFILES 10
PERFORMANCE SUMMARY KEY FINANCIAL PERFORMANCE 12 KEY NON-FINANCIAL PERFORMANCE 13
OPERATIONAL SUMMARY WATER 14 SEWERAGE 15 ENGINEERING 16 ENVIRONMENT 18 QUALITY 19 REUSE 20
2
A LOOK BACK

3
2018/19 ANNUAL OPERATIONS REPORT
Lake Lenthall

OVERVIEW
Wide Bay Water (WBW) is a Commercial Business Unit of the Fraser Coast Regional Council (FCRC) providing water and sewerage services to the Fraser Coast.
This Annual Operations Report has been prepared in accordance with s190 of the Local Government Regulation 2012.
The report provides a summary of WBWs major activities over the 2018/19 reporting year, including an assessment of our performance against the financial and non-financial targets defined in the WBW Annual Performance Plan 2018/19.
A LOOK BACK
4

WBW’s major operating assets include one dam and three weirs, four water treatment plants (WTP), eight sewage treatment plants (STP) and two integrated reuse schemes. At the end of the 2018/19 year, the extent of our asset base comprised 1132km of water mains, 783km of sewerage mains and 72km of effluent reuse mains.
Services provided include management of water storages including the safe operation of the regions referable dams, management of two bulk water supply schemes and their customers, water treatment and distribution, sewerage collection and treatment and effluent reuse. WBW remains a proactive member of the National Water
Industry, contributing to research and innovation, improvements in service delivery, and partnership services with other water utilities.
WBW is governed by an Executive Management team, and Non-Executive Advisory Committee that consists of external members and Councillors and is appointed under s264 of the Local Government Regulation 2012. The organisation continues to adopt best-practice standards in service and performance delivery that support its operations and their compliance with the broad regulatory environment in which it operates. WBW hold third party accreditations in Quality (ISO 9001) and Food Safety (ISO 22001).
ABOUT US
The WBW Annual Performance Plan 2018/19 was resolved by Council at its Special Meeting No. 3 held on Wednesday 27 June 2018.
The Annual Performance Plan (the Plan) was established in accordance with the requirements of section 175 (2) of the Local Government Regulation 2012. The plan outlines, among other things, the nature and extent of WBW’s operations, its vision and objectives, and the financial and non-financial performance targets that will guide its operations of the 2018/19 year.
No changes were made to the Performance Plan in 2018/19.
LOCAL GOVERNMENT DIRECTIONS
There were no local government directions issued to WBW during 2018/19.
ANNUAL PERFORMANCE PLAN
WBW’s Scientific Services Laboratory is accredited by the National Association of Testing Authorities (NATA) to standard ISO 17025. The Laboratory continues to provide an extensive range of testing services for internal and external customers under the business name WaterOne Laboratory Services.
WBW’s Engineering unit provides services to internal and external customers in the form of strategic planning, development services, design of pump stations and treatment plants, network modelling, delivery of capital development projects and operational technical support.
2018/19 ANNUAL OPERATIONS REPORT
5

OBJECTIVES
VISION
Our vision is to be an efficient customer-focused business developing and delivering sustainable water services for the benefit of the Fraser Coast Community.
BUSINESS OBJECTIVES
LIFESTYLE
A safe and vibrant community that
promotes a preferred place to live.
GOVERNANCE
An effective organisation
providing excellent service delivery through strong
leadership, democratic principles
and effective management of people, assets and finances.
A LOOK BACK
6
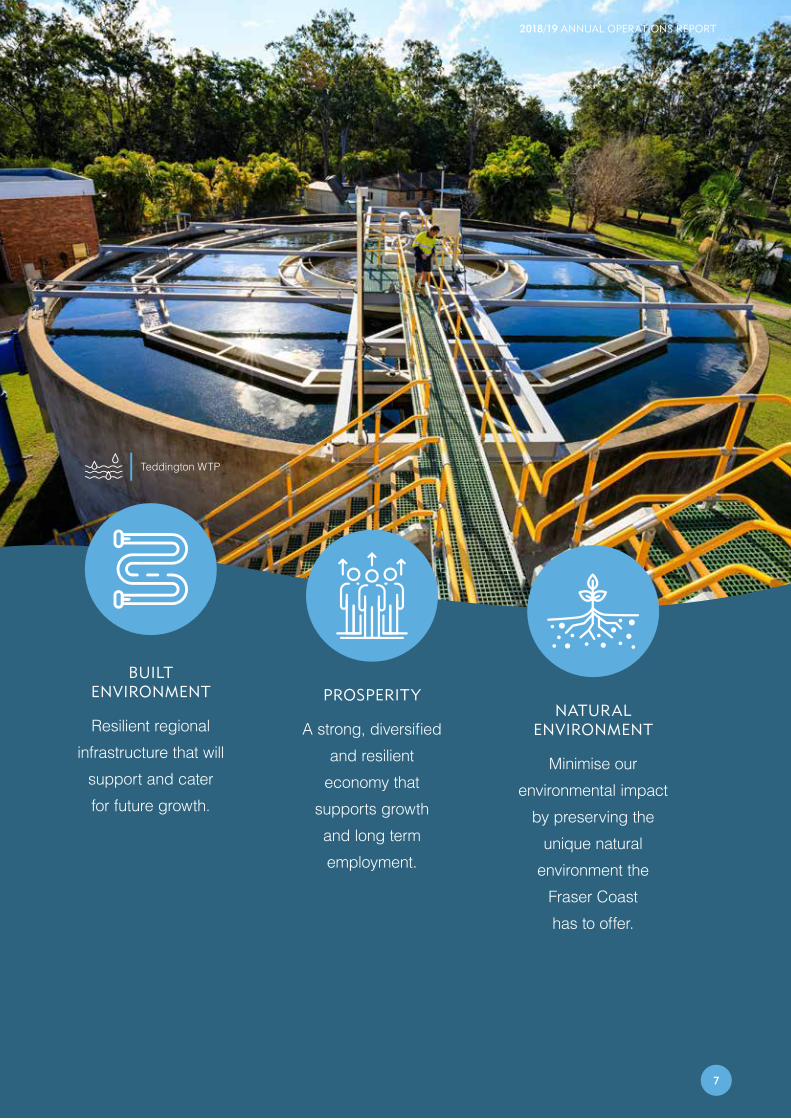
PROSPERITY
A strong, diversified and resilient
economy that supports growth and long term employment.
NATURAL ENVIRONMENT
Minimise our environmental impact
by preserving the unique natural
environment the Fraser Coast has to offer.
BUILT ENVIRONMENT
Resilient regional infrastructure that will
support and cater for future growth.
2018/19 ANNUAL OPERATIONS REPORT
7
Teddington WTP

A LOOK BACK
8
PETER BORROWSPeter is Director of Kedron Consulting Pty Ltd and Independent Director of Murrumbidgee Irrigation Ltd. Peter is Chairman of MI Board’s Infrastructure Committee, and a member of the Remuneration and Nominations Committee. Peter is MI’s alternate delegate for the National Irrigators’ Council.
Peter’s qualifications include – Graduate Diploma in Business Administration and Bachelor of Engineering. Peter is also a Fellow with Australian Institute of Company Directors and a Fellow with the Institution of Engineers.
Peter was appointed to the Wide Bay Water and Waste Services Advisory Committee in January 2019.
CLIFF SEARLEChairman
Cliff was admitted as a Member of The Association of Hydraulic Services Consultants Australia (Qld) Inc. (AHSCA) in 1993 and in 2015 was awarded life membership of the AHSCA.In 1985, Cliff was elected as an Alderman for the Hervey Bay City Council and re-elected in 1989. During his six year period in Council his major focus was water and sewerage.
Cliff operated his own hydraulic design business, Water Wise Design Pty Ltd up until January 2015 at which time he decided it was time to retire.
Cliff is an avid golfer and President of the Hervey Bay Golf Club and spends many a day enjoying his favourite pastime.
LANCE STONELance is a Graduate of the Australian Institute of Company Directors (GAICD). He is Managing Director of a group of Community Based Organisations, private companies and social enterprises.
Lance is currently the:• Vice President – Maryborough
Chamber of Commerce• Deputy Chair – Wide Bay
Water and Waste Services• MD – Fraser Coast Training
Employment Support Service Inc. (TESS) RTO #1826
• MD – Maisie Kaufmann Learning Centre Inc. RTO #5205
• MD – Coral Sea Training RTO #32221
• MD – Fraser Coast Palliative Care and Active Plus Life-Style Options
• MD – BAYS Inc.• CEO – Australian Child
Care Career Options Pty Ltd, RTO #5404
• Board Member Horizon Housing Limited
Lance’s other community interests include; Family, Sport, Youth Mental Health, Life Long Learning, Homelessness, Social Justice and Social Inclusion.
GOVERNANCE STRUCTURE & COMMITTEE
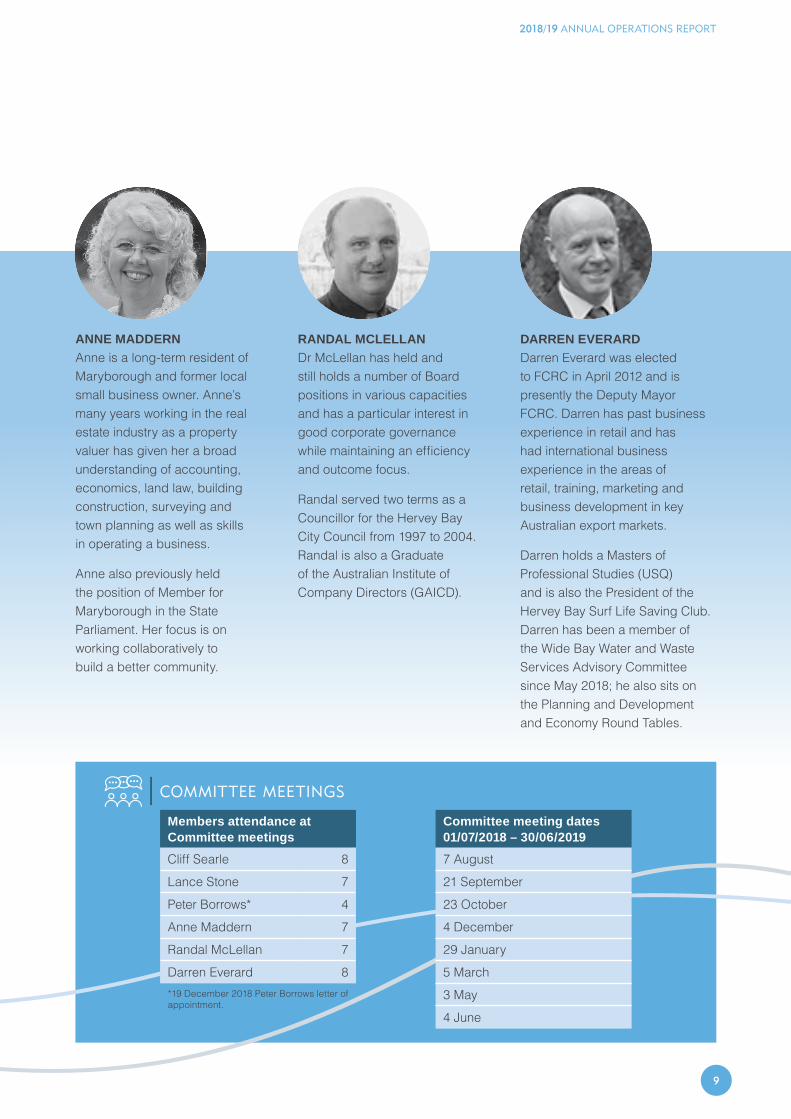
2018/19 ANNUAL OPERATIONS REPORT
9
ANNE MADDERNAnne is a long-term resident of Maryborough and former local small business owner. Anne’s many years working in the real estate industry as a property valuer has given her a broad understanding of accounting, economics, land law, building construction, surveying and town planning as well as skills in operating a business.
Anne also previously held the position of Member for Maryborough in the State Parliament. Her focus is on working collaboratively to build a better community.
RANDAL MCLELLANDr McLellan has held and still holds a number of Board positions in various capacities and has a particular interest in good corporate governance while maintaining an efficiency and outcome focus.
Randal served two terms as a Councillor for the Hervey Bay City Council from 1997 to 2004. Randal is also a Graduate of the Australian Institute of Company Directors (GAICD).
DARREN EVERARDDarren Everard was elected to FCRC in April 2012 and is presently the Deputy Mayor FCRC. Darren has past business experience in retail and has had international business experience in the areas of retail, training, marketing and business development in key Australian export markets.
Darren holds a Masters of Professional Studies (USQ) and is also the President of the Hervey Bay Surf Life Saving Club. Darren has been a member of the Wide Bay Water and Waste Services Advisory Committee since May 2018; he also sits on the Planning and Development and Economy Round Tables.
*19 December 2018 Peter Borrows letter of appointment.
Members attendance at Committee meetingsCliff Searle 8Lance Stone 7Peter Borrows* 4Anne Maddern 7Randal McLellan 7Darren Everard 8
Committee meeting dates 01/07/2018 – 30/06/20197 August21 September23 October4 December29 January5 March3 May4 June
COMMITTEE MEETINGS

A LOOK BACK
10
MARK VANNERDirector
Mark was appointed to the position of Director in January 2019 to provide leadership, strategic direction and management of Council’s water, wastewater and waste functions.
He commenced his professional career in fields of biotechnology and medical device manufacturing before joining WBW in 2006 in the area of Catchment and Bulk Water Management. Mark has been a member of the Wide Bay Water and Waste Executive Team since 2012 where he has led the compliance and regulation function to support the water business in the area of bulk water operations, drinking water quality, dam safety, environmental compliance, work health and safety, scientific services, and quality management. He has also led Waste Operations since 2016 to provide planning and management of the Fraser Coast’s resource recovery and waste management services.
Mark holds a Bachelor degree in Aquatic Resource Management, Master of Environmental Management, and Post Graduate Certificate in Professional Legal Studies. Mark is a Graduate of the Australian Institute of Company Directors (GAICD) and is a current Director of Football Queensland Wide Bay.
DENIS HERONExecutive Manager Process Operations
Denis started his career with WBW in 1993 as the architect of Hervey Bay’s award winning water recycling scheme.
During his 26 year career with Council and WBW, Denis has undertaken a number of roles from project concept through to the planning, design, construction, operation and maintenance. As part of a team, he has made major contributions to developing and delivering improved services through water demand management, sewer rehabilitation and water recycling on the Fraser Coast.
As Executive Manager Process Operations, Denis is responsible for Water Treatment including the management of the water supply dams, Sewage Treatment and Reuse of wastewater including the management of the effluent storages. Water One Laboratory and Operations Technology also falls under Denis’s remit. Denis leads a team of 46 with a focus of delivering high quality water and sewerage services to the Fraser Coast Community.
Denis is also a Graduate of the Australian Institute of Company Directors (GAICD).
DARREN SMITHExecutive Manager Network Operations and Maintenance
Darren commenced his career with BHP in 1986 as a Mechanical Engineer predominantly undertaking roles in asset maintenance management, during this time he also had responsibility for large industrial Wastewater Treatment Plants. Darren has 16 years’ experience in the Australian water industry and joined WBW in 2006 in the position of Operations Manager.
Darren has recently completed a Diploma in Leadership and Management with the AIM and been appointed to the role of Executive Manager Network Operations and Maintenance where he is responsible for managing the teams who deliver water and wastewater customer service and the maintenance of WBW assets.
EXECUTIVE TEAM
A LOOK BACK

2018/19 ANNUAL OPERATIONS REPORT
11
TREVOR DEANExecutive Manager Engineering and Technical Services
Trevor has worked for Council since 1995 and has held management roles since 2005. Trevor leads the Engineering and Technical Services team that predominately works in the planning and project delivery aspects of the water business; he has had experience in Asset Management Systems, Process Engineering, Electrical Engineering and Environmental aspects having managed teams responsible for these functions.
He was awarded an Associate Degree in Civil Engineering in 2001 and a Bachelor of Engineering (Civil) in 2006, both from the University of Southern Queensland. He is both a Registered Professional Engineer Queensland (RPEQ) and a Registered Professional Engineer (RPEng). In addition, he is a member of the Australian Institute of Company Directors, Chairman of Queensland Water Directorate Technical Reference Group, a member of the WBBROC Urban Water Technical Committee and a PRINCE2 Practitioner.
As Executive Manager of Engineering and Technical Service, Trevor is responsible for managing an interdisciplinary team that facilitate WBW’s interaction with private developers, undertake short and long term planning, deliver infrastructure projects and provide guidance on environmental licencing and compliance matters.
GRAHAM COLEActing Executive Manager Waste Services
Graham has been with WBW since 2001 except for a two year break in 2012-2013 when he was the Water and Sewer Coordinator at North Burnett Regional Council. He has gained a broad depth of water industry experience across various positions at WBW including Technical Officer Operations, Continuous Improvement Officer, Training and Research Coordinator and Quality, Data and Risk Coordinator. For the past year Graham has been Acting Executive Manager Regulation and Waste Services.
Graham holds a Bachelor of Social Science Degree from Deakin University and a Master of Philosophy (Smart Metering and Water Pricing) from Griffith University. He was also seconded to the National Water Commission in 2010-2011 for a research study into time-of-use tariffs subsequently published in a National Waterlines Report.
Graham has also had research papers published in various international water industry publications including the Urban Water Journal and Water, Science and Technology.
2018/19 ANNUAL OPERATIONS REPORT
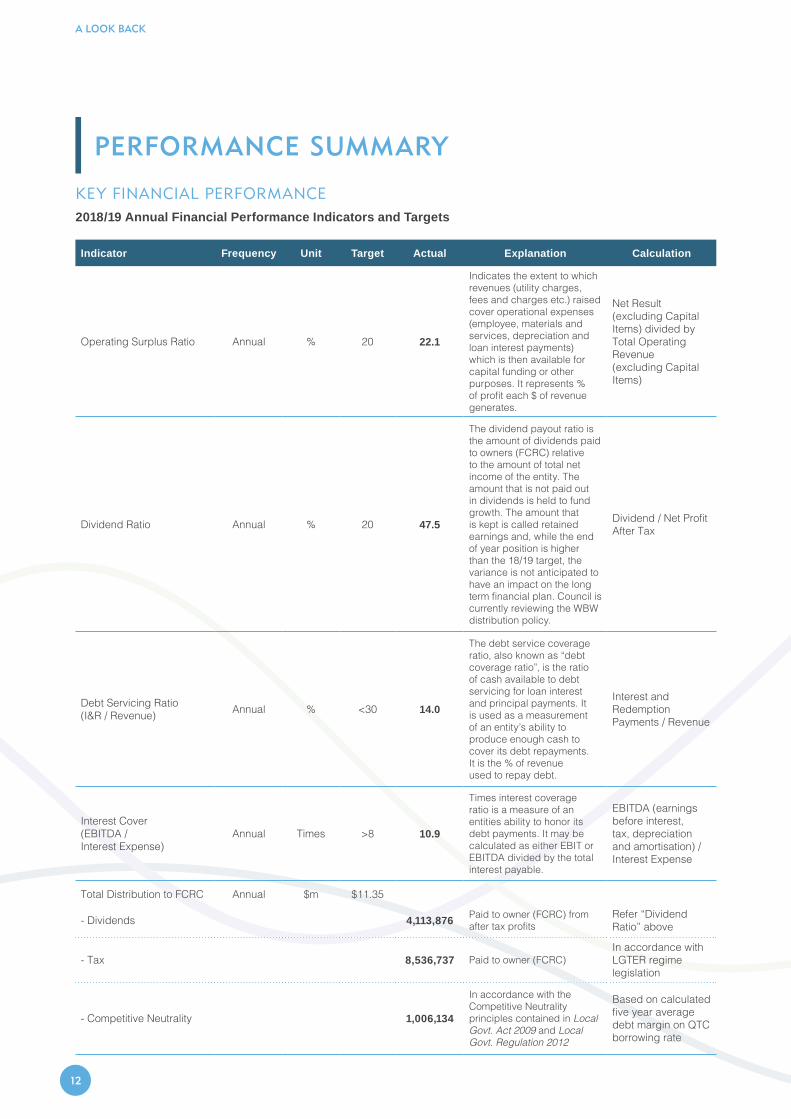
A LOOK BACK
12
PERFORMANCE SUMMARY
KEY FINANCIAL PERFORMANCE2018/19 Annual Financial Performance Indicators and Targets
Indicator Frequency Unit Target Actual Explanation Calculation
Operating Surplus Ratio Annual % 20 22.1
Indicates the extent to which revenues (utility charges, fees and charges etc.) raised cover operational expenses (employee, materials and services, depreciation and loan interest payments) which is then available for capital funding or other purposes. It represents % of profit each $ of revenue generates.
Net Result(excluding Capital Items) divided by Total Operating Revenue(excluding Capital Items)
Dividend Ratio Annual % 20 47.5
The dividend payout ratio is the amount of dividends paid to owners (FCRC) relative to the amount of total net income of the entity. The amount that is not paid out in dividends is held to fund growth. The amount that is kept is called retained earnings and, while the end of year position is higher than the 18/19 target, the variance is not anticipated to have an impact on the long term financial plan. Council is currently reviewing the WBW distribution policy.
Dividend / Net Profit After Tax
Debt Servicing Ratio(I&R / Revenue) Annual % <30 14.0
The debt service coverage ratio, also known as “debt coverage ratio”, is the ratio of cash available to debt servicing for loan interest and principal payments. It is used as a measurement of an entity’s ability to produce enough cash to cover its debt repayments. It is the % of revenue used to repay debt.
Interest and Redemption Payments / Revenue
Interest Cover(EBITDA / Interest Expense)
Annual Times >8 10.9
Times interest coverage ratio is a measure of an entities ability to honor its debt payments. It may be calculated as either EBIT or EBITDA divided by the total interest payable.
EBITDA (earnings before interest, tax, depreciation and amortisation) / Interest Expense
Total Distribution to FCRC Annual $m $11.35
- Dividends 4,113,876 Paid to owner (FCRC) from after tax profits
Refer “Dividend Ratio” above
- Tax 8,536,737 Paid to owner (FCRC)In accordance with LGTER regime legislation
- Competitive Neutrality 1,006,134
In accordance with the Competitive Neutrality principles contained in Local Govt. Act 2009 and Local Govt. Regulation 2012
Based on calculated five year average debt margin on QTC borrowing rate

2018/19 ANNUAL OPERATIONS REPORT
13
Hervey Bay and Maryborough Unit Target Actual
WaterContinuity and reliability of water supplyTime for restoration of service within five hours – percentage of unplanned incidents % 95% 99.3%
Minimum water pressure at the property boundary for 99% of connected properties(on enquiry or complaint) kPa 200 >200
Minimum flow at the property boundary for 90% of connected properties(on enquiry or complaint) L/min >20 >20
System water loss ILI 1.5 1.02
Water quality
Water at the point of delivery will meet National Health and Medical Research Council Health Guidelines for Australian Drinking Water % 100% 99.6%#1
Water quality at point of delivery (physical and chemical parameters) will meet National Health and Medical Research Council Aesthetic Drinking Water Guidelines % >95% 99.6%
New service connections – water
Installation of all 20mm and 25mm diameter service connections (average time from receipt of application and payment fee)
Workingdays 20 8
Service connections greater than 25mm diameter:
(a) Design and notification of construction price(average time from completed application)
Workingdays 10 6
(b) Construction time (average time from payment of fees) subject to building and development regulations being met
Workingdays 20 16
Sewerage
Effective transport of waste effluentTotal sewage overflows per 100km main Number <10 0.4
Sewage overflows on to customer property per 1,000 connections Number <5 0.2
Sewer odour complaints per 1,000 connections Number <10 0.7
Effluent complies to Environmental Licence % 100% 98.9%#2
Sewerage reuse on land for 90% of the year % 100% 100%
New service connections – sewer
Completion of new sewer connections:
(a) Design and notification of construction price(average time from completed application)
Workingdays 10 7
(b) Construction time (average time from payment of fees)subject to building and development regulations being met
Workingdays 20 12
Queensland Government – Reportable indicators
QG 4.5 Total water main breaks per 100km of water main Number <20 6.8
QG 4.6 Total sewerage main breaks and chokes per 100km sewerage main Number <60 7.9
QG 4.7 Incidence of unplanned interruptions to supply per 1000 connected properties Number <100 50.2
QG 4.8 Average response time for incidents causing an interruption to supply Minutes <60 45
QG 4.9 Average response time for incidents causing an interruption to sewerage collection Minutes <60 30
QG 4.10 Drinking water quality complaints per 1000 connected properties Number <5 1.4
QG 4.11 Total water and sewerage complaints per 1000 connected properties Number <40 10
KEY NON-FINANCIAL PERFORMANCE2018/19 Annual Non-Financial Performance Indicators and Targets
#1 – Multiple THM guideline value exceedances#2 – 28 license exceedances across 5 of 8 STPsFurther information can be located in the WBW Annual Drinking Water Quality Management Plan Report.
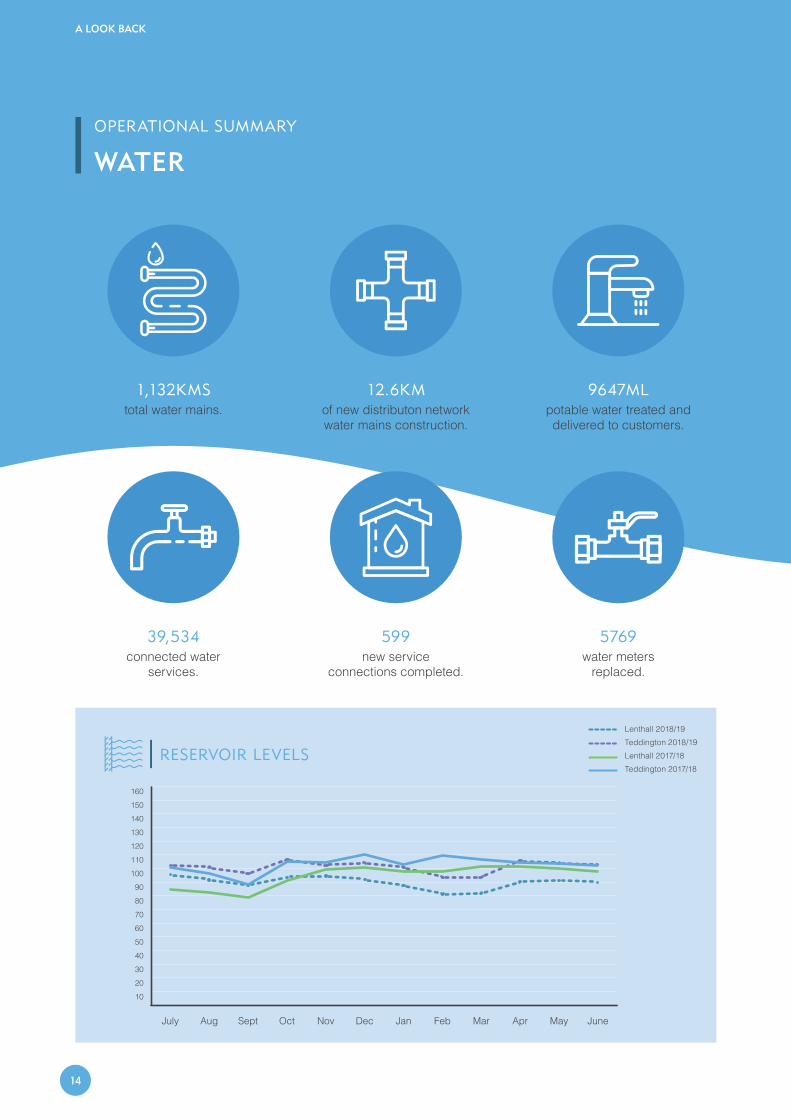
A LOOK BACK
14
OPERATIONAL SUMMARY
WATER
A LOOK BACK
1,132KMStotal water mains.
39,534connected water
services.
12.6KMof new distributon network water mains construction.
599new service
connections completed.
9647MLpotable water treated and delivered to customers.
5769water meters
replaced.
RESERVOIR LEVELS
102030405060708090
100110120130140150160
JuneMayAprMarFebJanDecNovOctSeptAugJuly
Lenthall 2018/19Teddington 2018/19Lenthall 2017/18Teddington 2017/18

2018/19 ANNUAL OPERATIONS REPORT
15
OPERATIONAL SUMMARY
SEWERAGE
2018/19 ANNUAL OPERATIONS REPORT
783KMtotal sewerage mains.
94.2KMsewer network cleaned and CCTV inspected.
16.6KMtotal gravity sewer
mains relined.
6,199MLsewerage collected from customers across FCRC.
12.12KMnew gravity collection sewers constructed by developers.
32,542connected sewage
services.
593new properties
connected.
Pulgul STP
All sewerage works were undertaken internally by WBW’s fitters.

A LOOK BACK
16
OPERATIONAL SUMMARY
ENGINEERING
$22.6Mcapital investment into
the Fraser Coast’s water and sewerage
infrastructure.
Sewer relining TCD drainage
St Helens Sewer relining Albergerdie
16

2018/19 ANNUAL OPERATIONS REPORT
17
MAJOR GROWTH PROJECTS
• Nil.
MAJOR RENEWAL PROJECTS
• March Street Water Main Replacement.
• Sewer relining Ann St (Hervey Bay) and Neptune St (Maryborough).
• Bazaar St Water Main (Maryborough).
• Walker St Water Main (Pallas to John Street, Maryborough).
• Tiaro Reservoir replacement.
MAJOR IMPROVEMENT PROJECTS
• Minor Sewage Pumping Station Upgrade Project.
• Aubinville STP Control Building.• Eli-Dundowran Trunk
Sewerage (continuing).• Major STP upgrade for
Hervey Bay (continuing).
Aubinville STP Control Building
17

A LOOK BACK
18
OPERATIONAL SUMMARY
ENVIRONMENT
1outstanding matters
from eight compliance inspections.
10,9553223 (direct) and 7732 (indirect)
community members educated on the importance
of waste minimisation and water conservation.
11TH ANNUAL School Water and
Waste Wise Competition was hosted.
53Statutory Environmental
Reports prepared and submitted within statutory timeframes to the Department of
Environment and Science.
9Statutory Environmental Reports prepared and
submitted within statutory timeframes to the
Department of Natural Resources and Mines.
A LOOK BACK

2018/19 ANNUAL OPERATIONS REPORT
19
OPERATIONAL SUMMARY
QUALITY
2018/19 ANNUAL OPERATIONS REPORT
ISO 9001Quality Management
Certification.
ISO 22000Food Safety Management
Certification.
ISO 17025Laboratory Management
Certification.
ISO 14001 Environmental
Management System preliminary work for accreditation.
CORPORATE CALENDARimprovement
initiative implemented.
DOCUMENT MANAGEMENT
REPORTINGimprovement initiative
implemented.

A LOOK BACK
20
OPERATIONAL SUMMARY
REUSE
100%Achieved
combined reuse percentage on the
Fraser Coast of 100% of Average Dry Weather Flow
received at the regions STPs.
4142m3
biosolids were beneficially reused
and applied to WBW Plantations
and approved Third Party Land.
63%Effluent reuse
continues to support the local economy
with third party customers reusing
63% of the total volume reused in the financial year.
33% INCREASEThird Party Usage made up the largest proportion over the reporting period
at 63% of total reuse volume. All third party
usage demand was met which corresponded to
a 33% increase from the previous financial year.
Hebblewhite Plantation
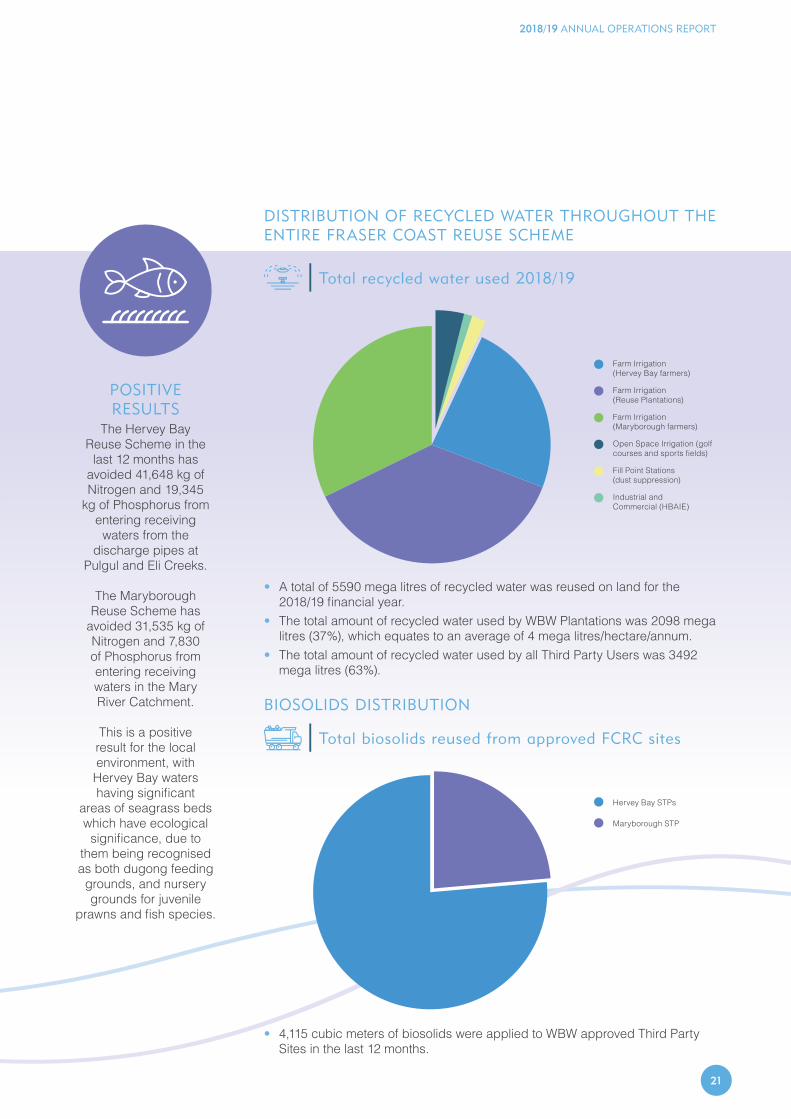
2018/19 ANNUAL OPERATIONS REPORT
21
POSITIVE RESULTS
The Hervey Bay Reuse Scheme in the
last 12 months has avoided 41,648 kg of Nitrogen and 19,345
kg of Phosphorus from entering receiving
waters from the discharge pipes at
Pulgul and Eli Creeks.
The Maryborough Reuse Scheme has
avoided 31,535 kg of Nitrogen and 7,830 of Phosphorus from entering receiving waters in the Mary River Catchment.
This is a positive result for the local environment, with Hervey Bay waters having significant
areas of seagrass beds which have ecological
significance, due to them being recognised as both dugong feeding
grounds, and nursery grounds for juvenile
prawns and fish species.
DISTRIBUTION OF RECYCLED WATER THROUGHOUT THE ENTIRE FRASER COAST REUSE SCHEME
• A total of 5590 mega litres of recycled water was reused on land for the 2018/19 financial year.
• The total amount of recycled water used by WBW Plantations was 2098 mega litres (37%), which equates to an average of 4 mega litres/hectare/annum.
• The total amount of recycled water used by all Third Party Users was 3492 mega litres (63%).
• 4,115 cubic meters of biosolids were applied to WBW approved Third Party Sites in the last 12 months.
Farm Irrigation (Hervey Bay farmers)
Farm Irrigation (Reuse Plantations)
Farm Irrigation (Maryborough farmers)
Open Space Irrigation (golf courses and sports fields)
Fill Point Stations (dust suppression)
Industrial and Commercial (HBAIE)
Hervey Bay STPs
Maryborough STP
Total recycled water used 2018/19
BIOSOLIDS DISTRIBUTION
Total biosolids reused from approved FCRC sites

29-31 Ellengowan St Urangan, Hervey Bay Qld 4655
1300 79 49 29 07 4197 4455
http://www.frasercoast.qld.gov.au/wide-bay-water