171214 TB Item 07 October IPR.pdf - moorfields.nhs.uk TB Item 07... · Report to Trust Board Report...
35
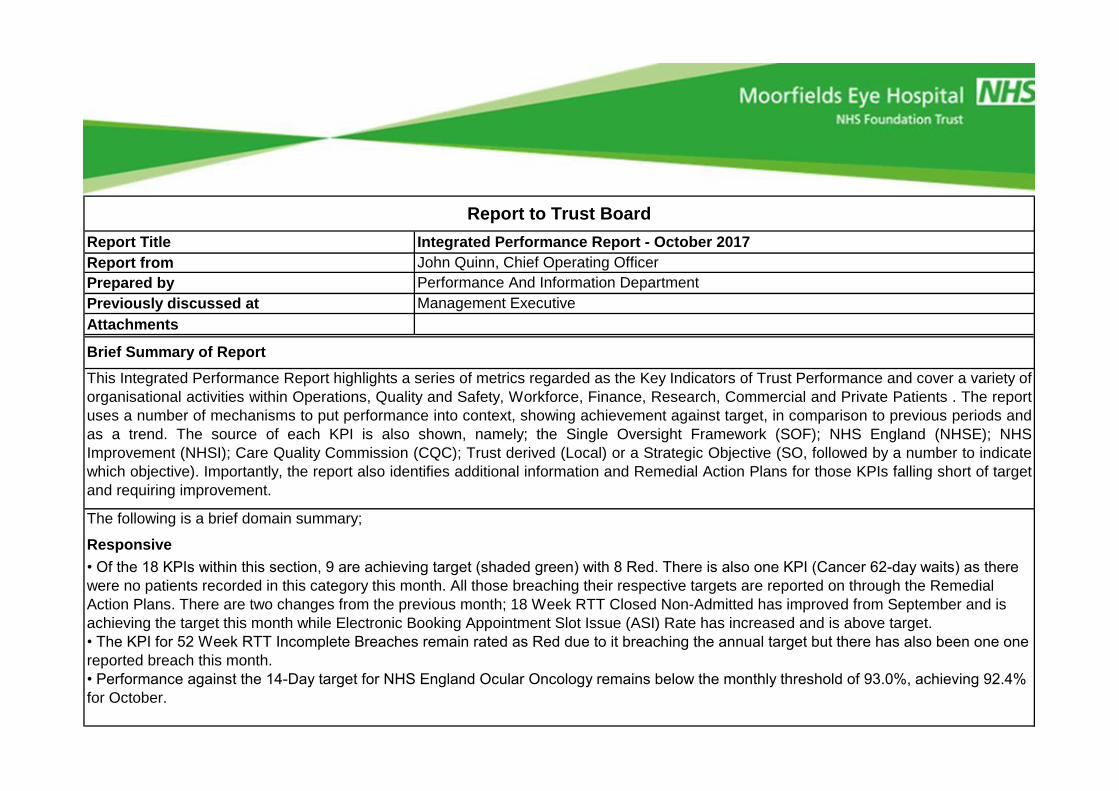
Report to Trust Board Report Title Integrated Performance Report - October 2017 Report from John Quinn, Chief Operating Officer Prepared by Performance And Information Department Previously discussed at Management Executive Attachments Brief Summary of Report This Integrated Performance Report highlights a series of metrics regarded as the Key Indicators of Trust Performance and cover a variety of organisational activities within Operations, Quality and Safety, Workforce, Finance, Research, Commercial and Private Patients . The report uses a number of mechanisms to put performance into context, showing achievement against target, in comparison to previous periods and as a trend. The source of each KPI is also shown, namely; the Single Oversight Framework (SOF); NHS England (NHSE); NHS Improvement (NHSI); Care Quality Commission (CQC); Trust derived (Local) or a Strategic Objective (SO, followed by a number to indicate which objective). Importantly, the report also identifies additional information and Remedial Action Plans for those KPIs falling short of target and requiring improvement. The following is a brief domain summary; Responsive • Of the 18 KPIs within this section, 9 are achieving target (shaded green) with 8 Red. There is also one KPI (Cancer 62-day waits) as there were no patients recorded in this category this month. All those breaching their respective targets are reported on through the Remedial Action Plans. There are two changes from the previous month; 18 Week RTT Closed Non-Admitted has improved from September and is achieving the target this month while Electronic Booking Appointment Slot Issue (ASI) Rate has increased and is above target. • The KPI for 52 Week RTT Incomplete Breaches remain rated as Red due to it breaching the annual target but there has also been one one reported breach this month. • Performance against the 14-Day target for NHS England Ocular Oncology remains below the monthly threshold of 93.0%, achieving 92.4% for October.
Transcript of 171214 TB Item 07 October IPR.pdf - moorfields.nhs.uk TB Item 07... · Report to Trust Board Report...
Report to Trust Board
Report Title Integrated Performance Report - October 2017
Report from John Quinn, Chief Operating Officer
Prepared by Performance And Information Department
Previously discussed at Management Executive
Attachments
Brief Summary of Report
This Integrated Performance Report highlights a series of metrics regarded as the Key Indicators of Trust Performance and cover a variety of
organisational activities within Operations, Quality and Safety, Workforce, Finance, Research, Commercial and Private Patients . The report
uses a number of mechanisms to put performance into context, showing achievement against target, in comparison to previous periods and
as a trend. The source of each KPI is also shown, namely; the Single Oversight Framework (SOF); NHS England (NHSE); NHS
Improvement (NHSI); Care Quality Commission (CQC); Trust derived (Local) or a Strategic Objective (SO, followed by a number to indicate
which objective). Importantly, the report also identifies additional information and Remedial Action Plans for those KPIs falling short of target
and requiring improvement.
The following is a brief domain summary;
Responsive
• Of the 18 KPIs within this section, 9 are achieving target (shaded green) with 8 Red. There is also one KPI (Cancer 62-day waits) as there
were no patients recorded in this category this month. All those breaching their respective targets are reported on through the Remedial
Action Plans. There are two changes from the previous month; 18 Week RTT Closed Non-Admitted has improved from September and is
achieving the target this month while Electronic Booking Appointment Slot Issue (ASI) Rate has increased and is above target.
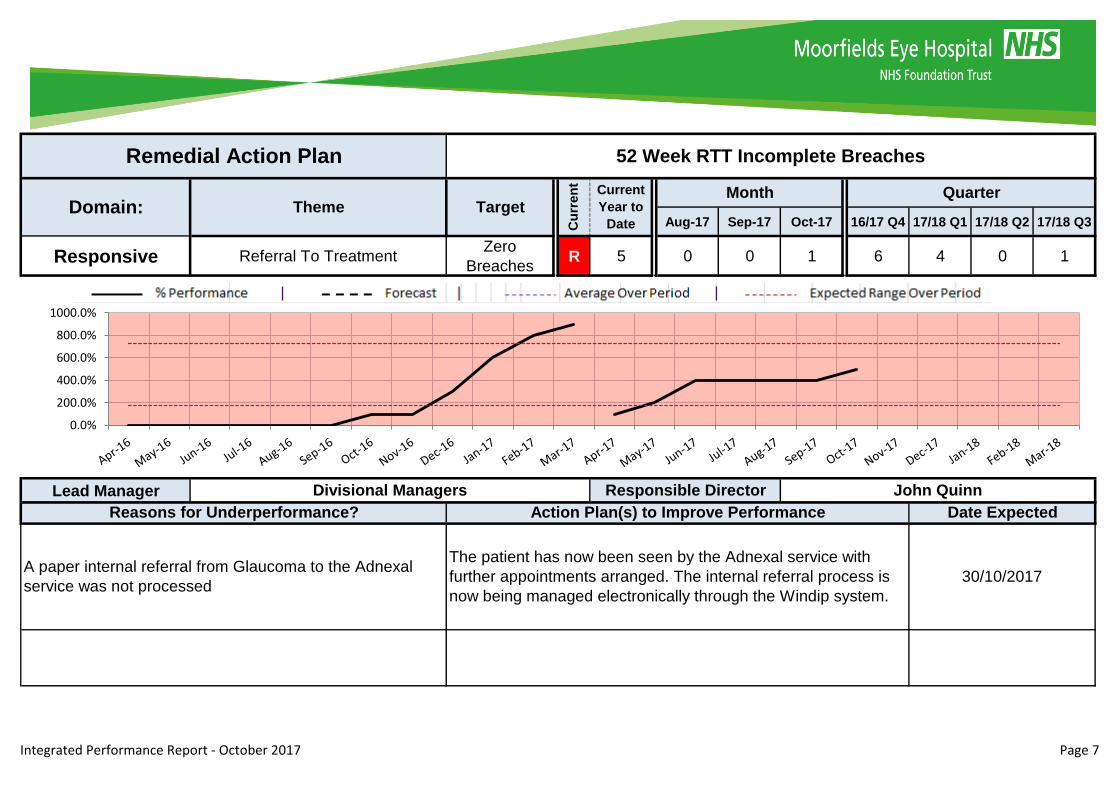
• The KPI for 52 Week RTT Incomplete Breaches remain rated as Red due to it breaching the annual target but there has also been one one
reported breach this month.
• Performance against the 14-Day target for NHS England Ocular Oncology remains below the monthly threshold of 93.0%, achieving 92.4%
for October.

X To Note
Well Led
Safe
Effective
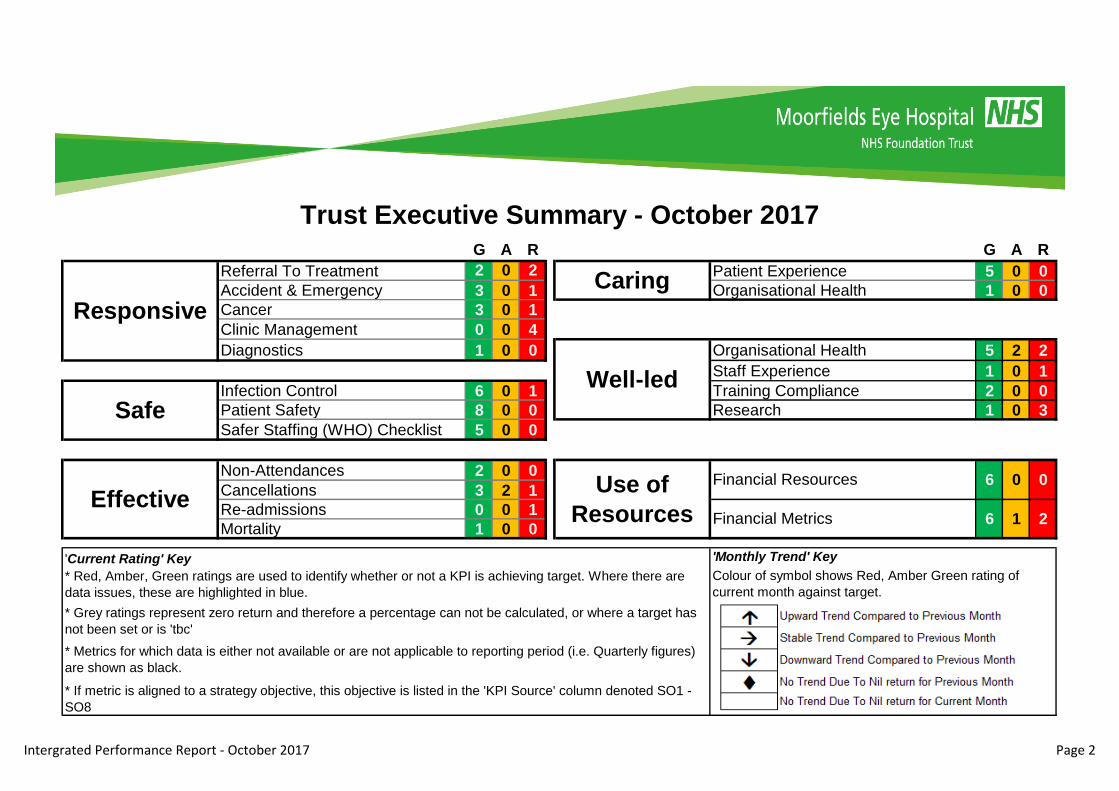
• For the 10 KPIs within the Effective section, 6 are achieving their respective targets this month with two being rated 'Amber' and the
remaining two 'Red'.
• Of the two Amber KPIs, the Outpatient Cancellation Rate (Patient Cancellations) has marginally breached the target (3.18% achieved
against the 3.15% target) and the Theatre Cancellation Rate (Non-Medical Cancellations) has achieved it's best level of performance this
month.
• Of the two Red KPIs, operations which were cancelled for non-medical reasons which were not rebooked within 28 days has again reported
2 for the month which has prompted a review of the administrative and escalation processes. Similarly the Emergency Re-admission
percentage breach has also triggered work to ensure accurate recording of data.
Caring
• Of the six metrics within this domain, all are achieving target this month. This is an improvement on the previous month with Written
Complaints now meeting the monthly target.
• This domain contains 19 reportable KPIs for this month, of which 18 are achieving target. The only KPI breaching target this month is
'Adenovirus cases that were possibly MEH acquired', for which a Remedial Action Plan has been completed. The RAP identifies that whilst
there have been four cases, each has been reviewed and there are no specific causes for concern with infection control or for patient safety.
The report is primarily for information purposes but will inform discussion regarding how the Trust is performing against its key organisational measures.
This may in turn generate subsequent action. As this is the first Integrated Performance Report produced in this format, the Board is also asked to provide
feedback on the style and content of the report, so that these can be considered for future iterations.
For Assurance For decision For discussion
• The 17 KPIs within this domain reflect 9 measures achieving target with the remainder falling short, with 2 Amber and 6 Red. Remedial
Action Plans are supplied for 6 of these KPIs, the temporary staffing details can be found within the Boards Finance Report
• Appraisal Compliance has achieved the 80% target this month for the first time this financial year.
Use Of Resources
• The 15 KPIs within this domain reflect 12 measures achieving target with 3 falling short (1 Amber and 2 Red). Further detail can be found in
the Board Financial Report.
Action Required/Recommendation
The report is primarily for information purposes but will inform discussion regarding how the Trust is performing against its key organisational measures.
This may in turn generate subsequent action. As this is the first Integrated Performance Report produced in this format, the Board is also asked to provide
feedback on the style and content of the report, so that these can be considered for future iterations.
Action Required/Recommendation
G A R G A R
Referral To Treatment 2 0 2 Patient Experience 5 0 0
Accident & Emergency 3 0 1 Organisational Health 1 0 0
Cancer 3 0 1
Clinic Management 0 0 4
Diagnostics 1 0 0 Organisational Health 5 2 2
Staff Experience 1 0 1
Infection Control 6 0 1 Training Compliance 2 0 0
Patient Safety 8 0 0 Research 1 0 3
Safer Staffing (WHO) Checklist 5 0 0
Non-Attendances 2 0 0
Cancellations 3 2 1
Re-admissions 0 0 1
Mortality 1 0 0
'Current Rating' Key 'Monthly Trend' Key
* Red, Amber, Green ratings are used to identify whether or not a KPI is achieving target. Where there are
data issues, these are highlighted in blue.
Colour of symbol shows Red, Amber Green rating of
current month against target.
* Grey ratings represent zero return and therefore a percentage can not be calculated, or where a target has
not been set or is 'tbc'
* Metrics for which data is either not available or are not applicable to reporting period (i.e. Quarterly figures)
are shown as black.
* If metric is aligned to a strategy objective, this objective is listed in the 'KPI Source' column denoted SO1 -
SO8
0
Financial Metrics 6 1 2Effective
Use of
Resources
Financial Resources 6 0
Trust Executive Summary - October 2017
Responsive
Caring
Well-led
Safe
Intergrated Performance Report - October 2017 Page 2
Executive Summary - Domain Trends
0
2
4
6
8
10
12
Apr May Jun Jul Aug Sep Oct
KP
I RA
G S
tatu
s
Apr May Jun Jul Aug Sep Oct
Green 7 8 9 9 10 10 9
Amber 0 1 2 1 1 1 0
Red 10 8 6 6 7 7 8
Responsive
0
5
10
15
20
Apr May Jun Jul Aug Sep Oct
KP
I RA
G S
tatu
s
Apr May Jun Jul Aug Sep Oct
Green 16 16 18 17 18 19 19
Amber 0 0 0 0 0 0 0
Red 3 3 2 1 0 1 1
Safe
0
2
4
6
8
10
Apr May Jun Jul Aug Sep Oct
KP
I RA
G S
tatu
s
Apr May Jun Jul Aug Sep Oct
Green 6 5 5 6 5 8 6
Amber 2 3 0 2 1 1 2
Red 2 2 5 2 4 0 2
Effective
0
1
2
3
4
5
6
7
Apr May Jun Jul Aug Sep Oct
KP
I RA
G S
tatu
s
Apr May Jun Jul Aug Sep Oct
Green 5 5 5 6 5 5 6
Amber 0 0 0 0 0 0 0
Red 1 1 1 0 1 1 0
Caring
0
2
4
6
8
10
12
Apr May Jun Jul Aug Sep Oct
KP
I RA
G S
tatu
s
Apr May Jun Jul Aug Sep Oct
Green 11 10 10 11 8 7 9
Amber 2 2 3 2 3 3 2
Red 3 4 4 4 6 7 6
Well-Led
0
2
4
6
8
10
12
14
Apr May Jun Jul Aug Sep Oct
KP
I RA
G S
tatu
s
Apr May Jun Jul Aug Sep Oct
Green 10 12 12 12 9 11 12
Amber 1 0 0 1 0 0 1
Red 4 3 3 2 6 4 2
Use of Resources
Integrated Performance Report - October 2017 Page 3

2016/17 2017/18 2016/17 2017/18
A&E Arrivals (All Type 2) 8,613 8,401 - 2.5% 62,044 59,807 - 3.6%
Number of 4 hour breaches 281 43 - 84.7% 1,327 999 - 24.7%
Number of Referrals Received 11,163 11,889 + 6.5% 75,776 76,019 + 0.3%
Total Attendances 47,215 50,556 + 7.1% 324,207 329,513 + 1.6%
First Appointment Attendances 10,888 11,429 + 5.0% 72,313 73,906 + 2.2%
Follow Up (Subsequent) Attendances 36,327 39,127 + 7.7% 251,894 255,607 + 1.5%
Total Admissions 3,195 3,337 + 4.4% 22,069 21,780 - 1.3%
Day Case Elective Admissions 2,817 3,004 + 6.6% 19,829 19,395 - 2.2%
Inpatient Elective Admissions 125 83 - 33.6% 670 621 - 7.3%
Non-Elective (Emergency) Admissions 253 250 - 1.2% 1,570 1,764 + 12.4%
These figures are not subject to any finance or commissioning business logic. They present all activity, whether chargeable or not
Outpatient
Activity
Admission
Activity
Context - Overall Activity - October 2017October 2017 Monthly
Variance
Year To Date YTD
Variance
Accident &
Emergency
Intergrated Performance Report - October 2017 Page 4

Domain: Responsive
Aug-17 Sep-17 Oct-17 16/17 Q4 17/18 Q1 17/18 Q2 17/18 Q3 13 Month Month
18 Week RTT Incomplete Performance SOF ≥92% G 96.0% 95.7% 95.3% 94.7% 97.7% 96.7% 95.6% 94.7%
52 Week RTT Incomplete Breaches NHSEZero
BreachesR 7 5 0 0 1 6 4 0 1
18 Week RTT Closed Admitted Performance NHSE ≥90% R 8 83.7% 83.2% 83.6% 83.5% 86.3% 84.1% 83.3% 83.5%
18 Week RTT Closed Non-Admitted Performance NHSE ≥95% G 95.3% 95.2% 95.1% 95.5% 96.0% 95.8% 94.8% 95.5%
A&E Four Hour Performance SOF ≥95% G 98.3% 98.1% 99.4% 99.5% 98.0% 97.5% 98.7% 99.5%
Time to Treatment In Department - median Local ≤60 Mins G 31 33 36 40 35 31 34 40
A&E Left Without Being Seen Local ≤5% G 2.4% 1.9% 2.1% 2.7% 2.3% 2.4% 2.2% 2.7%
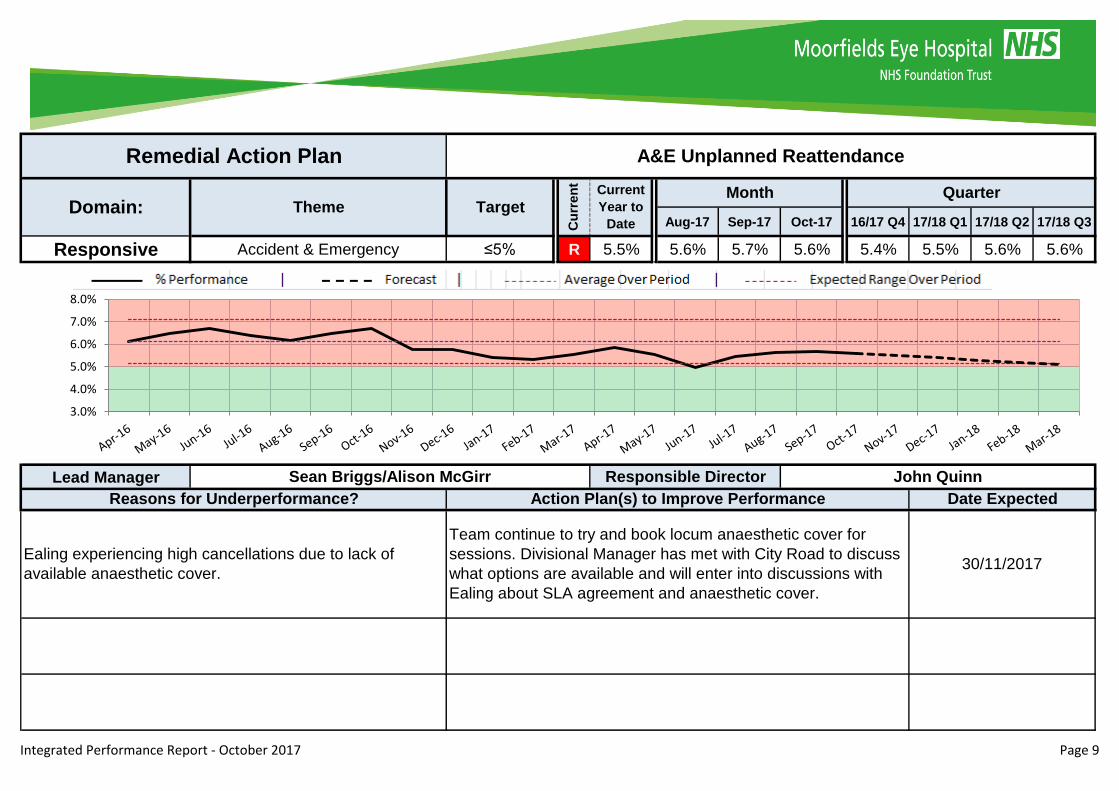
A&E Unplanned Reattendance Local ≤5% R 9 5.5% 5.6% 5.7% 5.6% 5.4% 5.5% 5.6% 5.6%
Cancer 2 week waits - first appointment urgent GP referral NHSE ≥93% G 97.9% 93.3% 100.0% 100.0% 100.0% 97.0% 97.7% 100.0%
Cancer 14 Day Target - NHS England Referrals (Ocular Oncology) NHSE ≥93% R 10 92.2% 92.6% 91.5% 92.4% 89.1% 91.8% 92.6% 92.4%
Cancer 31 day waits - diagnosis to first appointment NHSE ≥96% G 90.8% 100.0% 100.0% 100.0% 93.2% 79.1% 100.0% 100.0%
Cancer 31 day waits - subsequent treatment NHSE ≥94% G 96.3% 100.0% 100.0% 100.0% 100.0% 88.9% 100.0% 100.0%
Cancer 62 days from urgent GP referral to first definitive treatment SOF ≥85% 100.0% 100.0% n/a n/a 100.0% n/a 100.0% n/a
Outpatient Clinic Journey times - New Appointments (Minutes): Trajectory
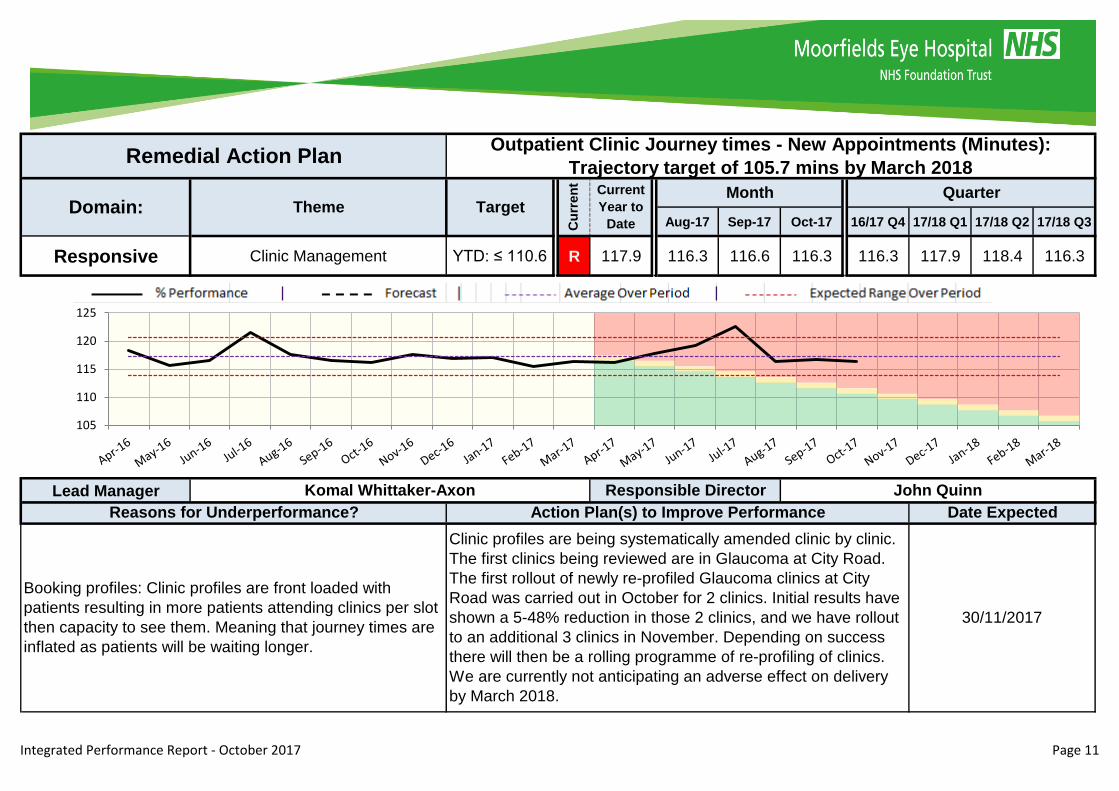
target of 105.7 mins by March 2018SO1 YTD: ≤ 110.6 R 11 117.9 116.3 116.6 116.3 116.3 117.9 118.4 116.3
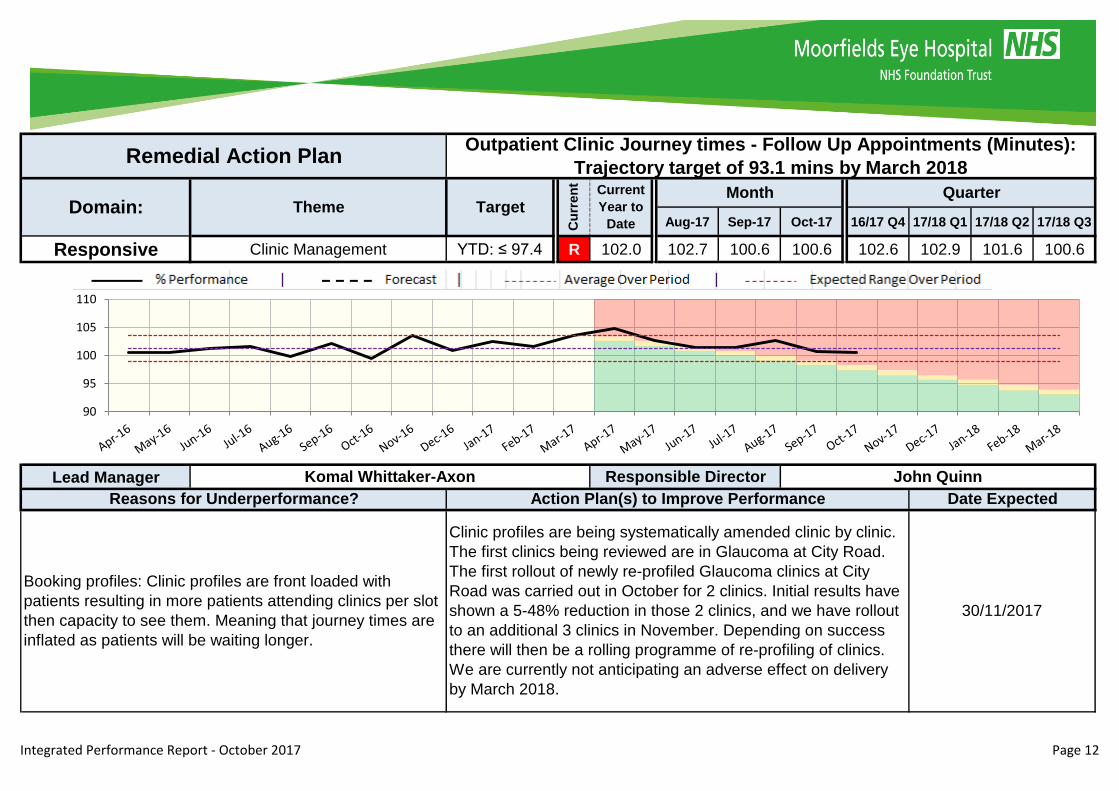
Outpatient Clinic Journey times - Follow Up Appointments (Minutes):
Trajectory target of 93.1 mins by March 2018SO1 YTD: ≤ 97.4 R 12 102.0 102.7 100.6 100.6 102.6 102.9 101.6 100.6
Electronic Booking Appointment Slot Issue (ASI) Rate - trajectory target
of ≥ 4% by March 2018NHSI Mth: ≤ 13.1% R 13 22.1% 17.2% 12.4% 22.5% 19.8% 26.9% 17.4% 22.5%
Percentage of GP referrals From Electronic Booking - trajectory target of
80% by Q3NHSI Mth: ≥83.3% R 14 56.8% 58.9% 62.0% 60.5% 57.7% 53.8% 58.4% 60.5%
Diagnostics Percentage of Diagnostic waiting times less than 6 weeks NHSE ≥99% G 100% 100% 100% 100% 100% 100% 100% 100%
Referral To
Treatment
Accident &
Emergency
Cancer
Clinic
Management
October 2017
Theme Metric DescriptionKPI
SourceTarget
Cu
rre
nt
RA
P P
g Current
Year to
Date
Month Quarter Trends
Where issued for a metric, the page number of the Remedial Action Plan (RAP) can be found in column 'RAP Pg'
Integrated Performance Report - October 2017 Page 5
Remedial Action Plans for Responsive
Integrated Performance Report - October 2017 Page 6
Aug-17 Sep-17 Oct-17 16/17 Q4 17/18 Q1 17/18 Q2 17/18 Q3
Responsive Referral To TreatmentZero
BreachesR 5 0 0 1 6 4 0 1
Lead Manager
A paper internal referral from Glaucoma to the Adnexal
service was not processed
The patient has now been seen by the Adnexal service with
further appointments arranged. The internal referral process is
now being managed electronically through the Windip system.
30/10/2017
Divisional Managers Responsible Director John Quinn
Reasons for Underperformance? Action Plan(s) to Improve Performance Date Expected
Remedial Action Plan 52 Week RTT Incomplete Breaches
Domain: Theme Target
Cu
rren
t
Current
Year to
Date
Month Quarter
0.0%
200.0%
400.0%
600.0%
800.0%
1000.0%
Integrated Performance Report - October 2017 Page 7

Aug-17 Sep-17 Oct-17 16/17 Q4 17/18 Q1 17/18 Q2 17/18 Q3
Responsive Referral To Treatment ≥90% R 83.7% 83.2% 83.6% 83.5% 86.3% 84.1% 83.3% 83.5%
Lead Manager
North West - Issues with cover at Northwick Park and Ealing
Hospital are affecting performance. Cover both in terms of senior
medical cover and anaesthetic cover.
Team continue to book locum anaesthetic cover for sessions. Divisional
Manager has met with City Road to discuss what options are available
and will enter into discussions with Ealing about SLA agreement and
anaesthetic cover.
30/11/2017
South - Additional referrals loaded March/April 2017 (450 Referrals)
impacting bottle neck 18-24 weeks.
Maximising lists - Ensuring we utilise full day of theatre lists. Increase
Injection list from an average of 11 to 13. Additional Cataract list on
Saturdays leading to January 2017
01/02/2018
Cancellation rates for patients particularly New patients noted to be
much higher at Darent Valley and Watford; 7-8%.
Divisional Manager to meet with team doing bookings to understand
issues and draw up plan to reduce patient cancellations.30/11/2017
North East - Issues with capacity at Darent Valley Hospital
insufficient for current demand. Main other underperformance is
Cataract at St Ann's and Mile End.
Darent Valley Hospital expansion plan underway. Cataract lists have
been increased to 7 per session at Mile End and St Ann's to help
performance although Barts move has affected Theatres.
30/11/2017
Divisional Managers Responsible Director John Quinn
Reasons for Underperformance? Action Plan(s) to Improve Performance Date Expected
Remedial Action Plan 18 Week RTT Closed Admitted Performance
Domain: Theme Target
Cu
rren
t
Current
Year to
Date
Month Quarter
75%
80%
85%
90%
95%
100%
Integrated Performance Report - October 2017 Page 8
Aug-17 Sep-17 Oct-17 16/17 Q4 17/18 Q1 17/18 Q2 17/18 Q3
Responsive Accident & Emergency ≤5% R 5.5% 5.6% 5.7% 5.6% 5.4% 5.5% 5.6% 5.6%
Lead Manager
Ealing experiencing high cancellations due to lack of
available anaesthetic cover.
Team continue to try and book locum anaesthetic cover for
sessions. Divisional Manager has met with City Road to discuss
what options are available and will enter into discussions with
Ealing about SLA agreement and anaesthetic cover.
30/11/2017
Sean Briggs/Alison McGirr Responsible Director John Quinn
Reasons for Underperformance? Action Plan(s) to Improve Performance Date Expected
Remedial Action Plan A&E Unplanned Reattendance
Domain: Theme Target
Cu
rren
t
Current
Year to
Date
Month Quarter
3.0%
4.0%
5.0%
6.0%
7.0%
8.0%
Integrated Performance Report - October 2017 Page 9

Aug-17 Sep-17 Oct-17 16/17 Q4 17/18 Q1 17/18 Q2 17/18 Q3
Responsive Cancer ≥93% R 92.2% 92.6% 91.5% 92.4% 89.1% 91.8% 92.6% 92.4%
Lead Manager
14 day Ocular oncology performance of 92.4% was due to
patient choice. Out of 79 attendance 6 patients did not
want their appointment within the 14 day timeframe
All patients who request a date for their appointment outside the
breach date are escalated to the service manager . All patients
are telephoned and offered dates within the 14 day time frame
30/11/2017
Katie Goodwin Responsible Director John Quinn
Reasons for Underperformance? Action Plan(s) to Improve Performance Date Expected
Remedial Action Plan Cancer 14 Day Target - NHS England Referrals (Ocular Oncology)
Domain: Theme Target
Cu
rren
t
Current
Year to
Date
Month Quarter
70%
75%
80%
85%
90%
95%
100%
Integrated Performance Report - October 2017 Page 10
Aug-17 Sep-17 Oct-17 16/17 Q4 17/18 Q1 17/18 Q2 17/18 Q3
Responsive Clinic Management YTD: ≤ 110.6 R 117.9 116.3 116.6 116.3 116.3 117.9 118.4 116.3
Lead Manager
Booking profiles: Clinic profiles are front loaded with
patients resulting in more patients attending clinics per slot
then capacity to see them. Meaning that journey times are
inflated as patients will be waiting longer.
Clinic profiles are being systematically amended clinic by clinic.
The first clinics being reviewed are in Glaucoma at City Road.
The first rollout of newly re-profiled Glaucoma clinics at City
Road was carried out in October for 2 clinics. Initial results have
shown a 5-48% reduction in those 2 clinics, and we have rollout
to an additional 3 clinics in November. Depending on success
there will then be a rolling programme of re-profiling of clinics.
We are currently not anticipating an adverse effect on delivery
by March 2018.
30/11/2017
Komal Whittaker-Axon Responsible Director John Quinn
Reasons for Underperformance? Action Plan(s) to Improve Performance Date Expected
Remedial Action PlanOutpatient Clinic Journey times - New Appointments (Minutes):
Trajectory target of 105.7 mins by March 2018
Domain: Theme Target
Cu
rren
t
Current
Year to
Date
Month Quarter
105
110
115
120
125
Integrated Performance Report - October 2017 Page 11
Aug-17 Sep-17 Oct-17 16/17 Q4 17/18 Q1 17/18 Q2 17/18 Q3
Responsive Clinic Management YTD: ≤ 97.4 R 102.0 102.7 100.6 100.6 102.6 102.9 101.6 100.6
Lead Manager
Booking profiles: Clinic profiles are front loaded with
patients resulting in more patients attending clinics per slot
then capacity to see them. Meaning that journey times are
inflated as patients will be waiting longer.
Clinic profiles are being systematically amended clinic by clinic.
The first clinics being reviewed are in Glaucoma at City Road.
The first rollout of newly re-profiled Glaucoma clinics at City
Road was carried out in October for 2 clinics. Initial results have
shown a 5-48% reduction in those 2 clinics, and we have rollout
to an additional 3 clinics in November. Depending on success
there will then be a rolling programme of re-profiling of clinics.
We are currently not anticipating an adverse effect on delivery
by March 2018.
30/11/2017
Komal Whittaker-Axon Responsible Director John Quinn
Reasons for Underperformance? Action Plan(s) to Improve Performance Date Expected
Remedial Action PlanOutpatient Clinic Journey times - Follow Up Appointments (Minutes):
Trajectory target of 93.1 mins by March 2018
Domain: Theme Target
Cu
rren
t
Current
Year to
Date
Month Quarter
90
95
100
105
110
Integrated Performance Report - October 2017 Page 12
Aug-17 Sep-17 Oct-17 16/17 Q4 17/18 Q1 17/18 Q2 17/18 Q3
Responsive Clinic Management Mth: ≤ 13.1% R 22.1% 17.2% 12.4% 22.5% 19.8% 26.9% 17.4% 22.5%
Lead Manager
Remedial Action PlanElectronic Booking Appointment Slot Issue (ASI) Rate - trajectory target
of ≥ 4% by March 2018
Domain: Theme Target
Cu
rren
t
Current
Year to
Date
Month Quarter
Sean Briggs Responsible Director John Quinn
Reasons for Underperformance? Action Plan(s) to Improve Performance Date Expected
Actual clinic slots now available stands at 93%. MEH are
working with commissioners to change the data we are
currently reporting as we are on track to meet the CQUIN.
High demand for new CAB slots.
Demand and capacity project looking to ensure all choose and
book slots have capacity. 01/01/2018
0.0%
10.0%
20.0%
30.0%
Integrated Performance Report - October 2017 Page 13

Aug-17 Sep-17 Oct-17 16/17 Q4 17/18 Q1 17/18 Q2 17/18 Q3
Responsive Clinic Management Mth: ≥83.3% R 56.8% 58.9% 62.0% 60.5% 57.7% 53.8% 58.4% 60.5%
Lead Manager
01/01/2018
Actual clinic slots now available stands at 93%. MEH are
working with commissioners to change the data we are
currently reporting as we are on track to meet the CQUIN.
High demand for new CAB slots.
Demand and capacity project looking to ensure all choose and
book slots have capacity.
Sean Briggs Responsible Director John Quinn
Reasons for Underperformance? Action Plan(s) to Improve Performance Date Expected
Remedial Action PlanPercentage of GP referrals From Electronic Booking - trajectory target
of 80% by Q3
Domain: Theme Target
Cu
rren
t
Current
Year to
Date
Month Quarter
50%
60%
70%
80%
90%
100%
Integrated Performance Report - October 2017 Page 14
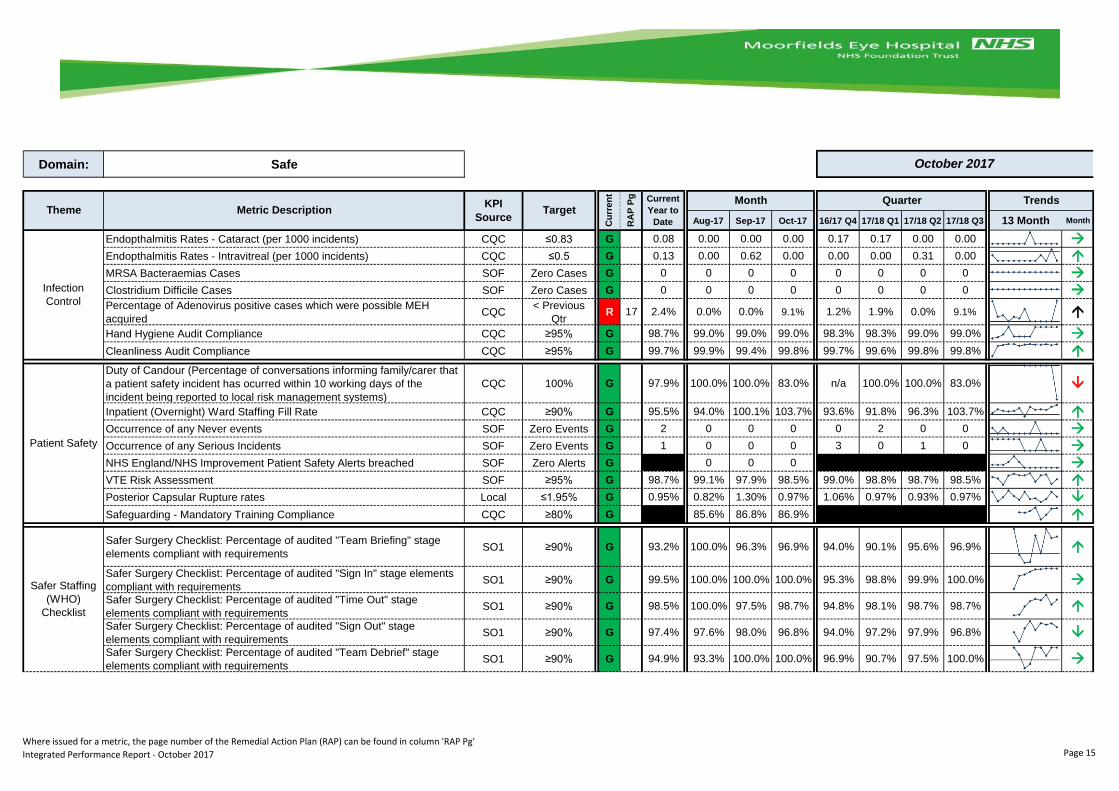
Domain: Safe
Aug-17 Sep-17 Oct-17 16/17 Q4 17/18 Q1 17/18 Q2 17/18 Q3 13 Month Month
Endopthalmitis Rates - Cataract (per 1000 incidents) CQC ≤0.83 G 0.08 0.00 0.00 0.00 0.17 0.17 0.00 0.00
Endopthalmitis Rates - Intravitreal (per 1000 incidents) CQC ≤0.5 G 0.13 0.00 0.62 0.00 0.00 0.00 0.31 0.00
MRSA Bacteraemias Cases SOF Zero Cases G 0 0 0 0 0 0 0 0
Clostridium Difficile Cases SOF Zero Cases G 0 0 0 0 0 0 0 0
Percentage of Adenovirus positive cases which were possible MEH
acquiredCQC
< Previous
QtrR 17 2.4% 0.0% 0.0% 9.1% 1.2% 1.9% 0.0% 9.1%
Hand Hygiene Audit Compliance CQC ≥95% G 98.7% 99.0% 99.0% 99.0% 98.3% 98.3% 99.0% 99.0%
Cleanliness Audit Compliance CQC ≥95% G 99.7% 99.9% 99.4% 99.8% 99.7% 99.6% 99.8% 99.8%
Duty of Candour (Percentage of conversations informing family/carer that
a patient safety incident has ocurred within 10 working days of the
incident being reported to local risk management systems)
CQC 100% G 97.9% 100.0% 100.0% 83.0% n/a 100.0% 100.0% 83.0%
Inpatient (Overnight) Ward Staffing Fill Rate CQC ≥90% G 95.5% 94.0% 100.1% 103.7% 93.6% 91.8% 96.3% 103.7%
Occurrence of any Never events SOF Zero Events G 2 0 0 0 0 2 0 0
Occurrence of any Serious Incidents SOF Zero Events G 1 0 0 0 3 0 1 0
NHS England/NHS Improvement Patient Safety Alerts breached SOF Zero Alerts G 0 0 0
VTE Risk Assessment SOF ≥95% G 98.7% 99.1% 97.9% 98.5% 99.0% 98.8% 98.7% 98.5%
Posterior Capsular Rupture rates Local ≤1.95% G 0.95% 0.82% 1.30% 0.97% 1.06% 0.97% 0.93% 0.97%
Safeguarding - Mandatory Training Compliance CQC ≥80% G 85.6% 86.8% 86.9%
Safer Surgery Checklist: Percentage of audited "Team Briefing" stage
elements compliant with requirements SO1 ≥90% G 93.2% 100.0% 96.3% 96.9% 94.0% 90.1% 95.6% 96.9%
Safer Surgery Checklist: Percentage of audited "Sign In" stage elements
compliant with requirementsSO1 ≥90% G 99.5% 100.0% 100.0% 100.0% 95.3% 98.8% 99.9% 100.0%
Safer Surgery Checklist: Percentage of audited "Time Out" stage
elements compliant with requirementsSO1 ≥90% G 98.5% 100.0% 97.5% 98.7% 94.8% 98.1% 98.7% 98.7%
Safer Surgery Checklist: Percentage of audited "Sign Out" stage
elements compliant with requirementsSO1 ≥90% G 97.4% 97.6% 98.0% 96.8% 94.0% 97.2% 97.9% 96.8%
Safer Surgery Checklist: Percentage of audited "Team Debrief" stage
elements compliant with requirementsSO1 ≥90% G 94.9% 93.3% 100.0% 100.0% 96.9% 90.7% 97.5% 100.0%
October 2017
Theme Metric DescriptionKPI
SourceTarget
TrendsCurrent
Year to
Date
Month Quarter
Infection
Control
Patient Safety
Safer Staffing
(WHO)
ChecklistC
urr
en
t
RA
P P
g
Where issued for a metric, the page number of the Remedial Action Plan (RAP) can be found in column 'RAP Pg'
Integrated Performance Report - October 2017 Page 15
Remedial Action Plans for Safe
Integrated Performance Report - October 2017 Page 16

Aug-17 Sep-17 Oct-17 16/17 Q4 17/18 Q1 17/18 Q2 17/18 Q3
Safe Infection Control< Previous
QtrR 2.4% 0.0% 0.0% 9.1% 1.2% 1.9% 0.0% 9.1%
Lead Manager
Remedial Action PlanPercentage of Adenovirus positive cases which were possible MEH
acquired
Domain: Theme Target
Cu
rren
t
Current
Year to
Date
Month Quarter
Catherine Wagland Responsible Director Tracy Luckett
Reasons for Underperformance? Action Plan(s) to Improve Performance Date Expected
There is no particular indication for the increase in
numbers of adenovirous for the month of October. All four
cases occurred in different department and on different
dates and were seen by different practitioners. However,
appropriate actions were taken.
The Infection Control Nurses conducted a walkabout in the units
that had the cases to observe practice. All the areas had the
appropriate wipes present which were in every cubicle and slit-
lamps were observed to be cleaned between patients. Staff
were reminded to clean medical devices between patients and
practice good hand hygiene.Continued surveillance of
adenovirus is being conducted by the infection control team.
0.0%
2.0%
4.0%
6.0%
8.0%
10.0%
Integrated Performance Report - October 2017 Page 17

Domain: Effective
Aug-17 Sep-17 Oct-17 16/17 Q4 17/18 Q1 17/18 Q2 17/18 Q3 13 Month Month
Outpatients DNA rate - 1st appointment - trajectory target of 12.7% by
March 2018Local YTD:≤13.3% G 12.3% 12.6% 12.5% 11.6% 13.8% 12.5% 12.5% 11.6%
Outpatients DNA rate - follow up appointment - trajectory target of 10.9%
by March 2018Local YTD:≤11.3% G 10.7% 11.0% 11.2% 10.6% 12.0% 10.5% 10.9% 10.6%
Outpatient Cancellation rate (Hospital cancellations) Local ≤2.85% G 2.86% 3.09% 2.54% 2.63% 2.70% 2.99% 2.83% 2.63%
Outpatient Cancellation Rate (Patient cancellations) Local ≤3.15% A 20 3.26% 3.41% 3.05% 3.18% 3.20% 3.28% 3.28% 3.18%
Theatre Cancellation Rate Local ≤7.6% G 7.0% 6.7% 6.3% 6.9% 8.0% 7.4% 6.6% 6.9%
Theatre Cancellation Rate (Non-Medical Cancellations) Local ≤0.8% A 21 1.35% 0.98% 1.09% 0.95% 1.22% 1.73% 1.12% 0.95%
Theatre Sessions starting late Local ≤35.8% G 32.2% 27.7% 27.6% 30.5% 38.5% 37.4% 27.7% 30.5%
Number of non-medical cancelled operations not treated within 28 days * CQCZero
BreachesR 22 9 1 2 2 1 4 3 2
Re-AdmissionsPercentage of Emergency re-admissions within 30 days following an
elective or emergency spell at the ProviderSOF ≤3.77% R 23 4.07% 5.36% 3.51% 6.20% 3.35% 3.44% 3.79% 6.20%
Mortality Summary Hospital Mortality Indicator SOF Zero Cases G 0 0 0 0 1 0 0 0
Non-
Attendances
Cancellations
October 2017
Theme Metric DescriptionKPI
SourceTarget
Cu
rre
nt
RA
P P
g Current
Year to
Date
Month Quarter Trends
* Figures for Current quarter and YTD are provisional
Where issued for a metric, the page number of the Remedial Action Plan (RAP) can be found in column 'RAP Pg'
Integrated Performance Report - October 2017 Page 18
Remedial Action Plans for Effective
Integrated Performance Report - October 2017 Page 19
Aug-17 Sep-17 Oct-17 16/17 Q4 17/18 Q1 17/18 Q2 17/18 Q3
Effective Cancellations ≤3.15% A 3.26% 3.41% 3.05% 3.18% 3.20% 3.28% 3.28% 3.18%
Lead Manager
Patients contacted over the past three months to reminding
them of their upcoming appointment. This has resulted in
more patient cancellations
All out patient activity is being monitored weekly including
patient cancellations. All patients are telephoned by the booking
centre staff before their appointment date to confirm
attendance.
30/11/2017
Cancellation rates for patients particularly New patients
noted to be much higher at Darent Valley and Watford - 7-
8%.
Divisional Manager to meet with team doing bookings to
understand issues and try to draw up plan to reduce patient
cancellations.
30/11/2017
Divisional Managers Responsible Director John Quinn
Reasons for Underperformance? Action Plan(s) to Improve Performance Date Expected
Remedial Action Plan Outpatient Cancellation Rate (Patient cancellations)
Domain: Theme Target
Cu
rren
t
Current
Year to
Date
Month Quarter
2.0%
2.5%
3.0%
3.5%
4.0%
Integrated Performance Report - October 2017 Page 20
Aug-17 Sep-17 Oct-17 16/17 Q4 17/18 Q1 17/18 Q2 17/18 Q3
Effective Cancellations ≤0.8% A 1.35% 0.98% 1.09% 0.95% 1.22% 1.73% 1.12% 0.95%
Lead Manager
Increased patient contact confirming planned surgery. A
reduction in DNA numbers supporting overall cancellation
rate.
The performance has improved from 1.09% down to 0.95 % in
the past month. The admission teams are calling patients to
confirm their attendance
30/11/2017
Ealing experiencing high cancellations due to lack of
available anaesthetic cover.
Team continue to try and book locum anaesthetic cover for
sessions. Divisional Manager has met with City Road to discuss
what options are available and will try to enter into discussions
with Ealing about SLA agreement and anaesthetic cover.
30/11/2017
Katie Goodwin Responsible Director John Quinn
Reasons for Underperformance? Action Plan(s) to Improve Performance Date Expected
Remedial Action Plan Theatre Cancellation Rate (Non-Medical Cancellations)
Domain: Theme Target
Cu
rren
t
Current
Year to
Date
Month Quarter
0.0%
1.0%
2.0%
3.0%
4.0%
Integrated Performance Report - October 2017 Page 21
Aug-17 Sep-17 Oct-17 16/17 Q4 17/18 Q1 17/18 Q2 17/18 Q3
Effective CancellationsZero
BreachesR 9 1 2 2 1 4 3 2
Lead Manager
One patient cancelled and then delayed due to patient
choice. One patient was cancelled due to a lack of theatre
time and then not re-booked in time.
Strengthened data capture and escalation process for non-
medical cancellations. 01/11/2017
Katie Goodwin Responsible Director John Quinn
Reasons for Underperformance? Action Plan(s) to Improve Performance Date Expected
Remedial Action Plan Number of non-medical cancelled operations not treated within 28 days
Domain: Theme Target
Cu
rren
t
Current
Year to
Date
Month Quarter
0
1
2
3
Integrated Performance Report - October 2017 Page 22
Aug-17 Sep-17 Oct-17 16/17 Q4 17/18 Q1 17/18 Q2 17/18 Q3
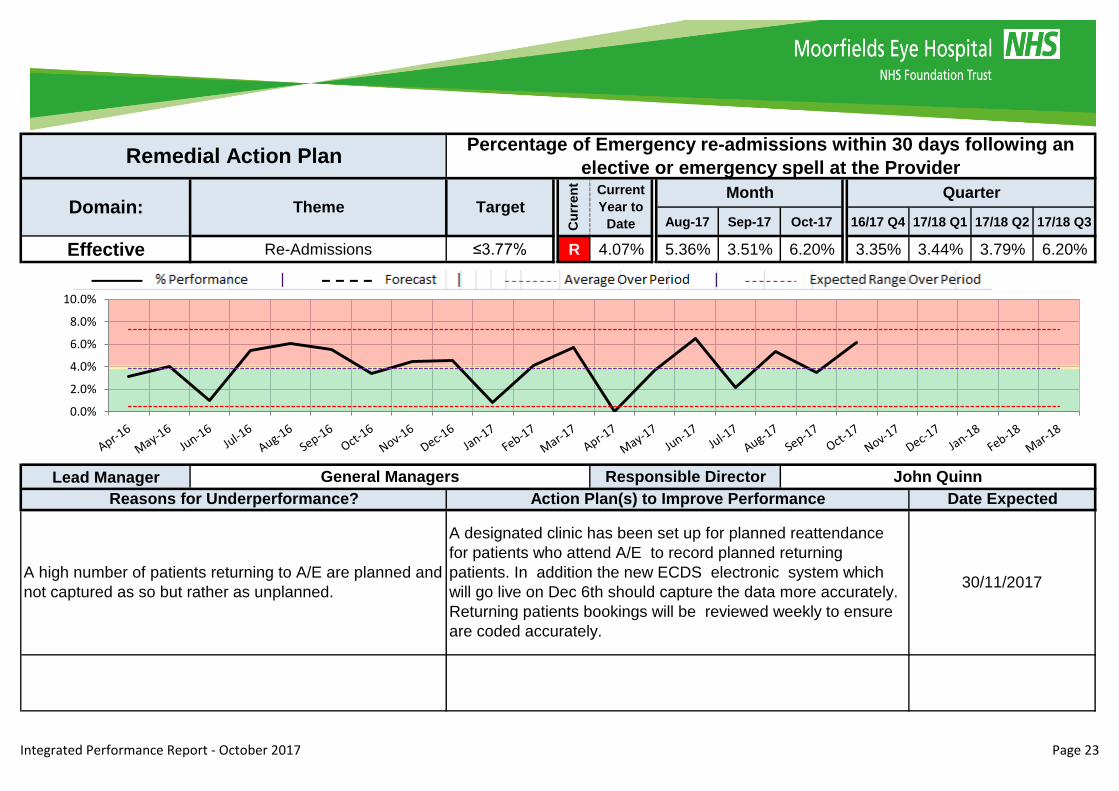
Effective Re-Admissions ≤3.77% R 4.07% 5.36% 3.51% 6.20% 3.35% 3.44% 3.79% 6.20%
Lead Manager
A high number of patients returning to A/E are planned and
not captured as so but rather as unplanned.
A designated clinic has been set up for planned reattendance
for patients who attend A/E to record planned returning
patients. In addition the new ECDS electronic system which
will go live on Dec 6th should capture the data more accurately.
Returning patients bookings will be reviewed weekly to ensure
are coded accurately.
30/11/2017
General Managers Responsible Director John Quinn
Reasons for Underperformance? Action Plan(s) to Improve Performance Date Expected
Remedial Action PlanPercentage of Emergency re-admissions within 30 days following an
elective or emergency spell at the Provider
Domain: Theme Target
Cu
rren
t
Current
Year to
Date
Month Quarter
0.0%
2.0%
4.0%
6.0%
8.0%
10.0%
Integrated Performance Report - October 2017 Page 23
Domain: Caring
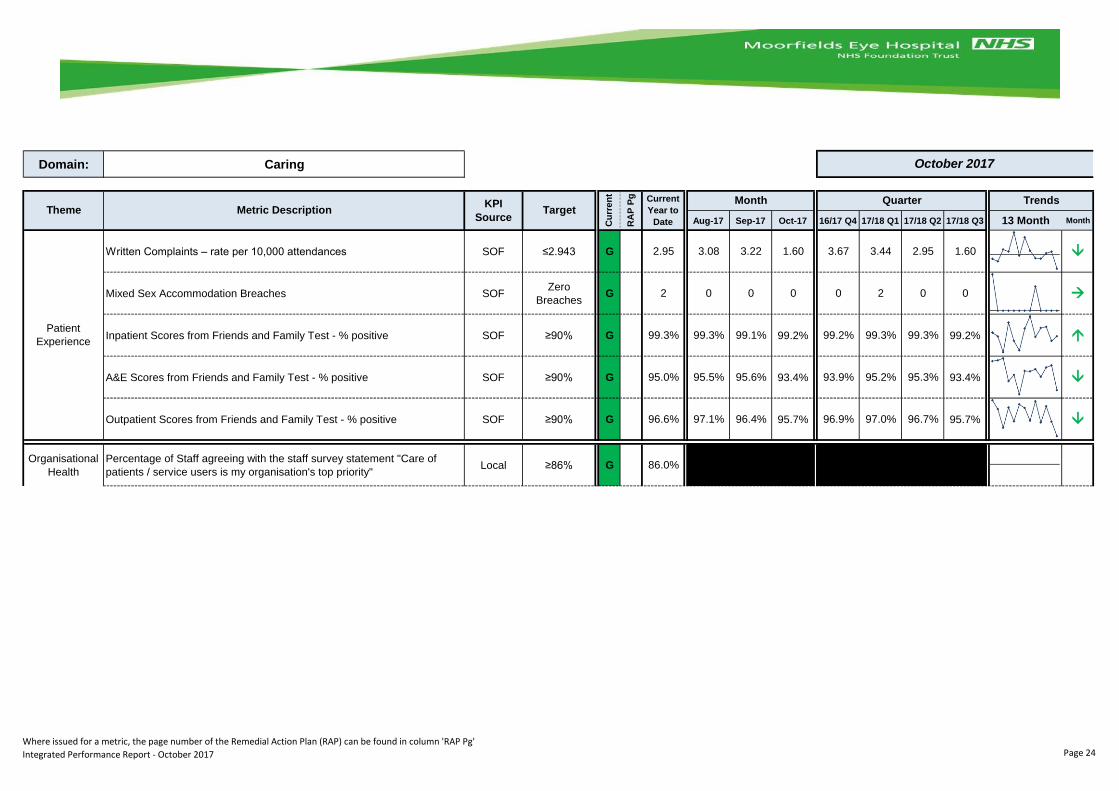
Aug-17 Sep-17 Oct-17 16/17 Q4 17/18 Q1 17/18 Q2 17/18 Q3 13 Month Month
Written Complaints – rate per 10,000 attendances SOF ≤2.943 G 2.95 3.08 3.22 1.60 3.67 3.44 2.95 1.60
Mixed Sex Accommodation Breaches SOFZero
BreachesG 2 0 0 0 0 2 0 0
Inpatient Scores from Friends and Family Test - % positive SOF ≥90% G 99.3% 99.3% 99.1% 99.2% 99.2% 99.3% 99.3% 99.2%
A&E Scores from Friends and Family Test - % positive SOF ≥90% G 95.0% 95.5% 95.6% 93.4% 93.9% 95.2% 95.3% 93.4%
Outpatient Scores from Friends and Family Test - % positive SOF ≥90% G 96.6% 97.1% 96.4% 95.7% 96.9% 97.0% 96.7% 95.7%
Organisational
Health
Percentage of Staff agreeing with the staff survey statement "Care of
patients / service users is my organisation's top priority"Local ≥86% G 86.0%
Patient
Experience
October 2017
Theme Metric DescriptionKPI
SourceTarget
Cu
rre
nt
RA
P P
g Current
Year to
Date
Month Quarter Trends
Where issued for a metric, the page number of the Remedial Action Plan (RAP) can be found in column 'RAP Pg'
Integrated Performance Report - October 2017 Page 24
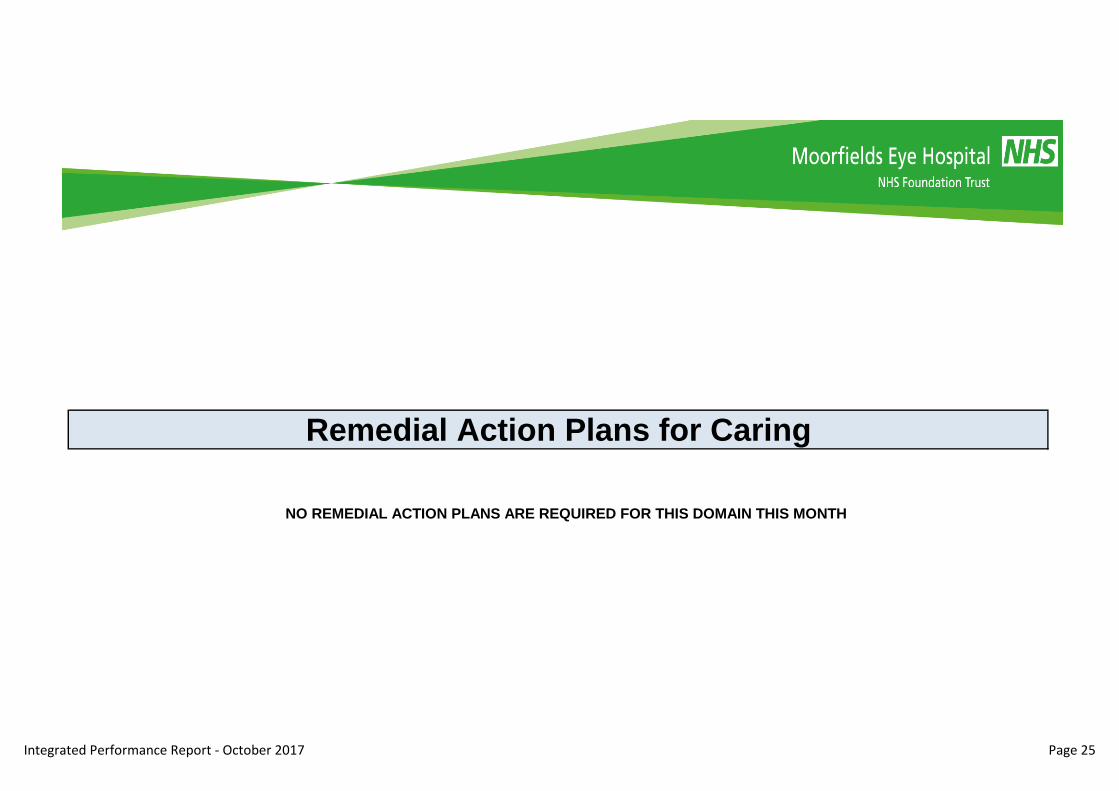
Remedial Action Plans for Caring
NO REMEDIAL ACTION PLANS ARE REQUIRED FOR THIS DOMAIN THIS MONTH
Integrated Performance Report - October 2017 Page 25
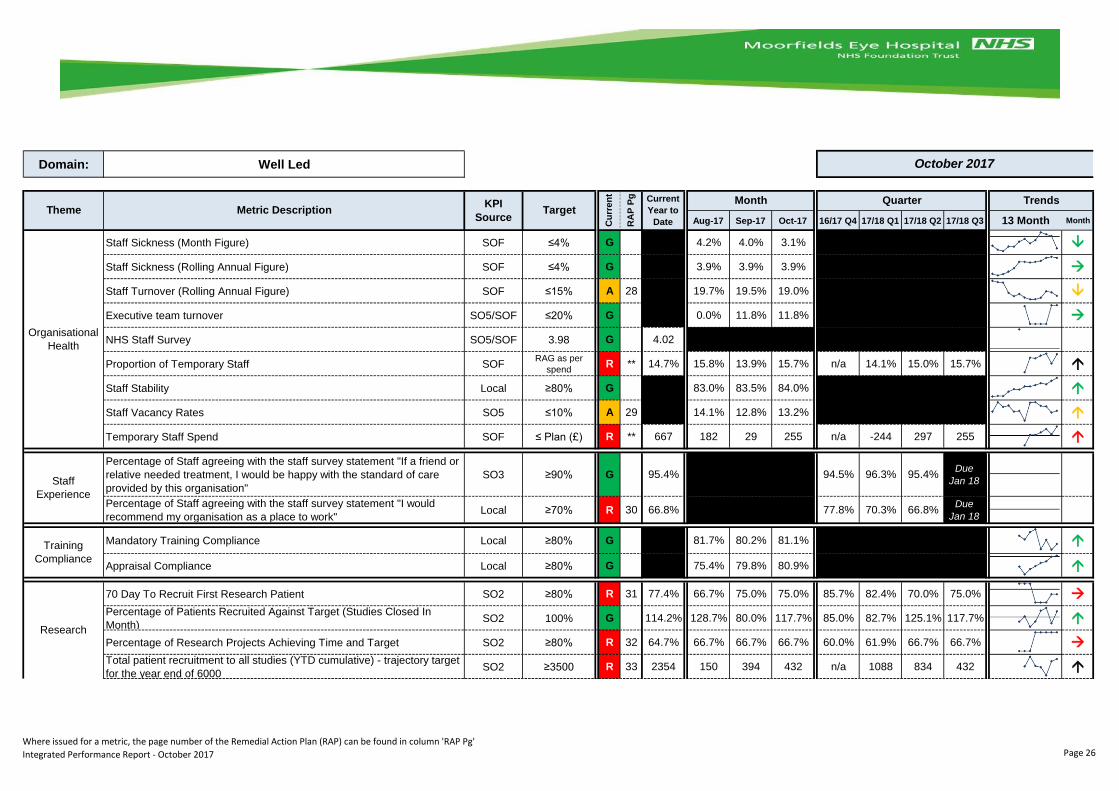
Domain: Well Led
Aug-17 Sep-17 Oct-17 16/17 Q4 17/18 Q1 17/18 Q2 17/18 Q3 13 Month Month
Staff Sickness (Month Figure) SOF ≤4% G 4.2% 4.0% 3.1%
Staff Sickness (Rolling Annual Figure) SOF ≤4% G 3.9% 3.9% 3.9%
Staff Turnover (Rolling Annual Figure) SOF ≤15% A 28 19.7% 19.5% 19.0%
Executive team turnover SO5/SOF ≤20% G 0.0% 11.8% 11.8%
NHS Staff Survey SO5/SOF 3.98 G 4.02
Proportion of Temporary Staff SOFRAG as per
spendR ** 14.7% 15.8% 13.9% 15.7% n/a 14.1% 15.0% 15.7%
Staff Stability Local ≥80% G 83.0% 83.5% 84.0%
Staff Vacancy Rates SO5 ≤10% A 29 14.1% 12.8% 13.2%
Temporary Staff Spend SOF ≤ Plan (£) R ** 667 182 29 255 n/a -244 297 255
Percentage of Staff agreeing with the staff survey statement "If a friend or
relative needed treatment, I would be happy with the standard of care
provided by this organisation"
SO3 ≥90% G 95.4% 94.5% 96.3% 95.4%Due
Jan 18
Percentage of Staff agreeing with the staff survey statement "I would
recommend my organisation as a place to work"Local ≥70% R 30 66.8% 77.8% 70.3% 66.8%
Due
Jan 18
Mandatory Training Compliance Local ≥80% G 81.7% 80.2% 81.1%
Appraisal Compliance Local ≥80% G 75.4% 79.8% 80.9%
70 Day To Recruit First Research Patient SO2 ≥80% R 31 77.4% 66.7% 75.0% 75.0% 85.7% 82.4% 70.0% 75.0%
Percentage of Patients Recruited Against Target (Studies Closed In
Month)SO2 100% G 114.2% 128.7% 80.0% 117.7% 85.0% 82.7% 125.1% 117.7%
Percentage of Research Projects Achieving Time and Target SO2 ≥80% R 32 64.7% 66.7% 66.7% 66.7% 60.0% 61.9% 66.7% 66.7%
Total patient recruitment to all studies (YTD cumulative) - trajectory target
for the year end of 6000SO2 ≥3500 R 33 2354 150 394 432 n/a 1088 834 432
Organisational
Health
Staff
Experience
Training
Compliance
Research
October 2017
Theme Metric DescriptionKPI
SourceTarget
Cu
rre
nt
RA
P P
g Current
Year to
Date
Month Quarter Trends
Where issued for a metric, the page number of the Remedial Action Plan (RAP) can be found in column 'RAP Pg'
Integrated Performance Report - October 2017 Page 26

Remedial Action Plans for Well Led
Integrated Performance Report - October 2017 Page 27
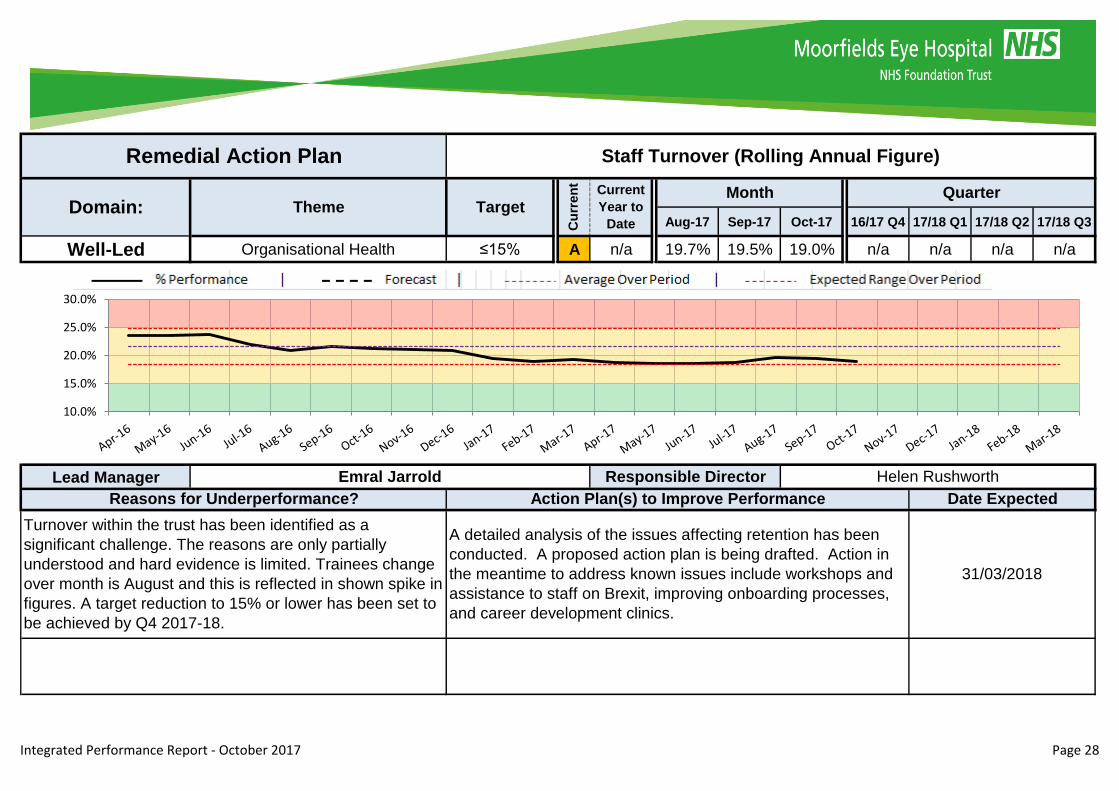
Aug-17 Sep-17 Oct-17 16/17 Q4 17/18 Q1 17/18 Q2 17/18 Q3
Well-Led Organisational Health ≤15% A n/a 19.7% 19.5% 19.0% n/a n/a n/a n/a
Lead Manager
Remedial Action Plan Staff Turnover (Rolling Annual Figure)
Domain: Theme Target
Cu
rren
t
Current
Year to
Date
Month Quarter
Emral Jarrold Responsible Director Helen Rushworth
Reasons for Underperformance? Action Plan(s) to Improve Performance Date Expected
Turnover within the trust has been identified as a
significant challenge. The reasons are only partially
understood and hard evidence is limited. Trainees change
over month is August and this is reflected in shown spike in
figures. A target reduction to 15% or lower has been set to
be achieved by Q4 2017-18.
A detailed analysis of the issues affecting retention has been
conducted. A proposed action plan is being drafted. Action in
the meantime to address known issues include workshops and
assistance to staff on Brexit, improving onboarding processes,
and career development clinics.
31/03/2018
10.0%
15.0%
20.0%
25.0%
30.0%
Integrated Performance Report - October 2017 Page 28
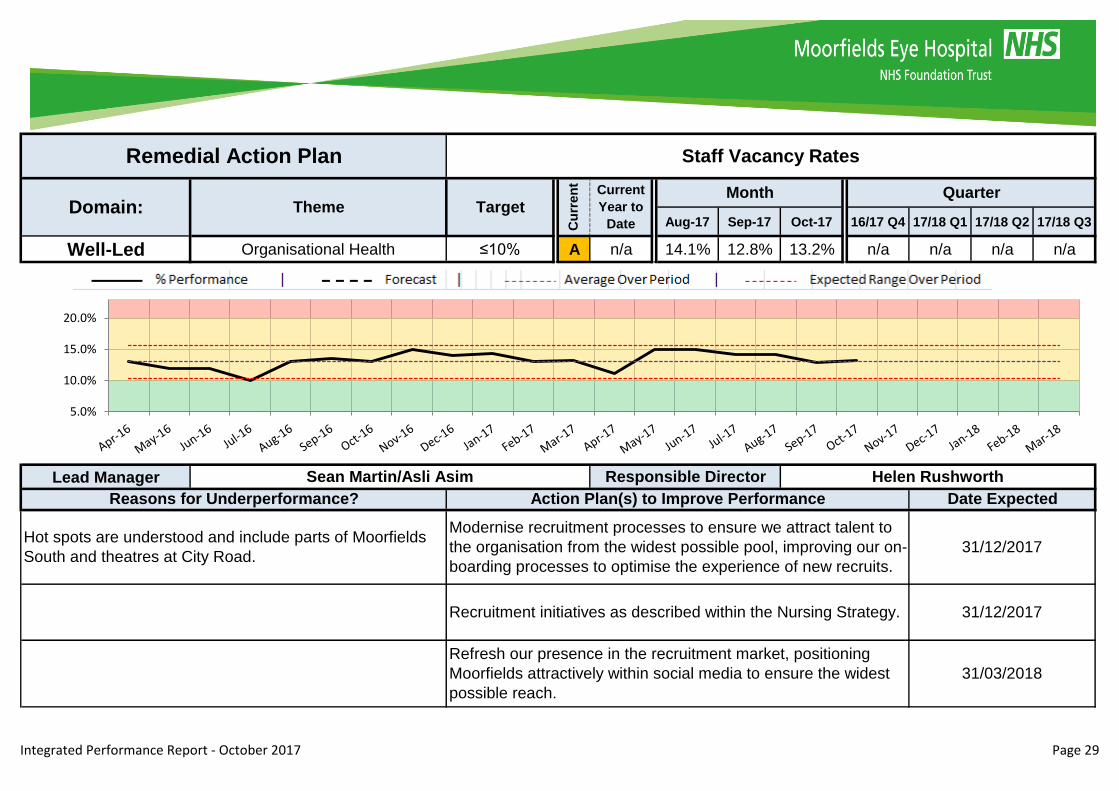
Aug-17 Sep-17 Oct-17 16/17 Q4 17/18 Q1 17/18 Q2 17/18 Q3
Well-Led Organisational Health ≤10% A n/a 14.1% 12.8% 13.2% n/a n/a n/a n/a
Lead Manager
Refresh our presence in the recruitment market, positioning
Moorfields attractively within social media to ensure the widest
possible reach.
31/03/2018
Hot spots are understood and include parts of Moorfields
South and theatres at City Road.
Modernise recruitment processes to ensure we attract talent to
the organisation from the widest possible pool, improving our on-
boarding processes to optimise the experience of new recruits.
31/12/2017
Recruitment initiatives as described within the Nursing Strategy. 31/12/2017
Sean Martin/Asli Asim Responsible Director Helen Rushworth
Reasons for Underperformance? Action Plan(s) to Improve Performance Date Expected
Remedial Action Plan Staff Vacancy Rates
Domain: Theme Target
Cu
rren
t
Current
Year to
Date
Month Quarter
5.0%
10.0%
15.0%
20.0%
Integrated Performance Report - October 2017 Page 29
Aug-17 Sep-17 Oct-17 16/17 Q4 17/18 Q1 17/18 Q2 17/18 Q3
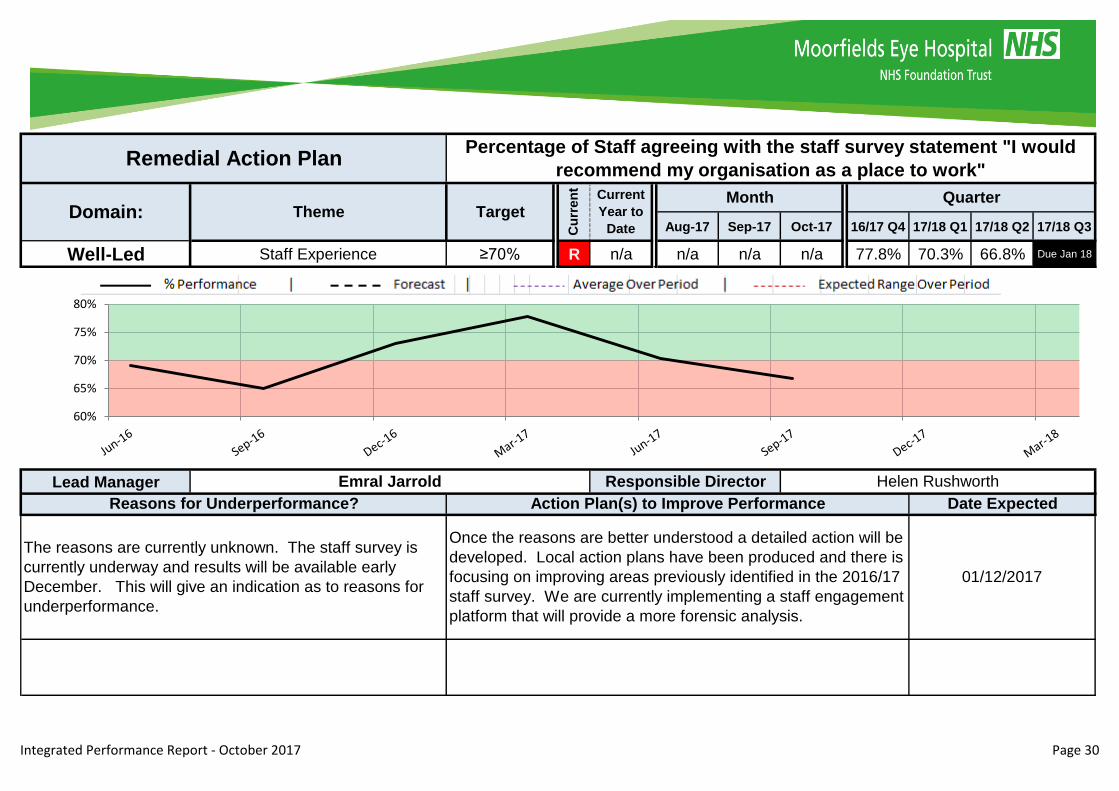
Well-Led Staff Experience ≥70% R n/a n/a n/a n/a 77.8% 70.3% 66.8% Due Jan 18
Lead Manager
Remedial Action PlanPercentage of Staff agreeing with the staff survey statement "I would
recommend my organisation as a place to work"
Domain: Theme Target
Cu
rren
t
Current
Year to
Date
Month Quarter
Emral Jarrold Responsible Director Helen Rushworth
Reasons for Underperformance? Action Plan(s) to Improve Performance Date Expected
The reasons are currently unknown. The staff survey is
currently underway and results will be available early
December. This will give an indication as to reasons for
underperformance.
Once the reasons are better understood a detailed action will be
developed. Local action plans have been produced and there is
focusing on improving areas previously identified in the 2016/17
staff survey. We are currently implementing a staff engagement
platform that will provide a more forensic analysis.
01/12/2017
60%
65%
70%
75%
80%
Integrated Performance Report - October 2017 Page 30

Aug-17 Sep-17 Oct-17 16/17 Q4 17/18 Q1 17/18 Q2 17/18 Q3
Well-Led Research ≥80% R 77.4% 66.7% 75.0% 75.0% 85.7% 82.4% 70.0% 75.0%
Lead Manager
Rare event where staff required for patient consent were
unavailable (sickness and annual leave) to recruit in time to
meet the benchmark.
Research and Development staff will ensure a greater number
of staff are available to consent patients during the benchmark
window, including drafting staff from other studies during this
time.
01/12/2017
Maria Hassard Responsible Director Peng Khaw
Reasons for Underperformance? Action Plan(s) to Improve Performance Date Expected
Remedial Action Plan 70 Day To Recruit First Research Patient
Domain: Theme Target
Cu
rren
t
Current
Year to
Date
Month Quarter
50%
60%
70%
80%
90%
100%
Integrated Performance Report - October 2017 Page 31

Aug-17 Sep-17 Oct-17 16/17 Q4 17/18 Q1 17/18 Q2 17/18 Q3
Well-Led Research ≥80% R 64.7% 66.7% 66.7% 66.7% 60.0% 61.9% 66.7% 66.7%
Lead Manager
1. Global project target met, closing the study early, before
the MEH had the opportunity to achieve its proportion of
that global target. 2. Study had very stringent eligibility
criteria which made the study difficult to recruit to and/or it
was a rare disease study with few eligible patients seen in
clinic to recruit in time.
Internal feasibility analysis will enable the setting of better
targets in difficult to recruit to studies. Negotiations with partners
will in future develop target ranges which will allows us to report
against both the lower and upper ends of that range. This will
cater for those occasions where we are opening as a site later
than most other international sites and avoid the risk of having
studies close early before we have been able to meet our
agreed target locally. We are also looking at predicted closure
dates 6 months in advance and engaging with sponsors early to
try to avoid this happening so often
01/12/2017
Maria Hassard Responsible Director Peng Khaw
Reasons for Underperformance? Action Plan(s) to Improve Performance Date Expected
Remedial Action Plan Percentage of Research Projects Achieving Time and Target
Domain: Theme Target
Cu
rren
t
Current
Year to
Date
Month Quarter
50%
60%
70%
80%
90%
Integrated Performance Report - October 2017 Page 32
Aug-17 Sep-17 Oct-17 16/17 Q4 17/18 Q1 17/18 Q2 17/18 Q3
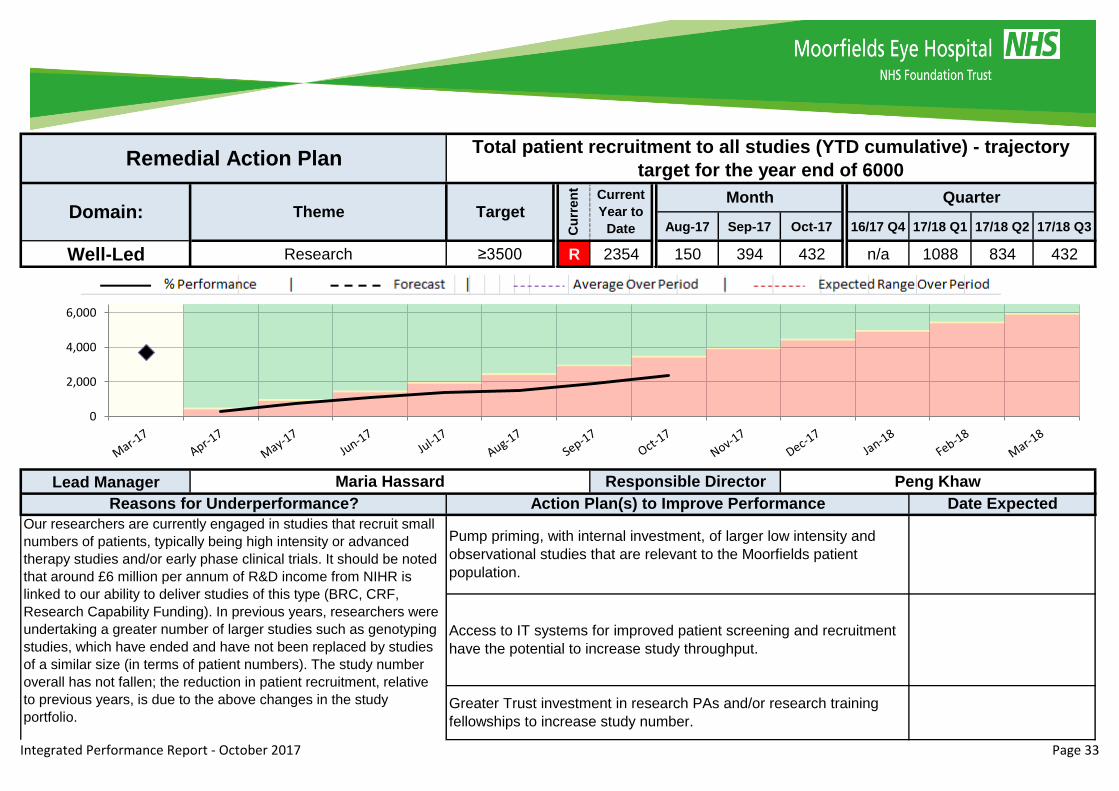
Well-Led Research ≥3500 R 2354 150 394 432 n/a 1088 834 432
Lead Manager
Our researchers are currently engaged in studies that recruit small
numbers of patients, typically being high intensity or advanced
therapy studies and/or early phase clinical trials. It should be noted
that around £6 million per annum of R&D income from NIHR is
linked to our ability to deliver studies of this type (BRC, CRF,
Research Capability Funding). In previous years, researchers were
undertaking a greater number of larger studies such as genotyping
studies, which have ended and have not been replaced by studies
of a similar size (in terms of patient numbers). The study number
overall has not fallen; the reduction in patient recruitment, relative
to previous years, is due to the above changes in the study
portfolio.
Pump priming, with internal investment, of larger low intensity and
observational studies that are relevant to the Moorfields patient
population.
Access to IT systems for improved patient screening and recruitment
have the potential to increase study throughput.
Greater Trust investment in research PAs and/or research training
fellowships to increase study number.
Maria Hassard Responsible Director Peng Khaw
Reasons for Underperformance? Action Plan(s) to Improve Performance Date Expected
Remedial Action PlanTotal patient recruitment to all studies (YTD cumulative) - trajectory
target for the year end of 6000
Domain: Theme Target
Cu
rren
t
Current
Year to
Date
Month Quarter
0
2,000
4,000
6,000
Integrated Performance Report - October 2017 Page 33
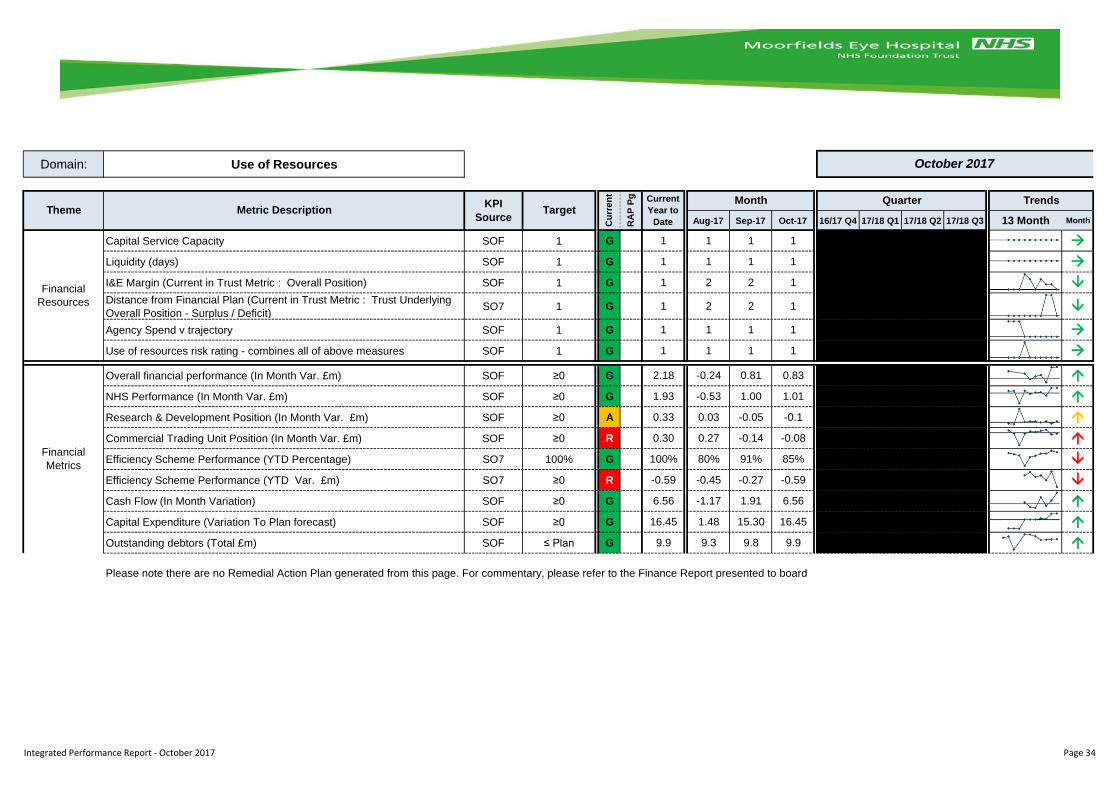
Domain: Use of Resources
Aug-17 Sep-17 Oct-17 16/17 Q4 17/18 Q1 17/18 Q2 17/18 Q3 13 Month Month
Capital Service Capacity SOF 1 G 1 1 1 1
Liquidity (days) SOF 1 G 1 1 1 1
I&E Margin (Current in Trust Metric : Overall Position) SOF 1 G 1 2 2 1
Distance from Financial Plan (Current in Trust Metric : Trust Underlying
Overall Position - Surplus / Deficit)SO7 1 G 1 2 2 1
Agency Spend v trajectory SOF 1 G 1 1 1 1
Use of resources risk rating - combines all of above measures SOF 1 G 1 1 1 1
Overall financial performance (In Month Var. £m) SOF ≥0 G 2.18 -0.24 0.81 0.83
NHS Performance (In Month Var. £m) SOF ≥0 G 1.93 -0.53 1.00 1.01
Research & Development Position (In Month Var. £m) SOF ≥0 A 0.33 0.03 -0.05 -0.1
Commercial Trading Unit Position (In Month Var. £m) SOF ≥0 R 0.30 0.27 -0.14 -0.08
Efficiency Scheme Performance (YTD Percentage) SO7 100% G 100% 80% 91% 85%
Efficiency Scheme Performance (YTD Var. £m) SO7 ≥0 R -0.59 -0.45 -0.27 -0.59
Cash Flow (In Month Variation) SOF ≥0 G 6.56 -1.17 1.91 6.56
Capital Expenditure (Variation To Plan forecast) SOF ≥0 G 16.45 1.48 15.30 16.45
Outstanding debtors (Total £m) SOF ≤ Plan G 9.9 9.3 9.8 9.9
Please note there are no Remedial Action Plan generated from this page. For commentary, please refer to the Finance Report presented to board
Financial
Resources
Financial
Metrics
October 2017
Theme Metric DescriptionKPI
SourceTarget
Cu
rre
nt
RA
P P
g Current
Year to
Date
Month Quarter Trends
Integrated Performance Report - October 2017 Page 34