1.7-µm Broadband Light Source and...
6
1.7-μm Broadband Light Source and Applications Jun Ono, Hiroshi Mori, Yoshiharu Shimose, Tetsuya Suzuki, Atsushi Yamada, Kazuaki Mise, Yasuaki Nagashima [Summary] The 1.7-μm band suffers little absorption loss from water molecules and can be used to evaluate the presence of organic solvents in aqueous solution from optical absorption peaks caused C-H bonds. 1), 2) We have worked in cooperation with Osaka Prefectural University to develop a 1.7-μm band ASE 3) light source composed of a Thulium (Tm 3+ ) doped fiber amplifier (TDFA) pumped by an Anritsu 1.2-μm LD module. This article explains the developed 1.7-μm band ASE light source with optical output improved by combination with a 1.65-μm band SLD module and describes the ap- plication of this light source in a system for evaluating the alcohol concentration of Japanese sake rice wine using a near infrared optical spectroscope system. (1) 1 Introduction The Anritsu Optical Devices Development Group has been focusing efforts on commercial development of a high-power 1.48-μm semiconductor laser diode (LD) for pumping an Erbium-Doped Fiber Amplifier (EDFA) with the requirement of expanding customers’ applications in the high-speed optical transmission market. Additionally, the following describes our active R&D into light-emitting ele- ments for the near-infrared spectrum with expected wide future applications in optical sensing. • Development of Distributed FeedBack Laser Diodes (DFB-LD) in the near-infrared wavelength region and examination of application fields • Development of long-wavelength Super Luminescent Di- odes (SLD) with excellent optical coupling to single mode fiber Near-infrared spectroscopic analysis using LDs is well known 4) and Anritsu has successfully developed a methane gas detector using a 1.65-μm band DFB-LD 5), 6) . The wave- length range from 1.7 to 1.8 μm has low optical absorption due to water molecules in the measurement environment and is generally known as an ‘optical window.’ In addition to gas measurements, it can also be used to measure the presence of organic materials dissolved in water in a clear glass container. We have successfully used a 1.2-μm Fiber Bragg Grating (FBG) LD module to pump a Thulium (Tm 3+ ) Doped Fiber Amplifier) (TDFA) and generate Amplified Spontaneous Emission (ASE) to measure the concentration of organic solvents such as isopropyl alcohol and dimethyl sulfoxide in solution as well as cholesterol solvents to validate the use- fulness of long-wavelength, broadband light sources 7) to 13) . However, increasing the measurement accuracy requires solving problems about increasing the output power. We have examined how to increase the optical power by com- bining the broad optical waveform and optical output of a 1.65-μm band SLD module with the above described broadband light source. This article introduces the structure and characteristics of a 1.7-μm broadband light source and also explains tests to evaluate the concentration of alcohol in Japanese sake rice wine by connecting the developed light source to a spectro- scopic evaluation system. 2 1.7-μm Broadband Light Source 2.1 Structure Figure 1 1.7-μm Broadband Light Source Figure 1 shows the structure of the 1.7-μm broadband light source. It is composed of an ASE light source using a TDFA and the 1.65-μm SLD module. The TDFA is composed of a Thulium (Tm 3+ ) doped fiber pumped by a 1.2-μm band LD module, a 1.2-μm/1.7-μm band WDM coupler, and an 94
Transcript of 1.7-µm Broadband Light Source and...
1.7-µm Broadband Light Source and Applications Jun Ono, Hiroshi Mori, Yoshiharu Shimose, Tetsuya Suzuki, Atsushi Yamada, Kazuaki Mise, Yasuaki Nagashima
[Summary] The 1.7-µm band suffers little absorption loss from water molecules and can be used to evaluate the presence of organic solvents in aqueous solution from optical absorption peaks caused C-H bonds.1), 2) We have worked in cooperation with Osaka Prefectural University to develop a 1.7-µm band ASE3) light source composed of a Thulium (Tm3+) doped fiber amplifier (TDFA) pumped by an Anritsu 1.2-µm LD module. This article explains the developed 1.7-µm band ASE light source with optical output improved by combination with a 1.65-µm band SLD module and describes the ap-plication of this light source in a system for evaluating the alcohol concentration of Japanese sake rice wine using a near infrared optical spectroscope system.
(1)
1 Introduction
The Anritsu Optical Devices Development Group has
been focusing efforts on commercial development of a
high-power 1.48-µm semiconductor laser diode (LD) for
pumping an Erbium-Doped Fiber Amplifier (EDFA) with
the requirement of expanding customers’ applications in the
high-speed optical transmission market. Additionally, the
following describes our active R&D into light-emitting ele-
ments for the near-infrared spectrum with expected wide
future applications in optical sensing.
• Development of Distributed FeedBack Laser Diodes
(DFB-LD) in the near-infrared wavelength region and
examination of application fields
• Development of long-wavelength Super Luminescent Di-
odes (SLD) with excellent optical coupling to single mode
fiber
Near-infrared spectroscopic analysis using LDs is well
known4) and Anritsu has successfully developed a methane
gas detector using a 1.65-µm band DFB-LD5), 6). The wave-
length range from 1.7 to 1.8 µm has low optical absorption
due to water molecules in the measurement environment
and is generally known as an ‘optical window.’ In addition to
gas measurements, it can also be used to measure the
presence of organic materials dissolved in water in a clear
glass container.
We have successfully used a 1.2-µm Fiber Bragg Grating
(FBG) LD module to pump a Thulium (Tm3+) Doped Fiber
Amplifier) (TDFA) and generate Amplified Spontaneous
Emission (ASE) to measure the concentration of organic
solvents such as isopropyl alcohol and dimethyl sulfoxide in
solution as well as cholesterol solvents to validate the use-
fulness of long-wavelength, broadband light sources7) to 13).
However, increasing the measurement accuracy requires
solving problems about increasing the output power. We
have examined how to increase the optical power by com-
bining the broad optical waveform and optical output of a
1.65-µm band SLD module with the above described
broadband light source.
This article introduces the structure and characteristics
of a 1.7-µm broadband light source and also explains tests to
evaluate the concentration of alcohol in Japanese sake rice
wine by connecting the developed light source to a spectro-
scopic evaluation system.
2 1.7-μm Broadband Light Source
2.1 Structure
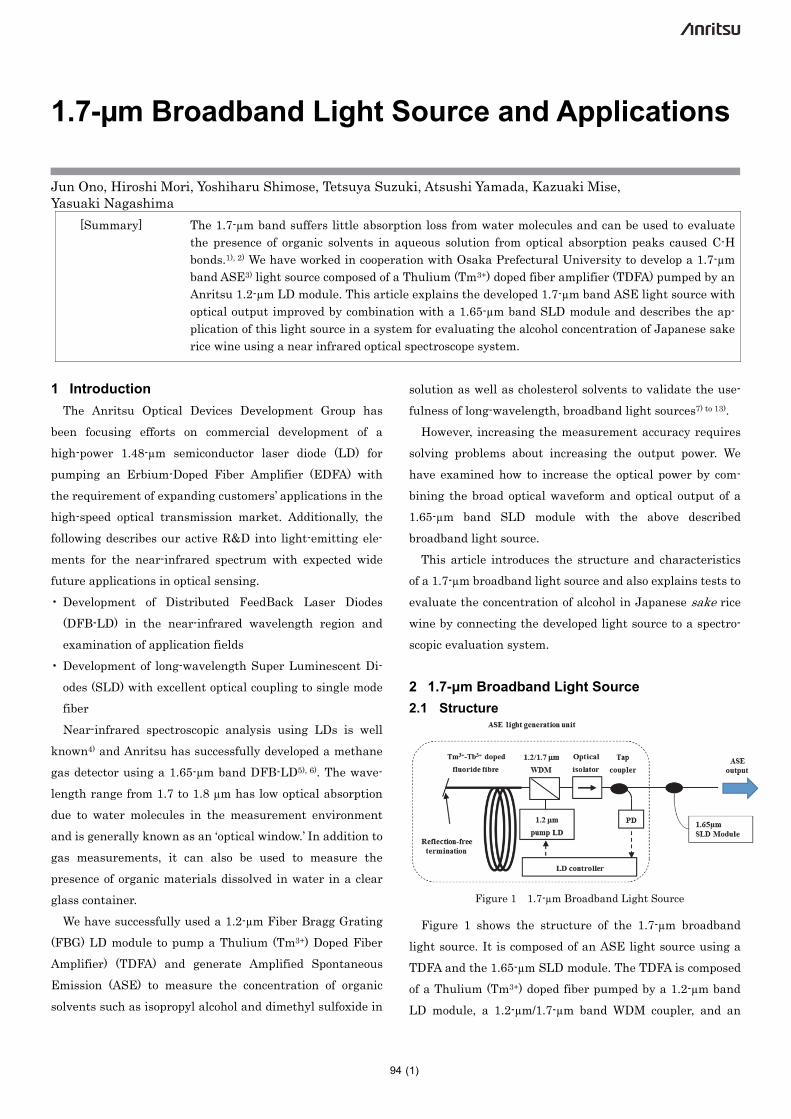
Figure 1 1.7-µm Broadband Light Source
Figure 1 shows the structure of the 1.7-µm broadband
light source. It is composed of an ASE light source using a
TDFA and the 1.65-µm SLD module. The TDFA is composed
of a Thulium (Tm3+) doped fiber pumped by a 1.2-µm band
LD module, a 1.2-µm/1.7-µm band WDM coupler, and an
94
Anritsu Technical Review No.24 September 2016 1.7-µm Broadband Light Source and Applications
(2)
optical isolator. The thallium-doped fiber relative refractive
index difference, cutoff frequency, Tm3+ doping concentra-
tion, and fiber length are 1.6%,1 µm, 6000 ppm,and 1 m,
respectively.
2.2 1.2-µm Pump LD Module
Like the 1.65-µm SLD module described later, the 1.2-µm
band pump LD module uses a 14-pin butterfly package. The
details of the structure are described in the next section.
The Far-Field pattern (FFP) LD element is oriented at 20°
to the horizontal and vertical axes; the beam form is nearly
circular. In addition, an aspherical lens is used to achieve
and an optical fiber coupling efficiency of 80%. The LD ele-
ment is held at a constant 25°C reference operating tem-
perature using a thermistor and Thermo Electric Cooler
(TEC). In addition, a photodiode for monitoring the LD
output is positioned at the rear of the LD.
A FBG matching the lasing wavelength is used to connect
the single-mode fiber (optical fiber hereafter) to this module.
An anti-reflection (AR) coating on the output facet sup-
presses reflections to form an external laser oscillating
resonator between the FBG and LD. The oscillation wave-
length is fixed to 1.24 µm in the operating range and the
optical output can be varied at this wavelength. The max-
imum fiber output power of 120 mW was obtained.
2.3 1.65-µm SLD Module
Figure 2 shows the external appearance of the 1.65-µm
SLD module. Like the 1.2-µm LD module, it uses a 14-pin
butterfly package filled with dry nitrogen gas and is seam
welded to assure stable element operation.13)
Figure 2 1.65-µm SLD Module External Appearance
The module reliability is in accordance with the Telcordia
GR468-CORE standard.
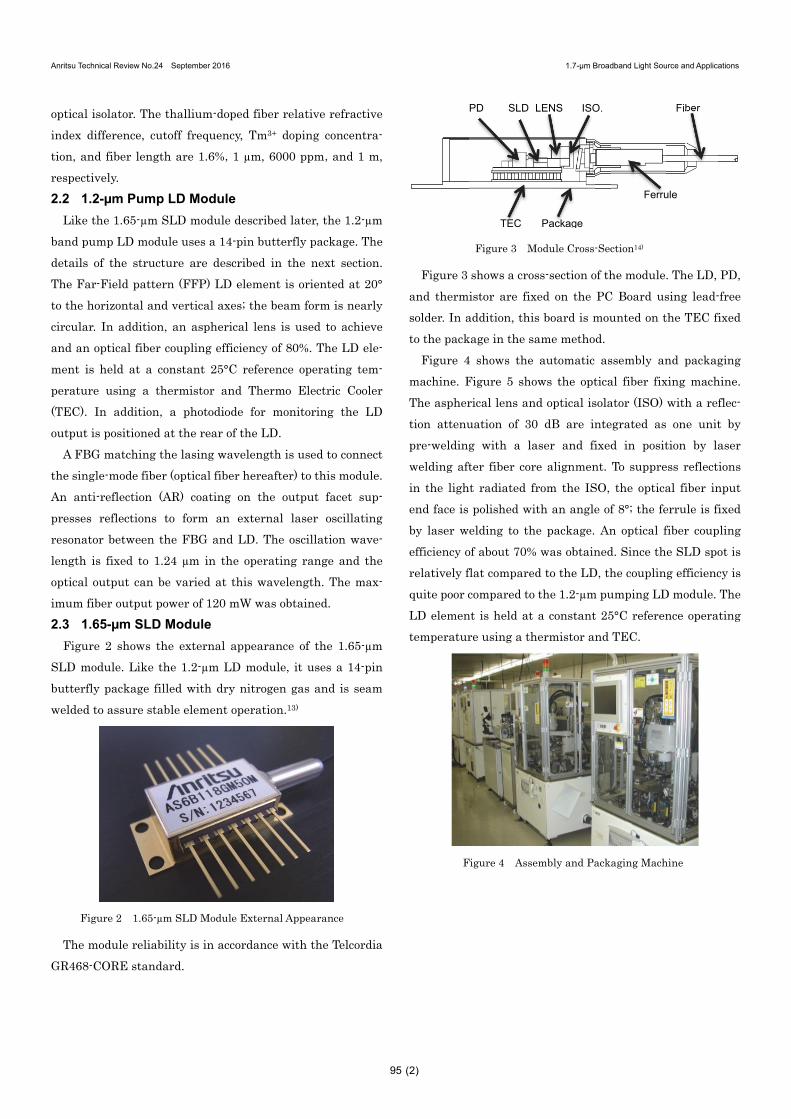
Figure 3 Module Cross-Section14)
Figure 3 shows a cross-section of the module. The LD, PD,
and thermistor are fixed on the PC Board using lead-free
solder. In addition, this board is mounted on the TEC fixed
to the package in the same method.
Figure 4 shows the automatic assembly and packaging
machine. Figure 5 shows the optical fiber fixing machine.
The aspherical lens and optical isolator (ISO) with a reflec-
tion attenuation of 30 dB are integrated as one unit by
pre-welding with a laser and fixed in position by laser
welding after fiber core alignment. To suppress reflections
in the light radiated from the ISO, the optical fiber input
end face is polished with an angle of 8°; the ferrule is fixed
by laser welding to the package. An optical fiber coupling
efficiency of about 70% was obtained. Since the SLD spot is
relatively flat compared to the LD, the coupling efficiency is
quite poor compared to the 1.2-µm pumping LD module. The
LD element is held at a constant 25°C reference operating
temperature using a thermistor and TEC.
Figure 4 Assembly and Packaging Machine
PD LENS SLD ISO.
Ferrule
TEC Package
Fiber
95
Anritsu Technical Review No.24 September 2016 1.7-µm Broadband Light Source and Applications
(3)
Figure 5 Optical Fiber Splicing Machine
2.4 SLD Chip Structure
Figure 6 shows an image of the long-wavelength band (1.3
to 1.65 µm) SLD waveguide structure. The substrate is
n-InP with an InGaAs/InGaAsP MultiQuantum Well
(MQW) structure.14)
Figure 6 SLD Waveguide Image15)
The active layer is horizontally flared at the output (front
in above figure). The waveguide uses a crossover angled
structure angled at about 8° to facet formed by the cleavage.
Although the end face is AR-coated to achieve a reflection
rate of 0.1%, this is insufficient from the low-reflectance
standpoint. Consequently, as well as angling the waveguide
so reflected light does not return to it, the flared structure is
used to strengthen this effect by expanding the size of the
spot in the waveguide optical horizontal plane.
In addition, reflections at the back face degrade the
measurement accuracy by causing spectrum ripple. Conse-
quently, a window region with no waveguide structure was
formed between the waveguide face and the back face. Since
light radiated from the waveguide face reaches facet while
being dispersed by the internal crystal structure of the
window region, the effect of reflections from facet is greatly
suppressed.
Moreover, the element length and window region length
must be optimized for the required characteristics. To
achieve high output, the 1.65-µm SLD chip used in this
work was fabricated with a 5-layer quantum well structure.
However, since strengthening the optical confinement effect
at the active layer simultaneously causes problems with
increased ripple, this SLD element features a longer win-
dow region of 500 µm relative to the element length.
3 Output Characteristics
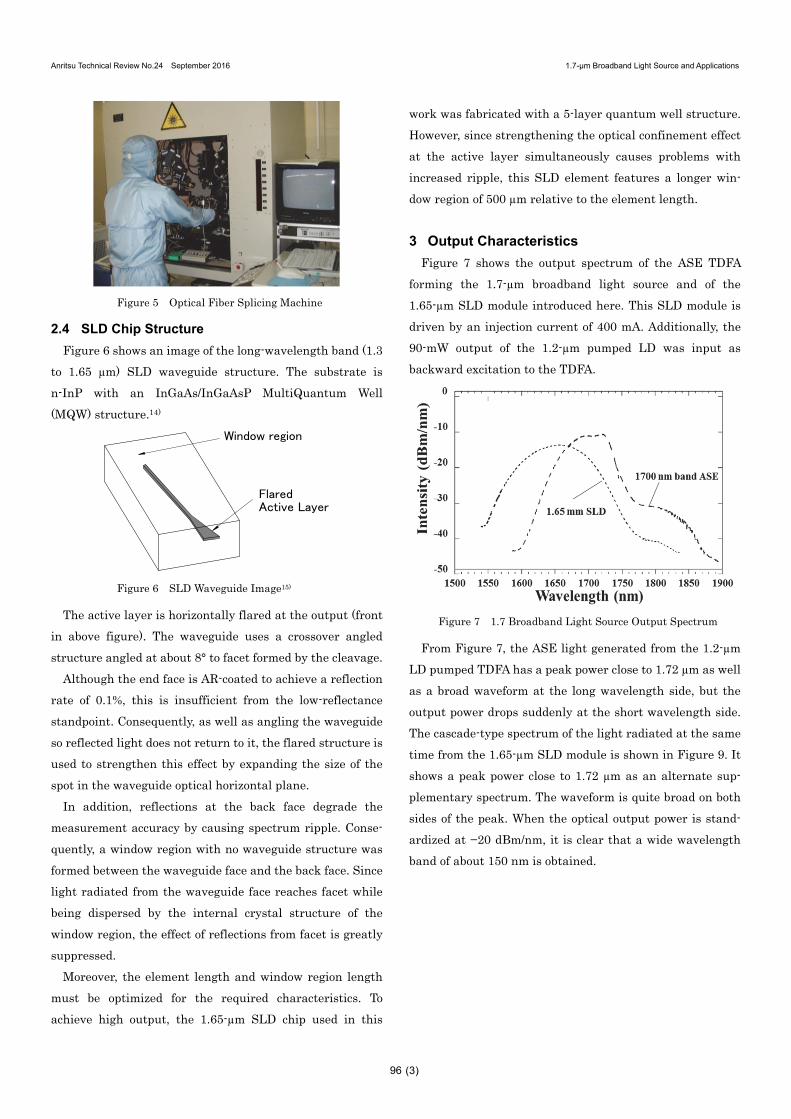
Figure 7 shows the output spectrum of the ASE TDFA
forming the 1.7-µm broadband light source and of the
1.65-µm SLD module introduced here. This SLD module is
driven by an injection current of 400 mA. Additionally, the
90-mW output of the 1.2-µm pumped LD was input as
backward excitation to the TDFA.
Figure 7 1.7 Broadband Light Source Output Spectrum
From Figure 7, the ASE light generated from the 1.2-µm
LD pumped TDFA has a peak power close to 1.72 µm as well
as a broad waveform at the long wavelength side, but the
output power drops suddenly at the short wavelength side.
The cascade-type spectrum of the light radiated at the same
time from the 1.65-µm SLD module is shown in Figure 9. It
shows a peak power close to 1.72 µm as an alternate sup-
plementary spectrum. The waveform is quite broad on both
sides of the peak. When the optical output power is stand-
ardized at −20 dBm/nm, it is clear that a wide wavelength
band of about 150 nm is obtained.
Window region
FlaredActive Layer
96
Anritsu Technical Review No.24 September 2016 1.7-µm Broadband Light Source and Applications
(4)
4 Spectrum Evaluation System
Figure 8 Spectrum Evaluation System
The optical spectroscope system is shown in Figure 8. It is
composed of a glass cell for the test material (5 mm spec-
trum analysis of optical wavelength) positioned between fi-
ber collimators (approx. 5-mm beam diameter and approx.
70% coupling efficiency) and an optical spectrum analyzer
(adjustable measurement wavelength range of 1.2 to 2 µm).
Figure 9 Glass Cell Transmission Spectrum
Figure 9 shows the transmission spectrum of the glass
cell in the optical spectroscope system. When the glass cell
between the optical collimators is filled with ultra-pure
water, the spectrum power is degraded by about 20 dB/nm
but the shape of the spectrum remains broadly the same as
that of the light source.
5 Rice Wine Alcohol Concentration Evaluation
5.1 Calibration Curves
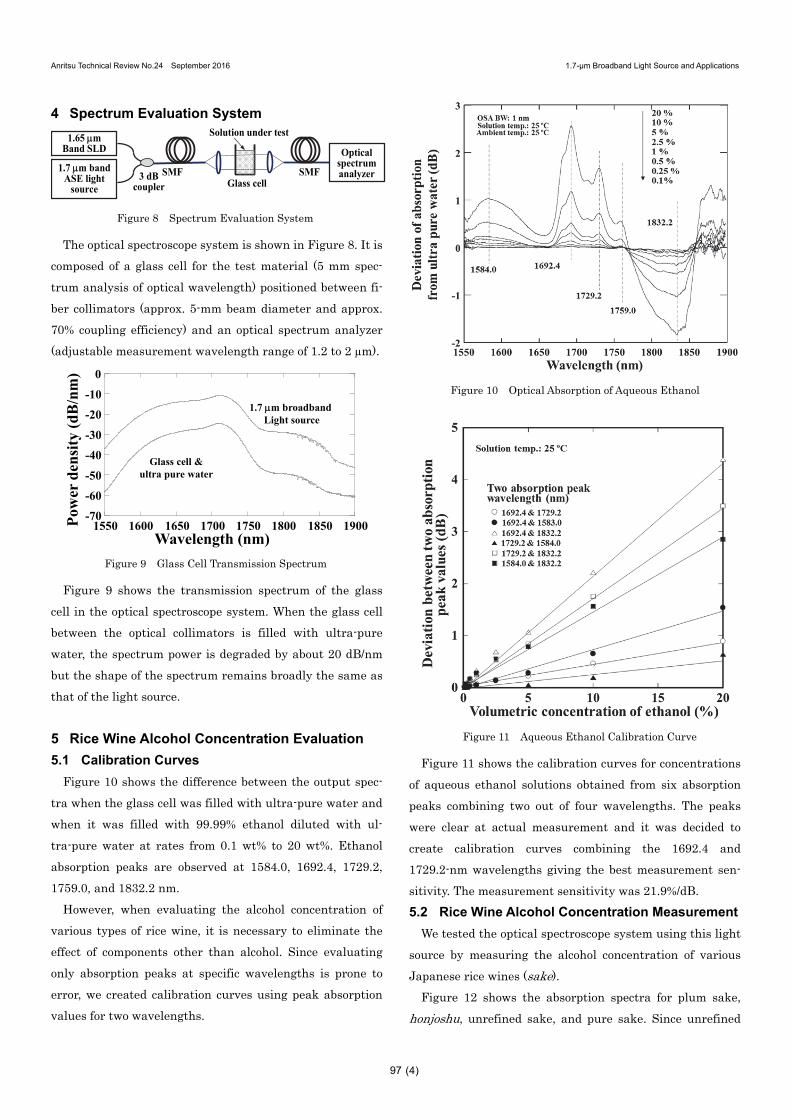
Figure 10 shows the difference between the output spec-
tra when the glass cell was filled with ultra-pure water and
when it was filled with 99.99% ethanol diluted with ul-
tra-pure water at rates from 0.1 wt% to 20 wt%. Ethanol
absorption peaks are observed at 1584.0, 1692.4, 1729.2,
1759.0, and 1832.2 nm.
However, when evaluating the alcohol concentration of
various types of rice wine, it is necessary to eliminate the
effect of components other than alcohol. Since evaluating
only absorption peaks at specific wavelengths is prone to
error, we created calibration curves using peak absorption
values for two wavelengths.
Figure 10 Optical Absorption of Aqueous Ethanol
Figure 11 Aqueous Ethanol Calibration Curve
Figure 11 shows the calibration curves for concentrations
of aqueous ethanol solutions obtained from six absorption
peaks combining two out of four wavelengths. The peaks
were clear at actual measurement and it was decided to
create calibration curves combining the 1692.4 and
1729.2-nm wavelengths giving the best measurement sen-
sitivity. The measurement sensitivity was 21.9%/dB.
5.2 Rice Wine Alcohol Concentration Measurement
We tested the optical spectroscope system using this light
source by measuring the alcohol concentration of various
Japanese rice wines (sake).
Figure 12 shows the absorption spectra for plum sake,
honjoshu, unrefined sake, and pure sake. Since unrefined
3 dBcoupler
1.65 m Band SLD
1.7 m bandASE light
source Glass cell
Solution under test
SMF SMF
Opticalspectrumanalyzer
-70
-60
-50
-40
-30
-20
-10
0
1550 1600 1650 1700 1750 1800 1850 1900Pow
er d
ensi
ty(d
B/n
m)
Wavelength (nm)
1.7 m broadbandLight source
Glass cell &ultra pure water
97
Anritsu Technical Review No.24 September 2016 1.7-µm Broadband Light Source and Applications
(5)
sake has low transmissivity, the optical power of the system
was insufficient and centrifuging was required first.
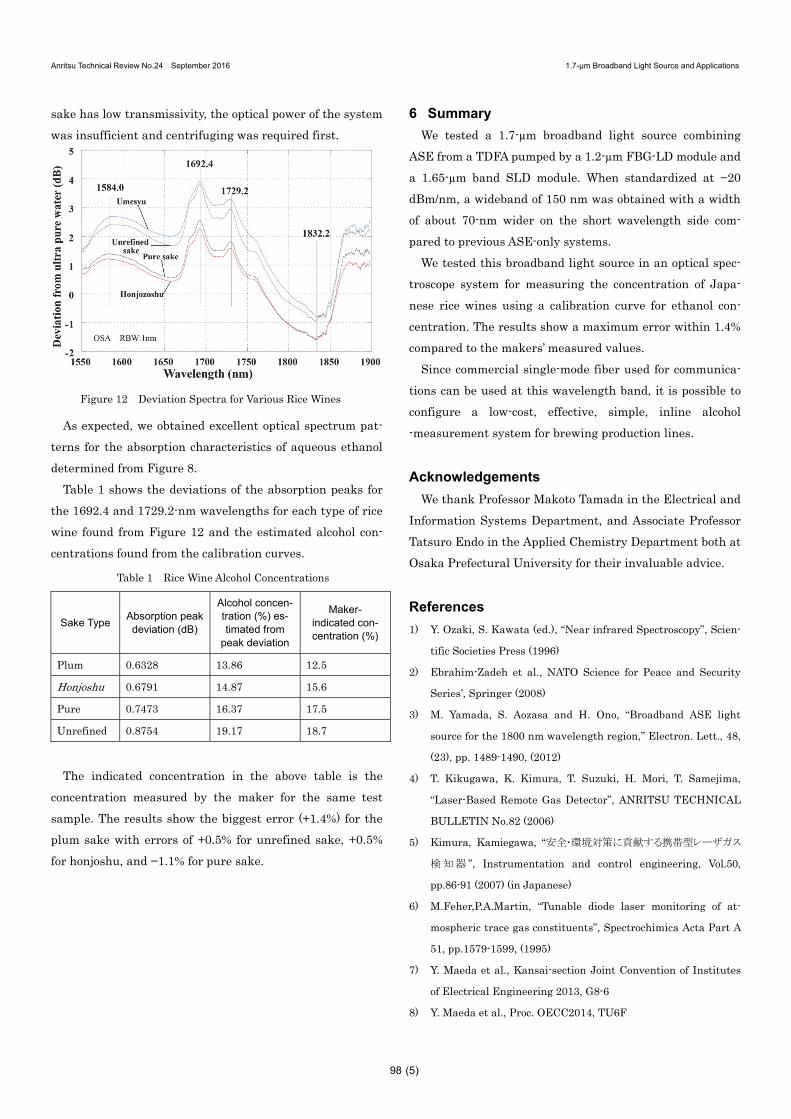
Figure 12 Deviation Spectra for Various Rice Wines
As expected, we obtained excellent optical spectrum pat-
terns for the absorption characteristics of aqueous ethanol
determined from Figure 8.
Table 1 shows the deviations of the absorption peaks for
the 1692.4 and 1729.2-nm wavelengths for each type of rice
wine found from Figure 12 and the estimated alcohol con-
centrations found from the calibration curves.
Table 1 Rice Wine Alcohol Concentrations
Sake Type Absorption peak deviation (dB)
Alcohol concen-tration (%) es-timated from
peak deviation
Maker- indicated con-centration (%)
Plum 0.6328 13.86 12.5
Honjoshu 0.6791 14.87 15.6
Pure 0.7473 16.37 17.5
Unrefined 0.8754 19.17 18.7
The indicated concentration in the above table is the
concentration measured by the maker for the same test
sample. The results show the biggest error (+1.4%) for the
plum sake with errors of +0.5% for unrefined sake, +0.5%
for honjoshu, and −1.1% for pure sake.
6 Summary
We tested a 1.7-µm broadband light source combining
ASE from a TDFA pumped by a 1.2-µm FBG-LD module and
a 1.65-µm band SLD module. When standardized at −20
dBm/nm, a wideband of 150 nm was obtained with a width
of about 70-nm wider on the short wavelength side com-
pared to previous ASE-only systems.
We tested this broadband light source in an optical spec-
troscope system for measuring the concentration of Japa-
nese rice wines using a calibration curve for ethanol con-
centration. The results show a maximum error within 1.4%
compared to the makers’ measured values.
Since commercial single-mode fiber used for communica-
tions can be used at this wavelength band, it is possible to
configure a low-cost, effective, simple, inline alcohol
-measurement system for brewing production lines.
Acknowledgements
We thank Professor Makoto Tamada in the Electrical and
Information Systems Department, and Associate Professor
Tatsuro Endo in the Applied Chemistry Department both at
Osaka Prefectural University for their invaluable advice.
References
1) Y. Ozaki, S. Kawata (ed.), “Near infrared Spectroscopy”, Scien-
tific Societies Press (1996)
2) Ebrahim-Zadeh et al., NATO Science for Peace and Security
Series’, Springer (2008)
3) M. Yamada, S. Aozasa and H. Ono, “Broadband ASE light
source for the 1800 nm wavelength region,” Electron. Lett., 48,
(23), pp. 1489-1490, (2012)
4) T. Kikugawa, K. Kimura, T. Suzuki, H. Mori, T. Samejima,
“Laser-Based Remote Gas Detector”, ANRITSU TECHNICAL
BULLETIN No.82 (2006)
5) Kimura, Kamiegawa, “安全・環境対策に貢献する携帯型レーザガス
検知器 ”, Instrumentation and control engineering, Vol.50,
pp.86-91 (2007) (in Japanese)
6) M.Feher,P.A.Martin, “Tunable diode laser monitoring of at-
mospheric trace gas constituents”, Spectrochimica Acta Part A
51, pp.1579-1599, (1995)
7) Y. Maeda et al., Kansai-section Joint Convention of Institutes
of Electrical Engineering 2013, G8-6
8) Y. Maeda et al., Proc. OECC2014, TU6F
98

Anritsu Technical Review No.24 September 2016 1.7-µm Broadband Light Source and Applications
(6)
9) Y. Maeda, M. Yamada, T. Endo, K. Ohta, T. Tanaka, M. Ono, K.
Senda, J. Ono and O. Koyama, “1700 nm ASE Light Source and
its Application to Mid-Infrared Spectroscopy,” Proc. OECC,
paper TU6F, Melbourne, Australia, (2014)
10) M. Yamada, K. Senda, T. Tanaka, Y. Maeda, S. Aozasa, H.
Ono, K. Ota, O. Koyama and J. Ono, “Tm3+-Tb3+-doped
tunable fibre ring laser for the 1700 nm wavelength region,”
Electron. Lett., 49, (20), pp. 1287-1288, (2013)
11) M. Yamada, J. Ono, K. Mise, Y. Shimose, H. Mori, A. Yamada, K.
Ota, K. Senda, Y. Maeda, O. Koyama and H. Ono, “1.8 μm
broadband light source using a super luminescent diode,”
Electron. Lett., 50, (20), pp. 1468-1470, (2014)
12) J.Ono, T.Endo, K.Ohta, H.Ono, Y.Maeda, K.Senda, O.Koyama
and M.Yamada, “Broadband Light Source and Its Application
to Near-Infrared Spectroscopy”, Sensors and Materials, Voi.27,
No.5, pp413-423, (2015)
13) Omori, Samejima, Kanaya, Mise, Ono, Nakano, “広帯域インコ
ヒーレント光源モジュール”, IEICE General Conference 2003,
C-3-12 (2003) (in Japanese)
14) Yamada, Yoshida, Fujita, Morimoto, Omatsu, “斜め窓構造を用い
た 1.3 µmスーパールミネッセントダイオード”, IEICE Transactions C,
J97-C(8), pp.308-316, (2014) (in Japanese)
Authors
Jun Ono Marketing Dept. Anritsu Devices Co., Ltd.
Hiroshi Mori Optical Device Development Dept.Device Development Center
Yoshiharu Shimose Optical Device Development Dept.Device Development Center
Tetsuya Suzuki Optical Device Development Dept.Device Development Center
Atsushi Yamada Optical Device Development Dept.Device Development Center
Kazuaki Mise Optical Device Development Dept.Device Development Center
Yasuaki Nagashima Optical Device Development Dept.Device Development Center
Publicly available
99