16 Marzo 2010WG1&WG2 Meeting - CIC Salamanca 1 Proteored Multilab Experiment 5 QUANTITATIVE...
25
16 Marzo 2010 WG1&WG2 Meeting - CIC Salamanca 1 Proteored Multilab Experiment 5 QUANTITATIVE PROTEOMICS 4 proteins spiked in E. coli protein matrix Progenesis LC-MS assisted label-free analysis
-
Upload
dominic-griffin -
Category
Documents
-
view
214 -
download
0
Transcript of 16 Marzo 2010WG1&WG2 Meeting - CIC Salamanca 1 Proteored Multilab Experiment 5 QUANTITATIVE...

16 Marzo 2010 WG1&WG2 Meeting - CIC Salamanca
1
Proteored Multilab Experiment 5QUANTITATIVE PROTEOMICS
4 proteins spiked in E. coli protein matrix
Progenesis LC-MS assisted label-free analysis
Labs Reporting Data
• Universidad de Alicante (Qual-Quant)
• Hospital Universitario Instituto de Oncologia Vall d’Hebron (Qual-Quant)
• Centro de Biología Molecular “Severo Ochoa” (Qual: 72 Ecoli + 2 spiked)
16 Marzo 2010 WG1&WG2 Meeting - CIC Salamanca
2

16 Marzo 2010 WG1&WG2 Meeting - CIC Salamanca
3
APPROACHLAB1-LAB2
• Sample processing and Data acquisition– Liquid digestion (iodoacetamide, trypsin)– nLC-nESI-IT– 5 - 4 runs of sample A, 4 runs of sample B
• Label-free analysis with Progenesis LC-MS– LC-MS plot alignment– Whole-feature selection – feature abundance >1E+06– Mascot search (2mclv, Ox(M), Deam(QN), 1.2Da –
1.4 Da parent, 0.6Da – 0.7 Da fragment)– Peptide match validation: score > 25, matching E. coli
or spiked protein

16 Marzo 2010 WG1&WG2 Meeting - CIC Salamanca
4
Reference LC-MS run selection

16 Marzo 2010 WG1&WG2 Meeting - CIC Salamanca
5
LC-MS runs alignment

16 Marzo 2010 WG1&WG2 Meeting - CIC Salamanca
6
Feature filtering

16 Marzo 2010 WG1&WG2 Meeting - CIC Salamanca
7
Stats-based feature selection

16 Marzo 2010 WG1&WG2 Meeting - CIC Salamanca
8
Selected feature stats

16 Marzo 2010 WG1&WG2 Meeting - CIC Salamanca
9
Peptide search: mgf export, xml import

16 Marzo 2010 WG1&WG2 Meeting - CIC Salamanca
10
Peptide filtering

16 Marzo 2010 WG1&WG2 Meeting - CIC Salamanca
11
Protein view - conflict resolution

16 Marzo 2010 WG1&WG2 Meeting - CIC Salamanca
12
Report configuration

16 Marzo 2010 WG1&WG2 Meeting - CIC Salamanca
13
Web report

16 Marzo 2010 WG1&WG2 Meeting - CIC Salamanca
14
0.00
0.20
0.40
0.60
0.80
1.00
1.20
1 peptide 2 peptides 1&2peptides
3-7 peptides >7 peptides
aver
age
A/B
avg ratio
Average and %CV of A/B ratios of groups of E. coli proteins identified-quantified with only…
0.00
0.20
0.40
0.60
0.80
1.00
1.20
1 peptide 2 peptides 1&2peptides
3-7 peptides >7 peptides
aver
age
A/B
avg ratio
0
10
20
30
40
50
60
70
80
1 peptide 2 peptides 1&2 peptides 3-7 peptides >7 peptides
aver
age
A/B
%cv
0
10
20
30
40
50
60
70
80
1 peptide 2 peptides 1&2 peptides 3-7 peptides >7 peptides
%C
V o
f A
/B
%cv
0.00
0.20
0.40
0.60
0.80
1.00
1.20
1 peptide 2 peptides 1&2peptides
3-7peptides
>7peptides
aver
age
A/B
lab2
lab1
0
10
20
30
40
50
60
70
80
1 peptide 2 peptides 1&2peptides
3-7peptides
>7peptides
aver
age
A/B
lab2
lab1

16 Marzo 2010 WG1&WG2 Meeting - CIC Salamanca
15
Deviation of average abundance LAB1
0
20
40
60
80
100
120
140
160
0 1 2 3 4 5 6 7 8 9 10 11 12 13 14 15
PEPTIDES USED FOR ID-QUANT
PME5A
PME5B
spiked A
spiked B
ALDOA MYG CYC
25fm 200fm 1000fm

16 Marzo 2010 WG1&WG2 Meeting - CIC Salamanca
16
Deviation of average abundance LAB2
0
10
20
30
40
50
60
70
0 2 4 6 8 10 12
PEPTIDES USED FOR ID-QUANT
%C
V
PME5A
PME5B
SPIKED A
SPIKED B
ALDOA BSA/MYG CYC
25fm 1fm/200fm 1000fm

16 Marzo 2010 WG1&WG2 Meeting - CIC Salamanca
17
PROTEINS IDENTIFIED WITH AT LEAST 1 PEPTIDE
17
78
50
only LAB1
only LAB2
LAB1 & LAB2
0
5
10
15
20
25
30
35
P ROTEIN Nº
LAB2 LAB1

16 Marzo 2010 WG1&WG2 Meeting - CIC Salamanca
18
PROTEINS IDENTIFIED WITH AT LEAST 2 PEPTIDES IN ONE LAB
9
17
46
only LAB1
only LAB2
LAB1 & LAB2
0
5
10
15
20
25
30
35
PROTEIN Nº
LAB2 LAB1

16 Marzo 2010 WG1&WG2 Meeting - CIC Salamanca
19
Proteins stats LAB1
-1-0.8-0.6-0.4-0.2
00.20.40.60.8
1
0 2 4 6 8 10
UNIQUE PEPTIDES USED AT LEAST
AV
ER
AG
E R
AT
IO (
log
2)
0
10
20
30
40
50
0 1 2 3 4 5 6 7 8 9 10
UNIQUE PEPTIDES USED AT LEAST
%C
V O
F A
VE
RA
GE
RA
TIO
Number of E Coli proteins id. (total) 67
Number of E Coli single hit- proteins id 14
Number of Spiked proteins id. 3
0
10
20
30
40
50
60
70
80
0 1 2 3 4 5 6 7 8 9 10
UNIQUE PEPTIDES USED AT LEAST
#PR
OT
EIN
S I
D-Q
UA
NT
ALDOA MYG CYC
25fm 200fm 1000fm
AccessionPeptide count
Confidence score
Anova (p)* A/Bdtn - prep
CYC_HORSE 7 287.88 0.0053064 0.6 – 0.67
MYG_EQUBU 4 236.17 0.00068157 5.5 – 2.6
ALDOA_RABIT 3 152.12 0.00028094 3.8 – 2.0
BSA_BOVINK2C1_HUMAN
-4
NOT192.23
FOUND0.26933846 1.4

16 Marzo 2010 WG1&WG2 Meeting - CIC Salamanca
200
20
40
60
80
100
120
140
0 2 4 6 8 10
UNIQUE PEPTIDES USED AT LEAST
#PR
OT
EIN
S I
D-Q
UA
NT
Proteins stats LAB2Number of E Coli proteins id. (total) 128
Number of E Coli single hit- proteins id 74
Number of Spiked proteins id. 4
AccessionPeptide count
Confidence score
Anova (p)* A/Bdtn - prep
CYC_HORSE 5 285.88 0.0000067 0.57 – 0.67
MYG_EQUBU 3 244.41 0.00010617 2.18 – 2.6
ALDOA_RABIT 1 34.81 0.9008034 0.99 – 2.0
BSA_BOVIN 3 174.11 0.0105259 1.22 – 0.2
-1-0.8-0.6-0.4-0.2
00.20.40.60.8
1
0 2 4 6 8 10
UNIQUE PEPTIDES USED AT LEAST
AV
ER
AG
E A
/B (
log
2)
0
10
20
30
40
50
60
70
0 2 4 6 8 10
UNIQUE PEPTIDES USED AT LEAST
%C
V o
f av
erag
e A
/B
ALDOA BSA/MYG CYC
25fm 1fm/200fm 1000fm

16 Marzo 2010 WG1&WG2 Meeting - CIC Salamanca
21
-1-0.8-0.6-0.4-0.2
00.20.40.60.8
1
0 2 4 6 8 10
UNIQUE PEPTIDES USED AT LEAST
AV
ER
AG
E A
/B (
log
2)
lab2
lab1
0
10
20
30
40
50
60
70
0 2 4 6 8 10
UNIQUE PEPTIDES USED AT LEAST
%C
V o
f av
erag
e A
/B
lab2
lab1
0
20
40
60
80
100
120
140
0 2 4 6 8 10
UNIQUE PEPTIDES USED AT LEAST
#PR
OT
EIN
S I
D-Q
UA
NT
lab2
lab1

16 Marzo 2010 WG1&WG2 Meeting - CIC Salamanca
22
PREDICTION OF PEPTIDE COUNTS
y = 0.0036x + 2.7052
R2 = 0.999
y = 0.004x + 3.0359
R2 = 0.9946
0
1
2
3
4
5
6
7
8
0 200 400 600 800 1000 1200 1400
PROTEIN CONCENTRATION
PE
PT
IDE
CO
UN
TS
concentration (fmol/microg) concentration/10 (pg/microg)
Accessionconcentration (fmol/microg)
concentration/10 (pg/microg)
Peptide count
CYC_HORSE 1000 1200 7
MYG_EQUBU 200 340 4
ALDOA_RABIT 25 98 3
BSA_BOVIN 1 6.6 2-3
LINEAR MODEL
Suitable for interpolation

16 Marzo 2010 WG1&WG2 Meeting - CIC Salamanca
23
PREDICTION OF PEPTIDE COUNTS
y = 1.5985Ln(x) - 4.6602
R2 = 0.9252
y = 1.0556Ln(x) - 0.7609
R2 = 0.8795
-3
-2
-1
0
1
2
3
4
5
6
7
8
0.1 1 10 100 1000 10000
PROTEIN CONCENTRATION
PE
PT
IDE
CO
UN
TS
concentration (fmol/microg) concentration/10 (pg/microg)
Accessionconcentration (fmol/microg)
concentration/10 (pg/microg)
Peptide count
CYC_HORSE 1000 1200 7
MYG_EQUBU 200 340 4
ALDOA_RABIT 25 98 3
BSA_BOVIN 1 6.6 0
LOGARITHMIC MODEL
Suitable for extrapolation?
16 Marzo 2010 WG1&WG2 Meeting - CIC Salamanca
24
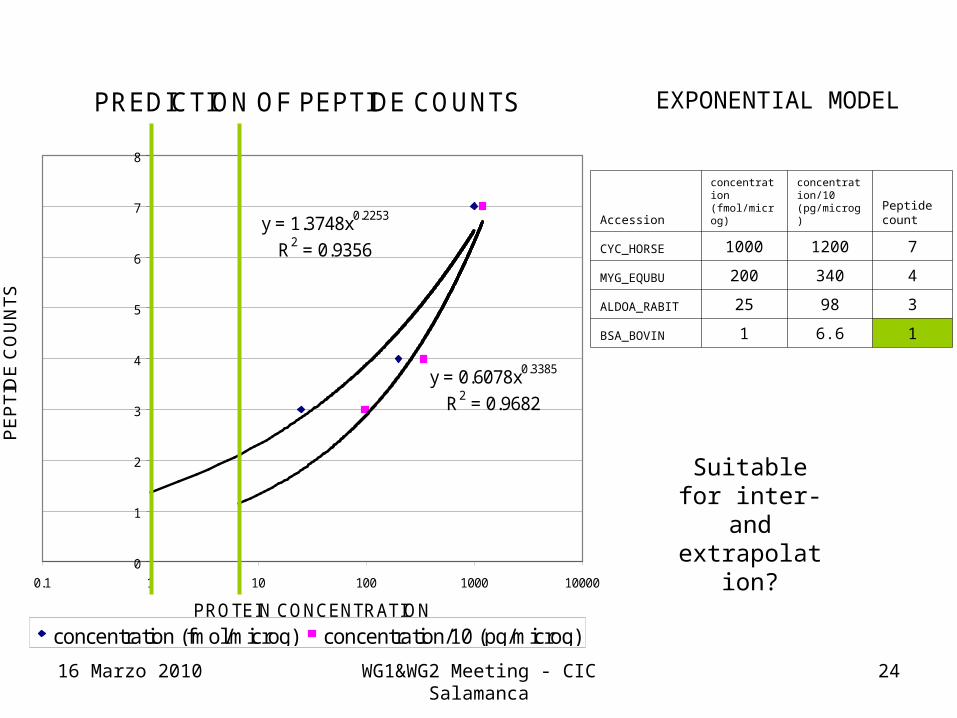
PREDICTION OF PEPTIDE COUNTS
y = 0.6078x0.3385
R2 = 0.9682
y = 1.3748x0.2253
R2 = 0.9356
0
1
2
3
4
5
6
7
8
0.1 1 10 100 1000 10000
PROTEIN CONCENTRATION
PE
PT
IDE
CO
UN
TS
concentration (fmol/microg) concentration/10 (pg/microg)
Accessionconcentration (fmol/microg)
concentration/10 (pg/microg)
Peptide count
CYC_HORSE 1000 1200 7
MYG_EQUBU 200 340 4
ALDOA_RABIT 25 98 3
BSA_BOVIN 1 6.6 1
EXPONENTIAL MODEL
Suitable for inter- and
extrapolation?

16 Marzo 2010 WG1&WG2 Meeting - CIC Salamanca
25
CONCLUSIONS
• LC-MS label free method was successfully used to quantitate relative abundance of spiked proteins across samples in a matrix of medium complexity
• Low resolution instruments (ESI-IT) produced reasonably accurate results
• Some spiked proteins can be in or below the LOD of the used instruments (inclusion lists)
• A thresold of 3 unique peptides seem to be needed for achieving an acceptable dispersion (p.ex. CV< 20%) of protein abundance data used for quantitation