
16-720 Computer Vision: Homework 1 Spatial …16720.courses.cs.cmu.edu/hw/hw1.pdf16-720 Computer...
10
16-720 Computer Vision: Homework 1 Spatial Pyramid Matching for Scene Classification Instructors: Deva Ramanan TAs: Achal Dave, Shashank Jujjavarapu, Siddarth Malreddy, Brian Pugh Due: Refer to course website: http://16720.courses.cs.cmu.edu/ Figure 1: Scene Classification: Given an image, can a computer program determine where it was taken? In this homework, you will build a representation based on bags of visual words and use spatial pyramid matching for classifying the scene categories. Instructions/Hints 1. Please pack your system and write-up into a single file named <AndrewId>.zip, see the complete submission checklist at the end. 2. All questions marked with a Q require a submission. 3. For the implementation part, please stick to the headers, variable names, and file con- ventions provided. 4. Start early! This homework will take a long time to complete. 5. Attempt to verify your implementation as you proceed: If you don’t verify that your im- plementation is correct on toy examples, you will risk having a huge mess when you put everything together. 6. Try to use relative paths with respect to the working directory. 7. If you have any questions or need clarifications, please post in Piazza or visit the TAs during the office hours. 1
Transcript of 16-720 Computer Vision: Homework 1 Spatial …16720.courses.cs.cmu.edu/hw/hw1.pdf16-720 Computer...
16-720 Computer Vision: Homework 1
Spatial Pyramid Matching for Scene Classification
Instructors: Deva RamananTAs: Achal Dave, Shashank Jujjavarapu, Siddarth Malreddy, Brian Pugh
Due: Refer to course website: http://16720.courses.cs.cmu.edu/
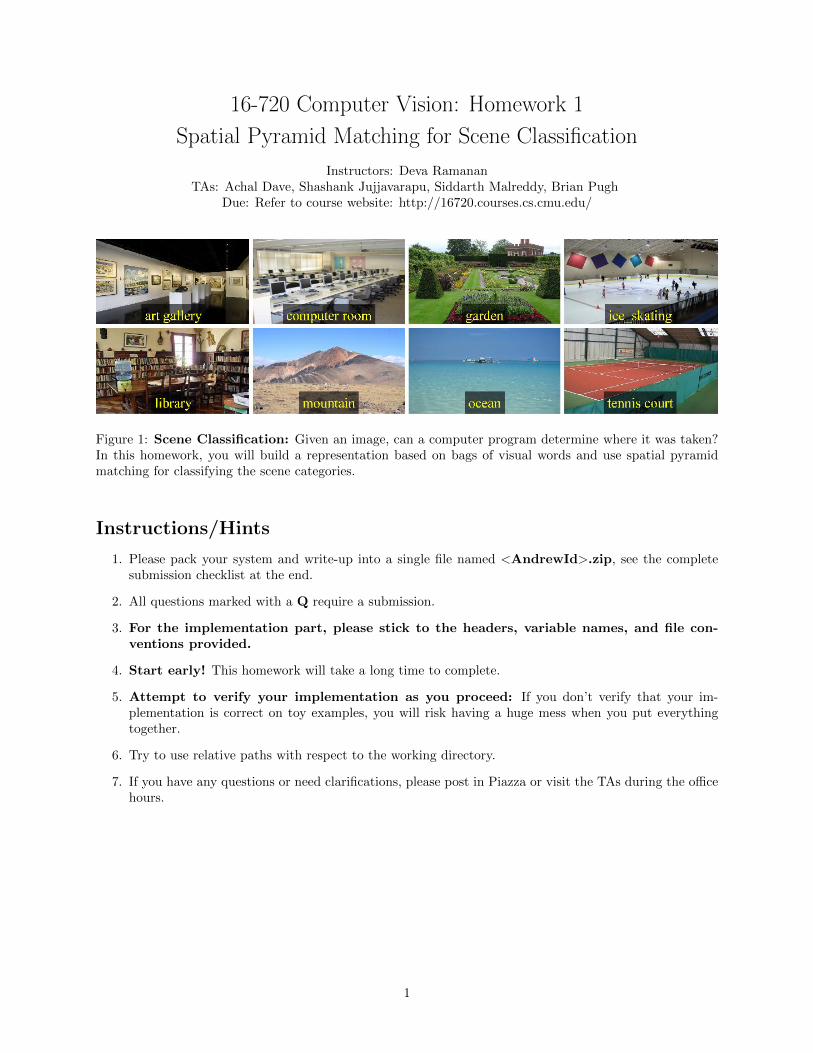
Figure 1: Scene Classification: Given an image, can a computer program determine where it was taken?In this homework, you will build a representation based on bags of visual words and use spatial pyramidmatching for classifying the scene categories.
Instructions/Hints
1. Please pack your system and write-up into a single file named <AndrewId>.zip, see the completesubmission checklist at the end.
2. All questions marked with a Q require a submission.
3. For the implementation part, please stick to the headers, variable names, and file con-ventions provided.
4. Start early! This homework will take a long time to complete.
5. Attempt to verify your implementation as you proceed: If you don’t verify that your im-plementation is correct on toy examples, you will risk having a huge mess when you put everythingtogether.
6. Try to use relative paths with respect to the working directory.
7. If you have any questions or need clarifications, please post in Piazza or visit the TAs during the officehours.
1
Overview
The bag-of-words (BoW) approach, which you learned about in class, has been applied to a myriad ofrecognition problems in computer vision. For example, two classic ones are object recognition [5, 7] andscene classification [6, 8] 1.
Beyond that, the BoW representation has also been the subject of a great deal of study aimed at improvingit, and you will see a large number of approaches that remain in the spirit of bag-of-words but improve uponthe traditional approach which you will implement here. For example, two important extensions are pyramidmatching [2, 4] and feature encoding [1].
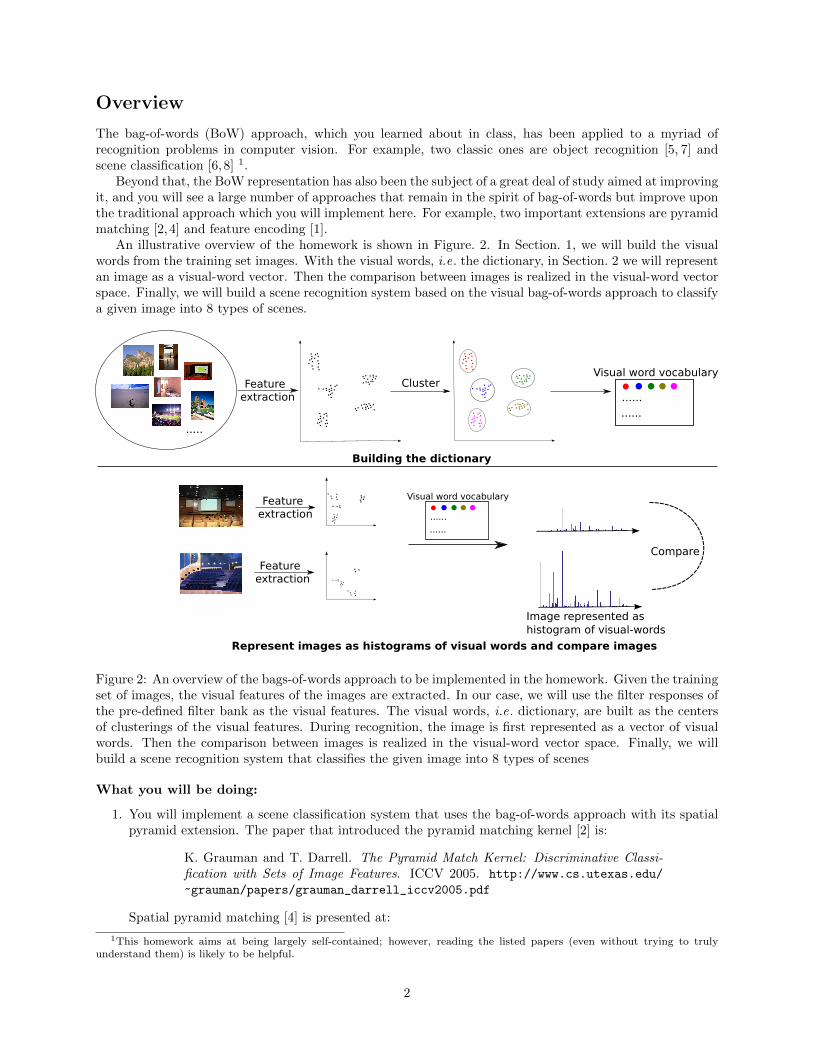
An illustrative overview of the homework is shown in Figure. 2. In Section. 1, we will build the visualwords from the training set images. With the visual words, i.e. the dictionary, in Section. 2 we will representan image as a visual-word vector. Then the comparison between images is realized in the visual-word vectorspace. Finally, we will build a scene recognition system based on the visual bag-of-words approach to classifya given image into 8 types of scenes.
.....
......
......
Feature extraction
ClusterVisual word vocabulary
......
......
Visual word vocabularyFeature extraction
Feature extraction
Image represented ashistogram of visual-words
Building the dictionary
Represent images as histograms of visual words and compare images
Compare
Figure 2: An overview of the bags-of-words approach to be implemented in the homework. Given the trainingset of images, the visual features of the images are extracted. In our case, we will use the filter responses ofthe pre-defined filter bank as the visual features. The visual words, i.e. dictionary, are built as the centersof clusterings of the visual features. During recognition, the image is first represented as a vector of visualwords. Then the comparison between images is realized in the visual-word vector space. Finally, we willbuild a scene recognition system that classifies the given image into 8 types of scenes
What you will be doing:
1. You will implement a scene classification system that uses the bag-of-words approach with its spatialpyramid extension. The paper that introduced the pyramid matching kernel [2] is:
K. Grauman and T. Darrell. The Pyramid Match Kernel: Discriminative Classi-fication with Sets of Image Features. ICCV 2005. http://www.cs.utexas.edu/
~grauman/papers/grauman_darrell_iccv2005.pdf
Spatial pyramid matching [4] is presented at:
1This homework aims at being largely self-contained; however, reading the listed papers (even without trying to trulyunderstand them) is likely to be helpful.
2
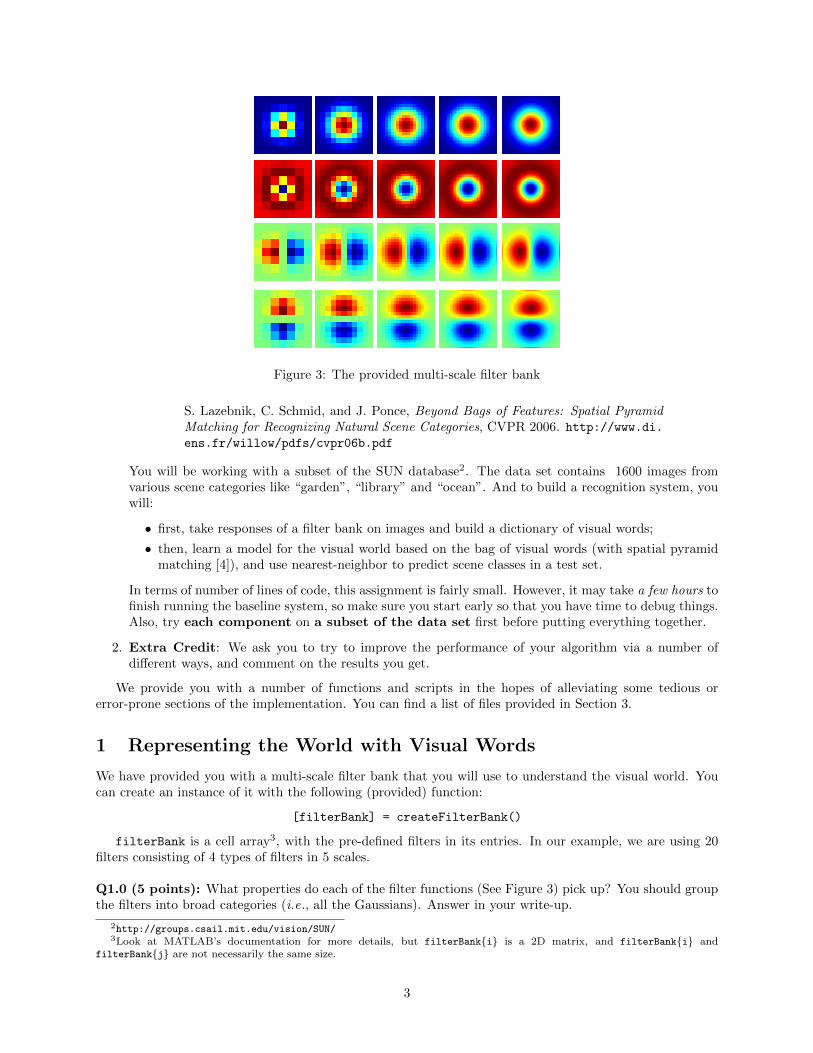
Figure 3: The provided multi-scale filter bank
S. Lazebnik, C. Schmid, and J. Ponce, Beyond Bags of Features: Spatial PyramidMatching for Recognizing Natural Scene Categories, CVPR 2006. http://www.di.ens.fr/willow/pdfs/cvpr06b.pdf
You will be working with a subset of the SUN database2. The data set contains 1600 images fromvarious scene categories like “garden”, “library” and “ocean”. And to build a recognition system, youwill:
• first, take responses of a filter bank on images and build a dictionary of visual words;
• then, learn a model for the visual world based on the bag of visual words (with spatial pyramidmatching [4]), and use nearest-neighbor to predict scene classes in a test set.
In terms of number of lines of code, this assignment is fairly small. However, it may take a few hours tofinish running the baseline system, so make sure you start early so that you have time to debug things.Also, try each component on a subset of the data set first before putting everything together.
2. Extra Credit: We ask you to try to improve the performance of your algorithm via a number ofdifferent ways, and comment on the results you get.
We provide you with a number of functions and scripts in the hopes of alleviating some tedious orerror-prone sections of the implementation. You can find a list of files provided in Section 3.
1 Representing the World with Visual Words
We have provided you with a multi-scale filter bank that you will use to understand the visual world. Youcan create an instance of it with the following (provided) function:
[filterBank] = createFilterBank()
filterBank is a cell array3, with the pre-defined filters in its entries. In our example, we are using 20filters consisting of 4 types of filters in 5 scales.
Q1.0 (5 points): What properties do each of the filter functions (See Figure 3) pick up? You should groupthe filters into broad categories (i.e., all the Gaussians). Answer in your write-up.
2http://groups.csail.mit.edu/vision/SUN/3Look at MATLAB’s documentation for more details, but filterBank{i} is a 2D matrix, and filterBank{i} and
filterBank{j} are not necessarily the same size.
3
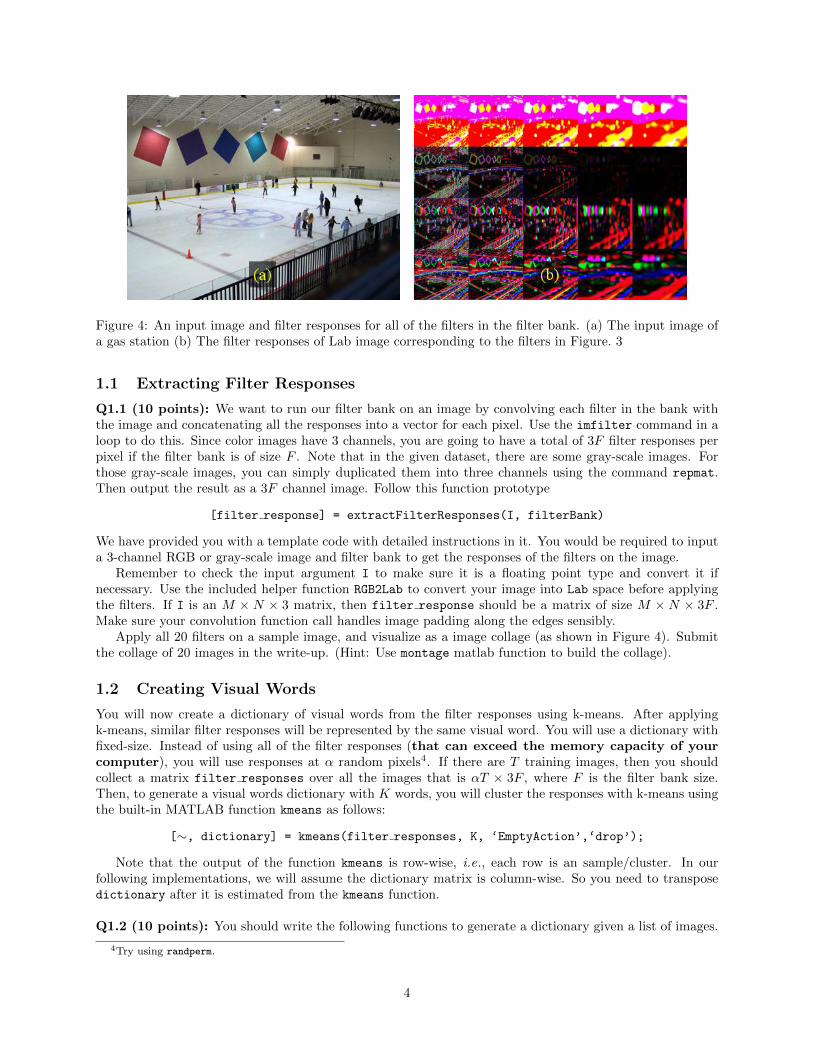
Figure 4: An input image and filter responses for all of the filters in the filter bank. (a) The input image ofa gas station (b) The filter responses of Lab image corresponding to the filters in Figure. 3
1.1 Extracting Filter Responses
Q1.1 (10 points): We want to run our filter bank on an image by convolving each filter in the bank withthe image and concatenating all the responses into a vector for each pixel. Use the imfilter command in aloop to do this. Since color images have 3 channels, you are going to have a total of 3F filter responses perpixel if the filter bank is of size F . Note that in the given dataset, there are some gray-scale images. Forthose gray-scale images, you can simply duplicated them into three channels using the command repmat.Then output the result as a 3F channel image. Follow this function prototype
[filter response] = extractFilterResponses(I, filterBank)
We have provided you with a template code with detailed instructions in it. You would be required to inputa 3-channel RGB or gray-scale image and filter bank to get the responses of the filters on the image.
Remember to check the input argument I to make sure it is a floating point type and convert it ifnecessary. Use the included helper function RGB2Lab to convert your image into Lab space before applyingthe filters. If I is an M × N × 3 matrix, then filter response should be a matrix of size M × N × 3F .Make sure your convolution function call handles image padding along the edges sensibly.
Apply all 20 filters on a sample image, and visualize as a image collage (as shown in Figure 4). Submitthe collage of 20 images in the write-up. (Hint: Use montage matlab function to build the collage).
1.2 Creating Visual Words
You will now create a dictionary of visual words from the filter responses using k-means. After applyingk-means, similar filter responses will be represented by the same visual word. You will use a dictionary withfixed-size. Instead of using all of the filter responses (that can exceed the memory capacity of yourcomputer), you will use responses at α random pixels4. If there are T training images, then you shouldcollect a matrix filter responses over all the images that is αT × 3F , where F is the filter bank size.Then, to generate a visual words dictionary with K words, you will cluster the responses with k-means usingthe built-in MATLAB function kmeans as follows:
[∼, dictionary] = kmeans(filter responses, K, ‘EmptyAction’,‘drop’);
Note that the output of the function kmeans is row-wise, i.e., each row is an sample/cluster. In ourfollowing implementations, we will assume the dictionary matrix is column-wise. So you need to transposedictionary after it is estimated from the kmeans function.
Q1.2 (10 points): You should write the following functions to generate a dictionary given a list of images.
4Try using randperm.
4
[filterBank, dictionary] = getFilterBankAndDictionary(image names)
As an input, getFilterBankAndDictionary takes a cell array of strings containing the full path to an image(or relative path wrt the working directory). You can load each file by iterating from 1:length(image names),and doing imread(image names{i}). Generate the αT filter responses over the training files and call k-means. A sensible initial value to try for K is between 100 and 300, and for α is between 50 and 200, butthey depend on your system configuration and you might want to play with these values.
Once you are done with getFilterBankAndDictionary, call the provided script computeDictionary,which will pass in the file names, and go get a coffee. If all goes well, you will have a .mat file nameddictionary.mat that contains the filter bank as well as the dictionary of visual words. If all goes poorly,you will have an error message5. If the clustering takes too long, reduce the number of clusters and samples.If you have debugging issues, try passing in a small number of training files manually.
1.3 Computing Visual Words
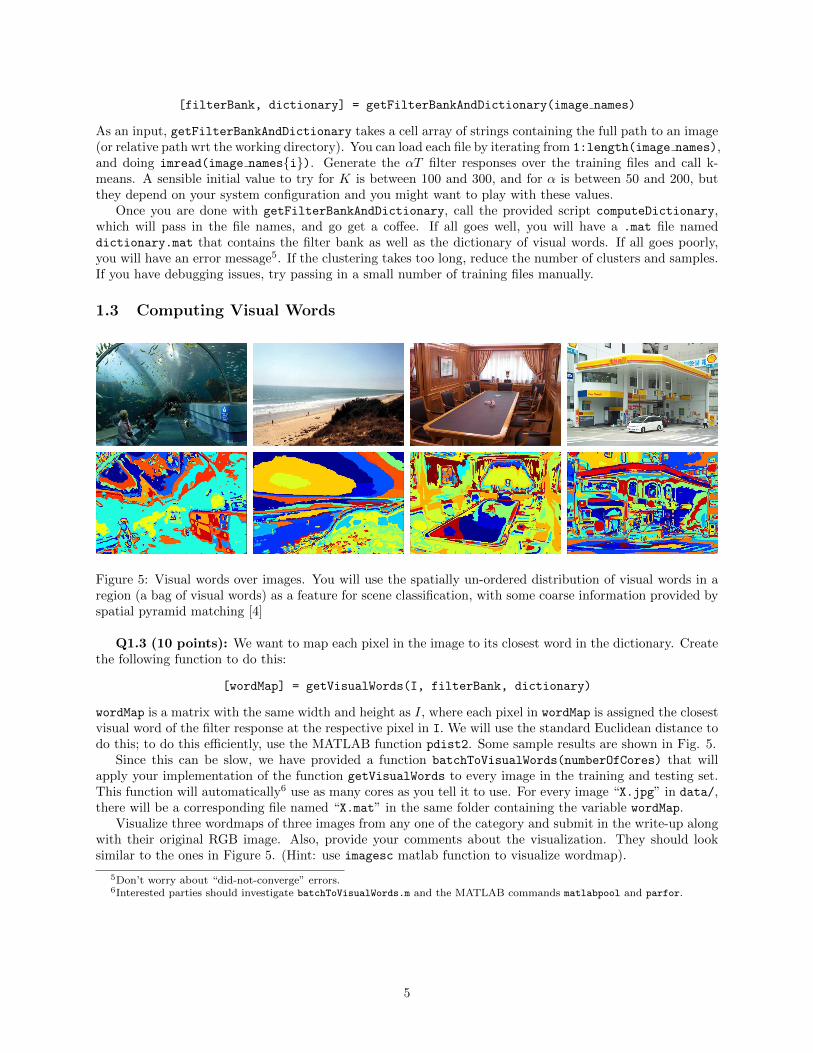
Figure 5: Visual words over images. You will use the spatially un-ordered distribution of visual words in aregion (a bag of visual words) as a feature for scene classification, with some coarse information provided byspatial pyramid matching [4]
Q1.3 (10 points): We want to map each pixel in the image to its closest word in the dictionary. Createthe following function to do this:
[wordMap] = getVisualWords(I, filterBank, dictionary)
wordMap is a matrix with the same width and height as I, where each pixel in wordMap is assigned the closestvisual word of the filter response at the respective pixel in I. We will use the standard Euclidean distance todo this; to do this efficiently, use the MATLAB function pdist2. Some sample results are shown in Fig. 5.
Since this can be slow, we have provided a function batchToVisualWords(numberOfCores) that willapply your implementation of the function getVisualWords to every image in the training and testing set.This function will automatically6 use as many cores as you tell it to use. For every image “X.jpg” in data/,there will be a corresponding file named “X.mat” in the same folder containing the variable wordMap.
Visualize three wordmaps of three images from any one of the category and submit in the write-up alongwith their original RGB image. Also, provide your comments about the visualization. They should looksimilar to the ones in Figure 5. (Hint: use imagesc matlab function to visualize wordmap).
5Don’t worry about “did-not-converge” errors.6Interested parties should investigate batchToVisualWords.m and the MATLAB commands matlabpool and parfor.
5

2 Building a Recognition System
We have formed a convenient representation for recognition. We will now produce a basic recognitionsystem with spatial pyramid matching. The goal of the system is presented in Fig. 1: given an image,classify (colloquially, “name”) the scene where the image was taken.
Traditional classification problems follow two phases: training and testing. During training time, thecomputer is given a pile of formatted data (i.e., a collection of feature vectors) with corresponding labels(e.g ., “beach”, “park”) and then builds a model of how the data relates to the labels: “if green, then park”.At test time, the computer takes features and uses these rules to infer the label: e.g ., “this is green, sotherefore it is park”.
In this assignment, we will use the simplest classification model: nearest neighbor. At test time, we willsimply look at the query’s nearest neighbor in the training set and transfer that label. In this example, youwill be looking at the query image and looking up its nearest neighbor in a collection of training imageswhose labels are already known. This approach works surprisingly well given a huge amount of data, e.g ., avery cool graphics applications from [3].
The components of any nearest-neighbor system are: features (how do you represent your instances?)and similarity (how do you compare instances in the feature space?). You will implement both.
2.1 Extracting Features
We will first represent an image with a bag of words approach. In each image, we simply look at how ofteneach word appears.
Q2.1 (10 points): Create a function getImageFeatures that extracts the histogram7 of visual words withinthe given image (i.e., the bag of visual words).
[h] = getImageFeatures(wordMap, dictionarySize)
As inputs, the function will take:
• wordMap is a H × W image containing the IDs of the visual words
• dictionarySize is the maximum visual word ID (i.e., the number of visual words, the dictionary size)
As output, the function will return h, a dictionarySize × 1 histogram that is L1 normalized, (i.e.,∑hi =
1). You may wish to load a single visual word map, visualize it, and verify that your function is workingcorrectly before proceeding.
2.2 Multi-resolution: Spatial Pyramid Matching
Bag of words is simple and efficient, but it discards information about the spatial structure of the image andthis information is often valuable. One way to alleviate this issue is to use spatial pyramid matching [4].The general idea is to divide the image into a small number of cells, and concatenate the histogram of eachof these cells to the histogram of the original image, with a suitable weight.
Here we will implement a popular scheme that chops the image into 2l × 2l cells where l is the layernumber. We treat each cell as a small image and count how often each visual word appears. This results ina histogram for every single cell in every layer. Finally to represent the entire image, we concatenate all thehistograms together after normalization by the total number of features in the image. If there are L layersand K visual words, the resulting vector has dimensionality K
∑Ll=0 4l = K
(4(L+1) − 1
)/3.
Now comes the weighting scheme. Note that when concatenating all the histograms, histograms fromdifferent levels are assigned different weights. Typically (in [4]), a histogram from layer l gets half the weightof a histogram from layer l+ 1, with the exception of layer 0, which is assigned a weight equal to layer 1. Apopular choice is for layer 0 and layer 1 the weight is set to 2−L, and for the rest it is set to 2l−L−1 (e.g ., ina three layer spatial pyramid, L = 2 and weights are set to 1/4, 1/4 and 1/2 for layer 0, 1 and 2 respectively,see Fig. 6). Note that the L1 norm (absolute values of all dimensions summed up together) for the finalvector is 1.
7Look into hist in MATLAB
6
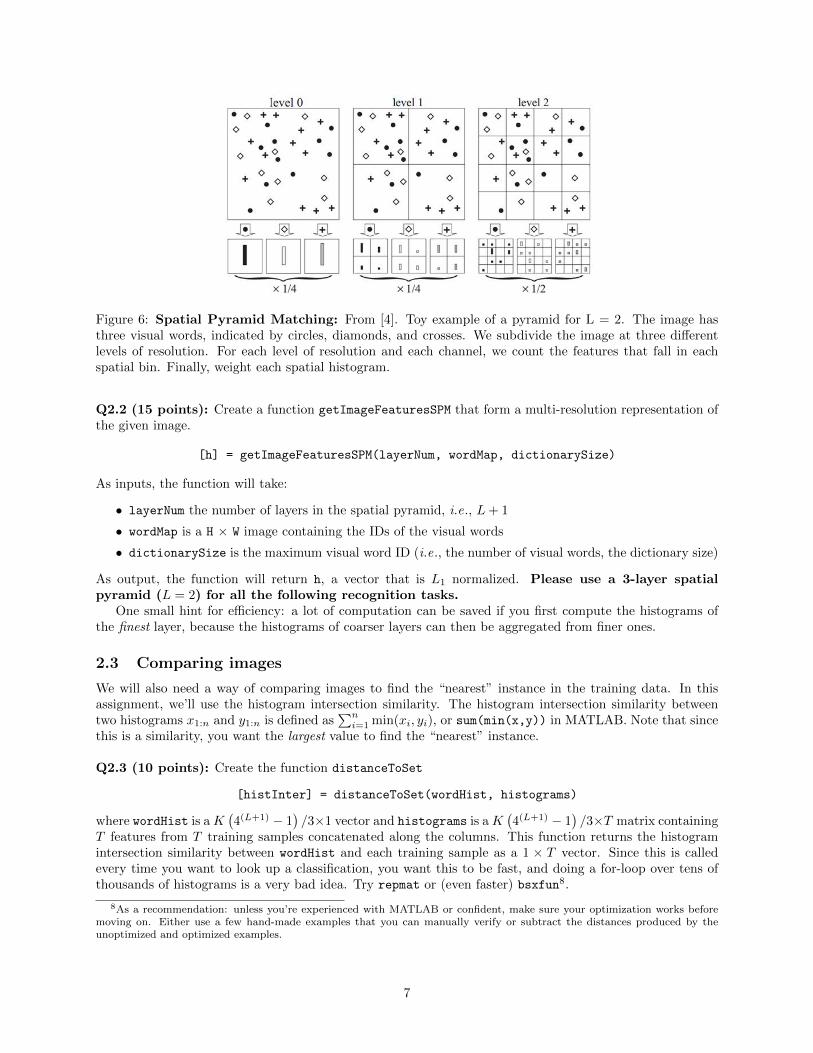
Figure 6: Spatial Pyramid Matching: From [4]. Toy example of a pyramid for L = 2. The image hasthree visual words, indicated by circles, diamonds, and crosses. We subdivide the image at three differentlevels of resolution. For each level of resolution and each channel, we count the features that fall in eachspatial bin. Finally, weight each spatial histogram.
Q2.2 (15 points): Create a function getImageFeaturesSPM that form a multi-resolution representation ofthe given image.
[h] = getImageFeaturesSPM(layerNum, wordMap, dictionarySize)
As inputs, the function will take:
• layerNum the number of layers in the spatial pyramid, i.e., L+ 1
• wordMap is a H × W image containing the IDs of the visual words
• dictionarySize is the maximum visual word ID (i.e., the number of visual words, the dictionary size)
As output, the function will return h, a vector that is L1 normalized. Please use a 3-layer spatialpyramid (L = 2) for all the following recognition tasks.
One small hint for efficiency: a lot of computation can be saved if you first compute the histograms ofthe finest layer, because the histograms of coarser layers can then be aggregated from finer ones.
2.3 Comparing images
We will also need a way of comparing images to find the “nearest” instance in the training data. In thisassignment, we’ll use the histogram intersection similarity. The histogram intersection similarity betweentwo histograms x1:n and y1:n is defined as
∑ni=1 min(xi, yi), or sum(min(x,y)) in MATLAB. Note that since
this is a similarity, you want the largest value to find the “nearest” instance.
Q2.3 (10 points): Create the function distanceToSet
[histInter] = distanceToSet(wordHist, histograms)
where wordHist is aK(4(L+1) − 1
)/3×1 vector and histograms is aK
(4(L+1) − 1
)/3×T matrix containing
T features from T training samples concatenated along the columns. This function returns the histogramintersection similarity between wordHist and each training sample as a 1 × T vector. Since this is calledevery time you want to look up a classification, you want this to be fast, and doing a for-loop over tens ofthousands of histograms is a very bad idea. Try repmat or (even faster) bsxfun8.
8As a recommendation: unless you’re experienced with MATLAB or confident, make sure your optimization works beforemoving on. Either use a few hand-made examples that you can manually verify or subtract the distances produced by theunoptimized and optimized examples.
7
2.4 Building A Model of the Visual World
Now that we’ve obtained a representation for each image, and defined a similarity measure to compare twospatial pyramids, we want to put everything up to now together.
You will need to load the training file names from traintest.mat and the filter bank and visual worddictionary from dictionary.mat. You will save everything to a .mat file named vision.mat. Included willbe:
1. filterBank: your filterbank.
2. dictionary: your visual word dictionary.
3. train features: a K(4(L+1) − 1
)/3 × N matrix containing all of the histograms of the N training
images in the data set. A dictionary with 150 words will make a train features matrix of size3150× 1349.
4. train labels: a 1×N vector containing the labels of each of the images. (i.e., so that train features(:,i)
has label train labels(i)).
We have provided you with the names of the training and testing images in traintest.mat. You want touse the cell array of files train imagenames for training, and the cell array of files test imagenames for test-ing. You cannot use the testing images for training. To access the word maps created by batchToVisualWords.m,you might need function strrep to modify the file names.
You may also wish to convert the labels to meaningful categories. Here is the mapping (a variable namedmapping is included in traintest.mat):
1 2 3 4 5 6 7 8
art gallery computer room garden ice skating library mountain ocean tennis court
Q2.4 (15 points): Write a script named buildRecognitionSystem.m that producesvision.mat, and submit it as well as any helper functions you write.
To qualitatively evaluate what you have done, we have provided a helper function that will let you getthe predictions on a new image given the training data. This will give you a visual sanity check that youhave implemented things correctly. Use the program as follows:
guessImage(absolutePathToImage)
The program will load the image, represent it with visual words, and get a prediction based on thehistogram. The predictions will appear inside your MATLAB command window as text.
Don’t worry if you get a fair amount of wrong answers. Do worry if the program crashes while callingyour code or if you get zero correct/all correct/all same answers. If you are getting 0% or 100% performance,go back and verify (visually) that each of your components produces correct output, or check that testingdata are accidentally included during training (yet you can pick images from both training and testing setfor debugging purposes).
2.5 Quantitative Evaluation
Qualitative evaluation is all well and good (and very important for diagnosing performance gains and losses),but we want some hard numbers.
Load the corresponding test images and their labels, and compute the predicted labels of each. To quan-tify the accuracy, you will compute a confusion matrix C: given a classification problem, the entry C(i,j) ofa confusion matrix counts the number of instances of class i that were predicted as class j. When things aregoing well, the elements on the diagonal of C are large, and the off-diagonal elements are small. Since thereare 8 classes, C will be 8 × 8. The accuracy, or percent of correctly classified images, is given by trace(C)
/ sum(C(:)).
Q2.5 (10 points): Write a script named evaluateRecognitionSystem.m
8
[conf] = evaluateRecognitionSystem()
that tests the system and outputs the confusion matrix, and submit it as well as any helper functions youwrite. Report the confusion matrix and accuracy for your results in your write-up. This does not have tobe formatted prettily: if you are using LATEX, you can simply copy/paste it from MATLAB into a verbatim
environment. Additionally, do not worry if your accuracy is low: with 8 classes, chance is 12.5%. To giveyou a more sensible number, a reference implementation without spatial pyramid matching gives an overallaccuracy of 5̃6%.
2.6 Find out the failed cases
There are some classes/samples that are more difficult to classify than the rest using the bags-of-wordsapproach. As a result, they are classified incorrectly into other categories.
Q2.6 (5 points): List some of these classes/samples and discuss why they are more difficult in your write-up.
2.7 Improving Performance (Extra Credit, upto 20 points)
So far you’ve implemented a baseline classification system. For extra credit, try make improvements to thesystem either in terms of accuracy or speed. You are free to try anything you’d like, but some things youcould try include changing the feature bank (use new filters to improve accuracy or try running the featureson an image pyramid to decrease running time), replace the histogram intersection with a different similaritymeasure or using a soft assignment scheme while mapping features to words. You can also explore differentvariations of Bag of words approach. If you attempt the extra credit section, include the entire code for theextra credit classification system in a folder called custom. In your writeup explain what you tried, why youthought it might work well and how much of a difference it made to your system’s performance.
3 HW1 Distribution Checklist
After unpacking hw1.zip, you should have a folder hw1 containing one folder for the data (data) and onefor each system you might implement (matlab and custom). In the matlab folder, where you will primarilywork, you will find:
• batchToVisualWords.m: a provided script that will run your code to convert all the images to visualword maps.
• computeDictionary.m: a provided script that will provide input for your visual word dictionary com-putation.
• createFilterBank.m: a provided function that returns a cell array of 20 filters.
• guessImage.m: a provided script that will predict the class for given image.
• RGB2Lab.m: a provided helper function to convert RGB to Lab image space.
Apart from this, we have also provided the stub codes in matlab folder. The data folder contains:
• data/: a directory containing .jpg images from SUN database.
• data/traintest.mat: a .mat file with the filenames of the training and testing set.
• checkA1Submission.m: Script to verify that your submission (<AndrewId>.zip) is in correct structureand contains all required files for submission.
9
4 Hw1 Submission Checklist
The assignment should be submitted to Blackboard as a zip file named <AndrewId>.zip and to Gradescopeas a pdf file named <AndrewId>.pdf. By extracting the zip file, it should have the following files in thestructure defined below. (Note: Missing to follow the structure will incur huge penalty in scores).
When you submit, remove the folder data/, as well as any large temporary files that we didnot ask you to create.
• <andrew id>/ # A directory inside .zip file
– matlab/
∗ dictionary.mat
∗ vision.mat
∗ <!– all .m files inside matlab directory >
– custom/ Matlab code for the custom system that you design to boost the performance of yoursystem (optional, extra credit);
∗ <!– all extra credit files >
Please run the provided script checkA1Submission(’<andrew id>’) before submission to ensure thatall the required files are available. It searches for a ’<andrew id>.zip’ file in the current directory.
References
[1] K. Chatfield, V. Lempitsky, A. Vedaldi, and A. Zisserman. The devil is in the details: an evaluation ofrecent feature encoding methods. In British Machine Vision Conference, 2011.
[2] K. Grauman and T. Darrell. The pyramid match kernel: discriminative classification with sets of imagefeatures. In Computer Vision (ICCV), 2005 IEEE International Conference on, volume 2, pages 1458–1465 Vol. 2, 2005.
[3] James Hays and Alexei A Efros. Scene completion using millions of photographs. ACM Transactions onGraphics (SIGGRAPH 2007), 26(3), 2007.
[4] S. Lazebnik, C. Schmid, and J. Ponce. Beyond bags of features: Spatial pyramid matching for recognizingnatural scene categories. In Computer Vision and Pattern Recognition (CVPR), 2006 IEEE Conferenceon, volume 2, pages 2169–2178, 2006.
[5] D.G. Lowe. Object recognition from local scale-invariant features. In Computer Vision (ICCV), 1999IEEE International Conference on, volume 2, pages 1150–1157 vol.2, 1999.
[6] Laura Walker Renninger and Jitendra Malik. When is scene identification just texture recognition?Vision research, 44(19):2301–2311, 2004.
[7] J. Winn, A. Criminisi, and T. Minka. Object categorization by learned universal visual dictionary. InComputer Vision (ICCV), 2005 IEEE International Conference on, volume 2, pages 1800–1807 Vol. 2,2005.
[8] Jianxiong Xiao, J. Hays, K.A. Ehinger, A. Oliva, and A. Torralba. Sun database: Large-scale scenerecognition from abbey to zoo. In Computer Vision and Pattern Recognition (CVPR), 2010 IEEEConference on, pages 3485–3492, 2010.
10


![720 IEEE TRANSACTIONS ON ULTRASONICS, FERROELECTRICS, … · Ultrafast cardiac ultrasound imaging is also possible with diverging waves [12]–[14]. To preserve contrast and spatial](https://static.fdocuments.net/doc/165x107/606340c80ae30d765b5c6650/720-ieee-transactions-on-ultrasonics-ferroelectrics-ultrafast-cardiac-ultrasound.jpg)