1527072 (2000) REP 2016'10'18 Geotechnical Investigation ...
87
October 2016 PRELIMINARY GEOTECHNICAL INVESTIGATION Glen Abbey Golf Club Redevelopment Oakville, Ontario REPORT Submitted to: Clublink Corporation ULC & Clublink Holdings Limited 15675 Dufferin Street King City, ON L4M 6Y1 Report Number: 1527072 (2000) Distribution: 1 e-Copy - Clublink Corporation ULC 1 e-Copy - Golder Associates Ltd.
Transcript of 1527072 (2000) REP 2016'10'18 Geotechnical Investigation ...

October 2016
PRELIMINARY GEOTECHNICAL INVESTIGATION
Glen Abbey Golf Club Redevelopment Oakville, Ontario
REPO
RT
Submitted to:Clublink Corporation ULC & Clublink Holdings Limited 15675 Dufferin Street King City, ON L4M 6Y1
Report Number: 1527072 (2000)
Distribution:
1 e-Copy - Clublink Corporation ULC 1 e-Copy - Golder Associates Ltd.

PRELIMINARY GEOTECHNICAL INVESTIGATION GLEN ABBEY GOLF CLUB REDEVELOPMENT
October 2016 Report No. 1527072 (2000) i
Table of Contents
1.0 INTRODUCTION .................................................................................................................................................... 1
2.0 PROJECT BACKGROUND ................................................................................................................................... 1
3.0 INVESTIGATION PROCEDURES ......................................................................................................................... 1
3.1 Field Investigation ..................................................................................................................................... 1
4.0 SUBSURFACE CONDITIONS ............................................................................................................................... 2
4.1 General Overview ..................................................................................................................................... 2
4.1.1 Topsoil ................................................................................................................................................ 3
4.1.2 Fill ....................................................................................................................................................... 3
4.1.3 Clayey Silt to Silty Clay Till .................................................................................................................. 3
4.1.4 Shale Bedrock ..................................................................................................................................... 4
4.2 Groundwater Conditions ........................................................................................................................... 4
5.0 GEOTECHNICAL COMMENTS AND RECOMMENDATIONS .............................................................................. 5
5.1 Subsurface Conditions Summary ............................................................................................................. 6
5.2 General Site Grading ................................................................................................................................ 6
5.3 Site Preparation and Engineered Fill ........................................................................................................ 6
5.4 Foundation Recommendations ................................................................................................................. 7
5.5 Lateral Earth Pressure on Walls ............................................................................................................... 8
5.6 Site Servicing ............................................................................................................................................ 9
5.6.1 Excavations ......................................................................................................................................... 9
5.6.2 Pipe Bedding and Cover ................................................................................................................... 10
5.6.3 Trench Backfill .................................................................................................................................. 10
5.8 Preliminary Geotechnical Input to Storm Water Management Ponds ..................................................... 11
5.8.1 SWM Pond Liners ............................................................................................................................. 12
5.8.2 SWM Pond Berm Construction and Inspection and Maintenance ..................................................... 12
5.9 Preliminary Pavement Design ................................................................................................................ 13
5.10 Erosion Hazard Limits ............................................................................................................................. 14
5.10.1 Background ....................................................................................................................................... 14
5.10.2 Methodology and Parameter Selection ............................................................................................. 14
5.10.3 Slope Stability Results ...................................................................................................................... 15

PRELIMINARY GEOTECHNICAL INVESTIGATION GLEN ABBEY GOLF CLUB REDEVELOPMENT
October 2016 Report No. 1527072 (2000) ii
5.10.4 Erosion Hazard Limit Analysis .......................................................................................................... 15
6.0 ADDITIONAL WORK, INSPECTIONS AND TESTING ....................................................................................... 16
ATTACHMENTS:
Important Information and Limitations of This Report Method of Soil Classification Abbreviations and Terms Used on Records of Boreholes and Test Pits List of Symbols TABLES:
Table 1: Fill Depths and Elevations Table 2: Till Depths and Elevations Table 3: Shale Bedrock Depths and Elevations LIST OF FIGURES
Figure 1: Site and Borehole Location Plan Figure 2: Slope A – Slop Stability Analysis (Static) Figure 3: Slope B – Slop Stability Analysis (Static) Figure 4: Slope C – Slop Stability Analysis (Static) Figure 5: Slope D – Slop Stability Analysis (Static) Figure 6: Slope Setback Analysis APPENDICES
APPENDIX A Record of Borehole Sheets
APPENDIX B Laboratory Test Results
APPENDIX C Previously Provided Slope Letter - Golder Associates Ltd.
PRELIMINARY GEOTECHNICAL INVESTIGATION GLEN ABBEY GOLF CLUB REDEVELOPMENT
October 2016 Report No. 1527072 (2000) 1
1.0 INTRODUCTION Golder Associates Ltd. (Golder) was retained by Clublink Corporation ULC & Clublink Holdings Limited (Clublink)
to provide geotechnical engineering services in support of the design of a mixed use development including
residential and commercial uses within the existing Glen Abbey Golf Course lands, in the Town of Oakville, Ontario.
The location of the site is shown on Figure 1.
The purpose of this report is to summarize the geotechnical information (soil, bedrock, and groundwater)
encountered in this area and to provide preliminary recommendations and comments on the geotechnical aspects
of the design and construction of the proposed development.
This report primarily addresses the geotechnical (physical) aspects of the subsurface conditions as encountered
at this site. Select soil samples were submitted for analytical testing to assess the environmental quality of the
subsurface soil conditions; the results of this testing are provided within the Phase II Environmental Site
Assessment (ESA) report, which is also being prepared by Golder under separate cover.
This report should be read in conjunction with the “Important Information and Limitations of this Report”, attached.
The reader’s attention is specifically drawn to this information, as it is essential for the proper use and interpretation
of this report.
2.0 PROJECT BACKGROUND The site is located at 1333 Dorval Drive, in the Town of Oakville, Ontario. The site is bounded by Dorval Drive to
the south, Upper Middle Road to the west and existing residential properties to the north and east. The site slopes
generally from south to north. The Sixteen Mile Creek Valley crosses the north portion of the site flowing from
northwest to southeast. The existing southern slope at the site ranges in height from about 24 metres to 31 metres;
the current slope profiles range from 0.7 horizontal to 1 vertical (0.7H:1V) to 1.9H:1V. Flatter slopes are present
at the northeastern portion of the site. Sixteen Mile Creek meanders along the base of the slope, within the valley
lands. The location and layout of the proposed development is shown on Figure 1.
Based on the site plan provided to our office titled “Glen Abbey Concept Master Plan” dated October 2016, the
proposed redevelopment of the Glen Abbey Golf Club will include the construction of detached residential units,
townhouse and stacked townhouse units, mid-rise apartment units, and mixed use (residential / retail / office)
space.
The proposed redevelopment will also consist of open space, parks, buffer blocks, and natural heritage system
blocks, as well as driveways and the associated municipal road network.
It is noted that the development is limited to the table land south of the valley and no development is planned
within the valley lands portion of the site or the Raydor Estate which is located at 1313 Dorval Drive.
3.0 INVESTIGATION PROCEDURES
3.1 Field Investigation The field investigation was completed between January 18 and February 10, 2016, during which time a total of
twenty boreholes were advanced at the site; the boreholes are designated as Boreholes BH1 to BH 20. A total of
nine environmental boreholes were advanced in the parking areas surrounding the maintenance area of the golf
club between January 25 and January 27, 2016. One of the boreholes (Borehole ESA-7) has been included in

PRELIMINARY GEOTECHNICAL INVESTIGATION GLEN ABBEY GOLF CLUB REDEVELOPMENT
October 2016 Report No. 1527072 (2000) 2
this report. The borehole locations are indicated on Figure 1. The Record of Borehole sheets for all of the
boreholes can be found in Appendix A.
The boreholes were drilled using both truck and track-mounted drill rigs supplied and operated by a specialist
drilling company. Standard penetration testing (ASTM D1586) and sampling were carried out at regular intervals
of depth in the boreholes using conventional 38 mm internal diameter split spoon sampling equipment in the
overburden soils. Bedrock coring was carried out in one of the boreholes.
Shallow groundwater conditions were noted in the open boreholes during drilling. Fourteen monitoring wells were
installed in selected boreholes and were equipped with flush mount steel casing access covers to allow for
subsequent monitoring of the groundwater levels at the site.
The field work was observed by members of Golder’s technical staff, who located the boreholes, arranged for the
clearance of underground utility services, observed the drilling, sampling and in situ testing operations, logged the
boreholes, and examined and cared for the recovered soil and rock samples. The samples were identified in the
field, placed in appropriate containers, labelled and transported to Golder’s Mississauga geotechnical laboratory
for further examination and laboratory testing. Index and classification tests, consisting of water content
determinations, grain size distribution tests, and Atterberg limits testing were carried out on selected soil samples.
The borehole locations were staked out in the field by Golder personnel prior to the drilling operations. Following
the drilling, the borehole and monitoring well locations were surveyed by Fiddes Clipsham Inc. The ground surface
elevations (referenced to Geodetic Datum) at the borehole locations were also surveyed at that time.
4.0 SUBSURFACE CONDITIONS The detailed subsurface soil/bedrock and groundwater conditions encountered in the boreholes advanced at this
site along with the results of geotechnical laboratory testing, are shown on the Record of Borehole sheets in
Appendix A. Methods of Soil Classification, Symbols and Terms used on Records of Boreholes and Test Pits are
provided to assist in the interpretation of the Record of Borehole sheets. The detailed results of geotechnical
laboratory testing on selected soil samples are presented in Appendix B.
The Record of Borehole sheets indicate the subsurface conditions at the borehole locations only. The stratigraphic
boundaries shown on the borehole records are inferred from non-continuous sampling, observations of drilling
progress as well as results of Standard Penetration Tests and, therefore, represent transitions between soil types
rather than exact planes of geological change. Subsurface soil conditions will vary between and beyond the
borehole locations.
The following sections of this report provide an overview of the subsurface conditions encountered at the site
followed by more detailed descriptions of the major soil strata and shallow groundwater conditions encountered at
the borehole locations.
4.1 General Overview In general, the subsurface stratigraphy within the area of the investigation consists of topsoil overlying variable fill;
the fill is underlain by native cohesive till deposits. The till is underlain by shale bedrock which was encountered
at depths ranging from 0.9 m to 5.6 m below ground surface. Groundwater was measured in nine of the boreholes
at the time of drilling at depths of between 2.6 m and 25.6 m below ground surface. Boreholes BH1, BH4, BH8,
BH9, BH10, BH12, BH14, BH15, BH17, BH18 and BH19 were dry at the completion of drilling. Groundwater levels

PRELIMINARY GEOTECHNICAL INVESTIGATION GLEN ABBEY GOLF CLUB REDEVELOPMENT
October 2016 Report No. 1527072 (2000) 3
were subsequently measured in the monitoring wells at depths of between 1.9 m and 26.9 m below ground surface
with a single monitoring well (BH17) being noted as dry. Additional comments regarding groundwater can be
found in Section 4.2 of this report.
4.1.1 Topsoil
Topsoil was encountered in each of the boreholes. The topsoil ranged in thickness between 50 mm and 610 mm.
The thickness of the topsoil at the site based on the borehole records should be considered preliminary only, and
a subsequent shallow test pit investigation should be completed to accurately ascertain the topsoil thickness
across the site.
4.1.2 Fill
Fill was encountered below the topsoil in eleven of the boreholes and ranged in thickness from about 0.3 m to
4.1 m. The fill was highly variable and ranged from silty clay to silt to silty sand fill and contained varying amounts
of gravel. The fill was reddish brown to grey; the water contents in the cohesive fill were variable from drier than
the plastic limit to at about the plastic limits; the non-cohesive fill was moist. Organics were noted in several of the
fill samples and a clayey topsoil layer was encountered underlying the fill at a depth of about 3.4 m in
Borehole BH17. The detailed depths and elevations of the fill at each of the borehole locations (if encountered) at
the site are provided in Table 1, following this report.
The measured SPT “N”-values in the cohesive fill ranged from 4 blows per 0.3 m of penetration to 25 blows per
0.3 m of penetration, indicating this fill is soft to very stiff. The measured SPT “N”-values in the non-cohesive fill
ranged from 7 blows per 0.3 m of penetration to 26 blows per 0.3 m of penetration indicating that these soils are
loose to compact.
The natural water contents measured on selected samples of the cohesive fill ranged between 7 percent and
13 percent. The natural water contents measured on selected samples of the non-cohesive fill ranged between
11 percent and 23 percent.
The results of grain size distribution tests completed on three selected samples of the silty clay fill are shown on
Figure B1. Atterberg Limits testing carried out on the three selected samples of the cohesive fill measured plastic
limits ranging between 14 and 20 percent, liquid limits ranging between 22 and 36 percent and plasticity indices
ranging between 8 and 16. These results, which are plotted on the plasticity chart on Figure B2, indicate that the
cohesive fill is comprised of silty clay of low plasticity.
The results of a grain size distribution test completed on one selected sample of the silt fill are shown on Figure B3.
Atterberg Limits testing carried out the selected sample of the silt fill measured a plastic limit of 19 percent, a liquid
limit of 22 percent and a plasticity index of 3. These results, which are plotted on the plasticity chart on Figure B4,
indicate that the fines portion of the fill are comprised of silt of slight plasticity.
The results of grain size distribution tests completed on two selected samples of the non-cohesive fill are shown
on Figure B5.
4.1.3 Clayey Silt to Silty Clay Till
A cohesive clayey silt to silty clay till deposit was encountered in the all of the boreholes with the exception of
BH17, underlying the topsoil or the fill, and directly overlying the shale bedrock. The clayey silt to silty clay till is
reddish brown to grey and contains variable sand gravel content, although typically the till is sandy. Upper portions

PRELIMINARY GEOTECHNICAL INVESTIGATION GLEN ABBEY GOLF CLUB REDEVELOPMENT
October 2016 Report No. 1527072 (2000) 4
of the till across the site were noted to be reworked. The till was observed to also contain shale fragments. The
water content of the till was noted to be generally at or below the estimated plastic limit. Till deposits in Ontario
are known to contain cobbles and boulders; as such, these materials are anticipated to be present throughout the
till deposits at this site. The till material ranged in thickness from 0.3 m to 3.5 m. The depths and elevations of the
clayey silt to silty clay till encountered at the site are provided in the Table 2, following this report.
The measured SPT “N”-values within the cohesive till deposit range from 10 blows per 0.3 m of penetration to
greater than 50 blows per 0.3 m of penetration, suggestive of a stiff to hard consistency. The SPT “N”-values
generally increase with depth.
The natural water content measured in samples of the cohesive till ranged from 6 percent to 22 percent.
The results of grain size distribution tests completed on nine selected samples of the cohesive till deposits are
shown on Figures B6 and B7. Atterberg Limits testing carried out on nine selected samples of the cohesive till
deposit measured plastic limits ranging between 15 and 18 percent, liquid limits ranging between 20 and
32 percent and plasticity indices ranging between 2 and 15. These results, which are plotted on the plasticity
charts on Figures B8 and B9, indicate that the till is comprised of clayey silt to silty clay of low plasticity.
4.1.4 Shale Bedrock
Red shale bedrock was encountered in each of the boreholes across the site, and as noted above, one of the
boreholes was cored to provide input to the bedrock. All of the boreholes were terminated in shale bedrock with
the exception of Borehole ESA-7. The shale was encountered underlying the native till deposits in each of the
boreholes excluding Borehole BH17, where it was encountered underlying the fill. The bedrock was encountered
at depths ranging from 0.7 m to 5.6 m below ground surface. The depth and elevation at which bedrock was
encountered in each of the boreholes across the site is provided in Table 3, following this report.
Several of the boreholes were advanced to their termination depths through the shale via augering and air rotary
methods. Samples of the shale bedrock were able to be recovered from the boreholes via the standard penetration
testing method; measured SPT “N”-values in the shale bedrock were greater than 50 blows per 0.3 m of
penetration.
Borehole BH7 was cored to a depth of about 29.4 m below existing grades. The HQ core recovery also indicated
that the shale bedrock contains limestone interbeds and is thinly bedded.
The Total Core Recovery (TCR) of the cored bedrock was between 95 percent to 100 percent and the Rock Quality
Designation (RQD) ranged from 85 percent to 100 percent.
4.2 Groundwater Conditions The shallow groundwater conditions encountered during this investigation and monitoring well installation details
are presented on the Record of Borehole sheets in Appendix A. Groundwater was measured in nine of the
boreholes at the time of drilling at depths of between 2.6 m and 25.6 m below ground surface. Boreholes BH1,
BH4, BH8, BH9, BH10, BH12, BH14, BH15, BH17, BH18 and BH19 were dry at the completion of drilling.
Groundwater levels were subsequently measured in the monitoring wells at depths of between 0.9 m and 26.9 m
below ground surface with a two monitoring wells (BH13 Deep and BH17) being noted as dry initially. The detailed
groundwater levels measured in the monitoring wells installed at the site, are summarized in the following table:

PRELIMINARY GEOTECHNICAL INVESTIGATION GLEN ABBEY GOLF CLUB REDEVELOPMENT
October 2016 Report No. 1527072 (2000) 5
Groundwater Levels
Well ID Ground
Elevation (masl)
Well depth
(m)
Groundwater Levels
Lithology February 16 and 22, 2016
March 22, 2016 April 13, 2016
Depth (mbgs)
Elevation (masl)
Depth (mbgs)
Elevation (masl)
Depth (mbgs)
Elevation (masl)
BH1 134.74 4.67 2.69 132.05 1.76 132.98 1.56 133.18 Shale
BH2 133.22 6.1 1.88 131.34 21.06 112.16 1.16 132.06 Silty clay to clayey silt, shale
BH3 127.04 26.2 21.23 105.81 - - 20.93 106.11 Shale
BH5 130.5 28.04 25.06 105.44 - - 23.18 107.32 Shale
BH7 127.01 29.41 26.94 100.07 - - 26.55 100.46 Shale
BH8 127.36 4.6 3.89 123.47 3.59 123.77 2.93 124.44 Silty clay, shale
BH9 133.16 4.57 3.08 130.08 2.20 130.97 2.14 131.03 Shale
BH11 137.09 12.19 3.81 133.28 2.19 134.90 2.75 134.34 Shale
BH13 - Shallow
134.37 1.5 1.31 133.06 - - 1.02 133.35 Silty clay
BH13 - Deep
134.37 14.6 DRY DRY - - 4.64 129.73 Shale
BH16 129.49 4.57 1.94 127.55 1.45 128.04 2.33 127.16 Shale
BH17 136.79 6.2 DRY DRY - - 4.75 132.04 Silty clay, shale
BH18 135.17 4.57 3.39 131.78 - - 2.06 133.11 Shale
BH19 132.41 4.55 2.17 130.24 1.94 130.47 1.81 130.60 Shale
BH20 130.27 10.67 1.04 129.23 - - 0.90 129.37 Shale
It should be noted that the groundwater levels at the site are anticipated to fluctuate with seasonal variations in
precipitation and runoff. A more detailed Hydrogeological Assessment of the site is reported under separate cover
in our report entitled “Preliminary Hydrogeological Assessment, Proposed Residential Development, Glen Abbey
Golf Course, Oakville, Ontario”, Ref. No. 1527072, dated July 2016.
5.0 GEOTECHNICAL COMMENTS AND RECOMMENDATIONS This section of the report provides preliminary engineering information regarding geotechnical aspects of the
proposed redevelopment at the Glen Abbey Golf Club, based on interpretation of the factual data obtained from
the boreholes advanced at the site and our understanding of the project requirements. The preliminary information
in this portion of the report is provided for the guidance of the design engineers and professionals. Where
comments are made on construction, they are provided in order to highlight those aspects which could affect the
design of the project. Contractors bidding on or undertaking any work at the site should examine the factual results
of the investigation, satisfy themselves as to the adequacy of the information for construction and make their own
interpretation of the factual information provided as it may affect equipment selection, proposed construction
methods, scheduling and the like.
This report primarily addresses the geotechnical (physical) aspects of the subsurface conditions as encountered
at this site. Select soil samples were submitted for analytical testing to assess the environmental quality of the

PRELIMINARY GEOTECHNICAL INVESTIGATION GLEN ABBEY GOLF CLUB REDEVELOPMENT
October 2016 Report No. 1527072 (2000) 6
subsurface soil conditions; the results of this testing are provided within the Phase II Environmental Site
Assessment (ESA) report, which is also being prepared by Golder under separate cover.
5.1 Subsurface Conditions Summary As noted above, the surficial conditions at the site typically consist of surficial topsoil overlying fill; the fill materials
were noted to contain organic matter in some areas, and in particular, a buried topsoil layer was encountered in
Borehole BH17. The fill materials are generally underlain by stiff to hard cohesive clayey silt to silty clay till
deposits, which are underlain by shale bedrock. Stabilized groundwater levels measured in the monitoring wells
at the site ranged from about 1.9 m and 26.9 m below ground surface.
Overall from a geotechnical perspective, the site is considered suitable to support the development as currently
proposed. Once the concept is finalized a more detailed site specific investigation will likely be required to address
the specific needs of the various components of the development.
5.2 General Site Grading Based on the conceptual plan referenced above and dated September 2015, the proposed redevelopment of the
Glen Abbey Golf Club will consist of residential structures comprising detached residential units, townhomes, mid-
rise apartment units, as well as mixed use (Residential / Retail / Office space).
At the time of this investigation the details of site grading were not yet available; however, it is anticipated that the
site will require some regrading as part of the redevelopment of the site. As indicated above, the near surface
soils encountered in several of the boreholes at the site consist of variable, soft to very stiff cohesive fill and loose
to compact fill materials containing organics.
The existing fill materials are not considered suitable for the subgrade support of shallow foundations. In areas
where these soils will be required to support settlement sensitive structures they should be removed followed by
placement of engineered fill materials to raise the grade back up to the proposed final grades as necessary. In
areas of deeper fill where fill removal is required in accordance with the final design, it is recommended that a
more detailed review of the fill in those areas is undertaken prior to earthworks to better assess the fill quality and
thickness specific to those areas. The fill depths and thicknesses encountered in the boreholes are provided in
Table 2.
5.3 Site Preparation and Engineered Fill As noted above, the fill present on site is not considered suitable to support settlement sensitive structures and as
such it is recommended that the fill be removed and replaced in these areas with engineered fill materials. The
following provides recommendations regarding site preparation and the placement of engineered fill within the site.
The existing topsoil layer should be stripped from the site prior to site grading and fill placement activities.
Following stripping of unsuitable surficial soils to expose the competent native till deposits and prior to placement
of engineered fill, the prepared native subgrade should be heavily compacted and proofrolled under the
supervision of the geotechnical engineer. Any softened or poorly performing areas of the native subgrade soils
must be subexcavated and replaced with engineered fill as directed by the geotechnical engineer.
The existing topsoil materials or other soils containing significant amounts of organic matter are not considered
suitable for reuse as engineered fill. Based on the results of the investigation, the organic content in the fill was

PRELIMINARY GEOTECHNICAL INVESTIGATION GLEN ABBEY GOLF CLUB REDEVELOPMENT
October 2016 Report No. 1527072 (2000) 7
variable; i.e., some of the fill samples contained organic content, whereas organics was not noted in several of the
of the fill samples. It is recommended that experienced Golder geotechnical personnel be present on site during
the removal of the fill to provide input into which soils could be stockpiled and later reused as engineered fill, and
which soils contain organic matter and thus should not be used as structural engineered fill.
The native till soils are considered suitable for reuse as engineered fill across the site provided the moisture
contents are within +/- 3% of the optimum moisture content.
Weathered shale that is excavated is not recommended to be used as engineered fill. However, consideration
could be given to mixing the weathered shale with native till soils prior to using the native till soils as engineered
fill. The shale must be broken down and / or pulverized prior to mixing with the till soils. It is recommended that
Golder personnel be on site full time to monitor any mixing of shale with native soils to confirm a suitable amount
of effort is being undertaken to fully break down the shale.
It is noted that, in order to mitigate damage to the golf course, the boreholes advanced as part of this project were
advanced in the immediate vicinity of cart paths or wooded areas. The existing golf course includes numerous
raised mounds along the fairways and rough areas that were unable to be investigated at this stage; however, it
is anticipated that the majority of these mounds and raised areas are comprised of fill. As noted above, it is
recommended that all fill be stripped prior to engineered fill placement. As such, Golder personnel should be on
site during the excavation of any raised areas as part of the grading works to provide input into the potential reuse
of the material as engineered fill.
The engineered fill should be placed in lifts not exceeding 200 mm in thickness, and should be uniformly
compacted to 100% of the materials Standard Proctor Maximum Dry Density (SPMDD). The existing fill soils may
be below their optimum water compaction and therefore water may need to be added during fill placement.
Full-time inspection by Golder’s geotechnical personnel is recommended during fill subexcavation and
engineered fill placement.
Care will be required to ensure that the prepared area extends far enough to encompass the limits of the
engineered fill. The engineered fill limits are defined such that the fill extends downward and outward from the
outside edge of the founding level of any footing/slab or other settlement sensitive area at a slope of one horizontal
to one vertical provided the fill extends a minimum of at least one metre beyond the perimeter of all structures.
Groundwater across the site was measured at a depth as high as 1.0 m below existing site grades; as noted
above, excavations to the native material may extend as deep as 4.4 m below existing grade. Groundwater levels
can fluctuate due to seasonal variations, and as such, to minimize the potential for dewatering, excavations for the
foundations, and/or engineered fill operations, should be conducted in the summer or fall months when
groundwater levels are typically at their lowest level.
Engineered fill materials should not be placed during winter/periods of freezing weather.
5.4 Foundation Recommendations For preliminary assessment purposes, conventional spread and strip footings foundations for lightly loaded to
moderately loaded structures on either the competent native till soils or bedrock may be designed using a factored
geotechnical resistance at Ultimate Limit States (ULS) of 300 kPa and a geotechnical resistance at Serviceability
Limit States (SLS) of 200 kPa (assuming 25 mm of settlement). In areas where structures are to be constructed

PRELIMINARY GEOTECHNICAL INVESTIGATION GLEN ABBEY GOLF CLUB REDEVELOPMENT
October 2016 Report No. 1527072 (2000) 8
which could exert higher loads onto the soils and bedrock (including the mid-rise apartments and the mixed use
structures), higher geotechnical resistances may be available on the fresh bedrock. In this regard, once these
areas are determined, an additional investigation should be completed, prior to detailed design, to provide
additional input toward the soil / bedrock interface and potentially increased geotechnical resistance values.
All exterior foundations and foundations in unheated areas must be provided with at least 1.2 m of earth cover for
frost protection purposes. In addition, the bearing soil and fresh concrete must be protected from freezing during
cold weather construction. All founding subgrade soils should be inspected by Golder prior to the
foundation construction. Any soft, loose or disturbed soils encountered at the founding level should be removed
and backfilled with compacted granular materials. Concrete for the foundations should be placed immediately
following the cleaning and inspection of the foundation subgrade (i.e., engineered fill or native soils). If concrete
cannot be placed immediately following preparation and cleaning of the subgrade, the integrity of the bearing
stratum should be protected by placement of a layer of lean concrete immediately following inspection of the
foundation subgrade by Golder.
If stepped spread footings are constructed, the difference in elevation between individual footings should not be
greater than one half the clear distance between the footings. In addition, the lower footings should be constructed
first so that if it is necessary to construct the lower footings at a greater depth than anticipated, the elevations of
the upper footings can be adjusted accordingly. Stepped strip footings should be constructed in accordance with
OBC Section 9.15.3.9.
For preliminary design assessment purposes, a factored geotechnical resistance at Ultimate Limit States (ULS) of
250 kPa and a geotechnical resistance at Serviceability Limit States (SLS) of 150 kPa (assuming 25 mm of
settlement) may be used in the design of shallow foundations founded within engineered fill materials.
The maximum total and differential settlements are expected to be less than 25 mm and 20 mm, respectively, for
foundations designed, constructed and inspected as outlined above.
5.5 Lateral Earth Pressure on Walls The exterior foundation walls, as well as any retaining structures, should be backfilled with compacted granular fill
materials. A suitable drainage system should be incorporated into the design to allow for the collection and
discharge of water that may enter the backfill zone. As a minimum requirement, the granular backfill should be
placed in the wedge-shaped zone defined by a 60 degree line extending up and back from the base of the
structures. All granular backfill should be placed in maximum 200 mm loose lifts and uniformly compacted to at
least 98 percent of the material’s Standard Proctor Maximum Dry Density (SPMDD). Heavy compaction
equipment should not be used within the lateral distance behind any structure equal to the current height of the fill
above the base of the structure.
The structures should be designed to withstand both lateral earth and groundwater pressures. Provided that the
excavation is backfilled as described above, the structures may be designed using a triangular earth pressure
distribution, an at-rest earth pressure coefficient of 0.5 and a soil unit weight of 19 kN/m3.

PRELIMINARY GEOTECHNICAL INVESTIGATION GLEN ABBEY GOLF CLUB REDEVELOPMENT
October 2016 Report No. 1527072 (2000) 9
5.6 Site Servicing 5.6.1 Excavations
Based on the information provided to our office by SCS Consulting Group Ltd. (SCS), excavations of up to 10 m
depth are required for installation of services.
The founding soils for site services at depths of up to 10 m are anticipated to consist primarily of the cohesive
clayey silt to silty clay till deposits, as well as shale bedrock. We note that extensive engineered fill operations will
likely be required at the site and excavations will also be completed through previously placed engineered fill.
Temporary excavations may be carried out using open cut methods. Excavation can be carried out using a large
excavator equipped with a rock breaker; ripping teeth may be required to loosen the upper portions of the shale.
All excavation work should be carried out in accordance with the Occupational Health and Safety Act and
Regulations (OHSA) and with local regulations. In general, temporary open cuts of 1H:1V are considered feasible.
Stockpiles of excavated material should be set back from the edge of the excavation by a distance at least equal
to the excavation depth.
An adequate temporary shoring system should be provided to protect existing structures, services and other
facilities located adjacent to the excavations and at all locations where space limitations prevent construction of
sufficiently shallow excavation side slopes. Either a driven, interlocking sheet pile system or a soldier pile and
timber lagging system would be suitable for the temporary excavation support based on the subsurface soil and
groundwater conditions. The temporary excavation support system should be designed and constructed in
accordance with Ontario Provincial Standard Specifications (OPSS) 539 (Construction Specification for
Temporary Protection Systems). The lateral movement of the temporary shoring system should meet
Performance Level 2 as specified in OPSS 539. As the presence of boulders within the till deposit should be
anticipated, sheet pile walls may encounter difficulties if considered to support this excavation.
It is noted that the Ministry of the Environment and Climate Change (MOECC) has implemented new regulations
for construction dewatering. If construction dewatering will be more than 50,000 L/day but less than 400,000 L/day
an Environmental Activity and Sector Registry (EASR) will be required. If dewatering will be greater than
400,000 L/day, a Permit to Take Water (PTTW) will be required.
Based on the subsurface conditions encountered during the borehole investigation, although high groundwater
levels were encountered in some of the boreholes, it is anticipated that actual flow into the excavations would be
relatively slow and controllable by conventional sumps and pumps.
The dewatering requirements also need to take into account the rate of removal of the storage volume as well as
removal of water that might accumulate in the open excavation during rainfall events. Based on the water level
depths, and the estimated hydraulic conductivity of the rock, it is likely that the dewatering requirement will exceed
50,000 L/day. It is recommended that once the excavation depths are finalized across the site, an assessment be
completed to determine the requirements for either an EASR or a PTTW.
The groundwater levels can fluctuate due to seasonal variations, and as such, to minimize the potential for
dewatering, if possible, excavations for the foundations should be conducted in the summer or fall months when
groundwater levels are typically at their lowest levels.

PRELIMINARY GEOTECHNICAL INVESTIGATION GLEN ABBEY GOLF CLUB REDEVELOPMENT
October 2016 Report No. 1527072 (2000) 10
5.6.2 Pipe Bedding and Cover
The native cohesive till soils and shale bedrock are considered to be suitable for supporting sewers and
watermains provided that the integrity of the base of the trench excavations can be maintained during construction.
Where variable fill materials, or other deleterious materials are encountered at the base of excavations for
settlement-sensitive services, these materials should be subexcavated and replaced with compacted bedding
materials approved by Golder.
The pipe bedding, embedment and cover soils should be compatible with the sizes, type and class of pipe(s) and
the surrounding subsoil. The design should be in accordance with the applicable OPSD standards (1100 series),
OPSS 441, OPSS 501 and the Town’s standards. If granular bedding is used, OPSS 1010 Granular “A” may be
used from at least 150 mm below invert to springline of the pipe. From springline to 300 mm above the obvert of
the pipe, sand cover could be used. Backfill above the embedment/cover soils could consist of suitable approved
native soils.
In regard to wet trench bases, the use of clear stone materials for use as pipe bedding materials is not
recommended due to the high potential for soil migration into the clear stone.
5.6.3 Trench Backfill
The excavated materials from trenches for servicing will consist of native cohesive till soils and shale bedrock. In
regard to the till, these materials are considered suitable for use as trench backfill provided their water contents at
the time of construction are at or near their optimum water content for compaction. Any boulders or cobbles
greater than 150 mm in size should be removed from the trench backfill.
Excavated highly weathered shale is expected to be suitable for trench backfill, provided that it is broken down or
pulverized and can be compacted to the required density using mechanical compaction equipment. During
compaction, the shale will require frequent wetting in order to achieve the desired degree of
compaction. Additional details on construction procedures and requirements for the excavation, backfilling and
compaction of shale are provided in the Town of Oakville’s Development Engineering Procedures and Guidelines
Manual.
If required an approved imported material such as OPSS 1010 Select Subgrade Material (SSM) should be used
for trench backfill in lieu of native materials.
The trench backfill should be placed in maximum 300 mm loose lift thickness and uniformly compacted to at least
95 percent of its SPMDD. Due to the high frost-susceptibility of the cohesive till materials, cold weather work
should not be completed; however, if cold weather backfill placement is necessary, it should be carried out so that
frozen lumps of material, snow and ice are not present in the fill and so that the placed material is not allowed to
freeze after placement and compaction. Any such backfilling work should be carried out under the fulltime
inspection by Golder with the understanding that work may have to be suspended if temperatures are too
low and some material might have to be removed and replaced if it is allowed to freeze after placement.
It is anticipated that the majority of the compacted backfill will comprise the native cohesive till soils; as such,
post-construction settlement of the compacted backfill may occur, with the majority of such settlement taking place
within about three to six months following the completion of the backfilling operations. This settlement would be
reflected at the ground surface. To provide a more uniform transition of the ground surface from the undisturbed

PRELIMINARY GEOTECHNICAL INVESTIGATION GLEN ABBEY GOLF CLUB REDEVELOPMENT
October 2016 Report No. 1527072 (2000) 11
native material to the trench backfill as applicable, the sides of the excavation should be sloped at an inclination
no steeper than 1 horizontal to 1 vertical, outwards and upwards from the base of the excavation.
As noted above, a hydrogeological assessment of the site is currently being undertaken by Golder. Additional
information regarding trench dewatering requirements and recommendations will be provided once the
hydrogeological assessment is complete.
5.7 Bulking Factors Soil / rock bulking is the increase in total volume of soil / rock over the volume of the same material in the
undisturbed state. Bulking of native materials occurs when they are excavated from undisturbed ground. For
initial design purposes and considering the predominant native till soils and shale bedrock, bulking of about
20 per cent (increase in total volume) for the till and 35% for the shale bedrock would be expected after excavation
and prior to re-compaction. After re-compaction, bulking of about 5 to 10 per cent would be expected.
5.8 Preliminary Geotechnical Input to Storm Water Management Ponds As discussed above, based on the latest site plans three Storm Water Management (SWM) Ponds) will be
constructed at the site. Preliminary design details for the SWM Ponds are indicated in the table below; we have
also provided the boreholes which are in close vicinity to the SWM Pond.
SWM Pond Borehole
No. Normal Water
Level Elevation (m)
Base of Pond Elevation
(m)
Maximum Side Slope (H:V)
A (Block 188) BH2, BH3 126.00 123.00 4H:1V
B (Block 190) BH19, BH20 127.50 124.50 4H:1V
C (Block 189) BH7, BH8 126.00 121.75 4H:1V
The subsurface conditions at the site generally comprise varying amounts of fill overlying native cohesive till
deposits. The till is underlain by weathered shale bedrock. Given the proposed depths of the ponds it is anticipated
that the base of the ponds will be located within the weathered shale bedrock. Therefore, it is recommended that
a liner be installed over the entirety of each of the ponds to eliminate the potential for stormwater seepage into the
bedrock. Discussion regarding potential liner types is provided in the following section of this report.
Based on the subsurface conditions encountered in boreholes drilled at the site, groundwater was measured
at a depth as high as 0.9 m below existing site grades in Borehole BH20. The depth of the groundwater
increases northward, toward the slope. Depending on the final SWM Pond(s) location and configuration,
significant dewatering could be required to facilitate the excavation and construction of the ponds. Additional
investigation and analysis should be completed during the detail design stage to provide input toward the
potential need for a Permit to Take Water.
The sideslope geometry of the SWM Ponds ranges between 7H:1V to 4H:1V. A global stability analysis
should be completed at each SWM Pond location to confirm that there is a suitable factor of safety against
global instability of any containment berms to be constructed, provided that the berm is properly constructed
using appropriate engineered fill materials and that a suitable liner is properly installed. Additional stability
features, such as shear keys, may be required depending on the results of the analysis. As discussed in
greater detail below, full-time supervision by experienced/senior Golder geotechnical personnel should be

PRELIMINARY GEOTECHNICAL INVESTIGATION GLEN ABBEY GOLF CLUB REDEVELOPMENT
October 2016 Report No. 1527072 (2000) 12
carried out during the berm construction (if required) and liner installation as unacceptable seepage and/or
instability could occur if the berm and liner is not properly constructed.
5.8.1 SWM Pond Liners
As a portion of the SWM Ponds will be constructed within the weathered shale bedrock, a low-permeability liner
will need to be installed to limit seepage out of the ponds through the weathered shale. This will help to maintain
the normal operating water level/permanent pool elevation within the ponds.
Consideration could be given to the installation of a liner comprised of clayey soils (i.e., a clay liner) at the site.
Reuse of the silty clay to clayey silt till as a clay liner could be considered provided any oversized particles
(boulders and cobbles) are removed from the material prior to placement and compaction. As an alternative to a
clay liner, consideration could be given to installing a geosynthetic clay liner (GCL) such as a Bentofix geosynthetic
liner or equivalent material. The use of a GCL is also recommended for ease of construction in comparison to a
liner comprised of clayey soils. The GCL is considered suitable for providing a low-permeability barrier in order to
reduce seepage out of the pond which would otherwise occur due to the presence of weathered shale bedrock
encountered during the investigation.
A review of any potential buoyancy issues should be completed once the final SWM Pond(s) configurations are
known. Specifically, Boreholes BH19 and BH20 were advanced in proximity to the southern SWM Pond
(Block 162); the groundwater levels measured in the monitoring wells in these two boreholes were 1.8 m and 0.9 m
respectively, below existing site grades. Under normal operating conditions, there will likely be sufficient resistance
to buoyancy of the liner under normal operating conditions (i.e., a water level within the ponds at the normal water
level). However, the SWM Ponds should be designed such that there is also sufficient resistance to uplift during
maintenance activities (i.e., if / when the pond is drained). In this regard, the liner will need to be covered with
sufficient soil weight to counteract the upward seepage pressures based on the water levels at the site.
Alternatively, a subdrain system could be installed beneath the liner to allow for water levels to be lowered either
on a permanent basis (if permitted) or at the time that maintenance activities are to be carried out.
5.8.2 SWM Pond Berm Construction and Inspection and Maintenance
As indicated on the engineering plans provided to our office, the northern portion of the SWM Pond A will require
construction of a new containment berm to be constructed using engineered fill. The SWM Pond should have an
external slope not steeper than 3 Horizontal to 1 Vertical.
It is anticipated that at least portions of the berm will be constructed from cut materials removed from within the
SWM Pond footprint, including the native till. It is noted that shale bedrock was encountered underlying the till
deposits; consideration could be given to mixing of the weathered shale with the native till materials provided that
the operations are completed with the mixing recommendations provided above in Section 5.3. Importing of
material may also be required to supplement the native material. If imported materials are required, they should
consist of well-graded glacial till materials or well-graded granular materials which should be approved prior to
importation.
Any existing topsoil materials, or other soils containing significant amounts of organic and deleterious matter, are
not considered suitable as subgrade soils for berm construction or for reuse as engineered fill materials within the
berm. It is also recommended to remove all previously placed fill prior to construction of the berm. Following
stripping of the topsoil and fill, and prior to placement of engineered fill for construction of the containment berm,

PRELIMINARY GEOTECHNICAL INVESTIGATION GLEN ABBEY GOLF CLUB REDEVELOPMENT
October 2016 Report No. 1527072 (2000) 13
the prepared subgrade should be heavily compacted and proofrolled under the supervision of the geotechnical
engineer. Any softened or poorly performing areas of the subgrade soils must be subexcavated and replaced with
engineered fill as directed by the geotechnical engineer.
A review of the subsurface conditions in Borehole BH2 indicate that silty clay fill was encountered up to a depth of
about 4.0 m below site grades; the fill is underlain by about 1.5 m of native silty clay to clayey silt till. Organics
were noted in portions of the fill materials; as such, monitoring of this material during excavation and stockpiling is
recommended to determine the potential for reuse as engineered fill for the berm construction. All materials
proposed for berm construction should be approved by qualified geotechnical personnel prior to use.
The containment berm engineered fill materials should be placed in lifts not exceeding 200 mm in thickness, and
should be uniformly compacted to 100% of the materials Standard Proctor Maximum Dry Density (SPMDD). Given
the potential for poor performance including potential for instability if the berm is not properly constructed,
confirming that the berm is properly constructed is of utmost importance and, as such, full-time observation and in
situ density testing by experienced Golder geotechnical personnel should be carried out during engineered fill
placement/berm construction and liner installation.
The installation of pond liner materials and appropriate erosion protection measures is recommended to be
incorporated into the design of the pond to limit the potential for internal erosion and seepage out of the pond.
Additionally, to reduce erosion of the exterior embankment side slopes due to surface water runoff, installation of
erosion control mats in conjunction with topsoil placement and seeding or pegged sod is recommended as soon
as practicable after construction of the embankments.
5.9 Preliminary Pavement Design Based on the borehole results, the subgrade for the pavement structure will generally comprise very stiff to hard
native till soils and engineered fill. Prior to placing any granular material, the exposed subgrade should be
prepared and heavily proof-rolled under the supervision of the geotechnical engineer. Remedial work should be
carried out on any disturbed, softened or poorly performing zones, as directed by the geotechnical engineer. The
recommended preliminary pavement design for this proposed redevelopment is outlined below and is consistent
with Town of Oakville Standards.
Material Thickness of Pavement Elements (mm)
Minor Collector Local Residential
Asphaltic Material (OPSS 1150)
HL3 Surface 50 40
HL8 Binder 80 50
Granular Material (OPSS 1010
Granular A Base 150 150
Granular B Subbase 350 350
Total Pavement Thickness (mm) 630 590
Over Prepared And Approved Subgrade
Granular materials should be uniformly compacted to 100 percent of the Standard Proctor Maximum Dry Density
(SPMDD). The asphalt materials should be compacted to between 92.0 and 96.5 percent of their Marshall
Maximum Relative Densities (MRDs), as measured in the field using a nuclear density gauge.

PRELIMINARY GEOTECHNICAL INVESTIGATION GLEN ABBEY GOLF CLUB REDEVELOPMENT
October 2016 Report No. 1527072 (2000) 14
It should be noted that the pavement structure provided above is not intended to support heavy construction traffic.
In this regard, heavy construction traffic, including triaxials, graders, etc., should be limited to areas of the site
where suitable temporary access roads have been constructed so that disturbance to the native soils will be
minimized. The contractor should be responsible for determining the locations of, and constructing, these
temporary access roads.
Golder should provide additional design recommendations regarding the pavement design once final grades have
been determined and traffic data is provided.
5.10 Erosion Hazard Limits 5.10.1 Background
Golder previously provided a letter entitled “Preliminary Stable Slope Setback Analysis” dated April 13, 2015; the
letter can be found in Appendix C. The criteria which govern the evaluation of the setbacks required for valley
lands in this area are defined in document titled “Determining Regulatory Limits in the Conservation Halton’s
Jurisdiction” dated August 2015.
As noted above, a natural slope is located along the northern-central portion of the site and runs in an east-west
direction from Dorval Drive to Upper Middle Road; Sixteen Mile Creek runs along or near the base of the existing
slope. The creek meanders throughout the valley lands and is generally more than 15 metres away from the toe
of the slope in most areas. However it is noted that an approximately 250 metre section of the slope exists where
the creek and slope are close or are in direct contact.
The existing slope at the site ranges in height from about 24 metres to 31 metres; the current slope profiles range
from 0.7 horizontal to 1 vertical (0.7H:1V) to 1.9H:1V. Flatter slopes are present at the northeastern portion of the
site.
As part of the geotechnical investigation, four boreholes were advanced near the crest of the slope to provide input
toward the stable slope allowance (Boreholes BH3, BH5, BH6 and BH7). The bedrock in Borehole BH7 was cored
to provide input toward Rock Quality Designation (RQD) and Total Core Recovery (TCR). In general, each of
these four boreholes encountered shallow fill underlain by clayey silt to silty clay till deposits. The overburden
thickness at the four borehole locations was about 4 m to 5 m; the overburden soils were underlain by shale
bedrock of Queenston Formation.
5.10.2 Methodology and Parameter Selection
A slope analysis was completed on the steepest slope in the vicinity of each of the four boreholes noted above.
These four areas are designated below as Slope A, Slope B, Slope C and Slope D. The slope stability analyses
were carried out using SLOPE/W Version 7.23, a commercially available software package by Geo-Slope
International for limit equilibrium stability analyses. Subsurface conditions from the closest borehole to each of
the slope sites were used to provide soil parameters at each of the areas.
Factors of safety are not indicated in the document provided by Halton Conservation; in this regard, an appropriate
factor of safety has been taken from the Ministry of Natural Resources (MNR) Technical Guide – River and Stream
Systems: Erosion Hazard Limit (Technical Guide). As per Table 4.3 in the Technical Guide, based on the
anticipated land use, a Factor of Safety of 1.5 was used to calculate the stable slope line.

PRELIMINARY GEOTECHNICAL INVESTIGATION GLEN ABBEY GOLF CLUB REDEVELOPMENT
October 2016 Report No. 1527072 (2000) 15
The soil parameters were estimated from empirical correlations using the results of in situ Standard Penetration
Tests (SPT), undrained shear strength values, visual classification and the results of laboratory testing. Deep
seated failures through the shale bedrock are not considered to be probable and as such, only shallow
rotational / sliding failures were analyzed at the four locations.
The simplified soil stratigraphy and the associated strengths and unit weights employed for the different soil types
for Slope A, Slope B, Slope C, and Slope D is shown below.
Slope Borehole No. Soil Layer Overburden Thickness
(m)
Bulk Unit Weight (kN/m3)
Effective Friction Angle
(degrees)
Slope A 3 Fill, firm to stiff
Till, very stiff to hard 4.8
18 20
28 35
Slope B 5
Fill, very stiff Fill, compact
Fill, loose Reworked Till, stiff
Till, hard
3.9
19 19 18 20 20
30 28 26 32 35
Slope C 6 Fill, firm
Fill, loose Till, very stiff
4.6 19 19 20
28 26 34
Slope D 7 Fill, firm
Till, very stiff 2.7
19 20
28 35
5.10.3 Slope Stability Results
A review of the analyses completed at the four sites noted above indicate stable slope lines in the overburden soils
ranging between 2.2H:1V to 2.6H:1V for a minimum Factor of Safety of 1.5 to be achieved. The results of the
analyses at each of the four sites can be found on Figures 2 to 5.
In regard to the stable slope angle for the shale bedrock, based on the Rock Quality Designation of the recovered
bedrock core in Borehole 7, and our past experience, a stable slope angle of 1.6H:1V is considered appropriate.
5.10.4 Erosion Hazard Limit Analysis
Based on the subsurface conditions noted from our field investigation, information detailed in the Halton Document
and the Technical Guide, as well as the slope stability analyses noted above, the table below provides a summary
of the recommended erosion allowances. We also note that Beacon Environmental Limited (Beacon) completed
a site reconnaissance at the watercourse and confirmed that where Sixteen Mile Creek is within 15 m of the toe
of the slope, a 5 m toe erosion allowance is required. This toe erosion allowance is applicable in Slope C, noted
below.

PRELIMINARY GEOTECHNICAL INVESTIGATION GLEN ABBEY GOLF CLUB REDEVELOPMENT
October 2016 Report No. 1527072 (2000) 16
Area Toe Erosion Allowance (m)
Stable Slope Angle (Bedrock)
Stable Slope Angle (Soil)
Slope A N/A 1.6H:1V 2.4H:1V
Slope B N/A 1.6H:1V 2.6H:1V
Slope C 5 m 1.6H:1V 2.2H:1V
Slope D N/A 1.6H:1V 2.3H:1V
Based on these values, Golder has provided a drawing which incorporates a 1.6H:1V stable slope angle through
the shale portion of the slope, with the varying soil stable slope angles noted in the table above. This drawing is
designated as Figure 6.
The composite Stable Slope Angle for the four slope locations analysed is about 1.7H:1V. This angle was applied
to develop the current Stable Top of Slope line indicated on Figure 6. Figure 6 also includes the toe erosion
allowance, where applicable. In the vicinity of Slope A, as the existing slope is shallower than 1.7H:1V, the stable
top of bank has been taken as the top of the existing slope.
It is noted that the erosion hazard for major valley systems, as defined by Conservation Halton, also includes an
Access Allowance of 15 m beyond the stable top of bank. We understand that a 10 m Access Allowance has been
applied by the development team, and that no private land uses will be proposed within 15m of the Stable top of
Bank. In this regard, from a geotechnical perspective, a 10 m Access Allowance, may be considered and is
consistent with recommendations in the MNR Technical Guide as well as those of many other Conservation
Authorities in Southern Ontario.
6.0 ADDITIONAL WORK, INSPECTIONS AND TESTING As noted above, prior to completing the proposed residential and mixed use subdivision design, further site specific
geotechnical assessment will be required. Prior to tendering, the geotechnical aspects of the final design drawings
and specifications and the proposed geo-related construction methodology should be reviewed by Golder to
confirm that the various aspects outlined in this report have been met.
During construction, sufficient subgrade monitoring, in-situ density tests, and materials tests should be carried out
to confirm that the ground conditions encountered are consistent with those encountered in the boreholes, and to
monitor conformance with the pertinent project specifications. Full-time geo-monitoring should be performed by
Golder geotechnical personnel during construction.


IMPORTANT INFORMATION AND LIMITATIONS OF THIS REPORT
2013 1 of 2
Standard of Care: Golder Associates Ltd. (Golder) has prepared this report in a manner consistent with that level of care and skill ordinarily exercised by members of the engineering and science professions currently practising under similar conditions in the jurisdiction in which the services are provided, subject to the time limits and physical constraints applicable to this report. No other warranty, expressed or implied is made.
Basis and Use o f the Report: This report has been prepared for the specific site, design objective, development and purpose described to Golder by the Client. The factual data, interpretations and recommendations pertain to a specific project as described in this report and are not applicable to any other project or site location. Any change of site conditions, purpose, development plans or if the project is not initiated within eighteen months of the date of the report may alter the validity of the report. Golder can not be responsible for use of this report, or portions thereof, unless Golder is requested to review and, if necessary, revise the report.
The information, recommendations and opinions expressed in this report are for the sole benefit of the Client. No other party may use or rely on this report or any portion thereof without Golder’s express written consent. If the report was prepared to be included for a specific permit application process, then upon the reasonable request of the client, Golder may authorize in writing the use of this report by the regulatory agency as an Approved User for the specific and identified purpose of the applicable permit review process. Any other use of this report by others is prohibited and is without responsibility to Golder. The report, all plans, data, drawings and other documents as well as all electronic media prepared by Golder are considered its professional work product and shall remain the copyright property of Golder, who authorizes only the Client and Approved Users to make copies of the report, but only in such quantities as are reasonably necessary for the use of the report by those parties. The Client and Approved Users may not give, lend, sell, or otherwise make available the report or any portion thereof to any other party without the express written permission of Golder. The Client acknowledges that electronic media is susceptible to unauthorized modification, deterioration and incompatibility and therefore the Client can not rely upon the electronic media versions of Golder’s report or other work products.
The report is of a summary nature and is not intended to stand alone without reference to the instructions given to Golder by the Client, communications between Golder and the Client, and to any other reports prepared by Golder for the Client relative to the specific site described in the report. In order to properly understand the suggestions, recommendations and opinions expressed in this report, reference must be made to the whole of the report. Golder can not be responsible for use of portions of the report without reference to the entire report.
Unless otherwise stated, the suggestions, recommendations and opinions given in this report are intended only for the guidance of the Client in the design of the specific project. The extent and detail of investigations, including the number of test holes, necessary to determine all of the relevant conditions which may affect construction costs would normally be greater than has been carried out for design purposes. Contractors bidding on, or undertaking the work, should rely on their own investigations, as well as their own interpretations of the factual data presented in the report, as to how subsurface conditions may affect their work, including but not limited to proposed construction techniques, schedule, safety and equipment capabilities.
Soil, Rock and Ground water Conditions: Classification and identification of soils, rocks, and geologic units have been based on commonly accepted methods employed in the practice of geotechnical engineering and related disciplines. Classification and identification of the type and condition of these materials or units involves judgment, and boundaries between different soil, rock or geologic types or units may be transitional rather than abrupt. Accordingly, Golder does not warrant or guarantee the exactness of the descriptions.

IMPORTANT INFORMATION AND LIMITATIONS OF THIS REPORT
2013 2 of 2
Special risks occur whenever engineering or related disciplines are applied to identify subsurface conditions and even a comprehensive investigation, sampling and testing program may fail to detect all or certain subsurface conditions. The environmental, geologic, geotechnical, geochemical and hydrogeologic conditions that Golder interprets to exist between and beyond sampling points may differ from those that actually exist. In addition to soil variability, fill of variable physical and chemical composition can be present over portions of the site or on adjacent properties. The professional services retained for this project include only the geotechnical aspects of the subsurface conditions at the site, unless otherwise specifically stated and identified in the report. The presence or implication(s) of possible surface and/or subsurface contamination resulting from previous activities or uses of the site and/or resulting from the introduction onto the site of materials from off-site sources are outside the terms of reference for this project and have not been investigated or addressed.
Soil and groundwater conditions shown in the factual data and described in the report are the observed conditions at the time of their determination or measurement. Unless otherwise noted, those conditions form the basis of the recommendations in the report. Groundwater conditions may vary between and beyond reported locations and can be affected by annual, seasonal and meteorological conditions. The condition of the soil, rock and groundwater may be significantly altered by construction activities (traffic, excavation, groundwater level lowering, pile driving, blasting, etc.) on the site or on adjacent sites. Excavation may expose the soils to changes due to wetting, drying or frost. Unless otherwise indicated the soil must be protected from these changes during construction.
Sample Disposal: Golder will dispose of all uncontaminated soil and/or rock samples 90 days following issue of this report or, upon written request of the Client, will store uncontaminated samples and materials at the Client’s expense. In the event that actual contaminated soils, fills or groundwater are encountered or are inferred to be present, all contaminated samples shall remain the property and responsibility of the Client for proper disposal.
Follow-Up and Construction Services: All details of the design were not known at the time of submission of Golder’s report. Golder should be retained to review the final design, project plans and documents prior to construction, to confirm that they are consistent with the intent of Golder’s report.
During construction, Golder should be retained to perform sufficient and timely observations of encountered conditions to confirm and document that the subsurface conditions do not materially differ from those interpreted conditions considered in the preparation of Golder’s report and to confirm and document that construction activities do not adversely affect the suggestions, recommendations and opinions contained in Golder’s report. Adequate field review, observation and testing during construction are necessary for Golder to be able to provide letters of assurance, in accordance with the requirements of many regulatory authorities. In cases where this recommendation is not followed, Golder’s responsibility is limited to interpreting accurately the information encountered at the borehole locations, at the time of their initial determination or measurement during the preparation of the Report.
Changed Conditions and Drainage: Where conditions encountered at the site differ significantly from those anticipated in this report, either due to natural variability of subsurface conditions or construction activities, it is a condition of this report that Golder be notified of any changes and be provided with an opportunity to review or revise the recommendations within this report. Recognition of changed soil and rock conditions requires experience and it is recommended that Golder be employed to visit the site with sufficient frequency to detect if conditions have changed significantly.
Drainage of subsurface water is commonly required either for temporary or permanent installations for the project. Improper design or construction of drainage or dewatering can have serious consequences. Golder takes no responsibility for the effects of drainage unless specifically involved in the detailed design and construction monitoring of the system.
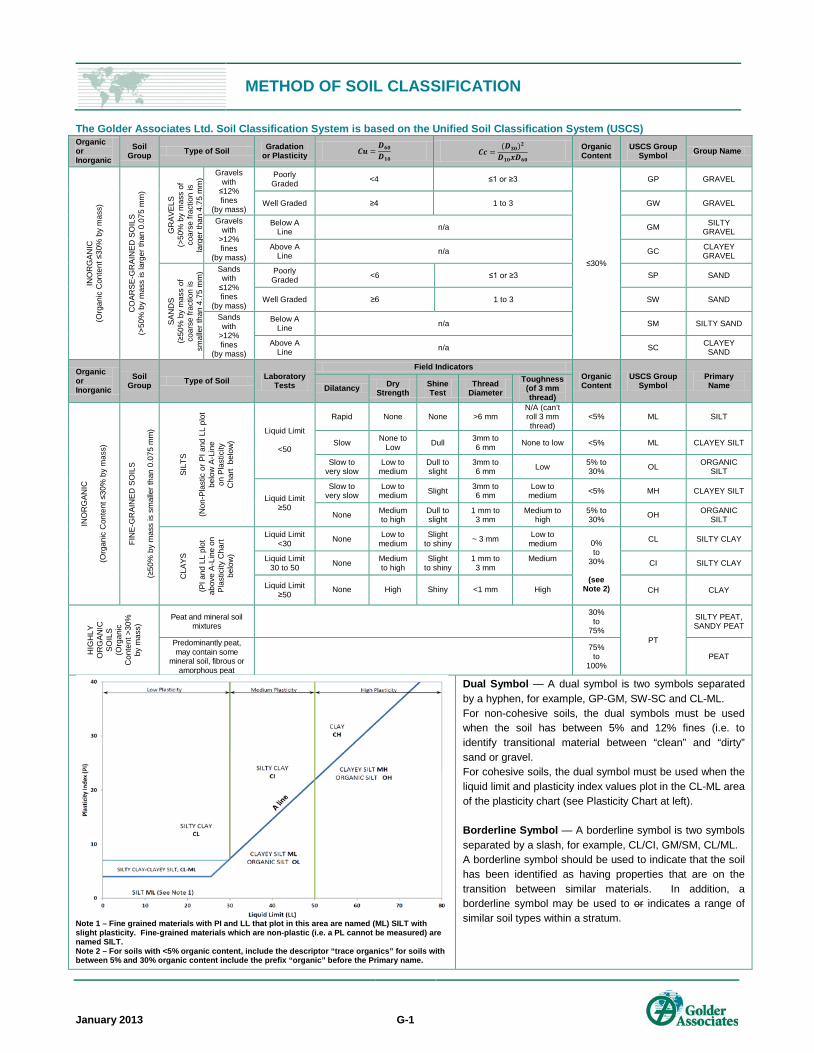
METHOD OF SOIL CLASSIFICATION
The Golder Associates Ltd. Soil Classification System is based on the Unified Soil Classification System (USCS)
January 2013 G-1
Organic or Inorganic
Soil Group
Type of Soil Gradation
or Plasticity 𝑪𝒖 =
𝑫𝟔𝟎
𝑫𝟏𝟎 𝑪𝒄 =
(𝑫𝟑𝟎)𝟐
𝑫𝟏𝟎𝒙𝑫𝟔𝟎
Organic Content
USCS Group Symbol
Group Name
INO
RG
AN
IC
(Org
an
ic C
onte
nt
≤30
% b
y m
ass
)
CO
AR
SE
-GR
AIN
ED
SO
ILS
(˃
50
% b
y m
ass
is la
rge
r th
an
0.0
75
mm
)
GR
AV
EL
S
(>5
0%
by
ma
ss o
f co
ars
e f
ract
ion
is
larg
er
tha
n 4
.75
mm
)
Gravels with
≤12% fines
(by mass)
Poorly Graded
<4 ≤1 or ≥3
≤30%
GP GRAVEL
Well Graded ≥4 1 to 3 GW GRAVEL
Gravels with
>12% fines
(by mass)
Below A Line
n/a GM SILTY
GRAVEL
Above A Line
n/a GC CLAYEY GRAVEL
SA
ND
S
(≥5
0%
by
ma
ss o
f co
ars
e f
ract
ion
is
sma
ller
than
4.7
5 m
m) Sands
with ≤12% fines
(by mass)
Poorly Graded
<6 ≤1 or ≥3 SP SAND
Well Graded ≥6 1 to 3 SW SAND
Sands with
>12% fines
(by mass)
Below A Line
n/a SM SILTY SAND
Above A Line
n/a SC CLAYEY
SAND
Organic or Inorganic
Soil Group
Type of Soil Laboratory
Tests
Field Indicators Organic Content
USCS Group Symbol
Primary Name Dilatancy
Dry Strength
Shine Test
Thread Diameter
Toughness (of 3 mm thread)
INO
RG
AN
IC
(Org
an
ic C
onte
nt
≤30
% b
y m
ass
)
FIN
E-G
RA
INE
D S
OIL
S
(≥5
0%
by
ma
ss is
sm
alle
r th
an 0
.07
5 m
m)
SIL
TS
(N
on
-Pla
stic
or
PI
and
LL
plo
t b
elo
w A
-Lin
e
on
Pla
stic
ity
Ch
art
b
elo
w)
Liquid Limit
<50
Rapid None None >6 mm N/A (can’t roll 3 mm thread)
<5% ML SILT
Slow None to
Low Dull
3mm to 6 mm
None to low <5% ML CLAYEY SILT
Slow to very slow
Low to medium
Dull to slight
3mm to 6 mm
Low 5% to 30%
OL ORGANIC
SILT
Liquid Limit ≥50
Slow to very slow
Low to medium
Slight 3mm to 6 mm
Low to medium
<5% MH CLAYEY SILT
None Medium to high
Dull to slight
1 mm to 3 mm
Medium to high
5% to 30%
OH ORGANIC
SILT
CL
AY
S
(P
I a
nd
LL
plo
t a
bo
ve A
-Lin
e o
n
Pla
stic
ity C
ha
rt
be
low
)
Liquid Limit <30
None Low to
medium Slight
to shiny ~ 3 mm
Low to medium 0%
to 30%
(see
Note 2)
CL SILTY CLAY
Liquid Limit 30 to 50
None Medium to high
Slight to shiny
1 mm to 3 mm
Medium
CI SILTY CLAY
Liquid Limit ≥50
None High Shiny <1 mm High CH CLAY
HIG
HL
Y
OR
GA
NIC
S
OIL
S
(Org
an
ic
Co
nte
nt
>3
0%
b
y m
ass
)
Peat and mineral soil mixtures
30%
to 75%
PT
SILTY PEAT, SANDY PEAT
Predominantly peat, may contain some
mineral soil, fibrous or amorphous peat
75%
to 100%
PEAT
Note 1 – Fine grained materials with PI and LL that plot in this area are named (ML) SILT with slight plasticity. Fine-grained materials which are non-plastic (i.e. a PL cannot be measured) are named SILT. Note 2 – For soils with <5% organic content, include the descriptor “trace organics” for soils with between 5% and 30% organic content include the prefix “organic” before the Primary name.
Dual Symbol — A dual symbol is two symbols separated by a hyphen, for example, GP-GM, SW-SC and CL-ML. For non-cohesive soils, the dual symbols must be used when the soil has between 5% and 12% fines (i.e. to identify transitional material between “clean” and “dirty” sand or gravel. For cohesive soils, the dual symbol must be used when the liquid limit and plasticity index values plot in the CL-ML area of the plasticity chart (see Plasticity Chart at left). Borderline Symbol — A borderline symbol is two symbols separated by a slash, for example, CL/CI, GM/SM, CL/ML. A borderline symbol should be used to indicate that the soil has been identified as having properties that are on the transition between similar materials. In addition, a borderline symbol may be used to or indicates a range of similar soil types within a stratum.

ABBREVIATIONS AND TERMS USED ON RECORDS OF BOREHOLES AND TEST PITS
January 2013 G-2
PARTICLE SIZES OF CONSTITUENTS
Soil Constituent
Particle Size Description
Millimetres Inches
(US Std. Sieve Size)
BOULDERS Not
Applicable >300 >12
COBBLES Not
Applicable 75 to 300 3 to 12
GRAVEL Coarse
Fine 19 to 75
4.75 to 19 0.75 to 3
(4) to 0.75
SAND Coarse Medium
Fine
2.00 to 4.75 0.425 to 2.00 0.075 to 0.425
(10) to (4) (40) to (10) (200) to (40)
SILT/CLAY Classified by
plasticity <0.075 < (200)
SAMPLES
AS Auger sample
BS Block sample
CS Chunk sample
DO or DP Seamless open ended, driven or pushed tube sampler – note size
DS Denison type sample
FS Foil sample
RC Rock core
SC Soil core
SS Split spoon sampler – note size
ST Slotted tube
TO Thin-walled, open – note size
TP Thin-walled, piston – note size
WS Wash sample
MODIFIERS FOR SECONDARY AND MINOR CONSTITUENTS
Percentage by Mass
Modifier
>35 Use 'and' to combine major constituents (i.e., SAND and GRAVEL, SAND and CLAY)
> 12 to 35 Primary soil name prefixed with "gravelly, sandy, SILTY, CLAYEY" as applicable
> 5 to 12 some
≤ 5 trace
SOIL TESTS
w water content
PL , wp plastic limit
LL , wL liquid limit
C consolidation (oedometer) test
CHEM chemical analysis (refer to text)
CID consolidated isotropically drained triaxial test1
CIU consolidated isotropically undrained triaxial test with porewater pressure measurement1
DR relative density (specific gravity, Gs)
DS direct shear test
GS specific gravity
M sieve analysis for particle size
MH combined sieve and hydrometer (H) analysis
MPC Modified Proctor compaction test
SPC Standard Proctor compaction test
OC organic content test
SO4 concentration of water-soluble sulphates
UC unconfined compression test
UU unconsolidated undrained triaxial test
V (FV) field vane (LV-laboratory vane test)
γ unit weight
1. Tests which are anisotropically consolidated prior to shear are shown as CAD, CAU.
PENETRATION RESISTANCE Standard Penetration Resistance (SPT), N: The number of blows by a 63.5 kg (140 lb) hammer dropped 760 mm (30 in.) required to drive a 50 mm (2 in.) split-spoon sampler for a distance of 300 mm (12 in.). Cone Penetration Test (CPT) An electronic cone penetrometer with a 60° conical tip and a project end area of 10 cm2 pushed through ground at a penetration rate of 2 cm/s. Measurements of tip resistance (qt), porewater pressure (u) and sleeve frictions are recorded electronically at 25 mm penetration intervals. Dynamic Cone Penetration Resistance (DCPT); Nd: The number of blows by a 63.5 kg (140 lb) hammer dropped 760 mm (30 in.) to drive uncased a 50 mm (2 in.) diameter, 60° cone attached to "A" size drill rods for a distance of 300 mm (12 in.). PH: Sampler advanced by hydraulic pressure PM: Sampler advanced by manual pressure WH: Sampler advanced by static weight of hammer WR: Sampler advanced by weight of sampler and rod
NON-COHESIVE (COHESIONLESS) SOILS COHESIVE SOILS
Compactness2 Consistency
Term SPT ‘N’ (blows/0.3m)1 Very Loose 0 - 4
Loose 4 to 10 Compact 10 to 30 Dense 30 to 50
Very Dense >50 1. SPT ‘N’ in accordance with ASTM D1586, uncorrected for overburden
pressure effects. 2. Definition of compactness descriptions based on SPT ‘N’ ranges from
Terzaghi and Peck (1967) and correspond to typical average N60 values.
Term Undrained Shear
Strength (kPa) SPT ‘N’1
(blows/0.3m) Very Soft <12 0 to 2
Soft 12 to 25 2 to 4 Firm 25 to 50 4 to 8 Stiff 50 to 100 8 to 15
Very Stiff 100 to 200 15 to 30 Hard >200 >30
1. SPT ‘N’ in accordance with ASTM D1586, uncorrected for overburden pressure effects; approximate only.
Field Moisture Condition Water Content Term Description
Dry Soil flows freely through fingers.
Moist Soils are darker than in the dry condition and may feel cool.
Wet As moist, but with free water forming on hands when handled.
Term Description
w < PL Material is estimated to be drier than the Plastic Limit.
w ~ PL Material is estimated to be close to the Plastic Limit.
w > PL Material is estimated to be wetter than the Plastic Limit.

LIST OF SYMBOLS
January 2013 G-3
Unless otherwise stated, the symbols employed in the report are as follows:
I. GENERAL (a) Index Properties (continued) w water content π 3.1416 wl or LL liquid limit ln x natural logarithm of x wp or PL plastic limit log10 x or log x, logarithm of x to base 10 lp or PI plasticity index = (wl – wp) g acceleration due to gravity ws shrinkage limit t time IL liquidity index = (w – wp) / Ip IC consistency index = (wl – w) / Ip emax void ratio in loosest state emin void ratio in densest state ID density index = (emax – e) / (emax - emin) II. STRESS AND STRAIN (formerly relative density) γ shear strain (b) Hydraulic Properties ∆ change in, e.g. in stress: ∆ σ h hydraulic head or potential ε linear strain q rate of flow εv volumetric strain v velocity of flow η coefficient of viscosity i hydraulic gradient υ Poisson’s ratio k hydraulic conductivity σ total stress (coefficient of permeability) σ′ effective stress (σ′ = σ - u) j seepage force per unit volume σ′vo initial effective overburden stress σ1, σ2, σ3
principal stress (major, intermediate, minor)
(c) Consolidation (one-dimensional)
Cc compression index σoct mean stress or octahedral stress (normally consolidated range) = (σ1 + σ2 + σ3)/3 Cr recompression index τ shear stress (over-consolidated range) u porewater pressure Cs swelling index E modulus of deformation Cα secondary compression index G shear modulus of deformation mv coefficient of volume change K bulk modulus of compressibility cv coefficient of consolidation (vertical
direction) ch coefficient of consolidation (horizontal
direction) Tv time factor (vertical direction) III. SOIL PROPERTIES U degree of consolidation σ′p pre-consolidation stress (a) Index Properties OCR over-consolidation ratio = σ′p / σ′vo ρ(γ) bulk density (bulk unit weight)* ρd(γd) dry density (dry unit weight) (d) Shear Strength ρw(γw) density (unit weight) of water τp, τr peak and residual shear strength ρs(γs) density (unit weight) of solid particles φ′ effective angle of internal friction γ′ unit weight of submerged soil δ angle of interface friction (γ′ = γ - γw) µ coefficient of friction = tan δ DR relative density (specific gravity) of solid c′ effective cohesion particles (DR = ρs / ρw) (formerly Gs) cu, su undrained shear strength (φ = 0 analysis) e void ratio p mean total stress (σ1 + σ3)/2 n porosity p′ mean effective stress (σ′1 + σ′3)/2 S degree of saturation q (σ1 - σ3)/2 or (σ′1 - σ′3)/2 qu compressive strength (σ1 - σ3) St sensitivity * Density symbol is ρ. Unit weight symbol is γ
where γ = ρg (i.e. mass density multiplied by acceleration due to gravity)
Notes: 1 2
τ = c′ + σ′ tan φ′ shear strength = (compressive strength)/2

PRELIMINARY GEOTECHNICAL INVESTIGATION GLEN ABBEY GOLF CLUB REDEVELOPMENT
October 2016 Report No. 1527072 (2000)
TABLES

PRELIMINARY GEOTECHNICAL INVESTIGATION GLEN ABBEY GOLF CLUB REDEVELOPMENT
October 2016 Report No. 1527072 (2000)
Table 1: Fill Depths and Elevations
Borehole No. Depth to Top
of Fill (m)*
Elevation of Top of Fill
(m)
Depth to Base of Fill (m)*
Elevation of Base of Fill
(m)
Fill Thickness (m)
BH2 0.3 132.9 4.0 129.2 3.8
BH3 0.1 127.0 1.4 125.7 1.3
BH5 0.6 129.9 2.9 127.6 2.3
BH6 0.3 131.1 2.7 128.7 2.4
BH7 0.1 126.9 2.1 124.9 2.1
BH9 0.6 132.6 1.4 131.8 0.8
BH13 0.2 134.2 1.4 133.0 1.2
BH15 0.1 130.3 0.7 129.6 0.6
BH16 0.4 129.1 0.7 128.8 0.3
BH17 0.4 136.4 4.4 132.4 4.1
BH20 0.4 129.9 0.7 129.6 0.3
ESA-7 0.1 132.1 4.1 128.1 4.0
* Depths measured from below existing grades

PRELIMINARY GEOTECHNICAL INVESTIGATION GLEN ABBEY GOLF CLUB REDEVELOPMENT
October 2016 Report No. 1527072 (2000)
Table 2: Till Depths and Elevations
Borehole No. Depth to Top
of Till (m)*
Elevation of Top of Till
(m)
Depth to Base of Till (m)*
Elevation of Base of Till
(m)
Till Thickness (m)
BH1 0.2 134.5 1.2 133.6 1.0
BH2 4.0 129.2 5.6 127.6 1.6
BH3 1.4 125.7 4.9 122.2 3.5
BH4 0.6 130.7 2.1 129.2 1.5
BH5 2.9 127.6 3.7 126.8 0.8
BH6 2.7 128.7 4.2 127.3 1.5
BH7 2.1 124.9 2.7 124.3 0.6
BH8 0.4 127.0 1.8 125.6 1.4
BH9 1.4 131.8 2.5 130.6 1.2
BH10 0.6 133.6 0.9 133.3 0.3
BH11 0.6 136.5 1.3 135.8 0.7
BH12 0.6 134.0 0.9 133.7 0.3
BH13 1.4 133.0 1.7 132.6 0.4
BH14 0.1 132.8 1.4 131.5 1.3
BH15 0.7 129.6 1.2 129.1 0.5
BH16 0.7 128.8 1.4 128.1 0.7
BH18 0.3 134.9 0.7 134.5 0.4
BH19 0.5 131.9 2.1 130.3 1.6
BH20 0.7 129.6 1.4 128.9 0.7
ESA-7 4.1 128.1 4.4 Below 127.7** > 0.3**
* Depths measured from below existing grades
**Borehole ESA-7 was terminated in the till deposit

PRELIMINARY GEOTECHNICAL INVESTIGATION GLEN ABBEY GOLF CLUB REDEVELOPMENT
October 2016 Report No. 1527072 (2000)
Table 3: Shale Bedrock Depths and Elevations
Borehole No. Depth to Shale
Surface (m)*
Elevation of Shale Surface
(m)
BH1 1.2 133.6
BH2 5.6 127.7
BH3 4.9 122.2
BH4 2.1 129.2
BH5 4.0 126.5
BH6 4.2 127.3
BH7 2.7 124.3
BH8 1.8 125.6
BH9 2.5 130.6
BH10 0.9 133.3
BH11 1.3 135.8
BH12 0.9 133.7
BH13 1.7 132.6
BH14 1.4 131.5
BH15 1.2 129.1
BH16 1.4 128.1
BH17 4.4 132.4
BH18 0.7 134.5
BH19 2.1 130.3
BH20 1.4 128.9
* Depths measured from below existing grades

PRELIMINARY GEOTECHNICAL INVESTIGATION GLEN ABBEY GOLF CLUB REDEVELOPMENT
October 2016 Report No. 1527072 (2000)
FIGURES

DORVAL DRIVE
UPPE
R M
IDDL
E RO
AD
STREET 'A'
STREET 'B'STREET 'C' STREET 'D'
ST. '
E'
STREET 'F'
ST. '
G'
STR
EET
'H'ST
REET
'I'
STREET 'J'
STREET 'J'
ST. 'K
'
ST. 'M
'
ST. 'N'
ST. 'O' ST. 'P'
STREET '
Q'
ST. 'R'
STREET 'S'
STREET 'S'
STR
EET
'T'
STREET 'T'
ST. '
V'
STREET 'U'STREET 'X'
STR
EET
'W'
LANE 'B'
LANE 'C'
LN. 'D'
LANE 'E
'
LANE 'F
'
LANE 'G'
GOLFVIEW C
T.
ABBEYDALE CT.
MASTERS GREEN
MASTERS GREEN
THE LINKS DR.
FAIRWAY H
ILLS
BLVD.
GREENEAGLE D
R.GALL
ERY HILL
GREENEAGLE DR.
OLD
ABBEY LANE
ROYAL OAK CT.
RAMBLER CT.
ROYAL ALBERT CT.
LEEWOOD DRIVE
ODESSA CRESCENT
McCRANERY STREET W
ST. 'L
'
LANE 'H'
STREET 'F'
LANE 'A'
LANE 'H'
BH10
BH12
BH11
BH18
BH19
BH17
BH20
BH16
BH15
BH14
BH8
BH9
BH6
BH5
BH4
BH1 BH7
BH2
BH13
BH3
ESA-7
GLEN ABBEY GOLF CLUB REDEVELOPMENT
CLUBLINK CORPORATION ULC
CONSULTANT
DESIGN
PREPARED
REVIEW
APPROVED
YYYY-MM-DD
PROJECT No. Rev.
Path
: ----
| F
ile N
ame:
152
7072
CA0
001.
dwg
025
mm
IF T
HIS
MEA
SUR
EMEN
T D
OES
NO
T M
ATC
H W
HAT
IS S
HO
WN
, TH
E SH
EET
SIZE
HAS
BEE
N M
OD
IFIE
D F
RO
M: A
NSI
B
TITLE
PROJECT
CLIENT
1527072Phase2000
Figure
1AA
2016-08-22
STB
SITE AND BOREHOLE LOCATION PLAN
REFERENCES
PLAN LEGEND
KEY PLAN
Plan Concept overlies ESRI Geography Network OBM Features. Concept Plan is approximated toorthographic Image and OBM features.Version Glen Abbey Concept Plan August 2016.
Borehole Locations Surveyed by Fiddes Clipsham Inc. on February 24, 2016.
1:5000
100 200 300 m0
Plotted 11x17" Tabloid Projection is UTM NAD 83 Zone 17
KEY PLAN 1:50000 m
QUEEN E
LIZAB
ETH W
AY / 4
03
QUEEN E
LIZAB
ETH W
AY / 4
03
QUEEN E
LIZAB
ETH W
AY / 4
03
QUEEN E
LIZAB
ETH W
AY / 4
03
QUEEN E
LIZAB
ETH W
AY / 4
03
QUEEN E
LIZAB
ETH W
AY / 4
03
QUEEN E
LIZAB
ETH W
AY / 4
03
QUEEN E
LIZAB
ETH W
AY / 4
03
QUEEN E
LIZAB
ETH W
AY / 4
03
QUEEN E
LIZAB
ETH W
AY / 4
03
QUEEN E
LIZAB
ETH W
AY / 4
03
QUEEN E
LIZAB
ETH W
AY / 4
03
QUEEN E
LIZAB
ETH W
AY / 4
03
QUEEN E
LIZAB
ETH W
AY / 4
03
QUEEN E
LIZAB
ETH W
AY / 4
03
QUEEN E
LIZAB
ETH W
AY / 4
03
QUEEN E
LIZAB
ETH W
AY / 4
03DORVAL DR.
DORVAL DR.
DORVAL DR.
DORVAL DR.
DORVAL DR.
DORVAL DR.
DORVAL DR.
DORVAL DR.
DORVAL DR.
DORVAL DR.
DORVAL DR.
DORVAL DR.
DORVAL DR.
DORVAL DR.
DORVAL DR.
DORVAL DR.
DORVAL DR.
UPPER
MID
DLE R
D. W / 3
8
UPPER
MID
DLE R
D. W / 3
8
UPPER
MID
DLE R
D. W / 3
8
UPPER
MID
DLE R
D. W / 3
8
UPPER
MID
DLE R
D. W / 3
8
UPPER
MID
DLE R
D. W / 3
8
UPPER
MID
DLE R
D. W / 3
8
UPPER
MID
DLE R
D. W / 3
8
UPPER
MID
DLE R
D. W / 3
8
UPPER
MID
DLE R
D. W / 3
8
UPPER
MID
DLE R
D. W / 3
8
UPPER
MID
DLE R
D. W / 3
8
UPPER
MID
DLE R
D. W / 3
8
UPPER
MID
DLE R
D. W / 3
8
UPPER
MID
DLE R
D. W / 3
8
UPPER
MID
DLE R
D. W / 3
8
UPPER
MID
DLE R
D. W / 3
8
NEYAGAWANEYAGAWANEYAGAWANEYAGAWANEYAGAWANEYAGAWANEYAGAWANEYAGAWANEYAGAWANEYAGAWANEYAGAWANEYAGAWANEYAGAWANEYAGAWANEYAGAWANEYAGAWANEYAGAWA BLVD.BLVD.BLVD.BLVD.BLVD.BLVD.BLVD.BLVD.BLVD.BLVD.BLVD.BLVD.BLVD.BLVD.BLVD.BLVD.BLVD.
DEVELOPMENT BOUNDARY
BOREHOLE LOCATION
svodden
Typewritten Text
NLP

Glen Abbey Golf Club Redevelopment Slope A - Slope Stability Analysis (Static)
Figure 2
April 15, 2016 Analysis by: Rafael Abdulla Project No: 1527072 (2000) Reviewed by: Sarah Poot

Glen Abbey Golf Club Redevelopment Slope B - Slope Stability Analysis (Static)
Figure 3
April 15, 2016 Analysis by: Rafael Abdulla Project No: 1527072 (2000) Reviewed by: Sarah Poot

Glen Abbey Golf Club Redevelopment Slope C - Slope Stability Analysis (Static)
Figure 4
April 15, 2016 Analysis by: Rafael Abdulla Project No: 1527072 (2000) Reviewed by: Sarah Poot

Glen Abbey Golf Club Redevelopment Slope D - Slope Stability Analysis (Static)
Figure 5
April 15, 2016 Analysis by: Rafael Abdulla Project No: 1527072 (2000) Reviewed by: Sarah Poot

CONSULTANT
DESIGN
PREPARED
REVIEW
APPROVED
YYYY-MM-DD TITLE
PROJECT No. Rev.
PROJECTCLIENT
Path
: ----
| F
ile N
ame:
152
7072
_000
1_BG
_000
1.dw
g
025
mm
IF T
HIS
MEA
SUR
EMEN
T D
OES
NO
T M
ATC
H W
HAT
IS S
HO
WN
, TH
E SH
EET
SIZE
HAS
BEE
N M
OD
IFIE
D F
RO
M: A
NSI
B
1527072PHASE FIGURE
62
2016-04-15
STB
NLP
SK
GLEN ABBEY GOLF CLUB REDEVELOPMENTOAKVILLE, ONTARIO
CLUBLINK CORPORATION ULC
SLOPE SETBACK ANALYSIS
0
1:6,000 METRES
200100
TOP OF STABLE SLOPE
PROPERTY BOUNDARIES
LEGEND
REFERENCE
BASE PLAN RECEIVED IN AN E-MAIL FROM SCS CONSULTING GROUP, DATED APRIL 10, 2015.
BOREHOLE LOCATION

PRELIMINARY GEOTECHNICAL INVESTIGATION GLEN ABBEY GOLF CLUB REDEVELOPMENT
October 2016 Report No. 1527072 (2000)
APPENDIX A Record of Borehole Sheets

Tra
ck M
ount
CM
E 5
5
DO
DO
DO
DO
DO
DO
1
2
3
4
5
6
7
42
50/152mm
50/76
mm
50/76
mm
50/102mm
MH
6" O
/D S
oild
Ste
m A
uger
TOPSOIL
(CL) SILTY CLAY, some sand; reddishbrown to grey, (REWORKED TILL);cohesive, w<PL, firm
(CL) SILTY CLAY, some sand, reddishbrown, (TILL); cohesive, w<PL, hard
SHALE (BEDROCK)Thinly beddedFine grainedRed
End of Borehole
NOTE:
1. Borehole dry upon completion ofdrilling on January 26, 2016.2. Groundwater measured at a depth of2.7 m below existing grade on February22, 2016.
0.20
0.61
1.17
4.67
134.54
134.13
133.57
130.07
Casing
#2 Silica Sand
Hole Plug
#2 Silica Sand
10 Slot PVC Screen
February 22, 2016
TY
PE
BORING DATE: January 26, 2016
NU
MB
ER
Wl
PIEZOMETEROR
STANDPIPEINSTALLATION
HYDRAULIC CONDUCTIVITY, k, cm/s
Wp W
WATER CONTENT PERCENT
BO
RIN
G M
ET
HO
D
ELEV.
AD
DIT
ION
AL
LAB
. TE
ST
ING
SOIL PROFILE
ST
RA
TA
PLO
T
BLO
WS
/0.3
m 10-6 10-5 10-4 10-3
10 20 30 40
SHEET 1 OF 1
SPT/DCPT HAMMER: MASS, 64kg; DROP, 760mm
RECORD OF BOREHOLE: BH1
SAMPLES
DEPTH(m)
DESCRIPTION
GROUND SURFACE
LOGGED:
CHECKED:
DATUM: Geodetic
PROJECT: 1527072 (2000)
LOCATION: See Figure 1
CL
0.00134.74
DEPTH SCALE
1 : 50
DE
PT
H S
CA
LEM
ET
RE
S
0
1
2
3
4
5
6
7
8
9
10
NL
GT
A-B
HS
001
S
:\CLI
EN
TS
\CLU
BLI
NK
\OA
KV
ILLE
_GLE
N_A
BB
EY
_GO
LF_C
OU
RS
E\0
2_D
AT
A\G
INT
\152
707
2-B
G-0
001.
GP
J G
AL-
MIS
.GD
T 4
-19
-16
ST
B
DYNAMIC PENETRATIONRESISTANCE, BLOWS/0.3m
20 40 60 80
SHEAR STRENGTHCu, kPa
20 40 60 80
Q -U -
nat V.rem V.

Tra
ck M
ount
CM
E 5
5
DO
DO
DO
DO
DO
DO
DO
DO
1
2
3
4
5
6
7
8
7
12
26
14
8
11
10
43
MH
6" O
/D S
oild
Ste
m A
uger
TOPSOIL
FILL-(SW) SAND, trace silt; brown;non-cohesive, moist, looseFILL-(CL) SILTY CLAY, some sand andgravel, organics, silt seams, shalefragments; reddish brown to greyishbrown to brown; cohesive, w<PL, firm tostiff to very stiff
FILL-(SM) SILTY SAND; brown;non-cohesive, moist, compact
FILL-(CL) SILTY CLAY, some sand,some gravel to gravelly, organics, sandseams, shale fragments; reddish brownto brown to grey; cohesive, w~PL tow<PL, stiff
(CL-MH) SILTY CLAY to CLAYEY SILT;grey to reddish brown, (TILL); cohesive,w<PL, stiff
SHALE (BEDROCK)Thinly beddedFine grainedRed
End of Borehole
NOTE:
1. Groundwater measured at a depth of2.3 m in open borehole upon completionof drilling on January 26, 2016.2. Groundwater measured at a depth of1.9 m below existing grade on February16, 2016.
0.280.38
1.73
2.13
4.04
5.56
6.55
132.94
131.49
131.09
129.18
127.66
126.67
Casing
#2 Silica Sand
Hole Plug
#2 Silica Sand
10 Slot PVC Screen
February 16, 2016T
YP
E
BORING DATE: January 26, 2016
NU
MB
ER
Wl
PIEZOMETEROR
STANDPIPEINSTALLATION
HYDRAULIC CONDUCTIVITY, k, cm/s
Wp W
WATER CONTENT PERCENT
BO
RIN
G M
ET
HO
D
ELEV.
AD
DIT
ION
AL
LAB
. TE
ST
ING
SOIL PROFILE
ST
RA
TA
PLO
T
BLO
WS
/0.3
m 10-6 10-5 10-4 10-3
10 20 30 40
SHEET 1 OF 1
SPT/DCPT HAMMER: MASS, 64kg; DROP, 760mm
RECORD OF BOREHOLE: BH2
SAMPLES
DEPTH(m)
DESCRIPTION
GROUND SURFACE
LOGGED:
CHECKED:
DATUM: Geodetic
PROJECT: 1527072 (2000)
LOCATION: See Figure 1
CL
0.00133.22
DEPTH SCALE
1 : 50
DE
PT
H S
CA
LEM
ET
RE
S
0
1
2
3
4
5
6
7
8
9
10
NL
GT
A-B
HS
001
S
:\CLI
EN
TS
\CLU
BLI
NK
\OA
KV
ILLE
_GLE
N_A
BB
EY
_GO
LF_C
OU
RS
E\0
2_D
AT
A\G
INT
\152
707
2-B
G-0
001.
GP
J G
AL-
MIS
.GD
T 4
-19
-16
ST
B
DYNAMIC PENETRATIONRESISTANCE, BLOWS/0.3m
20 40 60 80
SHEAR STRENGTHCu, kPa
20 40 60 80
Q -U -
nat V.rem V.
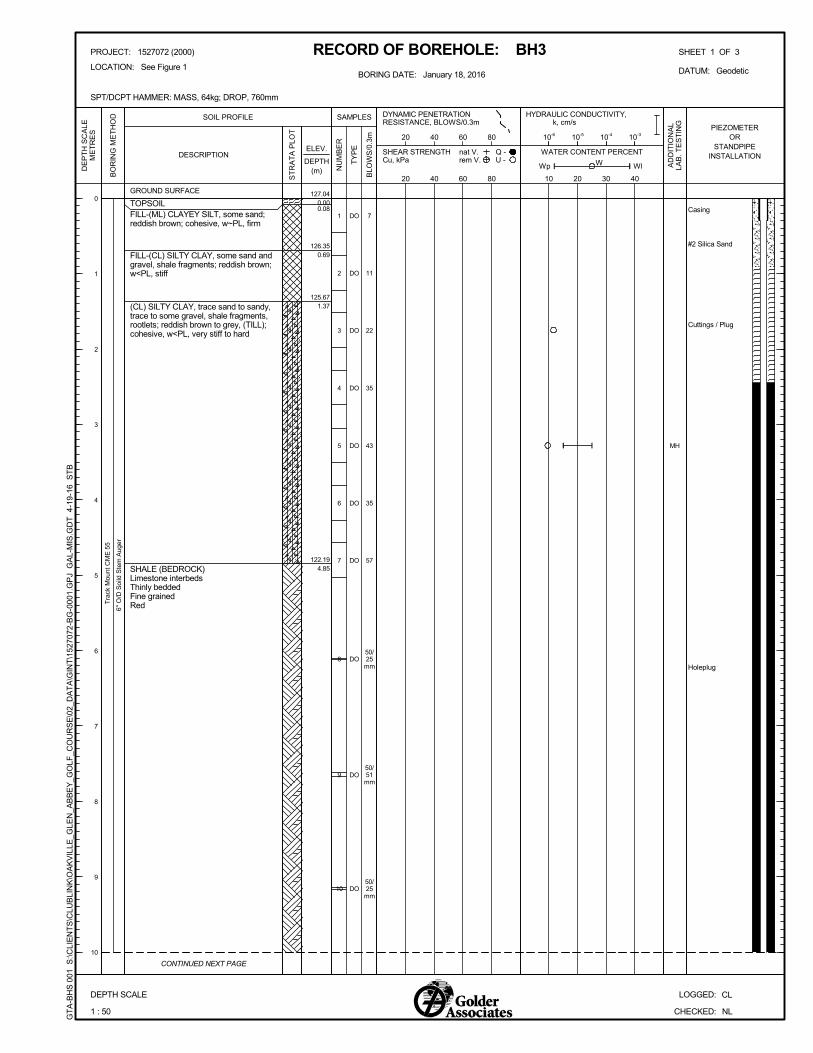
Tra
ck M
ount
CM
E 5
5
DO
DO
DO
DO
DO
DO
DO
DO
DO
DO
1
2
3
4
5
6
7
8
9
10
7
11
22
35
43
35
57
50/25
mm
50/51
mm
50/25
mm
MH
6" O
/D S
oild
Ste
m A
uger
TOPSOILFILL-(ML) CLAYEY SILT, some sand;reddish brown; cohesive, w~PL, firm
FILL-(CL) SILTY CLAY, some sand andgravel, shale fragments; reddish brown;w<PL, stiff
(CL) SILTY CLAY, trace sand to sandy,trace to some gravel, shale fragments,rootlets; reddish brown to grey, (TILL);cohesive, w<PL, very stiff to hard
SHALE (BEDROCK)Limestone interbedsThinly beddedFine grainedRed
0.08
0.69
1.37
4.85
126.35
125.67
122.19
Casing
#2 Silica Sand
Cuttings / Plug
Holeplug
TY
PE
BORING DATE: January 18, 2016
NU
MB
ER
Wl
PIEZOMETEROR
STANDPIPEINSTALLATION
HYDRAULIC CONDUCTIVITY, k, cm/s
Wp W
WATER CONTENT PERCENT
BO
RIN
G M
ET
HO
D
ELEV.
AD
DIT
ION
AL
LAB
. TE
ST
ING
SOIL PROFILE
ST
RA
TA
PLO
T
BLO
WS
/0.3
m 10-6 10-5 10-4 10-3
10 20 30 40
SHEET 1 OF 3
SPT/DCPT HAMMER: MASS, 64kg; DROP, 760mm
RECORD OF BOREHOLE: BH3
SAMPLES
DEPTH(m)
DESCRIPTION
GROUND SURFACE
CONTINUED NEXT PAGE
LOGGED:
CHECKED:
DATUM: Geodetic
PROJECT: 1527072 (2000)
LOCATION: See Figure 1
CL
0.00127.04
DEPTH SCALE
1 : 50
DE
PT
H S
CA
LEM
ET
RE
S
0
1
2
3
4
5
6
7
8
9
10
NL
GT
A-B
HS
001
S
:\CLI
EN
TS
\CLU
BLI
NK
\OA
KV
ILLE
_GLE
N_A
BB
EY
_GO
LF_C
OU
RS
E\0
2_D
AT
A\G
INT
\152
707
2-B
G-0
001.
GP
J G
AL-
MIS
.GD
T 4
-19
-16
ST
B
DYNAMIC PENETRATIONRESISTANCE, BLOWS/0.3m
20 40 60 80
SHEAR STRENGTHCu, kPa
20 40 60 80
Q -U -
nat V.rem V.

Tra
ck M
ount
CM
E 5
5T
rack
Mou
nt C
ME
55
DO
DO
DO
DO
11
12
13
14
50/25
mm
50/25
mm
50/76
mm
50/51
mm
6" O
/D S
oild
Ste
m A
uger
Air
Rot
ary
SHALE (BEDROCK)Limestone interbedsThinly beddedFine grainedRed
Holeplug
TY
PE
BORING DATE: January 18, 2016
NU
MB
ER
Wl
PIEZOMETEROR
STANDPIPEINSTALLATION
HYDRAULIC CONDUCTIVITY, k, cm/s
Wp W
WATER CONTENT PERCENT
BO
RIN
G M
ET
HO
D
ELEV.
AD
DIT
ION
AL
LAB
. TE
ST
ING
SOIL PROFILE
ST
RA
TA
PLO
T
BLO
WS
/0.3
m 10-6 10-5 10-4 10-3
10 20 30 40
SHEET 2 OF 3
SPT/DCPT HAMMER: MASS, 64kg; DROP, 760mm
RECORD OF BOREHOLE: BH3
SAMPLES
DEPTH(m)
DESCRIPTION
CONTINUED NEXT PAGE
LOGGED:
CHECKED:
--- CONTINUED FROM PREVIOUS PAGE ---
DATUM: Geodetic
PROJECT: 1527072 (2000)
LOCATION: See Figure 1
CLDEPTH SCALE
1 : 50
DE
PT
H S
CA
LEM
ET
RE
S
10
11
12
13
14
15
16
17
18
19
20
NL
GT
A-B
HS
001
S
:\CLI
EN
TS
\CLU
BLI
NK
\OA
KV
ILLE
_GLE
N_A
BB
EY
_GO
LF_C
OU
RS
E\0
2_D
AT
A\G
INT
\152
707
2-B
G-0
001.
GP
J G
AL-
MIS
.GD
T 4
-19
-16
ST
B
DYNAMIC PENETRATIONRESISTANCE, BLOWS/0.3m
20 40 60 80
SHEAR STRENGTHCu, kPa
20 40 60 80
Q -U -
nat V.rem V.

Tra
ck M
ount
CM
E 5
5
Air
Rot
ary
SHALE (BEDROCK)Limestone interbedsThinly beddedFine grainedRed
End of Borehole
NOTE:
1. Groundwater measured at a depth of22.7 m in open borehole uponcompletion of drilling on January 18,2016.2. Groundwater measured at a depth of21.2 m below existing grade on February16, 2016.
26.21100.83
Holeplug
#2 Silica Sand
10 Slot PVC Screen
February 16, 2016
TY
PE
BORING DATE: January 18, 2016
NU
MB
ER
Wl
PIEZOMETEROR
STANDPIPEINSTALLATION
HYDRAULIC CONDUCTIVITY, k, cm/s
Wp W
WATER CONTENT PERCENT
BO
RIN
G M
ET
HO
D
ELEV.
AD
DIT
ION
AL
LAB
. TE
ST
ING
SOIL PROFILE
ST
RA
TA
PLO
T
BLO
WS
/0.3
m 10-6 10-5 10-4 10-3
10 20 30 40
SHEET 3 OF 3
SPT/DCPT HAMMER: MASS, 64kg; DROP, 760mm
RECORD OF BOREHOLE: BH3
SAMPLES
DEPTH(m)
DESCRIPTION
LOGGED:
CHECKED:
--- CONTINUED FROM PREVIOUS PAGE ---
DATUM: Geodetic
PROJECT: 1527072 (2000)
LOCATION: See Figure 1
CLDEPTH SCALE
1 : 50
DE
PT
H S
CA
LEM
ET
RE
S
20
21
22
23
24
25
26
27
28
29
30
NL
GT
A-B
HS
001
S
:\CLI
EN
TS
\CLU
BLI
NK
\OA
KV
ILLE
_GLE
N_A
BB
EY
_GO
LF_C
OU
RS
E\0
2_D
AT
A\G
INT
\152
707
2-B
G-0
001.
GP
J G
AL-
MIS
.GD
T 4
-19
-16
ST
B
DYNAMIC PENETRATIONRESISTANCE, BLOWS/0.3m
20 40 60 80
SHEAR STRENGTHCu, kPa
20 40 60 80
Q -U -
nat V.rem V.

Tra
ck M
ount
CM
E 5
5
DO
DO
DO
DO
DO
DO
1
2
3
4
5
6
8
14
45
71
50/76
mm
50/152mm
6" O
/D S
oild
Ste
m A
uger
TOPSOIL
(CL) SILTY CLAY, trace sand, siltseams; mottled reddish brown grey,(REWORKED TILL); cohesive, w<PL,stiff(CL) SILTY CLAY, trace to some sand,shale fragments; reddish brown, (TILL);cohesive, w<PL, stiff to hard
SHALE (BEDROCK)Limestone interbedsThinly beddedFine grainedRed
End of Borehole
NOTE:
1. Borehole dry upon completion ofdrilling on January 26, 2016.
0.61
1.09
2.13
4.72
130.70
130.22
129.18
126.59
TY
PE
BORING DATE: January 26, 2016
NU
MB
ER
Wl
PIEZOMETEROR
STANDPIPEINSTALLATION
HYDRAULIC CONDUCTIVITY, k, cm/s
Wp W
WATER CONTENT PERCENT
BO
RIN
G M
ET
HO
D
ELEV.
AD
DIT
ION
AL
LAB
. TE
ST
ING
SOIL PROFILE
ST
RA
TA
PLO
T
BLO
WS
/0.3
m 10-6 10-5 10-4 10-3
10 20 30 40
SHEET 1 OF 1
SPT/DCPT HAMMER: MASS, 64kg; DROP, 760mm
RECORD OF BOREHOLE: BH4
SAMPLES
DEPTH(m)
DESCRIPTION
GROUND SURFACE
LOGGED:
CHECKED:
DATUM: Geodetic
PROJECT: 1527072 (2000)
LOCATION: See Figure 1
CL
0.00131.31
DEPTH SCALE
1 : 50
DE
PT
H S
CA
LEM
ET
RE
S
0
1
2
3
4
5
6
7
8
9
10
NL
GT
A-B
HS
001
S
:\CLI
EN
TS
\CLU
BLI
NK
\OA
KV
ILLE
_GLE
N_A
BB
EY
_GO
LF_C
OU
RS
E\0
2_D
AT
A\G
INT
\152
707
2-B
G-0
001.
GP
J G
AL-
MIS
.GD
T 4
-19
-16
ST
B
DYNAMIC PENETRATIONRESISTANCE, BLOWS/0.3m
20 40 60 80
SHEAR STRENGTHCu, kPa
20 40 60 80
Q -U -
nat V.rem V.

Tra
ck M
ount
CM
E 5
5T
rack
Mou
nt C
ME
55
DO
DO
DO
DO
DO
DO
DO
1
2
3
4
5
6
7
6
17
14
7
11
54
50/102mm
M
MH
MH
6" O
/D S
oild
Ste
m A
uger
Air
Rot
ary
TOPSOIL
FILL-(CL) SILTY CLAY, sand and gravelseam; brown; cohesive, w<PL, very stiff
FILL-(ML) SANDY SILT; brown;non-cohesive, moist, compact
FILL-(ML) SILT, trace sand, some plasticfines; reddish brown; non-cohesive,moist, loose
(CL) SILTY CLAY, trace sand; reddishbrown to grey, (REWORKED TILL);cohesive, w~PL, stiff
(CL) SILTY CLAY and SAND, tracegravel, limestone fragments; reddishbrown, (TILL); cohesive, w<PL, hardSHALE (BEDROCK)Limestone interbedsThinly beddedFine grainedRed
0.61
1.37
2.13
2.90
3.66
3.99
129.89
129.13
128.37
127.60
126.84
126.51
#2 Silica Sand
Hole Plug
TY
PE
BORING DATE: January 20, 2016
NU
MB
ER
Wl
PIEZOMETEROR
STANDPIPEINSTALLATION
HYDRAULIC CONDUCTIVITY, k, cm/s
Wp W
WATER CONTENT PERCENT
BO
RIN
G M
ET
HO
D
ELEV.
AD
DIT
ION
AL
LAB
. TE
ST
ING
SOIL PROFILE
ST
RA
TA
PLO
T
BLO
WS
/0.3
m 10-6 10-5 10-4 10-3
10 20 30 40
SHEET 1 OF 3
SPT/DCPT HAMMER: MASS, 64kg; DROP, 760mm
RECORD OF BOREHOLE: BH5
SAMPLES
DEPTH(m)
DESCRIPTION
GROUND SURFACE
CONTINUED NEXT PAGE
LOGGED:
CHECKED:
DATUM: Geodetic
PROJECT: 1527072 (2000)
LOCATION: See Figure 1
CL
0.00130.50
DEPTH SCALE
1 : 50
DE
PT
H S
CA
LEM
ET
RE
S
0
1
2
3
4
5
6
7
8
9
10
NL
GT
A-B
HS
001
S
:\CLI
EN
TS
\CLU
BLI
NK
\OA
KV
ILLE
_GLE
N_A
BB
EY
_GO
LF_C
OU
RS
E\0
2_D
AT
A\G
INT
\152
707
2-B
G-0
001.
GP
J G
AL-
MIS
.GD
T 4
-19
-16
ST
B
DYNAMIC PENETRATIONRESISTANCE, BLOWS/0.3m
20 40 60 80
SHEAR STRENGTHCu, kPa
20 40 60 80
Q -U -
nat V.rem V.

Tra
ck M
ount
CM
E 5
5
Air
Rot
ary
SHALE (BEDROCK)Limestone interbedsThinly beddedFine grainedRed
Hole Plug
TY
PE
BORING DATE: January 20, 2016
NU
MB
ER
Wl
PIEZOMETEROR
STANDPIPEINSTALLATION
HYDRAULIC CONDUCTIVITY, k, cm/s
Wp W
WATER CONTENT PERCENT
BO
RIN
G M
ET
HO
D
ELEV.
AD
DIT
ION
AL
LAB
. TE
ST
ING
SOIL PROFILE
ST
RA
TA
PLO
T
BLO
WS
/0.3
m 10-6 10-5 10-4 10-3
10 20 30 40
SHEET 2 OF 3
SPT/DCPT HAMMER: MASS, 64kg; DROP, 760mm
RECORD OF BOREHOLE: BH5
SAMPLES
DEPTH(m)
DESCRIPTION
CONTINUED NEXT PAGE
LOGGED:
CHECKED:
--- CONTINUED FROM PREVIOUS PAGE ---
DATUM: Geodetic
PROJECT: 1527072 (2000)
LOCATION: See Figure 1
CLDEPTH SCALE
1 : 50
DE
PT
H S
CA
LEM
ET
RE
S
10
11
12
13
14
15
16
17
18
19
20
NL
GT
A-B
HS
001
S
:\CLI
EN
TS
\CLU
BLI
NK
\OA
KV
ILLE
_GLE
N_A
BB
EY
_GO
LF_C
OU
RS
E\0
2_D
AT
A\G
INT
\152
707
2-B
G-0
001.
GP
J G
AL-
MIS
.GD
T 4
-19
-16
ST
B
DYNAMIC PENETRATIONRESISTANCE, BLOWS/0.3m
20 40 60 80
SHEAR STRENGTHCu, kPa
20 40 60 80
Q -U -
nat V.rem V.

Tra
ck M
ount
CM
E 5
5
Air
Rot
ary
SHALE (BEDROCK)Limestone interbedsThinly beddedFine grainedRed
End of Borehole
NOTE:
1. Groundwater measured at a depth of24.2 m in open borehole uponcompletion of drilling on January 20,2016.2. Groundwater measured at a depth of24.1 m below existing grade on February16, 2016.
28.04102.46
Hole Plug
#2 Silica Sand
10 Slot PVC Screen
February 16, 2016
TY
PE
BORING DATE: January 20, 2016
NU
MB
ER
Wl
PIEZOMETEROR
STANDPIPEINSTALLATION
HYDRAULIC CONDUCTIVITY, k, cm/s
Wp W
WATER CONTENT PERCENT
BO
RIN
G M
ET
HO
D
ELEV.
AD
DIT
ION
AL
LAB
. TE
ST
ING
SOIL PROFILE
ST
RA
TA
PLO
T
BLO
WS
/0.3
m 10-6 10-5 10-4 10-3
10 20 30 40
SHEET 3 OF 3
SPT/DCPT HAMMER: MASS, 64kg; DROP, 760mm
RECORD OF BOREHOLE: BH5
SAMPLES
DEPTH(m)
DESCRIPTION
LOGGED:
CHECKED:
--- CONTINUED FROM PREVIOUS PAGE ---
DATUM: Geodetic
PROJECT: 1527072 (2000)
LOCATION: See Figure 1
CLDEPTH SCALE
1 : 50
DE
PT
H S
CA
LEM
ET
RE
S
20
21
22
23
24
25
26
27
28
29
30
NL
GT
A-B
HS
001
S
:\CLI
EN
TS
\CLU
BLI
NK
\OA
KV
ILLE
_GLE
N_A
BB
EY
_GO
LF_C
OU
RS
E\0
2_D
AT
A\G
INT
\152
707
2-B
G-0
001.
GP
J G
AL-
MIS
.GD
T 4
-19
-16
ST
B
DYNAMIC PENETRATIONRESISTANCE, BLOWS/0.3m
20 40 60 80
SHEAR STRENGTHCu, kPa
20 40 60 80
Q -U -
nat V.rem V.

Tra
ck M
ount
CM
E 5
5
DO
DO
DO
DO
DO
DO
DO
1
2
3
4
5
6
7
9
5
7
8
19
24
50/25
mm
M
MH
6" O
/D S
oild
Ste
m A
uger
TOPSOIL
FILL-(CL) SILTY CLAY, some sand andgravel; reddish brown to grey; cohesive,w<PL to w~PL, stiff to firm
FILL-(SM) SILTY SAND, trace to somegravel; brown; non-cohesive, moist,loose
(ML-CL) CLAYEY SILT to SILTY CLAY,trace to some sand; brown, (TILL);cohesive, w<PL, very stiff
SHALE (BEDROCK)Thinly beddedFine grainedRedEnd of Borehole
NOTE:
1. Groundwater measured at a depth of2.6 m in open borehole upon completionof drilling on January 20, 2016.
0.30
1.52
2.69
4.17
4.60
131.13
129.91
128.74
127.26
126.83
TY
PE
BORING DATE: January 20, 2016
NU
MB
ER
Wl
PIEZOMETEROR
STANDPIPEINSTALLATION
HYDRAULIC CONDUCTIVITY, k, cm/s
Wp W
WATER CONTENT PERCENT
BO
RIN
G M
ET
HO
D
ELEV.
AD
DIT
ION
AL
LAB
. TE
ST
ING
SOIL PROFILE
ST
RA
TA
PLO
T
BLO
WS
/0.3
m 10-6 10-5 10-4 10-3
10 20 30 40
SHEET 1 OF 1
SPT/DCPT HAMMER: MASS, 64kg; DROP, 760mm
RECORD OF BOREHOLE: BH6
SAMPLES
DEPTH(m)
DESCRIPTION
GROUND SURFACE
LOGGED:
CHECKED:
DATUM: Geodetic
PROJECT: 1527072 (2000)
LOCATION: See Figure 1
CL
0.00131.43
DEPTH SCALE
1 : 50
DE
PT
H S
CA
LEM
ET
RE
S
0
1
2
3
4
5
6
7
8
9
10
NL
GT
A-B
HS
001
S
:\CLI
EN
TS
\CLU
BLI
NK
\OA
KV
ILLE
_GLE
N_A
BB
EY
_GO
LF_C
OU
RS
E\0
2_D
AT
A\G
INT
\152
707
2-B
G-0
001.
GP
J G
AL-
MIS
.GD
T 4
-19
-16
ST
B
DYNAMIC PENETRATIONRESISTANCE, BLOWS/0.3m
20 40 60 80
SHEAR STRENGTHCu, kPa
20 40 60 80
Q -U -
nat V.rem V.

Tra
ck M
ount
CM
E 5
5T
rack
Mou
nt C
ME
55
DO
DO
DO
DO
DO
1
2
3
4
5
26
5
4
27
50/76
mm
MH
6" O
/D S
oild
Ste
m A
uger
HQ
Cor
ing
TOPSOILFILL-(SP/GP) SAND and GRAVEL;grey; non-cohesive, moist, compact
FILL-(CL) SILTY CLAY, some sand andgravel; reddish brown; cohesive, w<PL,firm
FILL-(CL) sandy SILTY CLAY, somegravel; reddish brown; cohesive, w<PL,firm
(CL) SILTY CLAY, some sand; reddishbrown to brown, (REWORKED TILL);cohesive, w<PL, very stiff
SHALE (BEDROCK)Thinly beddedFine grainedRedFor Rock Core Details, see Record ofDrillhole BH7
0.08
0.64
1.37
2.13
2.72
3.12
126.37
125.64
124.88
124.29
123.89
#2 Silica Sand
Hole Plug
TY
PE
BORING DATE: January 21, 2016
NU
MB
ER
Wl
PIEZOMETEROR
STANDPIPEINSTALLATION
HYDRAULIC CONDUCTIVITY, k, cm/s
Wp W
WATER CONTENT PERCENT
BO
RIN
G M
ET
HO
D
ELEV.
AD
DIT
ION
AL
LAB
. TE
ST
ING
SOIL PROFILE
ST
RA
TA
PLO
T
BLO
WS
/0.3
m 10-6 10-5 10-4 10-3
10 20 30 40
SHEET 1 OF 3
SPT/DCPT HAMMER: MASS, 64kg; DROP, 760mm
RECORD OF BOREHOLE: BH7
SAMPLES
DEPTH(m)
DESCRIPTION
GROUND SURFACE
CONTINUED NEXT PAGE
LOGGED:
CHECKED:
DATUM: Geodetic
PROJECT: 1527072 (2000)
LOCATION: See Figure 1
CL
0.00127.01
DEPTH SCALE
1 : 50
DE
PT
H S
CA
LEM
ET
RE
S
0
1
2
3
4
5
6
7
8
9
10
NL
GT
A-B
HS
001
S
:\CLI
EN
TS
\CLU
BLI
NK
\OA
KV
ILLE
_GLE
N_A
BB
EY
_GO
LF_C
OU
RS
E\0
2_D
AT
A\G
INT
\152
707
2-B
G-0
001.
GP
J G
AL-
MIS
.GD
T 4
-19
-16
ST
B
DYNAMIC PENETRATIONRESISTANCE, BLOWS/0.3m
20 40 60 80
SHEAR STRENGTHCu, kPa
20 40 60 80
Q -U -
nat V.rem V.

Tra
ck M
ount
CM
E 5
5
HQ
Cor
ing
For Rock Core Details, see Record ofDrillhole BH7
Hole Plug
TY
PE
BORING DATE: January 21, 2016
NU
MB
ER
Wl
PIEZOMETEROR
STANDPIPEINSTALLATION
HYDRAULIC CONDUCTIVITY, k, cm/s
Wp W
WATER CONTENT PERCENT
BO
RIN
G M
ET
HO
D
ELEV.
AD
DIT
ION
AL
LAB
. TE
ST
ING
SOIL PROFILE
ST
RA
TA
PLO
T
BLO
WS
/0.3
m 10-6 10-5 10-4 10-3
10 20 30 40
SHEET 2 OF 3
SPT/DCPT HAMMER: MASS, 64kg; DROP, 760mm
RECORD OF BOREHOLE: BH7
SAMPLES
DEPTH(m)
DESCRIPTION
CONTINUED NEXT PAGE
LOGGED:
CHECKED:
--- CONTINUED FROM PREVIOUS PAGE ---
DATUM: Geodetic
PROJECT: 1527072 (2000)
LOCATION: See Figure 1
CLDEPTH SCALE
1 : 50
DE
PT
H S
CA
LEM
ET
RE
S
10
11
12
13
14
15
16
17
18
19
20
NL
GT
A-B
HS
001
S
:\CLI
EN
TS
\CLU
BLI
NK
\OA
KV
ILLE
_GLE
N_A
BB
EY
_GO
LF_C
OU
RS
E\0
2_D
AT
A\G
INT
\152
707
2-B
G-0
001.
GP
J G
AL-
MIS
.GD
T 4
-19
-16
ST
B
DYNAMIC PENETRATIONRESISTANCE, BLOWS/0.3m
20 40 60 80
SHEAR STRENGTHCu, kPa
20 40 60 80
Q -U -
nat V.rem V.

Tra
ck M
ount
CM
E 5
5
HQ
Cor
ing
For Rock Core Details, see Record ofDrillhole BH7
NOTE:
1. Groundwater measured at a depth of25.6 m in open borehole uponcompletion of drilling on January 21,2016.2. Groundwater measured at a depth of26.9 m below existing grade on February16, 2016.
End of Borehole 29.4197.60
Hole Plug
#2 Silica Sand
10 Slot PVC Screen
February 16, 2016
TY
PE
BORING DATE: January 21, 2016
NU
MB
ER
Wl
PIEZOMETEROR
STANDPIPEINSTALLATION
HYDRAULIC CONDUCTIVITY, k, cm/s
Wp W
WATER CONTENT PERCENT
BO
RIN
G M
ET
HO
D
ELEV.
AD
DIT
ION
AL
LAB
. TE
ST
ING
SOIL PROFILE
ST
RA
TA
PLO
T
BLO
WS
/0.3
m 10-6 10-5 10-4 10-3
10 20 30 40
SHEET 3 OF 3
SPT/DCPT HAMMER: MASS, 64kg; DROP, 760mm
RECORD OF BOREHOLE: BH7
SAMPLES
DEPTH(m)
DESCRIPTION
LOGGED:
CHECKED:
--- CONTINUED FROM PREVIOUS PAGE ---
DATUM: Geodetic
PROJECT: 1527072 (2000)
LOCATION: See Figure 1
CLDEPTH SCALE
1 : 50
DE
PT
H S
CA
LEM
ET
RE
S
20
21
22
23
24
25
26
27
28
29
30
NL
GT
A-B
HS
001
S
:\CLI
EN
TS
\CLU
BLI
NK
\OA
KV
ILLE
_GLE
N_A
BB
EY
_GO
LF_C
OU
RS
E\0
2_D
AT
A\G
INT
\152
707
2-B
G-0
001.
GP
J G
AL-
MIS
.GD
T 4
-19
-16
ST
B
DYNAMIC PENETRATIONRESISTANCE, BLOWS/0.3m
20 40 60 80
SHEAR STRENGTHCu, kPa
20 40 60 80
Q -U -
nat V.rem V.

Tra
ck M
ount
CM
E 5
5
DO
DO
DO
DO
DO
DO
1
2
3
4
5
6
7
43
50/102mm
50/102mm
50/25
mm
50/127mm
6" O
/D S
oild
Ste
m A
uger
TOPSOIL
(CL) SILTY CLAY, some sand; reddishbrown, (REWORKED TILL); cohesive,w<PL, firm(CL) SILTY CLAY, trace sand, siltseams; reddish brown, (TILL); cohesive,w<PL, hard
SHALE (BEDROCK)Limestone interbedsThinly beddedFine grainedRed
End of Borehole
NOTE:
1. Borehole dry upon completion ofdrilling on February 2, 2016.2. Groundwater measured at a depth of3.9 m below existing grade on February16, 2016.
0.41
0.69
1.78
4.85
126.95
126.67
125.58
122.51
Casing
#2 Silica Sand
Hole Plug
#2 Silica Sand
10 Slot PVC Screen
February 16, 2016
TY
PE
BORING DATE: February 2, 2016
NU
MB
ER
Wl
PIEZOMETEROR
STANDPIPEINSTALLATION
HYDRAULIC CONDUCTIVITY, k, cm/s
Wp W
WATER CONTENT PERCENT
BO
RIN
G M
ET
HO
D
ELEV.
AD
DIT
ION
AL
LAB
. TE
ST
ING
SOIL PROFILE
ST
RA
TA
PLO
T
BLO
WS
/0.3
m 10-6 10-5 10-4 10-3
10 20 30 40
SHEET 1 OF 1
SPT/DCPT HAMMER: MASS, 64kg; DROP, 760mm
RECORD OF BOREHOLE: BH8
SAMPLES
DEPTH(m)
DESCRIPTION
GROUND SURFACE
LOGGED:
CHECKED:
DATUM: Geodetic
PROJECT: 1527072 (2000)
LOCATION: See Figure 1
CL
0.00127.36
DEPTH SCALE
1 : 50
DE
PT
H S
CA
LEM
ET
RE
S
0
1
2
3
4
5
6
7
8
9
10
NL
GT
A-B
HS
001
S
:\CLI
EN
TS
\CLU
BLI
NK
\OA
KV
ILLE
_GLE
N_A
BB
EY
_GO
LF_C
OU
RS
E\0
2_D
AT
A\G
INT
\152
707
2-B
G-0
001.
GP
J G
AL-
MIS
.GD
T 4
-19
-16
ST
B
DYNAMIC PENETRATIONRESISTANCE, BLOWS/0.3m
20 40 60 80
SHEAR STRENGTHCu, kPa
20 40 60 80
Q -U -
nat V.rem V.

Tra
ck M
ount
CM
E 5
5
DO
DO
DO
DO
DO
1
2
3
4
5
6
5
18
50/152mm
50/152mm
MH
6" O
/D S
oild
Ste
m A
uger
TOPSOIL
FILL-(CL) SILTY CLAY, trace sand,shale fragments; reddish brown;cohesive, w<PL, firm
(CL) sandy SILTY CLAY, trace sand,trace organics, silt seams; reddishbrown, (REWORKED TILL); cohesive,w<PL, very stiff
(CL) SILTY CLAY, some sand; reddishbrown, (TILL); cohesive, w<PL, hard
SHALE (BEDROCK)Thinly beddedFine grainedRed
No recovery of sample at 4.6 m bgs
End of Borehole
NOTE:
1. Borehole dry upon completion ofdrilling on February 2, 2016.2. Groundwater measured at a depth of3.1 m below existing grade on February16, 2016.
0.56
1.37
2.13
2.54
4.57
132.60
131.79
131.03
130.62
128.59
Casing
#2 Silica Sand
Hole Plug
10 Slot PVC Screen
February 16, 2016
TY
PE
BORING DATE: February 2, 2016
NU
MB
ER
Wl
PIEZOMETEROR
STANDPIPEINSTALLATION
HYDRAULIC CONDUCTIVITY, k, cm/s
Wp W
WATER CONTENT PERCENT
BO
RIN
G M
ET
HO
D
ELEV.
AD
DIT
ION
AL
LAB
. TE
ST
ING
SOIL PROFILE
ST
RA
TA
PLO
T
BLO
WS
/0.3
m 10-6 10-5 10-4 10-3
10 20 30 40
SHEET 1 OF 1
SPT/DCPT HAMMER: MASS, 64kg; DROP, 760mm
RECORD OF BOREHOLE: BH9
SAMPLES
DEPTH(m)
DESCRIPTION
GROUND SURFACE
LOGGED:
CHECKED:
DATUM: Geodetic
PROJECT: 1527072 (2000)
LOCATION: See Figure 1
CL
0.00133.16
DEPTH SCALE
1 : 50
DE
PT
H S
CA
LEM
ET
RE
S
0
1
2
3
4
5
6
7
8
9
10
NL
GT
A-B
HS
001
S
:\CLI
EN
TS
\CLU
BLI
NK
\OA
KV
ILLE
_GLE
N_A
BB
EY
_GO
LF_C
OU
RS
E\0
2_D
AT
A\G
INT
\152
707
2-B
G-0
001.
GP
J G
AL-
MIS
.GD
T 4
-19
-16
ST
B
DYNAMIC PENETRATIONRESISTANCE, BLOWS/0.3m
20 40 60 80
SHEAR STRENGTHCu, kPa
20 40 60 80
Q -U -
nat V.rem V.

Tra
ck M
ount
CM
E 5
5
DO
DO
DO
DO
DO
DO
1
2
3
4
5
6
10
24
50/76
mm
50/102mm
50/25
mm
50/152mm
6" O
/D S
oild
Ste
m A
uger
TOPSOIL
(CL) SILTY CLAY, trace sand andgravel; reddish brown, (TILL); cohesive,w<PL, very stiffSHALE (BEDROCK)Limestone InterbedsThinly beddedFine grainedRed
End of Borehole
NOTE:
1. Borehole dry upon completion ofdrilling on January 22, 2016.
0.61
0.91
4.72
133.60
133.30
129.49
TY
PE
BORING DATE: January 22, 2016
NU
MB
ER
Wl
PIEZOMETEROR
STANDPIPEINSTALLATION
HYDRAULIC CONDUCTIVITY, k, cm/s
Wp W
WATER CONTENT PERCENT
BO
RIN
G M
ET
HO
D
ELEV.
AD
DIT
ION
AL
LAB
. TE
ST
ING
SOIL PROFILE
ST
RA
TA
PLO
T
BLO
WS
/0.3
m 10-6 10-5 10-4 10-3
10 20 30 40
SHEET 1 OF 1
SPT/DCPT HAMMER: MASS, 64kg; DROP, 760mm
RECORD OF BOREHOLE: BH10
SAMPLES
DEPTH(m)
DESCRIPTION
GROUND SURFACE
LOGGED:
CHECKED:
DATUM: Geodetic
PROJECT: 1527072 (2000)
LOCATION: See Figure 1
CL
0.00134.21
DEPTH SCALE
1 : 50
DE
PT
H S
CA
LEM
ET
RE
S
0
1
2
3
4
5
6
7
8
9
10
NL
GT
A-B
HS
001
S
:\CLI
EN
TS
\CLU
BLI
NK
\OA
KV
ILLE
_GLE
N_A
BB
EY
_GO
LF_C
OU
RS
E\0
2_D
AT
A\G
INT
\152
707
2-B
G-0
001.
GP
J G
AL-
MIS
.GD
T 4
-19
-16
ST
B
DYNAMIC PENETRATIONRESISTANCE, BLOWS/0.3m
20 40 60 80
SHEAR STRENGTHCu, kPa
20 40 60 80
Q -U -
nat V.rem V.

Tra
ck M
ount
CM
E 5
5
DO
DO
DO
DO
DO
DO
DO
1
2
3
4
5
6
7
8
20
50/76
mm
50/102mm
50/152mm
50/51
mm
50/76
mm
MH
6" O
/D S
oild
Ste
m A
uger
TOPSOIL
(CL) sandy SILTY CLAY, trace gravel,shale fragments; reddish brown,(REWORKED TILL); cohesive, w<PL,very stiff
SHALE (BEDROCK)Limestone interbedsThinly beddedFine grainedRed
0.61
1.30
136.48
135.79
Casing
#2 Silica Sand
Hole Plug
#2 Silica Sand
10 Slot PVC Screen
February 22, 2016
TY
PE
BORING DATE: January 22, 2016
NU
MB
ER
Wl
PIEZOMETEROR
STANDPIPEINSTALLATION
HYDRAULIC CONDUCTIVITY, k, cm/s
Wp W
WATER CONTENT PERCENT
BO
RIN
G M
ET
HO
D
ELEV.
AD
DIT
ION
AL
LAB
. TE
ST
ING
SOIL PROFILE
ST
RA
TA
PLO
T
BLO
WS
/0.3
m 10-6 10-5 10-4 10-3
10 20 30 40
SHEET 1 OF 2
SPT/DCPT HAMMER: MASS, 64kg; DROP, 760mm
RECORD OF BOREHOLE: BH11
SAMPLES
DEPTH(m)
DESCRIPTION
GROUND SURFACE
CONTINUED NEXT PAGE
LOGGED:
CHECKED:
DATUM: Geodetic
PROJECT: 1527072 (2000)
LOCATION: See Figure 1
CL
0.00137.09
DEPTH SCALE
1 : 50
DE
PT
H S
CA
LEM
ET
RE
S
0
1
2
3
4
5
6
7
8
9
10
NL
GT
A-B
HS
001
S
:\CLI
EN
TS
\CLU
BLI
NK
\OA
KV
ILLE
_GLE
N_A
BB
EY
_GO
LF_C
OU
RS
E\0
2_D
AT
A\G
INT
\152
707
2-B
G-0
001.
GP
J G
AL-
MIS
.GD
T 4
-19
-16
ST
B
DYNAMIC PENETRATIONRESISTANCE, BLOWS/0.3m
20 40 60 80
SHEAR STRENGTHCu, kPa
20 40 60 80
Q -U -
nat V.rem V.

Tra
ck M
ount
CM
E 5
5
6" O
/D S
oild
Ste
m A
uger
SHALE (BEDROCK)Limestone interbedsThinly beddedFine grainedRed
End of Borehole
NOTE:
1. Groundwater measured at a depth of9.0 m in open borehole upon completionof drilling on January 22, 2016.2. Groundwater measured at a depth of3.8 m below existing grade on February22, 2016.
12.19124.90
10 Slot PVC Screen
TY
PE
BORING DATE: January 22, 2016
NU
MB
ER
Wl
PIEZOMETEROR
STANDPIPEINSTALLATION
HYDRAULIC CONDUCTIVITY, k, cm/s
Wp W
WATER CONTENT PERCENT
BO
RIN
G M
ET
HO
D
ELEV.
AD
DIT
ION
AL
LAB
. TE
ST
ING
SOIL PROFILE
ST
RA
TA
PLO
T
BLO
WS
/0.3
m 10-6 10-5 10-4 10-3
10 20 30 40
SHEET 2 OF 2
SPT/DCPT HAMMER: MASS, 64kg; DROP, 760mm
RECORD OF BOREHOLE: BH11
SAMPLES
DEPTH(m)
DESCRIPTION
LOGGED:
CHECKED:
--- CONTINUED FROM PREVIOUS PAGE ---
DATUM: Geodetic
PROJECT: 1527072 (2000)
LOCATION: See Figure 1
CLDEPTH SCALE
1 : 50
DE
PT
H S
CA
LEM
ET
RE
S
10
11
12
13
14
15
16
17
18
19
20
NL
GT
A-B
HS
001
S
:\CLI
EN
TS
\CLU
BLI
NK
\OA
KV
ILLE
_GLE
N_A
BB
EY
_GO
LF_C
OU
RS
E\0
2_D
AT
A\G
INT
\152
707
2-B
G-0
001.
GP
J G
AL-
MIS
.GD
T 4
-19
-16
ST
B
DYNAMIC PENETRATIONRESISTANCE, BLOWS/0.3m
20 40 60 80
SHEAR STRENGTHCu, kPa
20 40 60 80
Q -U -
nat V.rem V.

Tra
ck M
ount
CM
E 5
5
DO
DO
DO
DO
DO
DO
1
2
3
4
5
6
9
41
59
50/127mm
50/127mm
50/76
mm
6" O
/D S
oild
Ste
m A
uger
TOPSOIL
(CL) SILTY CLAY, trace sand andgravel; reddish brown, (TILL); cohesive,w<PL, hardSHALE (BEDROCK)Limestone interbedsThinly beddedFine grainedRed
End of Borehole
NOTE:
1. Borehole dry upon completion ofdrilling on January 22, 2016.
0.61
0.94
4.65
134.04
133.71
130.00
TY
PE
BORING DATE: January 22, 2016
NU
MB
ER
Wl
PIEZOMETEROR
STANDPIPEINSTALLATION
HYDRAULIC CONDUCTIVITY, k, cm/s
Wp W
WATER CONTENT PERCENT
BO
RIN
G M
ET
HO
D
ELEV.
AD
DIT
ION
AL
LAB
. TE
ST
ING
SOIL PROFILE
ST
RA
TA
PLO
T
BLO
WS
/0.3
m 10-6 10-5 10-4 10-3
10 20 30 40
SHEET 1 OF 1
SPT/DCPT HAMMER: MASS, 64kg; DROP, 760mm
RECORD OF BOREHOLE: BH12
SAMPLES
DEPTH(m)
DESCRIPTION
GROUND SURFACE
LOGGED:
CHECKED:
DATUM: Geodetic
PROJECT: 1527072 (2000)
LOCATION: See Figure 1
CL
0.00134.65
DEPTH SCALE
1 : 50
DE
PT
H S
CA
LEM
ET
RE
S
0
1
2
3
4
5
6
7
8
9
10
NL
GT
A-B
HS
001
S
:\CLI
EN
TS
\CLU
BLI
NK
\OA
KV
ILLE
_GLE
N_A
BB
EY
_GO
LF_C
OU
RS
E\0
2_D
AT
A\G
INT
\152
707
2-B
G-0
001.
GP
J G
AL-
MIS
.GD
T 4
-19
-16
ST
B
DYNAMIC PENETRATIONRESISTANCE, BLOWS/0.3m
20 40 60 80
SHEAR STRENGTHCu, kPa
20 40 60 80
Q -U -
nat V.rem V.

Tra
ck M
ount
CM
E 5
5
DO
DO
DO
DO
DO
DO
DO
DO
DO
1A
1B
2
3
4
5
6
7
8
9
5
37
50/25
mm
50/102mm
50/102mm
50/25
mm
50/25
mm
MH
6" O
/D S
oild
Ste
m A
uger
TOPSOIL
FILL-(CL) SILTY CLAY, some sand tosandy, some gravel, shale fragments;reddish brown to grey; cohesive, w<PL,stiff to firm
(CL) SILTY CLAY, trace sand, somegravel; reddish brown to grey, (TILL);cohesive, w<PL, hardSHALE (BEDROCK)Limestone interbedsThinly beddedFine grainedRed
0.20
1.37
1.73
134.17
133.00
132.64
Hole Plug
TY
PE
BORING DATE: January 25, 2016
NU
MB
ER
Wl
PIEZOMETEROR
STANDPIPEINSTALLATION
HYDRAULIC CONDUCTIVITY, k, cm/s
Wp W
WATER CONTENT PERCENT
BO
RIN
G M
ET
HO
D
ELEV.
AD
DIT
ION
AL
LAB
. TE
ST
ING
SOIL PROFILE
ST
RA
TA
PLO
T
BLO
WS
/0.3
m 10-6 10-5 10-4 10-3
10 20 30 40
SHEET 1 OF 2
SPT/DCPT HAMMER: MASS, 64kg; DROP, 760mm
RECORD OF BOREHOLE: BH13
SAMPLES
DEPTH(m)
DESCRIPTION
GROUND SURFACE
CONTINUED NEXT PAGE
LOGGED:
CHECKED:
DATUM: Geodetic
PROJECT: 1527072 (2000)
LOCATION: See Figure 1
CL
0.00134.37
DEPTH SCALE
1 : 50
DE
PT
H S
CA
LEM
ET
RE
S
0
1
2
3
4
5
6
7
8
9
10
NL
GT
A-B
HS
001
S
:\CLI
EN
TS
\CLU
BLI
NK
\OA
KV
ILLE
_GLE
N_A
BB
EY
_GO
LF_C
OU
RS
E\0
2_D
AT
A\G
INT
\152
707
2-B
G-0
001.
GP
J G
AL-
MIS
.GD
T 4
-19
-16
ST
B
DYNAMIC PENETRATIONRESISTANCE, BLOWS/0.3m
20 40 60 80
SHEAR STRENGTHCu, kPa
20 40 60 80
Q -U -
nat V.rem V.

Tra
ck M
ount
CM
E 5
5
6" O
/D S
oild
Ste
m A
uger
SHALE (BEDROCK)Limestone interbedsThinly beddedFine grainedRed
End of Borehole
NOTE:
1. Groundwater measured at a depth of13.8 m in open borehole uponcompletion of drilling on January 25,2016.2. Groundwater measured at a depth of14.6 m below existing grade in deepmonitoring on February 16, 2016.3. Groundwater measured at a depth of1.3 m below existing grade in shallowmonitoring on February 16, 2016.
15.24119.13
Hole Plug
#2 Silica Sand
10 Slot PVC Screen
February 16, 2016
TY
PE
BORING DATE: January 25, 2016
NU
MB
ER
Wl
PIEZOMETEROR
STANDPIPEINSTALLATION
HYDRAULIC CONDUCTIVITY, k, cm/s
Wp W
WATER CONTENT PERCENT
BO
RIN
G M
ET
HO
D
ELEV.
AD
DIT
ION
AL
LAB
. TE
ST
ING
SOIL PROFILE
ST
RA
TA
PLO
T
BLO
WS
/0.3
m 10-6 10-5 10-4 10-3
10 20 30 40
SHEET 2 OF 2
SPT/DCPT HAMMER: MASS, 64kg; DROP, 760mm
RECORD OF BOREHOLE: BH13
SAMPLES
DEPTH(m)
DESCRIPTION
LOGGED:
CHECKED:
--- CONTINUED FROM PREVIOUS PAGE ---
DATUM: Geodetic
PROJECT: 1527072 (2000)
LOCATION: See Figure 1
CLDEPTH SCALE
1 : 50
DE
PT
H S
CA
LEM
ET
RE
S
10
11
12
13
14
15
16
17
18
19
20
NL
GT
A-B
HS
001
S
:\CLI
EN
TS
\CLU
BLI
NK
\OA
KV
ILLE
_GLE
N_A
BB
EY
_GO
LF_C
OU
RS
E\0
2_D
AT
A\G
INT
\152
707
2-B
G-0
001.
GP
J G
AL-
MIS
.GD
T 4
-19
-16
ST
B
DYNAMIC PENETRATIONRESISTANCE, BLOWS/0.3m
20 40 60 80
SHEAR STRENGTHCu, kPa
20 40 60 80
Q -U -
nat V.rem V.

Tra
ck M
ount
CM
E 5
5
DO
DO
DO
DO
1
2
3
4
17
30
54
50/152mm
6" O
/D S
oild
Ste
m A
uger
TOPSOIL(CL) SILTY CLAY, some sand andgravel; reddish brown, (REWORKEDTILL); cohesive, w<PL, very stiff
(CL) SILTY CLAY, some sand, silt seam,shale fragments; reddish brown, (TILL);w<PL, hard
SHALE (BEDROCK)Limestone InterbedsThinly beddedFine grainedRed
No sample recovery at 3.2 m bgs
End of Borehole
NOTE:
1. Borehole dry upon completion ofdrilling on February 3, 2016.
0.08
0.69
1.37
3.20
132.19
131.51
129.68
TY
PE
BORING DATE: February 3, 2016
NU
MB
ER
Wl
PIEZOMETEROR
STANDPIPEINSTALLATION
HYDRAULIC CONDUCTIVITY, k, cm/s
Wp W
WATER CONTENT PERCENT
BO
RIN
G M
ET
HO
D
ELEV.
AD
DIT
ION
AL
LAB
. TE
ST
ING
SOIL PROFILE
ST
RA
TA
PLO
T
BLO
WS
/0.3
m 10-6 10-5 10-4 10-3
10 20 30 40
SHEET 1 OF 1
SPT/DCPT HAMMER: MASS, 64kg; DROP, 760mm
RECORD OF BOREHOLE: BH14
SAMPLES
DEPTH(m)
DESCRIPTION
GROUND SURFACE
LOGGED:
CHECKED:
DATUM: Geodetic
PROJECT: 1527072 (2000)
LOCATION: See Figure 1
CL
0.00132.88
DEPTH SCALE
1 : 50
DE
PT
H S
CA
LEM
ET
RE
S
0
1
2
3
4
5
6
7
8
9
10
NL
GT
A-B
HS
001
S
:\CLI
EN
TS
\CLU
BLI
NK
\OA
KV
ILLE
_GLE
N_A
BB
EY
_GO
LF_C
OU
RS
E\0
2_D
AT
A\G
INT
\152
707
2-B
G-0
001.
GP
J G
AL-
MIS
.GD
T 4
-19
-16
ST
B
DYNAMIC PENETRATIONRESISTANCE, BLOWS/0.3m
20 40 60 80
SHEAR STRENGTHCu, kPa
20 40 60 80
Q -U -
nat V.rem V.

Tra
ck M
ount
CM
E 5
5
DO
DO
DO
DO
DO
DO
1
2
3
4
5
6
5
21
57
50/127mm
50/51
mm
50/51
mm
MH
6" O
/D S
oild
Ste
m A
uger
TOPSOILFILL-(CL) SILTY CLAY, some sand,mixed organics; reddish brown;cohesive, w~PL, firm
(CL) sandy SILTY CLAY, some gravel,silt seams, shale fragments; reddishbrown, (TILL); cohesive, w<PL, very stiff
SHALE (BEDROCK)Limestone interbedsThinly beddedFine grainedRed
End of Borehole
NOTE:
1. Borehole dry upon completion ofdrilling on February 10, 2016.
0.05
0.69
1.22
4.62
129.64
129.11
125.71
TY
PE
BORING DATE: February 10, 2016
NU
MB
ER
Wl
PIEZOMETEROR
STANDPIPEINSTALLATION
HYDRAULIC CONDUCTIVITY, k, cm/s
Wp W
WATER CONTENT PERCENT
BO
RIN
G M
ET
HO
D
ELEV.
AD
DIT
ION
AL
LAB
. TE
ST
ING
SOIL PROFILE
ST
RA
TA
PLO
T
BLO
WS
/0.3
m 10-6 10-5 10-4 10-3
10 20 30 40
SHEET 1 OF 1
SPT/DCPT HAMMER: MASS, 64kg; DROP, 760mm
RECORD OF BOREHOLE: BH15
SAMPLES
DEPTH(m)
DESCRIPTION
GROUND SURFACE
LOGGED:
CHECKED:
DATUM: Geodetic
PROJECT: 1527072 (2000)
LOCATION: See Figure 1
CL
0.00130.33
DEPTH SCALE
1 : 50
DE
PT
H S
CA
LEM
ET
RE
S
0
1
2
3
4
5
6
7
8
9
10
NL
GT
A-B
HS
001
S
:\CLI
EN
TS
\CLU
BLI
NK
\OA
KV
ILLE
_GLE
N_A
BB
EY
_GO
LF_C
OU
RS
E\0
2_D
AT
A\G
INT
\152
707
2-B
G-0
001.
GP
J G
AL-
MIS
.GD
T 4
-19
-16
ST
B
DYNAMIC PENETRATIONRESISTANCE, BLOWS/0.3m
20 40 60 80
SHEAR STRENGTHCu, kPa
20 40 60 80
Q -U -
nat V.rem V.

Tra
ck M
ount
CM
E 5
5
DO
DO
DO
DO
DO
1
2
3
4
5
5
21
45
50/152mm
50/76
mm
6" O
/D S
oild
Ste
m A
uger
TOPSOIL
FILL-(CL) SILTY CLAY, trace sand, traceorganics and topsoil; reddish brown togrey; cohesive, w~PL, firm(CL) SILTY CLAY, trace sand, shalefragments; reddish brown, (REWORKEDTILL); cohesive, w<PL, very stiff
SHALE (BEDROCK)Limestone interbedsThinly beddedFine grainedRed
No recovery of sample at 4.6 m bgs
End of Borehole
NOTE:
1. Borehole dry upon completion ofdrilling on February 10, 2016.2. Groundwater measured at a depth of1.9 m below existing grade on February16, 2016.
0.41
0.69
1.37
4.57
129.08
128.80
128.12
124.92
Casing
Hole Plug
#2 Silica Sand
10 Slot PVC Screen
February 16, 2016T
YP
E
BORING DATE: February 10, 2016
NU
MB
ER
Wl
PIEZOMETEROR
STANDPIPEINSTALLATION
HYDRAULIC CONDUCTIVITY, k, cm/s
Wp W
WATER CONTENT PERCENT
BO
RIN
G M
ET
HO
D
ELEV.
AD
DIT
ION
AL
LAB
. TE
ST
ING
SOIL PROFILE
ST
RA
TA
PLO
T
BLO
WS
/0.3
m 10-6 10-5 10-4 10-3
10 20 30 40
SHEET 1 OF 1
SPT/DCPT HAMMER: MASS, 64kg; DROP, 760mm
RECORD OF BOREHOLE: BH16
SAMPLES
DEPTH(m)
DESCRIPTION
GROUND SURFACE
LOGGED:
CHECKED:
DATUM: Geodetic
PROJECT: 1527072 (2000)
LOCATION: See Figure 1
CL
0.00129.49
DEPTH SCALE
1 : 50
DE
PT
H S
CA
LEM
ET
RE
S
0
1
2
3
4
5
6
7
8
9
10
NL
GT
A-B
HS
001
S
:\CLI
EN
TS
\CLU
BLI
NK
\OA
KV
ILLE
_GLE
N_A
BB
EY
_GO
LF_C
OU
RS
E\0
2_D
AT
A\G
INT
\152
707
2-B
G-0
001.
GP
J G
AL-
MIS
.GD
T 4
-19
-16
ST
B
DYNAMIC PENETRATIONRESISTANCE, BLOWS/0.3m
20 40 60 80
SHEAR STRENGTHCu, kPa
20 40 60 80
Q -U -
nat V.rem V.

Tra
ck M
ount
CM
E 5
5
DO
DO
DO
DO
DO
DO
DO
DO
1
2
3
4
5
6
7
8
10
20
25
12
9
10
30
50/127mm
MH
6" O
/D S
oild
Ste
m A
uger
TOPSOIL
FILL-(CL) SILTY CLAY, trace to somesand and gravel, shale and limestonefragments; reddish brown; cohesive,w<PL, stiff to very stiff
FILL-CLAYEY TOPSOIL
FILL-(CL) sandy SILTY CLAY, mixedorganics; reddish brown to grey;cohesive, w<PL, stiff
SHALE (BEDROCK)Limestone InterbedsThinly beddedFine grainedRed
End of Borehole
NOTE:
1. Borehole dry upon completion ofdrilling on February 10, 2016.2. Monitoring well dry, measured onFebruary 22, 2016.
0.36
3.43
3.66
4.42
6.38
136.43
133.36
133.13
132.37
130.41
Casing
Hole Plug
#2 Silica Sand
10 Slot PVC Screen
TY
PE
BORING DATE: February 10, 2016
NU
MB
ER
Wl
PIEZOMETEROR
STANDPIPEINSTALLATION
HYDRAULIC CONDUCTIVITY, k, cm/s
Wp W
WATER CONTENT PERCENT
BO
RIN
G M
ET
HO
D
ELEV.
AD
DIT
ION
AL
LAB
. TE
ST
ING
SOIL PROFILE
ST
RA
TA
PLO
T
BLO
WS
/0.3
m 10-6 10-5 10-4 10-3
10 20 30 40
SHEET 1 OF 1
SPT/DCPT HAMMER: MASS, 64kg; DROP, 760mm
RECORD OF BOREHOLE: BH17
SAMPLES
DEPTH(m)
DESCRIPTION
GROUND SURFACE
LOGGED:
CHECKED:
DATUM: Geodetic
PROJECT: 1527072 (2000)
LOCATION: See Figure 1
CL
0.00136.79
DEPTH SCALE
1 : 50
DE
PT
H S
CA
LEM
ET
RE
S
0
1
2
3
4
5
6
7
8
9
10
NL
GT
A-B
HS
001
S
:\CLI
EN
TS
\CLU
BLI
NK
\OA
KV
ILLE
_GLE
N_A
BB
EY
_GO
LF_C
OU
RS
E\0
2_D
AT
A\G
INT
\152
707
2-B
G-0
001.
GP
J G
AL-
MIS
.GD
T 4
-19
-16
ST
B
DYNAMIC PENETRATIONRESISTANCE, BLOWS/0.3m
20 40 60 80
SHEAR STRENGTHCu, kPa
20 40 60 80
Q -U -
nat V.rem V.

Tra
ck M
ount
CM
E 5
5
DO
DO
DO
DO
DO
1
2
3
4
5
7
50/152mm
50/127mm
50/152mm
50/102mm
6" O
/D S
oild
Ste
m A
uger
TOPSOIL
(CL) SILTY CLAY, trace sand, shalefragments; reddish brown, (REWORKEDTILL); cohesive, w<PL, hardSHALE (BEDROCK)Limestone interbedsThinly beddedFine grainedRed
No recovery of sample at 4.5 m bgs
End of Borehole
NOTE:
1. Borehole dry upon completion ofdrilling on February 4, 2016.2. Groundwater measured at a depth of3.4 m below existing grade on February22, 2016.
0.30
0.69
4.57
134.87
134.48
130.60
Casing
#2 Silica Sand
Hole Plug
10 Slot PVC Screen
February 22, 2016
TY
PE
BORING DATE: February 4, 2016
NU
MB
ER
Wl
PIEZOMETEROR
STANDPIPEINSTALLATION
HYDRAULIC CONDUCTIVITY, k, cm/s
Wp W
WATER CONTENT PERCENT
BO
RIN
G M
ET
HO
D
ELEV.
AD
DIT
ION
AL
LAB
. TE
ST
ING
SOIL PROFILE
ST
RA
TA
PLO
T
BLO
WS
/0.3
m 10-6 10-5 10-4 10-3
10 20 30 40
SHEET 1 OF 1
SPT/DCPT HAMMER: MASS, 64kg; DROP, 760mm
RECORD OF BOREHOLE: BH18
SAMPLES
DEPTH(m)
DESCRIPTION
GROUND SURFACE
LOGGED:
CHECKED:
DATUM: Geodetic
PROJECT: 1527072 (2000)
LOCATION: See Figure 1
CL
0.00135.17
DEPTH SCALE
1 : 50
DE
PT
H S
CA
LEM
ET
RE
S
0
1
2
3
4
5
6
7
8
9
10
NL
GT
A-B
HS
001
S
:\CLI
EN
TS
\CLU
BLI
NK
\OA
KV
ILLE
_GLE
N_A
BB
EY
_GO
LF_C
OU
RS
E\0
2_D
AT
A\G
INT
\152
707
2-B
G-0
001.
GP
J G
AL-
MIS
.GD
T 4
-19
-16
ST
B
DYNAMIC PENETRATIONRESISTANCE, BLOWS/0.3m
20 40 60 80
SHEAR STRENGTHCu, kPa
20 40 60 80
Q -U -
nat V.rem V.

Tra
ck M
ount
CM
E 5
5
DO
DO
DO
DO
DO
DO
1
2
3
4
5
6
7
13
42
50/127mm
50/127mm
50/102mm
MH
6" O
/D S
oild
Ste
m A
uger
TOPSOIL
(CL) sandy SILTY CLAY, trace gravel,shale fragments; reddish brown,(REWORKED TILL); cohesive, w~PL tow<PL, stiff
(CL) SILTY CLAY, trace sand, limestonefragments; reddish brown, (TILL);cohesive, w<PL, hard
SHALE (BEDROCK)Limestone interbedsThinly beddedFine grainedRed
End of Borehole
NOTE:
1. Borehole dry upon completion ofdrilling on February 3, 2016.2. Groundwater measured at a depth of2.2 m below existing grade on February22, 2016.
0.51
1.37
2.13
4.67
131.90
131.04
130.28
127.74
Casing
#2 Silica Sand
Hole Plug
10 Slot PVC Screen
February 22, 2016
TY
PE
BORING DATE: February 3, 2016
NU
MB
ER
Wl
PIEZOMETEROR
STANDPIPEINSTALLATION
HYDRAULIC CONDUCTIVITY, k, cm/s
Wp W
WATER CONTENT PERCENT
BO
RIN
G M
ET
HO
D
ELEV.
AD
DIT
ION
AL
LAB
. TE
ST
ING
SOIL PROFILE
ST
RA
TA
PLO
T
BLO
WS
/0.3
m 10-6 10-5 10-4 10-3
10 20 30 40
SHEET 1 OF 1
SPT/DCPT HAMMER: MASS, 64kg; DROP, 760mm
RECORD OF BOREHOLE: BH19
SAMPLES
DEPTH(m)
DESCRIPTION
GROUND SURFACE
LOGGED:
CHECKED:
DATUM: Geodetic
PROJECT: 1527072 (2000)
LOCATION: See Figure 1
CL
0.00132.41
DEPTH SCALE
1 : 50
DE
PT
H S
CA
LEM
ET
RE
S
0
1
2
3
4
5
6
7
8
9
10
NL
GT
A-B
HS
001
S
:\CLI
EN
TS
\CLU
BLI
NK
\OA
KV
ILLE
_GLE
N_A
BB
EY
_GO
LF_C
OU
RS
E\0
2_D
AT
A\G
INT
\152
707
2-B
G-0
001.
GP
J G
AL-
MIS
.GD
T 4
-19
-16
ST
B
DYNAMIC PENETRATIONRESISTANCE, BLOWS/0.3m
20 40 60 80
SHEAR STRENGTHCu, kPa
20 40 60 80
Q -U -
nat V.rem V.

Tra
ck M
ount
CM
E 5
5
DO
DO
DO
DO
DO
DO
1
2
3
4
5
6
6
26
59
50/152mm
50/152mm
50/51
mm
6" O
/D S
oild
Ste
m A
uger
TOPSOIL
FILL-(CL) SILTY CLAY, trace sand,rootlets; reddish brown, (REWORKEDTILL), cohesive, w<PL, firm(CL) SILTY CLAY, some sand; reddishbrown, (TILL); cohesive, w<PL, very stiff
SHALE (BEDROCK)Limestone interbedsThinly beddedFine grainedRed
0.38
0.69
1.37
129.89
129.58
128.90
Casing
#2 Silica Sand
Hole Plug
#2 Silica Sand
10 Slot PVC Screen
February 22, 2016February 22, 2016
TY
PE
BORING DATE: February 3, 2016
NU
MB
ER
Wl
PIEZOMETEROR
STANDPIPEINSTALLATION
HYDRAULIC CONDUCTIVITY, k, cm/s
Wp W
WATER CONTENT PERCENT
BO
RIN
G M
ET
HO
D
ELEV.
AD
DIT
ION
AL
LAB
. TE
ST
ING
SOIL PROFILE
ST
RA
TA
PLO
T
BLO
WS
/0.3
m 10-6 10-5 10-4 10-3
10 20 30 40
SHEET 1 OF 2
SPT/DCPT HAMMER: MASS, 64kg; DROP, 760mm
RECORD OF BOREHOLE: BH20
SAMPLES
DEPTH(m)
DESCRIPTION
GROUND SURFACE
CONTINUED NEXT PAGE
LOGGED:
CHECKED:
DATUM: Geodetic
PROJECT: 1527072 (2000)
LOCATION: See Figure 1
CL
0.00130.27
DEPTH SCALE
1 : 50
DE
PT
H S
CA
LEM
ET
RE
S
0
1
2
3
4
5
6
7
8
9
10
NL
GT
A-B
HS
001
S
:\CLI
EN
TS
\CLU
BLI
NK
\OA
KV
ILLE
_GLE
N_A
BB
EY
_GO
LF_C
OU
RS
E\0
2_D
AT
A\G
INT
\152
707
2-B
G-0
001.
GP
J G
AL-
MIS
.GD
T 4
-19
-16
ST
B
DYNAMIC PENETRATIONRESISTANCE, BLOWS/0.3m
20 40 60 80
SHEAR STRENGTHCu, kPa
20 40 60 80
Q -U -
nat V.rem V.

SHALE (BEDROCK)Limestone interbedsThinly beddedFine grainedRed
End of Borehole
NOTE:
1. Groundwater measured at a depth of5.2 m in open borehole upon completionof drilling on February 3, 2016.2. Groundwater measured at a depth of1.0 m below existing grade on February22, 2016.
10.67119.60
10 Slot PVC Screen
TY
PE
BORING DATE: February 3, 2016
NU
MB
ER
Wl
PIEZOMETEROR
STANDPIPEINSTALLATION
HYDRAULIC CONDUCTIVITY, k, cm/s
Wp W
WATER CONTENT PERCENT
BO
RIN
G M
ET
HO
D
ELEV.
AD
DIT
ION
AL
LAB
. TE
ST
ING
SOIL PROFILE
ST
RA
TA
PLO
T
BLO
WS
/0.3
m 10-6 10-5 10-4 10-3
10 20 30 40
SHEET 2 OF 2
SPT/DCPT HAMMER: MASS, 64kg; DROP, 760mm
RECORD OF BOREHOLE: BH20
SAMPLES
DEPTH(m)
DESCRIPTION
LOGGED:
CHECKED:
--- CONTINUED FROM PREVIOUS PAGE ---
DATUM: Geodetic
PROJECT: 1527072 (2000)
LOCATION: See Figure 1
CLDEPTH SCALE
1 : 50
DE
PT
H S
CA
LEM
ET
RE
S
10
11
12
13
14
15
16
17
18
19
20
NL
GT
A-B
HS
001
S
:\CLI
EN
TS
\CLU
BLI
NK
\OA
KV
ILLE
_GLE
N_A
BB
EY
_GO
LF_C
OU
RS
E\0
2_D
AT
A\G
INT
\152
707
2-B
G-0
001.
GP
J G
AL-
MIS
.GD
T 4
-19
-16
ST
B
DYNAMIC PENETRATIONRESISTANCE, BLOWS/0.3m
20 40 60 80
SHEAR STRENGTHCu, kPa
20 40 60 80
Q -U -
nat V.rem V.
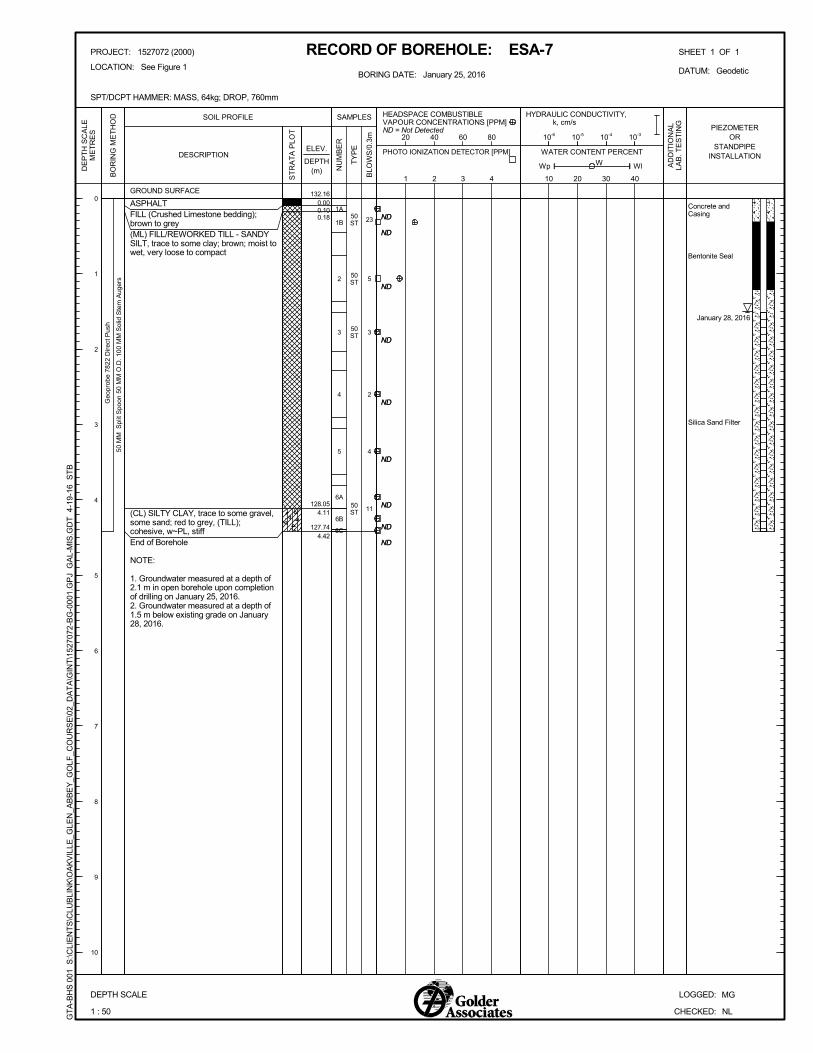
Geo
prob
e 78
22 D
irect
Pus
h
50ST
50ST
50ST
50ST
1A
1B
2
3
4
5
6A
6B
6C
23
5
3
2
4
11
50 M
M S
plit
Spo
on 5
0 M
M O
.D. 1
00 M
M S
olid
Ste
m A
uger
s
ASPHALTFILL (Crushed Limestone bedding);brown to grey(ML) FILL/REWORKED TILL - SANDYSILT, trace to some clay; brown; moist towet, very loose to compact
(CL) SILTY CLAY, trace to some gravel,some sand; red to grey, (TILL);cohesive, w~PL, stiffEnd of Borehole
NOTE:
1. Groundwater measured at a depth of2.1 m in open borehole upon completionof drilling on January 25, 2016.2. Groundwater measured at a depth of1.5 m below existing grade on January28, 2016.
0.100.18
4.11
4.42
128.05
127.74
ND
ND
ND
ND
ND
ND
ND
ND
ND
ND
ND
ND
ND
ND
ND
ND
ND
ND
Concrete andCasing
Bentonite Seal
Silica Sand Filter
January 28, 2016
TY
PE
BORING DATE: January 25, 2016
NU
MB
ER
Wl
PIEZOMETEROR
STANDPIPEINSTALLATION
HYDRAULIC CONDUCTIVITY, k, cm/s
Wp W
WATER CONTENT PERCENT
BO
RIN
G M
ET
HO
D
ELEV.
AD
DIT
ION
AL
LAB
. TE
ST
ING
SOIL PROFILE
ST
RA
TA
PLO
T
BLO
WS
/0.3
m 10-6 10-5 10-4 10-3
10 20 30 40
SHEET 1 OF 1
SPT/DCPT HAMMER: MASS, 64kg; DROP, 760mm
RECORD OF BOREHOLE: ESA-7
SAMPLES
DEPTH(m)
DESCRIPTION
GROUND SURFACE
LOGGED:
CHECKED:
DATUM: Geodetic
PROJECT: 1527072 (2000)
LOCATION: See Figure 1
MG
0.00132.16
DEPTH SCALE
1 : 50
DE
PT
H S
CA
LEM
ET
RE
S
0
1
2
3
4
5
6
7
8
9
10
NL
GT
A-B
HS
001
S
:\CLI
EN
TS
\CLU
BLI
NK
\OA
KV
ILLE
_GLE
N_A
BB
EY
_GO
LF_C
OU
RS
E\0
2_D
AT
A\G
INT
\152
707
2-B
G-0
001.
GP
J G
AL-
MIS
.GD
T 4
-19
-16
ST
B
HEADSPACE COMBUSTIBLEVAPOUR CONCENTRATIONS [PPM]ND = Not Detected
PHOTO IONIZATION DETECTOR [PPM]
1 2 3 4
20 40 60 80

Tra
ck M
ount
CM
E 5
5
1
2
3
4
5
6
7
8
SHALE (BEDROCK)Limestone interbedsThinly beddedFine grainedRed
HQ
Cor
ing
Hole Plug
SOLIDCORE %
- Joint- Fault- Shear- Vein- Conjugate
BDFOCOORCL
20406080
DEPTH(m) TOTAL
CORE %
ELEV.
R.Q.D.%
RECORD OF DRILLHOLE: BH7
NOTESWATER LEVELS
INSTRUMENTATIONDIP w.r.t.
COREAXIS
B Angle
- Polished- Slickensided- Smooth- Rough- Mechanical Break
POKSMRoMB
- Broken Rock
RECOVERY
JNFLTSHRVNCJ
FLU
SH
0 90 180
270
PLCUUNSTIR
RU
N N
o.
SY
MB
OLI
C L
OG
SHEET 1 OF 3
NOTE: For additionalabbreviations refer to listof abbreviations &symbols.
- Planar- Curved- Undulating- Stepped- Irregular
- Bedding- Foliation- Contact- Orthogonal- Cleavage C
OLO
UR
%
RE
TU
RN
DR
ILLI
NG
RE
CO
RD
20406080 5 10 15 20
DISCONTINUITY DATADESCRIPTION
0 30 60 90
TYPE AND SURFACEDESCRIPTION Jr JnJa
INCLINATION: -90° AZIMUTH: ---
FRACT.INDEXPER0.3 m
PE
NE
TR
AT
ION
RA
TE
min
/(m
)
DRILLING DATE: January 21, 2016
DRILL RIG: CME 55
DRILLING CONTRACTOR: Davis Drilling
20406080
BR
DATUM: Geodetic
DEPTH SCALE
3
4
5
6
7
8
9
10
11
12
SEE RECORD OF BOREHOLE BH7
2.72
1 : 50
CONTINUED NEXT PAGE
CL
124.29
LOGGED:
CHECKED:
PROJECT: 1527072 (2000)
LOCATION: See Figure 1
DE
PT
H S
CA
LEM
ET
RE
S
NL
GT
A-R
CK
004
S
:\CLI
EN
TS
\CLU
BLI
NK
\OA
KV
ILLE
_GLE
N_A
BB
EY
_GO
LF_C
OU
RS
E\0
2_D
AT
A\G
INT
\152
707
2-B
G-0
001.
GP
J G
AL-
MIS
S.G
DT
4-
19-1
6 S
TB
10-6
10-5
10-4
10-3
HYDRAULICCONDUCTIVITY
K, cm/sec
DiametralPoint Load
Index(MPa)
2 4 6
RMC-Q'
AVG.

Tra
ck M
ount
CM
E 5
5
8
9
10
11
12
13
14
SHALE (BEDROCK)Limestone interbedsThinly beddedFine grainedRed
HQ
Cor
ing
Hole Plug
SOLIDCORE %
- Joint- Fault- Shear- Vein- Conjugate
BDFOCOORCL
20406080
DEPTH(m) TOTAL
CORE %
ELEV.
R.Q.D.%
RECORD OF DRILLHOLE: BH7
NOTESWATER LEVELS
INSTRUMENTATIONDIP w.r.t.
COREAXIS
B Angle
- Polished- Slickensided- Smooth- Rough- Mechanical Break
POKSMRoMB
- Broken Rock
RECOVERY
JNFLTSHRVNCJ
FLU
SH
0 90 180
270
PLCUUNSTIR
RU
N N
o.
SY
MB
OLI
C L
OG
SHEET 2 OF 3
NOTE: For additionalabbreviations refer to listof abbreviations &symbols.
- Planar- Curved- Undulating- Stepped- Irregular
- Bedding- Foliation- Contact- Orthogonal- Cleavage C
OLO
UR
%
RE
TU
RN
DR
ILLI
NG
RE
CO
RD
20406080 5 10 15 20
DISCONTINUITY DATADESCRIPTION
0 30 60 90
TYPE AND SURFACEDESCRIPTION Jr JnJa
INCLINATION: -90° AZIMUTH: ---
FRACT.INDEXPER0.3 m
PE
NE
TR
AT
ION
RA
TE
min
/(m
)
DRILLING DATE: January 21, 2016
DRILL RIG: CME 55
DRILLING CONTRACTOR: Davis Drilling
20406080
BR
DATUM: Geodetic
DEPTH SCALE
13
14
15
16
17
18
19
20
21
22
1 : 50
CONTINUED NEXT PAGE
CLLOGGED:
CHECKED:
--- CONTINUED FROM PREVIOUS PAGE ---
PROJECT: 1527072 (2000)
LOCATION: See Figure 1
DE
PT
H S
CA
LEM
ET
RE
S
NL
GT
A-R
CK
004
S
:\CLI
EN
TS
\CLU
BLI
NK
\OA
KV
ILLE
_GLE
N_A
BB
EY
_GO
LF_C
OU
RS
E\0
2_D
AT
A\G
INT
\152
707
2-B
G-0
001.
GP
J G
AL-
MIS
S.G
DT
4-
19-1
6 S
TB
10-6
10-5
10-4
10-3
HYDRAULICCONDUCTIVITY
K, cm/sec
DiametralPoint Load
Index(MPa)
2 4 6
RMC-Q'
AVG.

Tra
ck M
ount
CM
E 5
5
14
15
16
17
18
SHALE (BEDROCK)Limestone interbedsThinly beddedFine grainedRed
End of Drillhole
NOTE:
1. Groundwater measured at a depth of25.6 m in open borehole uponcompletion of drilling on January 21,2016.2. Groundwater measured at a depth of26.9 m below existing grade on February16, 2016.
HQ
Cor
ing
97.6029.41
Hole Plug
#2 Silica Sand
10 Slot PVCScreen
February16,
2016
SOLIDCORE %
- Joint- Fault- Shear- Vein- Conjugate
BDFOCOORCL
20406080
DEPTH(m) TOTAL
CORE %
ELEV.
R.Q.D.%
RECORD OF DRILLHOLE: BH7
NOTESWATER LEVELS
INSTRUMENTATIONDIP w.r.t.
COREAXIS
B Angle
- Polished- Slickensided- Smooth- Rough- Mechanical Break
POKSMRoMB
- Broken Rock
RECOVERY
JNFLTSHRVNCJ
FLU
SH
0 90 180
270
PLCUUNSTIR
RU
N N
o.
SY
MB
OLI
C L
OG
SHEET 3 OF 3
NOTE: For additionalabbreviations refer to listof abbreviations &symbols.
- Planar- Curved- Undulating- Stepped- Irregular
- Bedding- Foliation- Contact- Orthogonal- Cleavage C
OLO
UR
%
RE
TU
RN
DR
ILLI
NG
RE
CO
RD
20406080 5 10 15 20
DISCONTINUITY DATADESCRIPTION
0 30 60 90
TYPE AND SURFACEDESCRIPTION Jr JnJa
INCLINATION: -90° AZIMUTH: ---
FRACT.INDEXPER0.3 m
PE
NE
TR
AT
ION
RA
TE
min
/(m
)
DRILLING DATE: January 21, 2016
DRILL RIG: CME 55
DRILLING CONTRACTOR: Davis Drilling
20406080
BR
DATUM: Geodetic
DEPTH SCALE
23
24
25
26
27
28
29
30
31
32
1 : 50
CLLOGGED:
CHECKED:
--- CONTINUED FROM PREVIOUS PAGE ---
PROJECT: 1527072 (2000)
LOCATION: See Figure 1
DE
PT
H S
CA
LEM
ET
RE
S
NL
GT
A-R
CK
004
S
:\CLI
EN
TS
\CLU
BLI
NK
\OA
KV
ILLE
_GLE
N_A
BB
EY
_GO
LF_C
OU
RS
E\0
2_D
AT
A\G
INT
\152
707
2-B
G-0
001.
GP
J G
AL-
MIS
S.G
DT
4-
19-1
6 S
TB
10-6
10-5
10-4
10-3
HYDRAULICCONDUCTIVITY
K, cm/sec
DiametralPoint Load
Index(MPa)
2 4 6
RMC-Q'
AVG.

PRELIMINARY GEOTECHNICAL INVESTIGATION GLEN ABBEY GOLF CLUB REDEVELOPMENT
October 2016 Report No. 1527072 (2000)
APPENDIX B Laboratory Test Results
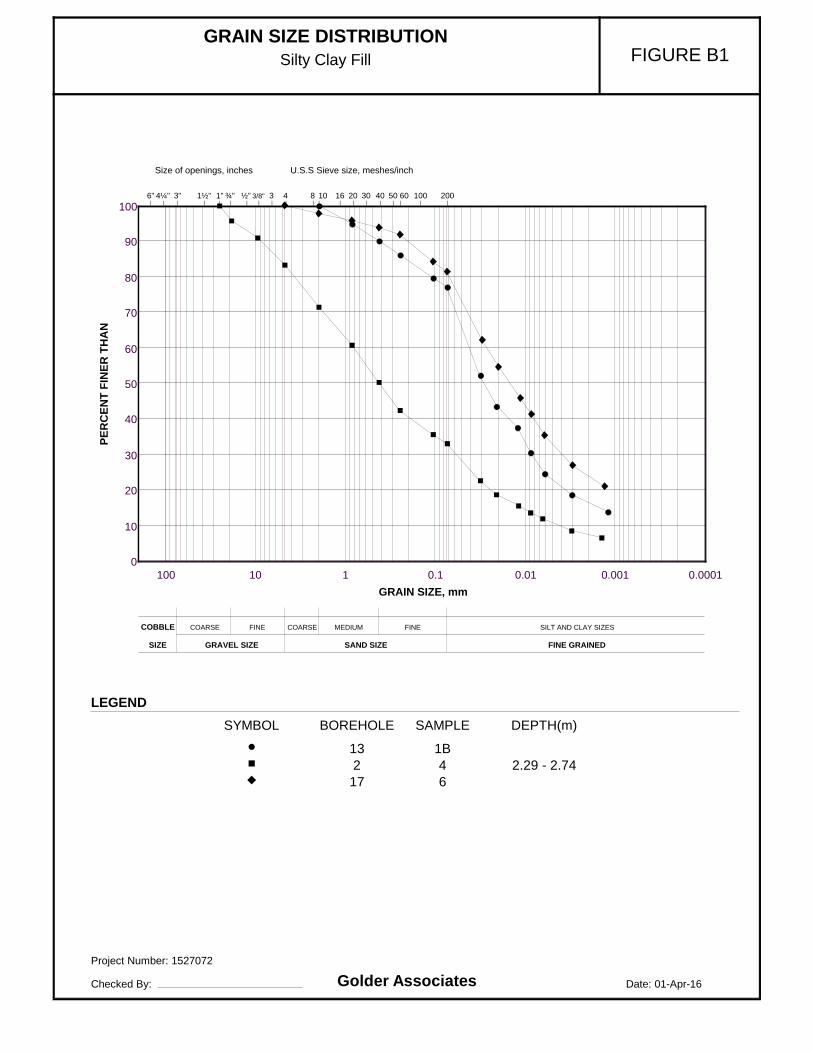
GRAIN SIZE DISTRIBUTION Silty Clay Fill FIGURE B1
Date: 01-Apr-16
Project Number: 1527072
Checked By: Golder Associates
LEGEND
BOREHOLE SAMPLE DEPTH(m)
13 1B 2 4 2.29 - 2.7417 6
SYMBOL
0.00010.0010.010.11101000
10
20
30
40
50
60
70
80
90
100
GRAIN SIZE, mm
PE
RC
EN
T F
INE
R T
HA
N
6" 3"4¼" 1½" 1" ¾" ½" 3/8" 3 4 8 10 16 20 30 40 50 60 100 200| | | | | | | | | | | | | | | | | | | |
Size of openings, inches U.S.S Sieve size, meshes/inch
COBBLE
SIZE
COARSE FINE COARSE MEDIUM FINE SILT AND CLAY SIZES
GRAVEL SIZE SAND SIZE FINE GRAINED
svodden
Typewritten Text
NLP

0
10
20
30
40
50
60
0 10 20 30 40 50 60 70 80 90 100
PL
AS
TIC
ITY
IN
DE
X
%
LIQUID LIMIT %
Figure No. B2
Project No. 1527072 PLASTICITY CHART
Silty Clay Fill
ML
ML or OL
MH or OH
CH
CL - ML
CI
SYMBOL
1B
LEGEND
BH SAMPLE
2 4
13
17 6
CL
Checked By:
svodden
Typewritten Text
NLP

GRAIN SIZE DISTRIBUTION Silt Fill FIGURE B3
Date: 01-Apr-16
Project Number: 1527072
Checked By: Golder Associates
LEGEND
BOREHOLE SAMPLE
5 4
SYMBOL
0.00010.0010.010.11101000
10
20
30
40
50
60
70
80
90
100
GRAIN SIZE, mm
PE
RC
EN
T F
INE
R T
HA
N
6" 3"4¼" 1½" 1" ¾" ½" 3/8" 3 4 8 10 16 20 30 40 50 60 100 200| | | | | | | | | | | | | | | | | | | |
Size of openings, inches U.S.S Sieve size, meshes/inch
COBBLE
SIZE
COARSE FINE COARSE MEDIUM FINE SILT AND CLAY SIZES
GRAVEL SIZE SAND SIZE FINE GRAINED
svodden
Typewritten Text
NLP
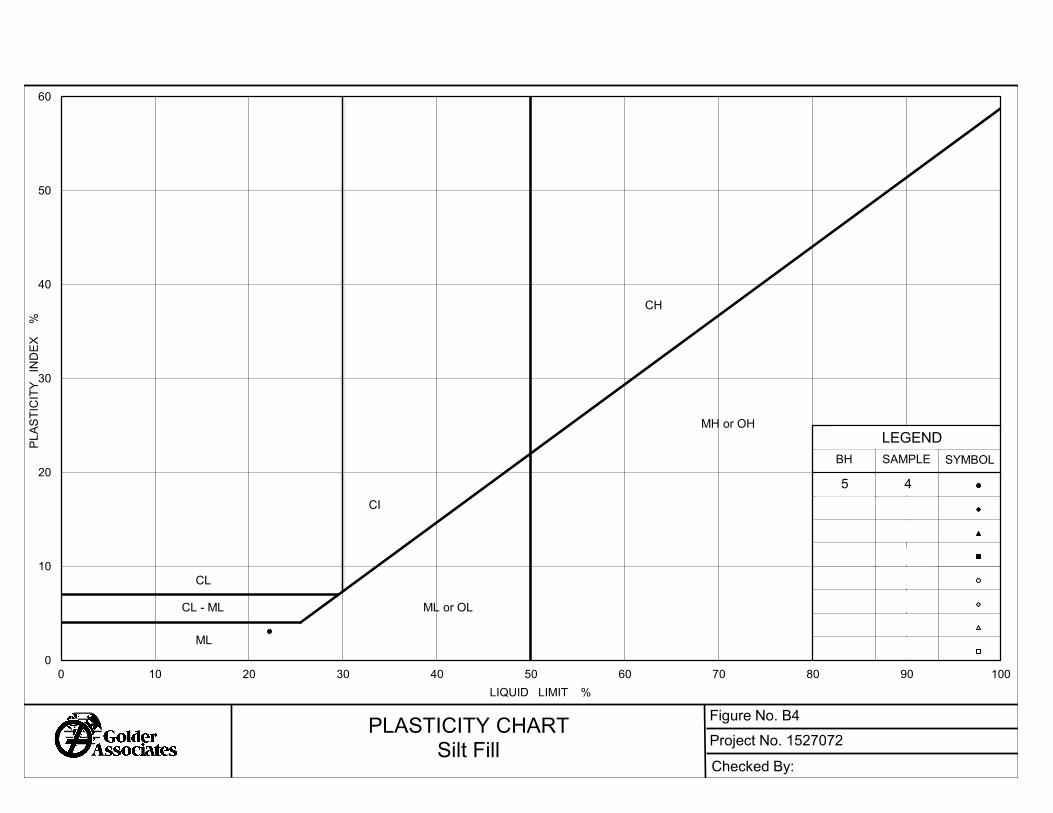
0
10
20
30
40
50
60
0 10 20 30 40 50 60 70 80 90 100
PL
AS
TIC
ITY
IN
DE
X
%
LIQUID LIMIT %
Figure No. B4
Project No. 1527072 PLASTICITY CHART
Silt Fill
ML
ML or OL
MH or OH
CH
CL - ML
CI
SYMBOL
LEGEND
BH SAMPLE
5 4
CL
Checked By:
svodden
Typewritten Text
NLP

GRAIN SIZE DISTRIBUTION Silty Sand to Sandy Silt Fill FIGURE B5
Date: 01-Apr-16
Project Number: 1527072
Checked By: Golder Associates
LEGEND
BOREHOLE SAMPLE
5 36 4
SYMBOL
0.00010.0010.010.11101000
10
20
30
40
50
60
70
80
90
100
GRAIN SIZE, mm
PE
RC
EN
T F
INE
R T
HA
N
6" 3"4¼" 1½" 1" ¾" ½" 3/8" 3 4 8 10 16 20 30 40 50 60 100 200| | | | | | | | | | | | | | | | | | | |
Size of openings, inches U.S.S Sieve size, meshes/inch
COBBLE
SIZE
COARSE FINE COARSE MEDIUM FINE SILT AND CLAY SIZES
GRAVEL SIZE SAND SIZE FINE GRAINED
svodden
Typewritten Text
NLP

GRAIN SIZE DISTRIBUTION Silty Clay Till FIGURE B6
Date: 01-Apr-16
Project Number: 1527072
Checked By: Golder Associates
LEGEND
BOREHOLE SAMPLE DEPTH(m)
1 2 7 4 3 5 3.05 - 3.515 6
SYMBOL
0.00010.0010.010.11101000
10
20
30
40
50
60
70
80
90
100
GRAIN SIZE, mm
PE
RC
EN
T F
INE
R T
HA
N
6" 3"4¼" 1½" 1" ¾" ½" 3/8" 3 4 8 10 16 20 30 40 50 60 100 200| | | | | | | | | | | | | | | | | | | |
Size of openings, inches U.S.S Sieve size, meshes/inch
COBBLE
SIZE
COARSE FINE COARSE MEDIUM FINE SILT AND CLAY SIZES
GRAVEL SIZE SAND SIZE FINE GRAINED
svodden
Typewritten Text
NLP

GRAIN SIZE DISTRIBUTION Clayey Silt to Silty Clay Till FIGURE B7
Date: 01-Apr-16
Project Number: 1527072
Checked By: Golder Associates
LEGEND
BOREHOLE SAMPLE
19 215 211 29 36 5
SYMBOL
0.00010.0010.010.11101000
10
20
30
40
50
60
70
80
90
100
GRAIN SIZE, mm
PE
RC
EN
T F
INE
R T
HA
N
6" 3"4¼" 1½" 1" ¾" ½" 3/8" 3 4 8 10 16 20 30 40 50 60 100 200| | | | | | | | | | | | | | | | | | | |
Size of openings, inches U.S.S Sieve size, meshes/inch
COBBLE
SIZE
COARSE FINE COARSE MEDIUM FINE SILT AND CLAY SIZES
GRAVEL SIZE SAND SIZE FINE GRAINED
svodden
Typewritten Text
NLP

0
10
20
30
40
50
60
0 10 20 30 40 50 60 70 80 90 100
PL
AS
TIC
ITY
IN
DE
X
%
LIQUID LIMIT %
Figure No. B8
Project No. 1527072 PLASTICITY CHART
Silty Clay Till
ML
ML or OL
MH or OH
CH
CL - ML
CI
SYMBOL
5
LEGEND
BH SAMPLE
1 2
3
5 6
7 4
9 3
11 2
15 2
19 2
CL
Checked By:
svodden
Typewritten Text
NLP

0
10
20
30
40
50
60
0 10 20 30 40 50 60 70 80 90 100
PL
AS
TIC
ITY
IN
DE
X
%
LIQUID LIMIT %
Figure No. B9
Project No. 1527072 PLASTICITY CHART
Clayey Silt Till
ML
ML or OL
MH or OH
CH
CL - ML
CI
SYMBOL
LEGEND
BH SAMPLE
6 5
CL
Checked By:
svodden
Typewritten Text
NLP

PRELIMINARY GEOTECHNICAL INVESTIGATION GLEN ABBEY GOLF CLUB REDEVELOPMENT
October 2016 Report No. 1527072 (2000)
APPENDIX C Previously Provided Slope Letter - Golder Associates Ltd.

Golder Associates Ltd.
100, Scotia Court, Whitby, Ontario, Canada L1N 8Y6 Tel: +1 (905) 723 2727 Fax: +1 (905) 723 2182 www.golder.com
Golder Associates: Operations in Africa, Asia, Australasia, Europe, North America and South America
Golder, Golder Associates and the GA globe design are trademarks of Golder Associates Corporation.
Dear Ms. Beckman,
As requested, Golder Associated Ltd. (Golder) has carried out a preliminary analysis of the setbacks required for
positioning the Top of Stable Slope line as part of the constraints mapping process for the site noted above.
As part of our review, Golder has reviewed currently available published geotechnical information and internal
geotechnical reports for the immediate area of the site, completed a site visit to assess the current condition of
the slopes and to observe any signs of active erosion present and reviewed the topographic mapping provided
by SCS Consulting Ltd. (SCS) which we understand was obtained by Malone Given Parsons (MGP) from the
Town of Oakville. In addition, we have relied upon previous information provided to ClubLink Properties Limited
in letter from Golder dated October 23, 1998.
Based on our review of the data noted above, our assessment of the current site conditions are as follows:
The site is primarily underlain by shale bedrock of the Queenston Formation which overlies the shale
bedrock of the Meaford-Dundas Formation. Local geotechnical information indicates that the shale is
overlain by 2 to 4 metres of a clay till material in the tableland area with the exception of the area of the site
adjacent to Upper Middle Road where up to 8 metres of soil was found overlying the bedrock. On the
valley slopes, the soils overlying the bedrock are typically comprised of completely weathered
shale/residual soil.
The slopes range in height from about 24 metres to 31 metres with the current slope profiles ranging from 1
horizontal to 1 vertical (1H:1V) to 1.9H:1V but typically in the range of 1.3H:1V. Flatter slopes in the range
of 3H:1V and 5H:1V are present south and east of the Canadian Golf Hall of Fame.
April 13, 2015 Project No. 1527072
Ms. Kim Beckman Davies Howe Partners, LLP 99 Spadina Avenue, 5th Floor Toronto, Ontario M5R 2Z2
PRELIMINARY STABLE SLOPE SETBACK ANALYSIS CRV SITE OAKVILLE, ONTARIO

Ms. Kim Beckman 1527072
Davies Howe Partners, LLP April 13, 2015
2/2
The slopes are well treed or grassed and are exhibiting only minor signs of surficial erosion with the
exception of one section where the creek is in direct contact with the slope and the shale bedrock is
exposed for almost the full height of the slope as a consequence of ongoing toe erosion.
Toe erosion is not an issue for the majority of the slope, as Sixteen Mile Creek is more than 15 metres
away from the toe of the slope in most areas. An approximately 250 metre section of the slope where the
creek and slope are close or in direct contact will be affected by the need for a toe erosion setback.
Stable slope angles for fresh shale bedrock would typically be considered to be in the order of about
1.4H:1V; for weathered shale slopes the stable slope angle is shallower and up to about 1.7H:1V. For the
soils anticipated at this site, the stable slope angle would typically range from 2H:1V to 3H:1V.
Based on the conditions noted above a conservative setback allowance (Stable Top of Bank Line as shown on
Figure 1) was developed based on a 1.9H:1V stable slope angle taken over the full height of the slope (to
encompass the weathered shale with nominal soil cover) along with a 5 metre toe erosion allowance where
required. A flatter stable slope angle (2.3H:1V) was used in the areas adjacent to Upper Middle Road to allow
for the thicker soils known to exist in that area. A total of nine slope cross-sections were reviewed and analysed
to develop the line.
Prior to final design, the Stable Top of Bank Line can be refined by carrying out detailed analyses of the slopes
once boreholes are advanced as part of the geotechnical assessment of the overall site and surveyed slope
profiles are available. The boreholes would confirm the actual type and thickness of the soil cover over the shale
and provide confirmation of the condition of the upper zones of the shale. In addition, updated topographic
information for specific section of the slopes will be required.
We trust this letter and its attachments are suitable for your current needs, if any point requires clarification
please do not hesitate to contact this office.
Yours truly,
GOLDER ASSOCIATES LTD.
Steven D. Keenan, C.E.T. Anne S. Poschmann, P.Eng. Prinicpal Principal SDK/ASP/sdk/js
CC: Ms. Sarah Kurtz – SCS Consulting Group Ltd.
Mr. Matthew James Cory – Malone Given Parsons Ltd. Attachments: Figure 1 – Stable Top of Slope Line, CRV Site, Oakville, Ontario
Figures 2 and 3 – Site Photographs
\\golder.gds\gal\barrie\active\2015\3 proj\1527072 geranium geotech hydrog oakville\correspondence\1527072 let 2015'04'13 preliminary stable slope setback analysis.docx

CONSULTANT
DESIGN
PREPARED
REVIEW
APPROVED
YYYY-MM-DD TITLE
PROJECT No. Rev.
PROJECTCLIENT
Path
: \\g
olde
r.gds
\gal
\Mis
siss
auga
\SIM
\Clie
nts\
Ger
aniu
m\P
roje
ct_C
RV_
Oak
ville
\99_
PRO
J\15
2707
2\40
_PR
OD
\000
1_Sl
ope_
Anal
ysis
\ |
File
Nam
e: 1
5270
72_0
001_
BG_0
001.
dwg
025
mm
IF T
HIS
MEA
SUR
EMEN
T D
OES
NO
T M
ATC
H W
HAT
IS S
HO
WN
, TH
E SH
EET
SIZE
HAS
BEE
N M
OD
IFIE
D F
RO
M: A
NSI
B
1527072CONTROL
FIGURE
1----
2015-04-13
MK
PROJECT CRVOAKVILLE, ONTARIO
CLUBLINK CORPORATION ULC
TOP OF STABLE SLOPE ANALYSIS0
1:6,000 METRES
200100
TOP OF STABLE SLOPE
PROPERTY BOUNDARIES
LEGEND
REFERENCE
BASE PLAN RECEIVED IN AN E-MAIL FROM SCS CONSULTING GROUP, DATED APRIL 10, 2015.SDK

Figure 2 - SITE PHOTOGRAPHS Slope Stability Setback Analysis
Image 1: Active Erosion of Slope – Contact with Sixteen Mile Creek
Image 2: Typical Slope West of Clubhouse
Project No. 1527072 Golder Associates Ltd. Inputted by: JS Date: April 13, 2015 Checked by: SDK

Figure 3 - SITE PHOTOGRAPHS Slope Stability Setback Analysis
Image 3: Slope Section where Toe Erosion Setback Required
Image 4: Flatter Slope Sections East of Canadian Golf Hall of Fame
Project No. 1527072 Golder Associates Ltd. Inputted by: JS Date: April 13, 2015 Checked by: SDK
Golder Associates Ltd.
121 Commerce Park Drive, Unit L
Barrie, Ontario, L4N 8X1
Canada
T: +1 (705) 722 4492