15 michael mc carty pv geographic smoothing effect - epri-sandia symposium - final
19
PV Geographic Smoothing Effect Michael McCarty, Andu Nguyen, and Sarah Walinga Grid Engineering Solutions May 10 th , 2016 EPRI-Sandia PV Systems Symposium
-
Upload
sandia-national-laboratories-energy-climate-renewables -
Category
Technology
-
view
237 -
download
3
Transcript of 15 michael mc carty pv geographic smoothing effect - epri-sandia symposium - final

PV Geographic Smoothing Effect
Michael McCarty, Andu Nguyen, and Sarah WalingaGrid Engineering Solutions
May 10th, 2016EPRI-Sandia PV Systems Symposium

SolarCity Confidential Slide 2 2
SolarCity’s national scope and breadth of experience can help you save on energy costs.
2,000+ Commercial projects
1,600+ MW installed400+ School installations
26 States with installations
9 Years of experience
14,000+ Employees
$9 Billion+ Of solar projects
The national leader in solar, SolarCityhas:
SolarCity has experience addressing major challenges.
We reduce your energy expenses.Our customers buy energy from us at a lower rate than they currently pay for electricity from utilities, with no up front cost.
We offer predictable energy prices.You’ll be able to accurately predict and manage your energy costs for 20 or more years.
We help you switch to solar seamlessly.Our experienced professionals take care of every step of the process, making the transition to solar as smooth as possible for our customers.
80+ Operation centers
Source: National leader according to the Q1 2015 GTM Research U.S. PV Leaderboard. “States currently served” data as of 8/11/15; “Facilities,” “Employees” and “MW Deployed” data as of 6/30/15; “School installations” data as of 9/24/14; “Commercial projects” data as of 4/22/15; “Funds raised to finance solar projects” data as of 5/28/15.
SolarCity Confidential Slide 3 3
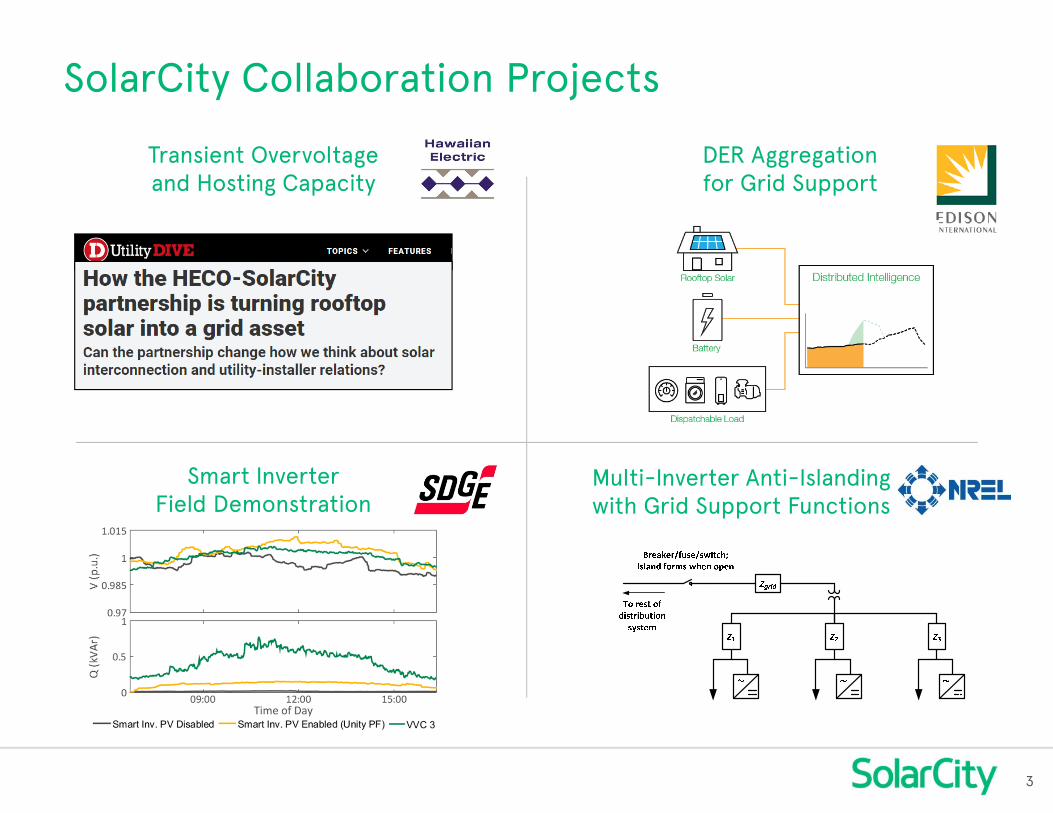
SolarCity Collaboration Projects
Transient Overvoltageand Hosting Capacity
DER Aggregation for Grid Support
Smart Inverter Field Demonstration
Multi-Inverter Anti-Islanding with Grid Support Functions
SolarCity Confidential Slide 4 4
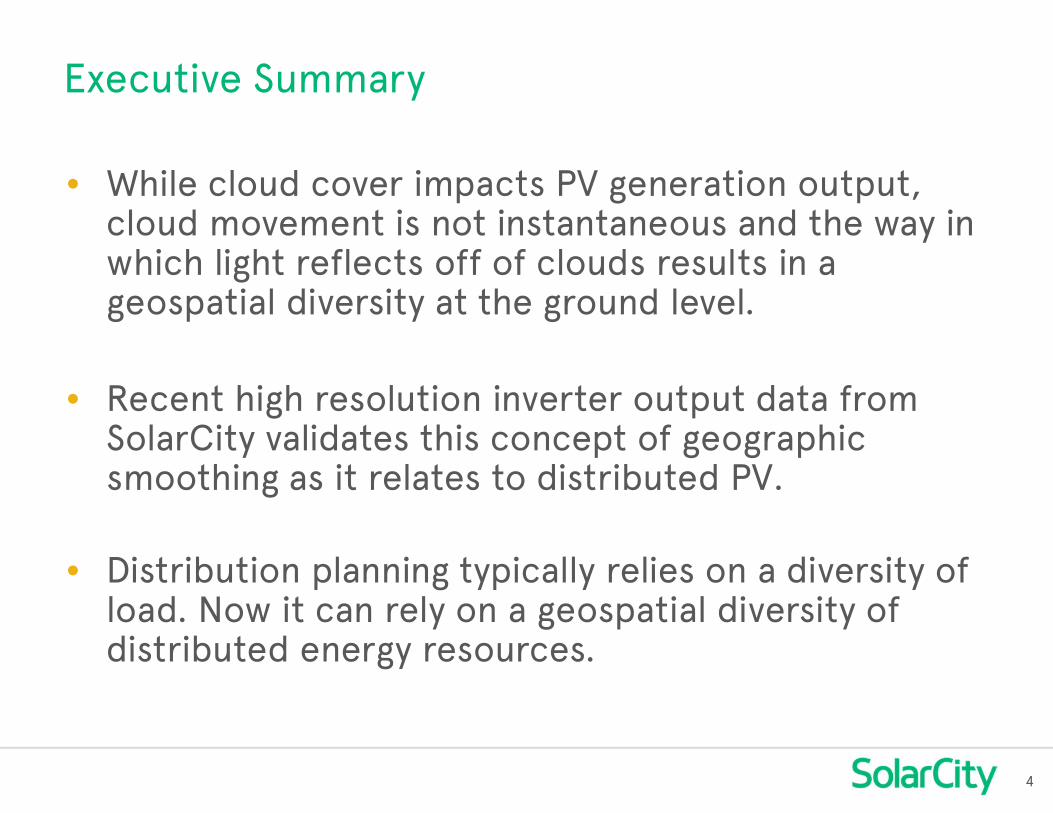
• While cloud cover impacts PV generation output, cloud movement is not instantaneous and the way in which light reflects off of clouds results in a geospatial diversity at the ground level.
• Recent high resolution inverter output data from SolarCity validates this concept of geographic smoothing as it relates to distributed PV.
• Distribution planning typically relies on a diversity of load. Now it can rely on a geospatial diversity of distributed energy resources.
Executive Summary
SolarCity Confidential Slide 5 5
Agenda
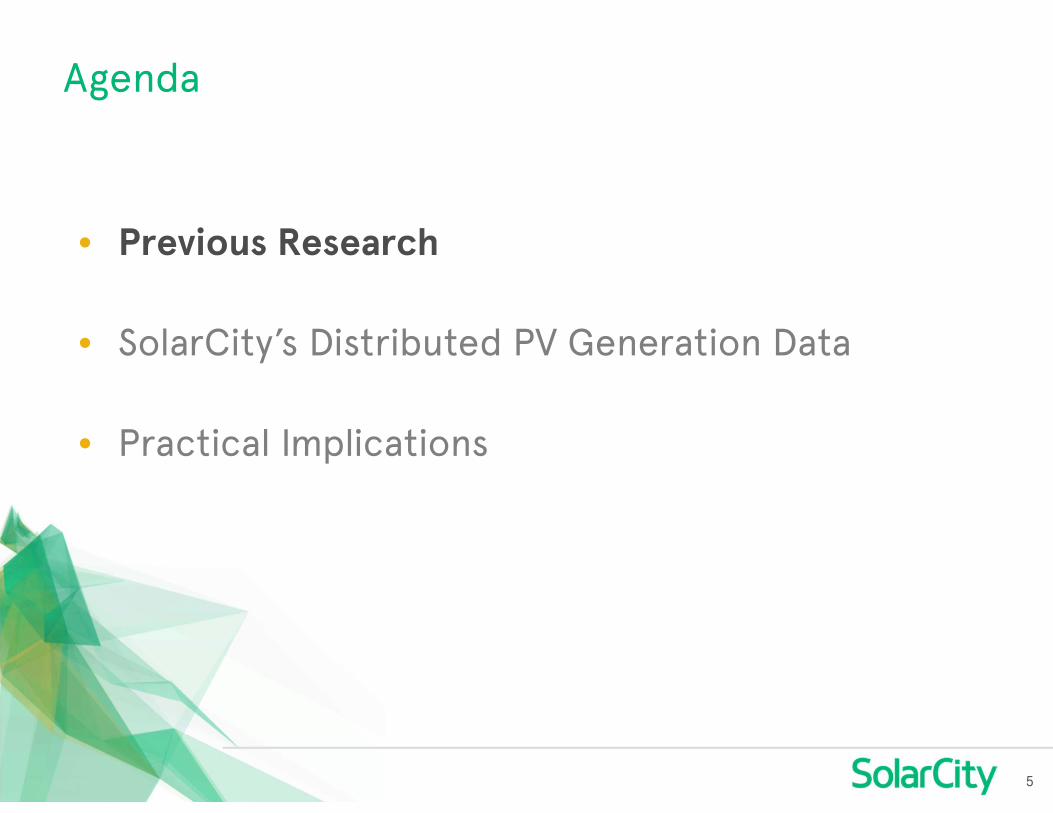
• Previous Research
• SolarCity’s Distributed PV Generation Data
• Practical Implications
SolarCity Confidential Slide 6 6
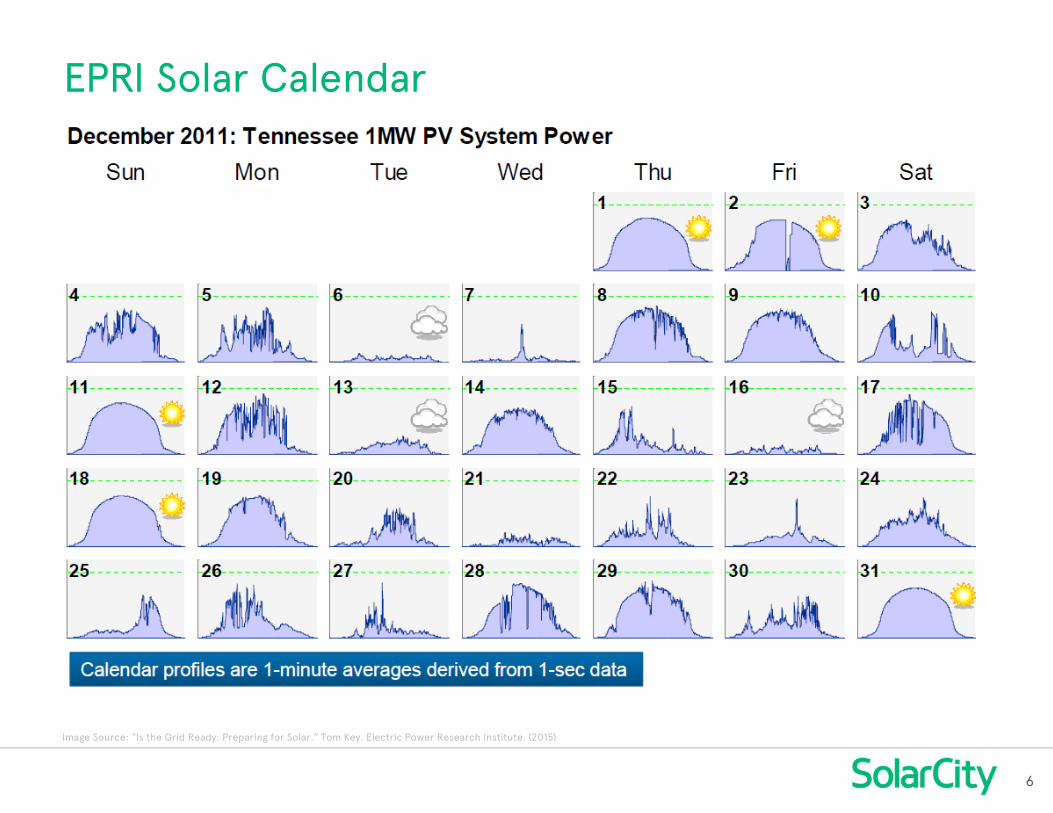
EPRI Solar Calendar
Image Source: “Is the Grid Ready: Preparing for Solar.” Tom Key. Electric Power Research Institute. (2015)

SolarCity Confidential Slide 7 7
Sandia’s Ota City Study2 MW over 0.15 mi2 and 553 Homes
Image Source: “Ota City: Characterizing Output Variability from 553 Homes with Residential PV Systems on a Distribution Feeder.” Lave et al. Sandia National Labs. (2011)

SolarCity Confidential Slide 8 8
Agenda
• Previous Research
• SolarCity’s Distributed PV Generation Data
• Practical Implications

SolarCity Confidential Slide 9 9
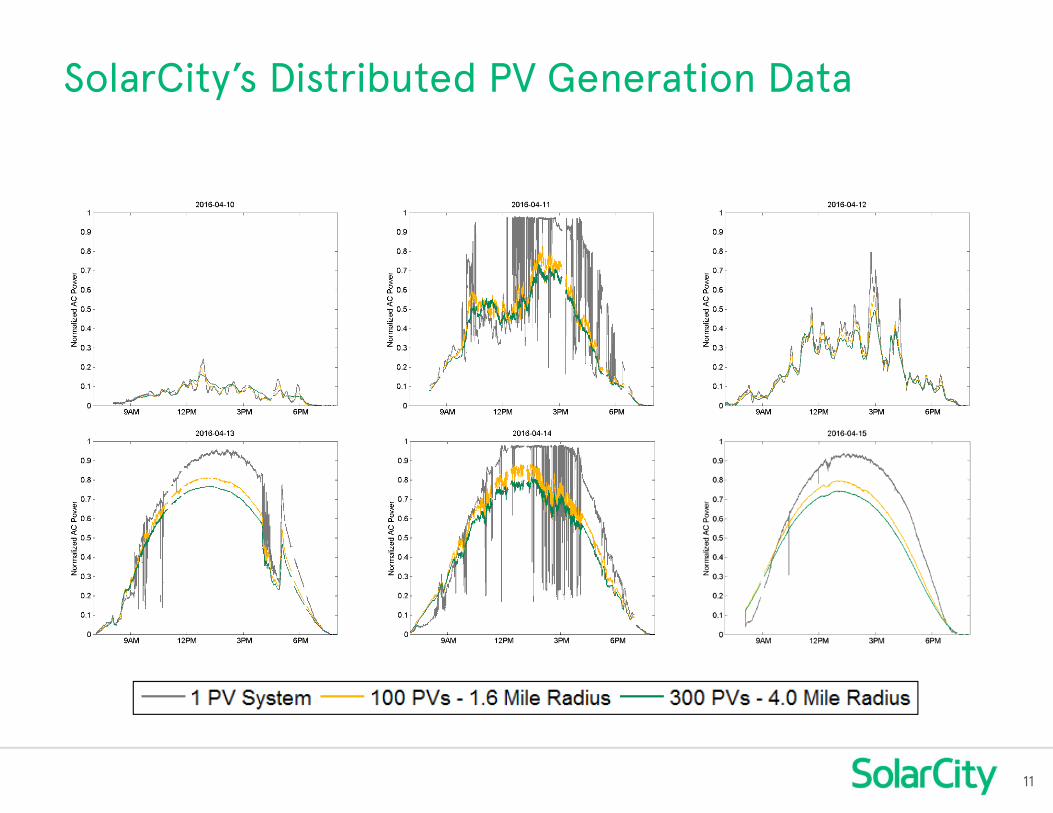
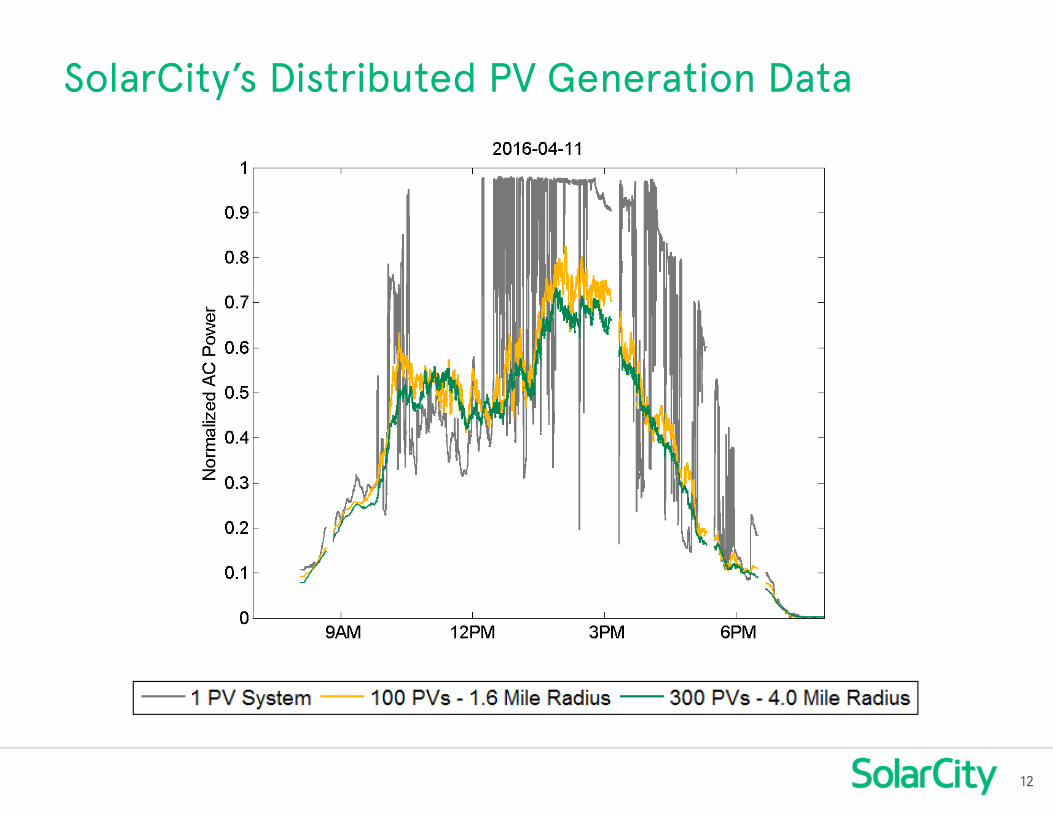
SolarCity’s Distributed PV Generation Data
• Data was collected in San Jose from 4/01 to 4/22 at one to five second intervals.
Representing Radius (miles) Number of Inverters
AC Nameplate (kW)
Line Regulator 1.6 100 400Load Tap Changer 4 300 1300

SolarCity Confidential Slide 10 10
SolarCity’s Distributed PV Generation Data
: ⋯
⋯
SolarCity Confidential Slide 11 11
SolarCity’s Distributed PV Generation Data
SolarCity Confidential Slide 12 12
SolarCity’s Distributed PV Generation Data

SolarCity Confidential Slide 13 13
SolarCity’s Distributed PV Generation Data
• Per unit max output swing in any one minute decreases as the area covered increases.

SolarCity Confidential Slide 14 14
SolarCity’s Distributed PV Generation Data
• For the 1.6 mile radius in any one minute interval, a max output swing greater than 5% was seen only 234 times (1.5% of time studied).
• A max output swing greater than 10% was seen only 5 times (0.03% of the time studied).
Count of One Minute Intervals with a Maximum Output Swing > X%
> 5% > 10% > 15%1.6 Mile Radius 234 5 1
4 Mile Radius 7 0 0
SolarCity Confidential Slide 15 15
Agenda
• Previous Research
• SolarCity’s Distributed PV Generation Data
• Practical Implications

SolarCity Confidential Slide 16 16
Voltage Flicker
• Flicker, fluctuation, and deviation often used interchangeably.
• GE curve has been superseded, but flicker intensity is challenging to proactively determine.
Image Source: IEEE

SolarCity Confidential Slide 17 17
• When calculating voltage deviation or flicker, use a ΔP (kW) of less than 100% of nameplate.
• This is a worst case scenario. The change in voltage in modeling software will be less.
Voltage Flicker
100% ⇒ ∆ 3400
3 ∗ 1000 ∗ 121.9%
30% ⇒ ∆ 30%
330% ∗ 4003 ∗ 1000 ∗ 12
0.6%

SolarCity Confidential Slide 18 18
• Tap operations can be similarly smoothed.
• Due to the smoothing effect, regulator is more likely to remain at new tap position or reset.
Tap Operations
; 6
10%∆ ⇒ 10% ∗ 0.5 ∗ 6 0.3 0.75
50% ⇒ 0.5

SolarCity Confidential Slide 19 19
Michael McCarty, PEPrincipal Engineer, Grid Engineering SolutionsSolarCity
[email protected]/gridx
Questions?