
Relationship Of profitability and Capital structure practices in Jindal steel and saw

�Jindal Saw Limited ACMIIL
Jindal Saw Ltd
AnalystChinmay S. [email protected]: (022) 2858 3407
Key Data INR
CMP 589.5
Key Data
Bloomberg Code JSAW IN
Reuters Code JIND.BO
BSE Code 500378
NSE Code JINDALSAW
Face Value (INR) 10
Market Cap. (INR mn.) 31275
52 Week High (INR) 1,224.90
52 Week Low (INR) 523.00
Avg. Daily Volume (6m) 70018
Beta (Sensex) 1.02
F&O
Market Lot 250
Turnover (INR mn) 20.84
Shareholding %
Promoters 43.76
Mutual Funds / Bank/ FI 17.21
Foreign Institutional Investors 17.09
Bodies Corporate/Individuals/Others
21.94
Total 100.0
Particulars FY06 CY07
(15M)
CY08E CY09E
Revenues
(Rs. mn)
38,731 70,157 37,684 52,782.4
Op. Profit
(Rs. mn)
4,065 8,008 4,099 5,111
OPM % 10.5 11.4 10.9 9.7
PAT (Rs.
mn)
1,649 13,293 1,699.2 2,361.9
EPS (Rs.) 34.1 259.9 30.3 38.5
FY06: September Ending
15 May, 2008
R E D U C E
IntroductionJindal Saw Ltd (JSL), promoted by Mr. O P Jindal started its operations in1984. JSL is the largest pipe manufacturer in India offering total pipe solutions. It manufactures SAW Pipes, Ductile Iron (DI) Pipe and Seamless Tubes, which find their application in exploration and transportation of oil, gas and water infrastructure projects. JSL’s major focus is on international market especially Middle east, with over 60% of its revenues coming from exports. JSL is accredited by major international Oil & Gas players.
Investment RationaleGlobal & domestic demand for pipe: Total world demand for pipes is estimated at USD 74 bn (235,171 km) for next five years from 2007-2011 (Source: Simdex). The major portion of world demand for pipes is expected to come from Middle East and Asian countries constituting over 45% of the world demand followed by North America (33%) and Europe (15%). There also exits a strong domestic demand for SAW pipes. Domestic demand for SAW pipes is approximately USD 5.5 bn. Indian player due to their locational advantage carry potential to cater to entire domestic demand of USD 5.5 bn.Capacity Addition: In order to tap growing global as well as domestic demand for pipes, JSL is undertaking significant capacity addition. Installed capacity will increase from 1.25 mn tonne pa to 1.95 mn tonne pa by CY08 and will be major volume driver. Capacity build up will mainly address growing demand from Middle East and India.Strong Order book: JSL has a strong order book of USD 1 bn, executable by January 2009. Current order book is equivalent to 1.2x times of JSL’s 2007 sales (annualized) from Indian operations.
Valuation and RecommendationWe believe that there is opportunity in global pipes and tubes sector and JSL being one of the leading player in the industry is likely to benefit from the incremental demand. However, to curb inflation and growing steel prices, Government has taken a policy stance to increase domestic supply of steel by reducing import duty on steel and discouraging exports of steel by imposing export duty. In this, steel tubes and pipes are also included. According to the notice of amendments government has proposed
20% duty on exports of steel pipes and tubes, but has issued a notification No.66/2008-Customs which levies custom duty of 10% on such exports.
This action seems to be temporary stand taken by Government. However such levy would definitely have a negative impact on company’s earnings till date such levy remains enforced. Our impact analysis shows that if export duty stays for CY08 then CY08E EPS will come down to Rs 30.3 from our estimates of Rs 52.11 (Annexure I: Without considering impact of export duty). The sharp decline in EPS of JSL is due to decrease in operating margins, as manufacturers like JSL would not be able to pass on the additional burden of export duty. Reduction in EPS will also negatively impact the company’s cash flows and its debt repayment capacity.

�Jindal Saw Limited ACMIIL
We have also done an impact analysis on quarterly basis for CY08E, we observe that if export duty remains levied for Q2CY08, Q3CY08, Q4 CY08, its EPS for CY08E would reduce to Rs 48.12, 40.66 and 30.29 respectively.Similarly if duty remains levied for another year i.e. CY09, its EPS may reduce down to Rs 38.5 from our estimate of Rs 81.91 (Annexure I: Without considering impact of export duty).
Rs. mn
Particulars Without Export Duty With Export Duty Without Export Duty With Export Duty
CY08E CY08E Difference (%) CY09E CY09E Difference(%)
Net Sales 39,396.60 37,684.55 -4.35 56,249.36 52,782.40 -6.16
Operating Profits 5,811.00 4,098.95 -29.46 8,578.03 5,111.07 -40.42
PAT 2,923.28 1,699.22 -41.87 5,031.03 2,361.93 -53.05
Operating Profit Margin (%) 14.75 10.88 -26.26 15.25 9.68 -36.5
Net Profit Margin (%) 7.42 4.51 -39.23 8.94 4.47 -49.97
EPS (Rs.) 52.11 30.29 -41.87 81.91 38.45 -53.05
(Source: ACMIIL Research, Annexure I)
Hence, we at present, recommend clients to reduce the exposure. If steel ministry is able to convince the Government then export duty may be rolled back. At this juncture it is advisable for investors to be cautious and avoid fresh investments.

�Jindal Saw Limited ACMIIL
Why to look at Indian pipe Industry now:
The setting up of transportation infrastructure in wake up of burgeoning crude prices, uneven resources for Oil and Gas, is increasing demand for SAW pipes (exhibited in diagram below). Indian pipe sector is set to capitalize on the booming global demand for pipes. Around US$118 billion global opportunity (SAW +SEAMLESS) is likely to unfold in next five years (FY2007-11) (Source: Steel world Research). Urgency to create oil and gas transportation in infrastructure due to burgeoning crude oil prices and rising depletion of global crude reserves is stimulating global demand for SAW (Submerged Arc Welded pipes used in oil and gas transportation) and Seamless pipe (used in oil and gas exploration). Indian pipe manufacturers are set to benefit from the global demand-supply imbalance and their participation in the global demand boom is visible from their expanding order book. With such robust demand drivers in place for this industry, Indian pipe manufacturers look an attractive bet. Brief profile for industry:
Types and Characteristics of Pipes: SAW pipes are large diameter pipes, which are manufactured by welding the edges of steel plates or by spiral Welding of hot rolled coil (HR coil). The SAW pipes manufactured from plates are called LSAW. There is longitudinal welding in LSAW pipes. HSAW pipes are made from HR coil, where in the coil is welded spirally to give a shape of pipe. In HSAW pipes the length of welding is larger as compared to that in LSAW. Depending on the length of welding, the HSAW pipes are perceived to be weaker as compared to the LSAW pipes.
Burgeoning global crude oil prices is stimulating global
demand for SAW pipes
�Jindal Saw Limited ACMIIL
LSAW-Longitudinal Submerged Arc Welded
HSAW-Helical Submerged Arc Welded
ERW- Electric Resistance Weld
DI- Ductile iron
CI- Cast iron
Source: ACMIIL Research.
Demand drivers for pipe industry
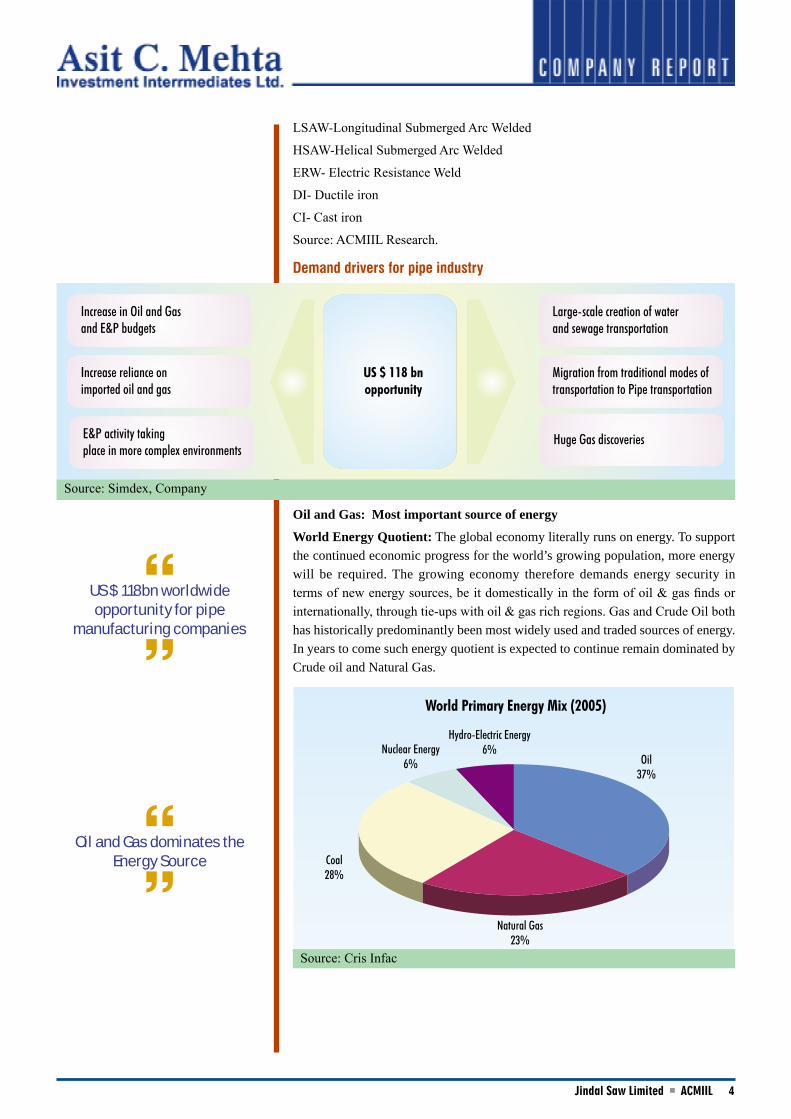
Oil and Gas: Most important source of energy
World Energy Quotient: The global economy literally runs on energy. To support the continued economic progress for the world’s growing population, more energy will be required. The growing economy therefore demands energy security in terms of new energy sources, be it domestically in the form of oil & gas finds or internationally, through tie-ups with oil & gas rich regions. Gas and Crude Oil both has historically predominantly been most widely used and traded sources of energy. In years to come such energy quotient is expected to continue remain dominated by Crude oil and Natural Gas.
Source: Simdex, Company
Source: Cris Infac
US $ 118bn worldwide opportunity for pipe
manufacturing companies
Oil and Gas dominates the Energy Source

�Jindal Saw Limited ACMIIL
Distribution pattern for Reserves and Consumption for Oil and Gas:
Middle East countries controlling nearly 60% of world reserves for Oil and nearly 40% for Natural Gas have predominantly dominated reserves for Oil and Gas. Whereas demand for crude oil and Gas is dominated by OECD countries (North America, Europe and Pacific) consuming nearly 55% of world’s crude oil and 51% of natural gas demand.
To meet its energy requirement such energy deficit countries have to either:
1) Explore more domestic reserves , or
2) To trade from oil and gas rich countries
Increasing Oil and Gas Exploring and Processing activities:Global Scenario: The unprecedented and continued firmness in crude oil prices, depleting output from productive oilfields and increasing demand have resulted in significant investments from oil majors in hectic E&P activities. This is evident from the sharp increase in the rig count (number of rigs developed for E&P activities). Demand for seamless pipe is directly correlated with number of Rigs. With number of Rigs count increasing progressively it spells boom for pipe manufacturers as it would translate into growth in demand for seamless pipes(used for exploration) and for line transportation pipes used for transporting oil and gas over long distances.
Source: Crisil Research
Source: Crisil Research
Uneven distribution of Reserves and consumption
destination lures out need for transporting Oil and Gas
Increased E&P activities subsequently leads to need for
transportation

�Jindal Saw Limited ACMIIL
Crude Oil Trade Scenario(2005): Subsequent to oil exploration incepts a need for transporting.
The Middle East accounted for the largest share in global crude oil exports with 46.0 per cent, followed by the FSU with 14.2 per cent; North America accounted for the largest share in imports with a share of 29 per cent, with USA being the largest importer in the region (the country accounted for 26.5 per cent in total global oil imports). China and other Asian countries together accounted for 26.3 per cent of total crude oil imports.
Expected Crude Oil trade scenario(2011):
Besides the Middle East, Other Asia and China are expected to significantly augment their refining capacities. Together, they are likely to account for 40 per cent of the incremental refining capacity being added by 2011, thus adding to their crude oil requirements. These regions are expected to emerge as the largest importers of crude oil, with a share of 31 per cent of the total crude oil import. With no major refinery capacity being added, the share of North America and Europe. the erstwhile largest importers . is likely to decline. The share of North America is likely to fall from 29.0 per cent in 2005 to 27.1 per cent of the total oil imported in 2011, while Europe’s share is likely to reduce from 27.8 per cent in 2005 to 26.0 per cent in 2011.
Source: CRISIL Research
Source: CRISIL Research
�Jindal Saw Limited ACMIIL
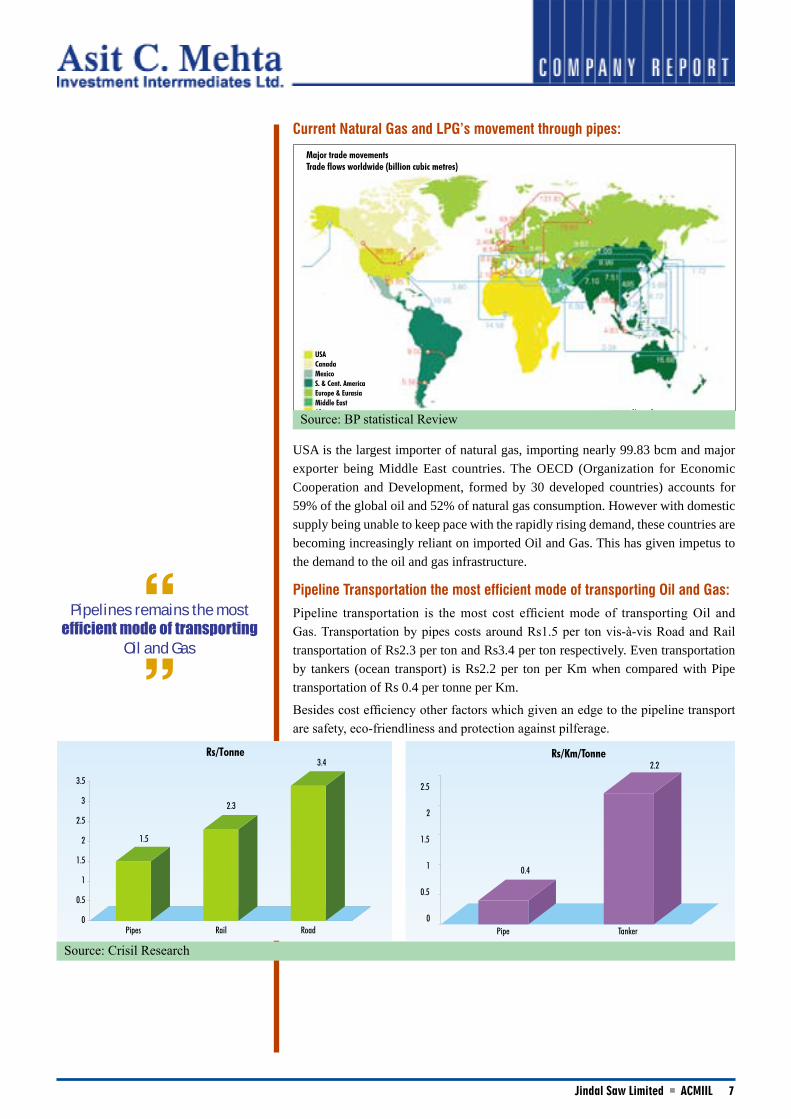
Current Natural Gas and LPG’s movement through pipes:
USA is the largest importer of natural gas, importing nearly 99.83 bcm and major exporter being Middle East countries. The OECD (Organization for Economic Cooperation and Development, formed by 30 developed countries) accounts for 59% of the global oil and 52% of natural gas consumption. However with domestic supply being unable to keep pace with the rapidly rising demand, these countries are becoming increasingly reliant on imported Oil and Gas. This has given impetus to the demand to the oil and gas infrastructure.
Pipeline Transportation the most efficient mode of transporting Oil and Gas:
Pipeline transportation is the most cost efficient mode of transporting Oil and Gas. Transportation by pipes costs around Rs1.5 per ton vis-à-vis Road and Rail transportation of Rs2.3 per ton and Rs3.4 per ton respectively. Even transportation by tankers (ocean transport) is Rs2.2 per ton per Km when compared with Pipe transportation of Rs 0.4 per tonne per Km.
Besides cost efficiency other factors which given an edge to the pipeline transport are safety, eco-friendliness and protection against pilferage.
Source: BP statistical Review
Source: Crisil Research
Pipelines remains the most efficient mode of transporting
Oil and Gas

�Jindal Saw Limited ACMIIL
Global opportunity
Indian pipes manufacturers set to capture worldwide deficit for SAW Pipes
Demand for Pipeline transport
Planned Projects
Total Length (Km)
Share in demand
Required tonnage (Mn tonnes)
Total Value (US $bn)
Addressable Mkt size for Indian Players
Addressable for Indian Players (US $bn)
North America 141 49724 21% 15 16 10% 1.6
Latin America 41 27941 12% 8 9 2% 0.2
Europe 73 34591 15% 10 11 2% 0.2
Africa 22 10098 4% 3 3 15% 0.5
Middle East & Asia 165 107832 46% 32 34 40% 13.6
Australasia 12 4985 2% 1 2 5% 0.1
Total 454 235171 71 74 16
Assumption:
1) 1km=303.5ton
2) Avg Realizations= US$1050 /ton
Source: SIMDEX, ACMIIL Research.
According to Simdex (Future pipeline worldwide guide) Total world demand for pipeline is estimated at 71mn tonnes for next five years from 2007-2011. The major portion of world demand for pipelines is expected to flow from Middle East and Asian countries demanding over 45% of world demand followed by American countries 33% and European countries 15%. This demand scenario clearly indicates three leading markets for pipes industry i.e Middle East & Asia, America and Europe.
World Supply scenario: India controlling more than 15% of world supply for pipes
Capacities worldwide for saw and seamless pipes:
Name Country Mn tonne
Sumitomo Japan 3
Nippon Steel Japan 2.8
JFE (Kawasaki) Japan 2.5
Seah Steel Korea 1.2
Hyundai Pipe Co Korea 1
V&M (Now Europ) Germany 2.5
Europipe Germany 1.1
Illva Italy 1.6
Vyksa Steel Russia 1.5
Volzsky Pipe Russia 1.3
Corus UK 0.6
Khartsyzsk Tube Ukraine 1.8
Oregon, USA 0.4
Berg USA 0.4
Ippsco Canada 1.2
Welland Pipe Canada 0.5
Confab Industrial Brazil 0.5
Jindal Saw India 1.25
PSL India 1.1
Welspun Gujarat India 1
Man Industries India 1
Source: Industry, ACMIIL ResearchNote: Capacities mentioned are nameplate capacities i.e (theoretical).
10.5 mn tonne
10.4 mn tonne
2.5 mn tonne
4.35 mn tonne
Indian players well poised to capture world demand

�Jindal Saw Limited ACMIIL
Worldwide supply for SAW pipes is estimated at 16 mn tonnes (Metal bulletin Research 2006, Company). Of companies mentioned above majority of them are catering to world’s demand for seamless pipes. Only about 65-70% of these capacities are considered as operable (Source:Industry). Japan and Korea leads the world supply for pipes controlling nearly 40% of world supply followed by European countries controlling 35%and India contributing nearly 15% to the world capacities.
All major linepipe manufacturing companies in America, Russia, and Europe have their order book full in respect with their capacities and new capacities are yet to come on the floor (probably in late FY2010 or FY2011) (shown in table below). With domestic demand in India for pipelines still being under explored and capacities already in setup, Indian companies are in a sweet spot to explore worldwide demand for Pipes.
We have not considered Chinese players while finding out current world capacities because as a Chinese market had huge internal demand for pipes, thus leaving limited room for exports by Chinese companies. However with internal demand meeting up gradually and newer capacities added up in coming years we can’t rule out some competition coming from Chinese players especially in LSAW market. However we don’t expect competition to be stiff enough in short term primarily due to two reasons
1) Accreditations procedure are long drawn which will take Chinese players’ time to penetrate into them posing threat to world market.
2) Chinese government has been imposing additional duties on export of such pipes which discourages exports of the same.
New SAW pipe capacities (planned for next 2-3 years)
Company Country Mn Tonnes
Baosteel China 0.40
Khartsyzsk Ukraine 0.20
Arabian pipes Saudi Arabia 0.30
Europipe/Ahwaz Iran 0.40
Europipe/V&M Brazil 0.09
Severstal - Izhora 2 Russia 0.45
Iraq Industry of Minerals Iraq 0.35
OMK Russia 0.35
Total LSAW 2.54
Berg USA 0.20
TMK Russia 0.07
Alison China 0.15
Borusan Mannesmann Turkey 0.20
Borusan Mannesmann Central Asia 0.20
Ipsco USA 0.20
Oregon Steel USA 0.22
Iraq Industry of Minerals Iraq 0.15
USS-POSCO-SeAH USA 0.30
PSL USA 0.30
Welspun USA 0.30
Jindal Saw India 0.20
Total HSAW 2.49
Total HSAW + LSAW 5.03
Source: Metal Bulletin Research, ACMIIL Research
Clear deficit in world market for saw pipes
�0Jindal Saw Limited ACMIIL
Total of 5 mn tonne capacities are expected to be added up worldwide within next three years. However as explained above such capacities are name plate capacities. Only 3 to 3.5mn tonne are expected to be operational. Such capacities are expected to be added up in phases and all capacities are expected to be added up by 2010. Thus we see from FY2011 onwards markets shrinking marginally for pipe industry due to such capacity addition, but however volume growth would still drive this industry further in passing years.
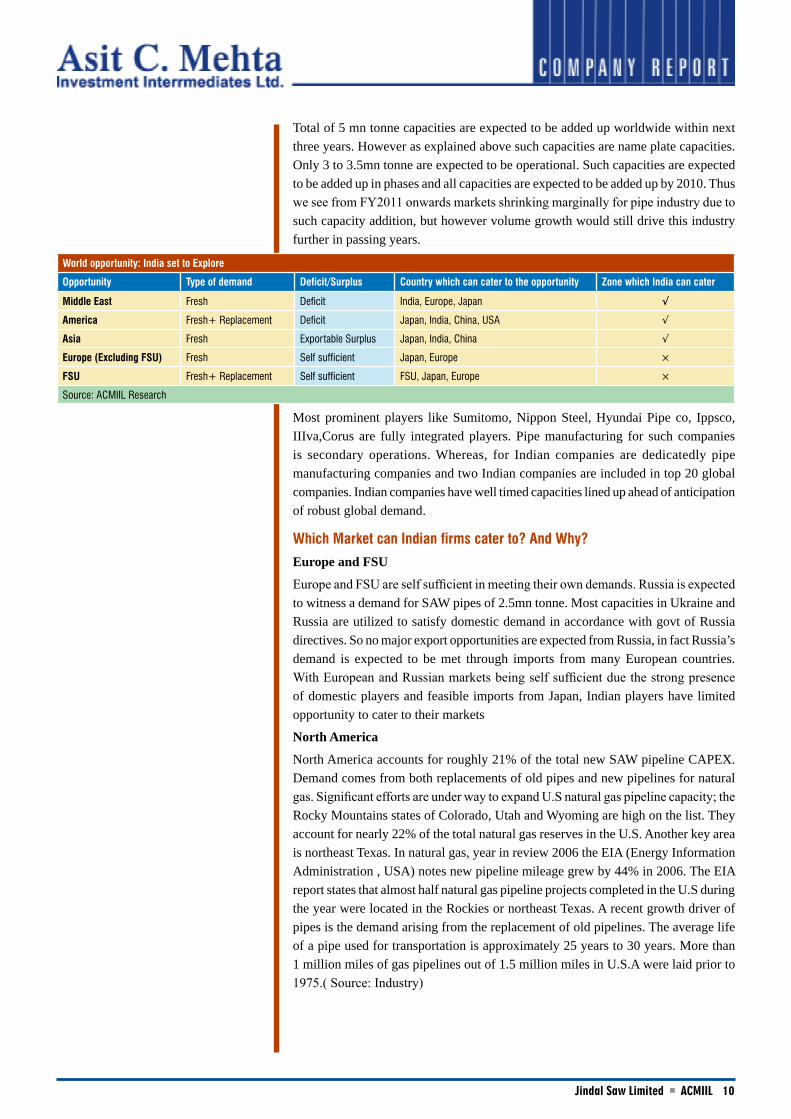
World opportunity: India set to Explore
Opportunity Type of demand Deficit/Surplus Country which can cater to the opportunity Zone which India can cater
Middle East Fresh Deficit India, Europe, Japan √
America Fresh+ Replacement Deficit Japan, India, China, USA √
Asia Fresh Exportable Surplus Japan, India, China √
Europe (Excluding FSU) Fresh Self sufficient Japan, Europe ×
FSU Fresh+ Replacement Self sufficient FSU, Japan, Europe ×
Source: ACMIIL Research
Most prominent players like Sumitomo, Nippon Steel, Hyundai Pipe co, Ippsco, IIIva,Corus are fully integrated players. Pipe manufacturing for such companies is secondary operations. Whereas, for Indian companies are dedicatedly pipe manufacturing companies and two Indian companies are included in top 20 global companies. Indian companies have well timed capacities lined up ahead of anticipation of robust global demand.
Which Market can Indian firms cater to? And Why?
Europe and FSU
Europe and FSU are self sufficient in meeting their own demands. Russia is expected to witness a demand for SAW pipes of 2.5mn tonne. Most capacities in Ukraine and Russia are utilized to satisfy domestic demand in accordance with govt of Russia directives. So no major export opportunities are expected from Russia, in fact Russia’s demand is expected to be met through imports from many European countries. With European and Russian markets being self sufficient due the strong presence of domestic players and feasible imports from Japan, Indian players have limited opportunity to cater to their markets
North America
North America accounts for roughly 21% of the total new SAW pipeline CAPEX. Demand comes from both replacements of old pipes and new pipelines for natural gas. Significant efforts are under way to expand U.S natural gas pipeline capacity; the Rocky Mountains states of Colorado, Utah and Wyoming are high on the list. They account for nearly 22% of the total natural gas reserves in the U.S. Another key area is northeast Texas. In natural gas, year in review 2006 the EIA (Energy Information Administration , USA) notes new pipeline mileage grew by 44% in 2006. The EIA report states that almost half natural gas pipeline projects completed in the U.S during the year were located in the Rockies or northeast Texas. A recent growth driver of pipes is the demand arising from the replacement of old pipelines. The average life of a pipe used for transportation is approximately 25 years to 30 years. More than 1 million miles of gas pipelines out of 1.5 million miles in U.S.A were laid prior to 1975.( Source: Industry)
��Jindal Saw Limited ACMIIL
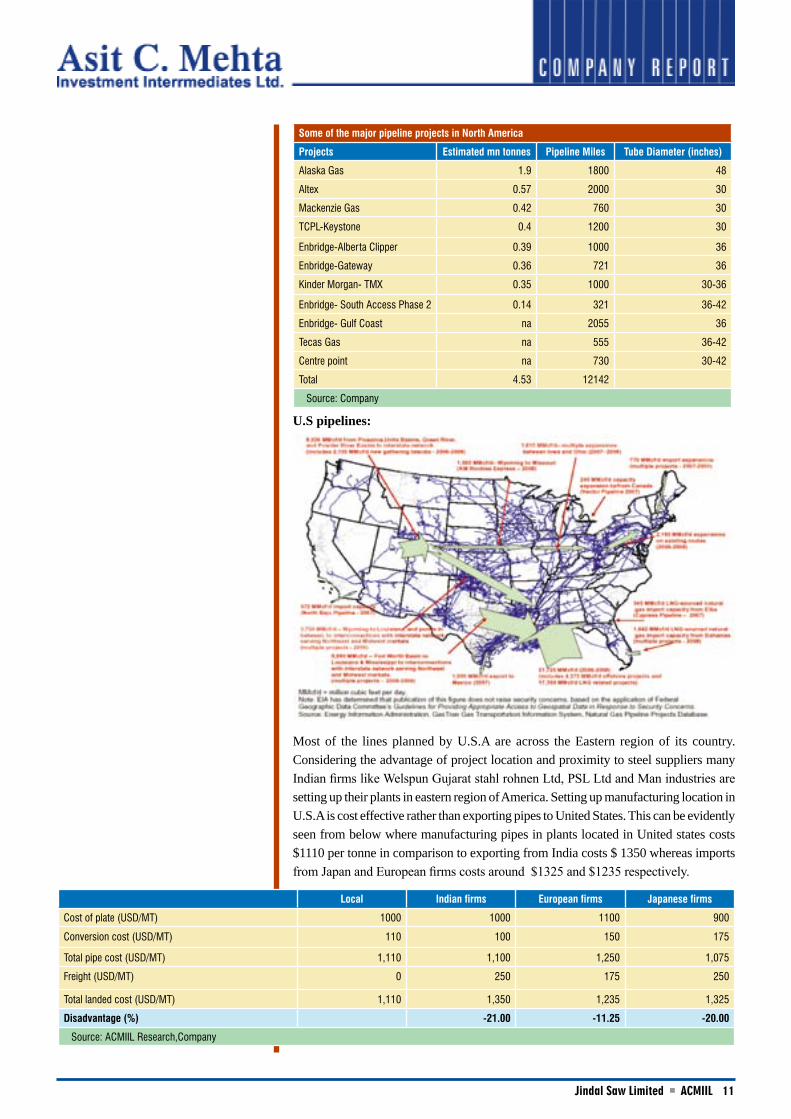
Some of the major pipeline projects in North America
Projects Estimated mn tonnes Pipeline Miles Tube Diameter (inches)
Alaska Gas 1.9 1800 48
Altex 0.57 2000 30
Mackenzie Gas 0.42 760 30
TCPL-Keystone 0.4 1200 30
Enbridge-Alberta Clipper 0.39 1000 36
Enbridge-Gateway 0.36 721 36
Kinder Morgan- TMX 0.35 1000 30-36
Enbridge- South Access Phase 2 0.14 321 36-42
Enbridge- Gulf Coast na 2055 36
Tecas Gas na 555 36-42
Centre point na 730 30-42
Total 4.53 12142
Source: Company
U.S pipelines:
Most of the lines planned by U.S.A are across the Eastern region of its country. Considering the advantage of project location and proximity to steel suppliers many Indian firms like Welspun Gujarat stahl rohnen Ltd, PSL Ltd and Man industries are setting up their plants in eastern region of America. Setting up manufacturing location in U.S.A is cost effective rather than exporting pipes to United States. This can be evidently seen from below where manufacturing pipes in plants located in United states costs $1110 per tonne in comparison to exporting from India costs $ 1350 whereas imports from Japan and European firms costs around $1325 and $1235 respectively.
Local Indian firms European firms Japanese firms
Cost of plate (USD/MT) 1000 1000 1100 900
Conversion cost (USD/MT) 110 100 150 175
Total pipe cost (USD/MT) 1,110 1,100 1,250 1,075
Freight (USD/MT) 0 250 175 250
Total landed cost (USD/MT) 1,110 1,350 1,235 1,325
Disadvantage (%) -21.00 -11.25 -20.00
Source: ACMIIL Research,Company

��Jindal Saw Limited ACMIIL
Middle East & Asia (Excluding India, Japan and China)
Middle East countries and other Asian countries like Japan and China have huge demand for Oil and Gas, which in turns also throws out huge demand for transportation pipes. China is self sufficient for its pipe demands and it does not presently export any of its capacities. Middle East with virtually no manufacturing capacity for transportation pipes potters huge demand for pipes. India and Japan with sufficient capacities can cater to Middle East demand for pipes. Europe too with marginal surplus can cater to Middle East demand. However India has proximity advantage to , which rests out European and Japanese firms to cater to Middle East markets.
(US$/tonne) Indian Manufacturer European Manufacturer Japanese Manufacturer
Cost of plate 1000 1100 900
Cost of value addition 100 150 175
Total cost of pipe 1100 1250 1075
Freight 110 175 275
Total cost 1210 1425 1350
Cost advantage (%) - 18 12
Source: ACMIIL Research, Company
This can be evidently seen that Indian exports are cheaper than European and Japanese firms which give and advantage to Indian firms.
Domestic scenario
Domestically SAW pipes find its application in transporting Oil and Gas as well as in transportation of water and sewage.
I Oil and Gas
Energy Quotient in India:
(Per cent) Coal Oil Gas Hydel Nuclear
1997-98 55 35 7 2 1
2001-02 50 32 15 2 1
2006-07 50 32 15 2 1
2010-11 53 30 14 2 1
2024-25 50 25 20 2 3
Source: Crisil Research
India’s energy requirement is heavily dependent on Coal (50%) followed by Oil and Gas both jointly accounting for 47%. Going ahead in 2024-25 such ratio is estimated to remain same but with Gas gaining momentum in total energy consumption.
India has traditionally been net importer of all source of energy (Source: KPMG) .To meet its energy security Government has continuously been encouraging investment in various energy sectors
To meet its Oil and Gas requirement India has been trying various supply mix. India has been importing Oil and Gas in considerable quantity predominantly from Middle East countries. Increasing investments in these sectors has led to exploration of Domestic reserves for Oil and Gas.
��Jindal Saw Limited ACMIIL
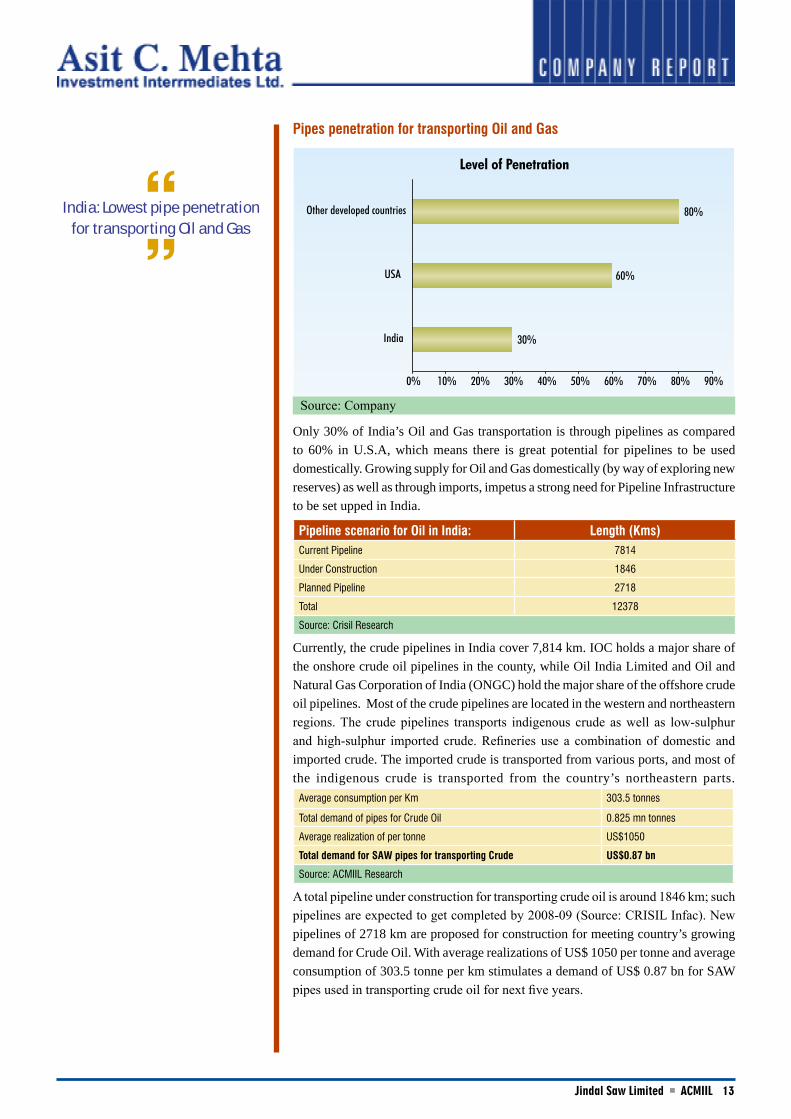
Pipes penetration for transporting Oil and Gas
Only 30% of India’s Oil and Gas transportation is through pipelines as compared to 60% in U.S.A, which means there is great potential for pipelines to be used domestically. Growing supply for Oil and Gas domestically (by way of exploring new reserves) as well as through imports, impetus a strong need for Pipeline Infrastructure to be set upped in India.
Pipeline scenario for Oil in India: Length (Kms)Current Pipeline 7814
Under Construction 1846
Planned Pipeline 2718
Total 12378
Source: Crisil Research
Currently, the crude pipelines in India cover 7,814 km. IOC holds a major share of the onshore crude oil pipelines in the county, while Oil India Limited and Oil and Natural Gas Corporation of India (ONGC) hold the major share of the offshore crude oil pipelines. Most of the crude pipelines are located in the western and northeastern regions. The crude pipelines transports indigenous crude as well as low-sulphur and high-sulphur imported crude. Refineries use a combination of domestic and imported crude. The imported crude is transported from various ports, and most of the indigenous crude is transported from the country’s northeastern parts.
Average consumption per Km 303.5 tonnes
Total demand of pipes for Crude Oil 0.825 mn tonnes
Average realization of per tonne US$1050
Total demand for SAW pipes for transporting Crude US$0.87 bn
Source: ACMIIL Research
A total pipeline under construction for transporting crude oil is around 1846 km; such pipelines are expected to get completed by 2008-09 (Source: CRISIL Infac). New pipelines of 2718 km are proposed for construction for meeting country’s growing demand for Crude Oil. With average realizations of US$ 1050 per tonne and average consumption of 303.5 tonne per km stimulates a demand of US$ 0.87 bn for SAW pipes used in transporting crude oil for next five years.
Source: Company
India: Lowest pipe penetration for transporting Oil and Gas
��Jindal Saw Limited ACMIIL
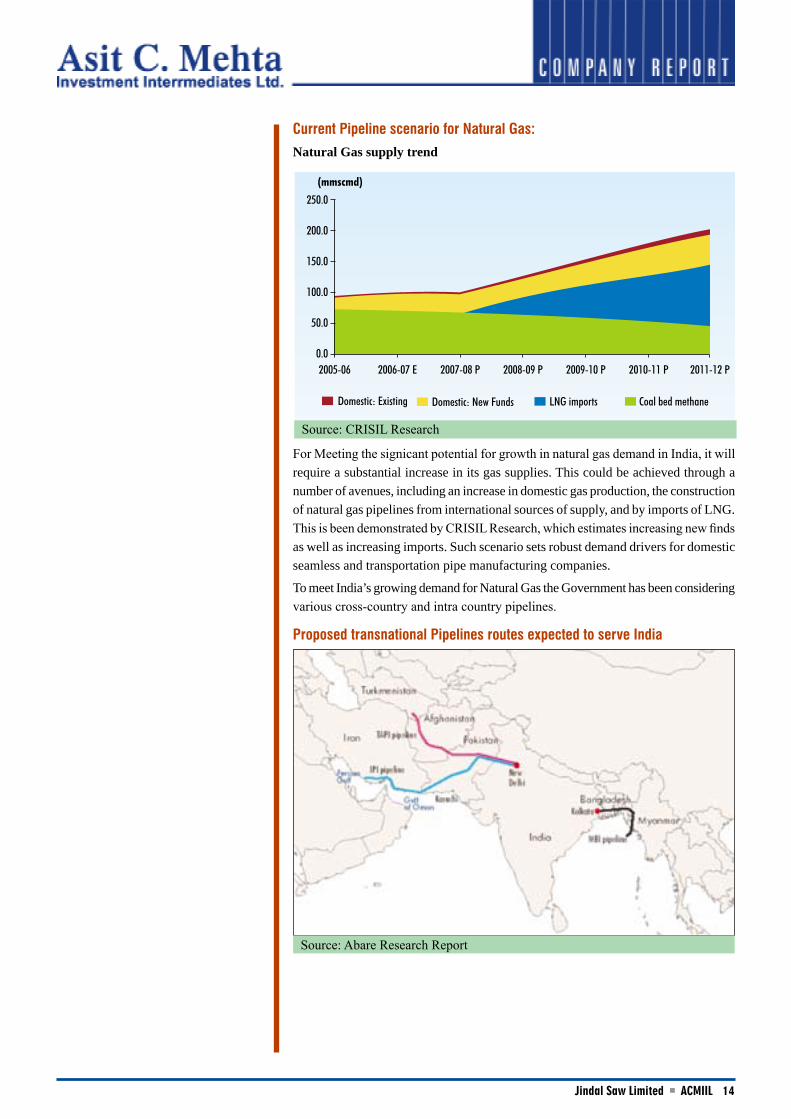
Current Pipeline scenario for Natural Gas:
Natural Gas supply trend
For Meeting the signicant potential for growth in natural gas demand in India, it will require a substantial increase in its gas supplies. This could be achieved through a number of avenues, including an increase in domestic gas production, the construction of natural gas pipelines from international sources of supply, and by imports of LNG.This is been demonstrated by CRISIL Research, which estimates increasing new finds as well as increasing imports. Such scenario sets robust demand drivers for domestic seamless and transportation pipe manufacturing companies.
To meet India’s growing demand for Natural Gas the Government has been considering various cross-country and intra country pipelines.
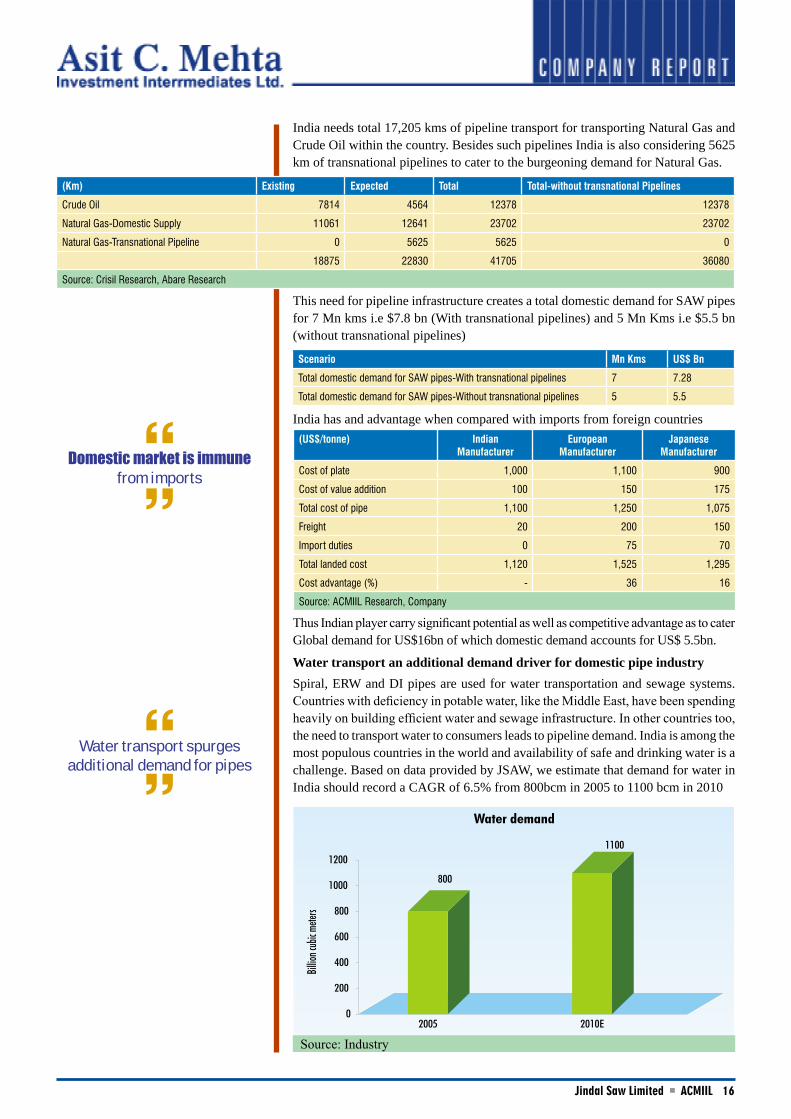
Proposed transnational Pipelines routes expected to serve India
Source: CRISIL Research
Source: Abare Research Report

��Jindal Saw Limited ACMIIL
Project Length (Kms)
Iran–Pakistan–India (IPI) pipeline 2775
Turkmenistan–Afghanistan–
Pakistan–India (TAPI) pipeline 1900
Myanmar–Bangladesh–India (MBI) pipeline 950
Total 5625
Source: Abare Research Report
Government of India has considered various pipelines, biggest of all being IPI pipeline that is expected stretched for 2800km. Other pipelines, which are under consideration, are TAPI and MBI. If such pipeline construction decision gets matured, it would incept a demand for construction of 5625km of SAW pipes .i.e for 1.71 mn tonnes of pipe.
Particulars
Average consumption per Km 303.5 tonnes
Total demand of pipes for Crude Oil 1.71mn tonnes
Average realization of per tonne US$1050
Total demand for SAW pipes for transporting Gas through International pipelines. US$1.8 bn
Source: ACMIIL Research However there are many uncertainties (like political interference) in regards to such pipeline construction. Hence such demand is yet to get materialize.
Intra country Pipeline for transporting Gas:
Particulars Length (Kms)
Current Pipeline 11061
Under Construction
Planned Pipeline 12641
Total 23702
Source: Crisil Research
India has a total pipeline infrastructure of around 11,061 km, supplying about 93mmscmd of gas (excluding the internal consumption). GAIL India Ltd is the country’s largest gas transmission and marketing company. It currently owns and operates around 53 per cent of the onshore pipeline network, with over 5,826 km of pipeline concentrated mainly in northwestern India, but spread over all regions of the country. Gujarat State Petroleum Corporation (GSPC), a Gujarat government-owned company, has also been in the gas transportation business through its subsidiary, Gujarat State Petronet Ltd (GSPL). GSPL is setting up a 1,069 km pipeline network for transporting gas. Among the other regional pipelines, Assam Gas Company has a prominent pipeline network in the northeast. Reliance Industries Limited also has firm plans to make a foray into gas pipelines for carrying its gas finds in the KG basin to the western and southern markets. This includes laying the 1,200 km Kakinada-Uran trunk line and the 2,500 km Jamnagar-Kochi pipeline. GAIL, GSPL, Gas Transportation & Infrastructure Company Ltd (GTICL) and other players have planned various cross-country and regional pipelines
Total domestic demand for SAW pipes required for transporting Natural Gas:
Company Length (Km)
GAIL 5181
GSPL 860
Reliance 6600
Total 12641
Source: ACMIIL Research.
Domestic opportunity of USD 4 bn for transporting Gas
��Jindal Saw Limited ACMIIL
India needs total 17,205 kms of pipeline transport for transporting Natural Gas and Crude Oil within the country. Besides such pipelines India is also considering 5625 km of transnational pipelines to cater to the burgeoning demand for Natural Gas.
(Km) Existing Expected Total Total-without transnational Pipelines
Crude Oil 7814 4564 12378 12378
Natural Gas-Domestic Supply 11061 12641 23702 23702
Natural Gas-Transnational Pipeline 0 5625 5625 0
18875 22830 41705 36080
Source: Crisil Research, Abare Research
This need for pipeline infrastructure creates a total domestic demand for SAW pipes for 7 Mn kms i.e $7.8 bn (With transnational pipelines) and 5 Mn Kms i.e $5.5 bn (without transnational pipelines)
Scenario Mn Kms US$ Bn
Total domestic demand for SAW pipes-With transnational pipelines 7 7.28
Total domestic demand for SAW pipes-Without transnational pipelines 5 5.5
India has and advantage when compared with imports from foreign countries (US$/tonne) Indian
ManufacturerEuropean
ManufacturerJapanese
Manufacturer
Cost of plate 1,000 1,100 900
Cost of value addition 100 150 175
Total cost of pipe 1,100 1,250 1,075
Freight 20 200 150
Import duties 0 75 70
Total landed cost 1,120 1,525 1,295
Cost advantage (%) - 36 16
Source: ACMIIL Research, Company
Thus Indian player carry significant potential as well as competitive advantage as to cater Global demand for US$16bn of which domestic demand accounts for US$ 5.5bn.
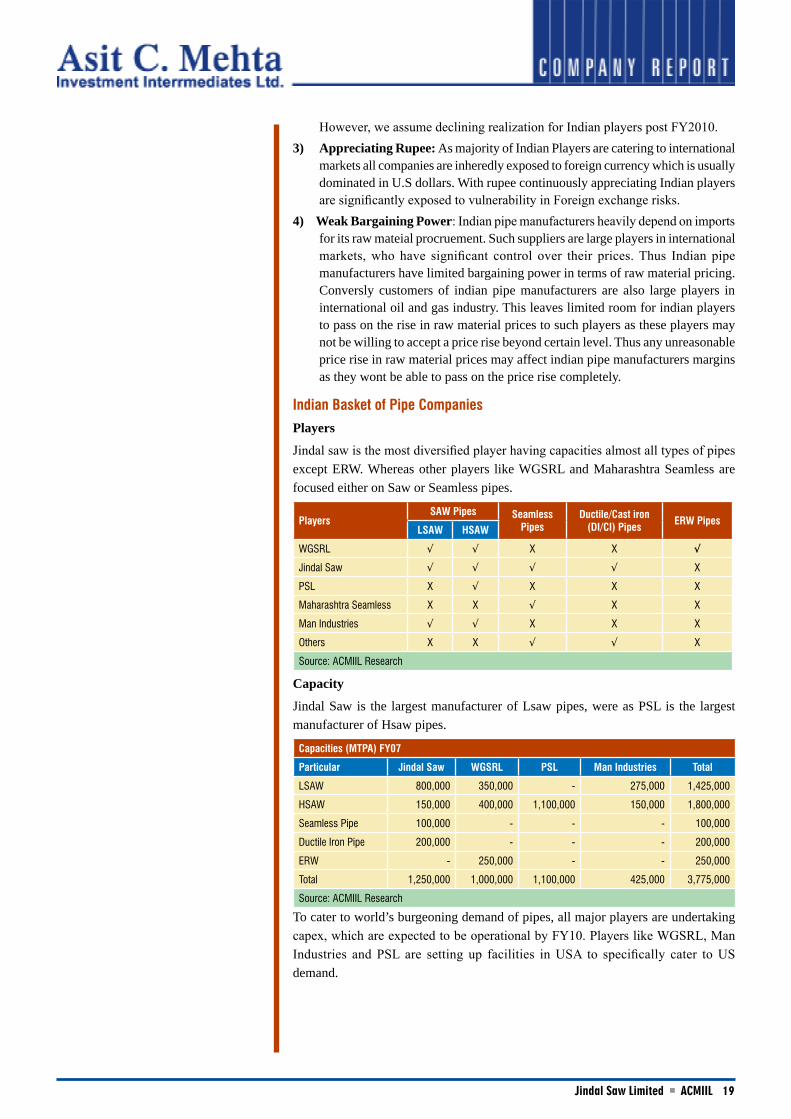
Water transport an additional demand driver for domestic pipe industrySpiral, ERW and DI pipes are used for water transportation and sewage systems. Countries with deficiency in potable water, like the Middle East, have been spending heavily on building efficient water and sewage infrastructure. In other countries too, the need to transport water to consumers leads to pipeline demand. India is among the most populous countries in the world and availability of safe and drinking water is a challenge. Based on data provided by JSAW, we estimate that demand for water in India should record a CAGR of 6.5% from 800bcm in 2005 to 1100 bcm in 2010
Source: Industry
Domestic market is immune from imports
Water transport spurges additional demand for pipes

��Jindal Saw Limited ACMIIL
We note that US$4 bn worth of water projects are currently under various stages of constructing, planning and designing in the country. The Central government is negotiating US$270 mn line of credit with the Asian Development Bank (ADB) through which it plans to finance the overhaul of the infrastructure and institutions governing the states’ water supply. Apart from this, ADB is currently funding a few other water distribution projects in association with the state governments.
Project Status Approval date close date Cost (US$ mn) (a)
Kerala Rural Water Supply and Environmental Sanitation Project Active 7-Nov-00 31-Dec-07 90
Second Karnataka Rural Water Supply and Sanitation Project Active 18-Dec-01 31-Dec-07 193
Maharashtra Rural Water Supply and Sanitation “Jalswarajya” Project Active 26-Aug-03 30-Sep-09 269
Karnataka Urban Water Sector Improvement Project Active 8-Apr-04 31-Dec-08 52
Hydrology Project Phase II Active 24-Aug-04 30-Jun-12 135
Uttaranchal Rural Water Supply and Sanitation Project Active 5-Sep-06 30-Jun-12 224
Punjab Rural Water Supply and Sanitation Active 14-Dec-06 31-Mar-12 261
TN Irrigated Agri. Modernization and Water-Bodies Restoration and Mngmt. Project Active 23-Jan-07 31-Mar-13 566
IN: National Urban Infrastructure Fund Proposed N/A N/A 200
Integrated Coastal Zone Management Project Proposed N/A N/A 107
Andhra Pradesh Rural Water Supply & Sanitation Project Proposed N/A N/A 250
Delhi Water Supply & Sewerage Proposed N/A N/A 250
Capacity Building for Urban Local Bodies - NURM Capacity Building Proposed N/A N/A 40
Tamil Nadu Rural Water Supply and Sanitation Project Proposed N/A N/A 625
Dam Rehabilitation & Improvement Project Proposed N/A N/A 400
Andhra Pradesh Urban Reform & Municipal Services Project Proposed N/A N/A 303
Note (a): Cost represents total cost for commissioning of the water project - not specifically the pipeline cost.
Source: World Bank
ENTRY BARRIERS:
Oil and Gas transportation carries an inherent risk of spillage and leakage, which may cause severe harm to environment. Thus in order to minimize such hazardous events Oil and Gas transportation companies have laid down stringent norms for pipe suppliers. Therefore, pipe manufacturers, in order to become suppliers to international/ local oil majors, require accreditation from these companies. This is very similar to the crude oil transportation business, where each tanker has to be approved by the individual oil companies. Pipe manufacturers have to get their
products as well as facilities approved. This is a very lengthy process and it takes up to 2-3 years to get the requisite approvals from major players (Source: Company). Before getting approval from major domestic/international oil and gas companies every company in order to cater to international customers need to get certified by American Petroleum Institute (API). Such approval procedures take around 9-12 months (Source: Company). Total time required for setting up Greenfield project for manufacturing pipes takes 2 years (Source: Company).
Source: Industry, Company

��Jindal Saw Limited ACMIIL
Industry cost structure:
Raw material cost accounts for nearly 70% of sales realization and 80% of cost of production of pipes.
% of sales
Raw material 70-75%
Power 1-2%
Freight 4-5%
Other costs 2-3%
Margings 15-20%
Source: Company, ACMIIL Research
Timely and economic availability of raw material is a prime concern for every standalone (non-integrated) manufacturing companies. Two basic raw materials that are used for manufacturing pipes are HR coils for HSAW pipes and Plates for LSAW pipes.We note that LSAW line pipe prices have been ruling high due to bottlenecks in API plate supplies. API plate production has been historically dominated by Western Europe and Japan, requiring imports into supply deficient regions- India and Russia (Source: Hatch Bedows). We believe as the new plate mills capable of producing API plate start in these supply- deficient regions, we could see LSAW becoming more competitive in international markets. In India, about 5 mn tonness of plate mill is expected to get operational over FY2010.
Producer Start date Mn tonnes
Welspun 2008 1.5
Essar Steel Q4 2007 1.5
Jindal Steel & Power Apr-07 1
Jindal Steel & Power 2008/9 1.2
Total 5.2
Source: Company, ACMIIL Research
A shortage of API plates has not only pushed LSAW pipe prices higher but also increased the demand for HSAW pipes for onshore applications. Despite upcoming LSAW capacities in the next 2-3 years, we believe availability of API plates will determine real supply demand for LSAW pipes. Increasing availability of plates will reduce the differential between HSAW and LSAW pipe prices.Key concerns for the industry and correspondingly Indian Players:1) Capacities for pipes building faster than expected times: We note that addition
of around 5 mn tonnes of linepipe (LSAW and HSAW) capacities has been announced worldwide. Any faster-than-expected line pipe addition or revival of unutilized capacities will ease the tight Supply-demand balance much earlier-than-expected, thus adversely impacting realizations, volumes and margins for Indian line pipe manufacturers. Though we build a price decline from 2011, we note price declines can take place much earlier if all the new capacity were to come up as scheduled as or earlier than that.
2) Stiff Competition: We note that with large capacities becoming operational in US over the next 2-3 years, Indian Players would have to actively explore other regions such as Africa to increase its exports. Though Indian players export to Middle East and Latin America, we expect markets outside USA will see high competition as players from other geographies such as china, Japan increasingly Target these markets. We believe China, which has seen linepipe imports drop to 12,000 tons (2006) from around 295,000 tons (2003) could have an increasing presence on the LSAW export market once the West-East pipeline development is complete. However, we believe there is a possibility that competition from China may not be intense as potential pipelines from Russia, Central Asia could keep Chinese LSAW/HSAW producers further busy. Further, Japanese players, which face duties in US, will also try to increase their exports to Africa and Middle East.
Expected steel plates facilities would provide
cushion to Indian LSAW pipe manufacturers
��Jindal Saw Limited ACMIIL
However, we assume declining realization for Indian players post FY2010.3) Appreciating Rupee: As majority of Indian Players are catering to international
markets all companies are inheredly exposed to foreign currency which is usually dominated in U.S dollars. With rupee continuously appreciating Indian players are significantly exposed to vulnerability in Foreign exchange risks.
4) Weak Bargaining Power: Indian pipe manufacturers heavily depend on imports for its raw mateial procruement. Such suppliers are large players in international markets, who have significant control over their prices. Thus Indian pipe manufacturers have limited bargaining power in terms of raw material pricing. Conversly customers of indian pipe manufacturers are also large players in international oil and gas industry. This leaves limited room for indian players to pass on the rise in raw material prices to such players as these players may not be willing to accept a price rise beyond certain level. Thus any unreasonable price rise in raw material prices may affect indian pipe manufacturers margins as they wont be able to pass on the price rise completely.
Indian Basket of Pipe Companies
Players
Jindal saw is the most diversified player having capacities almost all types of pipes except ERW. Whereas other players like WGSRL and Maharashtra Seamless are focused either on Saw or Seamless pipes.
Players SAW Pipes Seamless
PipesDuctile/Cast iron
(DI/CI) Pipes ERW PipesLSAW HSAW
WGSRL √ √ X X √
Jindal Saw √ √ √ √ X
PSL X √ X X X
Maharashtra Seamless X X √ X X
Man Industries √ √ X X X
Others X X √ √ X
Source: ACMIIL Research
Capacity
Jindal Saw is the largest manufacturer of Lsaw pipes, were as PSL is the largest manufacturer of Hsaw pipes.
Capacities (MTPA) FY07
Particular Jindal Saw WGSRL PSL Man Industries Total
LSAW 800,000 350,000 - 275,000 1,425,000
HSAW 150,000 400,000 1,100,000 150,000 1,800,000
Seamless Pipe 100,000 - - - 100,000
Ductile Iron Pipe 200,000 - - - 200,000
ERW - 250,000 - - 250,000
Total 1,250,000 1,000,000 1,100,000 425,000 3,775,000
Source: ACMIIL Research
To cater to world’s burgeoning demand of pipes, all major players are undertaking capex, which are expected to be operational by FY10. Players like WGSRL, Man Industries and PSL are setting up facilities in USA to specifically cater to US demand.

�0Jindal Saw Limited ACMIIL
Capacities Post Expansion (MTPA) by FY10
Particular Jindal Saw WGSRL PSL Man Industries Total
LSAW 1,000,000 650,000 - 500,000 2,150,000
HSAW 500,000 850,000 1,400,000 800,000 3,550,000
Seamless Pipe 250,000 - - - 250,000
Ductile Iron Pipe 200,000 - - - 200,000
ERW - 250,000 - - 250,000
Total 1,950,000 1,750,000 1,400,000 1,300,000 6,400,000
(Note: Capacities includes Capacity Expansion in USA WGSRL: 300,000 MTPA: HSAW; PSL: 300,000 MTPA:
HSAW; Man Industries: 300,000 MTPA: HSAW)
Source: ACMIIL Research
Sales
Jindal Saw is the largest player in term of volumes. Largest capacity, operation in USA and above average capacity utilization has helped the company to register sales more than double of its competitor.
WGRSL which has a smaller capacity than PSL has registered sales which is almost double than that of PSL mainly due to higher capacity utilization rate (Larger and heavier the pipe manufactured better would be the capacity utilization)
Both Jindal Saw and WRGSL sales have depicted unprecedented sales CAGR growth of 73% and 46% due to increase in capacity, increasing capacity utilization and increasing realization of pipes.
Margins
WGSRL has highest EBIDTA margin over its domestic peer players due to its presence in niche market and timely booking of its raw material. WGSRL with its backward integration (expected in FY08) would further improve company’s EBIDTA margins Jindal Saw has lowest EBITDA margins primarily due low profitability of US operations, However, with divestment of US operations EBIDTA margins are expected to increase.
(Note: Jindal Saw Sales are annualized)Source: ACMIIL Research

��Jindal Saw Limited ACMIIL
High gearing of PSL and WGSRL has lead to erosion of EBIDTA margins. Both PSL and WGSRL PAT margins are lower with respect to EBIDTA margins due to higher interest cost.
Particulars Man Industries Jindal Saw PSL WGSRL
Debt Equity (FY07) 0.86 0.52 2.26 2.03
Source: ACMIIL Research
Quarterly Results
Man Industries Jindal Saw PSL WGSRL
Net Sales FY07 10596.40 70157.05 14433.40 25551.30
Net Sales 9M 10575.70 70157.05 15656.30 27707.00
EBIDTA % 12.22 11.57 11.02 16.82
PAT % 5.39 5.52 4.24 8.99
(Note: Jindal Saw results are for 15M CY07)
Source: ACMIIL Research
Return ratios (FY07)
Source: ACMIIL Research,Note: Jindal Saw’s ROCE & RONW are annualized and normalized
(Note: Margins: FY07, Source: ACMIIL Research)

��Jindal Saw Limited ACMIIL
Company BackgroundJSL has its presence in both global and domestic market, approximately 65% of current order book constitutes of export while the rest 35% constitutes of domestic orders. JSL operates through its plants located at Mundra (Gujarat), Nashik (Maharashtra) and Kosi Kalan (Uttar Pradesh). The company manufactures SAW & Ductile Iron (DI) pipes at Mundra and Kosi Kalan, while seamless pipes are manufactured in Nashik. It also has pipe-coating plants at Mundra and Kosi Kalan.
To cater to global demand for SAW pipes, JSL has strategically selected Mundra as its manufacturing base. Mundra plant being on the western shore of India makes exports to the middle- east feasible and cost efficient. While, domestic demand for pipes is mainly address through its Kosi-kalan facility.
Key Positives
Diversified Product MixJindal Saw is the only manufacturer in India with a diverse product profile from SAW pipes to seamless and DI pipes. This places JSL in a position to grab opportunities arising in diverse industries from oil & gas exploration and transportation to Water infrastructure. Diversification also reduces risk related to concentration on a particular industry.
Particulars Longitudinal Saw Pipes (LSAW) Spiral/Helical Saw Pipes (HSAW) Seamless Pipes Ductile Iron Pipes (DI)
Location Kosi Kalan Mundra I & II Mundra I Nashik Mundra II
Capacity MT PA 250,000 550,000 150,000 100,000 200,000
Operating
Margins
14% to 15% 14% to 15% 9.5% 20%
Application Oil & Gas Transportation. Oil & Gas Transportation, Water
Transportation.
Petroleum, Exploration, General
Engineering, Boilers, Automotive.
Water Transportation,
Sanitation & Housing.
Differentiator Used under high pressure conditions
Demand directly related to investments
in Oil & Gas sector
Used under low pressure conditions
Demand directly related to investments
in Oil & Gas sector and water projects
Wide application in oil related and
non-oil industries
Ductile is rapidly replac-
ing Cast Iron steel pipes
Source: ACMIIL Research, Company
Products like DI pipes, which earn higher EBIDTA margins compared to LSAW and HSAW also helps JSL to keep up its margins.
Prominent player in International and Domestic
Market
(Source: Company)

��Jindal Saw Limited ACMIIL
Capacity to manufacture large diameter and thicker pipes
Diameter and thickness of pipe determines its realization. Larger the thickness / diameter, better would be its realization. JSL is one of few players with the technology and capacity to manufacture thicker and large diameter pipes. It can manufacture LSAW and HSAW pipes with diameter as large as 56” and 100” and thickness of 38 mm and 18mm respectively.
Particulars Longitudinal Saw Pipes (LSAW) Spiral/Helical Saw Pipes (HSAW)
Jindal Saw
Size 16” to 56” outer diameter 20” to 108” outer diameter
Thickness 38 mm 18 mm
Welspun Gujarat Stahl Rohren
Size 16’’ to 60’’ outer diameter 18’’ to 100’’ outer diameter
Thickness 40 mm 25 mm
Source: ACMIIL Research, Company
Presence in DI pipes
DI pipes find their application mainly in water transportation, sanitation and housing. Over the years Cast Iron Pipes (CI) were used for water transportation. However, DI pipes are now replacing CI pipes due to better physical and mechanical properties, more water carrying capacity, high corrosion resistance, etc. (Annexure: II)
Jindal Saw, apart from Electrosteel Casting Ltd is the only player in India having presence in DI Pipe segment.
Indian DI Pipes Manufacturers Location Capacity MT PA
Electrosteel Casting Ltd Kolkata 250,000
Jindal Saw Mundra 200,000
(Source: ACMIIL Research, Company)
Demand for DI pipes has grown at a CAGR of 23% and is expected to grow at a CAGR of 16% to 18% from 2006 onwards (Source: Industry). This is expected to benefit both players, as each caters to different market. Jindal Saw has its presence in western market as its manufacturing base is in Mundra and Electrosteel Casting Ltd with its base in Kolkota caters to the eastern market.
Strong Order Book
JSL’s order book stands at USD 1 Bn, executable by January 2009. Majority of the order book constitutes of LSAW followed by DI and HSAW.
Particulars USD mn
Large Diameter pipes 860
Ductile Iron Pipes 165
Seamless Pipes 65
Source: Company
Order book US $1bn includes export orders of more than 65%. In the domestic market, company has bagged USD 200 mn from Cairn Energy India (Cairns) to supply LSAW line pipes covering 600 kilometres for worlds’ longest underground pre-insulated heat traced “Barmer Salaya pipeline”. Further the company has bided for approx. US$ 3 bn worth of orders in domestic as well as international markets.
Accreditation from global and domestic manufacturers
Oil and Gas transportation through pipes carries an inherent risk of spillage and leakage, which may cause severe harm to environment. Thus, in order to minimize such hazardous events Oil and Gas transportation companies have laid down stringent
Only player, apart from Electrosteel Casting in DI Pipes
segment
��Jindal Saw Limited ACMIIL
norms for pipe suppliers. Therefore, pipe manufacturers, in order to become suppliers to international/ local oil majors, requires accreditation from these companies. JSL executed its first export order in 1995 for line pipe. Over the years JSL has marked its presence in global as well as domestic market and has received accreditation (an entry barrier for new entrant) from many major global as well as domestic manufacturers.
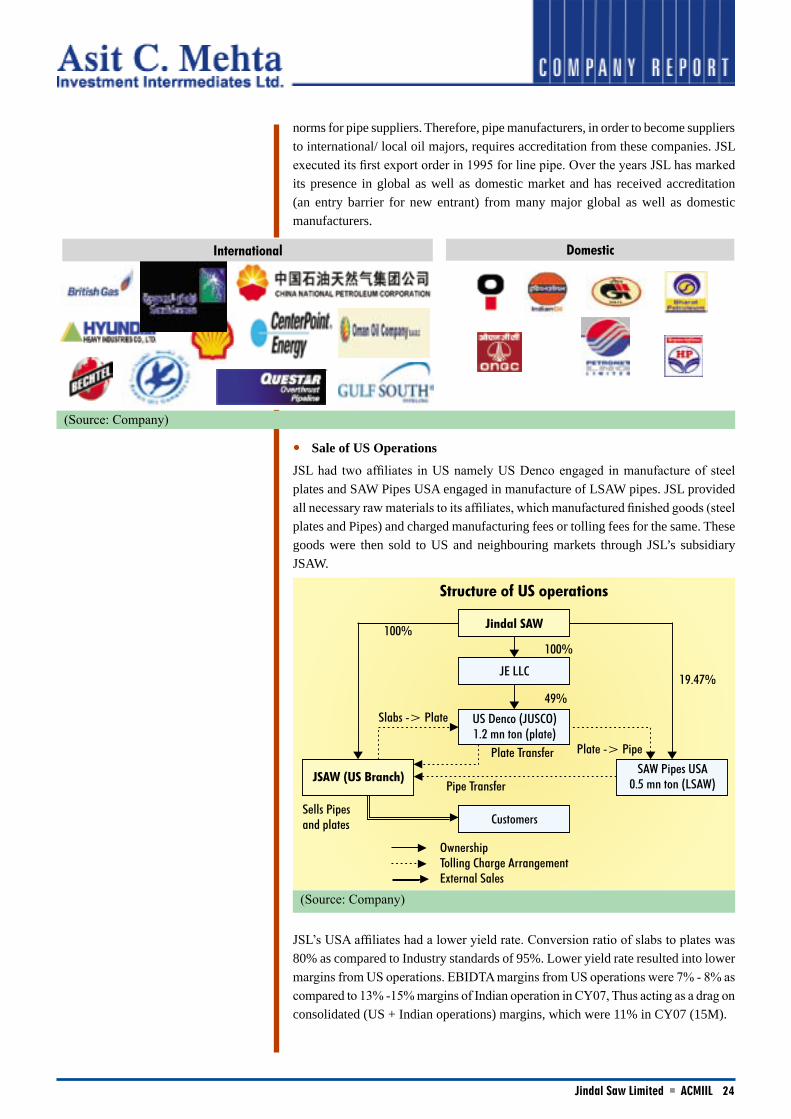
Sale of US Operations
JSL had two affiliates in US namely US Denco engaged in manufacture of steel plates and SAW Pipes USA engaged in manufacture of LSAW pipes. JSL provided all necessary raw materials to its affiliates, which manufactured finished goods (steel plates and Pipes) and charged manufacturing fees or tolling fees for the same. These goods were then sold to US and neighbouring markets through JSL’s subsidiary JSAW.
JSL’s USA affiliates had a lower yield rate. Conversion ratio of slabs to plates was 80% as compared to Industry standards of 95%. Lower yield rate resulted into lower margins from US operations. EBIDTA margins from US operations were 7% - 8% as compared to 13% -15% margins of Indian operation in CY07, Thus acting as a drag on consolidated (US + Indian operations) margins, which were 11% in CY07 (15M).
(Source: Company)
(Source: Company)
��Jindal Saw Limited ACMIIL
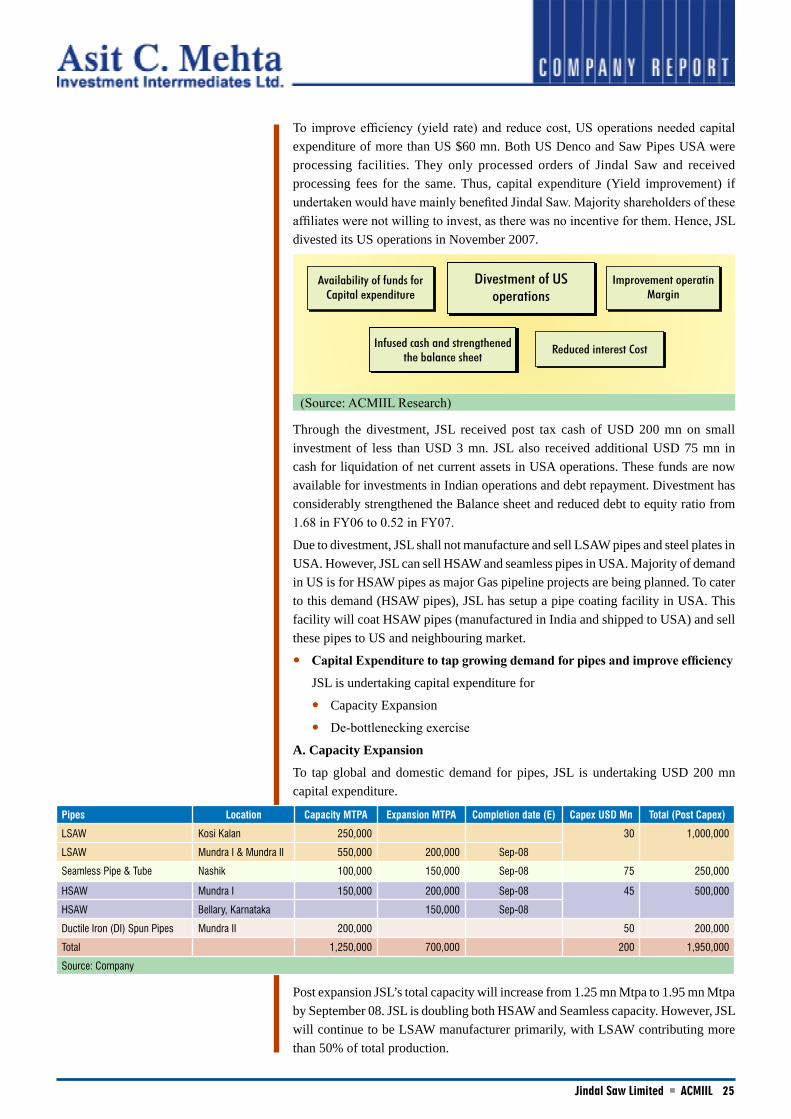
To improve efficiency (yield rate) and reduce cost, US operations needed capital expenditure of more than US $60 mn. Both US Denco and Saw Pipes USA were processing facilities. They only processed orders of Jindal Saw and received processing fees for the same. Thus, capital expenditure (Yield improvement) if undertaken would have mainly benefited Jindal Saw. Majority shareholders of these affiliates were not willing to invest, as there was no incentive for them. Hence, JSL divested its US operations in November 2007.
Through the divestment, JSL received post tax cash of USD 200 mn on small investment of less than USD 3 mn. JSL also received additional USD 75 mn in cash for liquidation of net current assets in USA operations. These funds are now available for investments in Indian operations and debt repayment. Divestment has considerably strengthened the Balance sheet and reduced debt to equity ratio from 1.68 in FY06 to 0.52 in FY07.
Due to divestment, JSL shall not manufacture and sell LSAW pipes and steel plates in USA. However, JSL can sell HSAW and seamless pipes in USA. Majority of demand in US is for HSAW pipes as major Gas pipeline projects are being planned. To cater to this demand (HSAW pipes), JSL has setup a pipe coating facility in USA. This facility will coat HSAW pipes (manufactured in India and shipped to USA) and sell these pipes to US and neighbouring market.
Capital Expenditure to tap growing demand for pipes and improve efficiency
JSL is undertaking capital expenditure for
Capacity Expansion
De-bottlenecking exercise
A. Capacity Expansion
To tap global and domestic demand for pipes, JSL is undertaking USD 200 mn capital expenditure.
Pipes Location Capacity MTPA Expansion MTPA Completion date (E) Capex USD Mn Total (Post Capex)
LSAW Kosi Kalan 250,000 30 1,000,000
LSAW Mundra I & Mundra II 550,000 200,000 Sep-08
Seamless Pipe & Tube Nashik 100,000 150,000 Sep-08 75 250,000
HSAW Mundra I 150,000 200,000 Sep-08 45 500,000
HSAW Bellary, Karnataka 150,000 Sep-08
Ductile Iron (DI) Spun Pipes Mundra II 200,000 50 200,000
Total 1,250,000 700,000 200 1,950,000
Source: Company
Post expansion JSL’s total capacity will increase from 1.25 mn Mtpa to 1.95 mn Mtpa by September 08. JSL is doubling both HSAW and Seamless capacity. However, JSL will continue to be LSAW manufacturer primarily, with LSAW contributing more than 50% of total production.
(Source: ACMIIL Research)
��Jindal Saw Limited ACMIIL
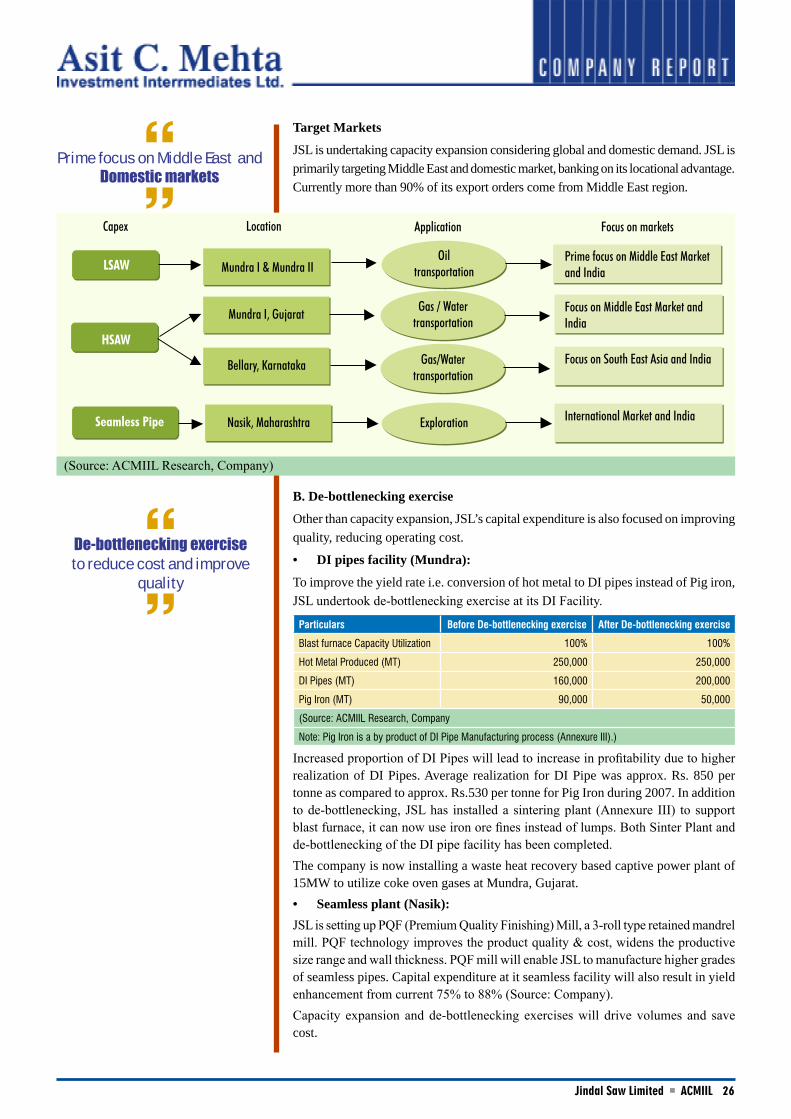
Target Markets
JSL is undertaking capacity expansion considering global and domestic demand. JSL is primarily targeting Middle East and domestic market, banking on its locational advantage. Currently more than 90% of its export orders come from Middle East region.
B. De-bottlenecking exercise
Other than capacity expansion, JSL’s capital expenditure is also focused on improving quality, reducing operating cost.
DI pipes facility (Mundra):
To improve the yield rate i.e. conversion of hot metal to DI pipes instead of Pig iron, JSL undertook de-bottlenecking exercise at its DI Facility.
Particulars Before De-bottlenecking exercise After De-bottlenecking exercise
Blast furnace Capacity Utilization 100% 100%
Hot Metal Produced (MT) 250,000 250,000
DI Pipes (MT) 160,000 200,000
Pig Iron (MT) 90,000 50,000
(Source: ACMIIL Research, Company
Note: Pig Iron is a by product of DI Pipe Manufacturing process (Annexure III).)
Increased proportion of DI Pipes will lead to increase in profitability due to higher realization of DI Pipes. Average realization for DI Pipe was approx. Rs. 850 per tonne as compared to approx. Rs.530 per tonne for Pig Iron during 2007. In addition to de-bottlenecking, JSL has installed a sintering plant (Annexure III) to support blast furnace, it can now use iron ore fines instead of lumps. Both Sinter Plant and de-bottlenecking of the DI pipe facility has been completed.The company is now installing a waste heat recovery based captive power plant of 15MW to utilize coke oven gases at Mundra, Gujarat.
Seamless plant (Nasik): JSL is setting up PQF (Premium Quality Finishing) Mill, a 3-roll type retained mandrel mill. PQF technology improves the product quality & cost, widens the productive size range and wall thickness. PQF mill will enable JSL to manufacture higher grades of seamless pipes. Capital expenditure at it seamless facility will also result in yield enhancement from current 75% to 88% (Source: Company). Capacity expansion and de-bottlenecking exercises will drive volumes and save cost.
•
•
Prime focus on Middle East and Domestic markets
De-bottlenecking exercise to reduce cost and improve
quality
(Source: ACMIIL Research, Company)

��Jindal Saw Limited ACMIIL
New Ventures
JSL is foraying into infrastructure space through its newly formed subsidiary Jindal ITF, which has subsidiaries underneath it. JSL plans to deploy approx. Rs. 18000 mn through a debt equity mix of 3:1 in next two years. It has issued warrants and Compulsorily Convertible Debentures worth Rs. 4300 mn for the same.
Investment Planned Rs. Mn
Jindal Waterways 6,000
Jindal Urban Infrastructure 2,000
Jindal Ship building 8,000
Jindal Water Infrastructure2,000
Jindal Rail Infrastructure
Source: Company
Jindal Waterways Ltd (JWL):
It is a water transportation company. The company has acquired 5 ships of 8,000 DWT - 10,000 DWT for USD 9mn each. Two of the five ships have been already deployed on west coast doing north to south connectivity. Ships carry cargo on spot basis with an average freight of USD 30 per tonne. The company is earning close to 30% EBIDTA and it plans to buy 5 more ships by the year-end. JSL expects each ship to earn freight of Rs. 25 mn per month (Source: Company).
Jindal water Infrastructure Ltd (JWIL):
Jindal water Infrastructure has current order book of USD 100 mn, executable by October 08. JWIL is executing three projects; water management for power utility, water management for clusters and common effluent treatment plant (CETP). The company has put forward bids for projects worth USD 600 mn. Future revenues will depend on its ability to win projects. The company expects JWIL to generate revenues close to USD 100 mn in CY08.
Jindal Urban Infrastructure Ltd (JUIL): Jindal Urban Infrastructure recently won a contract to setup country’s largest urban waste plant in Delhi. It is 20MW power generation project from urban waste.
(Source: Company)

��Jindal Saw Limited ACMIIL
The plant would run on about 6,000-8,000 tonne of waste. New Delhi Municipal Corporation and Municipal Corporation of Delhi would supply raw material to the company. JUIL has registered with United Nations Framework Convention on Climate Change (UNFCC) for availing carbon credits. JSL will invest approx. Rs.2,000 mn for the project. The project is expected to complete in 670 days by February 2010. JUIL will then sell power generated from the plant. Half of the power will be sold to State electricity board at Rs 2.45 per unit and remaining 50% will be sold to private players at merchant rate. JUIL is expected to earn revenues after CY09 on completion of power plant.
Jindal Rail Infrastructure Ltd (JRIL): For manufacturing of railway wagons the company has entered into a joint venture with a Chinese company. The company expects to start its operation within next 8 to 12 months. JRIL is expected to earn revenues after CY09.
Jindal Shipyard Ltd (JSYL): Jindal Saw also plans to venture into shipbuilding. It has acquired close to 510 acres of land in Gujarat. Company is planning to invest USD 100 mn for shipyard and another USD100 mn for setting up propellers, radar, etc. JSYL will be constructing ships having capacity ranging between 8,000 DWT - 10,000 DWT and is expecting its first ship to be out by 2009. Initially ships manufactured will be sold to JWIL.
Expected RevenuesParticular CY08E CY09E
Jindal Waterways Ltd (USD 100 mn) NA
Jindal water Infrastructure Ltd (USD 50 mn) NA
Jindal Urban Infrastructure Ltd Revenues expected to flow post CY09
Jindal Rail Infrastructure Ltd Revenues expected to flow post CY09
Jindal Shipyard Ltd First Ship expected in CY09
Source: Company
Key ConcernsExport Duty to erode JSL’s earnings: Government has levied export duty of 10% on export of pipes and tubes from May 10 2008. JSL’s current order book is approximately 1 bn USD. 65% of the order book constitutes of export orders, which will now attract export duty. These orders are booked at predetermined rate with virtually no escalation clause. Thus the possibility of passing on such additional burden of export duty does not arise for CY08E. Out of total estimated sales of Rs. 40,656.9 mn in CY08E, sales worth Rs. 19,986.8 mn are estimated to invite export duty. Thus export duty will have a considerable impact on JSL’s earnings.
Particulars Earlier With implementation of
Export Duty @10%
LSAW HSAW LSAW HSAW
Sales price per tonne (USD) 1500 1100 1500 1100
Raw material cost per tonne (USD) 1200 850 1200 850
Processing Cost per tonne (USD) 75 85 75 85
Export Duty borne by the Manufacturer (USD) 150 110
Operating Margin (USD) 225 165 75 55
(Source: ACMIIL Research, Company)
This action seems to be temporary stand taken by Government, which may not extended beyond 12 months. We have thus analyzed a situation, where if duty remains

��Jindal Saw Limited ACMIIL
enforced for each quarter what effect may be observed on company’s earnings after each passing quarter.
Particulars Q2 Q3 Q4 Net Sales (Rs. mn) OPM (%) NPM (%) EPS (Rs.)
E x p o r t D u t y
(CY08E)
39093.65 14.09 6.91 48.13
38504.06 12.77 5.92 40.67
37684.55 10.88 4.51 30.29
Source: ACMIIL Research
However, if export duty stays for CY09E, we do not see any passing of such additional duty burden to foreign clients, as inclusion of export duty in biding prices will make Indian pipe manufacturer’s price non-competitive against world foray of pipe manufacturers. Out of total estimated sales of Rs. 58048 mn in CY09E, sales worth Rs. 36,494 mn are estimated to invite export duty. Hence, export duty will continue to have a considerable impact on JSL’s earnings in CY09E as well.
Diversification:
JSL is venturing into diverse areas through its subsidiaries. These not being JSL core business activities, there exits inherent risk of failure. Subsidiaries being at nascent stage may erode consolidated earnings for initial period.
JSL plans to fund ventures through a debt equity mix of 3:1, which would considerably increase interest burden on JSL’s earnings.
Raw material prices and procurement:
Raw material constitutes 70-75% of sales. To pass on price risk, JSL places order to suppliers only after receiving orders from its clients. But there exists a small time gap and any major volatility in prices of raw material in such period may affect JSL.
JSL is totally dependent on import for procurement of plates (used for LSAW). Company mainly sources plates from Southeast Asia, which are transported by ships. Non-availability of transport or any delays may negatively affect JSL’s operations.

�0Jindal Saw Limited ACMIIL
Financials
We have not considered income as well as expenses from new ventures to arrive at our estimates. As all new ventures are at nascent stage and plans are being worked out, we are awaiting for more clarity on each project.
Net Sales Net sales have grown from Rs. 10,856.35 mn in FY04 (September Ending) to Rs. 56,125.64 mn in CY07 (annualized) at a CAGR of 73%. Increase in sales was mainly due to increased realization in pipes, capacity addition and improved capacity utilization.
US operations constituted 39% of CY07 (15M) sales.
JSL divested its US operations in November 2007. Capacity addition in domestic operations and increasing realizations of pipes were expected to compensate for fall in revenues due to discontinuation of US operations through these affiliates.However, with imposition export duty of 10% on exports of pipes and tubes. Manufacturers like JSL will not be able to pass on this duty to its customers to maintain their competitiveness in the international market. Hence, Net Sales are now expected to decline from Rs. 56125.64 mn in CY07 (annualized) to Rs. 52782.4 mn in CY09E.
Capacity addition, increasing realisation and improved capacity utilization have
contributed to sales growth
(Source: ACMIIL Research, Company)(Note: CY07 Capacity utilization is annualized, * September Ending)
(Source: Company)(Note: Sale of pipes & plates manufactured by US operations are marked as green)

��Jindal Saw Limited ACMIIL
Operating Margins
Operating margins were expected to improve from 11.41% in CY07 to more than 15% in CY09E due to divestment of US operations. However, with the levy of export duty, operating margins are now expected to fall to 9.68% in CY09E.
Net Profit Margin
Over the years Net profit margins have been around 5%. Net profit margins in CY07 were 18.95% as JSL received post tax Rs. 9419 mn (other income: Rs. 4404 mn and Extra ordinary income: Rs. 5014.8 mn) from divestment of US operations.
Going forward, with levy of export duty, we expect net profit margin to fall to 4.47 % in CY09.
(Source: ACMIIL Research, Company) (Note: * September Ending)
Export duty to pull down operating margins
(Source: ACMIIL Research, Company) (Note: * September Ending)
(Source: ACMIIL Research) (Note: CY07 sales are annualized, FY06: September Ending)
Export duty to create a drag on Net Sales

��Jindal Saw Limited ACMIIL
Capital Structure
JSL issued Foreign currency convertible bonds (FCCB) of JPY 9,090 mn convertible on or before 24 June 2011 into newly issued equity shares of Rs. 10 each at an initial conversion price of Rs. 675 per share with fixed rate of exchange of JPY 2.533= Re. 1.00
As of 31st Dec 2007, FCCB worth JPY 625 mn were converted into equity shares. We have assumed full conversion of the outstanding (JPY 8,465 mn) in FY08. Hence we expect equity share capital to increase from Rs.511.4 mn in FY07 to Rs. 560.9 in FY08
JSL has issued 2.6 mn warrants convertible into one equity shares of Rs 10/- each at a price not less than Rs 819 per share convertible on or before March 31, 2009.
JSL has also issued 2.73 mn — 9.5% Unsecured Compulsorily Convertible Debentures (CCDs) of Rs 819/- each convertible into one equity share of Rs 10/- each at a price not less than Rs 819 per share convertible during the period from April 01, 2009 September 20, 2009.
We have considered full conversion of both warrants and CCDs in CY09.
Profitability Ratios FY04 * FY05 * FY06 * CY07 (15M) CY08E CY09E
Debt/Equity 2.2 1.5 1.7 0.5 0.3 0.2
(Source: ACMIIL Research • Note: * September Ending)
Debt equity ratio reduced from 1.7 in FY06 to 0.5 in CY07 mainly on account divestment of US operations. We expect debt equity ratio to reduce further in CY08 and CY09 due to full FCCB and CCDs conversion.
Valuation and Recommendation
We believe that there is opportunity in global pipes and tubes sector and JSL being one of the leading player in the industry is likely to benefit from the incremental demand.
However, levy of export duty of 10% on exports of pipes and tubes would definitely have negative impact on company’s earnings till date such levy remains enforced.
Our impact analysis shows that if export duty stays for CY08 then CY08E EPS will come down to Rs 30.3 from our estimates of Rs 52.11 (Annexure I: Without considering impact of export duty).
The sharp decline in EPS of JSL is due to decrease in operating margins, as manufacturers like JSL would not be able to pass on the additional burden of export duty. Reduction in EPS will also negatively impact the company’s cash flows and its debt repayment capacity.
We have also done an impact analysis on quarterly basis for CY08E, we observe that if export duty remains levied for Q2CY08, Q3CY08, Q4 CY08, its EPS would reduce to Rs 48.12, 40.66 and 30.29 respectively.
Similarly if duty remains levied for another year i.e. CY09, its EPS may reduce down to Rs 38.5 from our estimate of Rs 81.91 (Annexure I: Without considering impact of export duty).

��Jindal Saw Limited ACMIIL
Rs. mn
Particulars Without Export Duty With Export Duty Without Export Duty With Export Duty
CY08E CY08E Difference (%) CY09E CY09E Difference(%)
Net Sales 39,396.60 37,684.55 -4.35 56,249.36 52,782.40 -6.16
Operating Profits 5,811.00 4,098.95 -29.46 8,578.03 5,111.07 -40.42
PAT 2,923.28 1,699.22 -41.87 5,031.03 2,361.93 -53.05
Operating Profit Margin (%) 14.75 10.88 -26.26 15.25 9.68 -36.5
Net Profit Margin (%) 7.42 4.51 -39.23 8.94 4.47 -49.97
EPS (Rs.) 52.11 30.29 -41.87 81.91 38.45 -53.05
(Source: ACMIIL Research, Annexure I)
Hence, we at present, recommend clients to reduce the exposure. If steel ministry is able to convince the Government then export duty may be rolled back. At this juncture it is advisable for investors to be cautious and avoid fresh investments.

��Jindal Saw Limited ACMIIL
Profit & Loss Account (Normalized and annualized: CY07) (Rs. in mn)
Particulars FY04 * FY05 * FY06 * CY07 CY08E CY09E
Net Sales 10,856.4 23,138.5 38,731.4 56,125.6 37,684.6 52,782.4
Total Expenditure 9,509.1 20,467.4 34,666.0 49,719.6 33,585.6 47,671.3
Operating Profits 1,347.3 2,671.1 4,065.4 6,406.0 4,099.0 5,111.1
Other Income 73.5 179.8 281.3 90.2 263.8 263.9
EBDIT 1,420.8 2,850.9 4,346.7 6,496.2 4,362.7 5,375.0
Depreciation 229.7 365.0 537.1 618.4 977.8 1,002.8
EBIT 1,191.2 2,485.8 3,809.6 5,877.8 3,384.9 4,372.2
Interest 408.5 984.6 1,290.2 1,547.0 991.7 1,045.5
PBT 782.7 1,501.2 2,519.4 4,330.8 2,393.3 3,326.7
Taxes 214.7 506.9 868.6 1,230.4 694.0 964.7
Profit After Tax 568.0 994.3 1,649.1 3,100.4 1,699.2 2,361.9
Growth in sales (%) 113.1 67.4 44.9 -32.9 40.1
Operating Profits Growth (%) 98.3 52.2 57.6 -36.0 24.7
PAT Growth (%) 75.0 65.9 88.0 -45.2 39.0
Operating Profit Margin (%) 12.4 11.5 10.5 11.4 10.9 9.7
Net Profit Margin (%) 5.2 4.3 4.3 5.5 4.5 4.5
(Note: * September Ending, # CY07: Normalized (Excludes profit on Sale of US operations) and annualized)
(Source: ACMIIL Research, Company)
Profit and Loss Account (Rs. in mn)
Particulars FY04 * FY05 * FY06 * CY07 (15m) CY08E CY09E
Net Sales 10,856.4 23,138.5 38,731.4 70,157.0 37,684.6 52,782.4
Total Expenditure 9,509.1 20,467.4 34,666.0 62,149.6 33,585.6 47,671.3
Operating Profits 1,347.3 2,671.1 4,065.4 8,007.5 4,099.0 5,111.1
Other Income 73.5 179.8 281.3 4,516.8 263.8 263.9
EBDIT 1,420.8 2,850.9 4,346.7 12,524.3 4,362.7 5,375.0
Depreciation 229.7 365.0 537.1 773.0 977.8 1,002.8
EBIT 1,191.2 2,485.8 3,809.6 11,751.2 3,384.9 4,372.2
Interest 408.5 984.6 1,290.2 1,933.7 991.7 1,045.5
PBT 782.7 1,501.2 2,519.4 9,816.9 2,393.3 3,326.7
Taxes 214.7 506.9 868.6 1,538.0 694.0 964.7
PAT 568.0 994.3 1,649.1 8,278.9 1,699.2 2,361.9
Extraordinary items 0.0 0.0 0.0 5,014.8 0.0 0.0
Profit After Tax 568.0 994.3 1,649.1 13,293.7 1,699.2 2,361.9
Growth in sales (%) 113.1 67.4 40.1
Operating Profits Growth (%) 98.3 52.2 24.7
PAT Growth (%) 75.0 65.9 39.0
Operating Profit Margin (%) 12.4 11.5 10.5 11.4 10.9 9.7
Net Profit Margin (%) 5.2 4.3 4.3 18.9 4.5 4.5
(Note: * September Ending)
(Source: ACMIIL Research, Company)

��Jindal Saw Limited ACMIIL
Balance Sheet (Rs. in mn)
Particulars FY04 * FY05 * FY06 * CY07 (15m) CY08E CY09E
Sources of Funds
Share Capital 389.8 471.1 483.6 511.4 560.9 614.2
Redeemable Non Conv Pref Share 1,000.0 1,000.0 1,000.0 1,000.0 1,000.0
Optionally Conv Warrants 116.5
Reserves and Surplus 3,034.6 6,451.1 8,031.1 22,238.2 26,907.3 33,228.0
Total Shareholders Funds 3,424.4 7,922.3 9,631.3 23,749.6 28,468.2 34,842.2
Total Loan Funds 7,630.3 11,979.2 16,217.3 12,455.4 9,178.9 8,543.1
Minority Interest 0.0 0.0 151.1 94.6 100.0 100.0
Net Deferred Tax Liability 465.8 598.8 763.1 825.8 1,264.3 1,289.5
Total Capital Employed 11,520.5 20,500.3 26,762.8 37,125.4 39,011.4 44,774.8
Application of Funds
Gross Block 5,091.4 8,633.4 11,049.1 12,336.6 19,556.3 20,056.3
Less: Accumulated Depreciation 1,573.1 1,980.4 2,499.1 3,246.2 4,224.0 5,226.9
Net Block 3,518.3 6,653.0 8,550.0 9,090.4 15,332.3 14,829.5
Capital Work in Progress 2,349.9 1,176.9 1,546.3 4,219.7 500.0 500.0
Goodwill 167.2 31.7 157.6 69.8 70.0 70.0
Investments 862.0 867.6 835.6 2,092.8 4,328.7 5,858.1
Net Current Assets 4,623.0 11,770.2 15,673.2 21,652.7 18,780.4 23,517.2
Miscellaneous Expenses not w/off 0.0 0.8 0.0 0.0 0.0 0.0
Total Assets 11,520.5 20,500.3 26,762.8 37,125.4 39,011.4 44,774.8
(Note: * September Ending)
(Source: ACMIIL Research, Company)
Cash flow Statement (Rs. in mn)
Particulars FY04 * FY05 * FY06 * CY07 (15m) CY08E CY09E
Pre tax profit 782.7 1,501.2 2,519.4 9,816.9 2,393.3 3,326.7
Add
Depreciation 229.7 365.0 537.1 773.0 977.8 1,002.8
Interest Expense 364.8 815.7 1,309.2 1,821.1 991.7 1,045.5
Profit before working capital changes 1,243.4 2,551.2 4,072.5 7,954.0 4,362.7 5,475.0
Working capital changes -1,060.0 -6,134.7 -2,230.6 -4,635.0 -1,325.6 -5,711.4
Less Taxes -341.5 -299.9 -252.5 -2,422.8 -600.0 -800.0
Net Cash flow from operating activities -158.1 -3,883.5 1,589.3 7,250.5 2,437.2 -1,036.4
Net Cash flow in investment activities -2,807.2 -2,024.8 -2,120.0 88.6 -5,735.9 -2,029.4
Net Cash flow from financing activities 3,056.5 7,090.0 2,925.7 -4,674.3 -1,611.5 2,330.7
Net increase /(decrease) in cash 91.2 1,181.8 2,395.1 2,664.8 -4,910.2 -735.1
Op. balance of cash and cash equivalents 253.5 344.7 1,526.5 3,921.6 6,586.4 1,676.2
Cl. balance of cash and cash equivalents 344.7 1,526.5 3,921.6 6,586.4 1,676.2 941.1
(Note: * September Ending)
(Source: ACMIIL Research, Company)

��Jindal Saw Limited ACMIIL
Ratios
Particulars FY04 * FY05 * FY06 * CY07 (15m) CY08E CY09E
Profitability Ratios
Operating Profit Margin (%) 12.4 11.5 10.5 11.4 10.9 9.7
EBDIT Margin (%) 13.1 12.3 11.2 17.9 11.6 10.2
EBDIT Margin (%) Normalized 13.1 12.3 11.2 11.6 11.6 10.2
PAT Margin (%) 5.2 4.3 4.3 18.9 4.5 4.5
PAT Margin (%) Normalized 5.2 4.3 4.3 5.5 4.5 4.5
RONW (%) 16.6 12.6 17.1 44.8# 6.0 6.8
ROCE (%) 10.3 12.1 14.2 25.3# 8.7 9.8
Per Share Ratios
EPS (Rs.) 14.6 21.1 34.1 259.9 30.3 38.5
EPS (Rs.) Normalized and Annualized 14.6 21.1 34.1 60.6 30.3 38.5
CEPS (Rs.) 20.5 28.9 45.2 177.0 47.7 54.8
CEPS (Rs.) Normalized and Annualized 20.5 28.9 45.2 72.7 47.7 54.8
BV Per Share (Rs.) 87.9 168.1 199.1 464.4 507.5 567.2
Valuation Ratios
P/E (x) @ Rs. 589.5 9.7 19.5 15.3
P/CEPS (x) @ Rs. 589.5 8.1 12.4 10.8
P/BV (x) @ Rs. 589.5 1.3 1.2 1.0
Capital Structure Ratios
Debt/Equity 2.2 1.5 1.7 0.5 0.3 0.2
Current Ratio 1.7 3.3 2.3 3.1 2.5 2.4
Turnover Ratios
Inventory Turnover (x) 2.3 2.5 2.8 2.9 3.0 3.0
Debtors turnover ratio (x) 2.5 6.9 5.1 3.0 3.0 3.2
Fixed Asset Turnover (x) 3.1 3.5 4.5 6.2 2.5 3.6
(Note: * September Ending, # Annualized, Normalized: Excludes profit on Sale of US operations, Turnover ratios are annualized for CY07)
(Source: ACMIIL Research)

��Jindal Saw Limited ACMIIL
Annexure I
Financials statements without considering impact of export duty.
Profit & Loss Account (Normalized and annualized: CY07) (Rs. in mn)
Particulars FY04 * FY05 * FY06 * CY07 CY08E CY09E
Net Sales 10,856.4 23,138.5 38,731.4 56,125.6 39,396.6 56,249.4
Total Expenditure 9,509.1 20,467.4 34,666.0 49,719.6 33,585.6 47,671.3
Operating Profits 1,347.3 2,671.1 4,065.4 6,406.0 5,811.0 8,578.0
Other Income 73.5 179.8 281.3 90.2 275.8 281.2
EBDIT 1,420.8 2,850.9 4,346.7 6,496.2 6,086.8 8,859.3
Depreciation 229.7 365.0 537.1 618.4 977.8 1,002.8
EBIT 1,191.2 2,485.8 3,809.6 5,877.8 5,109.0 7,856.5
Interest 408.5 984.6 1,290.2 1,547.0 991.7 770.5
PBT 782.7 1,501.2 2,519.4 4,330.8 4,117.3 7,086.0
Taxes 214.7 506.9 868.6 1,230.4 1,194.0 2,054.9
Profit After Tax 568.0 994.3 1,649.1 3,100.4 2,923.3 5,031.0
Growth in sales (%) 113.1 67.4 44.9 -29.8 42.8
Operating Profits Growth (%) 98.3 52.2 57.6 -9.3 47.6
PAT Growth (%) 75.0 65.9 88.0 -5.7 72.1
Operating Profit Margin (%) 12.4 11.5 10.5 11.4 14.8 15.3
Net Profit Margin (%) 5.2 4.3 4.3 5.5 7.4 8.9
(Note: * September Ending, # CY07: Normalized (Excludes profit on Sale of US operations) and annualized)
(Source: ACMIIL Research, Company)
Profit and Loss Account (Rs. in mn)
Particulars FY04 * FY05 * FY06 * CY07 (15m) CY08E CY09E
Net Sales 10,856.4 23,138.5 38,731.4 70,157.0 39,396.6 56,249.4
Total Expenditure 9,509.1 20,467.4 34,666.0 62,149.6 33,585.6 47,671.3
Operating Profits 1,347.3 2,671.1 4,065.4 8,007.5 5,811.0 8,578.0
Other Income 73.5 179.8 281.3 4,516.8 275.8 281.2
EBDIT 1,420.8 2,850.9 4,346.7 12,524.3 6,086.8 8,859.3
Depreciation 229.7 365.0 537.1 773.0 977.8 1,002.8
EBIT 1,191.2 2,485.8 3,809.6 11,751.2 5,109.0 7,856.5
Interest 408.5 984.6 1,290.2 1,933.7 991.7 770.5
PBT 782.7 1,501.2 2,519.4 9,816.9 4,117.3 7,086.0
Taxes 214.7 506.9 868.6 1,538.0 1,194.0 2,054.9
PAT 568.0 994.3 1,649.1 8,278.9 2,923.3 5,031.0
Extraordinary items 0.0 0.0 0.0 5,014.8 0.0 0.0
Profit After Tax 568.0 994.3 1,649.1 13,293.7 2,923.3 5,031.0
Growth in sales (%) 113.1 67.4 42.8
Operating Profits Growth (%) 98.3 52.2 47.6
PAT Growth (%) 75.0 65.9 72.1
Operating Profit Margin (%) 12.4 11.5 10.5 11.4 14.8 15.3
Net Profit Margin (%) 5.2 4.3 4.3 18.9 7.4 8.9
(Note: * September Ending)
(Source: ACMIIL Research, Company)

��Jindal Saw Limited ACMIIL
Balance Sheet (Rs. in mn)
Particulars FY04 * FY05 * FY06 * CY07 (15m) CY08E CY09E
Sources of Funds
Share Capital 389.8 471.1 483.6 511.4 560.9 614.2
Redeemable Non Conv Pref Share 1,000.0 1,000.0 1,000.0 1,000.0 1,000.0
Optionally Conv Warrants 116.5
Reserves and Surplus 3,034.6 6,451.1 8,031.1 22,238.2 28,131.3 37,121.1
Total Shareholders Funds 3,424.4 7,922.3 9,631.3 23,749.6 29,692.3 38,735.4
Total Loan Funds 7,630.3 11,979.2 16,217.3 12,455.4 9,178.9 6,043.1
Minority Interest 0.0 0.0 151.1 94.6 100.0 100.0
Net Deferred Tax Liability 465.8 598.8 763.1 825.8 1,264.3 1,289.5
Total Capital Employed 11,520.5 20,500.3 26,762.8 37,125.4 40,235.5 46,168.0
Application of Funds
Gross Block 5,091.4 8,633.4 11,049.1 12,336.6 19,556.3 20,056.3
Less: Accumulated Depreciation 1,573.1 1,980.4 2,499.1 3,246.2 4,224.0 5,226.9
Net Block 3,518.3 6,653.0 8,550.0 9,090.4 15,332.3 14,829.5
Capital Work in Progress 2,349.9 1,176.9 1,546.3 4,219.7 500.0 500.0
Goodwill 167.2 31.7 157.6 69.8 70.0 70.0
Investments 862.0 867.6 835.6 2,092.8 4,328.7 6,458.1
Net Current Assets 4,623.0 11,770.2 15,673.2 21,652.7 20,004.5 24,310.4
Miscellaneous Expenses not w/off 0.0 0.8 0.0 0.0 0.0 0.0
Total Assets 11,520.5 20,500.3 26,762.8 37,125.4 40,235.5 46,168.0
(Note: * September Ending)
(Source: ACMIIL Research, Company)
Cash flow Statement (Rs. in mn)
Particulars FY04 * FY05 * FY06 * CY07 (15m) CY08E CY09E
Pre tax profit 782.7 1,501.2 2,519.4 9,816.9 4,117.3 7,086.0
Add
Depreciation 229.7 365.0 537.1 773.0 977.8 1,002.8
Interest Expense 364.8 815.7 1,309.2 1,821.1 991.7 770.5
Profit before working capital changes 1,243.4 2,551.2 4,072.5 7,954.0 6,086.8 8,959.3
Working capital changes -1,060.0 -6,134.7 -2,230.6 -4,635.0 -1,766.3 -6,125.4
Less Taxes -341.5 -299.9 -252.5 -2,422.8 -950.0 -1,750.0
Net Cash flow from operating activities -158.1 -3,883.5 1,589.3 7,250.5 3,370.4 1,083.9
Net Cash flow in investment activities -2,807.2 -2,024.8 -2,120.0 88.6 -5,735.9 -2,629.4
Net Cash flow from financing activities 3,056.5 7,090.0 2,925.7 -4,674.3 -1,611.5 105.7
Net increase /(decrease) in cash 91.2 1,181.8 2,395.1 2,664.8 -3,977.0 -1,439.8
Op. balance of cash and cash equivalents 253.5 344.7 1,526.5 3,921.6 6,586.4 2,609.5
Cl. balance of cash and cash equivalents 344.7 1,526.5 3,921.6 6,586.4 2,609.5 1,169.6
(Note: * September Ending)
(Source: ACMIIL Research, Company)

��Jindal Saw Limited ACMIIL
Ratios
Particulars FY04 * FY05 * FY06 * CY07 (15m) CY08E CY09E
Profitability Ratios
Operating Profit Margin (%) 12.4 11.5 10.5 11.4 14.8 15.3
EBDIT Margin (%) 13.1 12.3 11.2 17.9 15.5 15.8
EBDIT Margin (%) Normalized 13.1 12.3 11.2 11.6 15.5 15.8
PAT Margin (%) 5.2 4.3 4.3 18.9 7.4 8.9
PAT Margin (%) Normalized 5.2 4.3 4.3 5.5 7.4 8.9
RONW (%) 16.6 12.6 17.1 44.8 # 9.8 13.0
ROCE (%) 10.3 12.1 14.2 25.3 # 12.7 17.0
Per Share Ratios
EPS (Rs.) 14.6 21.1 34.1 259.9 52.1 81.9
EPS (Rs.) Normalized and annualized 14.6 21.1 34.1 60.6 52.1 81.9
CEPS (Rs.) 20.5 28.9 45.2 177.0 69.5 98.2
CEPS (Rs.) Normalized and annualized 20.5 28.9 45.2 72.7 69.5 98.2
BV Per Share (Rs.) 87.9 168.1 199.1 464.4 529.3 630.6
Valuation Ratios
P/E (x) @ Rs. 589.5 9.7 11.3 7.2
P/CEPS (x) @ Rs. 589.5 8.1 8.5 6.0
P/BV (x) @ Rs. 589.5 1.3 1.1 0.9
Capital Structure Ratios
Debt/Equity 2.2 1.5 1.7 0.5 0.3 0.2
Current Ratio 1.7 3.3 2.3 3.1 2.6 2.4
Turnover Ratios
Inventory Turnover (x) 2.3 2.5 2.8 2.9 3.0 3.0
Debtors turnover ratio (x) 2.5 6.9 5.1 3.0 3.0 3.2
Fixed Asset Turnover (x) 3.1 3.5 4.5 6.2 2.6 3.8
(Note: * September Ending, # Annualized, Normalized: Excludes profit on Sale of US operations, Turnover ratios are annualized for CY07)
(Source: ACMIIL Research)
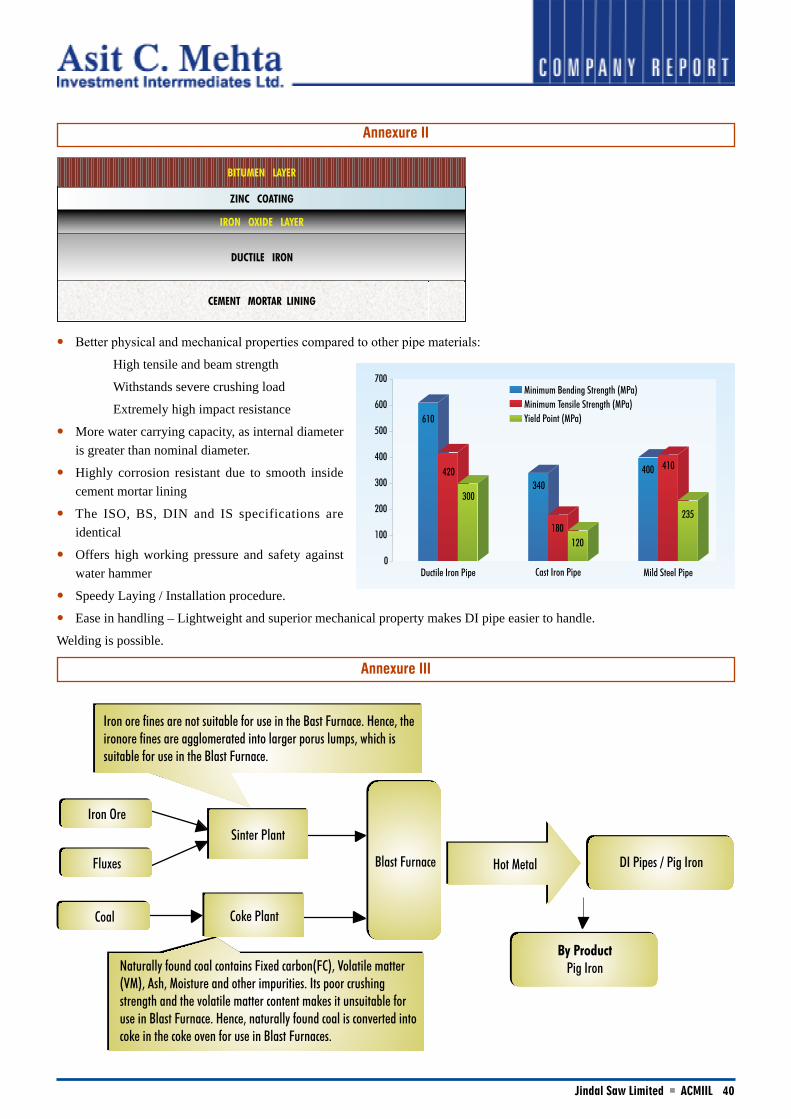
�0Jindal Saw Limited ACMIIL
Annexure II
Better physical and mechanical properties compared to other pipe materials:
High tensile and beam strength
Withstands severe crushing load
Extremely high impact resistance
More water carrying capacity, as internal diameter is greater than nominal diameter.
Highly corrosion resistant due to smooth inside cement mortar lining
The ISO, BS, DIN and IS specifications are identical
Offers high working pressure and safety against water hammer
Speedy Laying / Installation procedure.
Ease in handling – Lightweight and superior mechanical property makes DI pipe easier to handle.
Welding is possible.
Annexure III
�
�
�

��Jindal Saw Limited ACMIIL
Disclaimer:
This report is based on information that we consider reliable, but we do not represent that it is accurate or complete and it should not be relied upon such. ACMIIL or
any of its affiliates or employees shall not be in any way responsible for any loss or damage that may arise to any person from any inadvertent error in the information
contained in the report. ACMIIL and/or its affiliates and/or employees may have interests/positions, financial or otherwise in the securities mentioned in this report.
To enhance transparency we have incorporated a Disclosure of Interest Statement in this document. This should however not be treated as endorsement of the views
expressed in the report
Disclosure of Interest Jindal Saw Limited
1. Analyst ownership of the stock NO
2. Broking Relationship with the company covered NO
3. Investment Banking relationship with the company covered NO
4. Discretionary Portfolio Management Services NO
This document has been prepared by the Research Desk of Asit C Mehta Investment Interrmediates Ltd. and is meant for use of the recipient only and is not for
circulation. This document is not to be reported or copied or made available to others. It should not be considered as an offer to sell or a solicitation to buy any security.
The information contained herein is from sources believed reliable. We do not represent that it is accurate or complete and it should not be relied upon as such. We
may from time to time have positions in and buy and sell securities referred to herein.
Notes:
HNI Sales:Raju Mewawalla, Tel: +91 22 2858 3220
Institutional Sales:Bharat Patel, Tel: +91 22 2858 3732


![Annual Report Final - Jindal Saw Ltd Report2005-2006.pdf · JINDAL SAW LTD. Steel pipes, ... 8Total Pipe Solutions ... 4 inches½ to 6!] inches while OCTG product tubings vary in](https://static.fdocuments.net/doc/165x107/5aa6bbeb7f8b9a6d5a8b618c/annual-report-final-jindal-saw-report2005-2006pdfjindal-saw-ltd-steel-pipes.jpg)


