15 Community Supported Relief Nurseries Across Oregon
15
15 Community Supported Relief Nurseries Across Oregon
-
Upload
colleen-anthony -
Category
Documents
-
view
18 -
download
1
description
15 Community Supported Relief Nurseries Across Oregon. Who Relief Nurseries Serve. High Risk Families with Children 0 to 6 yrs Average of 16 Risk Factors per Family 90% Under Federal Poverty Level Average Age of Child – 1.6 yrs Child Race/Ethnicity: - PowerPoint PPT Presentation
Transcript of 15 Community Supported Relief Nurseries Across Oregon
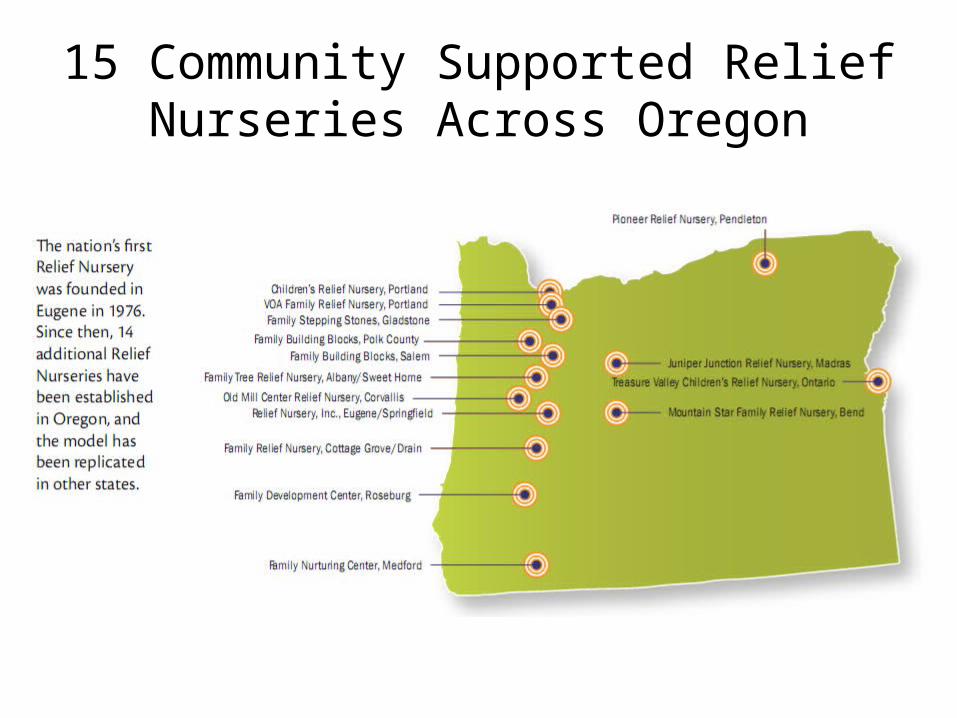
15 Community Supported Relief Nurseries Across Oregon
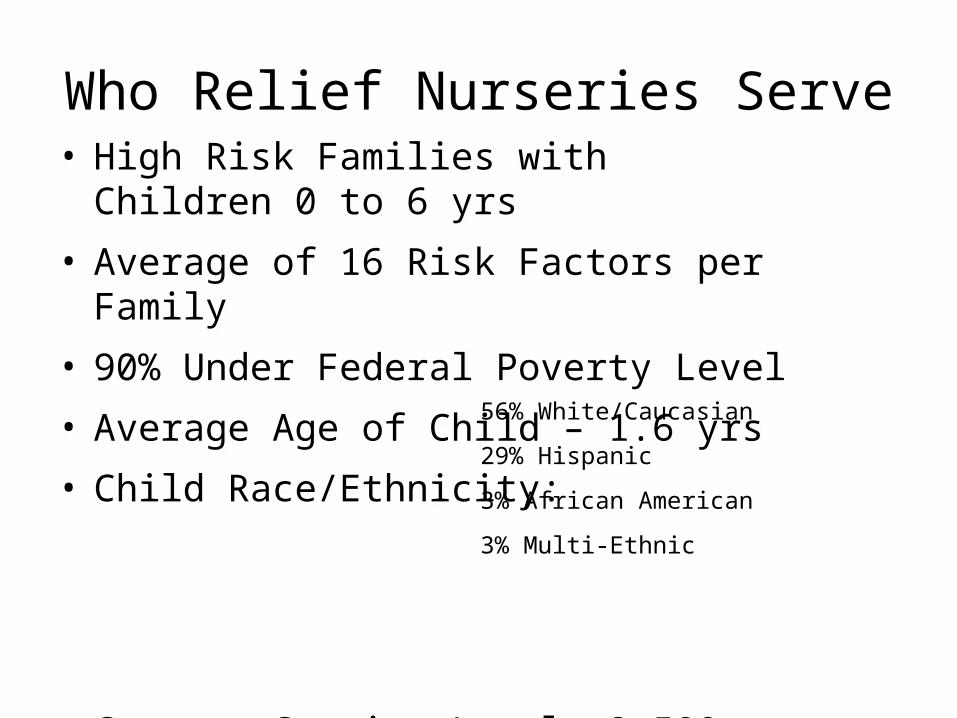
Who Relief Nurseries Serve• High Risk Families with Children 0 to 6 yrs
• Average of 16 Risk Factors per Family
• 90% Under Federal Poverty Level
• Average Age of Child – 1.6 yrs
• Child Race/Ethnicity:
• Current Service Level -2,500 Children Annually
56% White/Caucasian
29% Hispanic
3% African American
3% Multi-Ethnic
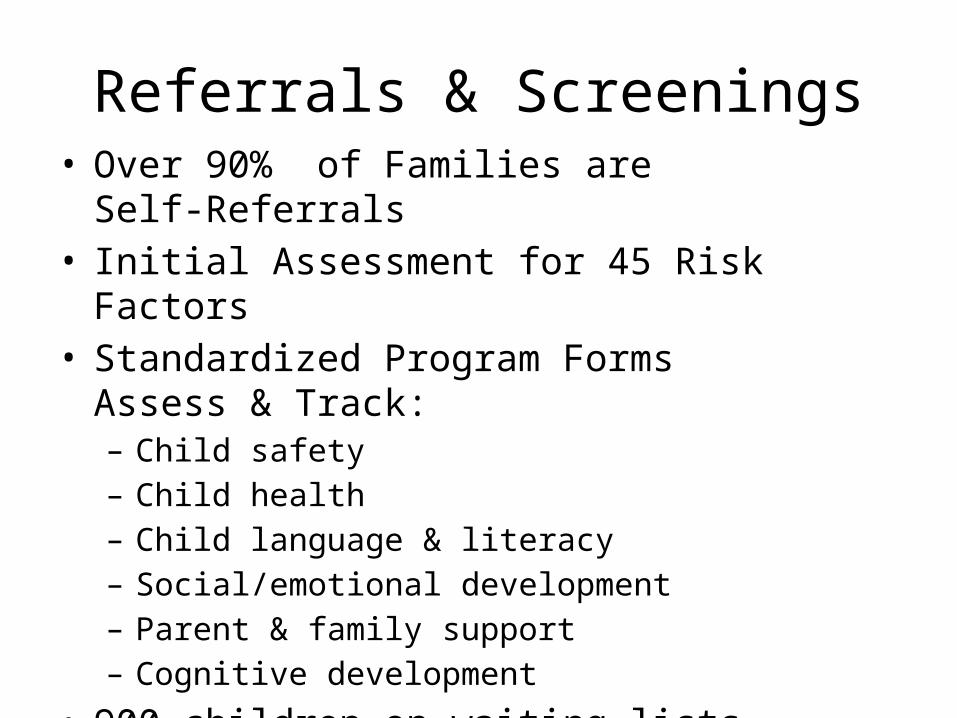
Referrals & Screenings• Over 90% of Families are Self-Referrals• Initial Assessment for 45 Risk Factors• Standardized Program Forms Assess & Track:
– Child safety– Child health– Child language & literacy– Social/emotional development– Parent & family support– Cognitive development
• 900 children on waiting lists as of May 2011

Relief Nursery Services
Early Childhood
Therapeutic Program
Outreach Program
Support & Referral
Other Contracts &
Services

Therapeutic Classroom Program
• 3-Hour Classes 1 or 2 times/wk
• Staffing Ratio– 4:1 for Preschool Children– 3:1 for Infant & Toddlers– Volunteers Improve Ratio
• 1.5-hr Home Visits – 1 to 4 x/mo.
• 300 Hours of Contact Annually
• Average Annual Cost/Child $5,582

Outreach Services• Home-Based Programs & Services for Families on Waitlist
• Initial Assessment & Crisis Intervention
• Home Visits & Phone Support
• Respite Classes & Parent/Child Play Groups
• Parenting Classes
• Access to Support Services
• Average Annual Cost/Family $1,962
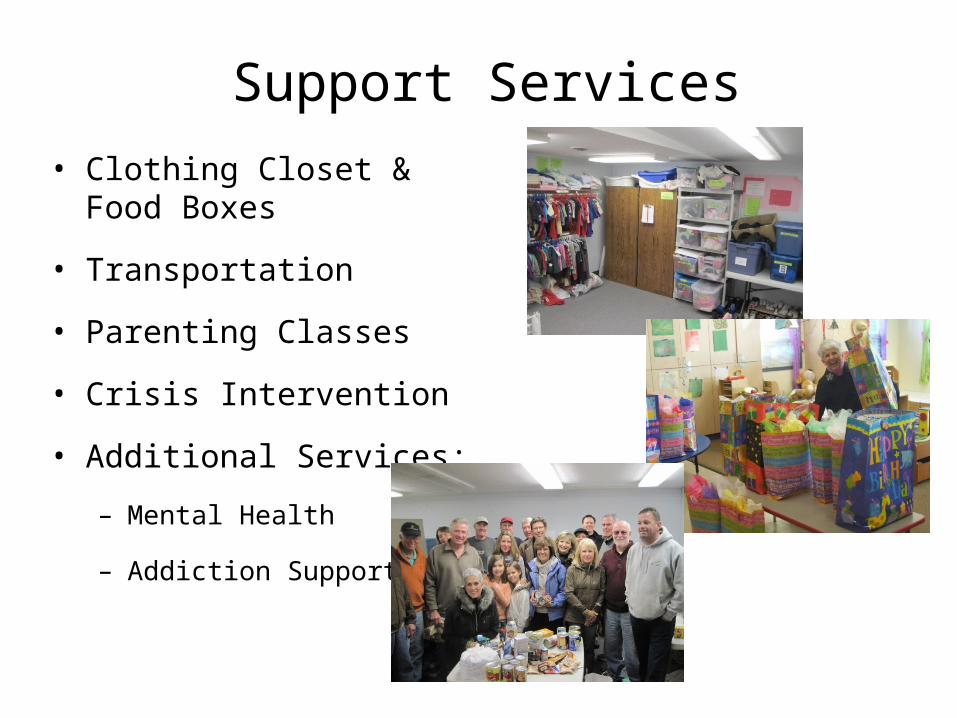
Support Services• Clothing Closet & Food Boxes
• Transportation
• Parenting Classes
• Crisis Intervention
• Additional Services:
– Mental Health
– Addiction Support

Referrals to Community Partners
• Early Intervention/Early Childhood Special Education
• Health Services
• Domestic Violence Programs
• Housing Support
• Mental Health Services
• Child Welfare
• Head Start

Service Contracts• Court Mandated Parenting
Classes• Healthy Start• Head Start & Early Head Start• Early Intervention/ECSE• Child Welfare Services
– Foster Care Support– Short-Term Services (ISRS)
• Supervised Visitation• Mental Health
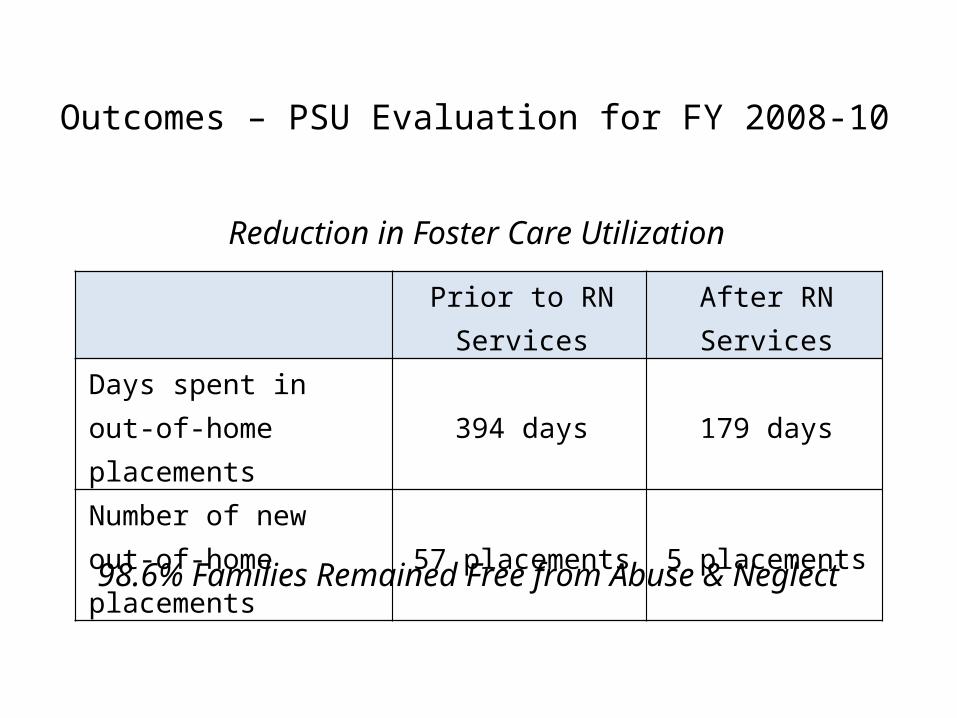
Prior to RN Services After RN Services
Days spent in out-of-home placements 394 days 179 days
Number of new out-of-home placements 57 placements 5 placements
Reduction in Foster Care Utilization
Outcomes – PSU Evaluation for FY 2008-10
98.6% Families Remained Free from Abuse & Neglect

Reduction in Victimization Rates
Number of Victims Per 10000
5
10
15
20
25
30
35
40
45
5044
14
Rate Before RN InvolvementRate After RN Involvement
Rate for Children 0-5
in the General
Population is 18/1,000

Intake-120
1
2
3
4
5
6
7
8
9
109.23
7.48
Reduction in “Mutable” Family Risk FactorsAfter 12 Months in Relief Nursery

Improvement in Key Parenting Outcomes
% Positive Parent-Child Interactions
% Reading Frequently to Child
0%
10%
20%
30%
40%
50%
60%
70%
35%30%
49%
58%
Intake 12 months
Statewide RN Report 2008 to 2010

1999-01 2001-03 2003-05 2005-07 2007-09 2009-11$0
$2,000,000
$4,000,000
$6,000,000
$8,000,000
$10,000,000
$12,000,000
$14,000,000
State Funds
Private Funds
OtherService Contracts
Relief Nurseries Stretch State Dollars with Local Support

Engage Community Support
• Volunteer Hours • Work Closely with Other Community Providers• Undergraduate and Graduate Internships• Government and Private Grant Programs
– Financial Accountability– Regular Reporting of Outcomes and Outputs
• Lean Organizations– Low Overhead (especially given fund raising success)– Low Personnel Costs