15 cns
28
350 Before the development of computed tomography (CT) in the 1970s, radionuclide brain scans were the only non- invasive method for diagnosing diseases of the brain, including tumors, strokes, and vascular anomalies. The first radionuclide brain scan agents, such as technetium- 99m pertechnetate and Tc-99m diethylenetriamine pen- taacetic acid (DTPA), did not cross the intact blood–brain barrier (Fig. 15-1). Brain uptake occurred only if there was disruption—for example, with tumor and stroke. The Tc-99m radiopharmaceuticals currently used today are lipophilic and able to readily cross the blood–brain barrier. Positron emission tomography (PET), which began with the brain decades ago, did not move into widespread clini- cal use until the advent of PET/CT for oncology and avail- ability of the glucose analog fluorine-18 fluorodeoxyglucose (FDG) without the need for an onsite cyclotron. Although most F-18 FDG imaging is currently done for cancer, use in the brain offers some advantages over single-photon emission computed tomography (SPECT), including bet- ter resolution and ease of quantitation. Although magnetic resonance imaging (MRI) and CT are the most commonly used brain-imaging modalities today, nuclear medicine techniques provide unique diagnostic information based on imaging physiology. SPECT and PET can both visual- ize alterations in function before anatomical changes can be detected. A list of current clinical indications for brain imaging using scintigraphy is listed in Box 15-1. Several new compounds have been moving through the approval process. The SPECT agent iodine-123 ioflupane (DaTscan), available in Europe for years, has now been approved for use in the United States to differentiate par- kinsonian syndromes from other causes of tremor. Although the only brain PET radiopharmaceutical available for clin- ical use in the United States for many years was F-18 FDG, an amyloid agent has recently been approved. It is expected that other agents will become available in the future. Many experimental agents are limited by the short, 20-minute physical half-life of their carbon-11 radiolabel. A clear clinical role must be found for other agents. A par- tial list of some PET agents used for a variety of applica- tions in the brain is listed in Table 15-1. CEREBRAL ANATOMY Knowledge of brain anatomy is critical in understanding patterns of disease and image interpretation. The brain consists of the two cerebral hemispheres above the tento- rium and the cerebellum below in the posterior fossa. The regions, or lobes, of the brain are illustrated in Fig- ure 15-2. The frontal lobe extends back to the central sulcus, with the parietal lobe just posterior to it. The occipital lobe is most posterior, below the parietooccipital sulcus. The temporal lobes are below the lateral fissure. Within these lobes, key functional centers, or regions, have been identified, that are important when trying to assimilate clinical changes with anatomical and functional images (Fig. 15-3). Studies such as dynamic radionuclide brain flow and brain death examination allow visualization of the vascular CHAPTER 15 Central Nervous System FIGURE 15-1. Normal delayed Tc-99m DTPA planar images. Anterior (A), right lateral (RL), left lateral (LL), and posterior (P) projections. The superior sagittal sinus (1) is seen on anterior and posterior views. The floor of the frontal sinus (2), confluence of sinuses (3), transverse sinuses (4), and sphenoid sinus (5) are faintly seen. BOX 15-1. Clinical Indications for Central Nervous System Scintigraphy Dementia diagnosis Epileptic seizure focus localization Brain tumor recurrence Vascular reserve assessment in high-risk patients Carotid artery sacrifice: Preoperative impact evaluation Acute stroke: Select thrombolytic agent candidates Brain death determination Parkinson disease: Differentiation from essential tremor Cerebrospinal fluid (CSF) evaluation CSF shunt function Normal-pressure hydrocephalus diagnosis Investigational uses: Psychiatric disorders and chronic effects of head trauma
-
Upload
azmal-sarker -
Category
Health & Medicine
-
view
187 -
download
0
Transcript of 15 cns

Chapter 15
Central Nervous System
Before the development of computed tomography (CT) in the 1970s, radionuclide brain scans were the only non-invasive method for diagnosing diseases of the brain, including tumors, strokes, and vascular anomalies. The first radionuclide brain scan agents, such as technetium-99m pertechnetate and Tc-99m diethylenetriamine pen-taacetic acid (DTPA), did not cross the intact blood–brain barrier (Fig. 15-1). Brain uptake occurred only if there was disruption—for example, with tumor and stroke. The Tc-99m radiopharmaceuticals currently used today are lipophilic and able to readily cross the blood–brain barrier.
Positron emission tomography (PET), which began with the brain decades ago, did not move into widespread clini-cal use until the advent of PET/CT for oncology and avail-ability of the glucose analog fluorine-18 fluorodeoxyglucose (FDG) without the need for an onsite cyclotron. Although most F-18 FDG imaging is currently done for cancer, use in the brain offers some advantages over single-photon emission computed tomography (SPECT), including bet-ter resolution and ease of quantitation. Although magnetic resonance imaging (MRI) and CT are the most commonly used brain-imaging modalities today, nuclear medicine techniques provide unique diagnostic information based on imaging physiology. SPECT and PET can both visual-ize alterations in function before anatomical changes can be detected.
Figure 15-1. Normal delayed Tc-99m DTPA planar images. Anterior (A), right lateral (RL), left lateral (LL), and posterior (P) projections. The superior sagittal sinus (1) is seen on anterior and posterior views. The floor of the frontal sinus (2), confluence of sinuses (3), transverse sinuses (4), and sphenoid sinus (5) are faintly seen.
350
A list of current clinical indications for brain imaging using scintigraphy is listed in Box 15-1.
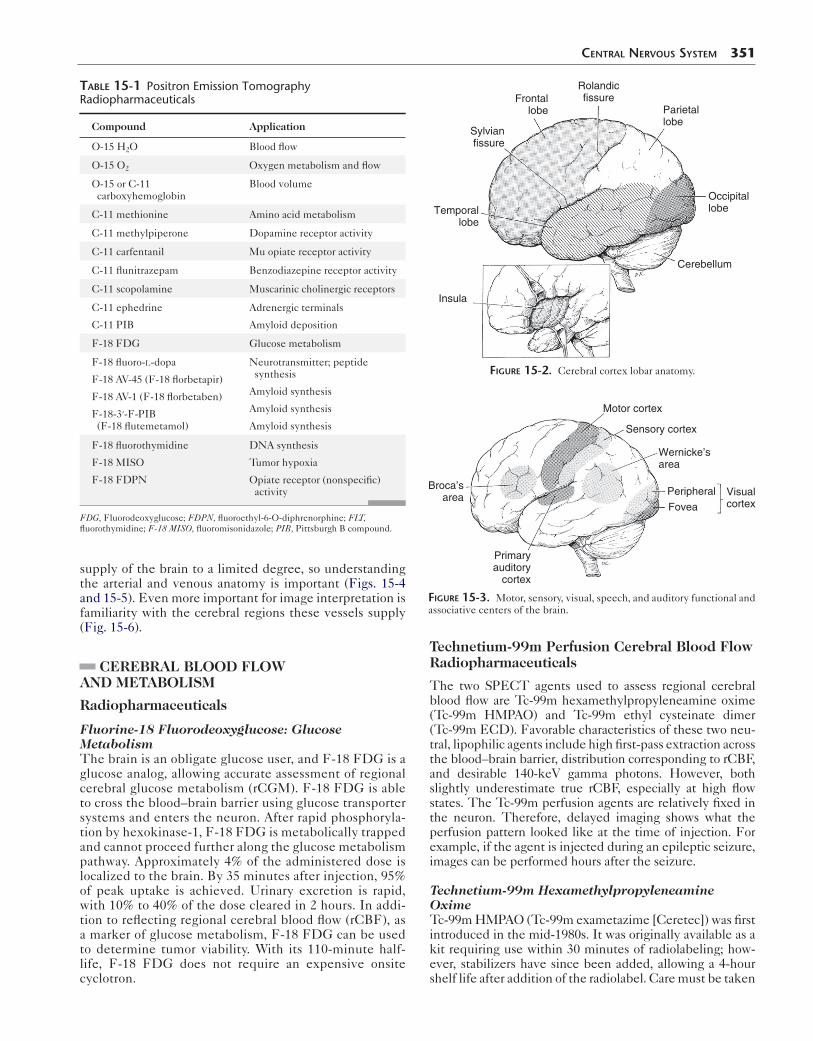
Several new compounds have been moving through the approval process. The SPECT agent iodine-123 ioflupane (DaTscan), available in Europe for years, has now been approved for use in the United States to differentiate par-kinsonian syndromes from other causes of tremor. Although the only brain PET radiopharmaceutical available for clin-ical use in the United States for many years was F-18 FDG, an amyloid agent has recently been approved. It is expected that other agents will become available in the future. Many experimental agents are limited by the short, 20-minute physical half-life of their carbon-11 radiolabel. A clear clinical role must be found for other agents. A par-tial list of some PET agents used for a variety of applica-tions in the brain is listed in Table 15-1.
CEREBRAL ANATOMY
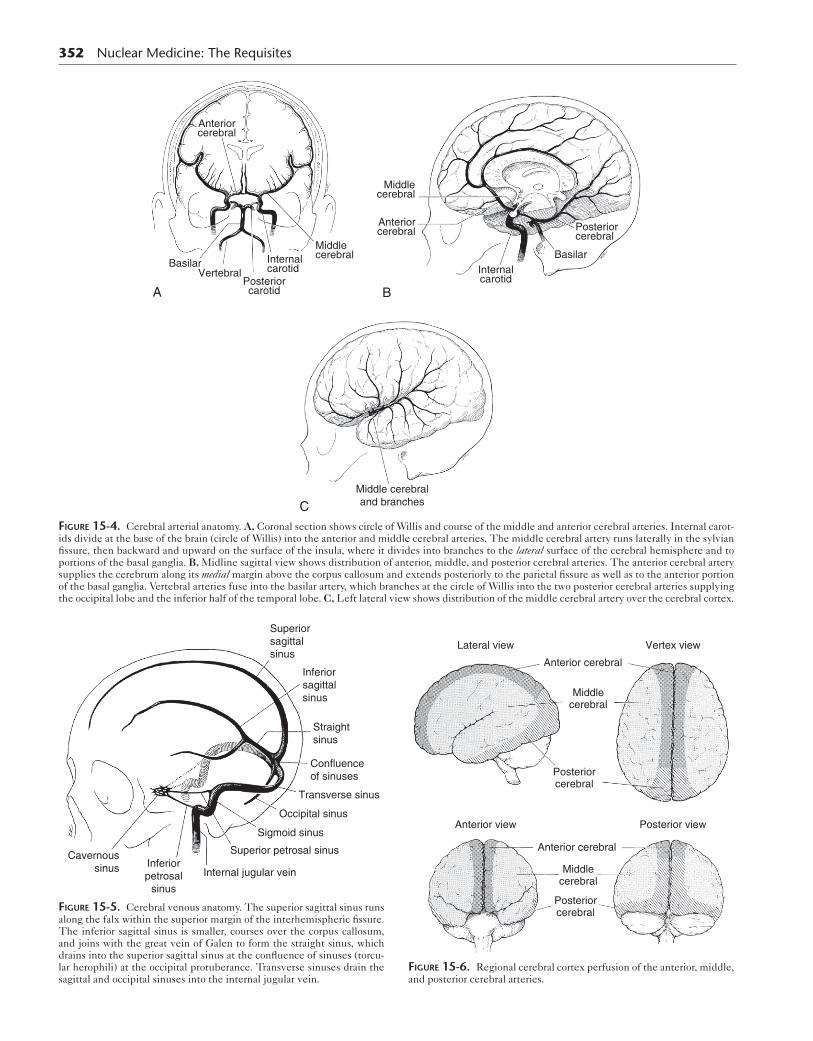
Knowledge of brain anatomy is critical in understanding patterns of disease and image interpretation. The brain consists of the two cerebral hemispheres above the tento-rium and the cerebellum below in the posterior fossa. The regions, or lobes, of the brain are illustrated in Fig-ure 15-2. The frontal lobe extends back to the central sulcus, with the parietal lobe just posterior to it. The occipital lobe is most posterior, below the parietooccipital sulcus. The temporal lobes are below the lateral fissure. Within these lobes, key functional centers, or regions, have been identified, that are important when trying to assimilate clinical changes with anatomical and functional images (Fig. 15-3).
Studies such as dynamic radionuclide brain flow and brain death examination allow visualization of the vascular
Box 15-1. Clinical Indications for Central Nervous System Scintigraphy
Dementia diagnosisEpileptic seizure focus localizationBrain tumor recurrenceVascular reserve assessment in high-risk patientsCarotid artery sacrifice: Preoperative impact evaluationAcute stroke: Select thrombolytic agent candidatesBrain death determinationParkinson disease: Differentiation from essential
tremorCerebrospinal fluid (CSF) evaluation
CSF shunt functionNormal-pressure hydrocephalus diagnosis
Investigational uses: Psychiatric disorders and chronic effects of head trauma
supply of the brain to a limited degree, so understanding the arterial and venous anatomy is important (Figs. 15-4 and 15-5). Even more important for image interpretation is familiarity with the cerebral regions these vessels supply (Fig. 15-6).
CEREBRAL BLOOD FLOW AND METABOLISM
Radiopharmaceuticals
Fluorine-18 Fluorodeoxyglucose: Glucose MetabolismThe brain is an obligate glucose user, and F-18 FDG is a glucose analog, allowing accurate assessment of regional cerebral glucose metabolism (rCGM). F-18 FDG is able to cross the blood–brain barrier using glucose transporter systems and enters the neuron. After rapid phosphoryla-tion by hexokinase-1, F-18 FDG is metabolically trapped and cannot proceed further along the glucose metabolism pathway. Approximately 4% of the administered dose is localized to the brain. By 35 minutes after injection, 95% of peak uptake is achieved. Urinary excretion is rapid, with 10% to 40% of the dose cleared in 2 hours. In addi-tion to reflecting regional cerebral blood flow (rCBF), as a marker of glucose metabolism, F-18 FDG can be used to determine tumor viability. With its 110-minute half-life, F-18 FDG does not require an expensive onsite cyclotron.
table 15-1 Positron Emission Tomography Radiopharmaceuticals
Compound Application
O-15 H2O Blood flow
O-15 O2 Oxygen metabolism and flow
O-15 or C-11 carboxyhemoglobin
Blood volume
C-11 methionine Amino acid metabolism
C-11 methylpiperone Dopamine receptor activity
C-11 carfentanil Mu opiate receptor activity
C-11 flunitrazepam Benzodiazepine receptor activity
C-11 scopolamine Muscarinic cholinergic receptors
C-11 ephedrine
C-11 PIB
Adrenergic terminals
Amyloid deposition
F-18 FDG Glucose metabolism
F-18 fluoro-l-dopa
F-18 AV-45 (F-18 florbetapir)
F-18 AV-1 (F-18 florbetaben)
F-18-3′-F-PIB (F-18 flutemetamol)
Neurotransmitter; peptide synthesis
Amyloid synthesis
Amyloid synthesis
Amyloid synthesis
F-18 fluorothymidine
F-18 MISO
F-18 FDPN
DNA synthesis
Tumor hypoxia
Opiate receptor (nonspecific) activity
FDG, Fluorodeoxyglucose; FDPN, fluoroethyl-6-O-diphrenorphine; FLT, fluorothymidine; F-18 MISO, fluoromisonidazole; PIB, Pittsburgh B compound.
Central nervous system 351
Technetium-99m Perfusion Cerebral Blood Flow Radiopharmaceuticals
The two SPECT agents used to assess regional cerebral blood flow are Tc-99m hexamethylpropyleneamine oxime (Tc-99m HMPAO) and Tc-99m ethyl cysteinate dimer (Tc-99m ECD). Favorable characteristics of these two neu-tral, lipophilic agents include high first-pass extraction across the blood–brain barrier, distribution corresponding to rCBF, and desirable 140-keV gamma photons. However, both slightly underestimate true rCBF, especially at high flow states. The Tc-99m perfusion agents are relatively fixed in the neuron. Therefore, delayed imaging shows what the perfusion pattern looked like at the time of injection. For example, if the agent is injected during an epileptic seizure, images can be performed hours after the seizure.
Technetium-99m Hexamethylpropyleneamine OximeTc-99m HMPAO (Tc-99m exametazime [Ceretec]) was first introduced in the mid-1980s. It was originally available as a kit requiring use within 30 minutes of radiolabeling; how-ever, stabilizers have since been added, allowing a 4-hour shelf life after addition of the radiolabel. Care must be taken
Temporallobe
Frontallobe
Sylvianfissure
Rolandicfissure
Parietallobe
Occipitallobe
Cerebellum
Insula
Figure 15-2. Cerebral cortex lobar anatomy.
Motor cortex
Sensory cortex
Peripheral
FoveaVisualcortex
Wernicke’sarea
Broca’sarea
Primaryauditory
cortex
Figure 15-3. Motor, sensory, visual, speech, and auditory functional and associative centers of the brain.
352 Nuclear Medicine: The Requisites
Anteriorcerebral
Middlecerebral
Posteriorcarotid
InternalcarotidVertebral
Basilar
A
Anteriorcerebral
Middlecerebral
Posteriorcerebral
Internalcarotid
Basilar
B
Middle cerebraland branchesC
Figure 15-4. Cerebral arterial anatomy. A, Coronal section shows circle of Willis and course of the middle and anterior cerebral arteries. Internal carot-ids divide at the base of the brain (circle of Willis) into the anterior and middle cerebral arteries. The middle cerebral artery runs laterally in the sylvian fissure, then backward and upward on the surface of the insula, where it divides into branches to the lateral surface of the cerebral hemisphere and to portions of the basal ganglia. B, Midline sagittal view shows distribution of anterior, middle, and posterior cerebral arteries. The anterior cerebral artery supplies the cerebrum along its medial margin above the corpus callosum and extends posteriorly to the parietal fissure as well as to the anterior portion of the basal ganglia. Vertebral arteries fuse into the basilar artery, which branches at the circle of Willis into the two posterior cerebral arteries supplying the occipital lobe and the inferior half of the temporal lobe. C, Left lateral view shows distribution of the middle cerebral artery over the cerebral cortex.
Superiorsagittalsinus
Inferiorsagittalsinus
Straightsinus
Confluenceof sinuses
Transverse sinus
Occipital sinus
Sigmoid sinus
Superior petrosal sinus
Internal jugular veinInferiorpetrosal
sinus
Cavernoussinus
Figure 15-5. Cerebral venous anatomy. The superior sagittal sinus runs along the falx within the superior margin of the interhemispheric fissure. The inferior sagittal sinus is smaller, courses over the corpus callosum, and joins with the great vein of Galen to form the straight sinus, which drains into the superior sagittal sinus at the confluence of sinuses (torcu-lar herophili) at the occipital protuberance. Transverse sinuses drain the sagittal and occipital sinuses into the internal jugular vein.
Lateral view Vertex view
Anterior view Posterior view
Anterior cerebral
Middlecerebral
Posteriorcerebral
Posteriorcerebral
Middlecerebral
Anterior cerebral
Figure 15-6. Regional cerebral cortex perfusion of the anterior, middle, and posterior cerebral arteries.

that doses from the radiopharmacy have been labeled with fresh generator eluate (<2 hours old) just before delivery. Tc-99m HMPAO has a good first-pass extraction of approxi-mately 80%, with 3.5% to 7% of the injected dose localizing in the brain within 1 minute of injection. Once across the blood–brain barrier, it enters the neuron and becomes a polar hydrophilic molecule trapped inside the cell. How-ever, some of the radiopharmaceutical may be present in different isomeric forms that are not trapped. Although up to 15% of the dose washes out in the first 2 minutes, little loss occurs over the next 24 hours. SPECT images can be acquired from 20 minutes to 2 hours after injection. Excre-tion is largely renal (40%) and gastrointestinal (15%).
Technetium-99m Ethyl Cysteinate DimerTc-99m ECD (Tc-99m bicisate, Neurolite) is a neutral lipophilic agent that passively diffuses across the blood–brain barrier like Tc-99m HMPAO. Once prepared, the Tc-99m ECD dose is stable for 6 hours. It has a first-pass extraction of 60% to 70%, with peak brain activity reaching 5% to 6% of the injected dose. The blood clearance is more rapid than Tc-99m HMPAO, resulting in better brain-to-background ratios. At 1 hour, less than 5% of the dose remains in the blood, compared to more than 12% of a Tc-99m HMPAO dose.
Once inside the cell, Tc-99m ECD undergoes enzymatic deesterification, forming polar metabolites unable to cross the cell membrane. However, slow (roughly 6% per hour) washout of some labeled metabolites occurs, with almost 25% of the brain activity cleared by 4 hours. Although images may be superior to those with Tc-99m HMPAO 15 to 30 minutes after injection, they may be suboptimal if imaging is delayed.
Dosimetry
The dosimetry for various cerebral radiopharmaceuticals is provided in Table 15-2.
Methodology
Positron Emission Tomography AcquisitionPatient preparation for F-18 FDG brain imaging is similar to that for oncology applications. Patients should fast for
table 15-2 Dosimetry of Cerebral Imaging Agents
AgentOrgan receiving highest dose
Dose(mGy/MBq)
Effective dose(mSv/MBq)
F-18 FDG Bladder wall 0.13 0.019
Tc-99m HMPAO
Kidney 0.034 0.0093
Tc-99m ECD Bladder wall 0.05 0.0077
Tl-201 Kidneys 0.46 0.23
Tc-99m sestamibi
Gallbladder 0.039 0.0085
I-123 ioflupane Bladder wall
Striata
0.053
0.230
0.0213
ECD, Ethyl cysteinate dimer; FDG, fluorodeoxyglucose; HMPAO, hexamethylpro-pyleneamine oxime.
Central nervous system 353
4 to 6 hours before injection, should have serum glucose less than 200 mg/dL, should not have had insulin for 2 hours (short-acting insulin) to 6 to 8 hours (long-acting insulin), and should avoid strenuous exercise for a few days before the test. Exercise and insulin will shunt FDG to the muscles and reduce brain uptake.
F-18 FDG should be injected in a quiet, dimly lit room with the patient remaining still and undisturbed during the uptake period (20-30 minutes). Scan acquisition is typ-ically done in a three-dimensional (3-D) mode, although some older systems still allow two-dimensional (2-D) mode acquisition with movable septa to minimize scatter. A sample protocol is listed in Box 15-2.
Single-Photon Emission Computed Tomography AcquisitionAs with PET, patients are injected in a quiet, dimly lit room. For the best-quality image, a delay of 30 to 60 min-utes for Tc-99m ECD and 30 to 90 minutes for Tc-99m HMPAO should be used to improve the signal-to-noise ratio. Dedicated triple-head gamma cameras are increas-ingly rare but yield the best results. A dual-head camera creates images superior to those with a single-head SPECT camera. Patient positioning is just as important as the equipment used. The heads of the camera must come as close to the patient as possible, or resolution is reduced. A head-holder attachment extending from the end of the table allows the camera heads to come in closer than the width of a table or the patient’s shoulders. In heavy patients and those whose shoulders obstruct the view, the posterior fossa may not be seen. A protocol for Tc-99m cerebral per-fusion SPECT imaging is given in Box 15-3. The SPECT images are processed using iterative reconstruction. A filter
Box 15-2. Fluorine-18 Fluorodeoxyglucose Positron Emission Tomography Imaging: Summary Protocol
PATIENT PREPARATIONPatient should fast 4 to 6 hours, avoid carbohydrates,
maintain normal blood glucose.Check blood glucose. If less than 180 to 200,
continue.Elevated glucose: Consider rescheduling, administer
insulin, recheck, delay 2 hours.Inject in quiet, dimly lit room, eyes open.Wait 30 minutes.
RADIOPHARMACEUTICALF-18 FDG 10 to 15 mCi (185-555 MBq)
INSTRUMENTATIONDedicated PET or PET/CT cameraCoincidence camera
IMAGINGAttenuation correction scan: Gadolinium rods or CTAcquisition: 7 minutes per bed position for one bed
position
PROCESSINGIterative reconstruction, automated software
CT, Computed tomography; FDG, fluorodeoxyglucose; PET, positron emission tomography.

354 Nuclear Medicine: The Requisites
is applied to smooth the image. In general, filters can be sampled and modified for each patient in the postprocess-ing stage to achieve an optimal image.
InterpretationSPECT images generally reflect cortical rCBF, which is determined by oxygen demands of the brain. In addition, blood flow distribution is usually similar to metabolism seen with F-18 FDG. Areas with more synaptic activity require greater blood flow. Activational studies can there-fore target areas of the brain showing increased flow when activated by a certain task.
There is a 2:1 to 4:1 differential in blood flow to gray matter compared to white matter seen on SPECT and PET scans. Lesions in the white matter often cannot be detected or even differentiated from cerebrospinal fluid (CSF) spaces on PET or SPECT, so MRI or CT correla-tion is necessary for identifying white matter changes
Box 15-3. Single-Photon Emission Computed Tomography Cerebral Perfusion Imaging: Summary Protocol
PATIENT PREPARATIONNone
RADIOPHARMACEUTICALTc-99m HMPAO (Ceretec) or Tc-99m ECD
(Neurolite) 20 mCi
INSTRUMENTATIONCamera: Dual-head or triple-head SPECTHead-holder attachment: Head extends beyond table
for minimum camera radiusCollimators: High resolution, parallel holeComputer setup: SPECT acquisition parameters
Matrix size: 64 × 64Zoom: 2Rotation: Step and shootOrbit: CircularAngle step size: 3 degreesStops: 40 per headTime per stop: 40 seconds (total time, 27 minutes)
IMAGING PROCEDUREPrepare dose according to package insert. Note shelf
life.Begin intravenous access or tape butterfly in place;
make patient comfortable in quiet, dimly lit room; inject; patient eyes open; begin scanning in 15 minutes to 2 to 3 hours later.
Position patient so that brain is entirely within field of view of all detectors.
Position collimators as close as possible to patient’s head.
PROCESSINGFiltered back projection or iterative reconstructionFilter: Hamming, 1.2 high-frequency cutoffAttenuation correction: 0.11 cm−1
ECD, Ethyl cysteinate dimer; HMPAO, hexamethylpropyleneamine oxime; SPECT, single-photon emission computed tomography.
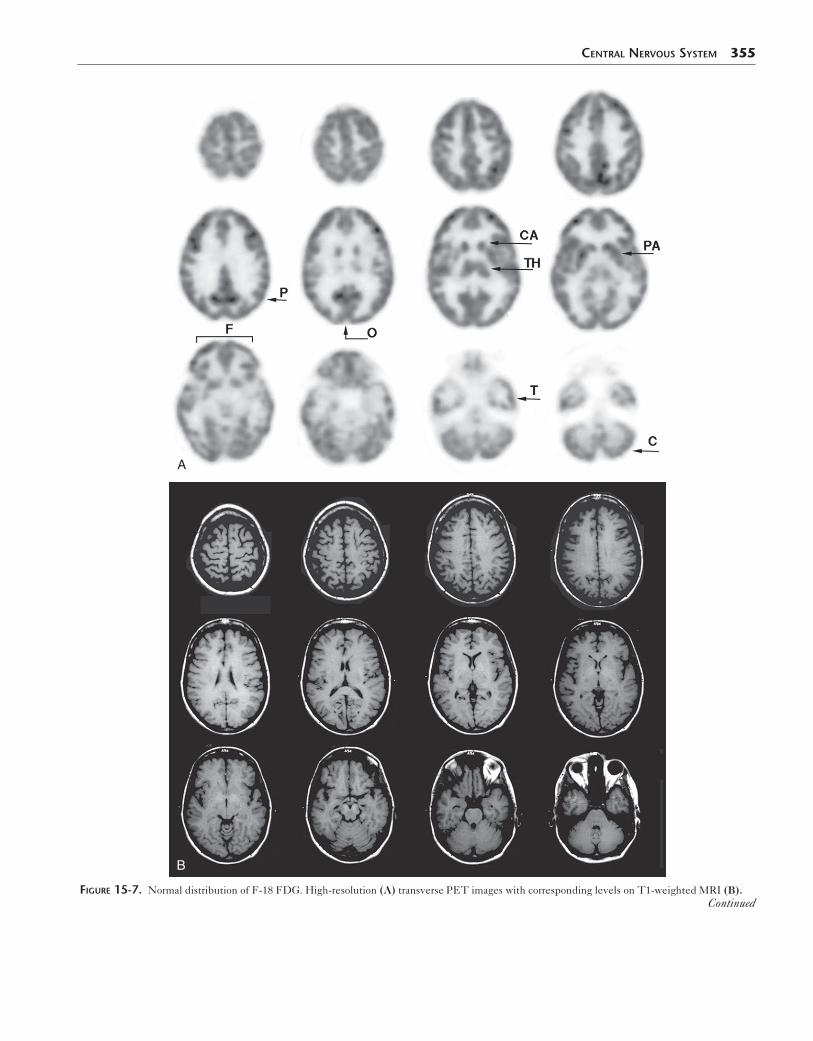
and enlarged ventricles. The anatomy seen on CT and MRI is much more detailed than the structures seen with SPECT or PET; however, many structures can be well visualized (Fig. 15-7). Typically, activity is fairly evenly distributed between the lobes of the brain. How-ever, this is dependent on the conditions at the time of injection. For example, bright lights will increase occipital lobes activity, falsely causing the frontal lobes to appear decreased.
The distribution of Tc-99m HMPAO differs only slightly from Tc-99m ECD. Tc-99m HMPAO accumulates more in the frontal lobes, thalamus, and cerebellum, whereas Tc-99m ECD shows higher affinity for the parietal and occipital lobes. Although the differences are not usually noticeable, it would be best to use the same agent for serial examina-tions. Most clinicians use the agent with which they are most familiar.
The normal distribution of SPECT and PET agents also changes with age. In infants, a relative decrease is seen in frontal lobe perfusion. This increases over time, reaching an adult level by about 2 years of age. In adults, global activ-ity decreases with age, and this decrease is more prominent in the frontal regions. Given these changes, using compari-son age-matched normal databases and computer programs that quantitate rCBF may help improve accuracy.
CLINICAL APPLICATIONS FOR CEREBRAL PERFUSION IMAGING
Dementia
As our population ages, dementia has an increasing impact on society and health care systems. Clinical symptoms may vary (e.g., short- or long-term memory loss, loss of judg-ment, personality changes, and loss of other higher cortical functions), and the functional decline can occur rapidly over months or slowly over years. These changes must be differentiated from the normal decline in memory and decreased ability to learn new things that accompany aging.
Dementia is a manifestation of many diseases (Box 15-4). Only about 10% of dementias, such as those caused by vita-min B12 or thyroid hormone deficiency, are treatable. How-ever, with better understanding of the disease processes underlying dementia, new therapies are being developed. For example, the cholinesterase inhibitors have some stabi-lizing effects in patients with Alzheimer disease, occasion-ally even reversing perfusion trends seen on SPECT scans.
The clinical diagnosis is often difficult and delayed, and anatomical imaging modalities such as CT and MRI may not reveal changes such as atrophy until the end stages of disease. SPECT and PET, on the other hand, have been shown useful in early diagnosis of Alzheimer disease. In addition, these functional modalities show promise for the identification of subjects early before damage is too severe for therapy to have any benefit.
Although PET has higher sensitivity and higher resolu-tion than SPECT, the overall patterns seen in dementia are similar for both rCGM and rCBF. In general, the types of dementia can be characterized as posterior, frontotemporal, or vascular. In addition to a geographic relation, dementias included in each category tend to share some histopatho-logical characteristics. The posterior dementias include
Central nervous system 355
A
B
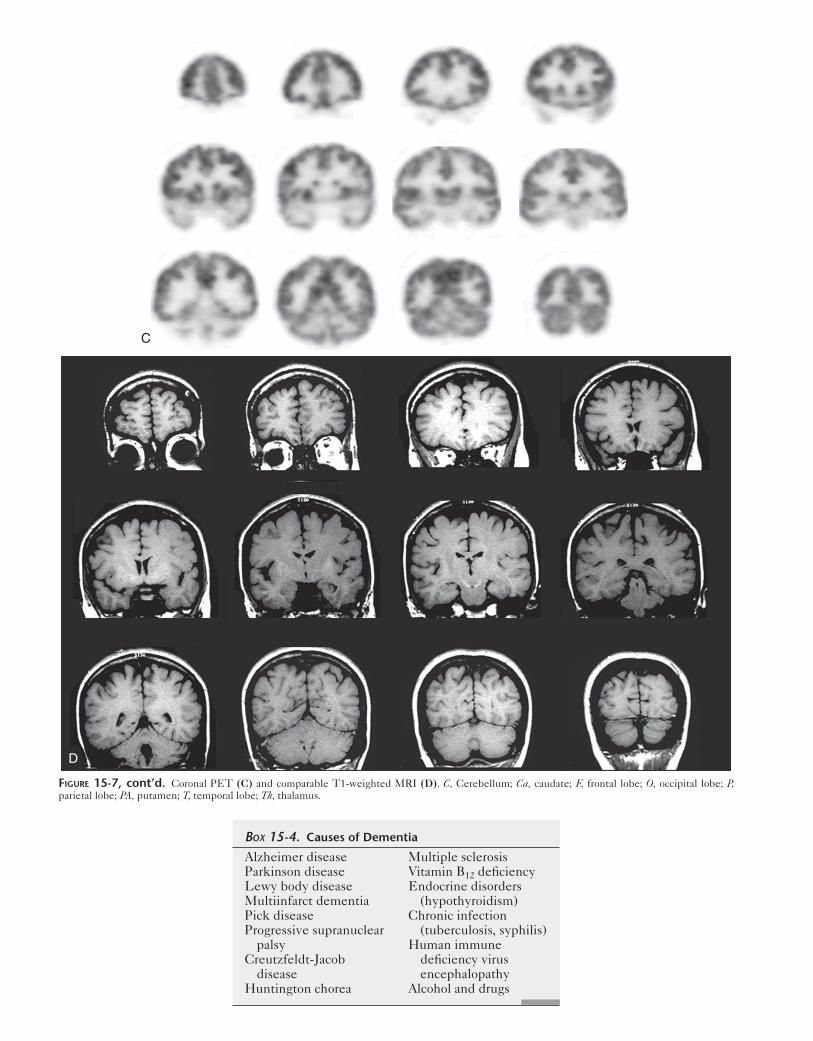
Figure 15-7. Normal distribution of F-18 FDG. High-resolution (A) transverse PET images with corresponding levels on T1-weighted MRI (B).Continued
C
D
Figure 15-7, cont’d. Coronal PET (C) and comparable T1-weighted MRI (D). C, Cerebellum; Ca, caudate; F, frontal lobe; O, occipital lobe; P, parietal lobe; PA, putamen; T, temporal lobe; Th, thalamus.
Alzheimer diseaseParkinson diseaseLewy body diseaseMultiinfarct dementiaPick diseaseProgressive supranuclear
palsyCreutzfeldt-Jacob
diseaseHuntington chorea
Multiple sclerosisVitamin B12 deficiencyEndocrine disorders
(hypothyroidism)Chronic infection
(tuberculosis, syphilis)Human immune
deficiency virus encephalopathy
Alcohol and drugs
Box 15-4. Causes of Dementia

Alzheimer disease, Lewy body disease, and Parkinson dementia. Pick disease is the classic frontotemporal dementia.
Posterior DementiasAlzheimer DementiaAlzheimer disease is the most common of the dementias, estimated to affect nearly 10% of the population over 65 and 50% of those over 85. Diagnosis can be definitively made at autopsy or by the rarely performed brain biopsy, with pathological samples showing characteristic neurofi-brillary tangles and amyloid plaques. Originally described as a dementia of a relatively young person (presenile dementia), it is now recognized that many older people originally thought to have multiinfarct dementia actually have Alzheimer disease. On the other hand, 25% of those thought to have Alzheimer disease clinically were found to have other causes of dementia at autopsy.
Imaging findings vary with the stage of disease, but PET and SPECT have both been able to identify cases of Alzheimer disease with a high degree of sensitivity. Studies have shown a higher sensitivity with F-18 FDG PET (up to 94%) than SPECT (78%-91%). The superi-ority of PET may be most important when trying to identify which patients with mild cognitive impairment will eventually progress on to actual Alzheimer disease. Patients with mild cognitive impairment have deficits on Mini-Mental Status Examination testing but do not meet probable Alzheimer disease criteria. Approximately 15% of patients with mild cognitive impairment progress to Alzheimer disease per year. PET studies have shown that patients with mild cognitive impairment with pari-etal and temporal hypometabolism were much more likely to go on to Alzheimer disease than those without the pattern. This ability may be crucial in the future for the identification of patients in the presymptomatic or early phases of Alzheimer disease who would benefit from therapy.
The characteristic patterns of Alzheimer disease are well established for both PET and SPECT, with findings pres-ent long before atrophy can be detected with MRI. Early disease begins in the posterior cingulate and tends to involve the superior posterior parietal cortex, manifested as bilateral hypometabolism or hypoperfusion (Fig. 15-8, A). Temporal lobe involvement is sometimes less reliably seen. Although the classic examples are symmetric, Alzheimer disease is often rather asymmetric, especially in the early stages (Fig.15-8, B). As the disease progresses, it involves the frontal cortices, although parietal and tempo-ral lobe involvement usually remains greater. It may be more difficult to diagnose very elderly patients and patients at the end stage of disease because the imaging pattern may be more of a generalized, nonspecific decrease in cortical uptake (Fig. 15-8, C). However, sparing of the occipital visual cortex, primary somatosensory and motor cortices, basal ganglia, thalamus, and cerebellum is the norm (Fig. 15-9).
New PET radiopharmaceuticals are being investigated that bind to amyloid, muscarinic receptors, nicotinic recep-tors, and components of the cholinergic system. Correla-tion with genetic factors influencing Alzheimer disease will be ongoing. Recent developments have shown a
Central nervous system 357
strong link between scintigraphic perfusion patterns and certain genes in Alzheimer disease, including the E4 allele of the apolipoprotein E gene.
Lewy Body DiseaseThe other diseases that affect the posterior regions of the brain often overlap with each other and with Alzheimer disease. These include Lewy body disease (dementia with Lewy bodies) and dementia of Parkinson disease. Dementia with Lewy bodies is most likely the second most common cause after Alzheimer disease among dementias caused by neurodegenerative disorders. Histo-pathology shows Lewy body intracellular inclusions (alpha-synuclein) throughout the cortex, brainstem, and limbic system. Clinically, patients with Lewey body dementia often demonstrate a fluctuating dementia, visual hallucinations, falls, and some parkinsonian symptoms, such as tremor. Lewy bodies were originally described in Parkinson disease, and it is likely that dementia with Lewy bodies and Parkinson disease are related as part of a spectrum of disease.
FDG PET and SPECT images can confirm dementia with Lewy bodies by showing changes in the posterior cor-tical regions. The pattern tends to involve the occipital lobes and cerebellum (Fig. 15-10). The involvement of the primary visual cortex can explain the clinical visual hallu-cinations. Another deviation from the patterns seen in Alzheimer disease is preservation of hippocampal activity in dementia with Lewy bodies. The imaging findings of dementia in Parkinson disease also can overlap Alzheimer disease, with the exception of occipital involvement and more mesial temporal sparing. It is often important to dif-ferentiate patients with Parkinson disease with depression from those with dementia clinically. Depressed patients with Parkinson disease can show decreased prefrontal and caudate activity rather than the posterior pattern so typical of dementia. However, other patterns have been described.
Frontotemporal DementiaThe frontotemporal dementias are a diverse group of diseases. Clinically, patients show varying presentations. Aphasia occurs with temporal lobe abnormalities, and fron-tal lobe involvement results in personality changes, includ-ing loss of judgment and inappropriate behavior. In frontotemporal dementia, memory loss is often secondary or absent as opposed to being the primary problem as in Alzheimer disease. The differential diagnosis of frontotem-poral dementia includes Pick disease, semantic dementia, primary progressive aphasia, and familial frontotemporal dementia. Frontotemporal dementia shows frontal and anterior temporal neuronal degeneration. Pick bodies, a type of protein inclusion, are sometimes found, and brain and CSF are sometimes assessed for abnormalities related to tau and ubiquitin proteins. However, concentrated amyloid and Lewy bodies are absent. Understanding the different abnormal proteins found in the dementias may help uncover new diagnostic tests and therapies.
As in the posterior dementias, PET and SPECT have both proved accurate for the detection of frontotemporal dementia (Fig. 15-11). Severe atrophy, seen on MRI, is not visualized until much later than the perfusion and meta-bolic changes of SPECT and FDG PET.

358 Nuclear Medicine: The Requisites
Decreased perfusion and metabolism in the frontal and temporal lobes may be seen in diseases other than those in the frontotemporal dementia group. These include cocaine abuse, depression, progressive supranuclear palsy, spino-cerebellar atrophy, and amyotrophic lateral sclerosis. More commonly, decreased frontal and temporal rCBF and rCGM are secondary to a vascular process. Focal cortical defects, abnormalities on MRI, and areas of scintigraphic
asymmetry should raise the level of suspicion for a vascular degenerative process.
Vascular DementiaVascular dementia is generally diagnosed through a combi-nation of clinical examination, history, and MRI changes such as focal white matter lesions (subcortical encephalo-malacia). However, symptoms may be confusing, and in
A
B
Figure 15-8. Alzheimer disease. A, Transaxial PET images reveal decreased perfusion to the temporal parietal cortex beginning high in the posterior parietal region with sparring of the basal ganglia, thalamus, and cerebellum. B, Tc-99m HMPAO SPECT shows that although Alzheimer disease is classically described as a symmetric process, it may be quite asymmetric, as seen in the left posterior parietal region.
Continued

Central nervous system 359
C
Figure 15-8, cont’d. C, As Alzheimer disease becomes more severe it is more diffuse on this SPECT study.
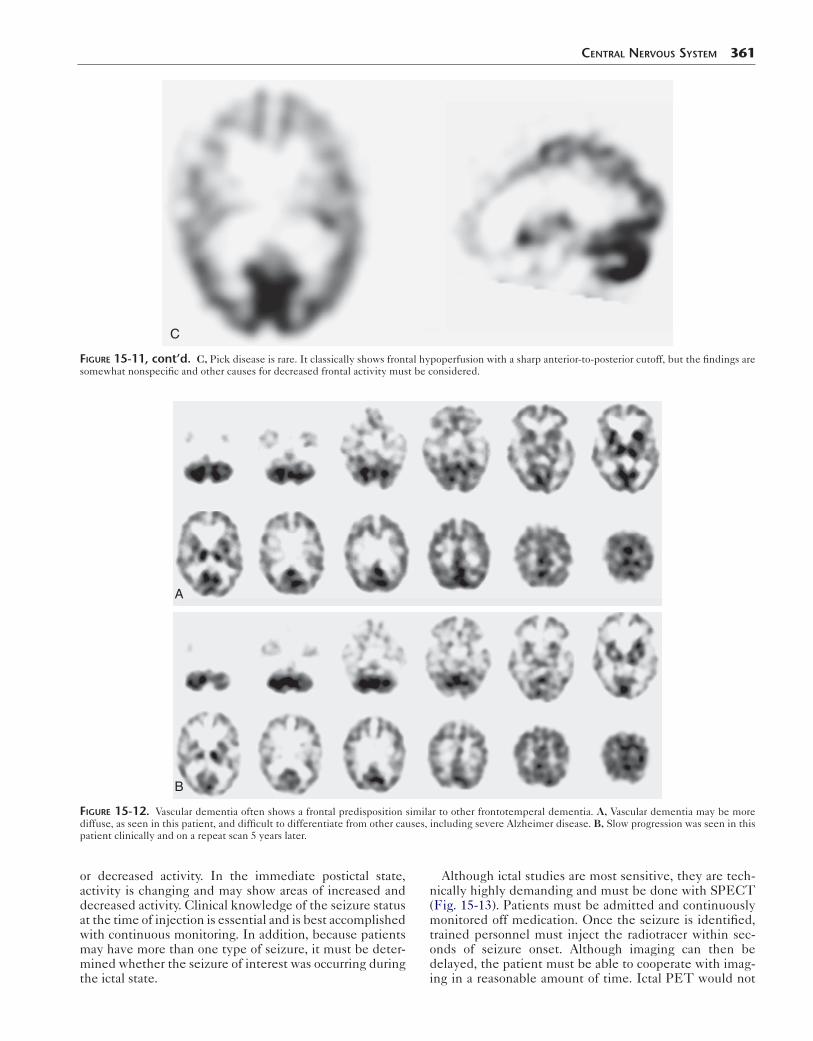
15% to 20% of cases, mixed causes are present. Frontal pre-disposition may be present in vascular dementia, which must be differentiated from expected age-related decreases on scintigraphic examinations. Often, the generalized decrease in rCGM or rCBF seen in the patient with vascu-lar dementia is difficult to differentiate from severe Alzheimer disease (Fig. 15-12). At times, when other causes for dementia such as Alzheimer disease are excluded, vas-cular dementia may be left as a diagnosis of exclusion.
EpilepsyIntractable or medically refractory seizures may require sur-gery for therapy. Precise seizure localization often requires a combination of scalp electroencephalogram (EEG), MRI, magnetoencephalography (MEG), and nuclear medicine imaging for evaluation. These noninvasive studies are important in directing the invasive intracranial EEG grid
Figure 15-9. Alzheimer disease on PET/CT. A patient with moderately advanced Alzheimer disease shows hypometabolism in the posterior pari-etal and temporal regions but involvement also extends anteriorly. Spar-ing of the occipital region and sensory motor cortex is clear (arrowheads).
placement in the operating room and determining thera-peutic options. Although MRI often reveals abnormalities at the site of seizure foci, such as mesial temporal hippocam-pal sclerosis, it is rare for structural imaging to fully visualize the actual extent of the abnormally activated neurons by structural imaging. In addition, although EEG remains criti-cal in seizure localization, it is often inconclusive.
PET and SPECT have very important roles in such sei-zure evaluation. In the ictal state, activated foci show increased activity, representing increased rCBF and glu-cose metabolism. Interictal images, however, show normal
Figure 15-10. Comparison of posterior dementias on Tc-99m HMPAO. Top row: Alzheimer disease generally begins near the superior convexity and involves the parietal and temporal regions laterally (arrows), sparing the occiput and cerebellum (arrowhead). Bottom row: Lewy body disease involves the medial occipital region (arrows) and usually has more caudal extension than Alzheimer disease.

360 Nuclear Medicine: The Requisites
A
B
Figure 15-11. Frontotemporal dementia sparing posterior parietal regions. A, Frontal hypometabolism on PET can be due to many causes and changes visible long before MRI shows atrophy or signal changes. B, Postcontrast T1-weighted MRI shows no atrophy, and other MRI sequences were unremarkable.
Continued
Central nervous system 361
A
B
Figure 15-12. Vascular dementia often shows a frontal predisposition similar to other frontotemperal dementia. A, Vascular dementia may be more diffuse, as seen in this patient, and difficult to differentiate from other causes, including severe Alzheimer disease. B, Slow progression was seen in this patient clinically and on a repeat scan 5 years later.
C
Figure 15-11, cont’d. C, Pick disease is rare. It classically shows frontal hypoperfusion with a sharp anterior-to-posterior cutoff, but the findings are somewhat nonspecific and other causes for decreased frontal activity must be considered.
or decreased activity. In the immediate postictal state, activity is changing and may show areas of increased and decreased activity. Clinical knowledge of the seizure status at the time of injection is essential and is best accomplished with continuous monitoring. In addition, because patients may have more than one type of seizure, it must be deter-mined whether the seizure of interest was occurring during the ictal state.
Although ictal studies are most sensitive, they are tech-nically highly demanding and must be done with SPECT (Fig. 15-13). Patients must be admitted and continuously monitored off medication. Once the seizure is identified, trained personnel must inject the radiotracer within sec-onds of seizure onset. Although imaging can then be delayed, the patient must be able to cooperate with imag-ing in a reasonable amount of time. Ictal PET would not

362 Nuclear Medicine: The Requisites
A
B
C
Figure 15-13. Seizure imaging. A, Ictal Tc-99m HMPAO SPECT axial (top) and coronal (bottom) images reveal increased perfusion (arrows) to the right temporal region from an active seizure. B, The abnormal temporal region is a subtle area of hypometabolism (arrows) on the interictal FDG PET. C, Ictal SPECT in a second patient demonstrates hyperperfusion (arrow) in the right parasagittal region (left) corresponding to an area of hypometabo-lism (arrow) on interictal PET (right) from a seizure focus.
be practical given the half-life of F-18 FDG. Interictal studies are far less sensitive, although interictal PET is superior to interictal SPECT. Clinical knowledge of the most recent seizure is needed to be sure that a study is truly ictal or interictal. Ictal SPECT has a sensitivity of
nearly 90% in temporal lobe seizures, and the abnormal areas are generally more extensive than any structural abnormality on MRI. However, sensitivity for extratempo-ral seizures is much lower, on the order of 50% to 75%. Interictal FDG PET and SPECT is approximately 70%
Central nervous system 363
ICTAL
INTERICTAL
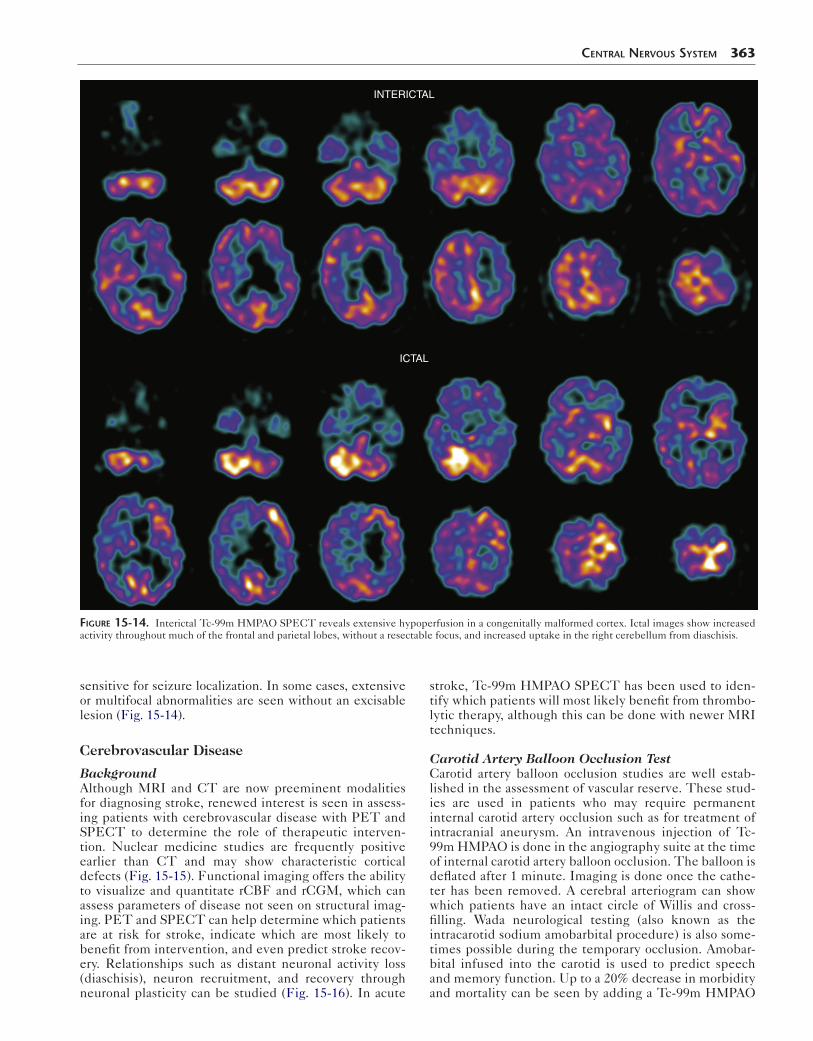
Figure 15-14. Interictal Tc-99m HMPAO SPECT reveals extensive hypoperfusion in a congenitally malformed cortex. Ictal images show increased activity throughout much of the frontal and parietal lobes, without a resectable focus, and increased uptake in the right cerebellum from diaschisis.
sensitive for seizure localization. In some cases, extensive or multifocal abnormalities are seen without an excisable lesion (Fig. 15-14).
Cerebrovascular Disease
BackgroundAlthough MRI and CT are now preeminent modalities for diagnosing stroke, renewed interest is seen in assess-ing patients with cerebrovascular disease with PET and SPECT to determine the role of therapeutic interven-tion. Nuclear medicine studies are frequently positive earlier than CT and may show characteristic cortical defects (Fig. 15-15). Functional imaging offers the ability to visualize and quantitate rCBF and rCGM, which can assess parameters of disease not seen on structural imag-ing. PET and SPECT can help determine which patients are at risk for stroke, indicate which are most likely to benefit from intervention, and even predict stroke recov-ery. Relationships such as distant neuronal activity loss (diaschisis), neuron recruitment, and recovery through neuronal plasticity can be studied (Fig. 15-16). In acute
stroke, Tc-99m HMPAO SPECT has been used to iden-tify which patients will most likely benefit from thrombo-lytic therapy, although this can be done with newer MRI techniques.
Carotid Artery Balloon Occlusion TestCarotid artery balloon occlusion studies are well estab-lished in the assessment of vascular reserve. These stud-ies are used in patients who may require permanent internal carotid artery occlusion such as for treatment of intracranial aneurysm. An intravenous injection of Tc-99m HMPAO is done in the angiography suite at the time of internal carotid artery balloon occlusion. The balloon is deflated after 1 minute. Imaging is done once the cathe-ter has been removed. A cerebral arteriogram can show which patients have an intact circle of Willis and cross-filling. Wada neurological testing (also known as the intracarotid sodium amobarbital procedure) is also some-times possible during the temporary occlusion. Amobar-bital infused into the carotid is used to predict speech and memory function. Up to a 20% decrease in morbidity and mortality can be seen by adding a Tc-99m HMPAO
364 Nuclear Medicine: The Requisites
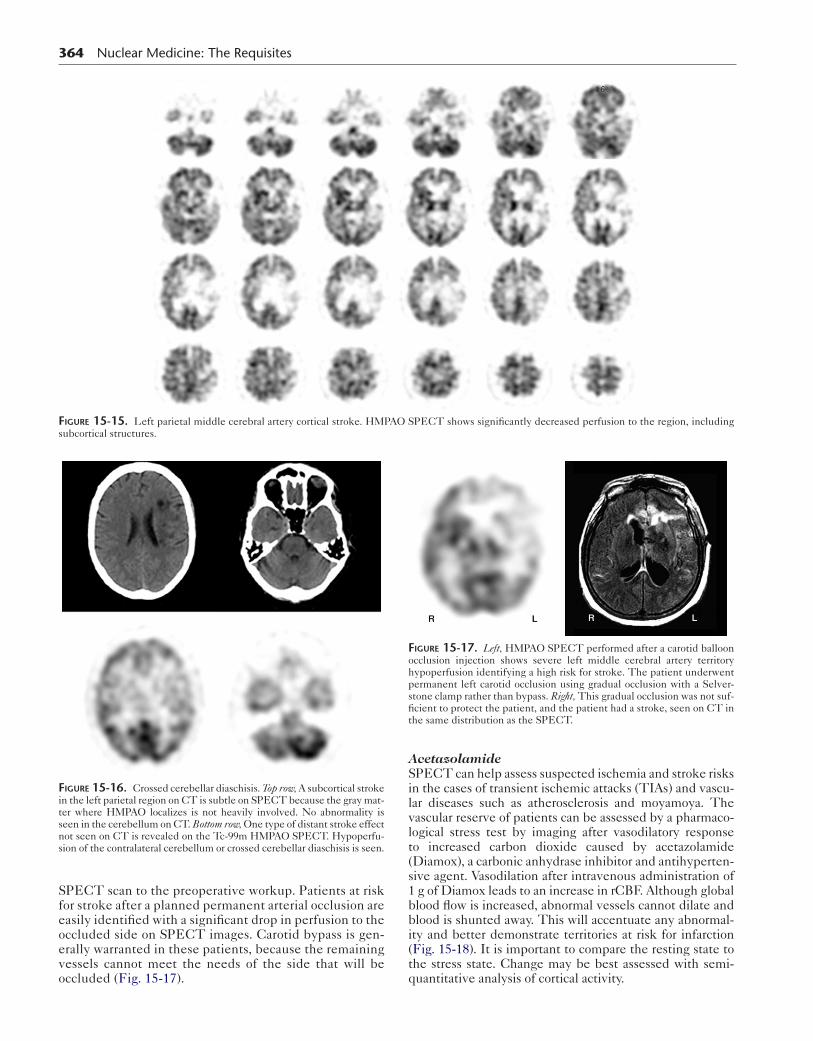
Figure 15-15. Left parietal middle cerebral artery cortical stroke. HMPAO SPECT shows significantly decreased perfusion to the region, including subcortical structures.
SPECT scan to the preoperative workup. Patients at risk for stroke after a planned permanent arterial occlusion are easily identified with a significant drop in perfusion to the occluded side on SPECT images. Carotid bypass is gen-erally warranted in these patients, because the remaining vessels cannot meet the needs of the side that will be occluded (Fig. 15-17).
Figure 15-16. Crossed cerebellar diaschisis. Top row, A subcortical stroke in the left parietal region on CT is subtle on SPECT because the gray mat-ter where HMPAO localizes is not heavily involved. No abnormality is seen in the cerebellum on CT. Bottom row, One type of distant stroke effect not seen on CT is revealed on the Tc-99m HMPAO SPECT. Hypoperfu-sion of the contralateral cerebellum or crossed cerebellar diaschisis is seen.
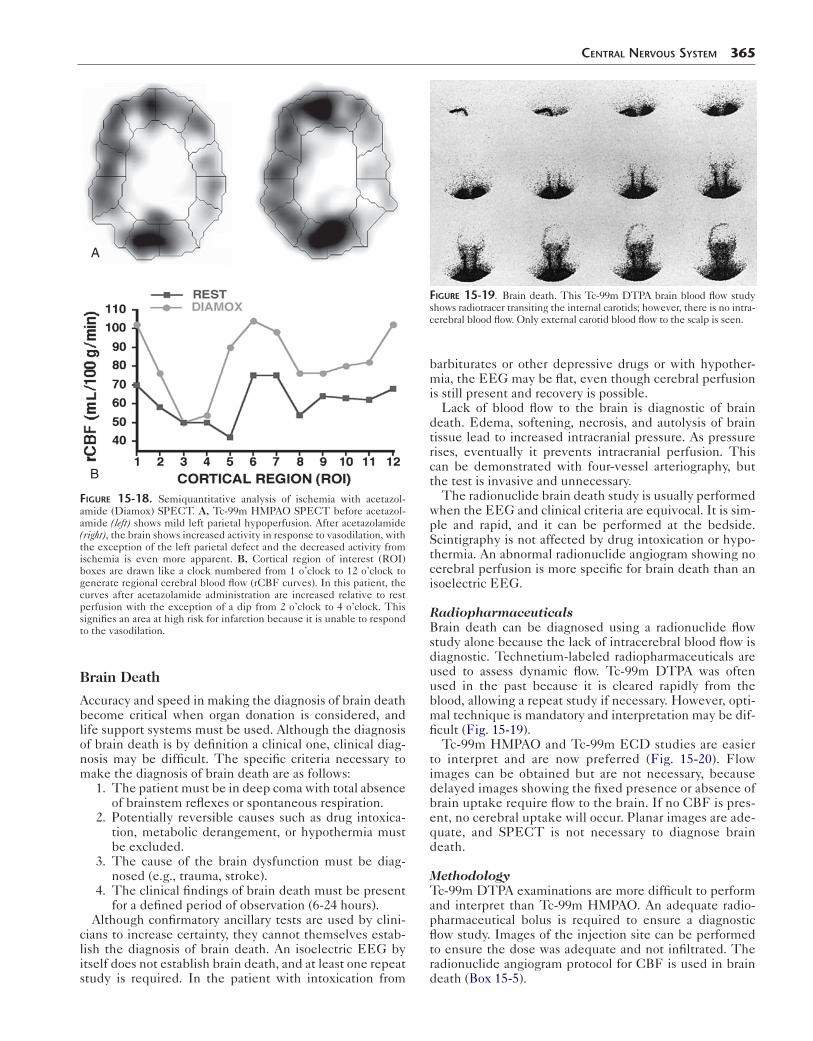
AcetazolamideSPECT can help assess suspected ischemia and stroke risks in the cases of transient ischemic attacks (TIAs) and vascu-lar diseases such as atherosclerosis and moyamoya. The vascular reserve of patients can be assessed by a pharmaco-logical stress test by imaging after vasodilatory response to increased carbon dioxide caused by acetazolamide (Diamox), a carbonic anhydrase inhibitor and antihyperten-sive agent. Vasodilation after intravenous administration of 1 g of Diamox leads to an increase in rCBF. Although global blood flow is increased, abnormal vessels cannot dilate and blood is shunted away. This will accentuate any abnormal-ity and better demonstrate territories at risk for infarction (Fig. 15-18). It is important to compare the resting state to the stress state. Change may be best assessed with semi-quantitative analysis of cortical activity.
Figure 15-17. Left, HMPAO SPECT performed after a carotid balloon occlusion injection shows severe left middle cerebral artery territory hypoperfusion identifying a high risk for stroke. The patient underwent permanent left carotid occlusion using gradual occlusion with a Selver-stone clamp rather than bypass. Right, This gradual occlusion was not suf-ficient to protect the patient, and the patient had a stroke, seen on CT in the same distribution as the SPECT.
Brain Death
Accuracy and speed in making the diagnosis of brain death become critical when organ donation is considered, and life support systems must be used. Although the diagnosis of brain death is by definition a clinical one, clinical diag-nosis may be difficult. The specific criteria necessary to make the diagnosis of brain death are as follows: 1. The patient must be in deep coma with total absence
of brainstem reflexes or spontaneous respiration. 2. Potentially reversible causes such as drug intoxica-
tion, metabolic derangement, or hypothermia must be excluded.
3. The cause of the brain dysfunction must be diag-nosed (e.g., trauma, stroke).
4. The clinical findings of brain death must be present for a defined period of observation (6-24 hours).
Although confirmatory ancillary tests are used by clini-cians to increase certainty, they cannot themselves estab-lish the diagnosis of brain death. An isoelectric EEG by itself does not establish brain death, and at least one repeat study is required. In the patient with intoxication from
A
B
Figure 15-18. Semiquantitative analysis of ischemia with acetazol-amide (Diamox) SPECT. A, Tc-99m HMPAO SPECT before acetazol-amide (left) shows mild left parietal hypoperfusion. After acetazolamide (right), the brain shows increased activity in response to vasodilation, with the exception of the left parietal defect and the decreased activity from ischemia is even more apparent. B, Cortical region of interest (ROI) boxes are drawn like a clock numbered from 1 o’clock to 12 o’clock to generate regional cerebral blood flow (rCBF curves). In this patient, the curves after acetazolamide administration are increased relative to rest perfusion with the exception of a dip from 2 o’clock to 4 o’clock. This signifies an area at high risk for infarction because it is unable to respond to the vasodilation.
Central nervous system 365
barbiturates or other depressive drugs or with hypother-mia, the EEG may be flat, even though cerebral perfusion is still present and recovery is possible.
Lack of blood flow to the brain is diagnostic of brain death. Edema, softening, necrosis, and autolysis of brain tissue lead to increased intracranial pressure. As pressure rises, eventually it prevents intracranial perfusion. This can be demonstrated with four-vessel arteriography, but the test is invasive and unnecessary.
The radionuclide brain death study is usually performed when the EEG and clinical criteria are equivocal. It is sim-ple and rapid, and it can be performed at the bedside. Scintigraphy is not affected by drug intoxication or hypo-thermia. An abnormal radionuclide angiogram showing no cerebral perfusion is more specific for brain death than an isoelectric EEG.
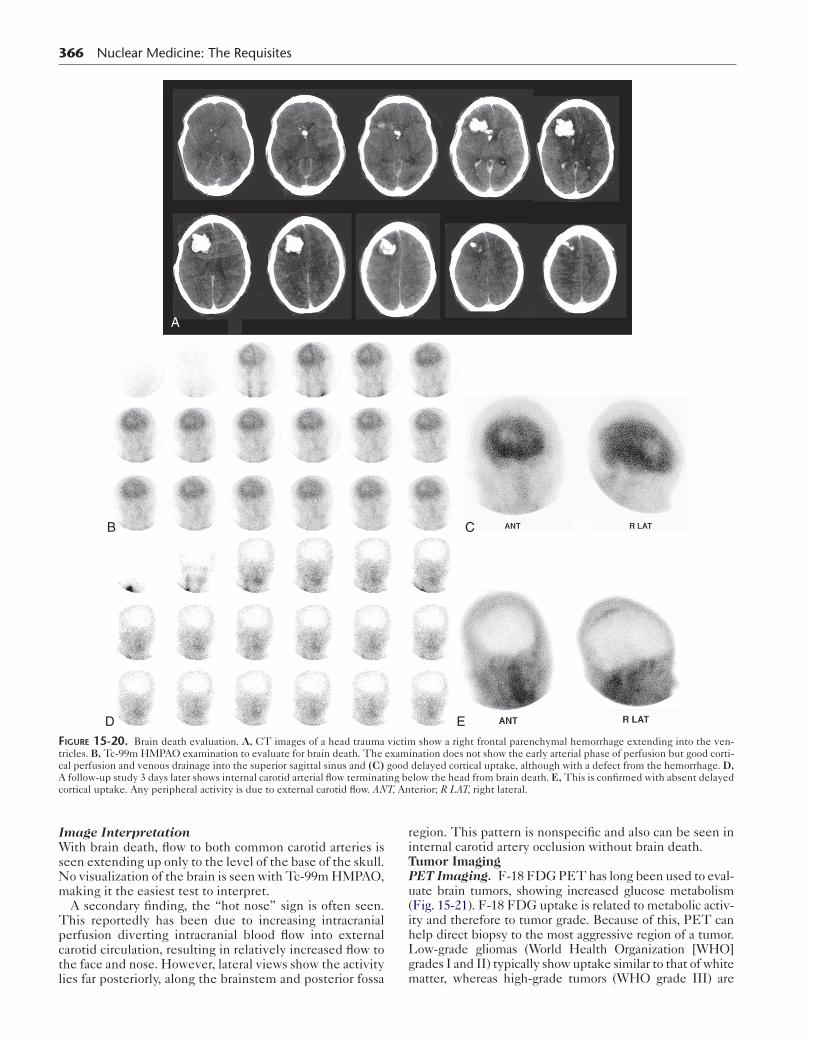
RadiopharmaceuticalsBrain death can be diagnosed using a radionuclide flow study alone because the lack of intracerebral blood flow is diagnostic. Technetium-labeled radiopharmaceuticals are used to assess dynamic flow. Tc-99m DTPA was often used in the past because it is cleared rapidly from the blood, allowing a repeat study if necessary. However, opti-mal technique is mandatory and interpretation may be dif-ficult (Fig. 15-19).
Tc-99m HMPAO and Tc-99m ECD studies are easier to interpret and are now preferred (Fig. 15-20). Flow images can be obtained but are not necessary, because delayed images showing the fixed presence or absence of brain uptake require flow to the brain. If no CBF is pres-ent, no cerebral uptake will occur. Planar images are ade-quate, and SPECT is not necessary to diagnose brain death.
MethodologyTc-99m DTPA examinations are more difficult to perform and interpret than Tc-99m HMPAO. An adequate radio-pharmaceutical bolus is required to ensure a diagnostic flow study. Images of the injection site can be performed to ensure the dose was adequate and not infiltrated. The radionuclide angiogram protocol for CBF is used in brain death (Box 15-5).
Figure 15-19. Brain death. This Tc-99m DTPA brain blood flow study shows radiotracer transiting the internal carotids; however, there is no intra-cerebral blood flow. Only external carotid blood flow to the scalp is seen.
366 Nuclear Medicine: The Requisites
A
B
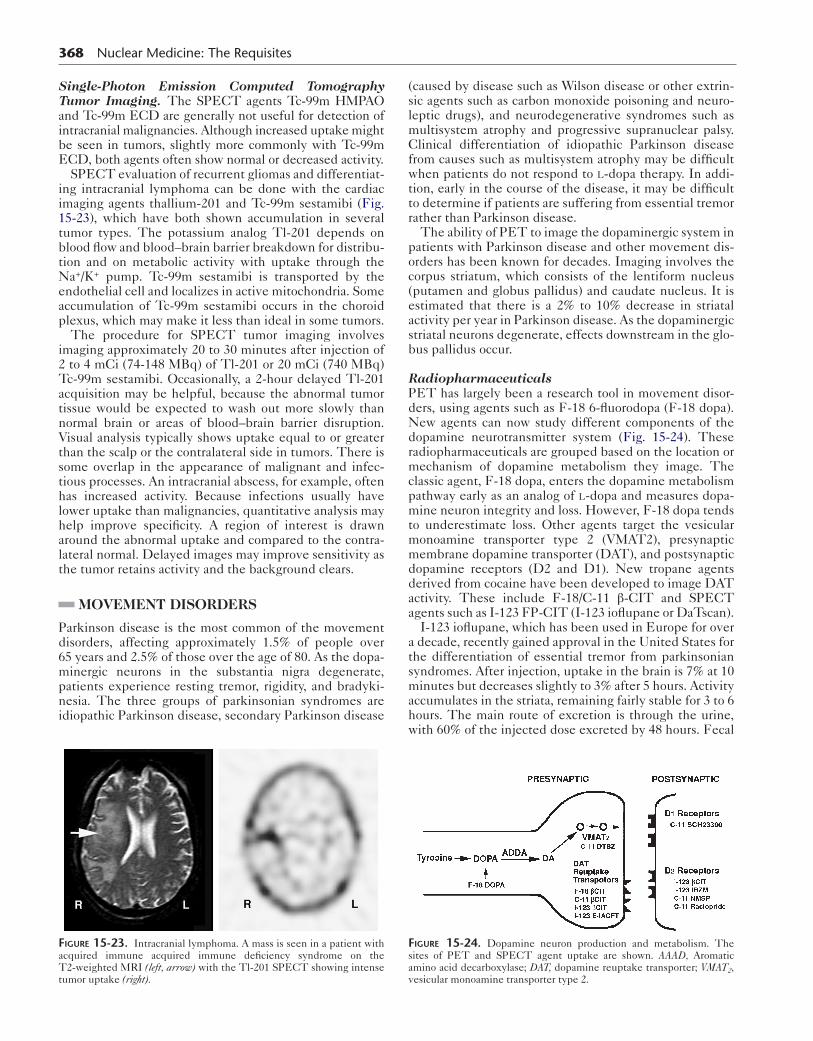
D E
C
Figure 15-20. Brain death evaluation. A, CT images of a head trauma victim show a right frontal parenchymal hemorrhage extending into the ven-tricles. B, Tc-99m HMPAO examination to evaluate for brain death. The examination does not show the early arterial phase of perfusion but good corti-cal perfusion and venous drainage into the superior sagittal sinus and (C) good delayed cortical uptake, although with a defect from the hemorrhage. D, A follow-up study 3 days later shows internal carotid arterial flow terminating below the head from brain death. E, This is confirmed with absent delayed cortical uptake. Any peripheral activity is due to external carotid flow. ANT, Anterior; R LAT, right lateral.
Image InterpretationWith brain death, flow to both common carotid arteries is seen extending up only to the level of the base of the skull. No visualization of the brain is seen with Tc-99m HMPAO, making it the easiest test to interpret.
A secondary finding, the “hot nose” sign is often seen. This reportedly has been due to increasing intracranial perfusion diverting intracranial blood flow into external carotid circulation, resulting in relatively increased flow to the face and nose. However, lateral views show the activity lies far posteriorly, along the brainstem and posterior fossa
region. This pattern is nonspecific and also can be seen in internal carotid artery occlusion without brain death.Tumor ImagingPET Imaging. F-18 FDG PET has long been used to eval-uate brain tumors, showing increased glucose metabolism (Fig. 15-21). F-18 FDG uptake is related to metabolic activ-ity and therefore to tumor grade. Because of this, PET can help direct biopsy to the most aggressive region of a tumor. Low-grade gliomas (World Health Organization [WHO] grades I and II) typically show uptake similar to that of white matter, whereas high-grade tumors (WHO grade III) are

similar or increased compared to gray matter. Grade IV (glio-blastoma multiforme) shows markedly increased activity compared to normal cortical gray matter. Interestingly, low-grade pilocytic astrocytomas and benign pituitary tumors can show increased F-18 FDG accumulation.
F-18 FDG PET also can be used to identify malignancy in cases in which the MRI is inconclusive. This includes differentiating lymphoma presenting as a ring enhancing lesion from toxoplasmosis infection in immunocompro-mised patients. However, the most common use of F-18 FDG PET is to determine whether abnormal MRI signal and enhancement after radiation or surgery represents recurrent glioma. PET images show absent or decreased activity in the normal postoperative brain and any area of
Box 15-5. Brain Death Scintigraphy: Summary Protocol
PATIENT PREPARATIONNone
RADIOPHARMACEUTICALTc-99m HMPAO or Tc-99m DTPA 20 mCi (740 MBq)
INSTRUMENTATIONGamma camera setup: Large field of viewCollimator: High resolution, low energyWindow: 15% over 140-keV photopeakCamera formatter setup: 2- to 3-second flow images
for 30 seconds, and then immediate and delayed static images in multiple views
Computer setup: 1-second flow images for 60 seconds (64 × 64 byte mode), and then static images (128 × 128 frame mode)
IMAGING PROCEDURE 1. Inject radiopharmaceutical as an intravenous
bolus. 2. Acquire dynamic flow study. 3. Immediate 750k static images in the anterior,
posterior, right lateral, and left lateral views (optional). Image injection site.
DTPA, Diethylenetriaminepentaacetic acid; HMPAO, hexamethylpropyleneamine oxime.
Central nervous system 367
increased uptake most likely represents tumor. High levels of background F-18 FDG activity complicate evaluation. Direct, side-by-side comparison with the MRI is critical for image interpretation, and actual fusion of PET images to the MRI is even better. In the case of high-dose radiation therapy, increased F-18 FDG activity can be seen and may persist. Although this activity is generally mild and not greater than normal cortical uptake, serial images to look for any areas of increasing activity may be necessary to exclude early recurrence. Recurrences are typically aggres-sive with intense radiotracer accumulation.
Although F-18 FDG PET is a valuable clinical tool in the workup of many types of malignancy outside of the CNS, nearly two thirds of intracranial metastatic lesions are not seen on PET because of the high background activity (Fig. 15-22). Therefore MRI remains the standard for metastatic lesion detection.
Numerous other PET radiopharmaceuticals have been used to evaluate tumors with aspects of cellular activity other than glucose metabolism. Evaluating DNA synthe-sis with F-18 fluorothymidine (FLT) appears superior to F-18 FDG with cases of aggressive, enhancing tumors. Evaluating protein synthesis, such as with C-11 methio-nine or F-18 fluorodopa, has been shown accurate even in low-grade tumors.
Figure 15-21. Recurrent gliomas may be difficult to detect on MRI. T2-weighted MRI shows posttherapy signal changes (left). The recurrent tumor is seen as an intense focus on the FDG PET (right).
A B
Figure 15-22. F-18 FDG images from a patient with metastatic lung cancer show (A) avid uptake in disease within the chest on the maximal intensity projection image, but PET/CT images of the brain (B) show a left cerebral metastasis with surrounding edema on CT (left) with little FDG accumula-tion on PET (center) or fused (right) images.
368 Nuclear Medicine: The Requisites
Single-Photon Emission Computed Tomography Tumor Imaging. The SPECT agents Tc-99m HMPAO and Tc-99m ECD are generally not useful for detection of intracranial malignancies. Although increased uptake might be seen in tumors, slightly more commonly with Tc-99m ECD, both agents often show normal or decreased activity.
SPECT evaluation of recurrent gliomas and differentiat-ing intracranial lymphoma can be done with the cardiac imaging agents thallium-201 and Tc-99m sestamibi (Fig. 15-23), which have both shown accumulation in several tumor types. The potassium analog Tl-201 depends on blood flow and blood–brain barrier breakdown for distribu-tion and on metabolic activity with uptake through the Na+/K+ pump. Tc-99m sestamibi is transported by the endothelial cell and localizes in active mitochondria. Some accumulation of Tc-99m sestamibi occurs in the choroid plexus, which may make it less than ideal in some tumors.
The procedure for SPECT tumor imaging involves imaging approximately 20 to 30 minutes after injection of 2 to 4 mCi (74-148 MBq) of Tl-201 or 20 mCi (740 MBq) Tc-99m sestamibi. Occasionally, a 2-hour delayed Tl-201 acquisition may be helpful, because the abnormal tumor tissue would be expected to wash out more slowly than normal brain or areas of blood–brain barrier disruption. Visual analysis typically shows uptake equal to or greater than the scalp or the contralateral side in tumors. There is some overlap in the appearance of malignant and infec-tious processes. An intracranial abscess, for example, often has increased activity. Because infections usually have lower uptake than malignancies, quantitative analysis may help improve specificity. A region of interest is drawn around the abnormal uptake and compared to the contra-lateral normal. Delayed images may improve sensitivity as the tumor retains activity and the background clears.
MOVEMENT DISORDERS
Parkinson disease is the most common of the movement disorders, affecting approximately 1.5% of people over 65 years and 2.5% of those over the age of 80. As the dopa-minergic neurons in the substantia nigra degenerate, patients experience resting tremor, rigidity, and bradyki-nesia. The three groups of parkinsonian syndromes are idiopathic Parkinson disease, secondary Parkinson disease
(caused by disease such as Wilson disease or other extrin-sic agents such as carbon monoxide poisoning and neuro-leptic drugs), and neurodegenerative syndromes such as multisystem atrophy and progressive supranuclear palsy. Clinical differentiation of idiopathic Parkinson disease from causes such as multisystem atrophy may be difficult when patients do not respond to l-dopa therapy. In addi-tion, early in the course of the disease, it may be difficult to determine if patients are suffering from essential tremor rather than Parkinson disease.
The ability of PET to image the dopaminergic system in patients with Parkinson disease and other movement dis-orders has been known for decades. Imaging involves the corpus striatum, which consists of the lentiform nucleus (putamen and globus pallidus) and caudate nucleus. It is estimated that there is a 2% to 10% decrease in striatal activity per year in Parkinson disease. As the dopaminergic striatal neurons degenerate, effects downstream in the glo-bus pallidus occur.
RadiopharmaceuticalsPET has largely been a research tool in movement disor-ders, using agents such as F-18 6-fluorodopa (F-18 dopa). New agents can now study different components of the dopamine neurotransmitter system (Fig. 15-24). These radiopharmaceuticals are grouped based on the location or mechanism of dopamine metabolism they image. The classic agent, F-18 dopa, enters the dopamine metabolism pathway early as an analog of l-dopa and measures dopa-mine neuron integrity and loss. However, F-18 dopa tends to underestimate loss. Other agents target the vesicular monoamine transporter type 2 (VMAT2), presynaptic membrane dopamine transporter (DAT), and postsynaptic dopamine receptors (D2 and D1). New tropane agents derived from cocaine have been developed to image DAT activity. These include F-18/C-11 β-CIT and SPECT agents such as I-123 FP-CIT (I-123 ioflupane or DaTscan).
I-123 ioflupane, which has been used in Europe for over a decade, recently gained approval in the United States for the differentiation of essential tremor from parkinsonian syndromes. After injection, uptake in the brain is 7% at 10 minutes but decreases slightly to 3% after 5 hours. Activity accumulates in the striata, remaining fairly stable for 3 to 6 hours. The main route of excretion is through the urine,
with 60% of the injected dose excreted by 48 hours. FecalFigure 15-23. Intracranial lymphoma. A mass is seen in a patient with acquired immune acquired immune deficiency syndrome on the T2-weighted MRI (left, arrow) with the Tl-201 SPECT showing intense tumor uptake (right).
Figure 15-24. Dopamine neuron production and metabolism. The sites of PET and SPECT agent uptake are shown. AAAD, Aromatic amino acid decarboxylase; DAT, dopamine reuptake transporter; VMAT2, vesicular monoamine transporter type 2.
excretion accounts for roughly 14% of the dose. Dosimetry of I-123 ioflupane is listed in Table 15-2.
MethodA protocol for I-123 ioflupane is presented in Box 15-6. One of the most difficult things concerning I-123 ioflupane use is the ordering process as the U.S. Federal Drug Administration (FDA) approval hinged on meeting Drug Enforcement Agency (DEA) insistence that it be treated as a Schedule II controlled substance. Patient medications should be reviewed for any drug that might interfere with
Box 15-6. Iodine-123 Ioflupane Imaging: Summary Protocol
PATIENT PREPARATIONPatient should stop interfering medications.Thyroid blocking: Lugol solution or potassium iodide
thyroid at least 1 hour before injection.
RADIOPHARMACEUTICALI-123 ioflupane 3 to 5 mCi (111-185 MBq)
intravenouslyDelay to scan: 3 to 6 hours
INSTRUMENTATIONSPECT camera: Dual-head or triple-headCollimators: Low energy, high resolutionEnergy window: Peak 159 keV ± 10%Matrix and zoom to a 3.5 to 4.5 mm pixel size
POSITIONINGSupine with off the table head holder to extend head
beyond bed and allow tight orbit (11-15 cm)
ACQUISITIONAt least 120 views over 360 degrees, minimum
1.5 million counts for optimal image. Iterative reconstruction.
Box 15-7. Medications Potentially Interfering with Iodine-123 Ioflupane
AmoxapineAmphetamineBenztropineBupropionBuspironeCocaineMazindolMethamphetamineMethylphenidateNorepinephrinePhenterminePhenylpropanolamineSelegilineSertraline
EFFECTS UNCERTAINDopamine agonists and antagonistsSerotonin reuptake inhibitors: paroxetine, citaopram
Central nervous system 369
the examination (Box 15-7). Patient preparation consists of blocking thyroid uptake with potassium iodide (400 mg) or Lugol solution (equivalent 100 mg iodide) at least 1 hour before injection. The patient should be well hydrated and void frequently in the first 48 hours after the examination. After radiotracer injection a 3- to 6-hour delay is needed before SPECT imaging.
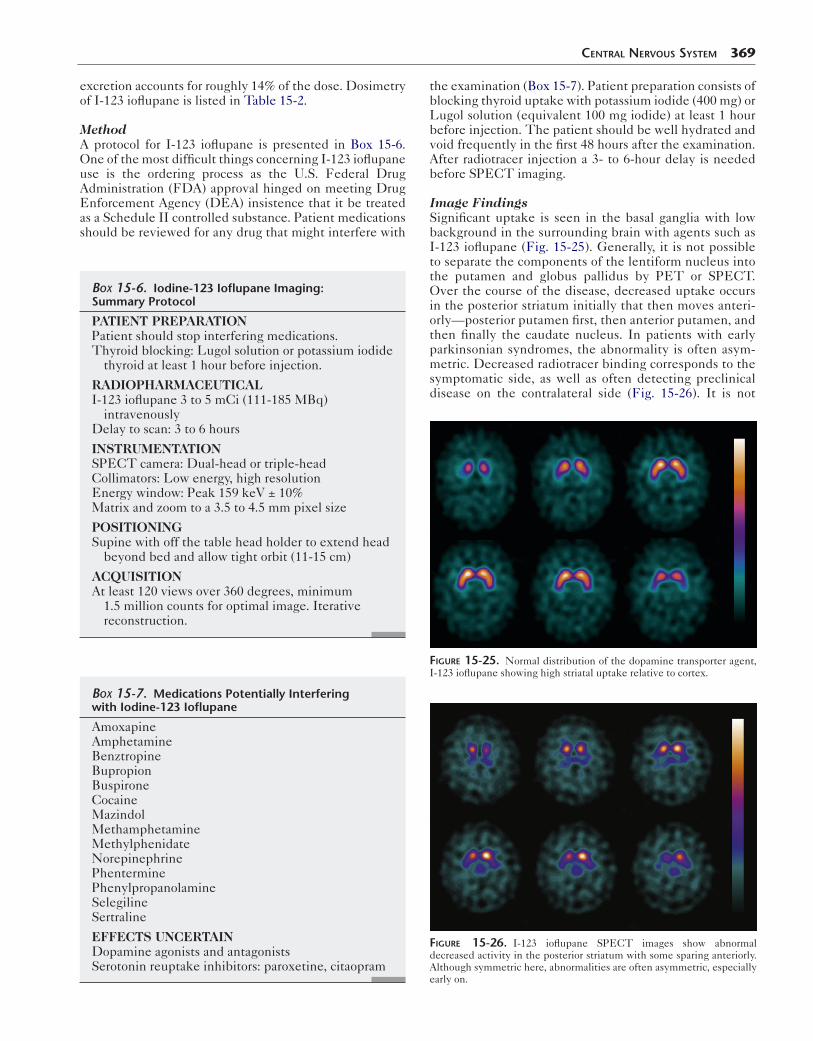
Image FindingsSignificant uptake is seen in the basal ganglia with low background in the surrounding brain with agents such as I-123 ioflupane (Fig. 15-25). Generally, it is not possible to separate the components of the lentiform nucleus into the putamen and globus pallidus by PET or SPECT. Over the course of the disease, decreased uptake occurs in the posterior striatum initially that then moves anteri-orly—posterior putamen first, then anterior putamen, and then finally the caudate nucleus. In patients with early parkinsonian syndromes, the abnormality is often asym-metric. Decreased radiotracer binding corresponds to the symptomatic side, as well as often detecting preclinical disease on the contralateral side (Fig. 15-26). It is not
Figure 15-25. Normal distribution of the dopamine transporter agent, I-123 ioflupane showing high striatal uptake relative to cortex.
Figure 15-26. I-123 ioflupane SPECT images show abnormal decreased activity in the posterior striatum with some sparing anteriorly. Although symmetric here, abnormalities are often asymmetric, especially early on.

370 Nuclear Medicine: The Requisites
possible to differentiate Parkinson disease from other true parkinsonian syndromes such as multisystem atro-phy and progressive supranuclear palsy because they all show similar decreases in the substantia nigra. Interob-server variability is good for positive and negative exami-nations. Although only 78% of patients with Parkinson disease had a positive scan, a negative scan (NPV) effec-tively excludes the diagnosis of Parkinson disease, with 97% of patients with a non-Parkinson disease, such as essential tremor, showing a normal examination.
AMYLOID IMAGING
Amyloid and Alzheimer Disease
Neurodegenerative dementias appear to involve increased production or abnormal folding of proteins such amyloid β (Aβ). Aβ is a peptide cleaved by various secretases (e.g., gamma secretase) from an amyloid precursor pro-tein. The role of Aβ is unclear, but growing evidence sug-gests it normally modulates presynaptic activity and neuronal survival. In patients with Alzheimer disease, along with neurofibrillary tangles, Aβ plaque accumulates in extracellular spaces and the walls of small vessels (Alzheimer angiopathy). One theory is that the amyloid causes neuronal damage, resulting in Alzheimer disease through a cascading series of downstream effects. Although the causal relationship of Aβ in the development of Alzheimer disease is not actually known, a relationship exists between the presence of Aβ and the severity of the dementia. As treatments are developed for Alzheimer dis-ease, it is critical to identify patients early, because amy-loid accumulation likely begins years before the dementia is evident.
RadiopharmaceuticalsCarbon-11 Pittsburgh B CompoundSeveral PET radiopharmaceuticals have been developed that bind to Aβ. The first and most studied of these is C-11 Pittsburgh B compound (PIB), developed from thioflavin T, a fluorescent dye used to evaluate amyloid. C-11 PIB has high-affinity binding to insoluble fibrillary Aβ but not to neurofibrillary plaques or amorphous Aβ. Binding of C-11 PIB is seen in more than 90% of patients with Alzheimer disease, but cortical uptake is similar to that in the cerebellum, the usual reference, in normal volunteers. However, Aβ accumulation occurs in asymptomatic elderly patients, increasing from 10% in those younger than 70 years of age to 30% to 40% by age 80. The binding of C-11 PIB does not always mirror areas of abnormality seen with F-18 FDG. C-11 PIB uptake is high in the frontal, tempo-ral, parietal, and occipital cortices and the striatum early on. The high levels of uptake do not significantly change over time, even as F-18 FDG shows growing areas of met-abolic decline with disease progression.
Fluorine-18 Amyloid AgentsFor an amyloid agent to be widely used, the half-life of the C-11 label is impractically short. A significant develop-ment in amyloid imaging was the formulation of an F-18 6-dialkylamino-2-naphthyethylidene derivative, F-18 FDDNP, a lipophilic agent that binds to Aβ. However, many studies have shown that F-18 FDDNP shows less
specific binding than C-11 PIB, with uptake in Aβ, neuro-fibrillary tangles and other proteins.
Clinical trials since have shown promise with three other F-18–labeled amyloid binding agents: F-18 AV-45 (Florbetapir), F-18 AV-1 (Florbetaben), and F-18-3′-F-PIB (Flutemetamol). Interpretation is made more difficult by the presence of Aβ in cognitively normal elderly patients and high levels of nonspecific white matter bind-ing (Fig. 15-27). However, each of the agents is able to cross the blood–brain barrier, shows high-affinity binding for Aβ, and is able to identify patients with Alzheimer dis-ease compared with controls or patients with frontotem-oral lobar degeneration (FTLD). Positive examinations demonstrate high levels of cortical uptake (Fig. 15-28). Because early deposition of amyloid occurs in the deeper cortical levels, the amount of white matter binding seen in these radiopharmaceuticals may cause diagnostic
Figure 15-27. Axial PET images of the amyloid binding agent F-18-3′-F-PIB in a control patient shows the expected nonspecific white matter binding but no significant cortical accumulation. (Courtesy Dr. Kirk Frey.)
Figure 15-28. Alzheimer dementia. Marked cortical activity is seen dif-fusely on axial PET images of F-18-3′-F-PIB in addition to nonspecific white matter binding in a patient with clinical Alzheimer disease. (Courtesy Dr. Kirk Frey.)
difficulties. New agents, such as C-11/F-18 AZD4694, are being investigated that show lower nonspecific binding.
The potential role of these amyloid agents will need to be determined. At this point, they should be able to con-firm the diagnosis of Alzheimer disease. Additional trials looking at factors such as drug therapy impact and early diagnosis in the prodromal mild cognitive impairment stage of disease need to be performed.
CISTERNOGRAPHY
CSF dynamics using radiotracers has been employed for many years to diagnose a site of CSF leakage, determine shunt patency, and manage hydrocephalus. Although CT and MRI are now often used, radionuclide cisternography still plays an important role because of the unique physio-logical information it provides. To be effective, close coor-dination with structural imaging studies and detailed knowledge of the clinical problem are necessary.
An understanding of normal CSF dynamics is important for image interpretation. CSF is secreted by the ventricular choroid plexus and, to a lesser extent, from extraventricular sites. Normally, CSF drains from the lateral ventricles through the interventricular foramen of Monro into the third ventricle (Fig. 15-29). With the additional CSF produced by the cho-roid plexus of the third ventricle, it then passes through the cerebral aqueduct of Sylvius into the fourth ventricle and then leaves the ventricular system through the median fora-men of Magendie and the two lateral foramina of Luschka. The CSF then enters the subarachnoid space surrounding the brain and spinal cord. Along the base of the brain, the subarachnoid space expands into lakes called cisterns. The
Choroidplexusof thirdventricle
Superior sagittal sinusArachnoid
Pontine cistern
Superiorcistern
Confluenceof thesinuses
CerebellomedullariscisternChoroid plexus
of fourth ventricleForamenof Magendie
Choroidplexus
of lateralventricle
Figure 15-29. Flow dynamics of cerebrospinal fluid (CSF). Originating in lateral ventricle choroid plexus, CSF flows through the third and fourth ventricles into the basal cisterns, moves over the convexities, and finally is reabsorbed in the superior sagittal sinus.
Central nervous system 371
subarachnoid space extends over the surface of the brain. The CSF is absorbed through the pacchionian granulations of the pia arachnoid villi into the superior sagittal sinus.
Radiopharmaceuticals
Radiopharmaceuticals injected intrathecally into the lumbar subarachnoid space must meet strict standards for sterility and apyrogenicity. They should follow the flow of the CSF without affecting the dynamics, and they should rapidly clear through the arachnoid villi. In-111 DTPA is ideal because it is non–lipid soluble, not metabolized, and not absorbed across the ependyma before reaching the arachnoid villi. Imaging in cisternography studies may extend over a period of days; thus In-111 is the radiotracer of choice because of its long half-life (67 hours) and reasonable imaging characteristics. Studies looking for CSF leaks may be done with Tc-99m DTPA because its superior imaging characteristics may improve sen-sitivity and these studies do not require prolonged imaging.
Methods
Proper sterile lumbar puncture technique is critical and should be done by an experienced clinician to ensure sub-arachnoid injection. An initial image of the injection site ensures that the radiotracer was delivered to the correct location. Early evaluation confirms dose migration up the vertebral column and a lack of excessive renal activity. Serial imaging is needed, as described in the protocol in Box 15-8.
Pharmacokinetics
Radiotracer injected into the intrathecal space normally reaches the basal cisterns by 1 hour, the frontal poles and
Box 15-8. Cisternography: Summary Protocol
PATIENT PREPARATIONNone
RADIOPHARMACEUTICALIn-111 DTPA 250 μCi (9.3 MBq)
INSTRUMENTATIONGamma camera: Large field of viewCollimator: Medium energy
IMAGING PROCEDUREInject slowly into lumbar subarachnoid space using
a 22-gauge needle with the bevel positioned vertically.
Instruct patient to remain recumbent for at least 1 hour after injection.
All images should be obtained for 50k counts.
IMAGING TIMES1 hour: Thoracic-lumbar spine for evaluation of
injection adequacy.3 hour: Base of the skull to visualize basilar cisterns.24 and 48 hours: Evaluation of ventricular reflux and
arachnoid villi resorption.3, 24, and 48 hours: Obtain anterior, posterior, and
both lateral views of the head.
DTPA, Diethylenetriaminepentaacetic acid.

372 Nuclear Medicine: The Requisites
sylvian fissure area by 2 to 6 hours, the cerebral convexities by 12 hours, and the arachnoid villi in the sagittal sinus by 24 hours. Flow to the parasagittal region occurs through both central and superficial routes. The radiotracer does not normally enter the ventricular system because physio-logical flow is in the opposite direction.
Dosimetry
To some extent, the radiation absorbed dose depends on the clearance dynamics of a particular patient. The spinal cord receives the highest dose, followed by the kidney and bladder, because the radiopharmaceutical undergoes renal excretion (Table 15-3).
Clinical Applications
HydrocephalusHydrocephalus is abnormal enlargement of the CSF spaces resulting from abnormalities of CSF production, circula-tion, or absorption (Table 15-4). MRI and CT are most often used to select patients who might benefit from inter-vention, whereas radionuclide cisternography is generally reserved for situations that remain unclear. When assessing hydrocephalus, it must first be known whether the process is noncommunicating or communicating. Then the route of radiopharmaceutical administration and expected pattern during cisternography can be predicted and evaluated.
In noncommunicating causes of hydrocephalus, flow from the ventricular system into the basal cisterns and
table 15-3 Dosimetry of Technetium-99m DTPA and Indium-111 DTPA
AgentInjection technique
Exposure organ receives highest dose (mGy/MBq)
Effective dose (mSv/
MBq)
In-111 DTPA Lumbar Spinal cord 0.95
Bladder 0.20
0.14
Cisternal Spinal cord 0.57
Bladder 0.18
0.12
Tc-99m DTPA Lumbar Spinal cord 0.046 0.011
Cisternal Brain 0.055 0.0066
Data from International Commission on Radiological Protection. Publication 53. Ontario.
DTPA, Diethylenetriaminepentaacetic acid.
table 15-4 Classification of Hydrocephalus
Classification Site of obstruction
OBSTRUCTIVE
Noncommunicating Intraventricular between lateral ventricles and basal cistern
Communicating Extraventricular, affecting basal cisterns, cerebral convexities and arachnoid villi
NONOBSTRUCTIVE
Generalized atrophy None
Localized atrophy None
subarachnoid space is obstructed. This is commonly due to a mass or congenital abnormality at or above the fourth ventricle, and the diagnosis is usually made by MRI.
In communicating hydrocephalus, CSF is free to flow from the intraventricular region into the subarachnoid space. The obstruction to CSF flow is extraventricular, in the basal cisterns, cerebral convexities, or arachnoid villi. Common causes include previous subarachnoid hemor-rhage, chronic subdural hematoma, leptomeningitis, and meningeal carcinomatosis, all leading to poor CSF move-ment and reabsorption. On anatomical imaging, the ven-tricular system is dilated out of proportion to the prominence of cortical sulci and the basal cisterns. It may be difficult to differentiate this extraventricular obstruc-tion from nonobstructive hydrocephalus ex vacuo, a sec-ondary expansion of the ventricles to fill the void after neuronal tissue loss from atrophy or stroke.
In the past, radionuclide studies were commonly used to help assess communicating hydrocephalus patients with normal-pressure hydrocephalus to determine whether the patient would be likely to benefit from CSF shunting. Normal-pressure hydrocephalus manifests clinically with progressive dementia, ataxia, and incontinence. Surgical shunting of CSF can potentially cure this cause of demen-tia, but not all patients improve with surgery.
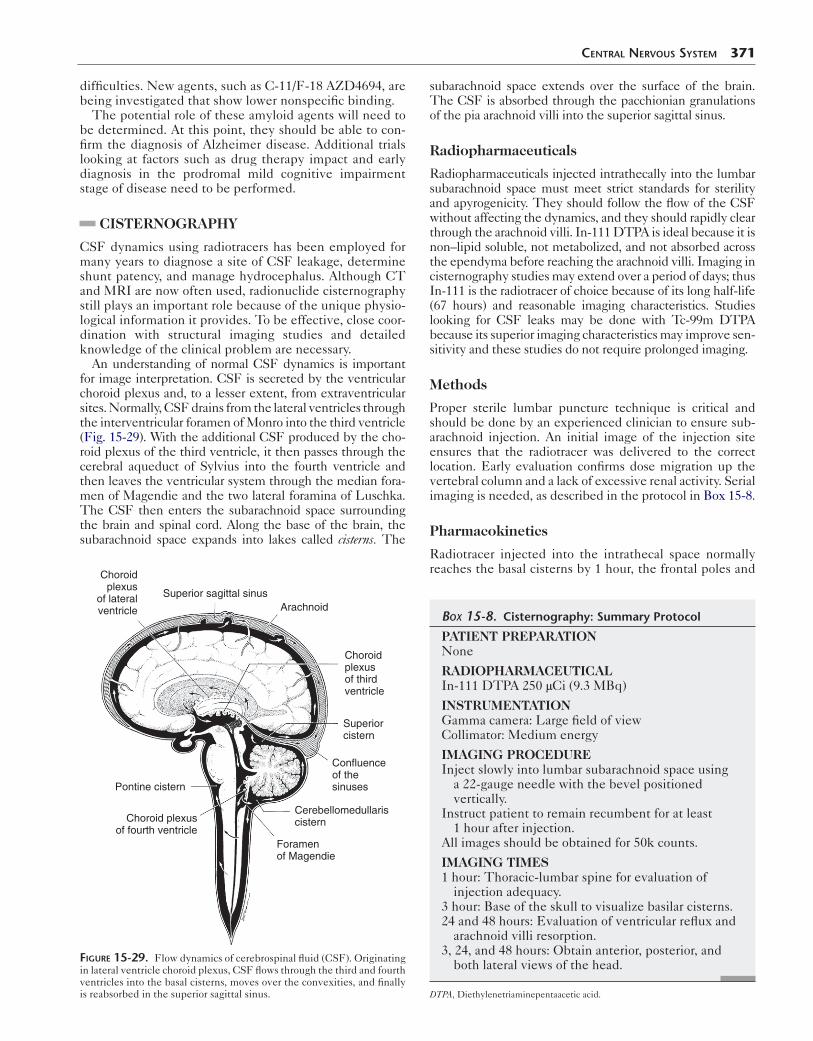
Cisternography Image InterpretationSeveral patterns of flow can be observed after introduction of radiopharmaceutical into the intrathecal space. Normal flow should not reflux into the ventricles and should move over the convexities by 24 hours (Fig. 15-30).
In patients with noncommunicating hydrocephalus, cis-ternography usually shows a normal pattern of flow up to the basal cisterns, over the convexities. No ventricular reflux is seen. However, if activity is injected into the ventricles through a ventriculostomy rather than via lumbar puncture, serial images show minimal activity in the basal cisterns.
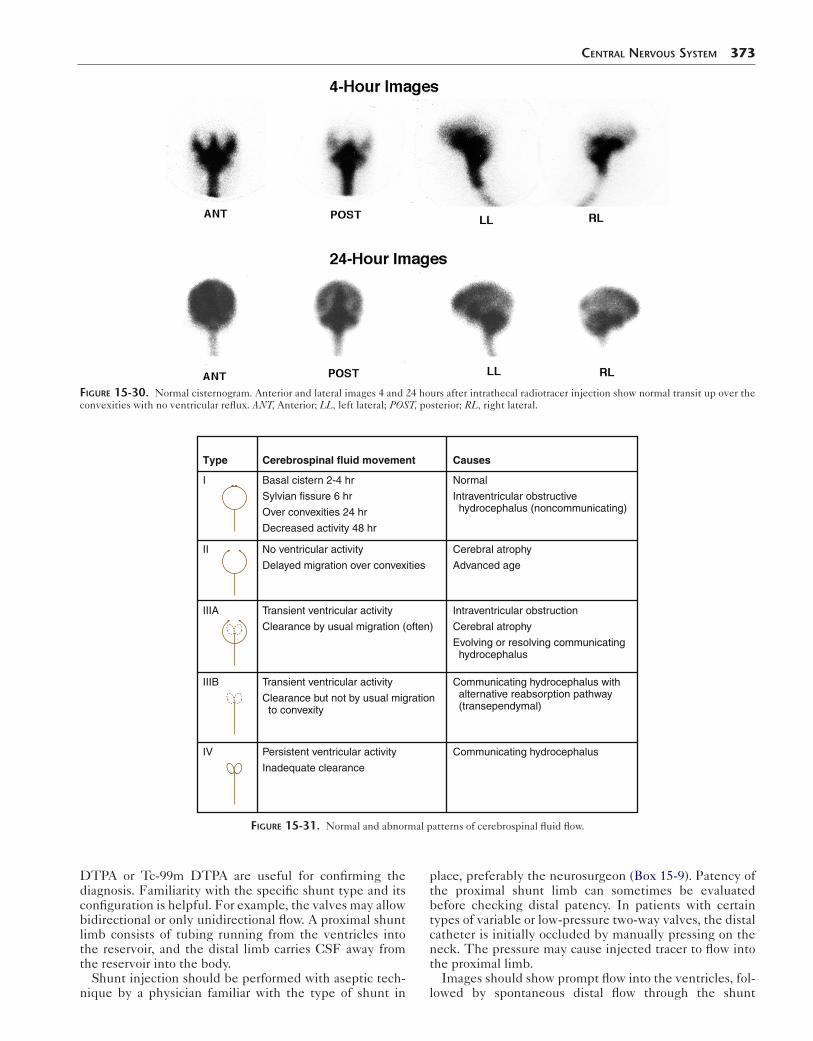
In communicating hydrocephalus, including patients with normal-pressure hydrocephalus, cisternography can show a spectrum of CSF flow patterns (Figs. 15-31 and 15-32). The common denominator is absent flow or a marked delay of activity flow up over the convexities of the brain. Ventricular reflux of activity may occur tran-siently or persist. Atrophy alone will cause delayed tracer movement through the enlarged subarachnoid space, sometimes with transient ventricular reflux. However, nor-mal clearance over the hemispheres is seen by 24 hours. It has been suggested that patients with communicating hydrocephalus with persistent ventricular activity and no activity over the convexities (the type IV cisternographic pattern) are most likely to benefit from shunting.
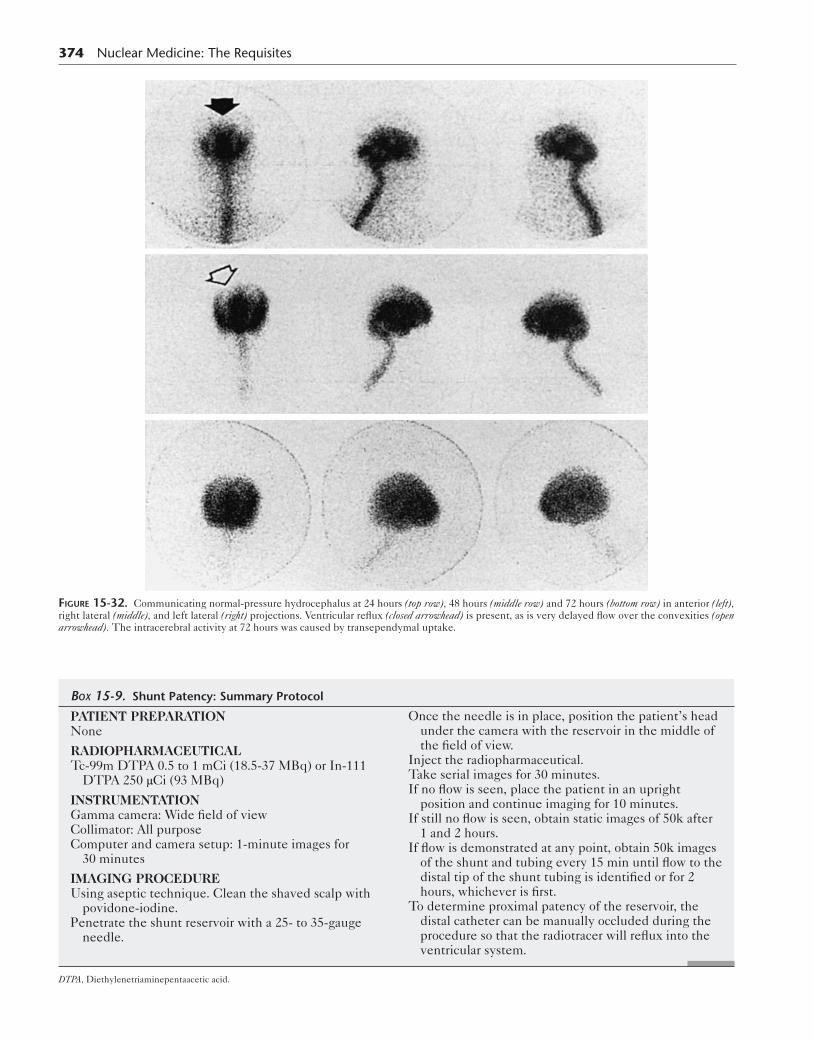
Surgical Shunt PatencyA variety of diversionary CSF shunts (ventriculoperitoneal, ventriculoatrial, ventriculopleural, lumboperitoneal) have been used to treat obstructive hydrocephalus. Complications may include catheter blockage, infection, thromboembolism, subdural or epidural hematomas, disconnection of catheters, CSF pseudocyst, bowel obstruction, and bowel perforation.
The diagnosis of shunt patency and adequacy of CSF flow often can be made by examination of the patient and inspection of the subcutaneous CSF reservoir. When this assessment is uncertain, radionuclide studies with In-111
Central nervous system 373
Type Cerebrospinal fluid movement Causes
I
II
IIIA
IIIB
IV
Basal cistern 2-4 hr
Sylvian fissure 6 hr
Over convexities 24 hr
Decreased activity 48 hr
No ventricular activity
Delayed migration over convexities
Cerebral atrophy
Advanced age
Transient ventricular activity
Clearance by usual migration (often)
Transient ventricular activity
Clearance but not by usual migration to convexity
Persistent ventricular activity
Inadequate clearance
Normal
Intraventricular obstructive hydrocephalus (noncommunicating)
Intraventricular obstruction
Cerebral atrophy
Evolving or resolving communicating hydrocephalus
Communicating hydrocephalus
Communicating hydrocephalus with alternative reabsorption pathway (transependymal)
Figure 15-31. Normal and abnormal patterns of cerebrospinal fluid flow.
Figure 15-30. Normal cisternogram. Anterior and lateral images 4 and 24 hours after intrathecal radiotracer injection show normal transit up over the convexities with no ventricular reflux. ANT, Anterior; LL, left lateral; POST, posterior; RL, right lateral.
DTPA or Tc-99m DTPA are useful for confirming the diagnosis. Familiarity with the specific shunt type and its configuration is helpful. For example, the valves may allow bidirectional or only unidirectional flow. A proximal shunt limb consists of tubing running from the ventricles into the reservoir, and the distal limb carries CSF away from the reservoir into the body.
Shunt injection should be performed with aseptic tech-nique by a physician familiar with the type of shunt in
place, preferably the neurosurgeon (Box 15-9). Patency of the proximal shunt limb can sometimes be evaluated before checking distal patency. In patients with certain types of variable or low-pressure two-way valves, the distal catheter is initially occluded by manually pressing on the neck. The pressure may cause injected tracer to flow into the proximal limb.
Images should show prompt flow into the ventricles, fol-lowed by spontaneous distal flow through the shunt
374 Nuclear Medicine: The Requisites
Figure 15-32. Communicating normal-pressure hydrocephalus at 24 hours (top row), 48 hours (middle row) and 72 hours (bottom row) in anterior (left), right lateral (middle), and left lateral (right) projections. Ventricular reflux (closed arrowhead) is present, as is very delayed flow over the convexities (open arrowhead). The intracerebral activity at 72 hours was caused by transependymal uptake.
Box 15-9. Shunt Patency: Summary Protocol
PATIENT PREPARATIONNone
RADIOPHARMACEUTICALTc-99m DTPA 0.5 to 1 mCi (18.5-37 MBq) or In-111
DTPA 250 μCi (93 MBq)
INSTRUMENTATIONGamma camera: Wide field of viewCollimator: All purposeComputer and camera setup: 1-minute images for
30 minutes
IMAGING PROCEDUREUsing aseptic technique. Clean the shaved scalp with
povidone-iodine.Penetrate the shunt reservoir with a 25- to 35-gauge
needle.
Once the needle is in place, position the patient’s head under the camera with the reservoir in the middle of the field of view.
Inject the radiopharmaceutical.Take serial images for 30 minutes.If no flow is seen, place the patient in an upright
position and continue imaging for 10 minutes.If still no flow is seen, obtain static images of 50k after
1 and 2 hours.If flow is demonstrated at any point, obtain 50k images
of the shunt and tubing every 15 min until flow to the distal tip of the shunt tubing is identified or for 2 hours, whichever is first.
To determine proximal patency of the reservoir, the distal catheter can be manually occluded during the procedure so that the radiotracer will reflux into the ventricular system.
DTPA, Diethylenetriaminepentaacetic acid.

Central nervous system 375
A ANT Head 10 min ANT lower ABD 30 min ANT lower ABD 60 min
ANT 10 min ANT 30 min
Injection site
ANT 60 minBFigure 15-33. Cerebrospinal shunt patency evaluation. A, Ventriculoperitoneal shunt at 10 minutes (left) shows activity in the reservoir port and distal limb of the shunt moving down the neck and chest. Intraventricular activity is also seen. By 30 minutes (middle), activity is in the abdomen with free flow in the peritoneum (right). B, Ventriculopleural shunt with normal radiotracer flow through the shunt into the pleural space that decreases over time. ANT, Anterior.
catheter (Fig. 15-33). The shunt tubing is usually seen. Catheters draining into the peritoneum show accumula-tion of radiotracer freely within the abdominal cavity. In cases of obstruction, activity does not move through the distal limb on delayed images or may pool close to the tip of the catheter in a loculated collection (Fig. 15-34).
Cerebrospinal Fluid LeakTrauma and surgery (transsphenoidal and nasal) are the most common causes for CSF rhinorrhea. Nontraumatic causes include hydrocephalus and congenital defects. CSF rhinorrhea may occur at any site, from the frontal sinuses to the temporal bone (Fig. 15-35). The cribriform plate is most susceptible to fracture, which can result in rhinor-rhea. Otorrhea is much less common. Accurate localization of CSF leaks can be clinically difficult.
Radionuclide studies are sensitive and accurate methods of CSF leak detection. To maximize the sensitivity of the test, nasal pledgets are placed in the anterior and posterior portion of each nasal region by an otolaryngologist and then removed and counted 4 hours later (Fig. 15-36). A ratio of nasal-to-plasma radioactivity greater than 2:1 or 3:1 is considered positive. The radiotracer is injected intrathe-cally via aseptic lumbar puncture (Box 15-10).
The site is most likely to be identified during a time when heavy leakage is occurring. Often, the patient position associated with greatest leakage is reproduced during imaging. Imaging in the appropriate projection is important for identifying the site of leak; lateral and anterior imaging
Figure 15-34. Obstructed cerebrospinal shunt. After injection of Tc-99m DTPA into the reservoir, refluxing into the ventricles, consistent with patency of the proximal limb of the shunt. However, no distal drainage occurs over 60 minutes from obstruction.
CSF leak to:
Frontal sinus
Ethmoid sinus
Sphenoid sinus
Figure 15-35. Common sites of cerebrospinal fluid (CSF) leakage.

376 Nuclear Medicine: The Requisites
are used for rhinorrhea and posterior imaging for otorrhea. In cases in which no reason is known for low CSF pressure or when leak around the lumbar region is suspected, addi-tional views should be made of the lumbar region.
Scintigraphic studies show CSF leaks as an increasing accumulation of activity at the leak site (Fig. 15-37). How-ever, counting the pledgets is more sensitive than imaging for detecting CSF leaks. Pledgets are also helpful in deter-mining the origin of the leak (anterior vs. posterior).
Sphenoidsinus
Olfactorycleft
Middlemeatus
Spheno-ethmoid
recess
Figure 15-36. Placement of pledgets for cerebrospinal fluid leak study. The labeled cotton pledgets are placed by an otolaryngologist at various levels within the anterior and posterior nares to detect leakage from the frontal, ethmoidal, and sphenoidal sinuses.
Figure 15-37. Positive radionuclide cerebrospinal fluid leak study. In-111 DTPA left lateral views show increasing radioactivity over time originating from the nares and leaking into the nose and mouth (arrow-heads).
Box 15-10. Cerebrospinal Fluid Leak Detection: Summary Protocol
PATIENT PREPARATIONNasal pledgets are placed and labeled as to location.
Pledgets should be weighed before placement.After intrathecal injection, place patient in Trendelen-
burg position to pool the radiotracer in the basal regions until imaging begins.
Once radiotracer reaches basal cisterns, position patient in a position that increases cerebrospinal fluid leakage.Rhinorrhea: Incline patient’s head forward and
against camera face with the camera positioned in the lateral position.
Otorrhea: Obtain posterior images instead of lateral views.
RADIOPHARMACEUTICALIn-111 DTPA 250 μCi (9 MBq)
INSTRUMENTATIONGamma camera: Large field of viewCollimator: Medium energy
IMAGING PROCEDURESetupIn-111 DTPA 500 μCi (18 MBq) of in 5 mL dextrose
10% in water intrathecally.Begin imaging when activity reaches the basal cisterns
(1-4 hours).
ACQUISITIONAcquire 5 minutes per frame for 1 hour in the selected
view, then acquire anterior, left lateral, right lateral, and posterior views.
Obtain 50k images every 10 minutes for 1 hour in the original view.
Remove pledgets and place in separate tubes. Draw a 5-mL blood sample.
Count pledgets and 0.5-mL aliquots of plasma.Repeat views may be indicated at 6 and 24 hours.Calculate the ratio of pledgets-to-plasma activity:
pledget counts/pledget capacity divided by serum counts/0.5 mL.
INTERPRETATIONPositive for cerebrospinal fluid leakage if the pledget-
to-plasma activity ratio is greater than 2-3:1.
DTPA, Diethylenetriaminepentaacetic acid.

SuggeSted Reading
Carmago EE. Brain SPECT in neurology and psychiatry. J Nucl Med. 2001;42(4):611.
Devous MD. Functional brain imaging in the dementias: role in early detection,differential diagnosis, and longitudinal studies. Eur J Nucl Med Imaging. 2002;29(12):1685-1687.
Herholz K, Herscovitch P, Heiss WD. NeuroPET. Berlin: Springer; 2004.Marshall VL, Reininger CB, Marquardt M, et al. Parkinson’s disease is over
diagnosed clinically at baseline in diagnostically uncertain cases: a 3-year European multicenter study with repeat [123I] FP-CIT. Mov Disord. 2009;24(4):500-508.
Central nervous system 377
Mountz JM, Liu HG, Deutsch G. Neuroimaging in cerebrovascular disorders: measurement of cerebral physiology after stroke and assessment of stroke recovery. Semin Nucl Med. 2003;33(1):56-76.
Osorio RS, Berti V, Mosconi L, et al. Evaluation of early dementia (mild cognitive impairment). PET Clin. 2005;5:15-31.
Van Heertum RL, Tikofsky RS, Masanori I. Functional Cerebral SPECT and PET Imaging. 4th ed. New York: Lippincott Williams & Wilkins; 2009.