15 April 2020 4QFY20E Results Preview Banks and NBFCs
19
15 April 2020 4QFY20E Results Preview Banks and NBFCs Look beyond the quarter 4Q was marked by events (YES+COVID-19) that are likely to have serious and lasting implications for the sector. In light of these developments, several banks released pro-forma unaudited financial information, giving investors a flavor of what to expect in 4Q. YES Impact The events at YES have adversely impacted depositor sentiments, to which deposit outflows from the bank (~Rs 729bn in 6 months) bear testament. Various financial institutions stepped in to rescue YES, to prevent widespread systemic impact. Nevertheless, several relatively financially sound private sector banks (IIB and RBK) have seen significant wholesale deposit outflows as a result of this. Several large banks (KMB), on the contrary saw significant net inflows. We believe this can result in a sustained polarisation of deposit flows towards PSBs and larger private banks as depositors become more risk-averse. The fund infusion by various financial institutions also virtually rules out the merger of YES and SBIN (positive for SBIN). COVID-19: The outbreak and resultant disruption to economic activity will have a material impact on growth and asset quality, and it invited a swathe of measures from the RBI (more on all of this here). Near term implications on the sector include Sharp slowdown in growth. Reported asset quality movement and LLPs to be impacted by the moratorium and abeyance on recognition of and provision against NPLs. Liquidity infusion will address near term liquidity concerns for the banking sector but will impact margins. NBFCs are likely to be similarly impacted (growth, asset quality and provisions), except that their problems may be compounded if they do not receive moratoriums from banks that have lent to them. They will also be required to repay capital market borrowings. Pedigreed NBFCs will benefit from the RBI’s TLTROs. Banks With already slowing systemic credit growth and COVID-19 related disruptions, we expect banks across our coverage to report significantly slower loan growth in 4Q. Nevertheless, we expect the retail portfolios of banks to have performed better, as this segment saw healthy growth trends until Feb-20 (17.0% YoY growth). We expect SBIN, ICICIBC, AXSB and KMB (already disclosed) to report higher deposit growth in 4Q and smaller banks such as DCBB, CUBK, KVB and FB to see muted deposit growth. IIB and RBK (as disclosed) have seen net deposit outflows in 4Q. Company CMP (Rs) RECO TP (Rs) AUBANK 501 REDUCE 509 AXSB 417 BUY 541 CUBK 129 BUY 176 DCBB 87 ADD 114 FB 41 BUY 71 ICICIBC 327 BUY 435 IIB 424 ADD 571 KMB 1,173 ADD 1,263 KVB 27 REDUCE 33 RBK 121 REDUCE 141 SBIN 182 BUY 316 NBFCs Company CMP (Rs) RECO TP (Rs) CIFC 153 BUY 251 MMFS 156 BUY 240 SHTF 664 ADD 891 INDOSTAR 263 REDUCE 253 LICHF 249 REDUCE 288 REPCO 110 ADD 215 Darpin Shah [email protected] +91-22-6171-7328 Aakash Dattani [email protected] +91-22-6171-7337 HDFC securities Institutional Research is also available on Bloomberg ERH HDF <GO> & Thomson Reuters
Transcript of 15 April 2020 4QFY20E Results Preview Banks and NBFCs
15 April 2020 4QFY20E Results Preview
Banks and NBFCs
Look beyond the quarter 4Q was marked by events (YES+COVID-19) that are likely to have serious and lasting implications for the sector. In light of these developments, several banks released pro-forma unaudited financial information, giving investors a flavor of what to expect in 4Q.
YES Impact
The events at YES have adversely impacted depositor sentiments, to which deposit outflows from the bank (~Rs 729bn in 6 months) bear testament.
Various financial institutions stepped in to rescue YES, to prevent widespread systemic impact.
Nevertheless, several relatively financially sound private sector banks (IIB and RBK) have seen significant wholesale deposit outflows as a result of this. Several large banks (KMB), on the contrary saw significant net inflows. We believe this can result in a sustained polarisation of deposit flows towards PSBs and larger private banks as depositors become more risk-averse.
The fund infusion by various financial institutions also virtually rules out the merger of YES and SBIN (positive for SBIN).
COVID-19: The outbreak and resultant disruption to economic activity will have a material impact on growth and asset quality, and it invited a swathe of measures from the RBI (more on all of this here).
Near term implications on the sector include
Sharp slowdown in growth.
Reported asset quality movement and LLPs to be impacted by the moratorium and abeyance on recognition of and provision against NPLs.
Liquidity infusion will address near term liquidity concerns for the banking sector but will impact margins.
NBFCs are likely to be similarly impacted (growth, asset quality and provisions), except that their problems may be compounded if they do not receive moratoriums from banks that have lent to them. They will also be required to repay capital market borrowings. Pedigreed NBFCs will benefit from the RBI’s TLTROs.
Banks
With already slowing systemic credit growth and COVID-19 related disruptions, we expect banks across our coverage to report significantly slower loan growth in 4Q. Nevertheless, we expect the retail portfolios of banks to have performed better, as this segment saw healthy growth trends until Feb-20 (17.0% YoY growth).
We expect SBIN, ICICIBC, AXSB and KMB (already disclosed) to report higher deposit growth in 4Q and smaller banks such as DCBB, CUBK, KVB and FB to see muted deposit growth. IIB and RBK (as disclosed) have seen net deposit outflows in 4Q.
Company CMP (Rs) RECO TP (Rs)
AUBANK 501 REDUCE 509
AXSB 417 BUY 541
CUBK 129 BUY 176
DCBB 87 ADD 114
FB 41 BUY 71
ICICIBC 327 BUY 435
IIB 424 ADD 571
KMB 1,173 ADD 1,263
KVB 27 REDUCE 33
RBK 121 REDUCE 141
SBIN 182 BUY 316
NBFCs
Company CMP (Rs)
RECO TP
(Rs) CIFC 153 BUY 251
MMFS 156 BUY 240
SHTF 664 ADD 891
INDOSTAR 263 REDUCE 253
LICHF 249 REDUCE 288
REPCO 110 ADD 215
Darpin Shah [email protected] +91-22-6171-7328 Aakash Dattani [email protected] +91-22-6171-7337
HDFC securities Institutional Research is also available on Bloomberg ERH HDF <GO> & Thomson Reuters

4QFY20 Results Preview
Consequently, we expect most of our coverage to register a dip in CD ratios.
Banks are likely to see muted treasury gains as benchmark yields fell by just ~40bps. SBIN will see a one time gain of Rs 26bn from its stake sale in SBI Cards.
Restricted income growth is likely to result in op-de-lev at some banks.
The moratorium option and abeyance on recognition will optically limit slippages and cushion earnings. However, we would expect prudent banks to (1) make higher specific LLPs on existing NPLs to shore up coverage and/or (2) make higher standard asset/ other provisions.
We do not anticipate any chunky corporate slippages or recoveries in 4Q.
We expect that our coverage will report 14/14/126% NII/PPOP/PAT growth YoY.
NBFCs and HFCs
Like banks, we expect NBFCs to see slower growth, due to COVID-related disruptions.
Our interactions with some of our coverage companies suggest that they have sufficient liquidity to meet fixed obligations for the next 4-6 months assuming ‘nil’ collections.
The sector awaits clarity on the offer of moratoriums by banks to NBFCs. Pedigreed NBFCs will benefit from the RBI’s TLROs. Here too, the moratoriums to borrowers and abeyance on recognition will impact reported asset quality and provisions.
We expect CIFC and MMFS to benefit from MCLR cuts and LICHF, REPCO and INDOSTAR to continue to witness some margin pressure.
We have conservatively factored in higher provisions across our coverage.
We expect LICHF and REPCO to register tepid AUM growth due to disruptions towards the end of the qtr and considerable competition from banks (bank credit for home loans grew at ~17% YoY until Feb-20).
Asset quality, especially in the developer book is a concern for LICHF.
We anticipate that our coverage will report 8/11/-4% NII/PPOP/PAT growth YoY
Contextual Monitorables
Business outlook (growth and asset quality).
Details of moratoriums availed by the customers- in terms of % of loans and borrowers to whom moratorium has been granted. For NBFCs, additionally, details of moratorium received on bank borrowings.
Commentary on the extent of participation in TLTROs by banks, details of debt issuance under TLTROs by NBFCs.
Deposit flux for banks and availability of debt funding for NBFCs.
Approach towards provisioning for anticipated stress- (1) higher LLPs, (2) higher standard asset provisions, (3) upward revision of PDs, LGDs and changes in other ECL model assumptions for NBFCs.
Commentary on operating challenges faced during the lockdown. Specific disclosures (notes to a/cs) regarding the impact of COVID-19 on the financial results.
Potential emphasis of matters/ other matters and key audit matters paragraphs regarding the impact of COVID-19 on audit procedures and any specific risks/ considerations highlighted by the auditor.
Page | 2
4QFY20 Results Preview
View Banks The evolving COVID-19 situation and the developments at YES present numerous
challenges for the sector. We anticipate that these will result in increased polarisation. In the absence of precedents of the impacts of such events, we expect larger banks with strong liability franchises, sufficient capital and a demonstrable asset quality track record to perform better.
We prefer ICICBC, AXSB and KMB amongst the large caps within our coverage.
We also like CUBK, given its underwriting history, operating efficiency, strong customer connect and fairly granular liability base.
We upgrade FB to BUY given healthy liability franchise and attractive valuations.
Despite the sharp recent correction, we maintain our Reduce rating on RBK, in light of challenges on both sides of the balance sheet.
NBFCs & HFCs Amongst our NBFC & HFC coverage
From our coverage cos, we believe that CIFC is better placed vs. peers, given its (1) good corporate governance practices and management pedigree, (2) diversified portfolio (across products and geographies), (3) ease in access to funding and higher proportion of bank borrowings, (4) more than sufficient capital post the recent fund raise, and (5) historical asset quality trends and overall performance.
We maintain our REDUCE rating on LICHF given higher competition, slower growth, pressure on spreads and concerns on asset quality.
Page | 3

4QFY20 Results Preview
4QFY20E: Financial Summary
Rs bn NII PPOP APAT
4Q FY20E
YoY (%)
QoQ (%)
4Q FY20E
YoY (%)
QoQ (%)
4Q FY20E
YoY (%)
QoQ (%)
PSBs
SBIN 256.1 11.6 (7.8) 192.8 13.9 5.8 60.2 617.9 7.8
PVT Banks
ICICIBC 88.7 16.4 3.8 74.0 18.7 (2.0) 38.4 295.5 (7.5)
KMB 33.5 10.0 (2.3) 22.7 (0.5) (4.9) 13.9 (1.3) (12.9)
AXSB 65.9 15.5 2.1 55.8 11.4 (2.8) 13.1 (12.6) (25.2)
IIB 29.3 31.3 (4.7) 25.2 21.8 (8.3) 3.7 3.6 (71.3)
RBK 9.5 28.5 2.9 7.3 29.6 (0.9) 0.7 (71.3) 1.3
FB 12.1 10.3 4.7 12.1 10.3 4.7 3.9 3.4 (10.5)
CUBK 4.4 5.4 3.7 3.2 (4.8) 4.3 1.7 (2.0) (10.8)
DCBB 3.3 9.5 1.9 1.9 2.9 0.4 0.9 (9.2) (9.5)
KVB 6.0 (3.4) 3.6 3.8 (17.5) (0.3) 0.3 (41.7) 132.1
Aggregate 252.7 16.0 1.5 206.0 13.0 (2.8) 76.7 47.5 (20.2)
SFBs
AUBANK 5.3 37.2 4.7 3.3 51.9 4.7 2.0 68.7 4.9
NBFCs
SHTF 19.3 0.1 (4.0) 15.3 0.3 (6.4) 7.8 5.0 (10.9)
CIFC 9.6 23.1 4.2 6.8 31.8 3.5 3.8 30.5 (2.0)
MMFS 14.0 10.1 4.7 9.3 19.3 4.8 4.8 (18.2) 31.7
INDOSTAR 1.8 1.2 (3.0) 1.1 (5.6) (4.9) 0.0 (98.2) 460.9
Aggregate 44.7 7.5 0.3 32.4 10.7 (1.4) 16.5 (3.1) 0.8
HFCs
LICHF 13.6 11.2 8.4 12.0 10.0 5.7 6.4 (7.3) 8.0
REPCO 1.2 6.3 0.5 1.0 15.4 (1.9) 0.7 26.9 (5.5)
Aggregate 14.8 10.8 7.7 13.0 10.4 5.0 7.1 (4.9) 6.6 Source: HDFC sec Inst Research
Peer Set Comparison
MCap (Rs bn)
CMP (Rs)
Rating TP
(Rs)
ABV (Rs) P/E (x) P/ABV (x) ROAE (%) ROAA (%)
FY20E FY21E FY22E FY20E FY21E FY22E FY20E FY21E FY22E FY20E FY21E FY22E FY20E FY21E FY22E
BANKS
AUBANK 151 501 REDUCE 509 121 131 163 23.7 23.9 20.1 4.02 3.72 2.99 16.7 13.4 14.0 1.70 1.41 1.42
AXSB# 1,175 417 BUY 541 263 282 338 20.9 11.4 8.8 1.50 1.40 1.17 6.9 10.7 12.4 0.64 1.07 1.25
CUBK 95 129 BUY 176 66 72 83 12.5 12.6 11.7 1.95 1.79 1.55 14.6 12.7 12.1 1.61 1.47 1.43
DCBB 27 87 ADD 114 94 101 116 7.5 7.2 6.6 0.92 0.86 0.75 11.0 10.4 10.2 0.96 0.92 0.90
FB 82 41 BUY 71 65 67 77 5.1 5.0 4.8 0.64 0.62 0.54 11.5 10.8 10.2 0.95 0.89 0.84
ICICIBC# 2,110 327 BUY 435 155 168 190 15.9 9.5 8.0 1.39 1.28 1.13 7.1 11.6 12.5 0.86 1.32 1.44
IIB 301 424 ADD 571 457 515 572 6.3 10.3 7.3 0.93 0.82 0.74 15.1 7.7 9.8 1.59 0.93 1.22
KMB# 2,240 1,173 ADD 1,263 237 255 295 27.2 26.7 24.8 3.66 3.39 2.94 13.4 12.2 11.7 1.84 1.70 1.69
KVB 21 27 REDUCE 33 56 53 62 9.0 5.4 4.6 0.48 0.50 0.43 3.7 6.0 6.9 0.33 0.53 0.59
RBK 61 121 REDUCE 141 189 198 218 11.4 10.8 7.5 0.64 0.61 0.55 5.9 5.2 7.1 0.60 0.57 0.76
SBIN# 1,627 182 BUY 316 179 183 227 4.0 3.3 2.6 0.40 0.40 0.32 7.0 8.2 9.6 0.43 0.50 0.60
NBFCS
CIFC 126 153 BUY 251 91 98 115 9.0 9.2 7.9 1.69 1.56 1.34 18.8 14.8 15.0 2.26 2.01 2.16
MMFS 96 156 BUY 240 133 132 166 7.5 7.9 5.8 1.03 1.04 0.83 10.0 8.8 11.2 1.59 1.42 1.81
SHTF 151 664 ADD 891 527 603 814 5.0 5.8 5.1 1.26 1.10 0.82 17.7 13.3 13.4 2.70 2.08 2.14
INDOSTAR 35 263 REDUCE 253 276 277 291 23.4 18.9 16.5 0.95 0.95 0.90 3.9 4.9 4.8 1.14 1.44 1.70
LICHF 25 249 REDUCE 288 284 281 346 4.9 5.7 5.0 0.88 0.89 0.72 14.8 11.5 11.8 1.21 0.96 0.99
REPCO 7 110 ADD 215 246 258 303 2.3 2.7 2.8 0.45 0.43 0.36 17.7 13.1 11.5 2.55 2.05 1.96
Source: HDFC sec Inst Research, #Adjusted for subsidiaries
Page | 4

4QFY20 Results Preview
Change in Estimates
Banks AUBANK
Earlier Revised Chg
FY21E FY22E FY21E FY22E FY21E FY22E
Loan growth (%) 32.0 31.0 16.9 21.2 -1507 bps -980 bps
NIM (%) 5.5 5.5 5.3 5.2 -25 bps -34 bps
NII Rs bn 25.6 33.3 21.6 25.3 -15.7% -24.0%
PPOP Rs bn 16.4 21.4 12.6 15.1 -23.3% -29.5%
PAT Rs bn 9.5 12.2 6.2 7.3 -34.8% -39.7%
EPS Rs 31.3 40.2 20.4 24.3 -34.8% -39.7%
ABV Rs 149.8 186.0 130.7 162.9 -12.7% -12.4%
GNPA (%) 1.8 1.8 3.1 2.1 126 bps 23 bps
NNPA (%) 1.0 0.9 2.0 0.8 103 bps -11 bps
Slippages (%) 2.0 1.8 3.0 2.0 100 bps 20 bps
LLP (%) 1.0 1.0 1.3 1.3 33 bps 31 bps
RoA (%) 2.1 2.1 1.4 1.4 -65 bps -66 bps
RoE (%) 19.7 20.9 13.4 14.0 -625 bps -688 bps
TP (Rs) 916 509 -44%
Multiple (x) 4.8 3.0 Source: HDFC sec Inst Research
AXSB
Earlier Revised Chg
FY21E FY22E FY21E FY22E FY21E FY22E
Loan growth (%) 16.5 17.1 10.8 14.2 -575 bps -292 bps
NIM (%) 3.4 3.4 3.4 3.4 -8 bps -3 bps
NII Rs bn 290.6 333.5 270.5 306.6 -6.9% -8.1%
PPOP Rs bn 268.9 305.0 254.0 284.1 -5.6% -6.8%
PAT Rs bn 118.9 154.8 97.8 125.8 -17.7% -18.7%
EPS Rs 42.2 54.9 34.7 44.7 -17.7% -18.7%
ABV Rs 309.1 354.5 281.9 338.2 -8.8% -4.6%
GNPA (%) 3.9 3.2 5.4 4.1 157 bps 87 bps
NNPA (%) 1.5 1.4 2.6 1.7 109 bps 29 bps
Slippages (%) 2.7 2.3 3.6 2.8 90 bps 50 bps
LLP (%) 1.7 1.3 2.0 1.7 33 bps 40 bps
RoA (%) 1.3 1.4 1.1 1.2 -18 bps -18 bps
RoE (%) 12.9 14.9 10.7 12.4 -222 bps -250 bps
TP (Rs) 908 541 -40%
Multiple (x) 2.5 1.5 Source: HDFC sec Inst Research
Page | 5
4QFY20 Results Preview
CUBK
Earlier Revised Chg
FY21E FY22E FY21E FY22E FY21E FY22E
Loan growth (%) 14.5 17.3 8.3 12.5 -625 bps -475 bps
NIM (%) 4.0 3.9 3.8 3.9 -13 bps -8 bps
NII Rs bn 19.6 22.6 18.0 20.1 -7.9% -11.3%
PPOP Rs bn 15.7 17.9 14.9 16.3 -5.4% -9.1%
PAT Rs bn 8.8 10.3 7.5 8.1 -14.9% -21.1%
EPS Rs 12.0 14.0 10.2 11.0 -14.9% -21.1%
ABV Rs 77.7 90.4 72.3 83.2 -6.9% -7.9%
GNPA (%) 3.2 3.0 4.4 4.2 113 bps 115 bps
NNPA (%) 1.8 1.6 2.6 2.2 79 bps 60 bps
Slippages (%) 2.1 1.9 3.0 2.4 90 bps 50 bps
LLP (%) 1.1 1.0 1.4 1.4 30 bps 39 bps
RoA (%) 1.6 1.6 1.5 1.4 -18 bps -21 bps
RoE (%) 14.7 14.8 12.7 12.1 -204 bps -270 bps
TP (Rs) 268 176 -34%
Multiple (x) 3.0 2.1 Source: HDFC sec Inst Research
DCBB
Earlier Revised Chg
FY21E FY22E FY21E FY22E FY21E FY22E
Loan growth (%) 16.2 18.5 8.3 14.6 -790 bps -392 bps
NIM (%) 3.7 3.7 3.5 3.5 -19 bps -19 bps
NII Rs bn 15.0 17.5 13.6 15.0 -9.6% -14.3%
PPOP Rs bn 8.9 10.6 7.8 8.5 -12.8% -19.8%
PAT Rs bn 4.9 6.0 3.7 4.0 -23.8% -33.0%
EPS Rs 15.9 19.5 12.1 13.0 -23.8% -33.0%
ABV Rs 110.9 129.0 100.8 116.0 -9.1% -10.1%
GNPA (%) 1.9 1.7 2.9 2.5 102 bps 77 bps
NNPA (%) 0.7 0.5 1.4 0.9 72 bps 37 bps
Slippages (%) 2.3 2.0 3.3 2.6 95 bps 60 bps
LLP (%) 0.7 0.7 1.0 1.0 25 bps 31 bps
RoA (%) 1.2 1.2 0.9 0.9 -23 bps -32 bps
RoE (%) 13.4 14.5 10.4 10.2 -296 bps -424 bps
TP (Rs) 223 114 -49%
Multiple (x) 1.8 1.0
Source: HDFC sec Inst Research
Page | 6
4QFY20 Results Preview
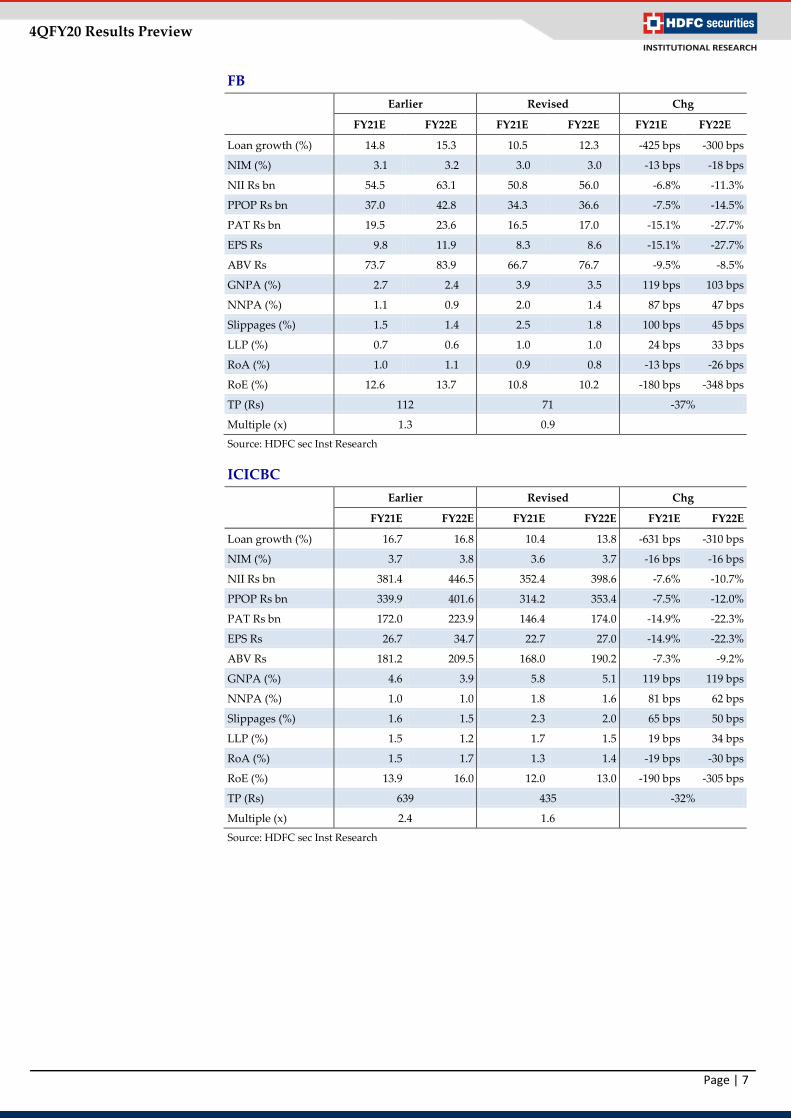
FB
Earlier Revised Chg
FY21E FY22E FY21E FY22E FY21E FY22E
Loan growth (%) 14.8 15.3 10.5 12.3 -425 bps -300 bps
NIM (%) 3.1 3.2 3.0 3.0 -13 bps -18 bps
NII Rs bn 54.5 63.1 50.8 56.0 -6.8% -11.3%
PPOP Rs bn 37.0 42.8 34.3 36.6 -7.5% -14.5%
PAT Rs bn 19.5 23.6 16.5 17.0 -15.1% -27.7%
EPS Rs 9.8 11.9 8.3 8.6 -15.1% -27.7%
ABV Rs 73.7 83.9 66.7 76.7 -9.5% -8.5%
GNPA (%) 2.7 2.4 3.9 3.5 119 bps 103 bps
NNPA (%) 1.1 0.9 2.0 1.4 87 bps 47 bps
Slippages (%) 1.5 1.4 2.5 1.8 100 bps 45 bps
LLP (%) 0.7 0.6 1.0 1.0 24 bps 33 bps
RoA (%) 1.0 1.1 0.9 0.8 -13 bps -26 bps
RoE (%) 12.6 13.7 10.8 10.2 -180 bps -348 bps
TP (Rs) 112 71 -37%
Multiple (x) 1.3 0.9 Source: HDFC sec Inst Research
ICICBC
Earlier Revised Chg
FY21E FY22E FY21E FY22E FY21E FY22E
Loan growth (%) 16.7 16.8 10.4 13.8 -631 bps -310 bps
NIM (%) 3.7 3.8 3.6 3.7 -16 bps -16 bps
NII Rs bn 381.4 446.5 352.4 398.6 -7.6% -10.7%
PPOP Rs bn 339.9 401.6 314.2 353.4 -7.5% -12.0%
PAT Rs bn 172.0 223.9 146.4 174.0 -14.9% -22.3%
EPS Rs 26.7 34.7 22.7 27.0 -14.9% -22.3%
ABV Rs 181.2 209.5 168.0 190.2 -7.3% -9.2%
GNPA (%) 4.6 3.9 5.8 5.1 119 bps 119 bps
NNPA (%) 1.0 1.0 1.8 1.6 81 bps 62 bps
Slippages (%) 1.6 1.5 2.3 2.0 65 bps 50 bps
LLP (%) 1.5 1.2 1.7 1.5 19 bps 34 bps
RoA (%) 1.5 1.7 1.3 1.4 -19 bps -30 bps
RoE (%) 13.9 16.0 12.0 13.0 -190 bps -305 bps
TP (Rs) 639 435 -32%
Multiple (x) 2.4 1.6 Source: HDFC sec Inst Research
Page | 7
4QFY20 Results Preview
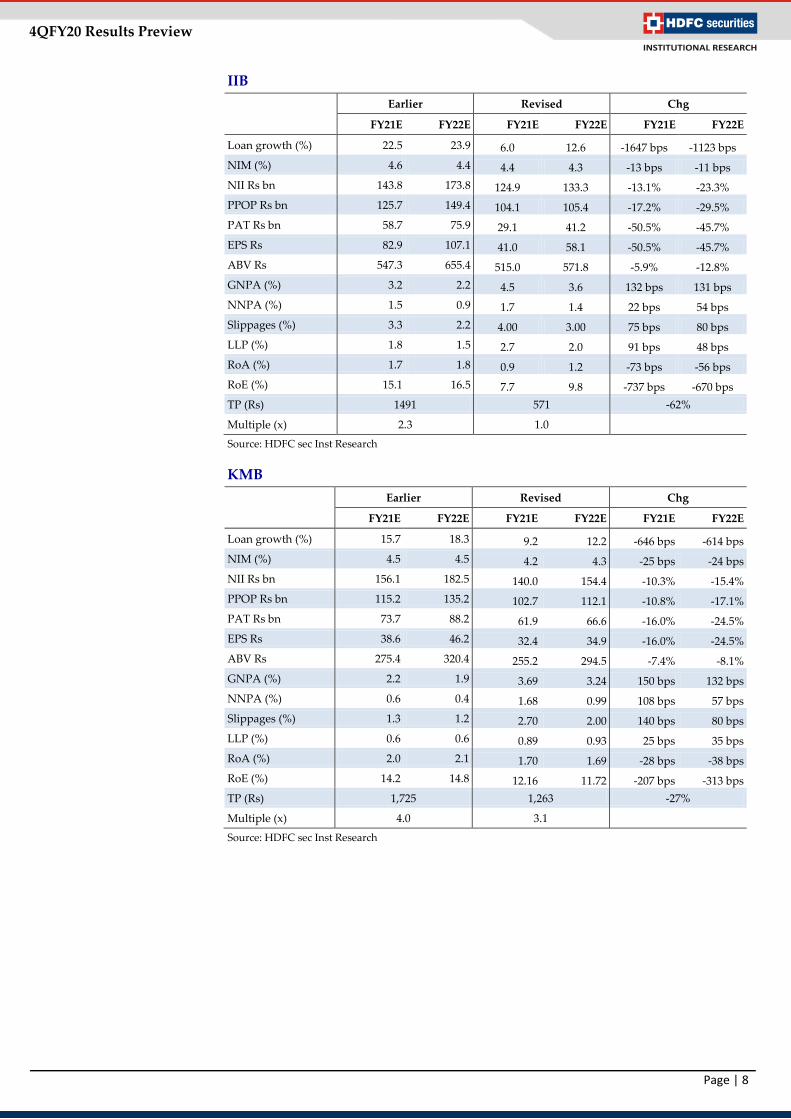
IIB
Earlier Revised Chg
FY21E FY22E FY21E FY22E FY21E FY22E
Loan growth (%) 22.5 23.9 6.0 12.6 -1647 bps -1123 bps NIM (%) 4.6 4.4 4.4 4.3 -13 bps -11 bps NII Rs bn 143.8 173.8 124.9 133.3 -13.1% -23.3% PPOP Rs bn 125.7 149.4 104.1 105.4 -17.2% -29.5% PAT Rs bn 58.7 75.9 29.1 41.2 -50.5% -45.7% EPS Rs 82.9 107.1 41.0 58.1 -50.5% -45.7% ABV Rs 547.3 655.4 515.0 571.8 -5.9% -12.8% GNPA (%) 3.2 2.2 4.5 3.6 132 bps 131 bps NNPA (%) 1.5 0.9 1.7 1.4 22 bps 54 bps Slippages (%) 3.3 2.2 4.00 3.00 75 bps 80 bps LLP (%) 1.8 1.5 2.7 2.0 91 bps 48 bps RoA (%) 1.7 1.8 0.9 1.2 -73 bps -56 bps RoE (%) 15.1 16.5 7.7 9.8 -737 bps -670 bps TP (Rs) 1491 571 -62%
Multiple (x) 2.3 1.0 Source: HDFC sec Inst Research
KMB
Earlier Revised Chg
FY21E FY22E FY21E FY22E FY21E FY22E
Loan growth (%) 15.7 18.3 9.2 12.2 -646 bps -614 bps NIM (%) 4.5 4.5 4.2 4.3 -25 bps -24 bps NII Rs bn 156.1 182.5 140.0 154.4 -10.3% -15.4% PPOP Rs bn 115.2 135.2 102.7 112.1 -10.8% -17.1% PAT Rs bn 73.7 88.2 61.9 66.6 -16.0% -24.5% EPS Rs 38.6 46.2 32.4 34.9 -16.0% -24.5% ABV Rs 275.4 320.4 255.2 294.5 -7.4% -8.1% GNPA (%) 2.2 1.9 3.69 3.24 150 bps 132 bps NNPA (%) 0.6 0.4 1.68 0.99 108 bps 57 bps Slippages (%) 1.3 1.2 2.70 2.00 140 bps 80 bps LLP (%) 0.6 0.6 0.89 0.93 25 bps 35 bps RoA (%) 2.0 2.1 1.70 1.69 -28 bps -38 bps RoE (%) 14.2 14.8 12.16 11.72 -207 bps -313 bps TP (Rs) 1,725 1,263 -27%
Multiple (x) 4.0 3.1
Source: HDFC sec Inst Research
Page | 8

4QFY20 Results Preview
KVB
Earlier Revised Chg
FY21E FY22E FY21E FY22E FY21E FY22E
Loan growth (%) 10.6 12.7 4.3 7.1 -635 bps -555 bps
NIM (%) 3.7 3.7 3.4 3.4 -21 bps -31 bps
NII Rs bn 25.5 28.6 23.3 24.4 -8.8% -14.4%
PPOP Rs bn 18.5 20.7 16.6 16.7 -10.0% -19.2%
PAT Rs bn 5.3 7.7 4.0 4.6 -25.1% -39.6%
EPS Rs 6.6 9.6 5.0 5.8 -25.1% -39.6%
ABV Rs 60.9 66.5 53.5 61.6 -12.2% -7.4%
GNPA (%) 7.5 6.2 9.3 7.5 173 bps 132 bps
NNPA (%) 3.3 2.7 4.6 3.4 131 bps 77 bps
Slippages (%) 2.3 2.1 3.2 2.4 85 bps 30 bps
LLP (%) 2.1 1.7 2.3 1.9 20 bps 22 bps
RoA (%) 0.7 0.9 0.5 0.6 -17 bps -35 bps
RoE (%) 8.0 11.2 6.0 6.9 -198 bps -432 bps
TP (Rs) 55 33 -40%
Multiple (x) 0.8 0.5 Source: HDFC sec Inst Research
RBK
Earlier Revised Chg
FY21E FY22E FY21E FY22E FY21E FY22E
Loan growth (%) 26.3 26.1 6.7 11.2 -1960 bps -1488 bps
NIM (%) 4.3 4.3 4.0 4.0 -29 bps -27 bps
NII Rs bn 41.7 51.9 35.0 38.0 -16.2% -26.9%
PPOP Rs bn 31.5 38.4 26.4 27.4 -16.1% -28.7%
PAT Rs bn 12.3 16.9 5.7 8.2 -53.8% -51.4%
EPS Rs 24.2 33.3 11.2 16.2 -53.8% -51.4%
ABV Rs 212.1 238.6 198.4 218.0 -6.5% -8.6%
GNPA (%) 3.0 2.6 4.5 3.3 150 bps 70 bps
NNPA (%) 1.3 1.1 1.7 1.1 40 bps 0 bps
Slippages (%) 2.9 2.5 4.1 3.0 125 bps 50 bps
LLP (%) 1.8 1.5 2.9 2.3 108 bps 79 bps
RoA (%) 1.1 1.3 0.6 0.8 -57 bps -51 bps
RoE (%) 10.9 13.5 5.2 7.1 -570 bps -637 bps
TP (Rs) 348 141 -59%
Multiple (x) 1.5 0.6
Source: HDFC sec Inst Research
Page | 9
4QFY20 Results Preview
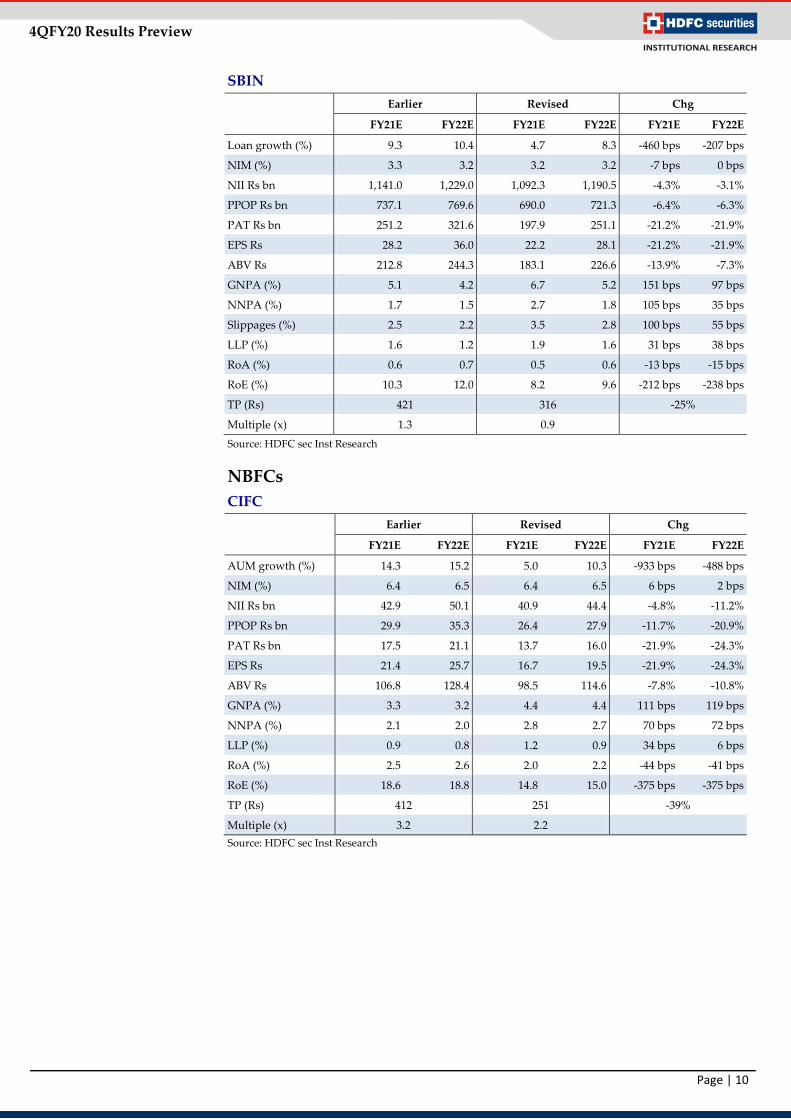
SBIN
Earlier Revised Chg
FY21E FY22E FY21E FY22E FY21E FY22E
Loan growth (%) 9.3 10.4 4.7 8.3 -460 bps -207 bps
NIM (%) 3.3 3.2 3.2 3.2 -7 bps 0 bps
NII Rs bn 1,141.0 1,229.0 1,092.3 1,190.5 -4.3% -3.1%
PPOP Rs bn 737.1 769.6 690.0 721.3 -6.4% -6.3%
PAT Rs bn 251.2 321.6 197.9 251.1 -21.2% -21.9%
EPS Rs 28.2 36.0 22.2 28.1 -21.2% -21.9%
ABV Rs 212.8 244.3 183.1 226.6 -13.9% -7.3%
GNPA (%) 5.1 4.2 6.7 5.2 151 bps 97 bps
NNPA (%) 1.7 1.5 2.7 1.8 105 bps 35 bps
Slippages (%) 2.5 2.2 3.5 2.8 100 bps 55 bps
LLP (%) 1.6 1.2 1.9 1.6 31 bps 38 bps
RoA (%) 0.6 0.7 0.5 0.6 -13 bps -15 bps
RoE (%) 10.3 12.0 8.2 9.6 -212 bps -238 bps
TP (Rs) 421 316 -25%
Multiple (x) 1.3 0.9 Source: HDFC sec Inst Research
NBFCs CIFC
Earlier Revised Chg
FY21E FY22E FY21E FY22E FY21E FY22E
AUM growth (%) 14.3 15.2 5.0 10.3 -933 bps -488 bps
NIM (%) 6.4 6.5 6.4 6.5 6 bps 2 bps
NII Rs bn 42.9 50.1 40.9 44.4 -4.8% -11.2%
PPOP Rs bn 29.9 35.3 26.4 27.9 -11.7% -20.9%
PAT Rs bn 17.5 21.1 13.7 16.0 -21.9% -24.3%
EPS Rs 21.4 25.7 16.7 19.5 -21.9% -24.3%
ABV Rs 106.8 128.4 98.5 114.6 -7.8% -10.8%
GNPA (%) 3.3 3.2 4.4 4.4 111 bps 119 bps
NNPA (%) 2.1 2.0 2.8 2.7 70 bps 72 bps
LLP (%) 0.9 0.8 1.2 0.9 34 bps 6 bps
RoA (%) 2.5 2.6 2.0 2.2 -44 bps -41 bps
RoE (%) 18.6 18.8 14.8 15.0 -375 bps -375 bps
TP (Rs) 412 251 -39%
Multiple (x) 3.2 2.2
Source: HDFC sec Inst Research
Page | 10
4QFY20 Results Preview
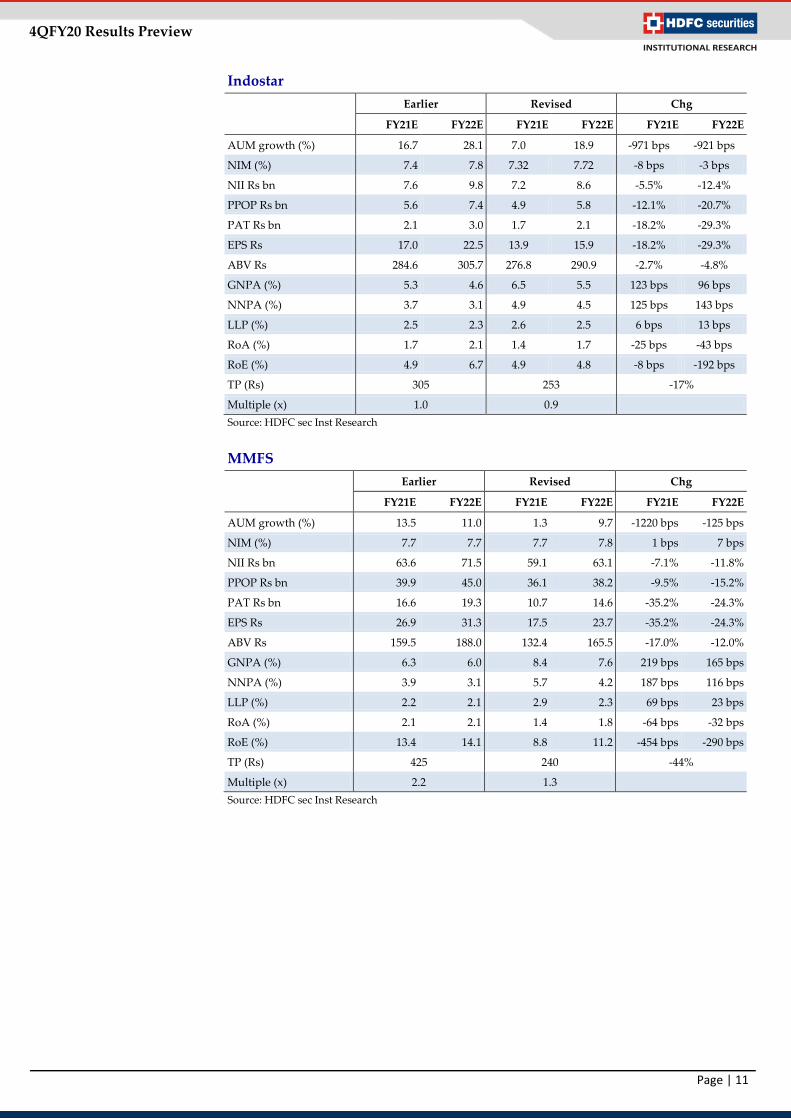
Indostar
Earlier Revised Chg
FY21E FY22E FY21E FY22E FY21E FY22E
AUM growth (%) 16.7 28.1 7.0 18.9 -971 bps -921 bps
NIM (%) 7.4 7.8 7.32 7.72 -8 bps -3 bps
NII Rs bn 7.6 9.8 7.2 8.6 -5.5% -12.4%
PPOP Rs bn 5.6 7.4 4.9 5.8 -12.1% -20.7%
PAT Rs bn 2.1 3.0 1.7 2.1 -18.2% -29.3%
EPS Rs 17.0 22.5 13.9 15.9 -18.2% -29.3%
ABV Rs 284.6 305.7 276.8 290.9 -2.7% -4.8%
GNPA (%) 5.3 4.6 6.5 5.5 123 bps 96 bps
NNPA (%) 3.7 3.1 4.9 4.5 125 bps 143 bps
LLP (%) 2.5 2.3 2.6 2.5 6 bps 13 bps
RoA (%) 1.7 2.1 1.4 1.7 -25 bps -43 bps
RoE (%) 4.9 6.7 4.9 4.8 -8 bps -192 bps
TP (Rs) 305 253 -17%
Multiple (x) 1.0 0.9 Source: HDFC sec Inst Research
MMFS
Earlier Revised Chg
FY21E FY22E FY21E FY22E FY21E FY22E
AUM growth (%) 13.5 11.0 1.3 9.7 -1220 bps -125 bps
NIM (%) 7.7 7.7 7.7 7.8 1 bps 7 bps
NII Rs bn 63.6 71.5 59.1 63.1 -7.1% -11.8%
PPOP Rs bn 39.9 45.0 36.1 38.2 -9.5% -15.2%
PAT Rs bn 16.6 19.3 10.7 14.6 -35.2% -24.3%
EPS Rs 26.9 31.3 17.5 23.7 -35.2% -24.3%
ABV Rs 159.5 188.0 132.4 165.5 -17.0% -12.0%
GNPA (%) 6.3 6.0 8.4 7.6 219 bps 165 bps
NNPA (%) 3.9 3.1 5.7 4.2 187 bps 116 bps
LLP (%) 2.2 2.1 2.9 2.3 69 bps 23 bps
RoA (%) 2.1 2.1 1.4 1.8 -64 bps -32 bps
RoE (%) 13.4 14.1 8.8 11.2 -454 bps -290 bps
TP (Rs) 425 240 -44%
Multiple (x) 2.2 1.3
Source: HDFC sec Inst Research
Page | 11

4QFY20 Results Preview
SHTF
Earlier Revised Chg
FY21E FY22E FY21E FY22E FY21E FY22E
AUM growth (%) 8.6 9.7 2.3 6.9 -636 bps -284 bps
NIM (%) 7.8 7.9 7.7 7.5 -18 bps -33 bps
NII Rs bn 91.0 99.9 86.0 88.7 -5.5% -11.2%
PPOP Rs bn 70.9 77.4 66.6 67.7 -6.2% -12.5%
PAT Rs bn 32.9 36.3 26.1 29.6 -20.7% -18.2%
EPS Rs 145.1 159.8 115.0 130.6 -20.7% -18.2%
ABV Rs 710.4 881.8 602.9 814.5 -15.1% -7.6%
GNPA (%) 8.4 8.2 11.0 9.6 261 bps 138 bps
NNPA (%) 4.3 3.4 6.2 4.0 190 bps 60 bps
LLP (%) 2.3 2.3 2.8 2.4 50 bps 11 bps
RoA (%) 2.6 2.6 2.1 2.1 -54 bps -46 bps
RoE (%) 16.5 15.8 13.3 13.4 -322 bps -236 bps
TP (Rs) 1538 891 -42%
Multiple (x) 1.7 1.1 Source: HDFC sec Inst Research
LICHF
Earlier Revised Chg
FY21E FY22E FY21E FY22E FY21E FY22E
AUM growth (%) 14.7 14.7 6.8 11.4 -800 bps -333 bps
NIM (%) 2.4 2.4 2.3 2.3 -10 bps -11 bps
NII Rs bn 57.0 64.7 52.3 56.1 -8.2% -13.3%
PPOP Rs bn 52.2 59.2 47.6 50.9 -8.8% -14.0%
PAT Rs bn 28.9 33.2 22.2 25.3 -23.2% -23.8%
EPS Rs 57.3 65.7 44.0 50.0 -23.2% -23.8%
ABV Rs 334.5 391.0 280.6 346.1 -16.1% -11.5%
GNPA (%) 2.8 2.8 4.2 3.8 134 bps 100 bps
NNPA (%) 1.5 1.3 2.7 2.0 113 bps 68 bps
LLP (%) 0.6 0.6 0.8 0.7 22 bps 15 bps
RoA (%) 1.2 1.2 1.0 1.0 -24 bps -20 bps
RoE (%) 14.8 15.0 11.5 11.8 -332 bps -324 bps
TP (Rs) 449 288 -36%
Multiple (x) 1.1 0.8
Source: HDFC sec Inst Research
Page | 12

4QFY20 Results Preview
REPCO
Earlier Revised Chg
FY21E FY22E FY21E FY22E FY21E FY22E
AUM growth (%) 11.8 12.6 2.1 3.2 -963 bps -944 bps
NIM (%) 4.3 4.3 3.99 3.98 -31 bps -37 bps
NII Rs bn 5.6 6.3 4.8 4.9 -13.1% -21.5%
PPOP Rs bn 4.7 5.3 4.0 4.1 -15.4% -23.5%
PAT Rs bn 3.2 3.7 2.5 2.5 -22.3% -32.7%
EPS Rs 51.8 58.9 40.3 39.7 -22.3% -32.6%
ABV Rs 289.6 346.1 258.0 302.6 -10.9% -12.6%
GNPA (%) 3.5 3.3 5.2 5.2 166 bps 190 bps
NNPA (%) 2.2 1.9 3.4 2.9 127 bps 105 bps
LLP (%) 0.3 0.3 0.5 0.6 22 bps 33 bps
RoA (%) 2.5 2.5 2.1 2.0 -44 bps -56 bps
RoE (%) 16.6 16.1 13.1 11.5 -344 bps -460 bps
TP (Rs) 399 217 -46%
Multiple (x) 1.2 0.7 Source: HDFC sec Inst Research
Page | 13

4QFY20 Results Preview
4QFY20E: Banks What’s Likely Key Monitorables
AUBANK
Healthy AUM growth (~28% YoY), albeit slower vs. previous trends (37%+). To be led by a 39/7.5% rise in retail loans. The wholesale book is likely to de-grow QoQ.
Sequentially stable NIMs will enable a 5% QoQ (+37% YoY) rise in NII.
Lower fee income to be offset to an extent by, higher PSL income.
We expect a 52% YoY PPOP growth after building in a 25% rise in opex.
We have conservatively built higher provisions (+55/33% YoY/QoQ).
Healthy PAT growth expected (+69%).
Retail deposit traction and strategy. Details on the moratorium availed by the customers. Outlook on growth and asset quality. Scope for efficiency improvement.
AXSB
~15% YoY (3% QoQ) loan growth and stable NIMs are expected to drive core earnings growth of 15.5% YoY.
Muted fee growth, and an 11% rise in opex will result in slower PPOP growth (11% YoY, down 3% QoQ).
We have factored in higher LLPs (+18% QoQ and 3x YoY), even as AXSB has a calc. PCR of ~59% and contingent provisions of Rs 25.6bn (8.5% of GNPAs).
Higher provisions will drag net earnings (Rs 13.1bn, -13/25% YoY/QoQ). YoY trends will be cushioned by the tax cut.
We have modeled 3% slippages vs. 4.6% QoQ and 2.5% YoY.
Deposit traction post the YES event. GNPA and BB and below rated loan pool flux. Details on the moratorium availed by the customers. Outlook on growth and asset quality. Subsidiaries’ performance.
CUBK
Loan growth is likely to moderate further to ~7.5% YoY (10.4% in 3Q) due to COVID-19 related disruptions.
A slight dip in NIMs will limit NII growth to just 5.5% YoY. Drop in non-interest income (lower fees and dip in treasury
gains) and a 15% rise in opex will drag PPOP (-5% YoY). While CUBK has the option to grant moratoriums and
extensively restructure MSME loans, we anticipate higher slippages at 2.9% vs. 2.7% QoQ
Higher LLPs (+27/42% YoY/QoQ)) will lead to a drop in net earnings (Rs 1.7bn, -2/-11% YoY/QoQ)
Deposit flux post the YES event. Utilisation of MSME restructuring, if any and moratorium
utilized by customers. Comments on growth and asset quality (incl. recoveries). Comments on TN macros, SMA II and the SME sector.
DCBB
Loan growth to further moderate to <10% vs. 11-15% in previous quarters.
With largely stable NIMs, we expect core earnings to grow by ~10% YoY and 2% QoQ
PPOP growth to be a mere 3% even as opex growth remains contained at 7/1.4% YoY/QoQ. Overall non-interest income is expected decline (9/2% YoY/QoQ).
We have conservatively factored in higher provisions (25% QoQ and 2.1x YoY).
Consequently, we expect PAT to de-grow 9/10%, YoY/QoQ (despite tax rate cut benefits).
Further outflow of deposits (if any). Utilisation of MSME restructuring, if any and moratorium
utilized by customers. Comments on growth and asset quality . Efficiency improvements. Commentary on the LAP/SME businesses.
Page | 14

4QFY20 Results Preview
What’s Likely Key Monitorables
FB
We expect +12% loan growth in 4Q vs. 13% in 3Q. With stable NIMs, core earnings are expected to grow by
10.3% YoY and ~5% QoQ. Non-interest income to remain flattish, due to lower
recoveries and treasury gains. Opex growth factored at 14/5% YoY/QoQ, led by a 23/10%
rise in staff costs. FB is expected to make additional provisions pursuant to wage negotiations.
Consequently, we expect PPOP (Rs 7.6bn) to be flat YoY. Benefits from the lower tax rate will be offset by higher
provisions (+33/48%); net earnings growth to be muted at 3.4% YoY.
Comments of deposit flux and particularly that of NRI deposits.
Utilisation of MSME restructuring, if any and moratorium utilized by customers.
Comments on growth and asset quality. Scope for efficiency improvement, if any. Additions to the watch-list and anticipated SME stress.
ICICIBC
Loan growth of 12/3% YoY/QoQ to be largely driven by the retail segment.
Core earnings to grow at 16/4% YoY, partially driven by an improvement in NIMs. Ex.one-offs, stable NIMs QoQ.
Higher non-interest income and controlled opex growth (+12% YoY) will drive +19% YoY PPOP growth.
We have factored in higher provisions (+9% QoQ, albeit lower YoY.
PAT is likely to register a sharp 4x YoY rise (on smaller base, down 8% QoQ).
Traction in deposits post the YES event. Movement of reported (GNPAs) and anticipated stress (BB
and below rated book) pools. Moratorium utilized by customers. Comments on resolutions. Outlook on growth and asset quality. Subsidiaries’ performance.
IIB
Loan growth (incl. BHAFIN) to slow further to ~13% (vs. 20% in 3Q and 29% in FY19).
With some pressure on NIMs (CoF and interest reversals), we expect NII to dip 5% QoQ (+31% YoY)
Non-interest income growth to be muted (7% YoY) with flattish fees and higher treasury gains (YoY, on smaller base).
Opex growth of 21% YoY (flattish QoQ) will limit PPOP growth to 22% YoY (down 8% QoQ).
We factor higher provisions (towards telecom and other stressed exposures) of Rs 20.2bn, +29/94% YoY/QoQ.
Benefits from the lower tax rate will be offset by higher provisions; we expect flat earnings YoY (down 72% QoQ).
Comments on deposit flux and especially that of bulk deposits.
Strategy for accumulating retail deposits. Moratorium utilized by customers across segments, esp. in
vehicle and microfinance. Additions to the watch-list and stress in the corporate and
SME segments. Rise in provision coverage ratio.
KMB
Loan growth further moderated to sub-7% (vs. 10.4% in 3Q and 21% in FY19)
Sharp surge in deposits (esp. CASA) - +16/10% YoY/QoQ post the YES event.
Fall in CD ratio, will impact NIMs on a QoQ basis. We expect NII growth of 10% YoY (down 2% QoQ). Muted other income and 17% opex growth will lead to
flattish PPOP We have conservatively factored in higher LLPs (+88%
YoY). PAT to de-grow 13% QoQ (flattish YoY)
Comments on macros and the financial Sector Outlook on Growth and asset quality. Further deposits inflows. Comments on the mandated reduction in promoter stake. Performance of subsidiaries.
Page | 15
4QFY20 Results Preview
What’s Likely Key Monitorables
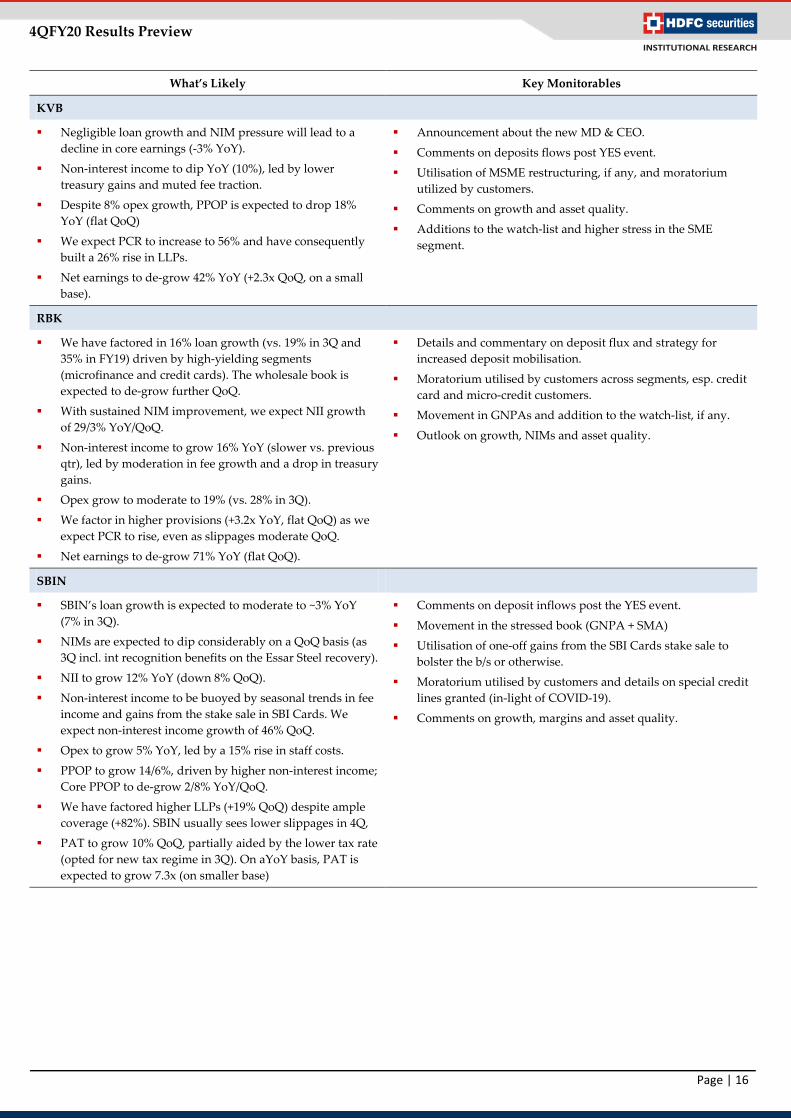
KVB
Negligible loan growth and NIM pressure will lead to a decline in core earnings (-3% YoY).
Non-interest income to dip YoY (10%), led by lower treasury gains and muted fee traction.
Despite 8% opex growth, PPOP is expected to drop 18% YoY (flat QoQ)
We expect PCR to increase to 56% and have consequently built a 26% rise in LLPs.
Net earnings to de-grow 42% YoY (+2.3x QoQ, on a small base).
Announcement about the new MD & CEO.
Comments on deposits flows post YES event.
Utilisation of MSME restructuring, if any, and moratorium utilized by customers.
Comments on growth and asset quality.
Additions to the watch-list and higher stress in the SME segment.
RBK
We have factored in 16% loan growth (vs. 19% in 3Q and 35% in FY19) driven by high-yielding segments (microfinance and credit cards). The wholesale book is expected to de-grow further QoQ.
With sustained NIM improvement, we expect NII growth of 29/3% YoY/QoQ.
Non-interest income to grow 16% YoY (slower vs. previous qtr), led by moderation in fee growth and a drop in treasury gains.
Opex grow to moderate to 19% (vs. 28% in 3Q).
We factor in higher provisions (+3.2x YoY, flat QoQ) as we expect PCR to rise, even as slippages moderate QoQ.
Net earnings to de-grow 71% YoY (flat QoQ).
Details and commentary on deposit flux and strategy for increased deposit mobilisation.
Moratorium utilised by customers across segments, esp. credit card and micro-credit customers.
Movement in GNPAs and addition to the watch-list, if any.
Outlook on growth, NIMs and asset quality.
SBIN
SBIN’s loan growth is expected to moderate to ~3% YoY (7% in 3Q).
NIMs are expected to dip considerably on a QoQ basis (as 3Q incl. int recognition benefits on the Essar Steel recovery).
NII to grow 12% YoY (down 8% QoQ).
Non-interest income to be buoyed by seasonal trends in fee income and gains from the stake sale in SBI Cards. We expect non-interest income growth of 46% QoQ.
Opex to grow 5% YoY, led by a 15% rise in staff costs.
PPOP to grow 14/6%, driven by higher non-interest income; Core PPOP to de-grow 2/8% YoY/QoQ.
We have factored higher LLPs (+19% QoQ) despite ample coverage (+82%). SBIN usually sees lower slippages in 4Q,
PAT to grow 10% QoQ, partially aided by the lower tax rate (opted for new tax regime in 3Q). On aYoY basis, PAT is expected to grow 7.3x (on smaller base)
Comments on deposit inflows post the YES event.
Movement in the stressed book (GNPA + SMA)
Utilisation of one-off gains from the SBI Cards stake sale to bolster the b/s or otherwise.
Moratorium utilised by customers and details on special credit lines granted (in-light of COVID-19).
Comments on growth, margins and asset quality.
Page | 16

4QFY20 Results Preview
4QFY20E: NBFCs
What’s Likely Key Monitorables
CIFC
While Jan and Feb-20 are likely to have seen decent disbursals, overall disbursals for the qtr will have been impacted by the disruptions in the 2nd half of Mar-20.
We expect AUM growth to slow to 15% NIMs are likely to remain stable as the impact of higher on-
b/s liquidity will be offset by the recent capital raise and MCLR cuts.
NII is expected to grow at 23% YoY and 4% QoQ. PPOP is likely to grow 32% YoY, driven by slower opex
growth (16%). We have factored in a 25% YoY growth in provisions. We expect PAT to grow by ~30%.
Comments on receipt and utilisation of moratoriums. Outlook on growth, collections and asset quality. Comments on rural macros. Approach to provisioning. Improvement in efficiency and coverage. Liquidity and comments on availability of funds.
INDOSTAR
AUM to dip 2% QoQ (15% YoY), led by a run down in the corporate book.
We expect spreads to compress, the impact on NIMs will be cushioned by the recent fund-raise.
NII to de-grow 3% QoQ (flat YoY). Higher provisions to persist as stress in the corporate book
may be exacerbated by the current situation. We expect negligible net earnings for the qtr (similar to 3Q).
Comments on the utilisation of moratorium, esp. in non-corporate businesses.
Corporate asset quality. Liquidity, availability of funds and cost of funds. Outlook on growth and asset quality.
MMFS
We expect AUMs to grow at 15% YoY (vs. 20% YoY in 3Q), due to disruptions in the 2nd half of Mar-20.
NII is expected to grow at 10% YoY and ~5% QoQ with marginal NIM improvement QoQ
PPOP is expected to grow at 19/5% YoY/QoQ with controlled opex growth (flattish YoY).
As 4Q is usually a seasonally strong qtr (recoveries /collections are generally higher), we have factored in a 28% drop in LLPs (Rs 2.9bn). This poses a risk to our estimates on either sides.
PAT expected to jump 32% QoQ (down 18% YoY).
Comments on utilisation of moratorium. Outlook on growth, collections and asset quality. Comments on rural macros. Additional provisions. Liquidity and comments on availability of funds. Performance of the housing subsidiary.
SHTF
Muted AUM growth to continue in 4Q as well (5% YoY and flat QoQ), accentuated by the lockdown.
NIMs are expected to be marginally impacted by higher cost of funds.
We expect NII to remain flat YoY (dip QoQ). Opex is expected to grow at 16% YoY, resulting in flattish
PPOP growth. Despite the moratorium, we have factored higher LLPs
(+8% QoQ) We expect PAT to grow by ~5% (down 11% QoQ)
Comments on utilisation of moratorium. Outlook on growth, collections and asset quality. Comments on rural macros. Liquidity and comments on availability of funds. Comments on the 3-way merger.
Page | 17
4QFY20 Results Preview
What’s Likely Key Monitorables
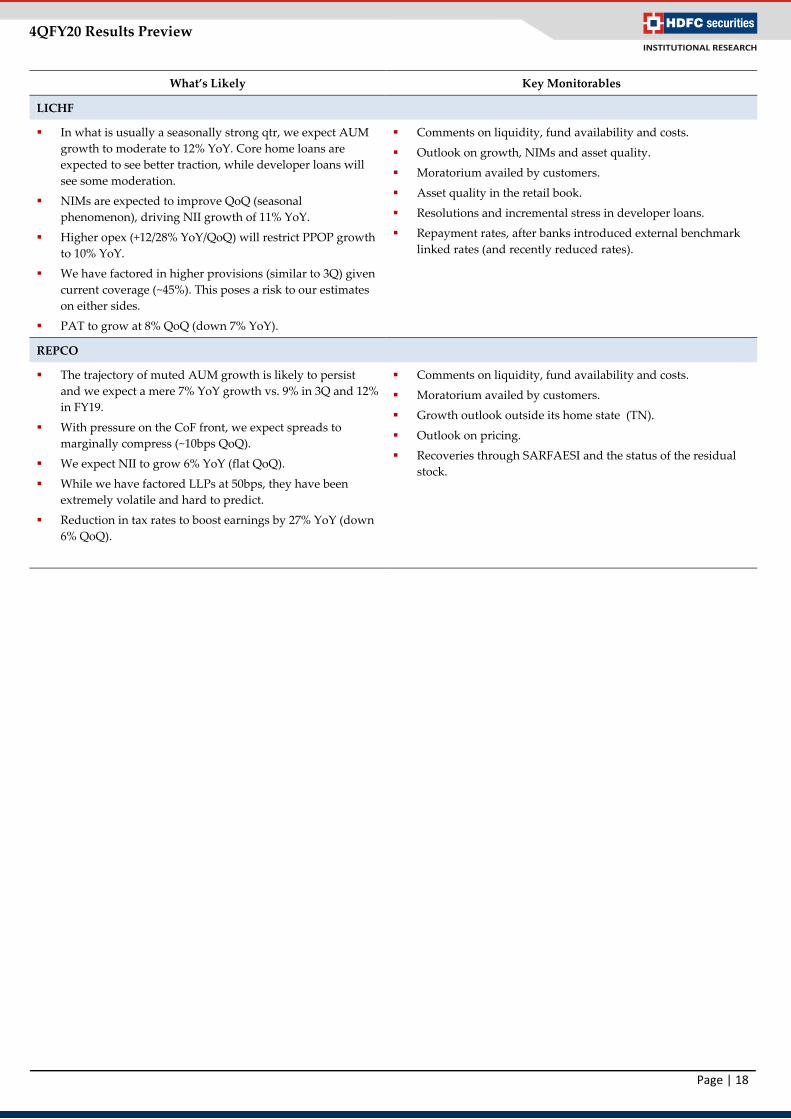
LICHF
In what is usually a seasonally strong qtr, we expect AUM growth to moderate to 12% YoY. Core home loans are expected to see better traction, while developer loans will see some moderation.
NIMs are expected to improve QoQ (seasonal phenomenon), driving NII growth of 11% YoY.
Higher opex (+12/28% YoY/QoQ) will restrict PPOP growth to 10% YoY.
We have factored in higher provisions (similar to 3Q) given current coverage (~45%). This poses a risk to our estimates on either sides.
PAT to grow at 8% QoQ (down 7% YoY).
Comments on liquidity, fund availability and costs.
Outlook on growth, NIMs and asset quality.
Moratorium availed by customers.
Asset quality in the retail book.
Resolutions and incremental stress in developer loans.
Repayment rates, after banks introduced external benchmark linked rates (and recently reduced rates).
REPCO
The trajectory of muted AUM growth is likely to persist and we expect a mere 7% YoY growth vs. 9% in 3Q and 12% in FY19.
With pressure on the CoF front, we expect spreads to marginally compress (~10bps QoQ).
We expect NII to grow 6% YoY (flat QoQ).
While we have factored LLPs at 50bps, they have been extremely volatile and hard to predict.
Reduction in tax rates to boost earnings by 27% YoY (down 6% QoQ).
Comments on liquidity, fund availability and costs.
Moratorium availed by customers.
Growth outlook outside its home state (TN).
Outlook on pricing.
Recoveries through SARFAESI and the status of the residual stock.
Page | 18

4QFY20 Results Preview
Rating Criteria BUY: >+15% return potential ADD: +5% to +15% return potential REDUCE: -10% to +5% return potential SELL: >10% Downside return potential
HDFC securities Institutional Equities Unit No. 1602, 16th Floor, Tower A, Peninsula Business Park, Senapati Bapat Marg, Lower Parel, Mumbai - 400 013 Board: +91-22-6171-7330 www.hdfcsec.com
Disclosure: We, Darpin Shah, MBA & Aaksh Dattani, ACA, authors and the names subscribed to this report, hereby certify that all of the views expressed in this research report accurately reflect our views about the subject issuer(s) or securities. HSL has no material adverse disciplinary history as on the date of publication of this report. We also certify that no part of our compensation was, is, or will be directly or indirectly related to the specific recommendation(s) or view(s) in this report. Research Analyst or his/her relative or HDFC Securities Ltd. does not have any financial interest in the subject company. Also Research Analyst or his relative or HDFC Securities Ltd. or its Associate may have beneficial ownership of 1% or more in the subject company at the end of the month immediately preceding the date of publication of the Research Report. Further Research Analyst or his relative or HDFC Securities Ltd. or its associate does not have any material conflict of interest. Any holding in stock –NO HDFC Securities Limited (HSL) is a SEBI Registered Research Analyst having registration no. INH000002475. Disclaimer: This report has been prepared by HDFC Securities Ltd and is solely for information of the recipient only. The report must not be used as a singular basis of any investment decision. The views herein are of a general nature and do not consider the risk appetite or the particular circumstances of an individual investor; readers are requested to take professional advice before investing. Nothing in this document should be construed as investment advice. Each recipient of this document should make such investigations as they deem necessary to arrive at an independent evaluation of an investment in securities of the companies referred to in this document (including merits and risks) and should consult their own advisors to determine merits and risks of such investment. The information and opinions contained herein have been compiled or arrived at, based upon information obtained in good faith from sources believed to be reliable. Such information has not been independently verified and no guaranty, representation of warranty, express or implied, is made as to its accuracy, completeness or correctness. All such information and opinions are subject to change without notice. Descriptions of any company or companies or their securities mentioned herein are not intended to be complete. HSL is not obliged to update this report for such changes. HSL has the right to make changes and modifications at any time. This report is not directed to, or intended for display, downloading, printing, reproducing or for distribution to or use by, any person or entity who is a citizen or resident or located in any locality, state, country or other jurisdiction where such distribution, publication, reproduction, availability or use would be contrary to law or regulation or what would subject HSL or its affiliates to any registration or licensing requirement within such jurisdiction. If this report is inadvertently sent or has reached any person in such country, especially, United States of America, the same should be ignored and brought to the attention of the sender. This document may not be reproduced, distributed or published in whole or in part, directly or indirectly, for any purposes or in any manner. Foreign currencies denominated securities, wherever mentioned, are subject to exchange rate fluctuations, which could have an adverse effect on their value or price, or the income derived from them. In addition, investors in securities such as ADRs, the values of which are influenced by foreign currencies effectively assume currency risk. It should not be considered to be taken as an offer to sell or a solicitation to buy any security. This document is not, and should not, be construed as an offer or solicitation of an offer, to buy or sell any securities or other financial instruments. This report should not be construed as an invitation or solicitation to do business with HSL. HSL may from time to time solicit from, or perform broking, or other services for, any company mentioned in this mail and/or its attachments. HSL and its affiliated company(ies), their directors and employees may; (a) from time to time, have a long or short position in, and buy or sell the securities of the company(ies) mentioned herein or (b) be engaged in any other transaction involving such securities and earn brokerage or other compensation or act as a market maker in the financial instruments of the company(ies) discussed herein or act as an advisor or lender/borrower to such company(ies) or may have any other potential conflict of interests with respect to any recommendation and other related information and opinions. HSL, its directors, analysts or employees do not take any responsibility, financial or otherwise, of the losses or the damages sustained due to the investments made or any action taken on basis of this report, including but not restricted to, fluctuation in the prices of shares and bonds, changes in the currency rates, diminution in the NAVs, reduction in the dividend or income, etc. HSL and other group companies, its directors, associates, employees may have various positions in any of the stocks, securities and financial instruments dealt in the report, or may make sell or purchase or other deals in these securities from time to time or may deal in other securities of the companies / organizations described in this report. HSL or its associates might have managed or co-managed public offering of securities for the subject company or might have been mandated by the subject company for any other assignment in the past twelve months. HSL or its associates might have received any compensation from the companies mentioned in the report during the period preceding twelve months from t date of this report for services in respect of managing or co-managing public offerings, corporate finance, investment banking or merchant banking, brokerage services or other advisory service in a merger or specific transaction in the normal course of business. HSL or its analysts did not receive any compensation or other benefits from the companies mentioned in the report or third party in connection with preparation of the research report. Accordingly, neither HSL nor Research Analysts have any material conflict of interest at the time of publication of this report. Compensation of our Research Analysts is not based on any specific merchant banking, investment banking or brokerage service transactions. HSL may have issued other reports that are inconsistent with and reach different conclusion from the information presented in this report. Research entity has not been engaged in market making activity for the subject company. Research analyst has not served as an officer, director or employee of the subject company. We have not received any compensation/benefits from the subject company or third party in connection with the Research Report. HDFC securities Limited, I Think Techno Campus, Building - B, "Alpha", Office Floor 8, Near Kanjurmarg Station, Opp. Crompton Greaves, Kanjurmarg (East), Mumbai 400 042 Phone: (022) 3075 3400 Fax: (022) 2496 5066 Compliance Officer: Binkle R. Oza Email: [email protected] Phone: (022) 3045 3600 HDFC Securities Limited, SEBI Reg. No.: NSE, BSE, MSEI, MCX: INZ000186937; AMFI Reg. No. ARN: 13549; PFRDA Reg. No. POP: 11092018; IRDA Corporate Agent License No.: CA0062; SEBI Research Analyst Reg. No.: INH000002475; SEBI Investment Adviser Reg. No.: INA000011538; CIN -
Page | 19