15-313 Foundations of Software Engineeringckaestne/15313/2016/04-8-sep-measurement.pdf ·...
64
Foundations of Software Engineering Part 3: Measurement Christian Kästner 15-313 Software Engineering 1
Transcript of 15-313 Foundations of Software Engineeringckaestne/15313/2016/04-8-sep-measurement.pdf ·...

Foundations of Software Engineering
Part 3: Measurement
Christian Kästner
15-313 Software Engineering 1
Administrativa
• HW1a due tonight
–Remember team policy
–Deployment (virtual box)
• Reading load
15-313 Software Engineering 2

15-313 Software Engineering 3
Learning Goals
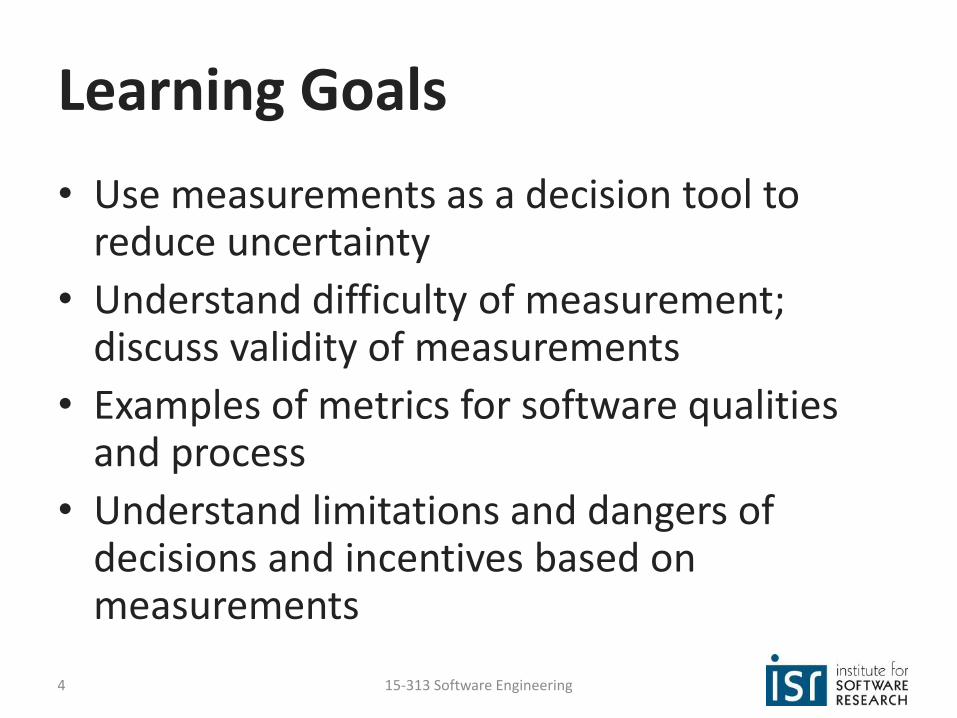
• Use measurements as a decision tool to reduce uncertainty
• Understand difficulty of measurement; discuss validity of measurements
• Examples of metrics for software qualities and process
• Understand limitations and dangers of decisions and incentives based on measurements
15-313 Software Engineering 4

About You
Could explain Cyclomatic Complexity
No
Vaguely
Yes
15-313 Software Engineering 5

Case Study: The Maintainability Index
15-313 Software Engineering 6

15-313 Software Engineering 7
Visual Studio since 2007
“Maintainability Index calculates an index value between 0 and 100 that represents the relative ease of maintaining the code. A high value means better maintainability. Color coded ratings can be used to quickly identify trouble spots in your code. A green rating is between 20 and 100 and indicates that the code has good maintainability. A yellow rating is between 10 and 19 and indicates that the code is moderately maintainable. A red rating is a rating between 0 and 9 and indicates low maintainability.”

Design rational (from MSDN blog)
• "We noticed that as code tended toward 0 it was clearly hard to maintain code and the difference between code at 0 and some negative value was not useful."
• "The desire was that if the index showed red then we would be saying with a high degree of confidence that there was an issue with the code."
15-313 Software Engineering 8
http://blogs.msdn.com/b/codeanalysis/archive/2007/11/20/maintainability-index-range-and-meaning.aspx
http://blogs.msdn.com/b/codeanalysis/archive/2007/11/20/maintainability-index-range-and-meaning.aspx
http://blogs.msdn.com/b/codeanalysis/archive/2007/11/20/maintainability-index-range-and-meaning.aspx
http://blogs.msdn.com/b/codeanalysis/archive/2007/11/20/maintainability-index-range-and-meaning.aspx
http://blogs.msdn.com/b/codeanalysis/archive/2007/11/20/maintainability-index-range-and-meaning.aspx
http://blogs.msdn.com/b/codeanalysis/archive/2007/11/20/maintainability-index-range-and-meaning.aspx
http://blogs.msdn.com/b/codeanalysis/archive/2007/11/20/maintainability-index-range-and-meaning.aspx
http://blogs.msdn.com/b/codeanalysis/archive/2007/11/20/maintainability-index-range-and-meaning.aspx

The Index
Maintainability Index =
MAX(0,(171 –
5.2 * log(Halstead Volume) –
0.23 * (Cyclomatic Complexity) –
16.2 * log(Lines of Code)
)*100 / 171)
15-313 Software Engineering 9

Lines of Code
• Easy to measure > wc –l file1 file2…
LOC projects
450 Expression Evaluator
2.000 Sudoku, Functional Graph Library
40.000 OpenVPN
80-100.000 Berkeley DB, SQLlight
150-300.000 Apache, HyperSQL, Busybox, Emacs, Vim, ArgoUML
500-800.000 gimp, glibc, mplayer, php, SVN
1.600.000 gcc
6.000.000 Linux, FreeBSD
45.000.000 Windows XP

Normalizing Lines of Code
• Ignore comments and empty lines
• Ignore lines < 2 characters
• Pretty print source code first
• Count statements (logical lines of code) for (i = 0; i < 100; i += 1) printf("hello"); /* How many lines of code is this? */
/* How many lines of code is this? */ for ( i = 0; i < 100; i += 1 ) { printf("hello"); }

Normalization per Language
Language Statement factor (productivity)
Line factor
C 1 1
C++ 2.5 1
Fortran 2 0.8
Java 2.5 1.5
Perl 6 6
Smalltalk 6 6.25
Python 6.5
12
Source: http://www.codinghorror.com/blog/2005/08/are-all-programming-languages-the-same.html u.a.

Halstead Volume
• Introduced by Maurice Howard Halstead in 1977
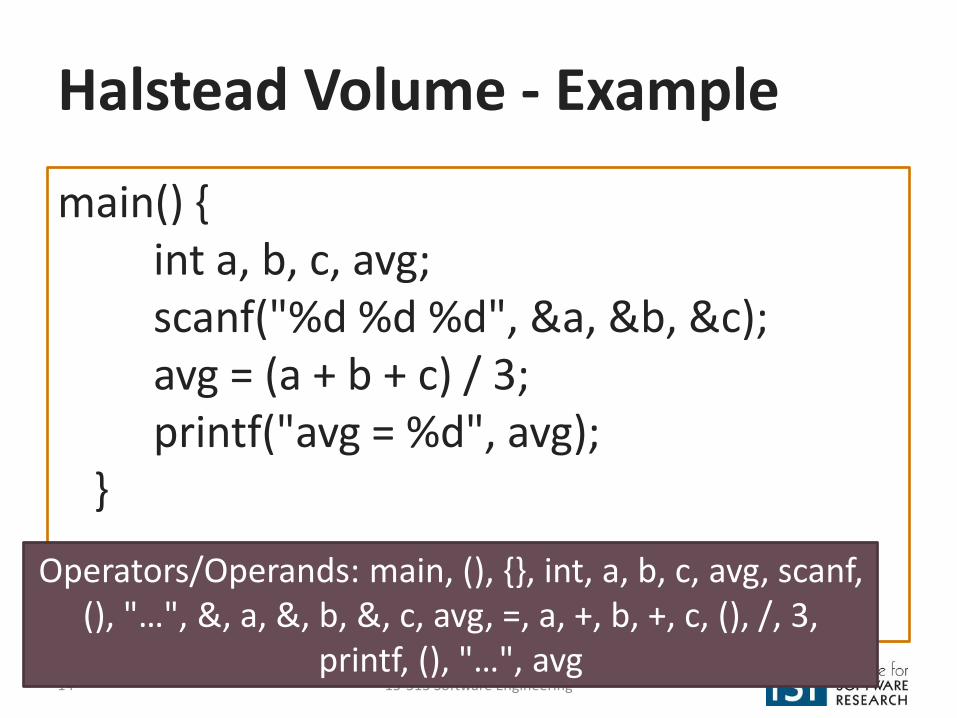
• Halstead Volume = number of operators/operands * log2(number of distinct operators/operands)
• Approximates size of elements and vocabulary
15-313 Software Engineering 13
Halstead Volume - Example
main() { int a, b, c, avg; scanf("%d %d %d", &a, &b, &c); avg = (a + b + c) / 3; printf("avg = %d", avg); }
15-313 Software Engineering 14
Operators/Operands: main, (), {}, int, a, b, c, avg, scanf, (), "…", &, a, &, b, &, c, avg, =, a, +, b, +, c, (), /, 3,
printf, (), "…", avg

Cyclomatic Complexity
• Proposed by McCabe 1976
• Based on control flow graph, measures linearly independent paths through a program
– ~= number of decisions
– Number of test cases needed to achieve branch coverage
if (c1) { f1(); } else { f2(); } if (c2) { f3(); } else { f4(); }
M = edges of CFG – nodes of CFG + 2*end points

Origins
• 1992 Paper at the International Conference on Software Maintenance by Paul Oman and Jack Hagemeister
• Developers rated a number of HP systems in C and Pascal
• Statistical regression analysis to find key factors among 40 metrics
15-313 Software Engineering 16
COM = percentage of comments

Discussion
15-313 Software Engineering 17

Discussion
• Metric seems attractive • Easy to compute • Often seems to match
intuition
• Parameters seem almost arbitrary, calibrated in single small study code (few developers, unclear statistical significance)
• All metrics related to size: just measure lines of code?
• Original 1992 C/Pascal programs potentially quite different from Java/JS/C# code
15-313 Software Engineering 18
http://avandeursen.com/2014/08/29/think-twice-before-using-the-maintainability-index/

Evaluating Metrics
• For every metric answer the following questions:
– What is the purpose of the measure?
– What is the scope of the measure?
– What attribute are we trying to measure?
– What is the natural scale of the attribute we are trying to measure?
– What is the natural variability of the attribute?
– What is the metric (measurement function)? What measuring instrument do we use?
– What is the natural scale for the metric?
– What is the natural measurement error for this instrument?
– What is the relationship of the attribute to the metric? (construct validity)
– What are the natural and foreseeable side effects of using this instrument?
Further reading: Kaner and Bond. Software Engineering Metrics: What Do They Measure and How Do We Know? METRICS 2004

Measurement for Decision Making in Software Development
15-313 Software Engineering 20

What is Measurement?
15-313 Software Engineering 21

What is Measurement?
• Measurement is the empirical, objective assignment of numbers, according to a rule derived from a model or theory, to attributes of objects or events with the intent of describing them. – Craner, Bond, “Software Engineering Metrics: What Do They Measure and How Do We Know?”
• A quantitatively expressed reduction of uncertainty based on one or more observations. – Hubbard, “How to Measure Anything …”
15-313 Software Engineering 22

Measurement
• Measurement is the assignment of numbers to objects or events according to a consistent rule – A mapping from the empirical world to the formal,
relational world
• Level of measurement – Nominal scale - e.g., gender, highest degree – Ordinal scale - e.g., good-average-bad scale – Interval and ration scale (metric) - e.g., temperature,
time, throughput, error rate
• Cornerstone of science

Measurement for Decision Making
15-313 Software Engineering 24

Measurement for Decision Making
• Fund project?
• More testing?
• Fast enough? Secure enough?
• Code quality sufficient?
• Which feature to focus on?
• Developer bonus?
• Time and cost estimation? Predictions reliable?
15-313 Software Engineering 25

What software qualities do we care about?
15-313 Software Engineering 26

What software qualities do we care about? (examples, see recitation) • Scalability
• Security
• Extensibility
• Documentation
• Performance
• Consistency
• Portability
• Installability
• Maintainability
• Functionality (e.g., data integrity)
• Availability
• Ease of use
15-313 Software Engineering 27

What process qualities do we care about?

What process qualities do we care about? (examples) • On-time release • Development speed • Meeting efficiency • Conformance to
processes • Time spent on rework • Reliability of
predictions • Fairness in decision
making
• Measure time, costs, actions, resources, and quality of work packages; compare with predictions
• Use information from issue trackers, communication networks, team structures, etc
• …

Trend analyses

Trend analyses
• Growth rate of code size?
• Adoption of design pattern?
• Time to fix a bug?
• Performance improvements?
• Fewer bugs in older code?

Benchmark-Based Metrics
• Monitor many projects or many modules, get typical values for metrics
• Report deviations
https://semmle.com/insights/

Benchmark-Based Metrics
• Monitor many projects or many modules, get typical values for metrics
• Report deviations
Microsoft Survey (2014)
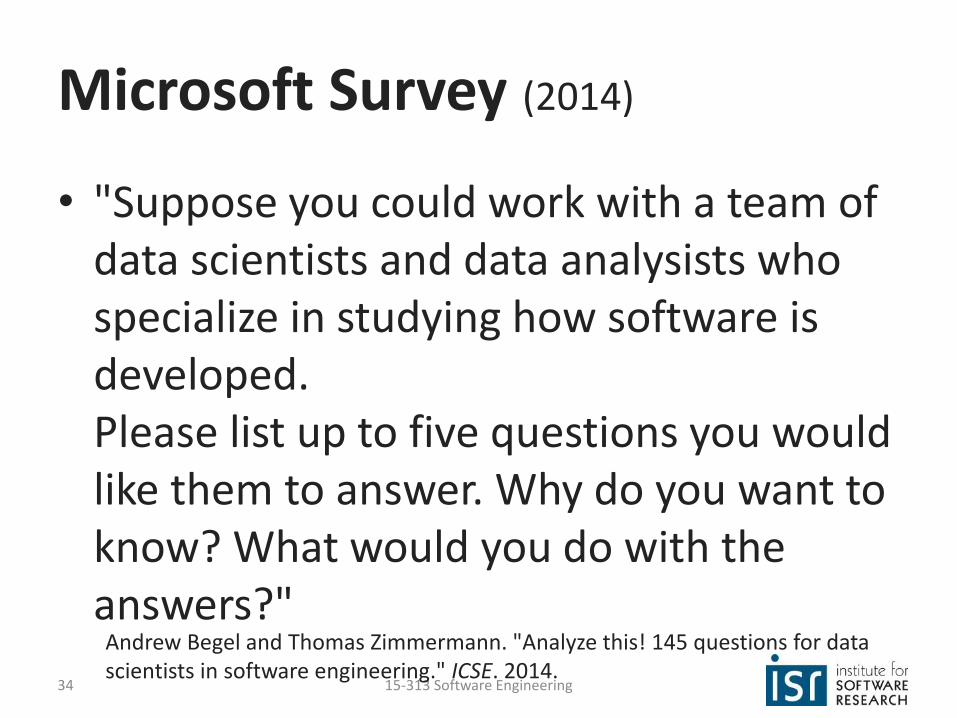
• "Suppose you could work with a team of data scientists and data analysists who specialize in studying how software is developed. Please list up to five questions you would like them to answer. Why do you want to know? What would you do with the answers?"
15-313 Software Engineering 34
Andrew Begel and Thomas Zimmermann. "Analyze this! 145 questions for data scientists in software engineering." ICSE. 2014.

Top Questions
• How do users typically use my application? • What parts of a software product are most used
and/or loved by customers? • How effective are the quality gates we run at
checkin? • How can we improve collaboration and sharing
between teams? • What are best key performance indicators (KPIs) for
monitoring services? • What is the impact of a code change or requirements
change to the project and tests?
15-313 Software Engineering 35

Top Questions
• What is the impact of tools on productivity? • How do I avoid reinventing the wheel by sharing
and/or searching for code? • What are the common patterns of execution in my
application? • How well does test coverage correspond to actual
code usage by our customers? • What kinds of mistakes do developers make in their
software? Which ones are the most common? • What are effective metrics for ship quality?
15-313 Software Engineering 36

Bottom Questions
• Which individual measures correlate with employee productivity (e.g., employee age, tenure, engineering skills, education, promotion velocity, IQ)?
• Which coding measures correlate with employee productivity (e.g., lines of code, time it take to build the software, a particular tool set, pair programming, number of hours of coding per day, language)?
• What metrics can be used to compare employees? • How can we measure the productivity of a Microsoft
employee? • Is the number of bugs a good measure of developer
effectiveness? • Can I generate 100% test coverage?
15-313 Software Engineering 37

Measurement is Difficult
15-313 Software Engineering 38

15-313 Software Engineering 39


Defect Density

Defect Density
• Defect density = Known bugs / line of code • System spoilage = time to fix post-release defects /
total system development time • Post-release vs pre-release • What counted as defect? Severity? Relevance? • What size metric used? • What quality assurance mechanisms used?
• Little reference data publicly available;
typically 2-10 defects/1000 lines of code

Measuring Usability

Measurement strategies
• Automated measures on code repositories
• Use or collect process data
• Instrument program (e.g., in-field crash reports)
• Surveys, interviews, controlled experiments, expert judgment
• Statistical analysis of sample
15-313 Software Engineering 44

Metrics and Incentives
15-313 Software Engineering 45

15-313 Software Engineering 46
http://dilbert.com/strips/comic/1995-11-13/

Productivity Metrics
15-313 Software Engineering 48

Productivity Metrics
• Lines of code per day?
– Industry average 10-50 lines/day
–Debugging + rework ca. 50% of time
• Function/object/application points per month
• Bugs fixed?
• Milestones reached?
15-313 Software Engineering 49

Incentivizing Productivity
• What happens when developer bonuses are based on – Lines of code per day
–Amount of documentation written
– Low number of reported bugs in their code
– Low number of open bugs in their code
–High number of fixed bugs
–Accuracy of time estimates
15-313 Software Engineering 50

15-313 Software Engineering 51
Autonomy Mastery Purpose
Can extinguish intrinsic motivation Can diminish performance
Can crush creativity Can crowd out good behavior
Can encourage cheating, shortcuts, and unethical behavior Can become addictive
Can foster short-term thinking
Temptation of Software Metrics
15-313 Software Engineering 52

Software Quality Metrics
• IEEE 1061 definition: “A software quality metric is a function whose inputs are software data and whose output is a single numerical value that can be interpreted as the degree to which software processes a given attribute that affects its quality.”
• Metrics have been proposed for many quality attributes; may define own metrics

External attributes: Measuring Quality
McCall model has 41 metrics to measure
23 quality criteria from 11 factors

Decomposition of Metrics
Maintainability
Correctability
Testability
Expandability
Faults count
Degree of testing
Effort
Change counts
Closure time Isolate/fix time Fault rate Statement coverage Test plan completeness Resource prediction Effort expenditure Change effort Change size Change rate

Object-Oriented Metrics
• Number of Methods per Class
• Depth of Inheritance Tree
• Number of Child Classes
• Coupling between Object Classes
• Calls to Methods in Unrelated Classes
• …

Other quality metrics?
• Comment density
• Test coverage
• Component balance (system breakdown optimality and component size uniformity)
• Code churn (number of lines added, removed, changed in a file)
• …
Validity of Metrics (excerpt)
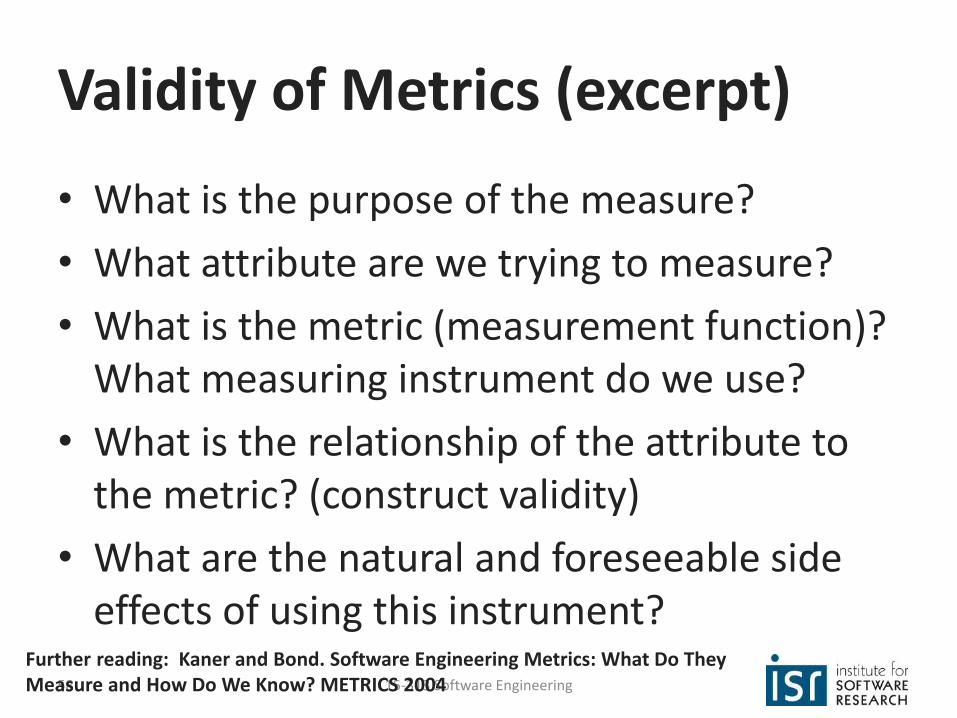
• What is the purpose of the measure?
• What attribute are we trying to measure?
• What is the metric (measurement function)? What measuring instrument do we use?
• What is the relationship of the attribute to the metric? (construct validity)
• What are the natural and foreseeable side effects of using this instrument?
15-313 Software Engineering 58
Further reading: Kaner and Bond. Software Engineering Metrics: What Do They Measure and How Do We Know? METRICS 2004

Warning
• Most software metrics are controversial – Usually only plausibility arguments, rarely rigorously validated
– Cyclomatic complexity was repeatedly refuted and is still used
– “Similar to the attempt of measuring the intelligence of a person in terms of the weight or circumference of the brain”
• Use carefully!
• Code size dominates many metrics
• Avoid claims about human factors (e.g., readability) and quality, unless validated
• Calibrate metrics in project history and other projects
• Metrics can be gamed; you get what you measure

http://xkcd.com/552/

• For causation – Provide a theory (from domain knowledge, independent
of data) – Show correlation – Demonstrate ability to predict new cases
(replicate/validate)
http://xkcd.com/552/

15-313 Software Engineering 62

Summary
• Measurement is difficult but important for decision making
• Software metrics are easy to measure but hard to interpret, validity often not established
• Many metrics exist, often composed, pick or design suitable metrics if needed
• Careful in use: monitoring vs incentives • Strategies beyond metrics

Further Reading on Metrics
• Sommerville. Software Engineering. Edition 7/8, Sections 26.1, 27.5, and 28.3
• Hubbard. How to measure anything: Finding the value of intangibles in business. John Wiley & Sons, 2014. Chapter 3
• Kaner and Bond. Software Engineering Metrics: What Do They Measure and How Do We Know? METRICS 2004
• Fenton and Pfleeger. Software Metrics: A rigorous & practical approach. Thomson Publishing 1997