DoP: 0090 EL DoP: 0090 B 1 - B 7 -- ETAG 001; 2013-04 ETA ...
)RADC-TR-80-360SIn-House Report
December 1980
STHEORETICAL AND EXPERIMENTAL STUDIES. OF HF DUCTED PROPAGATION
Terence J. Elkins
Kurt Toman
Gary S. Sales
APPROVED FOR PUBLIC RELEASE; DISTRIBUTION UNLIMITED
MAY I
AROME AIR DEVELOPMENT CENTER
o Air Force Systems CommandGriffiss Air Force Base, New York 13441
15 0%0090-
This report has been reviewed by the RADC Public Affairs Office (?A) "W
is releasable to the National Technical Informtion Service (NTIS). At NTSit will be releasable to the general public, including foreign nations.
RADC-TR-80-360 has been reviewed and is approved for publication.
APPROVED:
TERENCE J. ELKINS, Acting ChiefPropagation BranchElectromagnetic Sciences Division
APPROVED:
ALLAN C. SCHELL, ChiefElectromagnetic Sciences Division
FOR THE COMMANDER:
JOHN P. RUSSActing Chief, Plans Office
If your address has changed or if you wish to be removed from the RADC laill"list, or if the addressee is no longer employed by your organization, ploasenotify RADC (ER), Hanscom APR MA 01731. This will assist us in saintainia acurrent mailing list.
Do not return this copy. Retain or destroy.
UnclassifiedSECURITY CLASSIFICATION OF THIS PAGE r^- .. El..d _________________
REPOT DCIJMNTAION AGEREAD INSTRUCTIONSREPOT WMENTAION AGEBEFORE COMPLETING FORM
2. GOVT ACCESSION No. 3. RECIPIENT'S CATALOG N'JMBFR
RADC-TR - 703lYLE(andS,..eiflS. TYPE Of: REPORT a PERIOD COVERED
-- TEORETICA L A ND PERIMENTA L In-houseUDIESOFBy DUG TED V!ROPAGATION G. PERFORMING 01G. REPORT NUMBER
7 U4101r. 8. CONTRACT OR GRATNMB.,
JV~erence J. )Elkins J N L
Kurt/TomanGary S. Sales
ANZAIO NMEAND ADDRESS 10. PROGRAM ELEMENT. PROJECT. TASKAREA & WORK UNIT NUMBEDeuy o Eetrnc Technology (RACEP 6aFs7/'
Hanscom A FE =2Massachusetts 01731 )1j60311. CONTROLLING OFFICE NAME AND ADDRESS _. tr
Deputy for Electronic Technology (RADC/EEP)C 7 eceNM -N-Hanscom AFB3-iMP O AE
Massachusetts 01731 614. MONITORING AGENCY NAME & ADDRESS(If different from~ Controlling Ofi,.) IS. SECURITY CLASS. (of thi report
IA. DISTRIBUTION STATEMENT (of this. Report)
Approved for public release; distribution unlimited.
17. DISTRIBUTION STATEMENT (of th. abstract en~tered in Block 20. it different Inmeo Report)
1S. SUPPLEMENTARY NOTES
19. KEY WORDS (Cwthtlo Onl reverse ad* It noeseary end identify by block n,omber)
High frequency Scattering
modispieroueoeh oopei -ego vrPatvle ooao
Signals originating from these radars were received at field sites inLos Alamos, New Mexico, and Alamosa, Colorado. It has been surmisedthat signals could arrive at these sites by several types of propagation
DO I AN'73 1473 EDITION OF I NOV639 IS O§IOLETt UnclassifiedSECURITY CLASSIFICATION Or THIS PAGE (111ftet Dat* MW~ea
3Q %u
UnclassifiedSECURITY CLASSIFICATION OF THIS PAGE(1tfl boa Et.,EMO
20. Abstract (Continued)
o bmechanisms; for example, conventional multihop propagation along a great-circle path with or without final-hop scattering from the artificial irregu-larity volume. In another mechanism, likely to be operative for theAustralian transmission, the signal at times was expected to be ducted inthe F-region of the ionosphere, arrive at the artificial irregularity volumewith the propagation vector being nearly horizontal, and be backscatteredtoward the receiving sites. For comparison, characteristics of round-the-world signals are identified.
- 'Considerations of scattering from artificially induced field-alignedionospheric irregularities are presented. The interpretation of results isfacilitated by a numerical study in which raytracing through computationallyspecified model ionospheres is employed. Ducting predictions are describedusing the potential field technique. Propagation losses are estimated fromraytracing through ionospheric models. The detection of ducted signals bymeans of an artificially induced scatter volume is shown to be possible.
UnclassifiedSECURITY CLASSIFICATION Ow 1-, AGE rMh" Dop EW.
Preface
Many individuals and organizations contributed to the research reported here:
Mr. R. Freymann of the Los Alamos Scientific Laboratories provided generous
support in making available the Los Alamos receiving site and other logistic sup-
port; the Department of Supply of the Australian Government provided the trans-
missions from Salisbury; Mr. R. Philbrick of Air Force Geophysics Laboratory
made available unpublished satellite data providing ionospheric electron density
profiles; the Surveillance Division of RADC provided transmissions from the
Ava, NY site; SRI International, under contract to RADC, contributed the re-
sources of the Wide Aperture Radar Facility (WARF), scientific personnel and
other logistic support; the Institute of Telecommunications Sciences, under con-
tract to RADC reactivated and operated the Platteville heater, participated in the
installation and operation of the receiving sites and performed data analysis; The
ARCON corporation under contract to RADC, performed mcst of the computer
programming associated with the ionospheric radio propagation simulation. With
so many participants, it is impractical to name all of the individuals involved
whose efforts contributed to the project. The authors offer their sincere appreci-
ation and thanks to all of these contributors and their organizations without whom,
it need hardly be said, these experiments would have been impossible.
es , ni oil ?orDT IS GRA&IDTIC TABU oannounced 0Ju;ti fioatior ,
DistrlbUtion/
Availability Codes
_ Avail and/or
D Special
Contents
1. INTRODUCTION 9
2. GENERAL THEORETICAL CONSIDERATIONS 11
2.1 Potential Field Analogy 122.2 Illustration of Potential Field Techniques 152.3 Coupling to Duct Mode Propagation 252.4 Raytracing Through Natural Gradients 262.5 Scattering from Irregularities 282.6 Propagation Loss Evaluation 33
3. GROUND-BASED PROPAGATION EXPERIMENTS 35
3. 1 Round-the-World (RTW) Propagation 353.2 Long-range Propagation 43
4. ANALYSIS and INTERPRETATION 59
5. CONCLUSION 60
REFERENCES 63
Illustrations
1. Schematic Display of Chordal and Ducted Mode 10
2. Schematic Display of Potential Function for Two-LayerIonosphere 13
5
-W~d mo-
Illustrations
3. Mid-latitude Electron Density Height Profile Averaged fromDirect Ion Probe Measurements on Board the Satellite S3-1 14
4. Potential Functions for the Ionosphere of Figure 3 That Displaythe Changes with Operating Frequency 15
5. Computed Time Variation of the Maximum and Minimum of theF-region Critical Frequencies (foF2) Along a ParticularPropagation Path for Medium and High Sunspot Number 16
6. Computed Electron Density Height Contours Along a ParticularPropagation Path 17
7. Computed Contours of F-region Critical Frequencies (foF2)Spanned by Distance and Time (UT) for a ParticularPropagation Path (SSN = 150) 18
8. Computed Contours of F-region Critical Frequencies (foF2)Spanned by Distance and Time (UT) for a ParticularPropagation Path (SSN = 50) 19
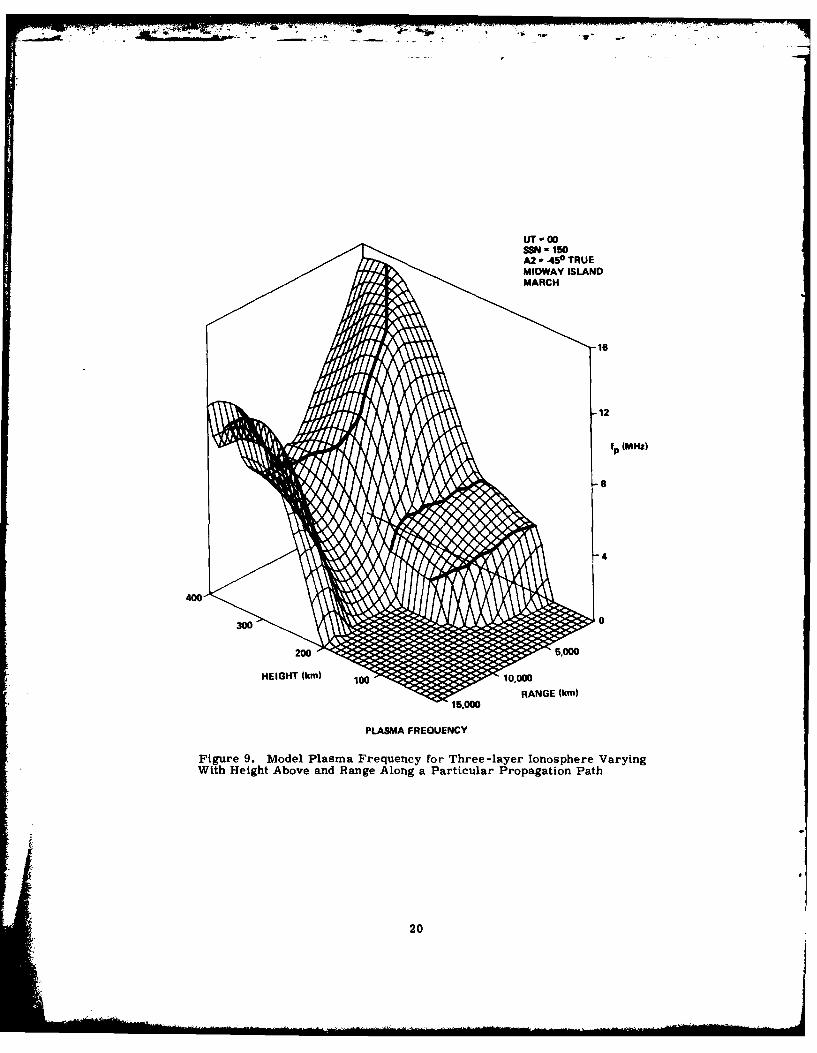
9. Model Plasma Frequency for Three-Layer Ionosphere Varyingwith Height Above and Range Along a Particular PropagationPath 20
10. Isometric Display of Potential Function for Ionosphere ofFigure 9 Using Operating Frequency of 20 MHz 21
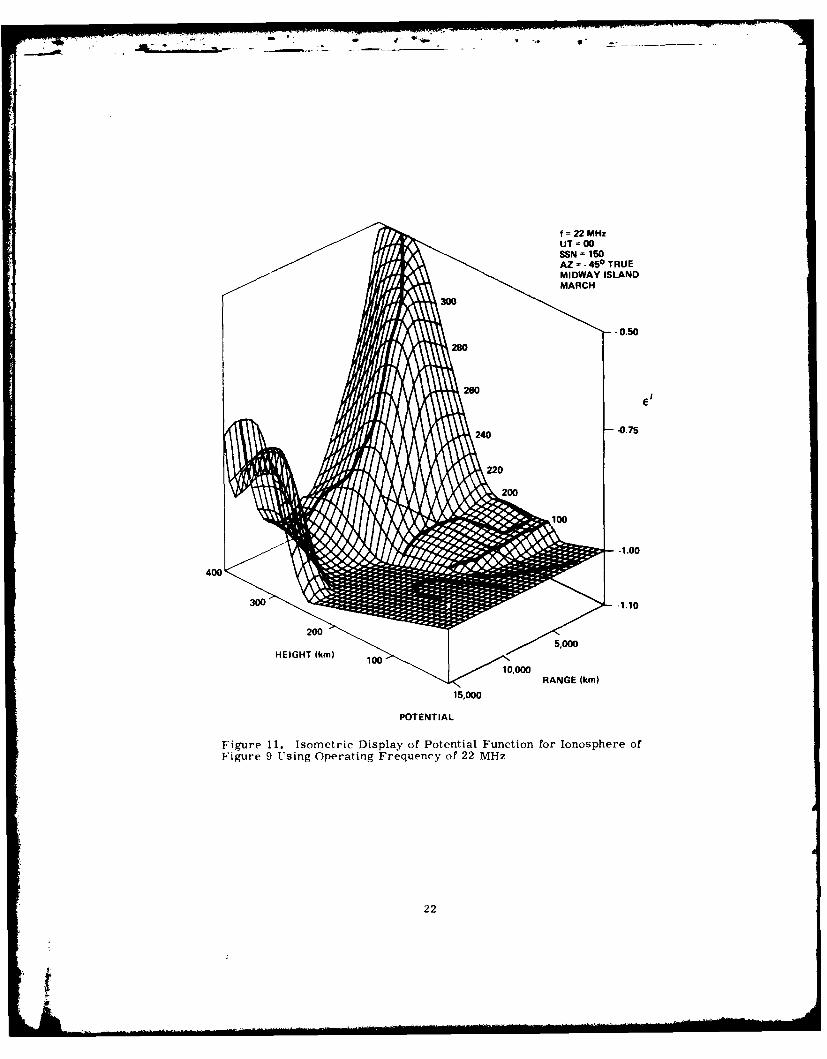
11. Isometric Display of Potential Function of Ionosphere ofFigure 9 Using Operating Frequency of 22 MHz 22
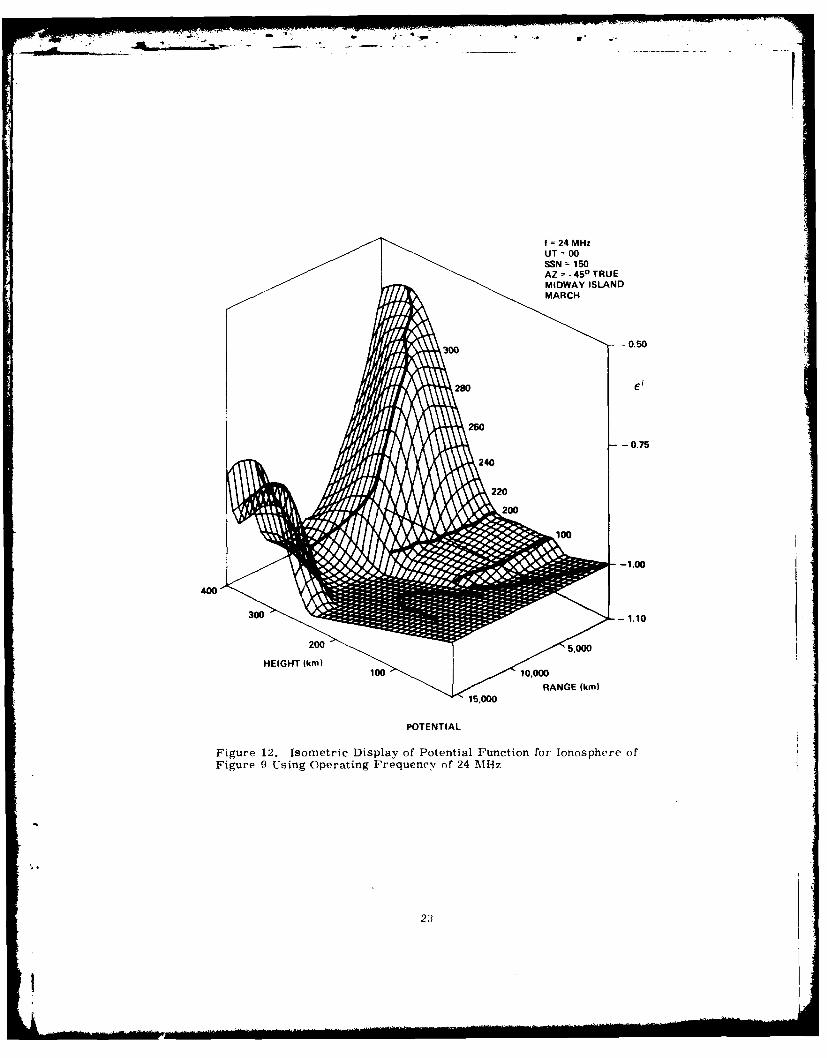
12. Isometric Display of Potential Function for Ionosphere ofFigure 9 Using Operating Frequency of 24 MHz 23
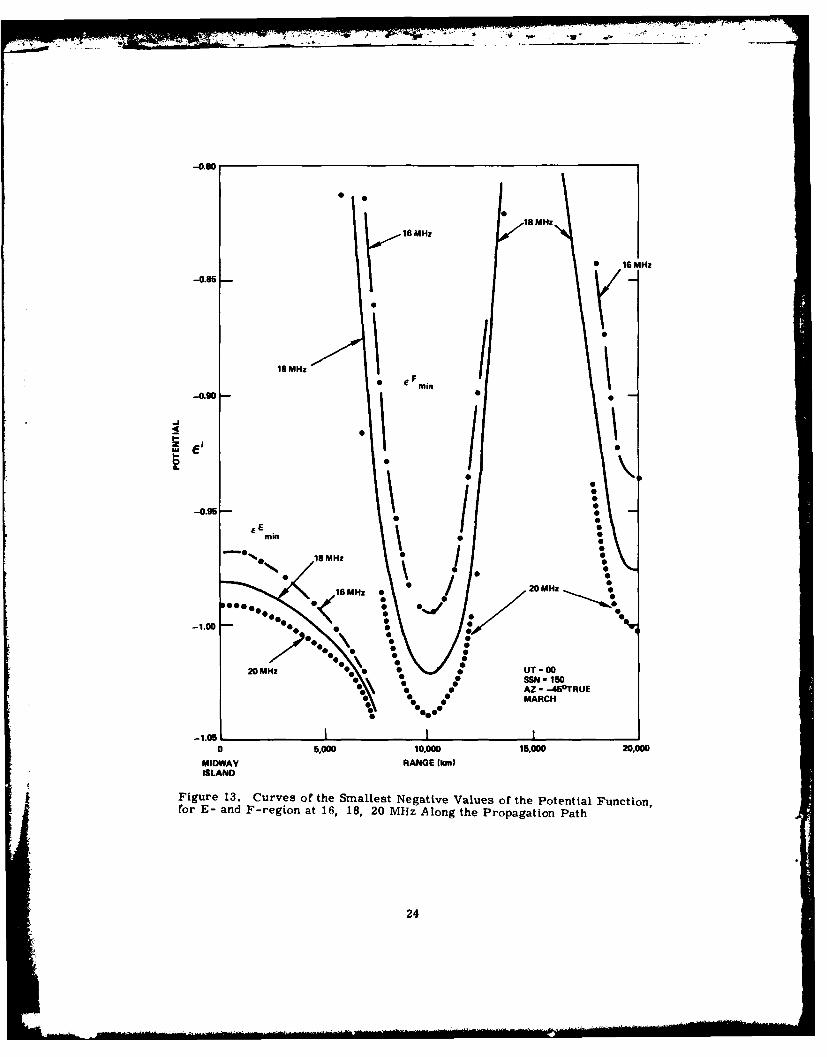
13. Curves of the Smallest Negative Values of the PotentialFunction, for E- and F-region at 16, 18, 20 MHz Alongthe Propagation Path 24
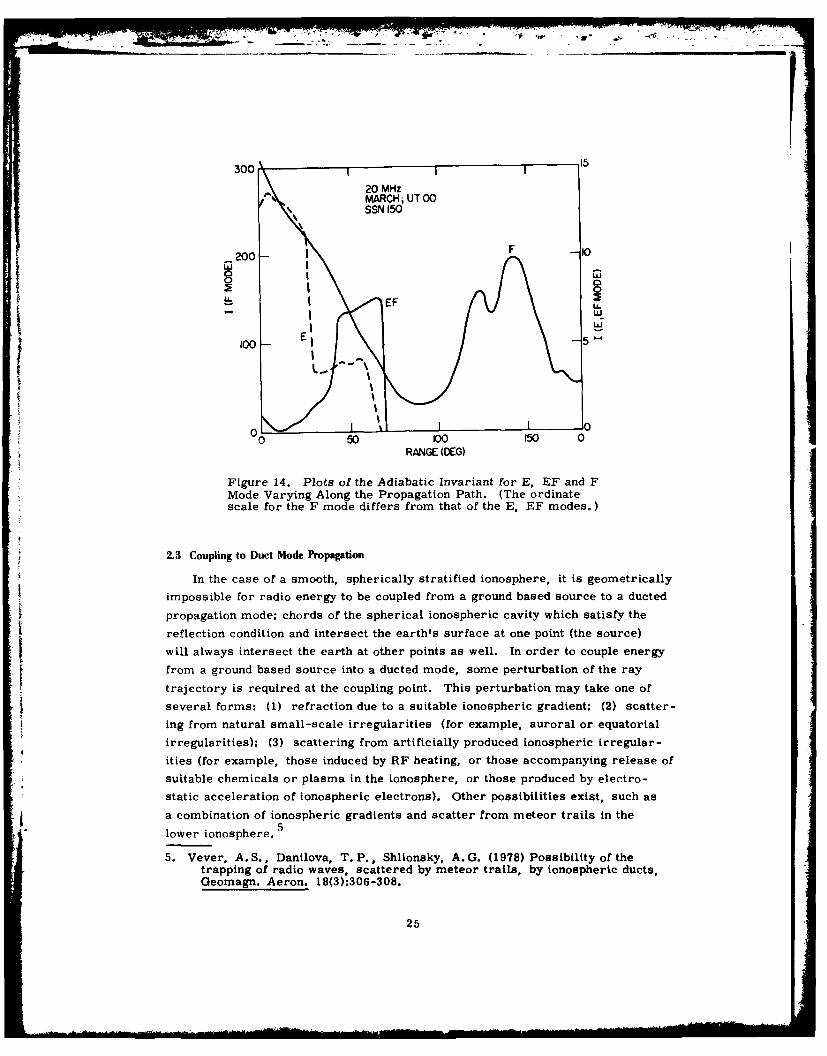
14. Plots of the Adiabatic Invariant for E, EF and F Mode VaryingAlong the Propagation Path 25
15. Progression of Solar Terminator Toward Transmitter 26
16. Sequence of Three-Dimensional Numerical Raytracings ThroughModel Ionosphere at Four Local Times for a Fixed Transmitter 27
17. Scattering Geometry for Reradiation of Incident ElectromagneticWaves by Elongated Irregularities 30
18. Normalized Reradiated Power as a Function of Scatter Angle forRanges of Transverse Irregularity Dimension I andAnisotropy r)(X = 10 m) 31
19. Normalized Reradiated Power as a Function of Scatter Angle forRanges of Transverse Irregularity Dimension I andAnisotropy r7(X = 20 m) 31
20. Computed Wavelength Dependence of Aspect Sensitivity NearOrthogonality (0 -. 0) 32
21. Sample Illustration of Propagation Loss, Computed for DifferentTransmitter Heights, Over a 10, 000 km Propagation Path 34
22. Round-the-world Echo of FM/CW Signal Radiated Northwardfrom Ava, NY and Received at Verona, NY About 137.5 mseclater 36
-6
II
Illustrations
23. Observed Maximum and Minimum Frequencies in Megahertzkof Round-the-world Echoes and Their Group Delays in
Milliseconds 37
24. Round-the-world Echo of FM/CW Signal Radiated Eastwardfrom Ava, NY and Received at Los Alamos, New Mexico 38
25. Round-the-world Echo of FM/CW Signal Radiated Westwardfrom Ava, NY and Received at Los Alamos, New Mexico 39
26. Sep 18, 1978 Ava - Los Alamos. Observed Maximum andMinimum Frequencies in Megahertz of Round-the-worldEchoes and Their Group Delays in Milliseconds 40
27. Sep 19, 1978 Ava - Los Alamos, Lost Hills - Los Alamos.Observed Maximum and Minimum Frequencies inMegahertz of Round-the-world Echoes and Their GroupDelays in Milliseconds 40
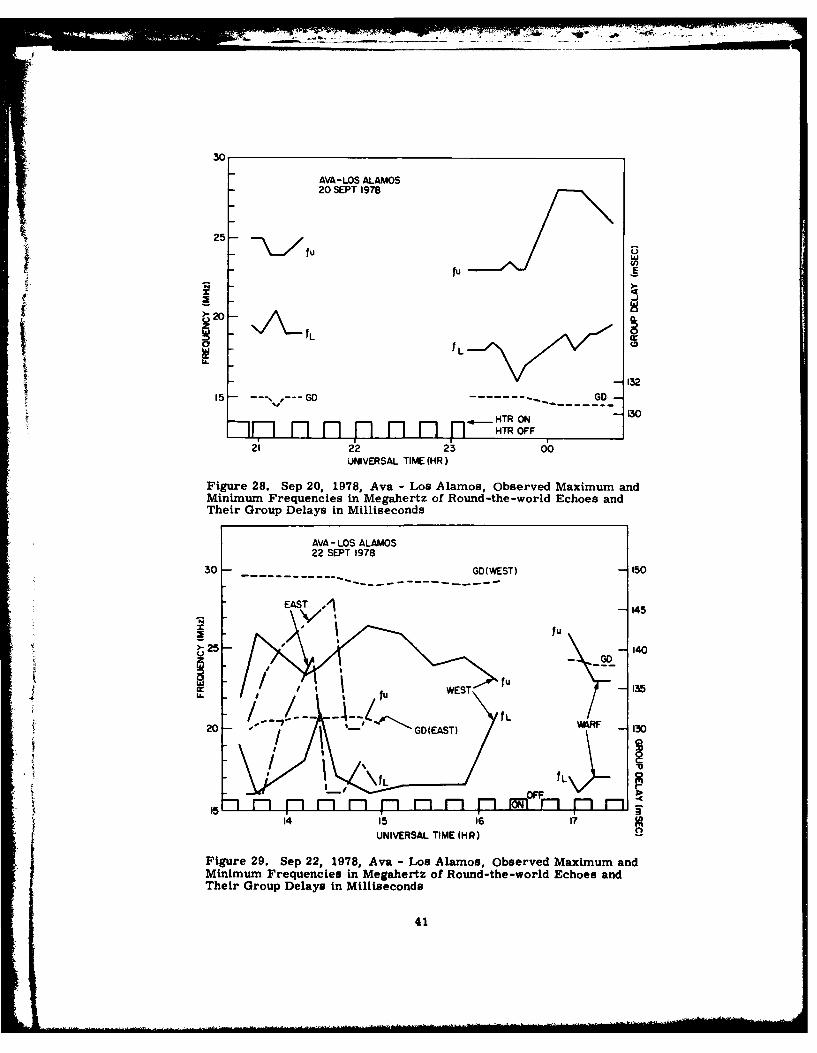
28. Sep 20, 1978 Ava - Los Alamos. Observed Maximum andMinimum Frequencies in Megahertz of Round-the-worldEchoes and Their Group Delays in Milliseconds 41
29. Sep 22, 1978 Ava - Los Alamos. Observed Maximum andMinimum Frequencies in Megahertz of Round-the-worldEchoes and Their Group Delays in Milliseconds 41
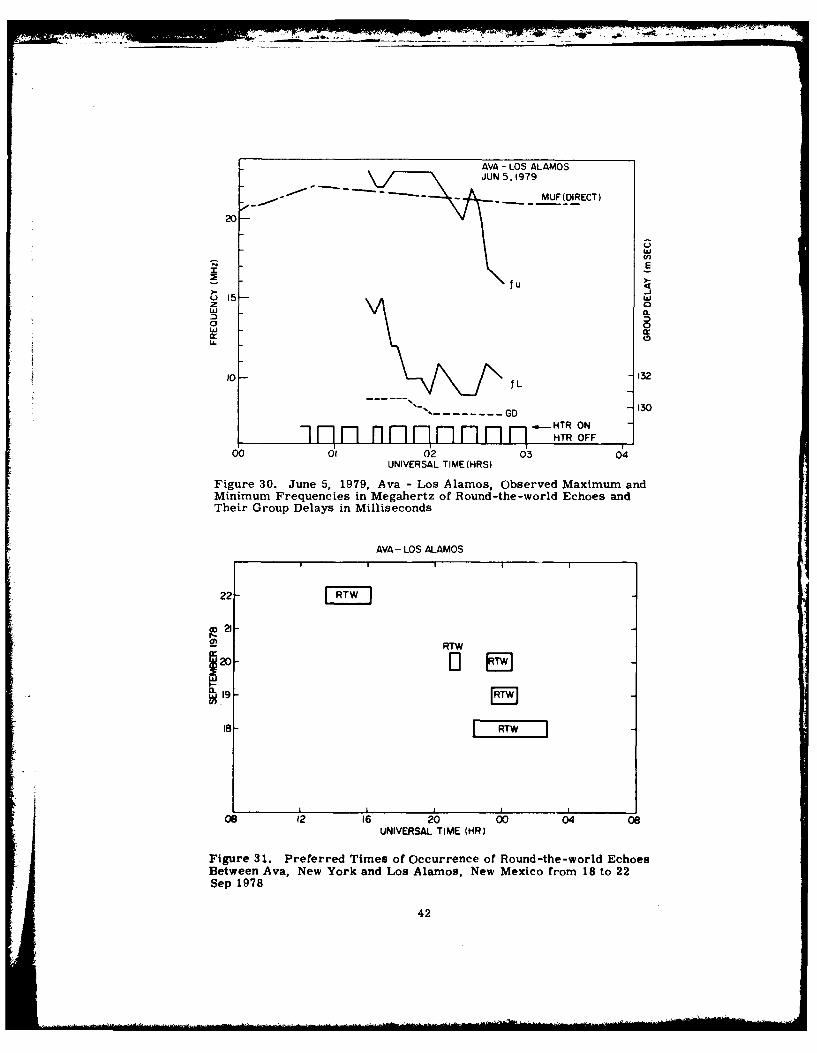
30. June 5, 1979 Ava - Los Alamos. Observed Maximum andMinimum Frequencies in Megahertz of Round-the-worldEchoes and Their Group Delays in Milliseconds 42
31. Preferred Times of Occurrence of Round-the-world EchoesBetween Ava, New York and Los Alamos, New Mexicofrom 18 to 22 Sep 1978 42
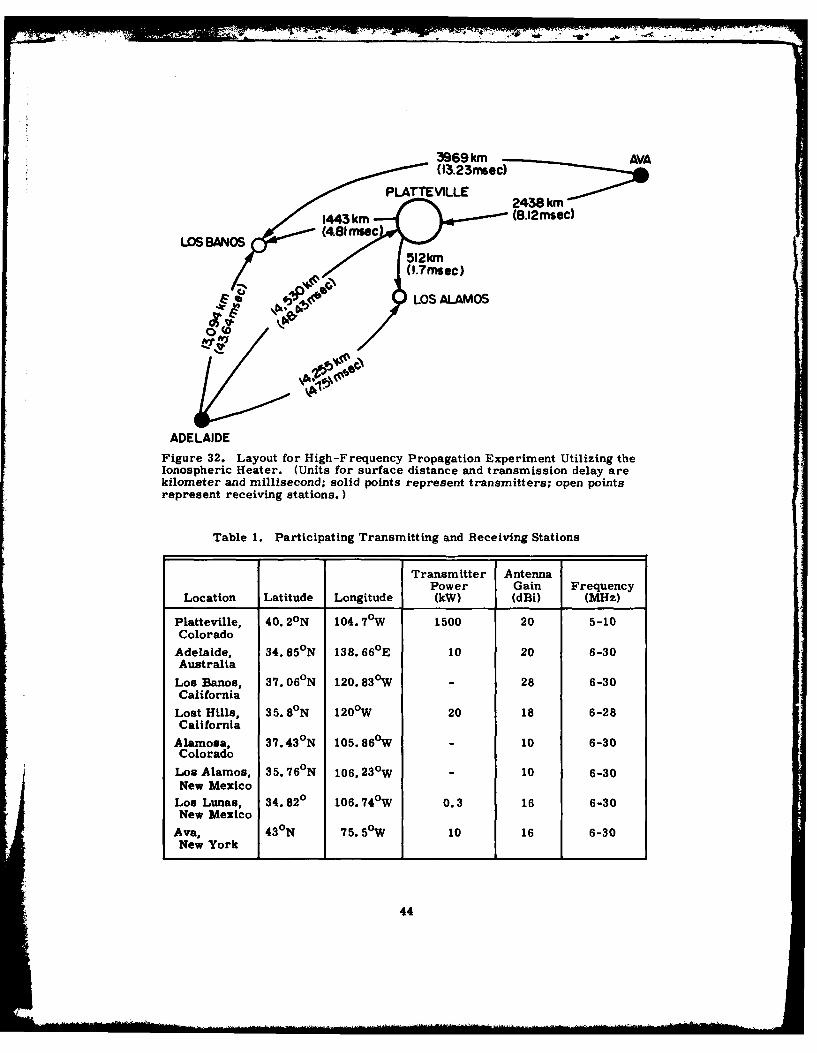
32. Layout for High-Frequency Propagation Experiment Utilizingthe Ionospheric Heater 44
33. Loci of Scattering Cones, Including Refraction, Intersectingthe Surface of the Earth 46
34. The Azimuthal Configuration Over Platteville, Colorado,Pertaining to the Scattering Loci, the Magnetic Meridianand the Direction Toward Adelaide, Australia 47
35. Loci of Scattering Cones with Refraction for f = 18 MHzand Two Azimuths Illustrating the Location of the LociNorth and South of Los Alamos 48
36. Effect of Elevation Angle of Ray Arriving at Irregularity °Height with Elevation Angle of +50 (from above) and -5(from below) With Respect to the Horizontal 49
37. Wide Aperture Research Facility (WARF) BackscatterSounding (Shows Direct Scatter from the Heated Volumeabove Platteville and the Effects of Azimuthal Scanningon the Delay Spread) 52
7
Illustrations
38. Nighttime Ionograms from SRI's Lost Hills Transmitterfor 27 April 1979 (Shows Line-of-sight Echo from theHeated Volume above Platteville When the Heater isOn (0740 UT) and Off (0735 UT)) 54
39. Map of the World Showing the Great-circle-path Defined byAdelaide and Platteville 55
40. Oblique Ionograms for the Australia to Los BanosPropagation Path With Platteville Heater Off (Top)and On (Bottom) 56
41. Oblique Ionograms for the Australia to Los AlamosPropagation Path with Platteville Heater Off (Top)and On (Bottom) 58
42. Ionospheric Contours Characterized by Plasma Frequencyin Megahertz, Derived from Ionospheric Model IONCAPfor April, 0700 UT for the Path from Salisbury,Australia to Los Alamos, New Mexico 59
Table
1. Participating Transmitting and Receiving Stations 44
8
Theoretical and ExperimentalStudies of HF Ducted Propagation
1. INTRODUCTION
The propagation of high frequency (HF) radio energy in so-called "non-
classical" modes, that is, in modes other than the conventional earth-ionosphere
hops, has recently attracted a great deal of attention. This report deals with two
such propagation modes, the chordal and ducted, often grouped together under the
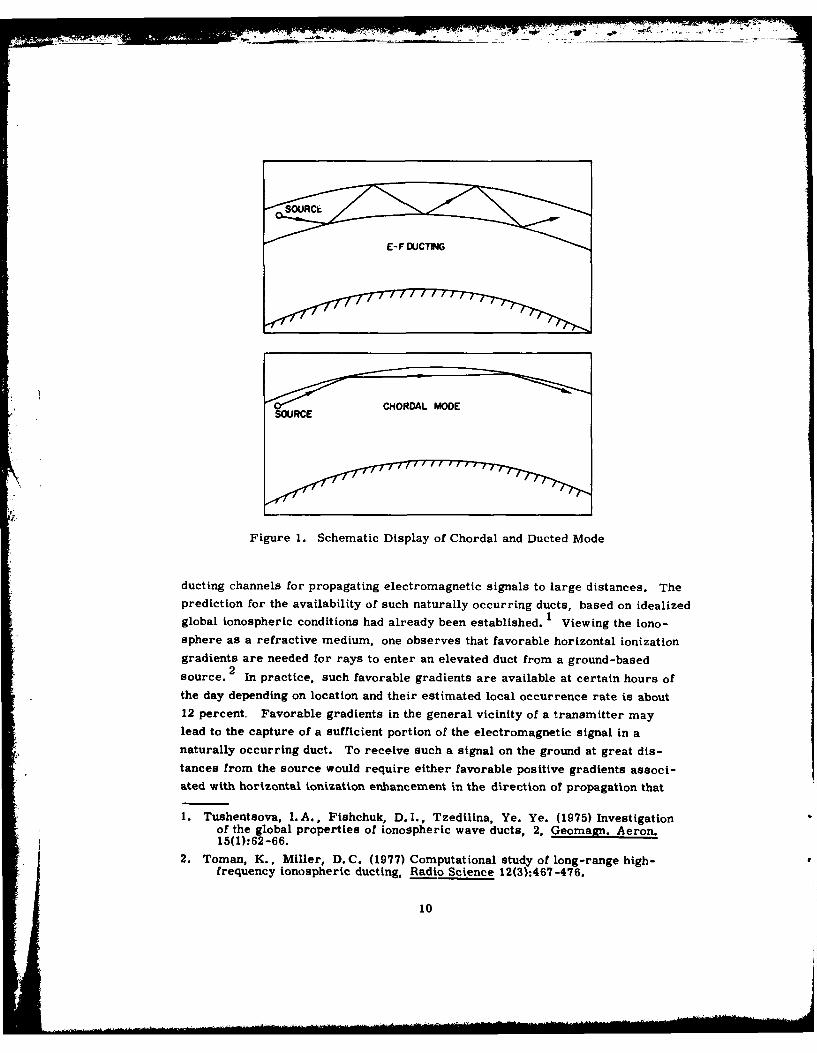
generic term "ducting." Figure 1 illustrates the two different modes schemat-
ically; note that the chordal mode is a special case of a ducted mode. Numerical
calculations and computer propagation simulations are described. New data on
the details of the vertical profile of the lower ionosphere are incorporated into
some of these calculations. The question of how HF energy can be coupled into
elevated ducts from a ground based source is examined in detail. Absorption
losses in ducts are estimated using specially adapted raytracing procedures.
A number of different but related experiments are described in which attempts
have been made to measure some of the properties of ducted propagation modes.
In some of these, natural ionospheric gradients were used to inject energy into
ducts, while in others a hgh power ionospheric heater/modifier was used as a
means of mode coupling.
In 1976, the concept emerged in the Propagation Branch of the Electromag-
netic Sciences Division to examine the possibility of using low-loss ionospheric
(Received for publication 21 November 1980)
9
SOURCECHORDAL MODESOURCE
Figure 1. Schematic Display of Chordal and Ducted Mode
ducting channels for propagating electromagnetic signals to large distances. The
prediction for the availability of such naturally occurring ducts, based on idealized
global ionospheric conditions had already been established. 1 Viewing the iono-
sphere as a refractive medium, one observes that favorable horizontal ionization
gradients are needed for rays to enter an elevated duct from a ground-based
source. 2 In practice, such favorable gradients are available at certain hours ofthe day depending on location and their estimated local occurrence rate is about
12 percent, Favorable gradients in the general vicinity of a transmitter may
lead to the capture of a sufficient portion of the electromagnetic signal in a
naturally occurring duct. To receive such a signal on the ground at great dis-
tances from the source would require either favorable positive gradients associ-
ated with horizontal ionization enhancement in the direction of propagation that
1. Tushentsova, I.A., Fishchuk, D.I., Tzedilina, Ye. Ye. (1975) Investigationof the global properties of ionospheric wave ducts, 2, Geomagn. Aeron.15(1):62-66.
2. Toman, K., Miller, D.C. (1977) Computational study of long-range high-frequency ionospheric ducting, Radio Science 12(3):467-476.
10
could bend a ray enough to reach the ground, or ionospheric irregularities that
might scatter a substantial portion of the electromagnetic signal to a receiver
at the ground.
Prevailing ionospheric ducting channels may not always be accessible to
transmissions originating from the ground. Local modification of the ionosphere
by radio frequency heating creates, however, ionospheric irregularities that
could, by a scattering process, deflect radio energy into an existing, elevated3ionospheric duct. Conversely, electromagnetic signals already trapped in such
a long-range duct could be ejected from the duct toward the ground by natural
and artificially induced ionospheric irregularities.
While in certain applications ionospheric modification may eventually be
required near both ends of a propagation path, the study described here was
conceived to examine the feasibility of successfully using an available radio
frequency heater to eject, with artificially created ionospheric irregularities,
ducted signals to the ground. For the path from Adelaide, Australia to Los
Alamos, advantage was taken of favorable ionospheric gradients near the trans-
mitter site at sunset. Conditions were enhanced by favorable gradients associ-
ated with the equatorial anomaly in the F-region ionosphere.
2. GENERAL THEORETICAL CONSIDERATIONS
In order to estimate the characteristics, availability, and behavior of iono-
spheric ducting channels, several techniques are available, each having its own
advantages and limitations. These techniques can be distinguished as 1) Numer-
ical raytracing through model ionospheres considered representative of condi-
tions occurring in nature; 2) pr-diagram obtained for a representative ionospheric
profile of a spherically symmetric medium without magnetic field and without
collisions; 3) potential field analogy for a representative ionospheric profile of
a spherically symmetric medium and its generalization to apply to an inhomo-
geneous medium. Departures from spherical symmetry generally pose no prob-
lems to numerical raytracing but tend to invalidate the use of the potential field
approach when inhomogeneities become severe. The pr-diagram remains strictly
applicable to a spherically symmetric medium only.
It is believed that the limitation imposed on the validity of raytracing is less
stringent than the constraint of the medium's spherical symmetry. Over the
short distances within which sudden changes in the refractive index would restrict
3. Gurevich, A.V., Tzedilina, Ye. Ye. (1976) Trapping of radiation in theionospheric duct during scattering on artificial inhomogeneities,Geomagn. Aeron. 15(6):713-715.
* 11
the use of raytracing, specification of the medium is not easily accomplished in
practice. When a propagation medium is specified for the purpose of raytracing,
care is taken in applying mathematical algorithms and profile specification func-
tions for multiple layers to assure that the refractive index varies slowly in all
directions.
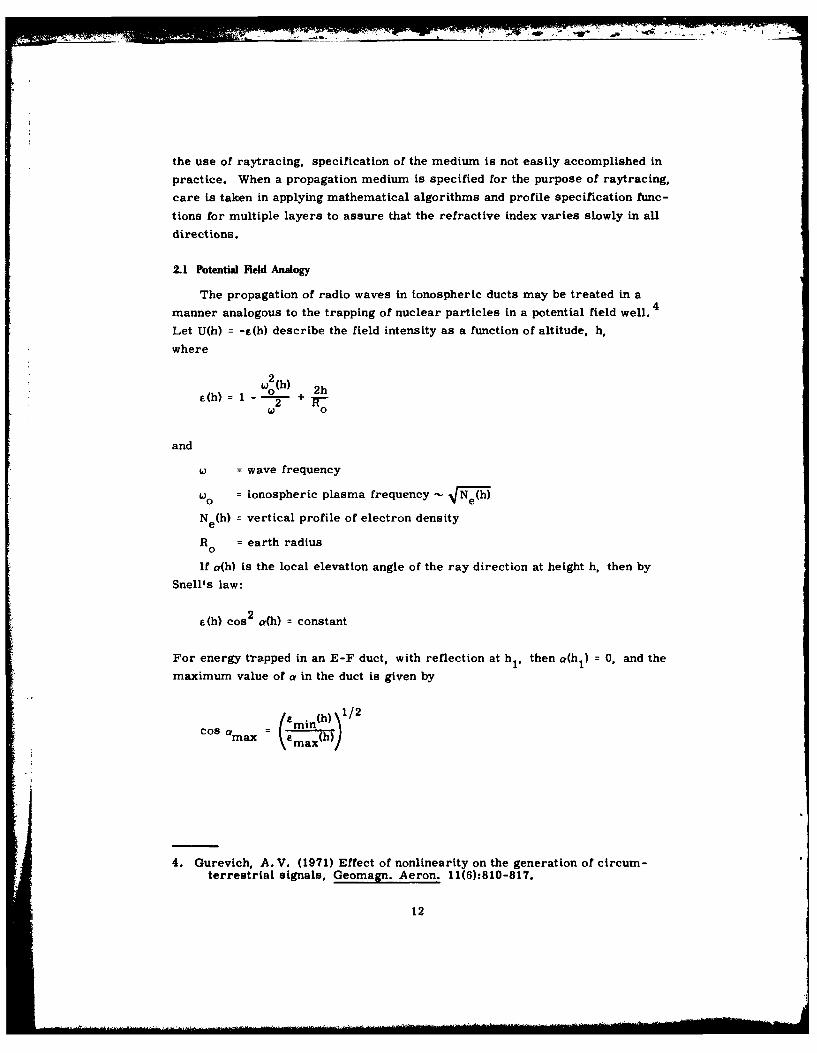
2.1 Potential Field Analogy
The propagation of radio waves in ionospheric ducts may be treated in a
manner analogous to the trapping of nuclear particles in a potential field well. 4
Let U(h) = -e(h) describe the field intensity as a function of altitude, h,
where
(2h wo(h) + 2h
a(h) 1t -2 I-to 0
and
and = wave frequency
W = ionospheric plasma frequency - 4Ne(h)
N e(h) = vertical profile of electron density
R = earth radius
If a(h) is the local elevation angle of the ray direction at height h, then by
Snell's law:
e(h) cos 2 a(h) = constant
For energy tr'apped in an E-F duct, with reflection at hl, then a(h1) = 0, and the
maximum value of a in the duct is given by
min(h) 1/2
cos amax = _ ma(h)
4. Gurevich, A. V. (1971) Effect of nonlinearity on the generation of circum-terrestrial signals, Geomagn. Aeron. 11(6):810-817.
12
An adiabatic invariant can be similarly defined, for a frequency f, as
hmaxrrf ax f [,(h, f) - min(h 1/2 dh
max hi
The value of the adiabatic invariant is proportional to the energy density in the
propagating mode at the frequency in question.
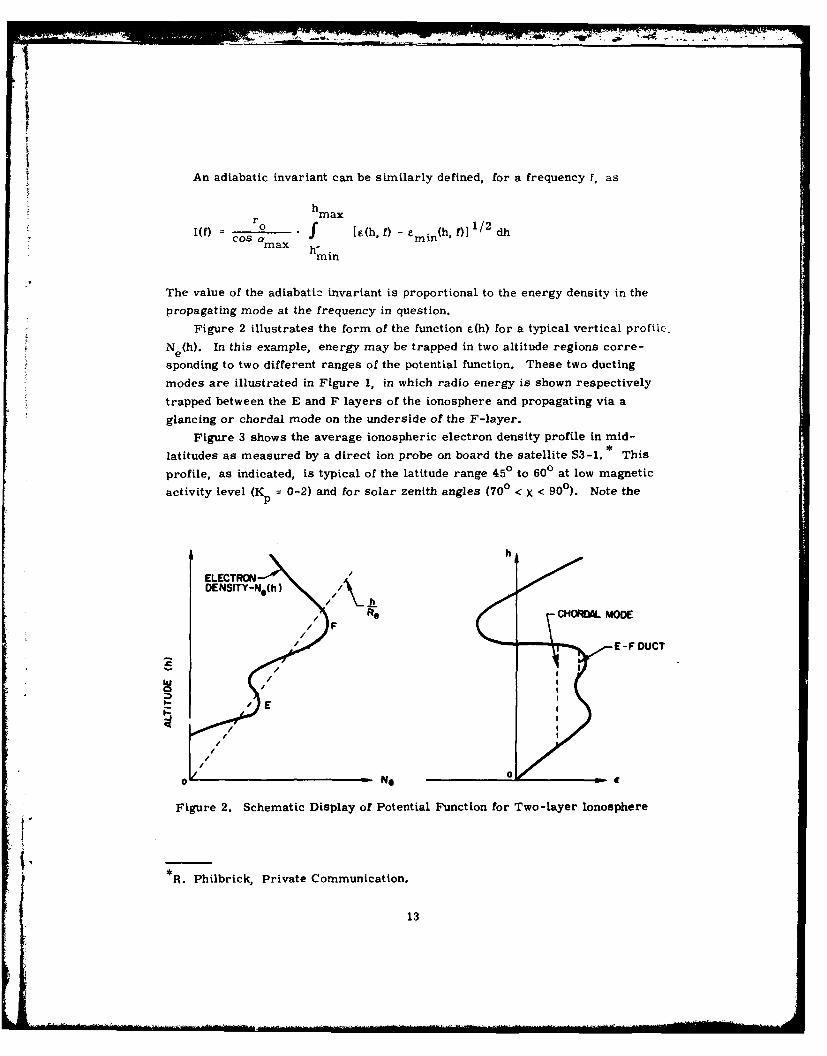
Figure 2 illustrates the form of the function e(h) for a typical vertical profile,
N e(h). In this example, energy may be trapped in two altitude regions corre-
sponding to two different ranges of the potential function. These two ducting
modes are illustrated in Figure 1, in which radio energy is shown respectively
trapped between the E and F layers of the ionosphere and propagating via a
glancing or chordal mode on the underside of the F-layer.
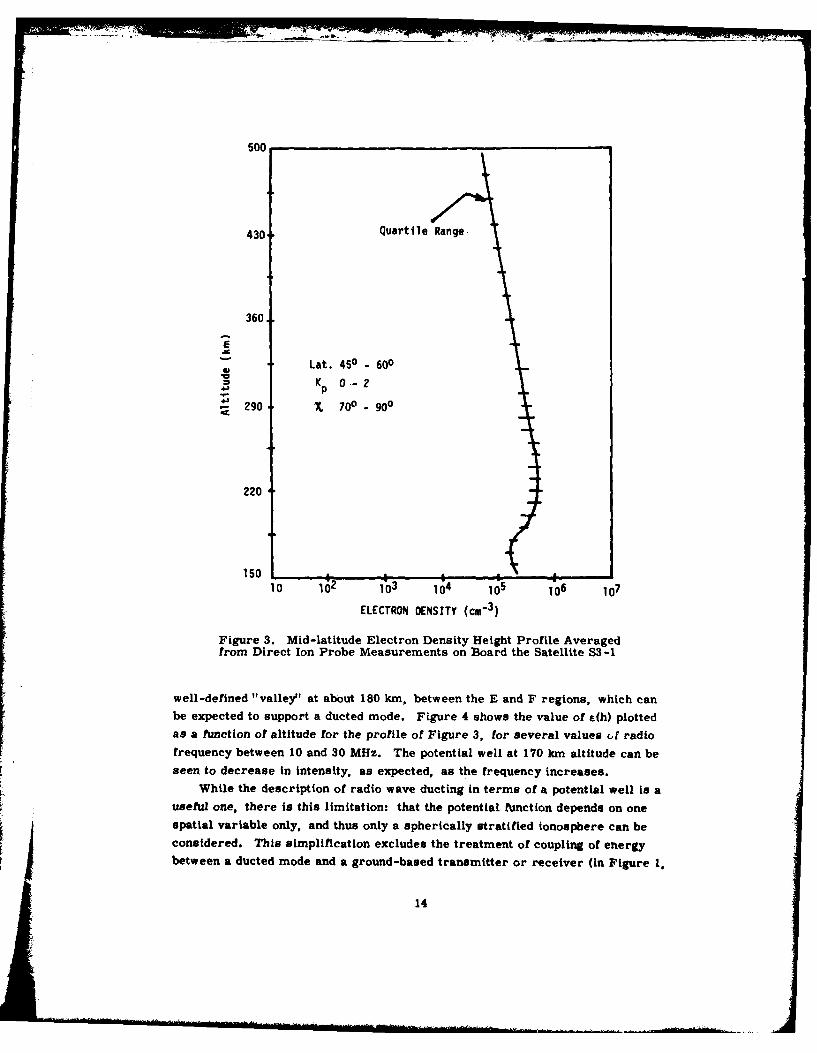
Figure 3 shows the average ionospheric electron density profile in mid-
latitudes as measured by a direct ion probe on board the satellite S3-1. * This
profile, as indicated, is typical of the latitude range 450 to 600 at low magnetic
activity level (Kp = 0-2) and for solar zenith angles (700 < x < 900). Note the
hELECTRONDENSITY-NO(h)
/ Re CHORDAL. MODE/F
S/ E-F DUCT
-E
/
/
0 No 0-
Figure 2. Schematic Display of Potential Function for Two-layer Ionosphere
*R. Philbrick, Private Communication.
13
500
430 Quartile Range
360
e
- Lat. 450 - 600
K 0.- 2
290 . 700-900
220
150 I
10 1 3 1 4 105 106 0
ELECTRON DENSITY (cm"3)
Figure 3. Mid-latitude Electron Density Height Profile Averagedfrom Direct Ion Probe Measurements on Board the Satellite S3-1
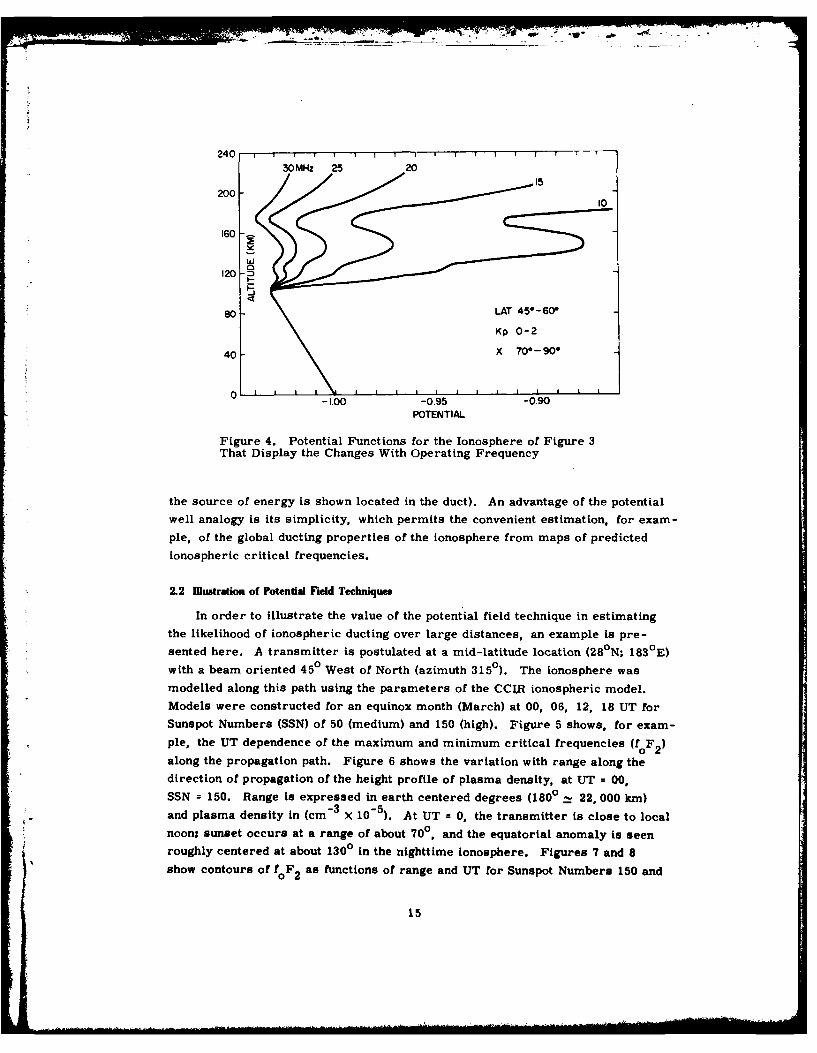
well-defined "valley" at about 180 km, between the E and F regions, which canbe expected to support a ducted mode. Figure 4 shows the value of a(h) plottedas a function of altitude for the profile of Figure 3, for several values (, radio
frequency between 10 and 30 MHz. The potential well at 170 km altitude can be
seen to decrease in intensity, as expected, as the frequency increases.
While the description of radio wave ducting in terms of a potential well is auseful one, there is this limitation: that the potential function depends on one
spatial variable only, and thus only a spherically stratified ionosphere can beconsidered. This simplification excludes the treatment of coupling of energybetween a ducted mode and a ground-based transmitter or receiver (in Figure 1.
14
240 I
30MHz 25 20
2005
1600
10
120 -
80 -LAT 45*-60*
Kp 0-2
40- X 70* -900
-1.00 -0.95 -090
POTENTIAL
Figure 4. Potential Functions for the Ionosphere of Figure 3That Display the Changes With Operating Frequency
the source of energy is shown located in the duct). An advantage of the potential
well analogy is its simplicity, which permits the convenient estimation, for exam-
ple, of the global ducting properties of the ionosphere from maps of predicted
ionospheric critical frequencies.
2.2 llustration of Potential Field Techniques
In order to illustrate the value of the potential field technique in estimatingthe likelihood of ionospheric ducting over large distances, an example is pre-
sented here. A transmitter is postulated at a mid-latitude location (28N0 1830 E)0 0with a beam oriented 45 West of North (azimuth 315 ). The ionosphere was
modelled along this path using the parameters of the CCIR ionospheric model.
Models were constructed for an equinox month (March) at 00, 06, 12, 18 UT for
Sunspot Numbers (SSN) of 50 (medium) and 150 (high). Figure 5 shows, for exam-
ple, the UT dependence of the maximum and minimum critical frequencies (foF 2 )along the propagation path. Figure 6 shows the variation with range along the
direction of propagation of the height profile of plasma density, at UT = 00,
SSN = 150. Range is expressed in earth centered degrees (1800 - 22, 000 km)-3 -5and plasma density in (cm X 10 ). At UT = 0, the transmitter is close to local
noon; sunset occurs at a range of about 700, and the equatorial anomaly Is seen
roughly centered at about 1300 in the nighttime Ionosphere. Figures 7 and 8
show contours of foF 2 as functions of range and UT for Sunspot Numbers 150 and
15
14
12 \
u 8 S-
SI
2- - -- SSN 150
SSN 50
12 18 24
UT(HR)
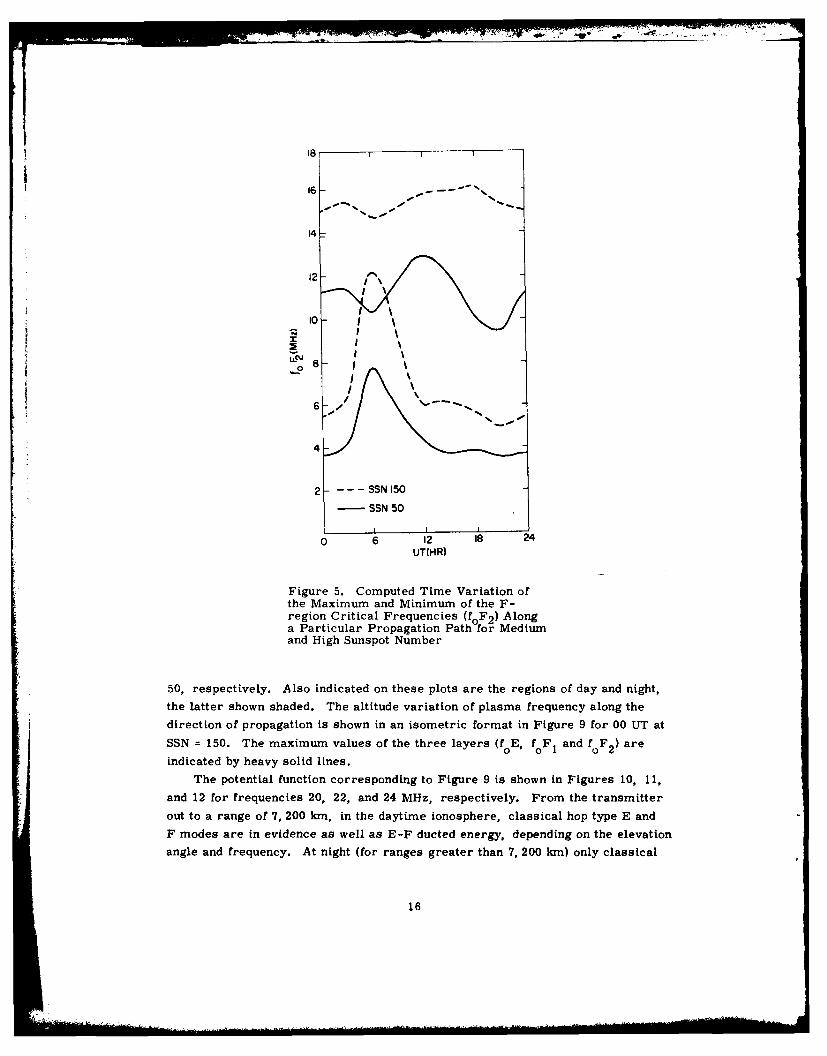
Figure 5. Computed Time Variation ofthe Maximum and Minimum of the F-region Critical Frequencies (f0 F 2 ) Alonga Particular Propagation Path for Mediumand High Sunspot Number
50, respectively. Also indicated on these plots are the regions of day and night,
the latter shown shaded. The altitude variation of plasma frequency along the
direction of propagation is shown in an isometric format in Figure 9 for 00 UT at
SSN = 150. The maximum values of the three layers (f 0 E, f 0 F 1 and f0 F 2 ) are
indicated by heavy solid lines.
The potential function corresponding to Figure 9 is shown in Figures 10, 11,
and 12 for frequencies 20, 22, and 24 MHz, respectively. From the transmitter
out to a range of 7, 200 km, in the daytime ionosphere, classical hop type E and
F modes are in evidence as well as E-F ducted energy, depending on the elevation
angle and frequency. At night (for ranges greater than 7, 200 kin) only classical
16
4oo
90 3
iIi
30o0
CONTOURS OF NoeX O'5 (CW"3 )
~MARCH
UT 00
045 90 135 ISO
RNGE (DEG)
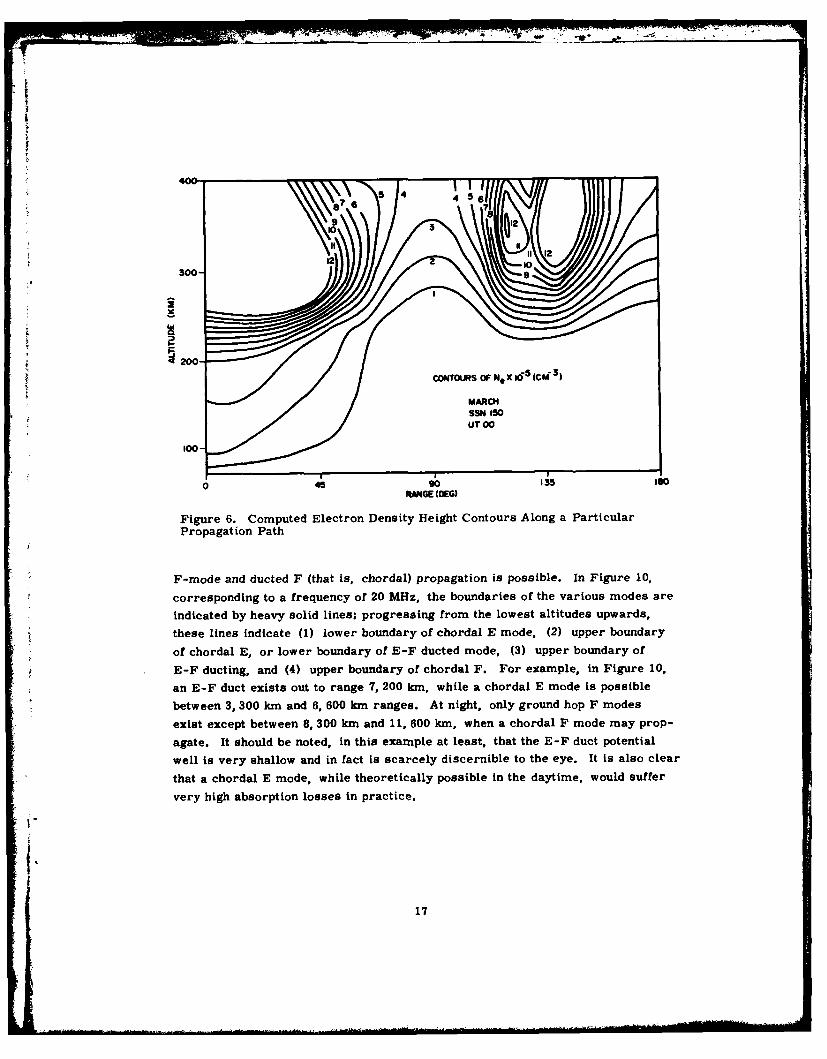
Figure 6. Computed Electron Density Height Contours Along a ParticularPropagation Path
F-mode and ducted F (that is, chordal) propagation is possible. In Figure 10,
corresponding to a frequency of 20 MHz, the boundaries of the various modes are
indicated by heavy solid lines; progressing from the lowest altitudes upwards,
these lines indicate (1) lower boundary of chordal E mode, (2) upper boundary
of chordal E, or lower boundary of E-F ducted mode, (3) upper boundary of
E-F ducting, and (4) upper boundary of chordal F. For example, in Figure 10,
an E-F duct exists out to range 7, 200 km, while a chordal E mode is possible
between 3, 300 km and 6, 600 km ranges. At night, only ground hop F modes
exist except between 8, 300 km and 11, 600 km, when a chordal F mode may prop-
agate. It should be noted, in this example at least, that the E-F duct potential
well is very shallow and in fact is scarcely discernible to the eye. It is also clear
that a chordal E mode, while theoretically possible in the daytime, would suffer
very high absorption losses in practice.
17
SSN 150
15,000
120
90 10,000 u03 ZzzZ 4
60-
5,000
30- -0
02 00 6 12 Is 24
UT (HR)
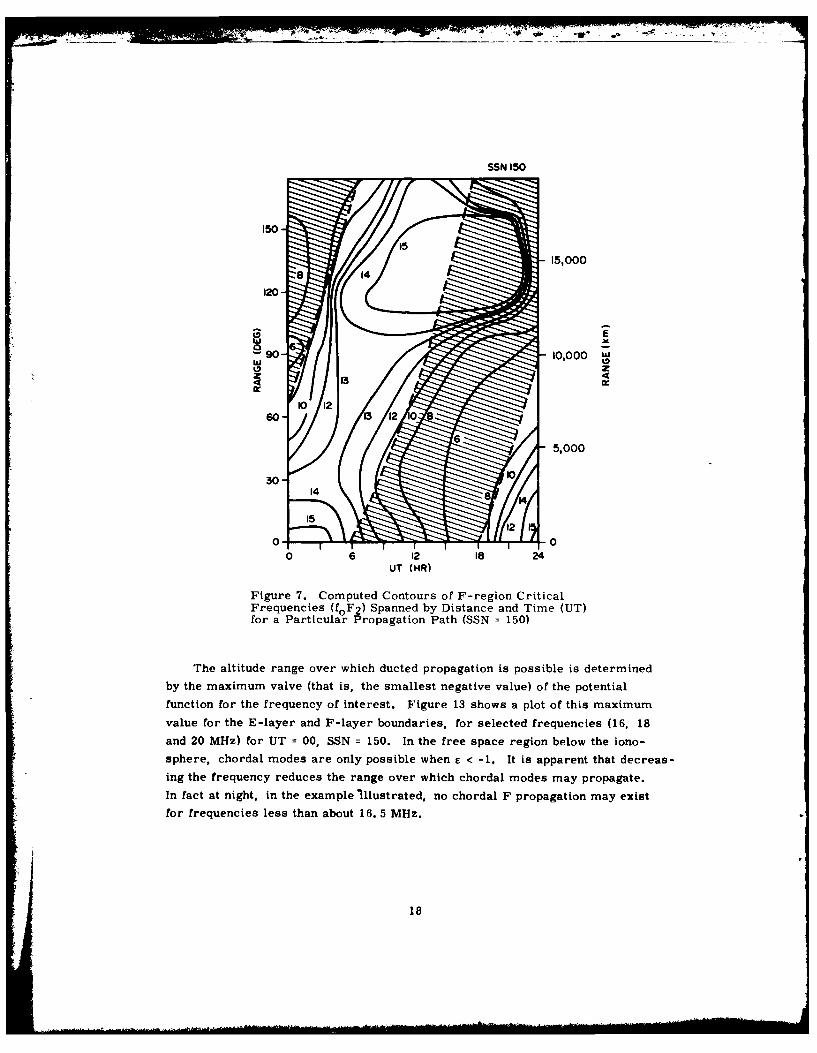
Figure 7. Computed Contours of F-region CriticalFrequencies (fF 2 ) Spanned by Distance and Time (UT)for a Particular Propagation Path (SSN = 150)
The altitude range over which ducted propagation is possible is determined
by the maximum valve (that is, the smallest negative value) of the potential
function for the frequency of interest. Figure 13 shows a plot of this maximum
value for the E-layer and F-layer boundaries, for selected frequencies (16, 18
and 20 MHz) for UT = 00, SSN = 150. In the free space region below the iono-
sphere, chordal modes are only possible when , < -1. It is apparent that decreas-
ing the frequency reduces the range over which chordal modes may propagate.
In fact at night, in the example illustrated, no chordal F propagation may exist
for frequencies less than about 16. 5 MHz.
18
SSNSO
15,000
120
90 10,000 W4z
60-
5,000
-0100
0 6 12 Is 24
UT (MR)
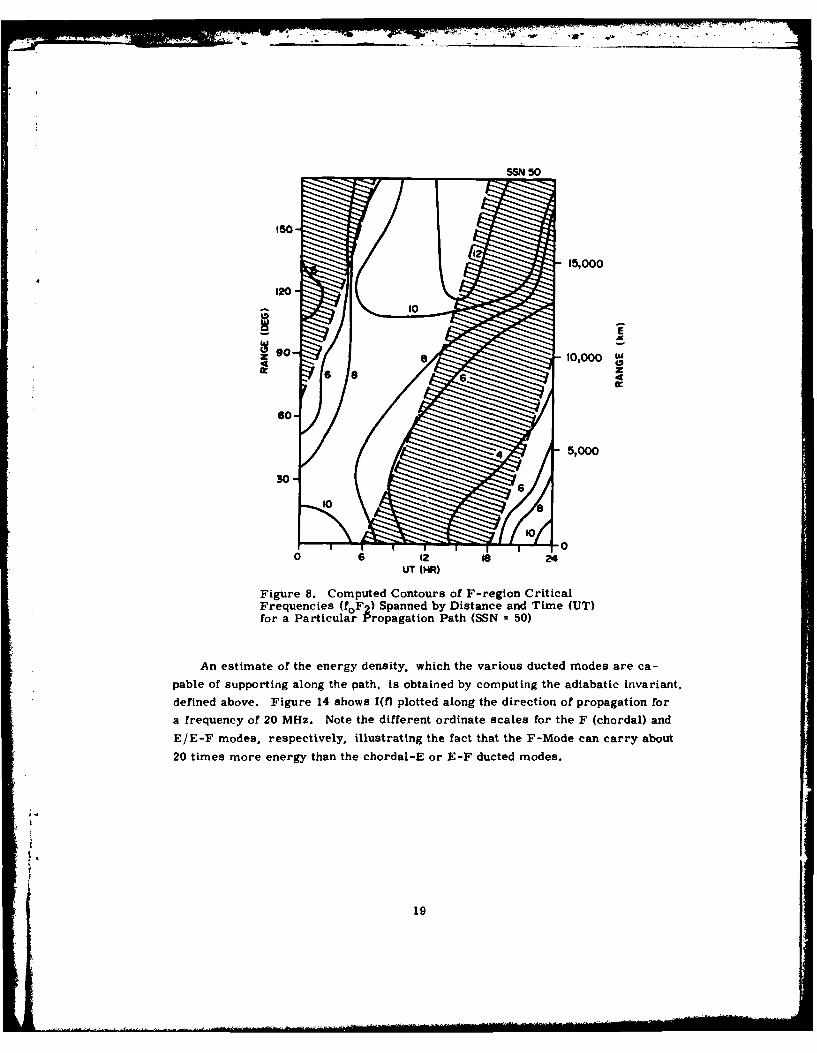
Figure 8. Computed Contours of F-region CriticalFrequencies (foF 2 ) Spanned by Distance and Time (UT)for a Particular Propagation Path (SSN = 50)
An estimate of the energy density, which the various ducted modes are ca-
pable of supporting along the path, is obtained by computing the adiabatic invariant.
defined above. Figure 14 shows I(f) plotted along the direction of propagation for
a frequency of 20 MHz. Note the different ordinate scales for the F (chordal) and
E/E-F modes, respectively, illustrating the fact that the F-Mode can carry about
20 times more energy than the chordal-E or E-F ducted modes.
19
UT-00~SSN - 150A2 - -5 TRUE
MIDWAY ISLANDMARCH
fp (MHz)
4
HEIGHT (kin) 100 10,000
RANGE (kin)15,000
PLASMA FREOUENCY
Figure 9. Model Plasma Frequency for Three-layer Ionosphere VaryingWith Height Above and Range Along a Particular Propagation Path
20

I- 20 MHzUT - 00SSN - 150
300 AZ -. 450 TRUEMIWYILAND
MARCH
-0.50
260
-2.0
F-MODES EXIST -1.10
15,0000
POTENTIAL
Figure 10. Isometric Display of Potential Function for Ionosphere orFigure 9 Using Operating Frequency of 20 MHz
21
LIT.000
3000
222
20
AZ =450 TRUEMIDWAY ISLAND
- 0.75
-1.0
100 10 00
15.0.00
40T0T A
Figur 12 smercDspa fPoeta.Fnto rInspeeo
Figur 5,sn0Oeain0rqunyof0 ~
HEIGHT (.3
10 0,0
-0.90
18 MHz18 MHz
0 16 MHz
-0.85 -
18 MHz I em
-0.90I
Z I
-0.95 0
00110 0 0 O O
mm.0 - 00000-00 0
50% M..z 0 5 0 T00 0 S 5
0 0
1, 00Z--5TU00.0 MA0CH
-1.00 0
foMr E- an F-eina 6 8 0 U~ ln h rpgt-ioPt
024SN'6
300 15
20 MHzMARCH; UT OOSSN 150
200 Fw ,\
o 0EF U_
-
I -- w
0 5I...
00 50 0DEG)
Figure 14. Plots of the Adiabatic Invariant for E, EF and FMode Varying Along the Propagation Path. (The ordinatescale for the F mode differs from that of the E, EF modes.)
2.3 Coupling to Duct Mode Propagation
In the case of a smooth, spherically stratified ionosphere, it is geometricallyimpossible for radio energy to be coupled from a ground based source to a ducted
propagation mode; chords of the spherical ionospheric cavity which satisfy the
reflection condition and intersect the earth's surface at one point (the source)
will always intersect the earth at other points as well. In order to couple energy
from a ground based source into a ducted mode, some perturbation of the ray
trajectory is required at the coupling point. This perturbation may take one of
several forms: (1) refraction due to a suitable ionospheric gradient; (2) scatter-
ing from natural small-scale irregularities (for example, auroral or equatorial
irregularities); (3) scattering from artificially produced ionospheric irregular-
ities (for example, those induced by RF heating, or those accompanying release of
suitable chemicals or plasma in the ionosphere, or those produced by electro-
static acceleration of ionospheric electrons). Other possibilities exist, such as
a combination of ionospheric gradients and scatter from meteor trails in thelower ionosphere. 5
5. Vever, A.S., Danilova, T. P., Shlionsky, A.G. (1978) Possibility of thetrapping of radio waves, scattered by meteor trails, by ionospheric ducts,Geomagn. Aeron. 18(3):306-308.
25
2.4 Raytracing Through Natural Gradients
In general, a decreasing electron density gradient in the direction of propa-
gation is required to couple energy from a ground based source into a ducted
mode (conversely, an increasing gradient is required for coupling from a ducted
mode to a ground based receiver). 2 Suitable gradients exist under commonly
occurring situations, such as crossing the solar terminator (day-night boundary
in the ionosphere), propagation through the polar and equatorial regions, and
traveling ionospheric disturbances. The frequency range and the range of eleva-
tion angles, over which trapping in ducts may take place, are functions of the
magnitude of the gradient and of the location of the irregularity relative to the
source on the ground.
Computations have been performed, using models of the ionosphere, together
with numerical raytracing procedures, to establish the range of frequencies and
elevation angles over which ducting can occur in typical cases. An example of
such a computation is presented here in which the influence of strong gradients
near sunset is considered.
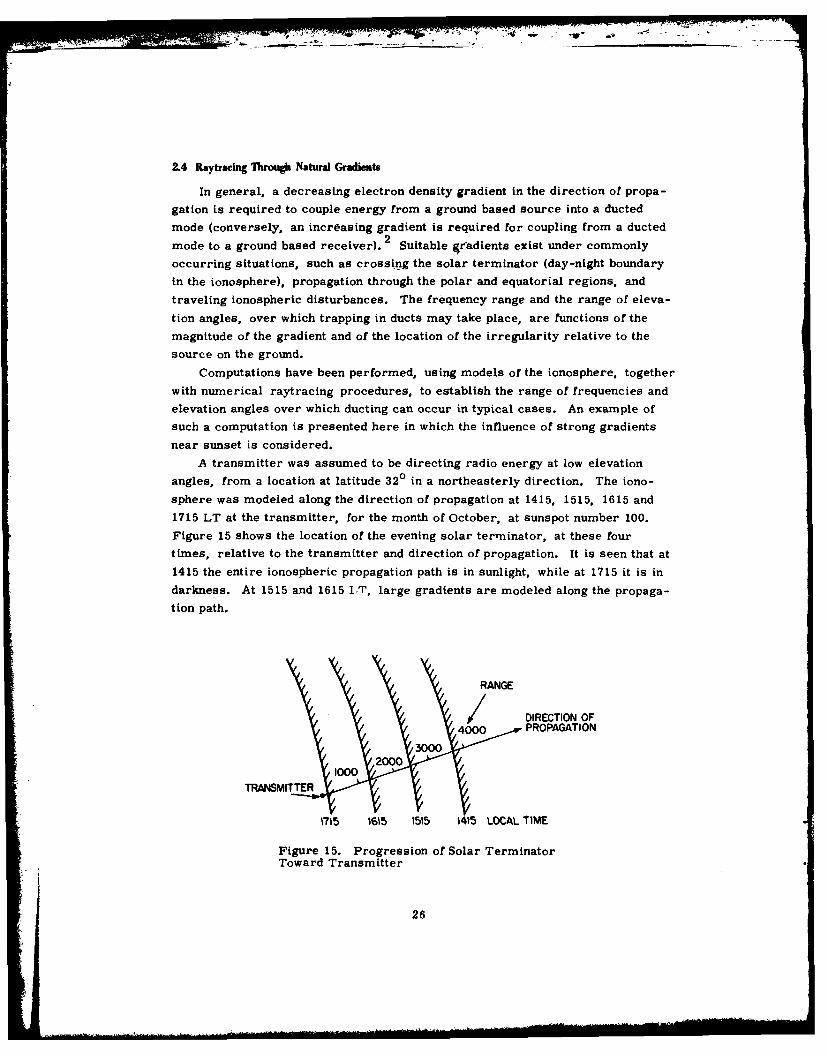
A transmitter was assumed to be directing radio energy at low elevation
angles, from a location at latitude 320 in a northeasterly direction. The iono-
sphere was modeled along the direction of propagation at 1415, 1515, 1615 and
1715 LT at the transmitter, for the month of October, at sunspot number 100.
Figure 15 shows the location of the evening solar terminator, at these four
times, relative to the transmitter and direction of propagation. It is seen that at
1415 the entire ionospheric propagation path is in sunlight, while at 1715 it is in
darkness. At 1515 and 1615 iT, large gradients are modeled along the propaga-
tion path.
RANGE
DIRECTION OF4000 PROPAGATION
30002000
1000TRANSMITTER
1715 1615 1515 1415 LOCAL TIME
Figure 15. Progression of Solar TerminatorToward Transmitter
26
-C . -. 14. 7
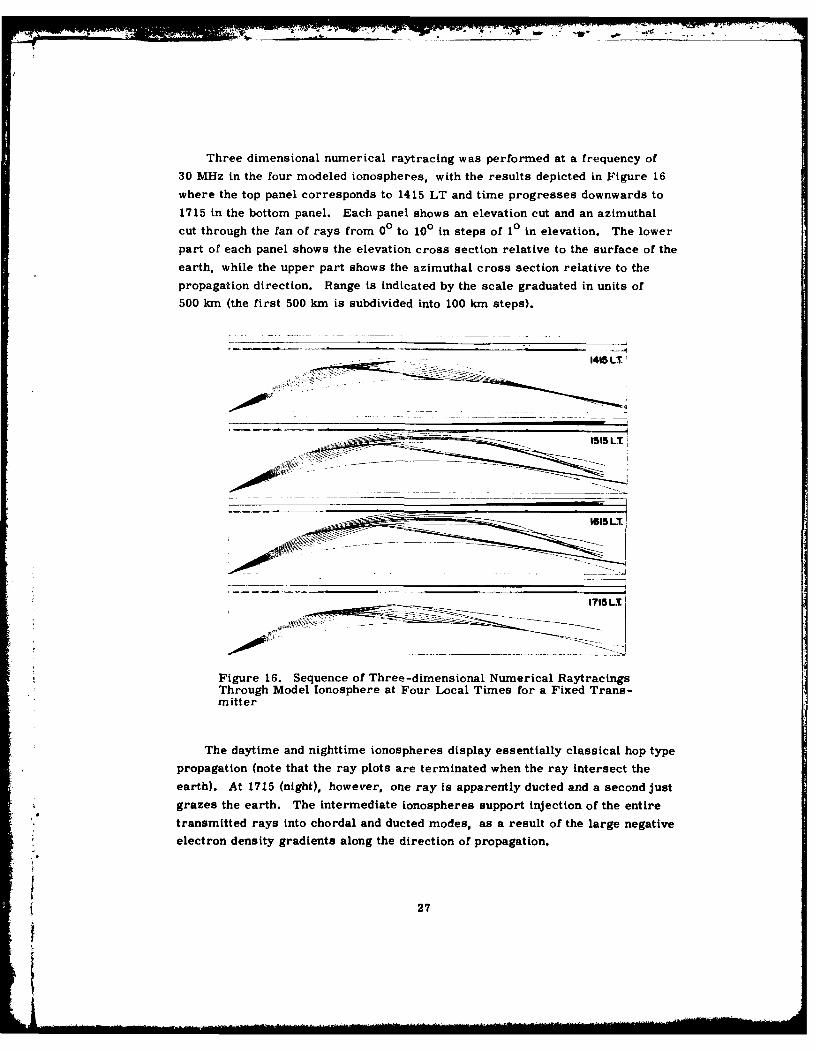
Three dimensional numerical raytracing was performed at a frequency of
30 MHz in the four modeled ionospheres, with the results depicted in Figure 16
where the top panel corresponds to 1415 LT and time progresses downwards to
1715 in the bottom panel. Each panel shows an elevation cut and an azimuthalcut through the fan of rays from 00 to 100 in steps of 10 in elevation. The lower
part of each panel shows the elevation cross section relative to the surface of the
earth, while the upper part shows the azimuthal cross section relative to the
propagation direction. Range is indicated by the scale graduated in units of
500 km (the first 500 km is subdivided into 100 km steps).
. 1415 LT
___-- 1515 LT
_____
____ ____ ___ ____ ___ 1715 LT.
Figure 16. Sequence of Three-dimensional Numerical RaytracingsThrough Model Ionosphere at Four Local Times for a Fixed Trans-mitter
The daytime and nighttime ionospheres display essentially classical hop typepropagation (note that the ray plots are terminated when the ray intersect the
earth). At 1715 (night), however, one ray is apparently ducted and a second just
grazes the earth. The intermediate ionospheres support injection of the entire*i transmitted rays into chordal and ducted modes, as a result of the large negative
electron density gradients along the direction of propagation.
27
I
2.5 Scattering from Irregularities
The phenomenon of scattering of radio waves from ionospheric small-scale
irregularities is essentially the same for both naturally occurring and artificially
produced irregularities. The only practical differences lie in the possibly differ-
ent scale-size spectra and different spatial extents involved in the two cases.
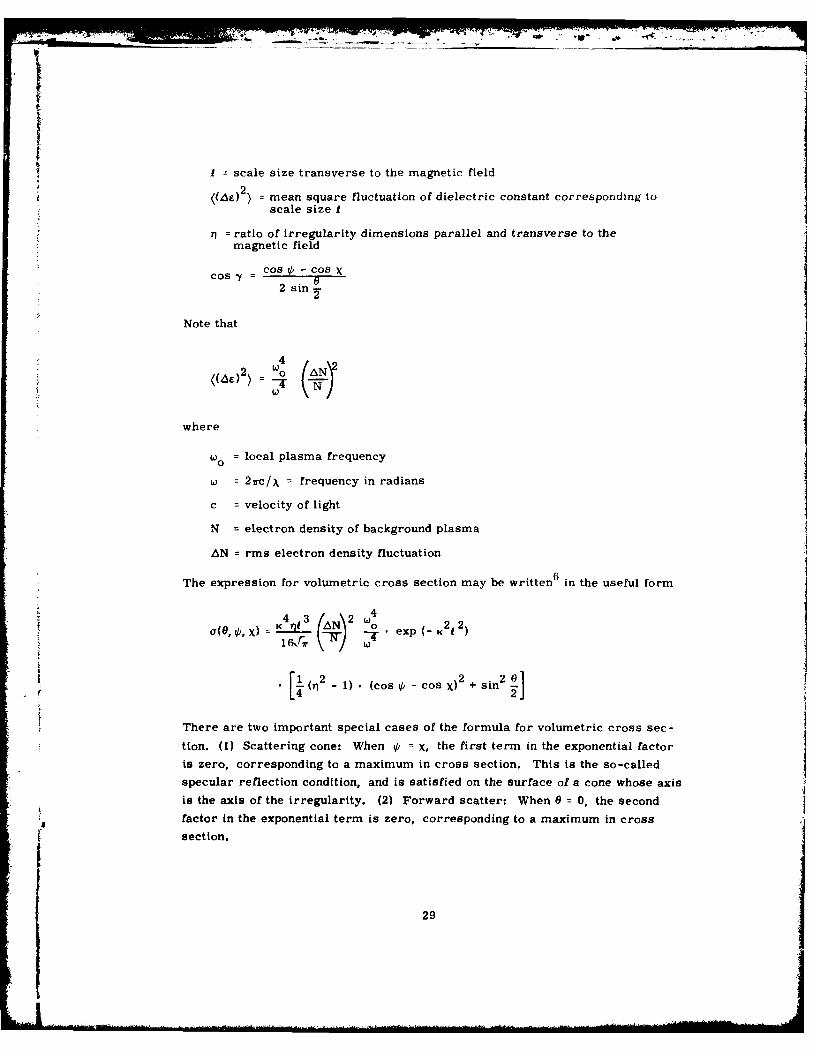
Figure 17 illustrates the geometry involved when radio waves of power densityP0 are incident on elongated irregularities at angle X. The power scattered into
an element of solid angle, dfl, at angle q to the irregularity axis, from an incre-
mental element of scatterer volume, dV, is
dPs - Po o(e) dS1 dV
where 0 is the scattering angle, that is, the angle between incident and scattered
vectors and a(O) is the "volumetric scatter cross section, " that is, the equivalent
point target cross section per unit volume of scatterers. In the ionosphere, the
scatterers are elongated along the direction of the local magnetic field; the
volumetric cross section is a strong function of the scatter angle 0.
The equivalent point target cross section of a finite volume V. of scatterers
is
s(e) =f a(O) dV
VS
Erukhimov et al6 have given the formula for the volumetric, cross section oflong, thin plasma irregularities having a Gaussian electron density distribution,
for the general case of arbitrary angles of incidence and scatter. Taking theirresults and making minor changes in symbols, we obtain
W(O,,Y) -k 4 il 3 ((5) 2 )
. exp - (kr1 sin 19)2 (cos 2 7 + sin 2 Y)
where
k =21/x
X = wavelength
6. Erukhimov, L. M., Matyugln, S. N., Uryadov, V.P. (1975) Radio wavepropagation in ionospheric wave channels, Radiophysics & QuantumElectronics 18(9):958-963.
28
I scale size transverse to the magnetic field
2((A)2) = mean square fluctuation of dielectric constant corresponding toscale size I
Y] = ratio of irregularity dimensions parallel and transverse to themagnetic field
cos b - cos X
2 sin -2i
Note that
((6e)2) ()
where
Wo = local plasma frequency
w = 2,rc/X = frequency in radians
c = velocity of light
N = electron density of background plasma
AN = rms electron density fluctuation
6The expression for volumetric cross section may be written in the useful form~4
43 \2 w 2a(6,i¢jX)= --N o exp (-K
.l(n21) (cos 0 - cos X)2 + sin2
r4There are two important special cases of the formula for volumetric cross sec-
tion. (1) Scattering cone: When i = X, the first term in the exponential factor
is zero, corresponding to a maximum in cross section. This is the so-called
specular reflection condition, and is satisfied on the surface of a cone whose axis
is the axis of the irregularity. (2) Forward scatter: When 0 = 0, the second
factor in the exponential term is zero, corresponding to a maximum in cross
section.
29
FORWARDSCATTER
SOLID ANGLE
CIO
SCATTER' |--CONE \_-
SCYLINDRICAL IRREGULARITY
INCIDENTPOWER DENSITY%o IRREGULARITY AXIS
//Figure 17. Scattering Geometry for Reradiation of Incident ElectromagneticWaves by Elongated Irregularities
An interesting special case is that in which the incident and scattered vectorsare both in the magnetic meridian plane, in which case
e : -X
and the volumetric cross section is a function of 0 and X alone.
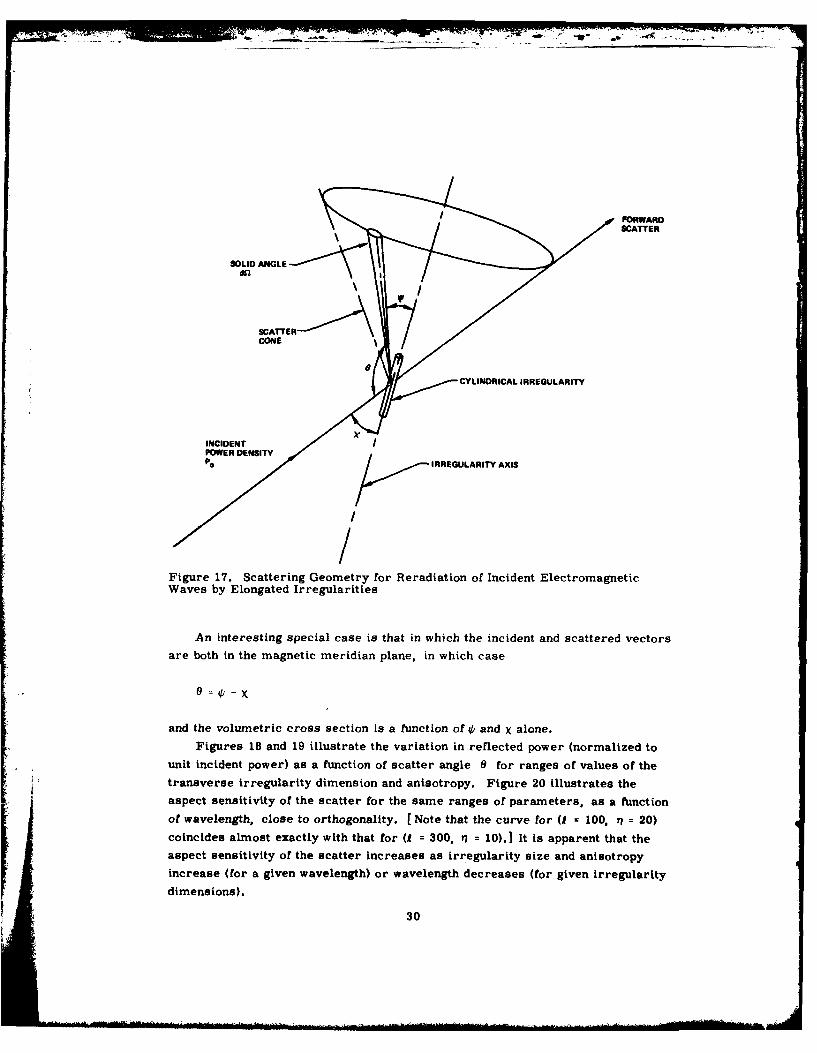
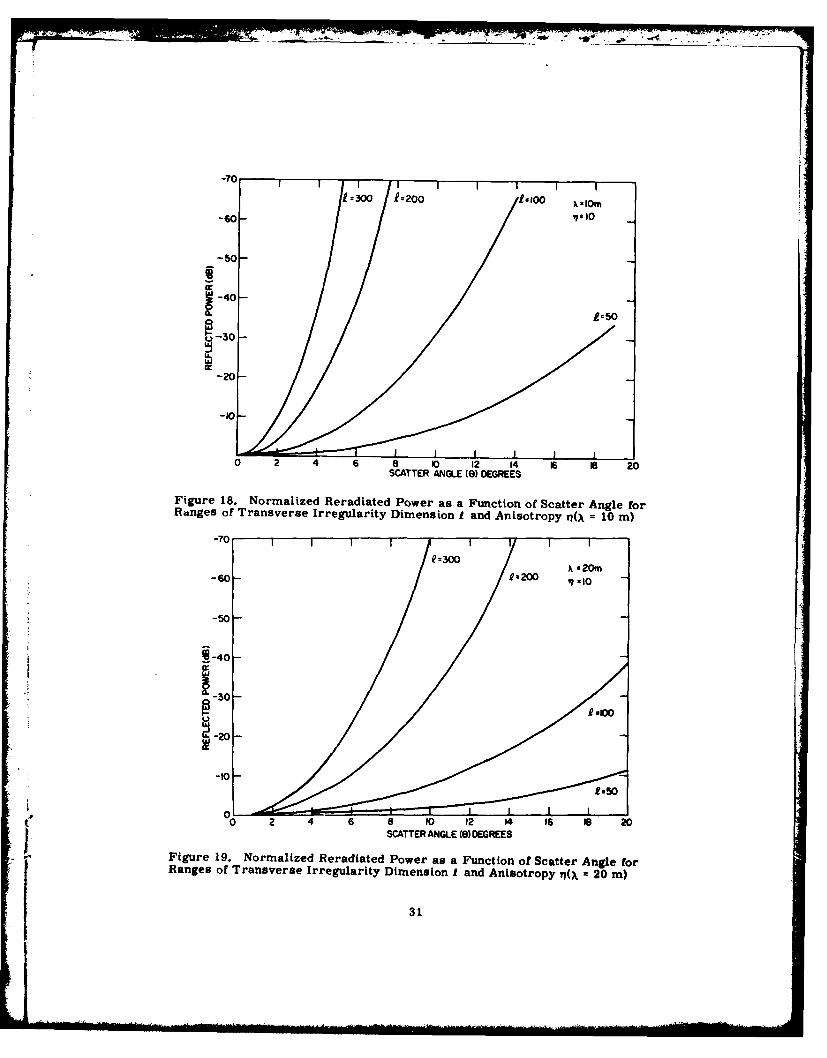
Figures 18 and 19 illustrate the variation in reflected power (normalized tounit incident power) as a function of scatter angle 0 for ranges of values of the
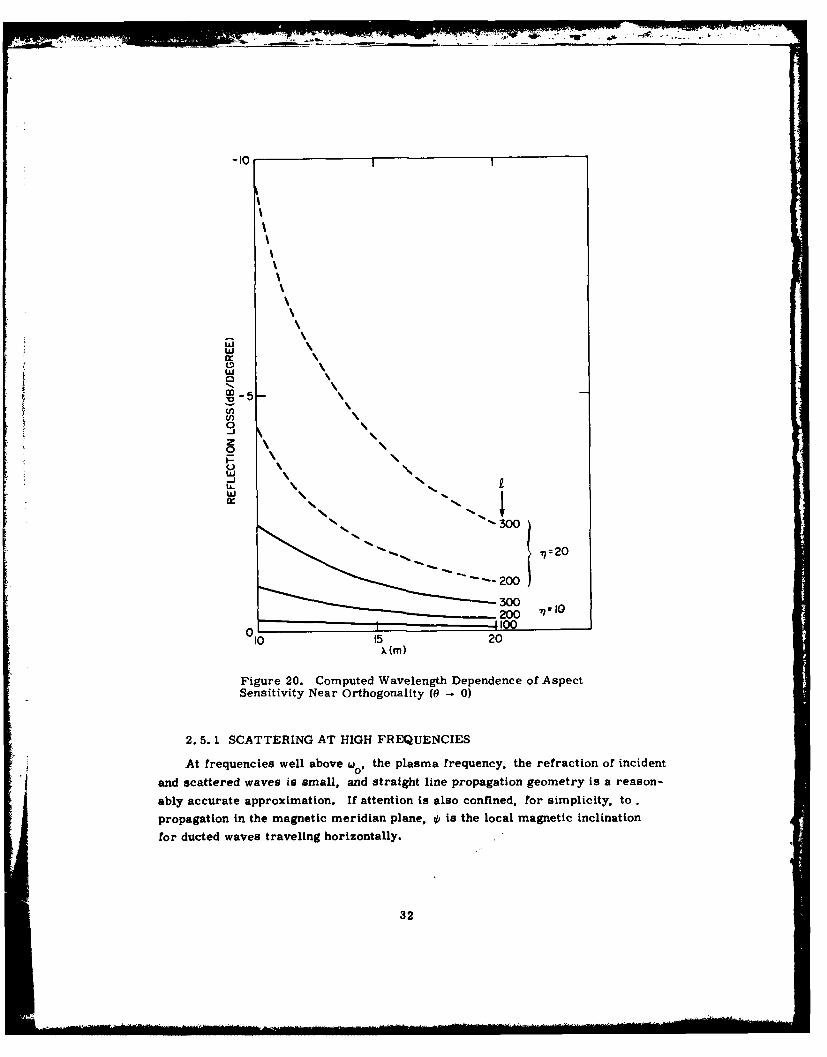
transverse irregularity dimension and anisotropy. Figure 20 illustrates the
aspect sensitivity of the scatter for the same ranges of parameters, as a function
of wavelength, close to orthogonality. [ Note that the curve for ( = 100, V = 20)
coincides almost exactly with that for (I = 300, n = 10).1 It is apparent that the
aspect sensitivity of the scatter increases as irregularity size and anisotropyincrease (for a given wavelength) or wavelength decreases (for given irregularitydimensions).
30t
1T 1300 1--200 b-100 )IOn
-50-
-40- 1-50
t -30-
-20
-10
0 2 4 6 8 10 12 14 6 B 20SCATTER ANGLE (e) DEGREES
Figure 18. Normalized Reradiated Power as a Function of Scatter Angle forRanges of Transverse Irregularity Dimension I and Anisotropy vl(X = 10 m)
-70 1 1R--300
&-0-so- 1-20 91-0m
-50-
!-40
920
-20-
-10O1:50
0 2 4 6 8 10 12 14 is is 20SCATTER ANGLE (e) DEGREES
11 1 7Figure 19. Normalized Reradiated Power as a Function of Scatter Angle forRanges of Transverse Irregularity Dimension I and Anisotropy qwi - 20 m)
31
-10
-'I
WW
cn
o
_j
\\
w
-J20
~300
\7
10 15 200
Figure 20. Computed Wavelength Dependence of AspectSensitivity Near Orthogonality (0 -~ 0)
2.5. 1 SCATTERING AT HIGH FREQUENCIES
At frequencies well above wthe plasma frequency, the refraction of incident
\0
and scattered waves is small, and straight line propagation geometry is a reason-
ably accurate approximation. If attention is also confined, for simplicity, to.
propagation in the magnetic meridian plane, 0 i s the local magnetic inclination
for ducted waves traveling horizontally.
32
2.5.2 SCATTER GEOMETRY WITH RADIO WAVE REFRACTION
The field-aligned scatter, which can act as a means of coupling energy in and
out of ionospheric ducts, has thus far been considered only in the high frequency
limit, that is, with consideration of radio refraction neglected. In fact, for radio
frequencies in the HF band, considerable refraction is encountered in the radio
path through the ionosphere below the scattering region, especially at the low
end of the band and in the daytime. Thus the straight-line propagation geometry
must be modified to reflect the actual propagation conditions, which is a task of
considerable complexity.
Computations have been performed in which the ionosphere was modeled in7
three dimensions, using a general purpose model, and rays were traced appro-
priately through this model over a range of frequencies. A ducted mode was
assumed to be propagating towards the scattering point from one of several
azimuths (00 to 3600 in 450 increments); after specular scattering and refracted
propagation through the lower ionosphere, the points of intersection of the rays
with the earth's surface were computed. In order to permit some deviation from
a rigid requirement for horizontal propagation in the ducted wave, the angle of
incidence upon the scattering point was assumed to take the values 0o . ±50 with
respect to the horizontal at that location. This permitted some estimate to be
made of the ground locus of intersection within a 10 degree range of angles for the
ducted wave vector. (See Section 3. 2, Figure 33.)
2.6 Propagation Loss Evaluation
In order to estimate the absorption losses for radio waves trapped in iono-
spheric ducts, a propagation analysis was conducted in which a numerical iono-
spheric model was constructed and rays subsequently traced in this model. The
modeling and raytracing procedure which was used permitted the computation of
absorption due to both electron-neutral and electron-ion collisions. 7 Radio waves
propagating in the F-region are influenced relatively little by electron-neutral
collisions, due to the relatively low concentration of neutral atoms at F-region
altitudes; the major contribution to absorption at these altitudes comes fromI electron-ion collisions.
6 A source of radio energy, in the frequency range 10 to 21 MHz was assumed
to exist at several altitudes in the ionosphere, and propagation to a range of
10, 000 km was considered. The elevation angle of the initial ray vector at the
7. Rush, C.M., Elkins, T.J. (1975) An assessment of the magnitude of theF-region absorption on HF radio waves using realistic electron densityand collision frequency models, ITU Telecommunication Journal, Geneva.
33
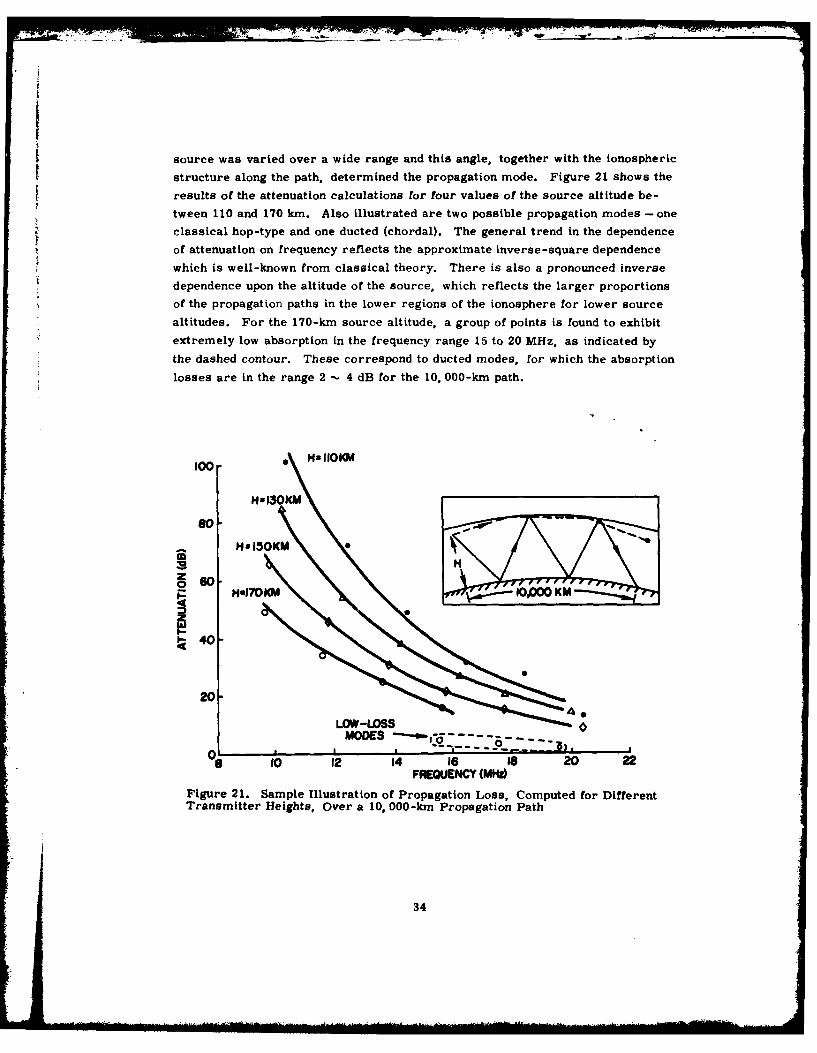
source was varied over a wide range and this angle, together with the ionospheric
structure along the path, determined the propagation mode. Figure 21 shows the
results of the attenuation calculations for tour values of the source altitude be-
tween 110 and 170 km. Also illustrated are two possible propagation modes -oneclassical hop-type and one ducted (chordal). The general trend in the dependence
of attenuation on frequency reflects the approximate inverse-square dependence
which is well-known from classical theory. There is also a pronounced inverse
dependence upon the altitude of the source, which reflects the larger proportions
of the propagation paths in the lower regions of the ionosphere for lower source
altitudes. For the 170-km source altitude, a group of points is found to exhibit
extremely low absorption in the frequency range 15 to 20 MHz, as indicated by
the dashed contour. These correspond to ducted modes, for which the absorption
losses are in the range 2 - 4 dB for the 10, 000-km path.
100 o 11IOKM
H-13OKM
o-lO
V H4
Trnmte GOghs O-e Ha7K 10,00 KM-i rpaainP
403
20-
LOW-LOSS
C ~MODES--.to1 12 14 16 Is 20 22
FREQUENCY (MMt)Figure 21. Sample Illustration of Propagation Loss, Computed for DifferentTransmitter Heights, Over a 10, 000-km Propagation Path
34
- t- w* -
V
3. GROUND-BASED PROPAGATION EXPERIMENTS
3.1 Round-the-World (RTW) Propagation
High frequency waves which travel completely round the world (so-called
RTW propagation) may be taken as evidence of the existence of ionospheric duct-
ing over appreciable portions of the path; otherwise lower ionospheric absorption
in the sunlit hemisphere would have reduced their signal strength below the level
of detectability. A related indication of ducting is the propagation of significantly
large energy along the long portion of the great circle joining two relatively close
points (so-called "back-path" propagation). Round-the-world propagation has
been studied for many years, 8 but a consistent explanation of the phenomenon has
only recently emerged. 9 Based on theoretical and experimental considerations,
it is apparent that the optimum conditions for RTW propagation are along a great
circle-which is close to the solar terminator (the twilight line). Generally speak-
ing, the greater the angular separation between the propagation path and the
optimum RTW great circle, which itself is displaced 150 to 200 from the termi-
nator, the less favorable are conditions for RTW propagation.
A number of RTW and related experiments have been conducted to investigate
the ducting phenomenon. An FM/CW transmitter, operating at l-kW power in the
frequency range 6 to 30 MHz was coupled to a horizontally polarized log periodic
antenna (gain -14 dB relative to isotropic) directed northwards from Ava,
New York (lat. 450). The receiving antenna, located at nearby Verona, New York
consisted of an array of Beverage elements having a mid-band gain of about 12 dB,
directed south. Swept frequency ionograms were recorded around the clock at
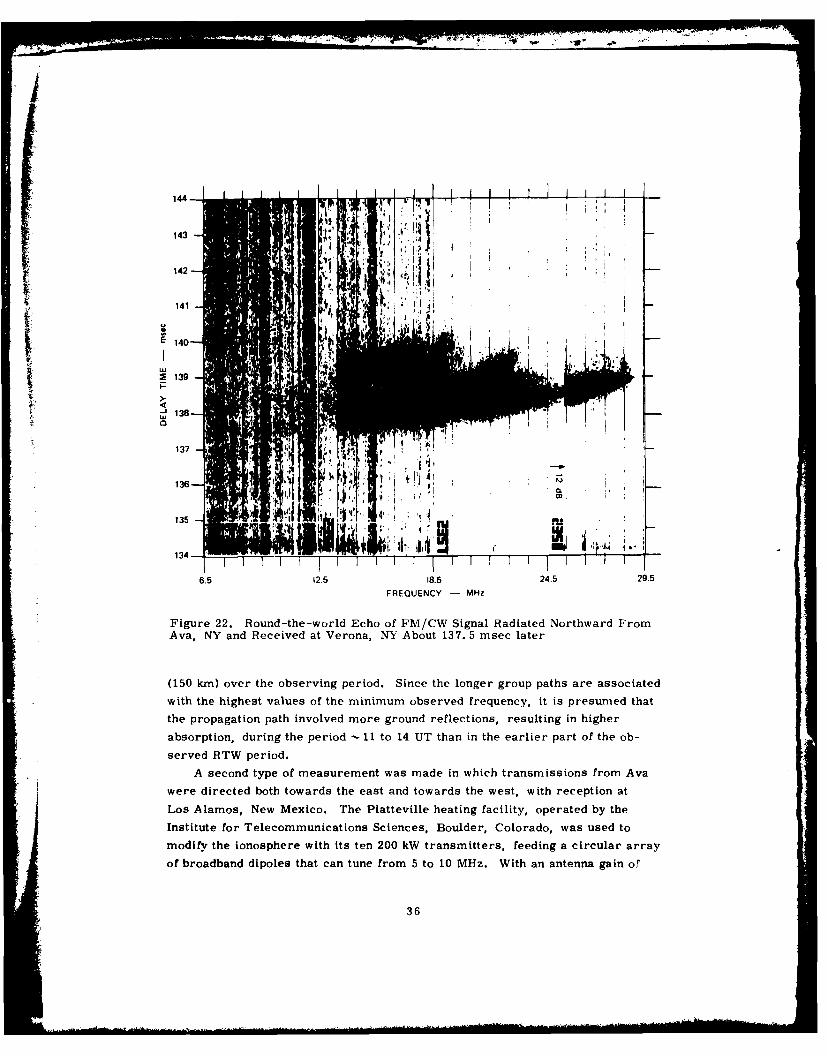
20 min intervals, with RTW propagation being frequently observed. Figure 22
shows an example of such an ionogram; note the diffuse nature of the trace and
the bifurcation at the high frequency end, a characteristic feature of these RTW
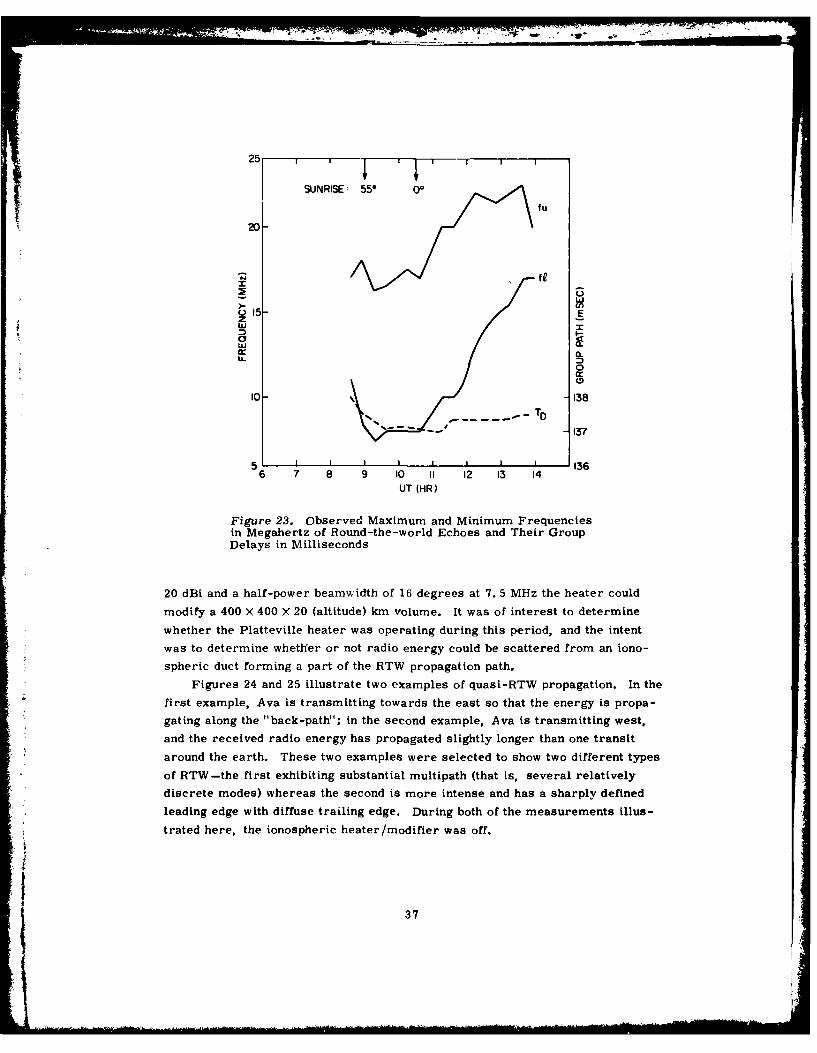
measurements. The maximum and minimum observed frequencies were extracted
from a sample eight hour period of ionograms and are plotted in Figure 23 to-
gether with the observed group delay. Also shown are the time of sunrise at the
approximate latitude of the ionospheric entry point (550) and at the equator of the
longitude of the transmitter/receiver pair. Note the approximate symmetry of
the period of RTW observation about 12 UT, that is, along the optimum RTW
great circle. 9 The group path, measured at the time of arrival of the earliest
signal returns (the leading edge) shows a maximum variation of about 0. 5 msec
8. Toman, K. (1979) High-frequency ionospheric ducting - A review, RadioScience 14(3):447-453.
9. Golyan, S.F. (1975) Optimal conditions for extra-long-range short-wavepropagation, Radiophysics & Quantum Electronics 18(9):1014-1022.
35
I
144
14 2
=w
141 i .!
. ~I i'E 140, I 141 [ .
139-
UA138
6.5 12.5 18.5 24.5 29.5
FREQUENCY MHz
Figure 22. Round-the-world Echo of FM/CW Signal Radiated Northward FromAva, NY and Received at Verona NY About 137 5 msec later
(150 kin) over the observing period. Since the longer group paths are associated
with the highest values of the minimum observed frequency, it is presumed that
the propagation path involved more ground reflections, resulting in higher
absorption, during the period - 11 to 14 UT than in the earlier part of the ob-
served RTW period.
A second type of measurement was made in which transmissions from Ava
were directed both towards the east and towards the west, with reception at
Los Alamos, New Mexico. The Platteville heating facility, operated by the
Institute for Telecommunications Sciences, Boulder, Colorado, was used to
modify the ionosphere with its ten 200 kW transmitters, feeding a circular array
of broadband dipoles that can tune from 5 to 10 MHz. With an antenna gain of
36
25 , ,SUNRISE: 550
fu
20-
, fe
Z3
j 15- Ew r
LL-; o
0
10 - 138TD
137
5 I I I i I I 136
6 7 8 9 10 II 12 13 14UT (HR)
Figure 23. Observed Maximum and Minimum Frequenciesin Megahertz of Round-the-world Echoes and Their GroupDelays in Milliseconds
20 dBi and a half-power beamwidth of 16 degrees at 7. 5 MHz the heater could
modify a 400 X 400 X 20 (altitude) km volume. It was of interest to determine
whether the Platteville heater was operating during this period, and the intent
was to determine whether or not radio energy could be scattered from an iono-
spheric duct forming a part of the RTW propagation path.
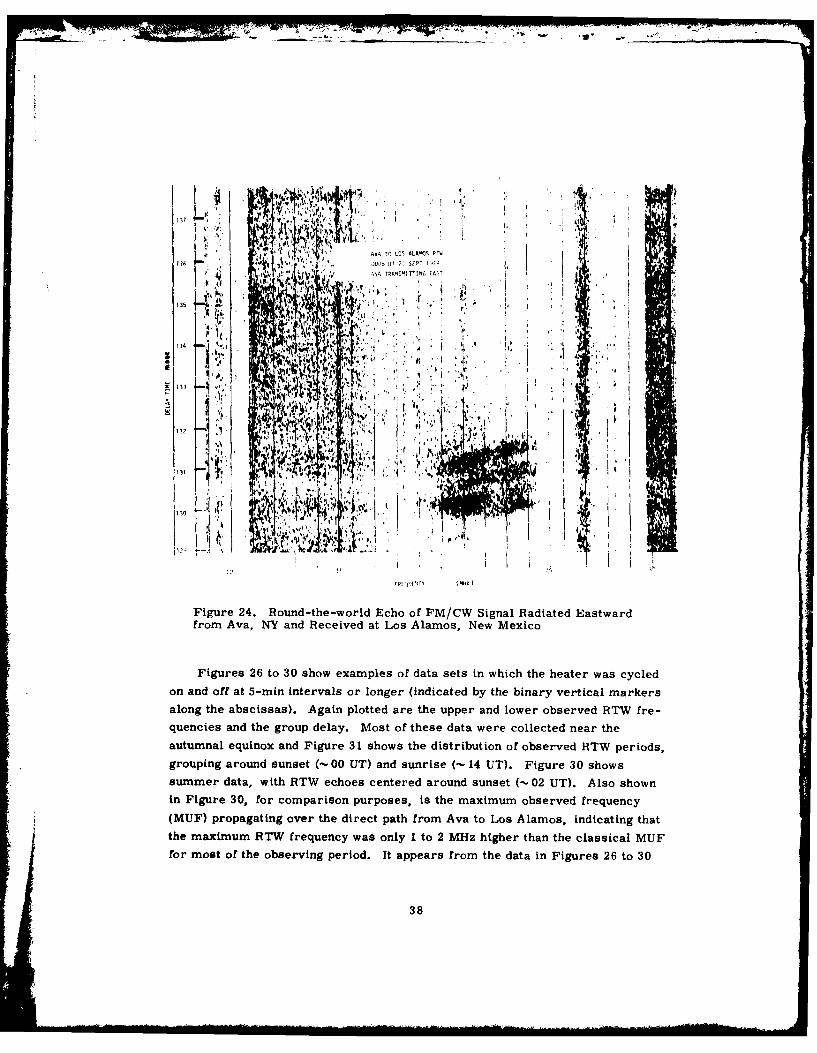
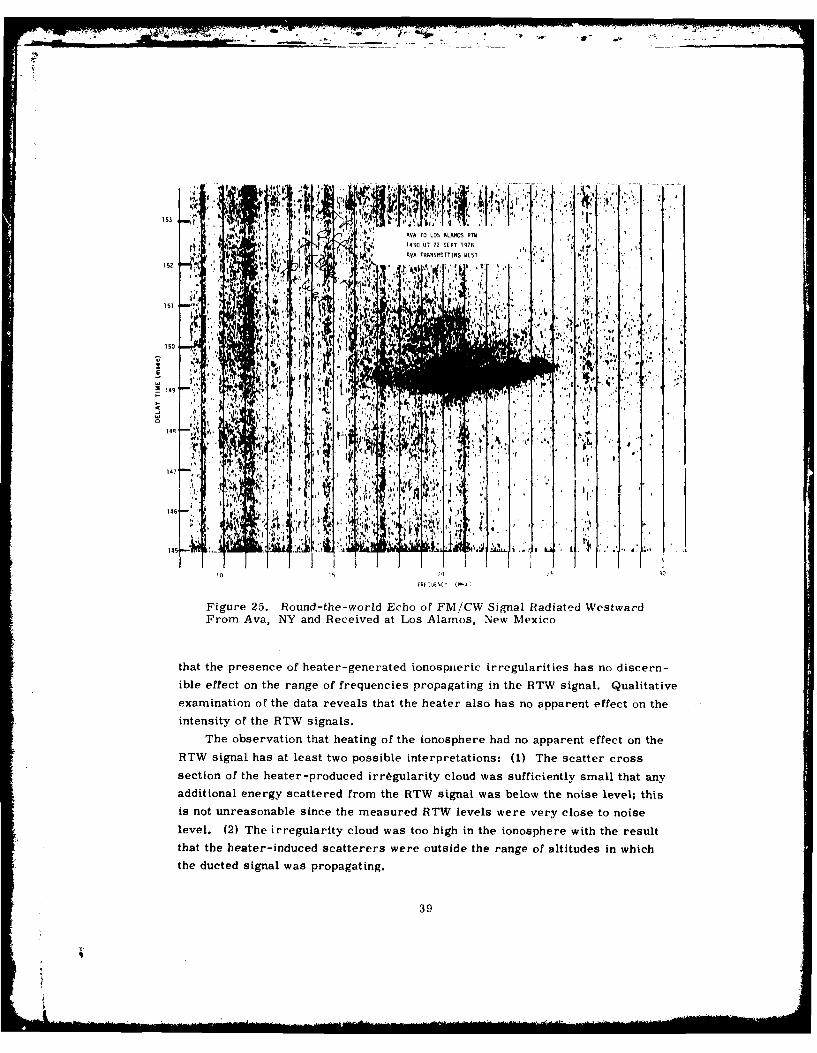
Figures 24 and 25 illustrate two examples of quasi-RTW propagation. In the
first example, Ava is transmitting towards the east so that the energy is propa-
gating along the "back-path"; in the second example, Ava is transmitting west,
and the received radio energy has propagated slightly longer than one transit
around the earth. These two examples were selected to show two different types
of RTW -the first exhibiting substantial multipath (that is, several relatively
discrete modes) whereas the second is more intense and has a sharply defined
leading edge with diffuse trailing edge. During both of the measurements illus-
trated here, the ionospheric heater/modifier was off.
37
137 ' ' 1h
AVA 'r LOS ALAO'S PTw
136 2~) UT' EP 71
4 17RATRSMITTING FAST
j N•
35
13 A)
IW
1 " ' i ' : ,.7 ...
*a , ,,L,,"' " I , i,
Va..
131 L L
Figure 24. Round-the-world Echo of FM/CW Signal Radiated Eastwardfrom Ava, NY and Received at Los Alamos, New Mexico
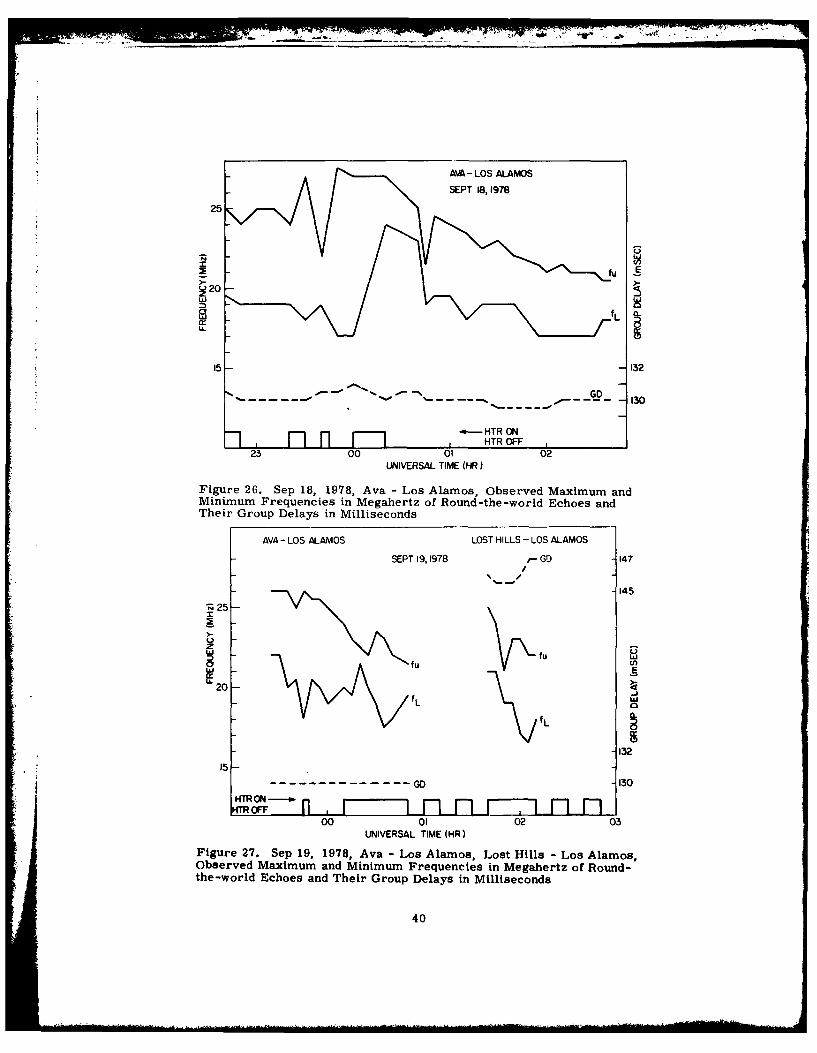
Figures 26 to 30 show examples of data sets in which the heater was cycled
on and off at 5-min intervals or longer (indicated by the binary vertical markers
along the abscissas). Again plotted are the upper and lower observed RTW fre-
quencies and the group delay. Most of these data were collected near the
autumnal equinox and Figure 31 shows the distribution of observed RTW periods,
grouping around sunset (- 00 UT) and sunrise (- 14 UT). Figure 30 shows
summer data, with RTW echoes centered around sunset (- 02 UT). Also shown
in Figure 30, for comparison purposes, is the maximum observed frequency
(MUF) propagating over the direct path from Ava to Los Alamos, indicating that
the maximum RTW frequency was only I to 2 MHz higher than the classical MUF
for most of the observing period. It appears from the data in Figures 26 to 30
38
153 V r4 11" ' "" lh \' ' AA TO 111 AIAMOS R'rT W' 1~e m
o3 ,SEPT 197 "
1 49 t1 I,4
" r '' *I ,. ', ,.,, ., '
C ..... I I 'I, ' . , "... ..'"" ' "'
147
146 .-. ",. , ,
* ,! ,5 • I
145j 1
10 3
F"' "A VI ( .
Figure 25. Round-the-world Echo of FM/CW Signal Radiated WestwardFrom Ava, NY and Received at Los Alamos, New Mexico
that the presence of heater-generated ionospneric irregularities has no discern-
ible effect on the range of frequencies propagating in the RTW signal. Qualitative
examination of the data reveals that the heater also has no apparent effect on the
intensity of the RTW signals.
The observation that heating of the ionosphere had no apparent effect on the
RTW signal has at least two possible interpretations: (1) The scatter cross
section of the heater-produced irrgularity cloud was sufficiently small that any
additional energy scattered from the RTW signal was below the noise level; this
is not unreasonable since the measured RTW levels were very close to noise
level. (2) The irregularity cloud was too high in the ionosphere with the result
that the heater-induced scatterers were outside the range of altitudes in which
the ducted signal was propagating.
39
AVA- LOS ALAMOS
SEPT 18, 1978
25
u
0w
15 - 13 2
. .. -- . ... 13 0
HTR ONo n F7 HTR OFF _
23 00 01 02UNIVERSAL TIME (HR)
Figure 26. Sep 18, 1978, Ava - Los Alamos, Observed Maximum andMinimum Frequencies in Megahertz of Round-the-world Echoes andTheir Group Delays in Milliseconds
AVA - LOS ALAMOS LOST HILLS - LOS ALAMOS
SEPT 19,1978 ,- GO -147
- 145
Z
W - 7\Afufu
204
fL
-32
G130w ~HTR ON--.
.o, , m F i- -- Fi -00 01 02 03
UNIVERSAL TIME (HR)
Figure 27. Sep 19, 1978, Ava - Los Alamos, Lost Hills - Los Alamos,Observed Maximum and Minimum Frequencies in Megahertz of Round-the-world Echoes and Their Group Delays in Milliseconds
40
30
AVA-LOS ALAMOS20 SEPT 1978
25-
'20 AA.
-0 -
-13215- -- --- GO - --- GD
HTR ON -130
F1 n n nHTR OFF
21 22 23 0UMVERSAL TIME (HR)
Figure 28. Sep 20, 1978, Ava - Los Alamos, Observed Maximum andMinimum Frequencies in Megahertz of Round-the-world Echoes andTheir Group Delays in Milliseconds
AVA- LOS ALAMOS22 SEPT 1978
30 -GD(WEST) 150
EAST 145
fu
>- 25 -140- GO
ju13
IL
1514 15 16 171.
UNIVERSAL TIME (MR)
Figure 29. Sep 22, 1978, Ava - Los Alamos, Observed Maximum andMinimum Frequencies in Megahertz of Round-the-world Echoes andTheir Group Delays in Milliseconds
41
AVA - LOS ALAMOSJUN 5,1979
-/ -MUF(DIRECT)
20-
cnN E
fuU 15 - ,.o 5oLZ 0LU -C
o 0Cr CDL.
10 - 132f L
"---------GD 130
[]n r rHTR ON -
HTR OFFoo 0 02 03 04
UNIVERSAL TIME (HRS)
Figure 30. June 5, 1979, Ava - Los Alamos, Observed Maximum andMinimum Frequencies in Megahertz of Round-the-world Echoes andTheir Group Delays in Milliseconds
AVA- LOS ALAMOS
22 RTW
., -- 21'-9? RTWO2
06 12 16 20 04 08UNIVERSAL TIME (HR)
Figure 31. Preferred Times of Occurrence of Round-the-world EchoesBetween Ava, New York and Los Alamos, New Mexico from 18 to 22Sep 1978
42
The second possibility is regarded as being the more likely one since the
lower frequency limit of the heater (5 MHz) was close to the maximum F-region
plasma frequency for much of the nighttime observing periods. Thus heating
was taking place mostly above about 250 km, and RF energy propagating in the
chordal mode (the dominant ducting mode at night) can be expected to travel at
a lower altitude than this value.
3.2 Long-range Propagation
Several ducted-propagation experiments have been conducted between 1978
and 1980 which involved the ionospheric radio-frequency heating facility at
Platteville, Colorado, operated by the Institute for Telecommunications Sciences,
Boulder, Colorado. This radio-frequency heating facility was used to create inthe F-region a heater cloud whose fine structure contained field-aligned ioniza-
tion irregularities. These irregularities were expected to scatter incoming high-
frequency signals, originating from remote transmitting sites, to receiving sites
whose general location relative to Platteville was deduced from the geometry
provided by ionization irregularities.
Characteristics of the geometry were: (1) Irregularities are constrained to
be aligned with the orientation of the local geomagnetic field, (2) irregularities
occur at heights that depend on the height distribution of the ambient ionosphere
plasma frequency and the heater frequency, (3) Direction of the incident radiation
originating from remote ground-based transmitters.
Transmitting and receiving sites used in the experiments, along with surface.
distances and propagation delay between stations are illustrated in Figure 32.Table 1 gives the location of participating stations, transmitter power, antenna
gain, and range of operating frequencies.
The sounding transmissions from the Stanford Research Institute, Inter-
national facility at Lost Hills, California, from the RADC facility at Ava, New
York, and from the Australian site at Adelaide employed a linear swept-frequency
continuous wave (SFCW) system. These transmissions were directed toward
Platteville, Colorado, where the RF heater transmitter was operated by the
Institute for Telecommunications Sciences. The most notable effect of the heat-
ing process is the creation of ionospheric irregularities in the F region by the
heater beam. The artificially created irregularities within the heated volume are
aligned in the direction of the earth's magnetic field. A receiving station located
at Los Banos, California obtained, for the Lost Hills transmission, backscatter
information on the cross section of the irregularity volume over Platteville, as
well as ground backscatter by way of ionospheric reflections. The receiving
stations at Los Alamos, New Mexico and Alamosa, Colorado, were selected on
43
3969 km AVA
PLATTEVILLE C
2438 km
(8.12msec)LOS BANOS (4.81 me
/ / 1 2km/ I (1.Tmsec)
ADELAIDE
Figure 32. Layout for High-Frequency Propagation Experiment Utilizing theIonospheric Heater. (Units for surface distance and transmission delay arekilometer and millisecond; solid points represent transmitters; open pointsrepresent receiving stations.)
Table 1. Participating Transmitting and Receiving Stations
Transmitter AntennaPower Gain Frequency
Location Latitude Longitude (kW) (dBi) (MHz)
Platteville, 40.2 0 N 104. 7W 1500 20 5-10Colorado
Adelaide, 34.85°N 138.66 0 E 10 20 6-30Australia
Los Banos, 37.06°N 120.830 W - 28 6-30California
Lost Hills, 35.80N 120°W 20 18 6-28California
Alamosa, 37.43ON 105.86°W - 10 6-30Colorado
Los Alamos, 35, 76°N 106.23°W - 10 6-30New Mexico
Los Lunas, 34.820 106.74°W 0.3 16 6-30New Mexico
Ava, 430N 75. 50 W 10 16 6-30New York
44
the basis of computations of the family of scattering cones, of field-aligned irreg-
ularities, that intersect the surface of the earth at loci which depend on the chosen
geomagnetic field model, arrival angle of the electromagnetic wave relative to
magnetic azimuth and elevation angle incident at the irregularity, the height of
the irregularity, and sounding frequency because of frequency-dependent refrac-~10tion effects in the ionosphere.
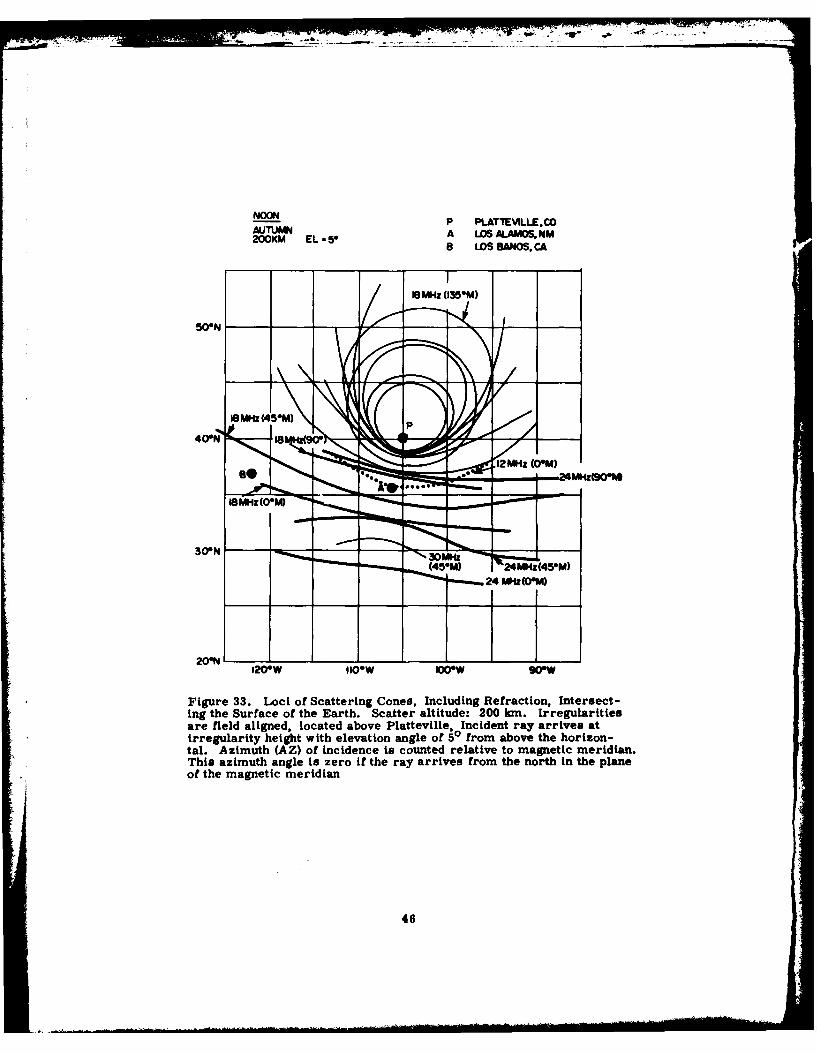
Figure 33 illustrates the results of sample calculations of loci resulting from
the intersection of scattering cones, associated with field-aligned irregularities,
with the surface of the earth, refraction in the ionosphere included. The condi-
tions derived from an ionospheric model are typical of autumn, noon, sunspot
number 150. The origin of the scattering cones are placed at a height of 200 km.
At that height above Platteville (P), Colorado (lat. 40. 20 N, long. 104.7°W; see
Table 1) electromagnetic signals were allowed to arrive at elevation angles of00, +50, -5°. In Figure 33, this angle was +50 above the horizontal at a height
of 200 km over Platteville.
Signal frequencies of 6, 12, 18, 24 and 30 MHz were used to compute rays
that are specularly reflected from field-aligned irregularities, each frequency
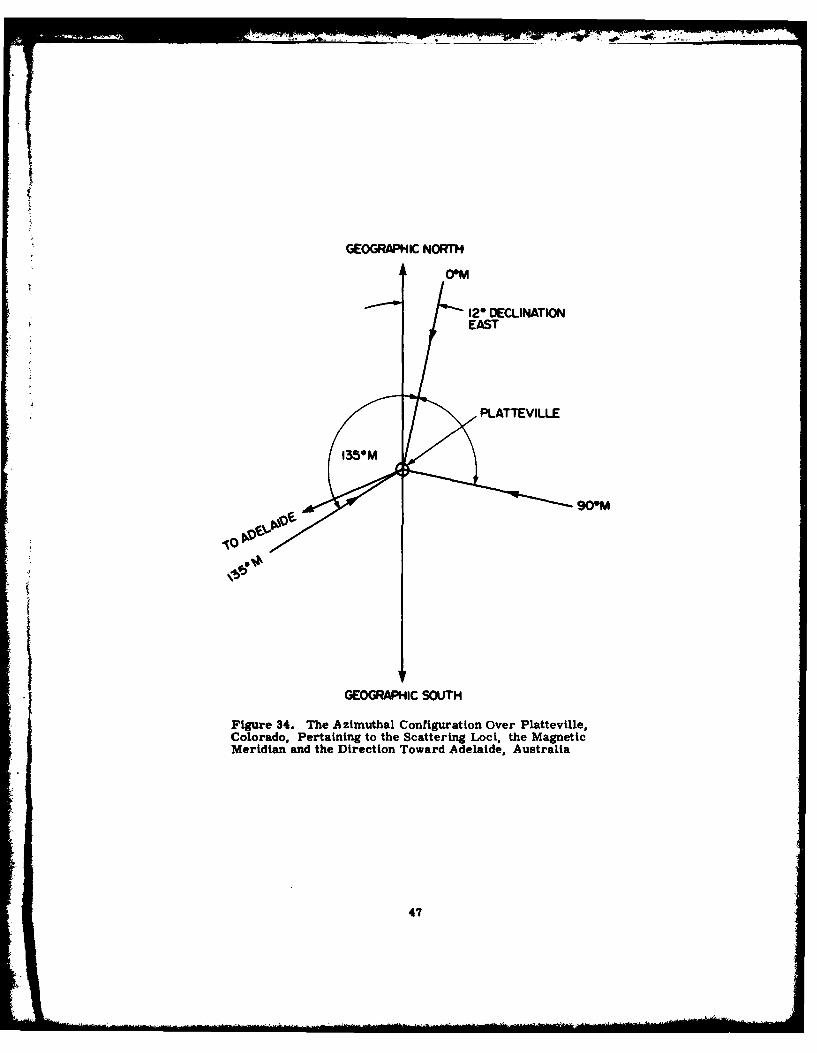
resulting in a family of discrete rays per angle of incidence that defines a"refracted" scattering cone. The azimuth of rays were 0, 45, 90, 135, 1800
relative to the orientation of the magnetic meridian (see Figure 34) with east or
west azimuth providing identical loci for intersection between scattering cone
and surface of the earth. While the magnetic field was used to define the scat-
tering geometry, it was neglected in the computations for the rays. Rays were
computed for all frequencies and azimuths cited earlier. Not all loci were
plotted, however, in Figure 33. For certain combinations of frequency and
azimuth, it was found that the scattering cones did not intersect the surface of
the earth, for example, 24- and 30-MHz signals at azimuth 135 0 M. For the
same frequencies arriving at an azimuth of 45 M, however, the signals are
scattered to the ground south of Los Alamos.
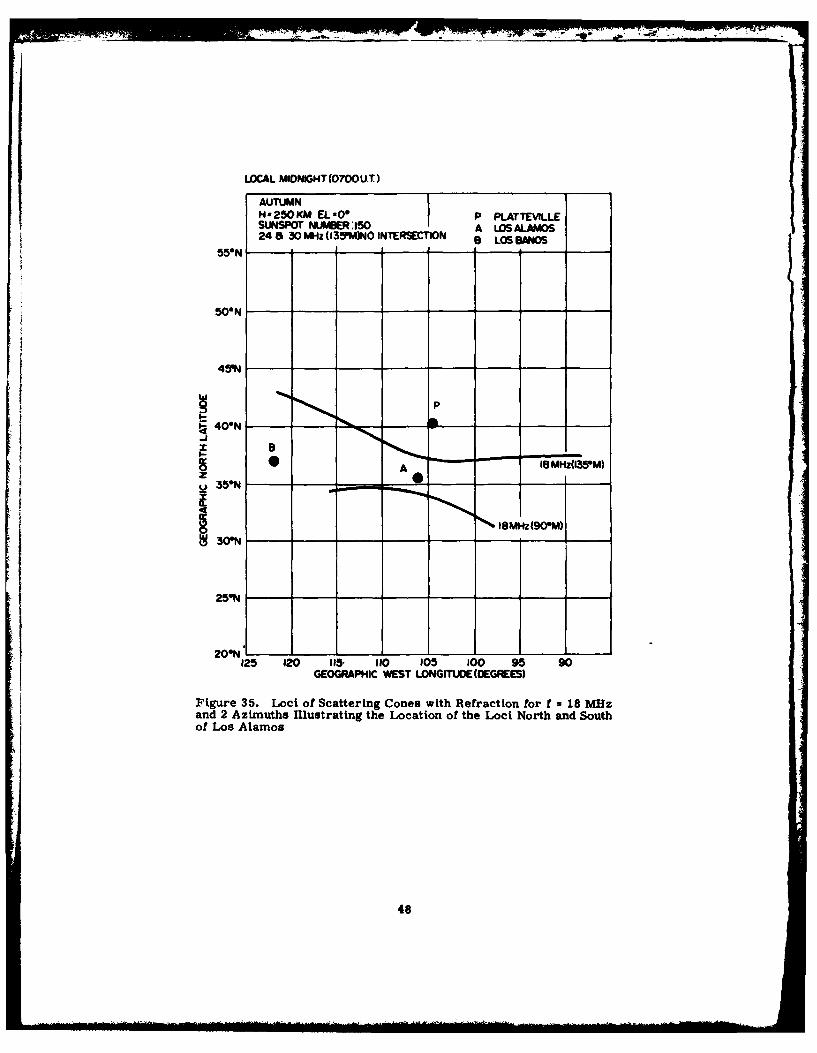
For ionospheric conditions typical of autumn, local midnight, two intersec-
tions of the scatter cone including refraction are illustrated for 18 MHz and
azimuths 90 0 M, 135 0 M. For the conditions chosen in Figure 33 it is seen that
the locus of intersection for 18 MHz (135 0 M) differs significantly from that shown
in Figure 35 for day versus night, 200 versus 250 km altitude, and assumed
incident elevation angle +50 versus 00. For local noon, autumn and a 200-km
altitude at which signals at 12, 18, 24 and 30 MHz coming from an azimuth of
135 0 M are assumed to be incident on field-aligned irregularities. Figure 36
10. Miller, D.C., Gibbs, J. (1978) Ionospheric Modeling and Propagation
Analysis, RADC-TR-78-163.
45
NOON P PLA ECO
AUTUMNA LOS *LAMOS.NM200KM EL -50 6 LOS BANOS. CA
161W'z (1356M)
50°N
30eN ~~~ ~ 1 N 4 E I "2MHz1450M)
" 24 OM')
20"N120OW Il00W 106W 906W
Figure 33. Loci of Scattering Cones, Including Refraction, Intersect-ing the Surface of the Earth. Scatter altitude: 200 kn. Irregularitiesare field aligned, located above Platteville, Incident ray arrives atirregularity height with elevation angle of 50 from above the horizon-tal. Azimuth (AZ) of incidence is counted relative to magnetic meridian.This azimuth angle is zero if the ray arrives from the north in the planeof the magnetic meridian
46
GEOGRAPHIC NORTH
DOM
12* DECLINATIONEAST
PATTEVILLE
1350M
.10M
GEOGRAPHIC SOUTH
Figure 34. The Azimuthal Configuration over Platteville,Colorado, Pertaining to the Scattering Loci. the MagneticMeridian and the Direction Toward Adelaide, Australia
47
LOCAL MIDNIGHT (0700 UT)
AUTUMNH*250KM EL-0 P PLATTEVILLESUNSPOT NUMBER:150 A P iO24 8 30 M.*z (135tO)NO INTERSECTION A LOSALAOS
55ON
50ON
P
40-N
A Is MWH35-M)
035*N
30-N __ _ _ _ __ _ __
25ON
20-N'125 120 115. 110 1O5 100 95 90
GEOGRAPHIC WEST LDNGITUDE(DEGREES)
Figure 35. Loci of Scattering Cones with Refraction for f = 18 MHzand 2 Azimuths Illustrating the Location of the Loci North and Southof Los Alamos
48
P PLATTEVILLE.COA LOSALAMOS.NM
LOCAL NOON. AUTUMN 200KM B LOS BANOS. CA
35*M EL.±5*____ __N 12.18.24,30MHz
5O /
**. A.... (24X+5)*
40*N
8
00*
120OW Ico~w 1000W 900W
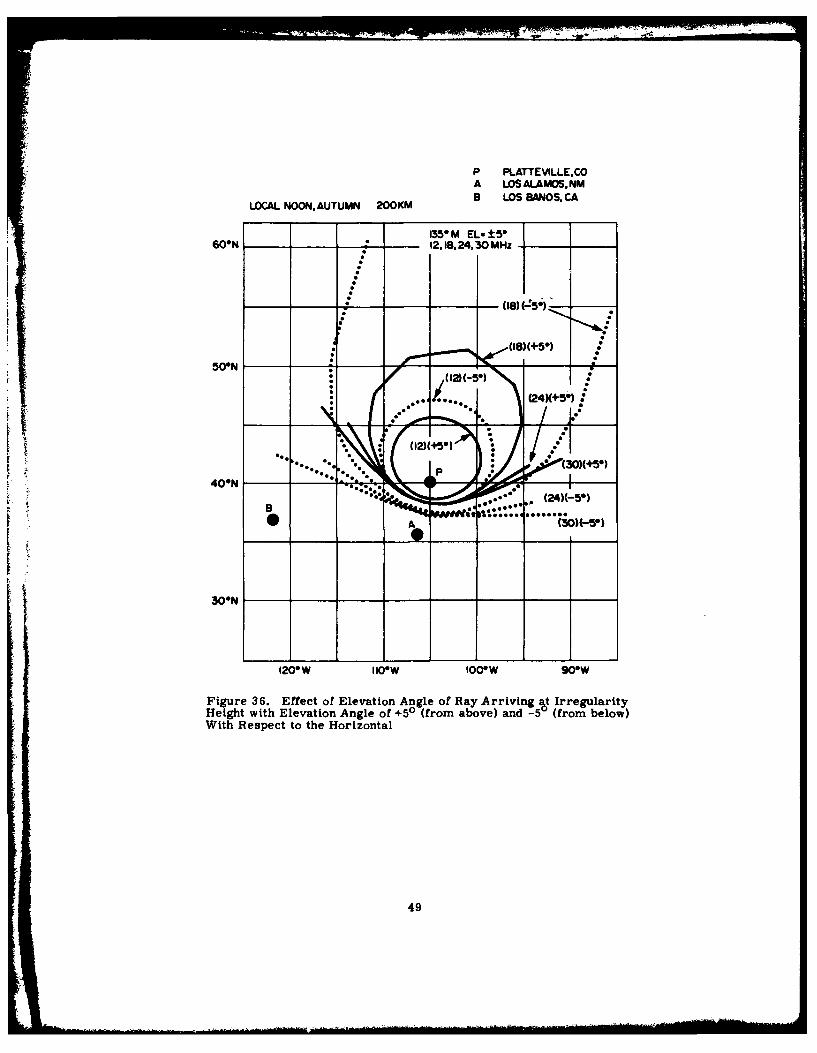
Figure 36. Effect of Elevation Angle of Ray Arriving a IrregularityHeight with Elevation Angle of +50 (from above) and -5 (from below)With Respect to the Horizontal
49
illustrates the effect of elevation angle at the points of incidence above Platteville.
The solid contours refer to arrival angle above the horizontal of +50, the dotted
contours to -5 ° . For signals assumed to arrive from the south-west (135 0 M), a
negative elevation angle of -50 displaces the intersection loci farther south from
Platteville compared with a positive angle of +5 ° . Higher frequencies tend to
come farther south because they encounter reduced refraction.Figures 33, 34 and 36 were based on simulation data derived from an iono-
spheric model 10 that provided the geometry of the scattering contours. The
results illustrate some characteristics of contours obtained by the choice of
model ionospheres representing mean conditions. The choice of initial conditions
for electromagnetic signals arriving at the field-aligned columns of the scatter-
ing volume resulted in an infinitesimal scattering cone that provided the initial
conditions for computing the rays of which some reached the surface of the earth,
while others did not.
The scattering geometry which is in principle characterized by the magnetic
field of the earth is practically time invariant. In practice, ionospheric condi-
tions will generally be different from the mean model used for computations.
These changing conditions will influence the choice of heater frequency and thus
the altitude at which field aligned irregularities are produced. Its consequence
will be a set of different intersection loci originating now from a particular
scattering cone located at some altitude with the landing of rays being subject to
the prevailing refractive influences of the ionosphere.
3.2.1 MEASUREMENT CAMPAIGN OF 1978
During July and September 1978 measurements were made of the HF induced
backscatter over Colorado 1 1 with an over-the-horizon radar at Lost Hills, and the
Wide Aperture Research Facility (WARF) at Los Banos, both in California. The
radar operated as a linear swept-frequency continuous wave (SFCW) backscatter
sounder at frequencies from 6 to 30 MHz. The ionospheric modification was pro-
duced by the Platteville heater facility using 5 to 10 MHz as modifier frequencies.
The most notable ionospheric effect of radio frequency heating is the creation of
irregularities in the heater beam which are aligned in the direction of the earth's
magnetic field. Narrow-band FM/CW transmissions (about 25-kHz bandwidth)
were used to measure "cloud" echo strength resulting from the radar illumination
of the irregularity volume and observe cloud cross-section changes caused by step-
wise variations in the heater power levels. A difference in transmitted power of
about 3.5 dB, resulting from cycling the RF heating power between 1.20 and0. 54 MW in 2 min intervals, resulted in a variation of echo power by about 2 dB
11. Showen, R.L., Zavolt, W.B. (1979) Plattevllle Heatins Results: HF RadarObservations, SRI International, Tech. Report No. 43.
50
indicating a saturation with increasing HF power of the process causing the
scatter.
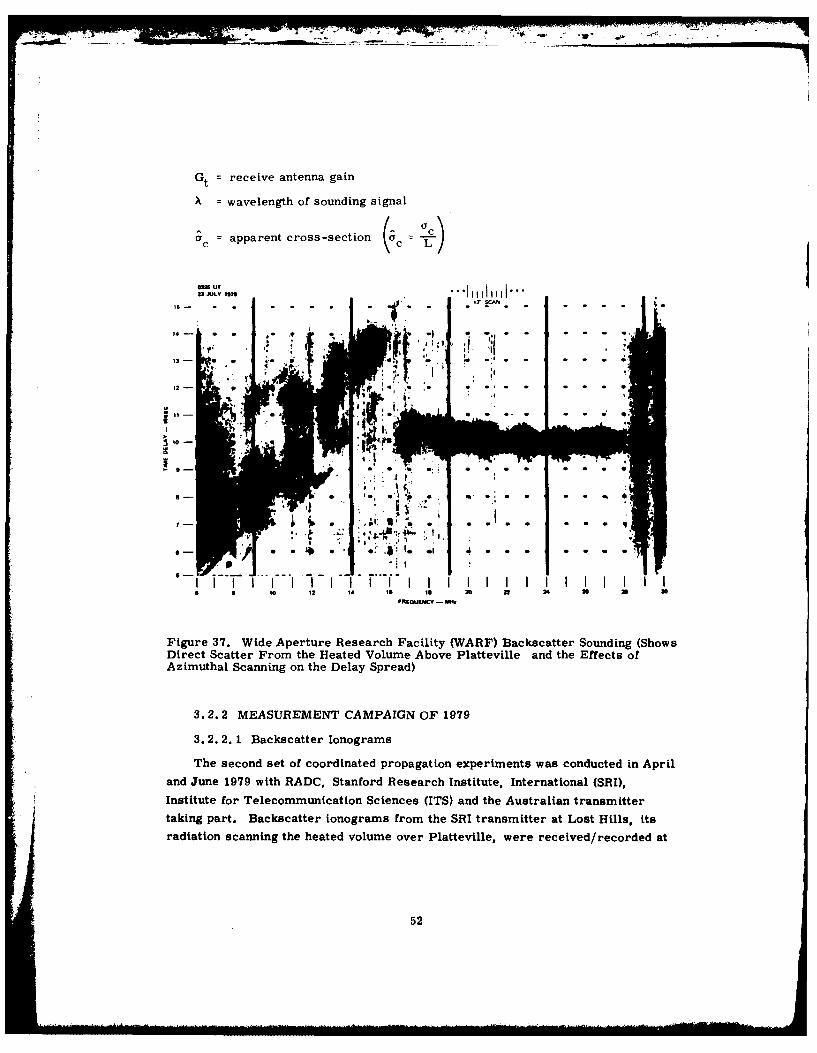
At the WARF receiving site in Los Banos, the use of a hybrid spectrumanalyzer provided real-time wide-sweep backscatter soundings to aid inoptimizing the selection of transmissions and recording parameter@. Thereceivers were operated with automatic gain control to accommodate the verylarge variation in received signal strength typical of wide-sweep soundings.To obtain azimuthal profiles of the "cloud's" cross section, three of the WARF'shalf-degree receive beams were repetitively stepped across a series of contin-uous bearings as the sounding frequency was varied. A WARF backscatter sound-ing ionogram showing "direct" scatter from the heated region is illustrated inFigure 37. Calibration markers were superimposed at intervals of 1 msec in timedelay and 1 MHz in frequency corresponding to 10 seconds for the sweep rate of100 kHz per second. Identifiable signatures in the sounding include the F-layerland-backscatter returns and direct echoes from the heated volume (cloud) overPlatteville. The 2-MHz periodic structure seen in the "cloud" echo is the resultof stepping the receive antenna beam in azimuth every 2. 5 seconds correspondingto a 2-MHz interval. The echoes from the "cloud" seem to extend in frequencyover the 16 to 30 MHz band. The mechanism of standard field-aligned scatterresponsible for the cloud echoes led to absolute cross-section estimates of 108
square meters. 11 Although more information about the scattering cross-sectionis available, the cross-section estimates generally agree with earlier results. 12
The computation of the apparent cross-section a which includes an excessloss term that cannot be controlled or directly measured by the radar, was con-veniently introduced. The equation for this quantity is
a c 4vR 2ac =-=S G 2
where
ac = radar backscatter cross section of the "cloud"
L = excess loss
S = received signal strength
R = slant range
Pt = transmitted power
12. Fialer, P.A. (1974) Field-aligned scattering from a heated region of theionosphere - Observations at HF and VHF, Radio Science 9 (11):923-940.
51
J 7,
Gt = receive antenna gain
X = wavelength of sounding signal
c=apparent cross-section c
03 UT2 u JLY I i
Dd *'YIh I. *j I11 Ill "i
15. '2 C A N
*, S 0 1 4 B I 23 24"4 . . . . UIs - , t • UI.
.- EG, E. . . . . . . ,
Figure 37. Wide Aperture Research Facility (WARF) Backscatter Sounding (ShowsDirect Scatter From the Heated Volume Above Platteville and the Effects ofAzimuthal Scanning on the Delay Spread)
3.2.2 MEASUREMENT CAMPAIGN OF 1979
3. 2. 2. 1 Backscatter lonograms
The second set of coordinated propagation experiments was conducted in Apriland June 1979 with RADC, Stanford Research Institute, International (SRI),
Institute for Telecommunication Sciences (ITS) and the Australian transmitter
taking part. Backscatter ionograms from the SRI transmitter at Lost Hills, Its
radiation scanning the heated volume over Platteville, were received/recorded at
52
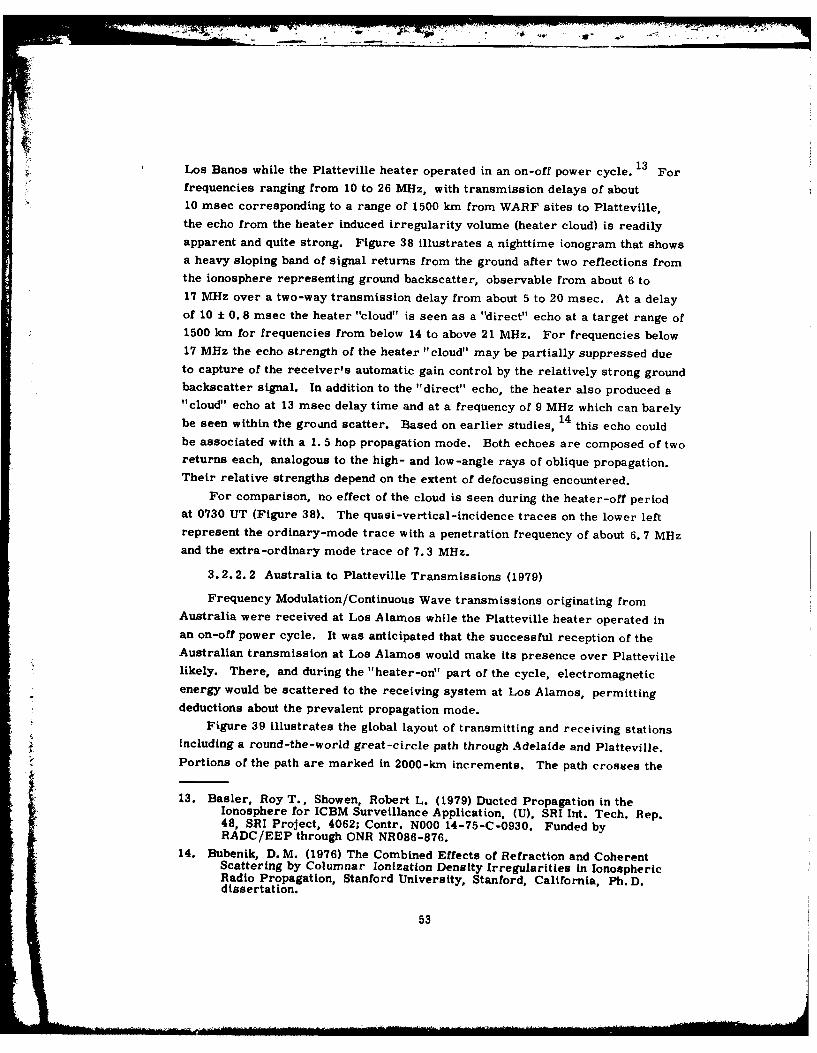
* ! Los Banos while the Platteville heater operated in an on-off power cycle. 13 Forfrequencies ranging from 10 to 26 MHz, with transmission delays of about10 msec corresponding to a range of 1500 km from WARF sites to Platteville,the echo from the heater induced irregularity volume (heater cloud) is readilyapparent and quite strong. Figure 38 illustrates a nighttime ionogram that showsa heavy sloping band of signal returns from the ground after two reflections fromthe ionosphere representing ground backscatter, observable from about 6 to17 MHz over a two-way transmission delay from about 5 to 20 msec. At a delayof 10 ± 0. 8 msec the heater "cloud" is seen as a "direct" echo at a target range of1500 km for frequencies from below 14 to above 21 MHz. For frequencies below17 MHz the echo strength of the heater "cloud" may be partially suppressed dueto capture of the receiver's automatic gain control by the relatively strong groundbackscatter signal. In addition to the "direct" echo, the heater also produced a"cloud" echo at 13 msec delay time and at a frequency of 9 MHz which can barelybe seen within the ground scatter. Based on earlier studies, 14 this echo couldbe associated with a 1. 5 hop propagation mode. Both echoes are composed of tworeturns each, analogous to the high- and low-angle rays of oblique propagation.Their relative strengths depend on the extent of defocussing encountered.
For comparison, no effect of the cloud is seen during the heater-off periodat 0730 UT (Figure 38). The quasi-vertical-incidence traces on the lower leftrepresent the ordinary-mode trace with a penetration frequency of about 6. 7 MHz
and the extra-ordinary mode trace of 7.3 MHz.
3.2.2. 2 Australia to Platteville Transmissions (1979)
Frequency Modulation/Continuous Wave transmissions originating fromAustralia were received at Los Alamos while the Platteville heater operated inan on-off power cycle. It was anticipated that the successful reception of theAustralian transmission at Los Alamos would make its presence over Plattevillelikely. There, and during the "heater-on" part of the cycle, electromagnetic
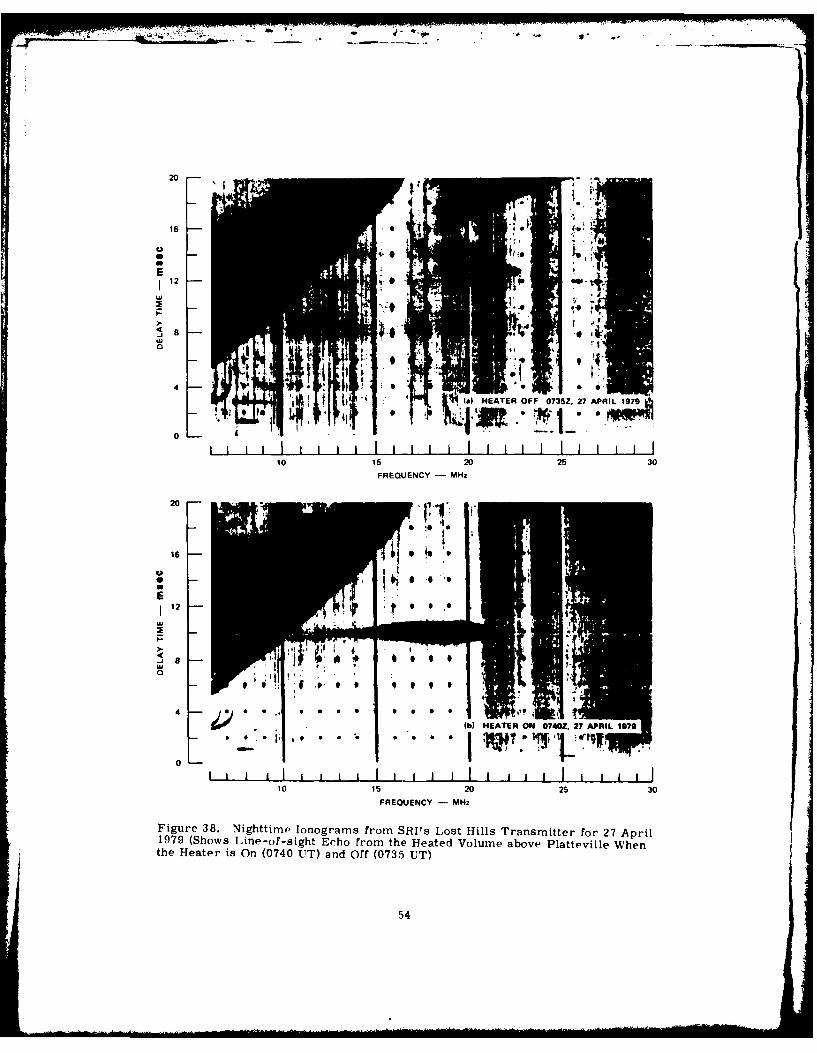
energy would be scattered to the receiving system at Los Alamos, permitting*deductions about the prevalent propagation mode." Figure 39 illustrates the global layout of transmitting and receiving stations
including a round-the-world great-circle path through Adelaide and Platteville.Portions of the path are marked in 2000-km increments. The path crosses the
13. Basler, Roy T., Showen, Robert L. (1979) Ducted Propagation in theIonosphere for ICBM Surveillance Application, (U), SRI Int. Tech. Rep.48, SRI Project, 4062; Contr. NOOO 14-75-C-0930. Funded byRADC/EEP through ONR NR086-876.
14. Bubenik, D. M. (1976) The Combined Effects of Refraction and CoherentScattering by Columnar Ionization Density Irregularities in IonosphericRadio Propagation, Stanford University, Stanford, California, Ph.D.dissertation.
53
20
16
E
12
I 1. Et+
Uj
0
101 0 53
12
4b) HEATER ON 070Z, 27 AIL 1979
11520 25 30FREQUENCY -MHz
Figure 38. Nighttime Ionograms from SRI's Lost Hills Transmitter for 27 April1979 (Shows Line-of-sight Echo from the Heated Volume above Platteville Whenthe Heater is On (0740 UT) and Off (0735 UT)
54
120 150 E 10 W 150 120 90 60 30 W 0 E 30 60 90 120 150 E
o- -- -o
80 8
60 soPLATTEVILLE
LOST HILLS -4
N N
0 I
20 Jl2
40 40ADELADOE , e
120 150I EOW 15O 120 90 60 W 0 E 30 i0 90 120 1OE
I. NIGHTI I I I I I I
1500 1700 1900 2100 2300 0100 0300 0500 0700LOCAL MEAN TIME
Figure 39. Map or the World Showing the Great-circle-path Defined byAdelaide and Platteville
equator at a distance of 6800 km from the location of the Australian transmitter.
Conventional multi-hop-propagation between earth and ionosphere from Nustraliato Colorado is mostly over water. Near the equator, propagating signals areexpected to encounter the equatorial anomaly. A particular local mean time isindicated on Figure 39 corresponding to 0700 UT. The day-night terminator isnear the east coast of Australia. Most of the path to Platteville is in darkness.
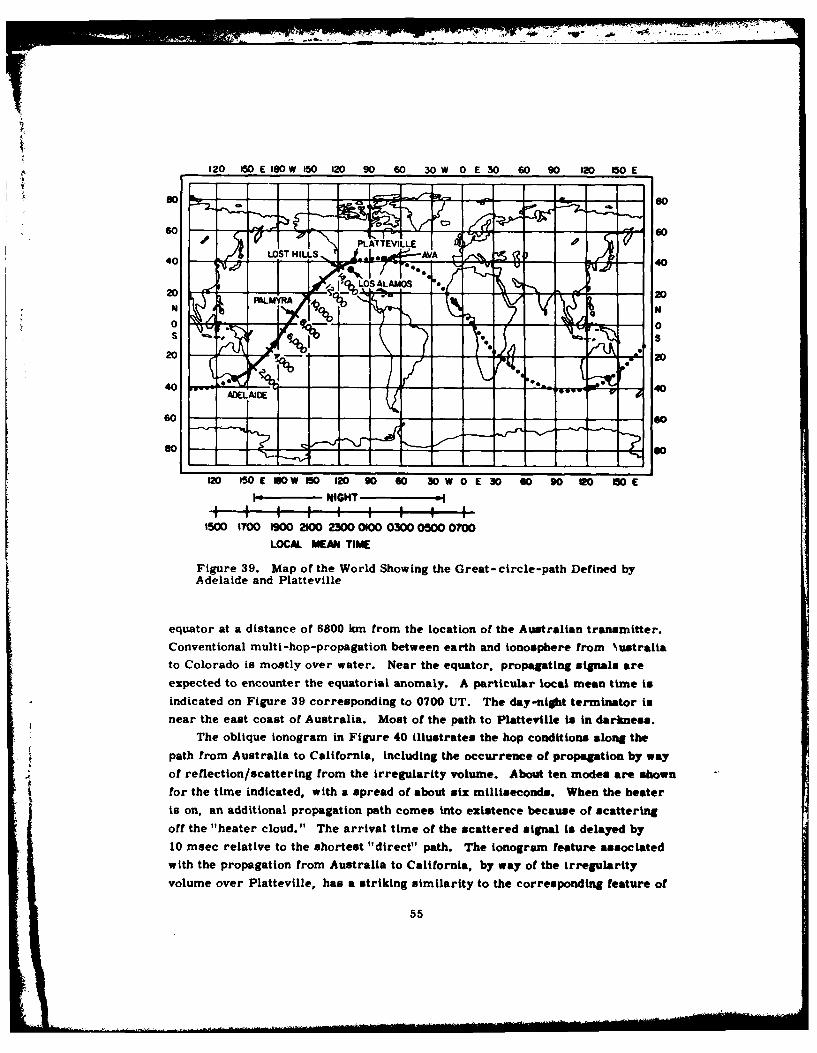
The oblique ionogram in Figure 40 illustrates the hop conditions along the
path from Australia to California, including the occurrence of propagation by wayof reflection/scattering from the irregularity volume. About ten modes are shown
for the time indicated, with a spread of about six milliseconds. When the heateris on, an additional propagation path comes into existence because of scattering
off the "heater cloud." The arrival time of the scattered signal is delayed by10 msec relative to the shortest "direct" path. The lonogram feature associated
with the propagation from Australia to California, by way of the irregularity
volume over Platteville, has a striking similarity to the corresponding feature of
55
. . . . . . . .
(a) HEATER OFF 0755Z. 27 APRIL 1976
6. . . . . . . . . .
* S
E
-I-
12 Is 20 25 30FREQUENCY -MHz
60 --
$ .;: EAER ON 081OZ'. 27 APRIL176q 6
48
12 1212FRQEC *
*iur 40 biu oor o teAsrlat o ao
Figuree 40.. Iwanobliqu 13onogrheaimu forteqAuetrali o Loe "alod ch a
never seen above the maximum observed frequency for "direct" propagation atLos Banos. Moreover, the geometry is not favorable for signals coming fromAustralia and arriving horizontally (glancing incident) over Platteville. beingscattered toward California. This fact, plus the observed limit in frequency ofthe echo from the heater cloud as seen at Los Banos, indicates that the Australian
56
signal, scattered from the irregularity volume over Platteville to Los Banos, did
not propagate from Australia to Platteville in an elevated ducted mode, but rather
in a conventional hop mode. 13 From Figures 35 and 36 it may be surmised that
Los Banos is indeed not likely to be found on loci of scattering cones of signals
arriving over Platteville in elevated ducts.
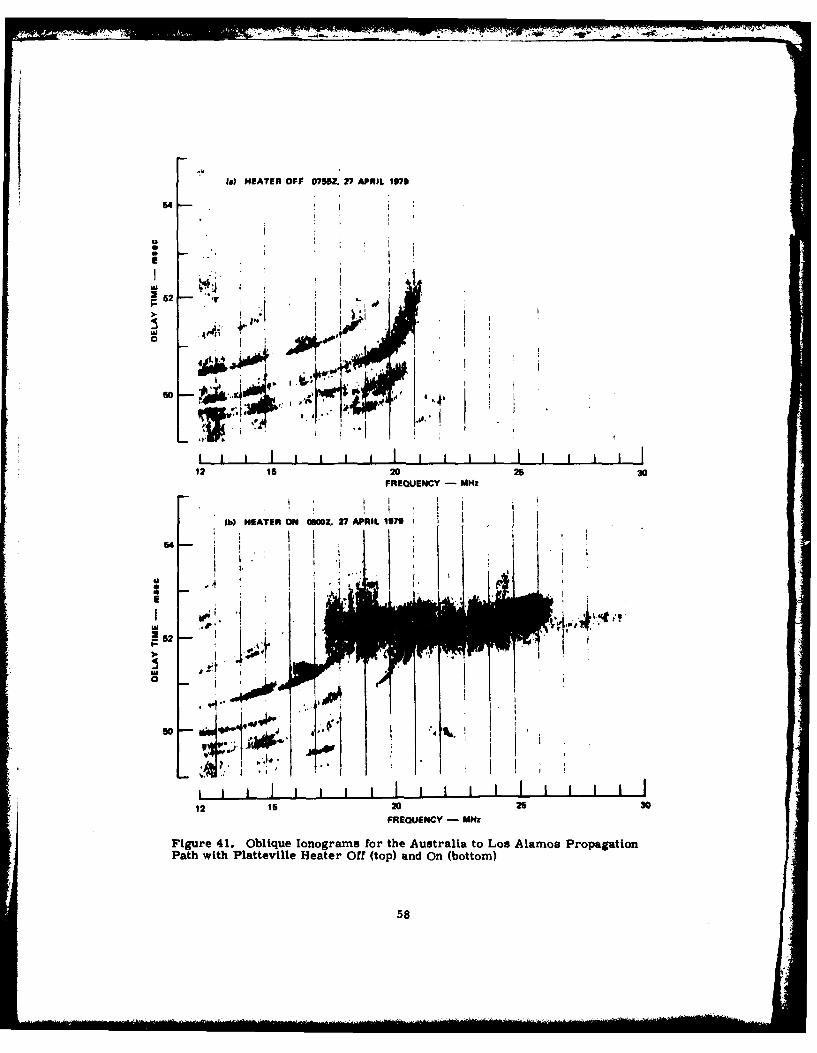
The lower portion of Figure 41 displays an oblique ionogram for the trans-
mission originating from Adelaide, Australia as received at Los Alamos over a
surface distance of about 14, 255 km. This ionogram was obtained on 27 April
1979 during the time interval 0800 to 0802 UT corresponding to 0100 to 0102 LTat Los Alamos and 1700 to 1702 LT at Adelaide. The propagation path is essen-
tially in darkness and the "terminator" is near and east of the transmitter. Sig-
nals originating from Adelaide and propagating northeast into nighttime ionosphere
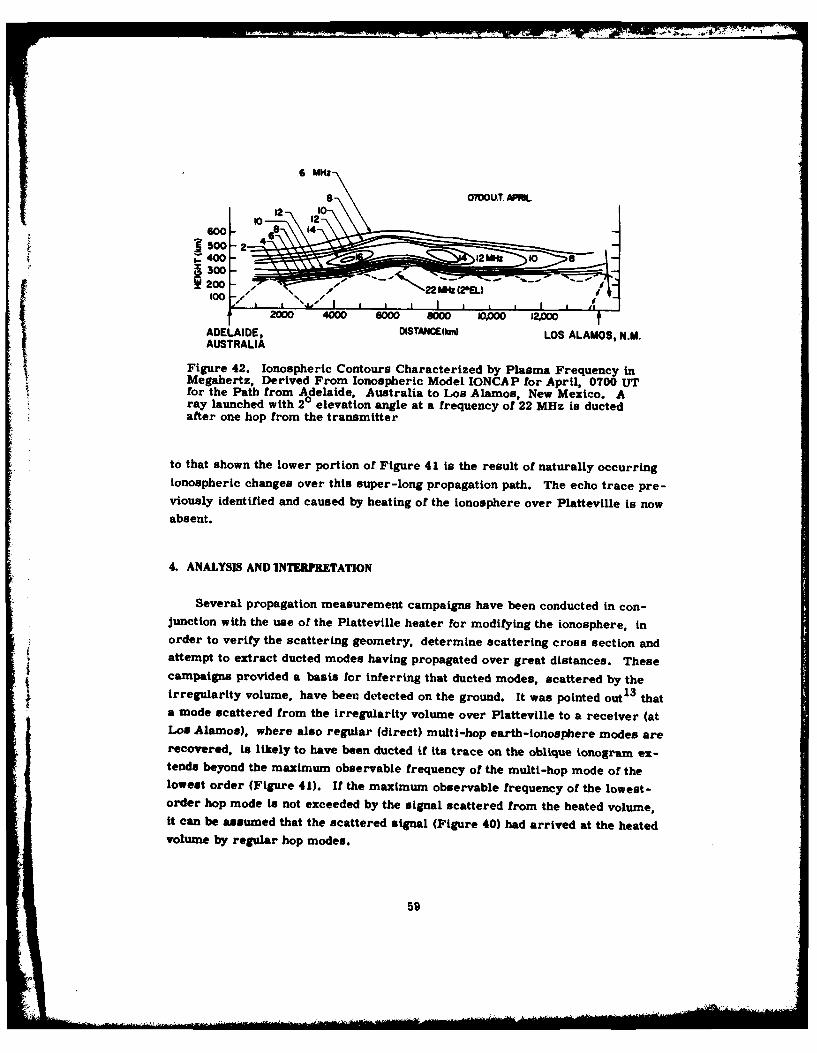
toward Los Alamos and Platteville, encounter negative horizontal ionization
gradients (Figure 42). In terms of ray refraction, such gradients are favorable
for injection of a family or rays into existing elevated ducts in which signals
propagate over large distances for as long as the duct is effectively maintained in
range, and with attenuation far below that expected for multi-hop propagation
between earth and ionosphere involving multiple traverses of the absorbing D
region.
At least 11 multi-hop modes are shown on the lower left of Figure 41 spread
over a 5 msec delay. Relative delay is read along the ordinate from about 48 to
55 msec. The time delay between Salisbury and Los Alamos, resulting from
pulse signal propagating along the surface of the earth over a great circle path
with the velocity of light, c, in free space is obtained dividing the great-circle
distance by c. The shorter great-circle distance between Adelaide and Los
Alamos was estimated to be 14, 255 km corresponding to a time delay of 47. 51
msec. With perfect time synchronization between the standard clocks at the
Adelaide transmitter and Los Alamos receiver, one would be able to place cor-
rectly absolute-delay time markers along the ordinate. This would allow one to
determine the delay in the arrival of the earliest earth-ionosphere hop mode.
For relatively uniform and undisturbed ionospheric conditions the knowledge of
absolute time could facilitate mode identification.
The echo trace extending in frequency from about 18 to 28 MHz and centered
on a relative delay of about 52 msec throughout this frequency range with delay
spread of one msec, is the result of scattering to Los Alamos of the "Adelaide"
signal from the ionospheric irregularity volume over Platteville. This echo
trace represents a feature of those oblique ionograms that were recorded while
the Platteville heater was on. In contrast, the upper portion of Figure 41 illus-
trates an ionogram taken 5 min earlier when the Platteville heater was off.
Unrelated to the heating process, a change in the hop-mode structure with respect
57
to) HEATER OFF 0755X. 27 APRIL 1979
54
52 vK
4 -
12 152 53
> FIT I I i i i IT.
12 iS20 25 30FREQUENCY - MHz
528
6MHz
0,0. . .
500-24000 6000 4000 00 I.0C0
ADELAIDE, DISTA4~E(ks)I LOS ALAMOS, N.M.AUSTRALIA
Figure 42. Ionospheric Contours Characterized by Plasma Frequency inMegahertz, Derived From Ionospheric Model IONCAP for April, 0700 UTfor the Path from Adelaide, Australia to Los Alamos, New Mexico. Aray launched with 20 elevation angle at a frequency of 22 MHz is ductedalter one hop from the transmitter
~to that shown the lower portion of Figure 41 is the result of naturally occurrIngionospheric changes over this super-long propagation path. The echo trace pre-viously identified and caused by heating of the ionosphere over Platteville is nowabsent.
~4. ANALYSIS AN4D INTER*PRETATION
Several propagation measurement campaigns have been conducted in con-junction with the use of the Platteville heater for modifyng the ionosphere, inorder to verify the scatterng geometry, determine scattering cross section andattempt to extract ducted modes having propagated over great distances. Thesecampaigns provided a basis for inferrng that ducted modes, scattered by the*1 irregularity volume, have been detected on the ground. It was pointed out1 3 thata mode scattered from the irregularity volume over Platteville to a receiver (at
Los Alamos), where also regular (direct) multi-hop earth-ionosphere modes arerecovered, is likely to have been ducted if its trace on the oblique lonograrm ex-tends beyond the maximum observable frequency of the multi-hop mode of thelowest order (Figure 41). If the maximum observable frequency of the lowest-order hop mode is not exceeded by the signal scattered from the heated volume,it can be asumed that the scattered signal (Figure 40) had arrived at the heated
volume by regular hop modes.
59
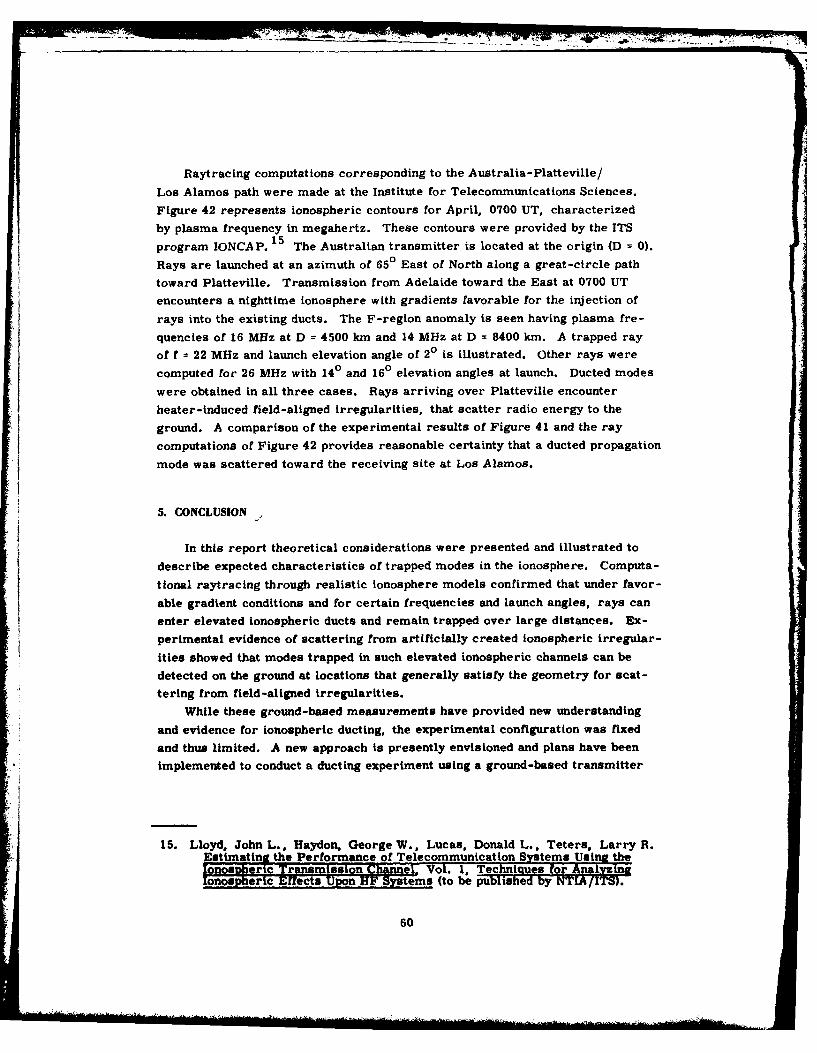
V W•_ W .7 I
Raytracing computations corresponding to the Australia-Platteville/
Los Alamos path were made at the Institute for Telecommunications Sciences.
Figure 42 represents ionospheric contours for April, 0700 UT, characterized
by plasma frequency in megahertz. These contours were provided by the ITS
program IONCAP. The Australian transmitter is located at the origin (D = 0).
Rays are launched at an azimuth of 650 East of North along a great-circle path
toward Platteville. Transmission from Adelaide toward the East at 0700 UT
encounters a nighttime ionosphere with gradients favorable for the injection of
rays into the existing ducts. The F-region anomaly is seen having plasma fre-
quencies of 16 MHz at D = 4500 km and 14 MHz at D = 8400 km. A trapped ray
of f = 22 MHz and launch elevation angle of 20 is illustrated. Other rays were
computed for 26 MHz with 14 and 16°0 elevation angles at launch. Ducted modes
were obtained in all three cases. Rays arriving over Platteville encounter
heater-induced field-aligned irregularities, that scatter radio energy to the
ground. A comparison of the experimental results of Figure 41 and the ray
computations of Figure 42 provides reasonable certainty that a ducted propagation
mode was scattered toward the receiving site at Los Alamos.
5. CONCLUSION
In this report theoretical considerations were presented and illustrated to
describe expected characteristics of trapped modes in the ionosphere. Computa-
tional raytracing through realistic ionosphere models confirmed that under favor-
able gradient conditions and for certain frequencies and launch angles, rays can
enter elevated ionospheric ducts and remain trapped over large distances. Ex-
perimental evidence of scattering from artificially created ionospheric irregular-
ities showed that modes trapped in such elevated ionospheric channels can be
detected on the ground at locations that generally satisfy the geometry for scat-
tering from field-aligned irregularities.
While these ground-based measurements have provided new understanding
and evidence for ionospheric ducting, the experimental configuration was fixed
and thus limited. A new approach is presently envisioned and plans have been
implemented to conduct a ducting experiment using a ground-based transmitter
15. Lloyd, John L., Haydon, George W., Lucas, Donald L.. Teters, Larry R.Estimatins the Performance of Telecommunication Systems Using theIonospheric Transmission Channel, Vol. 1, Techniques for AnalzinIonosperic Effects Upon sF ystems (to be published by NTIA ITS).
60
with the receiver, mounted on a space vehicle, orbiting at altitudes of the ducting
channel. It will then be possible, for the first time, to measure in situ the extentof ducting in ionospheric channels, and the properties of ionospherically ductedmodes.
61
-71 -
References
1. Tushentsova, I.A., Fishchuk, D.I., Tzedilina, Ye. Ye. (1975) Investigationof the global properties of ionospheric wave ducts, 2, Geomagn. Aeron.15(1):62-66.
2. Toman, K., Miller, D.C. (1977) Computational study of long-range high-frequency ionospheric ducting, Radio Science 12(3):467-476.
3. Gurevich, A. V., Tzedilina, Ye. Ye. (1976) Trapping of radiation in theionospheric duct during scattering on artificial inhomogeneities,Geomagn. Aeron. 15(6):713-715.
4. Gurevich, A.V. (1971) Effect of nonlinearity on the generation of circum-terrestrial signals, Geomagn. Aeron. 11(6):810-817.
5. Vever, A.S., Danilova, T. P., Shlionsky, A.G. (1978) Possibility of thetrapping of radio waves, scattered by meteor trails, by ionosphericducts, Geomagn. Aeron. 18(3):306-308.
6. Erukhimov, L. M., Matyugin, S. N., Uryadov, V. P. (1975) Radio wavepropagation in ionospheric wave channels, Radiophysics & QuantumElectronics 18(9):958-963.
7. Rush, C. M., Elkins, T.J. (1975) An assessment of the magnitude of theF-region absorption on HF radio waves using realistic electron densityand collision frequency models, ITU Telecommunication Journal,Geneva.
8. Toman, K. (1979) High-frequency ionospheric ducting - A review, RadioScience 14(3):447-453.
9. Golyan. S. F. (1975) Optimal conditions for extra-long-range short-wavepropagation, Radiophysics & Quantum Electronics 18(9):1014-1022
10. Miller, D. C., Gibbs, J. (1978) Ionospheric Modeling and PropagationAnalysis, RADC-TR-78-163.
11. Showen, R. L., Zavoll, W. B. (1979) Platteville Heating Results: HF RadarObservations, SRI International, Tech. Report No. 43.
63
40 W1-

. . . . . . . . . ..- . ~--",7
12. Fialer, P.A. (1974) Field-aligned scattering from a heated region of theionosphere - observations at HF and VHF, Radio Science 9(11):923 -940.
13. Easler, Roy T., Showen, Robert L. (1979) Ducted Propagation in theIonosphere for ICBM Surveillance Application. (U) SRI Int. Tech.Rp48, SRI Project, 4062: Co-ntr. NUUO 14-75-C-0930. Funded byRADC/EEP through ONR NR086-876.
14. Bubenik, D. M. (1976) The Combined Effects of Refraction and CoherentScattering by Columnar Ionization Density Irreaularities in IonosphericRadio Pro ation, Stanford University, Stanford, California, Ph.D.
3tsseRa ton.15. Lloyd, John L., Haydon, George W., Lucas, Donal L., Teters, Larry R.
Estimating the Performance of Telecommunication Systems Using theIonospheric Transmission Channel, Vol. 1, Techniques for AnalyzingIonospheric Effects Upo HSstms (to be pulished by NTIA rIS)
64
MISSIONOf
Rawe Air De'velop-,-zent (ioterRAVC pfian6 and execzwtc5A k~ca'ch, devetopment, -tut- and.sec~ted czcqw z on pugo Law1 in sqppo'tt o6 Command, Con tot
4 CommuniUa.tiom~ and Inte!tigence (C3 1) activLtie6 ehic-eao~d eoqinve~~iq suppw, ' t wi.thin a, eas o .techiticat compe~tence'f. s p 'touided to ESP P 'toqkam OKcc,6 WsO) and othve. ESQ
)etementz . The pinccvC. to-chnicat mi/,zion zo'eas a/LeSconmLuncaiom,, e2.ec-tomagnet .c guidane and conttoe, 6ut--
v'eitUiance oK quu~nd and aemo.pae ob ' ect/, inte&'.Zence dat4acoetcton and hancLtjng, in~o~wation .6py-tem tchnotoqg',
phqy,6c~s and e1.ecttmocic rabZLttq, ma LtanabiL&tyj and
comnpatibitity. .
Printed hyUnited Stutes Air ForceHantcomn AFB, Mass. 01731