146 15 cpr_patients online
29
MATH& 146 Lesson 15 Section 2.3 Randomization Case Study: CPR Patients 1
Transcript of 146 15 cpr_patients online

MATH& 146
Lesson 15
Section 2.3
Randomization Case Study:
CPR Patients
1

Two-Sided Hypotheses
Earlier we explored whether women were
discriminated against (Lesson 12) and whether a
simple trick could make students a little thriftier
(Lesson 13). In these case studies, we have
actually ignored some possibilities:
• What if men are actually discriminated against?
• What if the money trick actually makes students
spend more?
2

Two-Sided Hypotheses
These possibilities weren't considered in our
hypotheses or analyses. This may have seemed
natural since the data pointed in the directions in
which we framed the problems.
However, there are two dangers if we ignore
possibilities that disagree with our data or that
conflict with our worldview:
3

Two-Sided Hypotheses
1) Framing an alternative hypothesis simply to
match the direction that the data point will
generally inflate the Type 1 Error (false
positive) rate. After all the work we've done
(and will continue to do) to rigorously control
the error rates in hypothesis tests, careless
construction of the alternative hypotheses can
disrupt that hard work.
4

Two-Sided Hypotheses
2) If we only use alternative hypotheses that
agree with our worldview, then we're going to
be subjecting ourselves to confirmation bias,
which means we are looking for data that
supports our ideas. That's not very scientific,
and we can do better!
5

Two-Sided Hypotheses
Previously, we only considered one-sided
hypothesis tests, since they only explored one
direction of possibilities. Such hypotheses are
appropriate when we are exclusively interested in
the single direction.
Usually, however, we would want to consider all
possibilities. To do so, we would use two-sided
hypothesis tests.
6

CPR Patients
Let us consider a new study that examines the
impact of using blood thinners on patients who
have undergone CPR.
Cardiopulmonary resuscitation (CPR) is a
procedure used on individuals suffering a heart
attack when other emergency resources are
unavailable. This procedure is helpful in providing
some blood circulation to keep a person alive, but
CPR chest compressions can also cause internal
injuries.
7

CPR Patients
Internal bleeding and other injuries that can result
from CPR complicate additional treatment efforts.
For instance, blood thinners may be used to help
release a clot that is causing the heart attack once
a patient arrives in the hospital. However, blood
thinners negatively affect internal injuries.
8

CPR Patients
Here we consider an experiment with patients who
underwent CPR for a heart attack and were
subsequently admitted to a hospital. Each patient
was randomly assigned to either receive a blood
thinner (treatment group) or not receive a blood
thinner (control group).
The outcome variable of interest was whether the
patient survived for at least 24 hours.
9

Example 1
Form hypotheses for this study in plain and
statistical language. Let pc represent the true
survival rate of people who do not receive a blood
thinner (corresponding to the control group) and pt
represent the survival rate for people receiving a
blood thinner (corresponding to the treatment
group).
10

CPR Patients
There were 50 patients in the experiment who did
not receive a blood thinner and 40 patients who
did. The study results are shown below.
11
Survived Died Total
Control 11 39 50
Treatment 14 26 40
Total 25 65 90

Example 2
What is the observed survival rate in the control
group? And in the treatment group? Also, provide
a point estimate of the difference in survival
proportions of the two groups:
12
Survived Died Total
Control 11 39 50
Treatment 14 26 40
Total 25 65 90
ˆ ˆ .t cp p

CPR Patients
As we did with the gender discrimination study and
the opportunity cost study, we will simulate what
type of difference we might see from chance alone
under the null hypothesis.
By randomly sampling "simulated treatment" and
"simulated control" stickers to the patients' files, we
get a new grouping.
13

CPR Patients
If we repeat the simulation 10,000 times, we can
build a null distribution of the difference shown
below.
14

CPR Patients
The right tail is about 0.13. (Note: This is only
coincidence that the right tail matches the point
estimate.)
15

CPR Patients
However, contrary to how we calculated the
p-value in previous studies, the p-value of this test
is not 0.13.
16

p-Values
The p-value is defined as the chance we observe a
result at least as favorable to the alternative
hypothesis as the result (i.e. the difference) we
observe.
17

CPR Patients
In this case, any differences less than or equal to
–0.13 would also provide equally strong evidence
favoring the alternative hypothesis as a difference
of 0.13.
A difference of –0.13 would correspond to 13%
higher survival rate in the control group than the
treatment group.
18
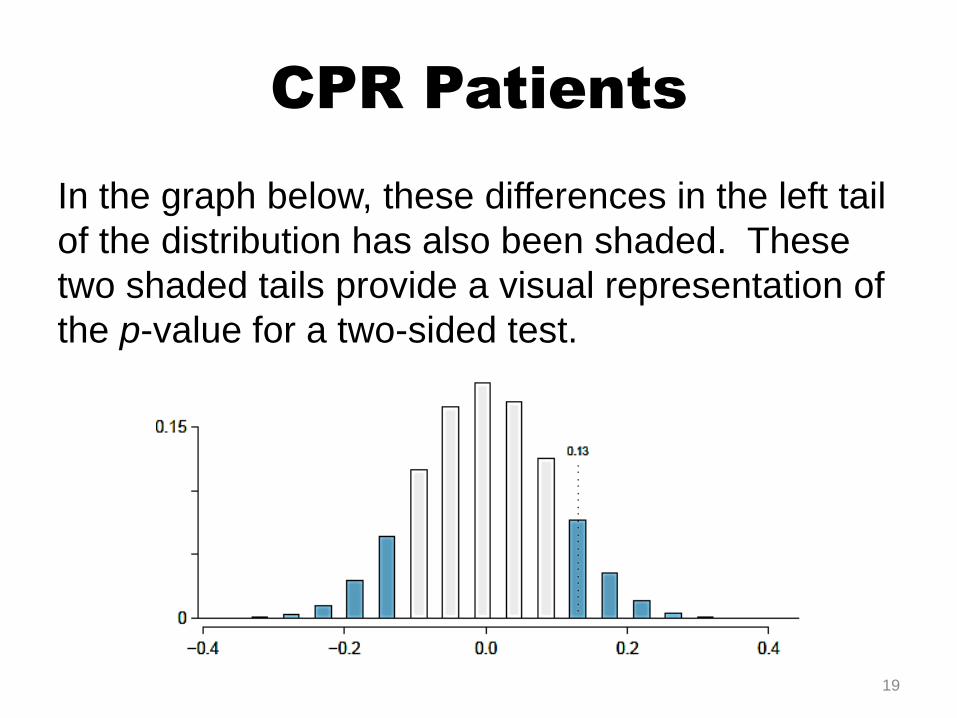
CPR Patients
In the graph below, these differences in the left tail
of the distribution has also been shaded. These
two shaded tails provide a visual representation of
the p-value for a two-sided test.
19
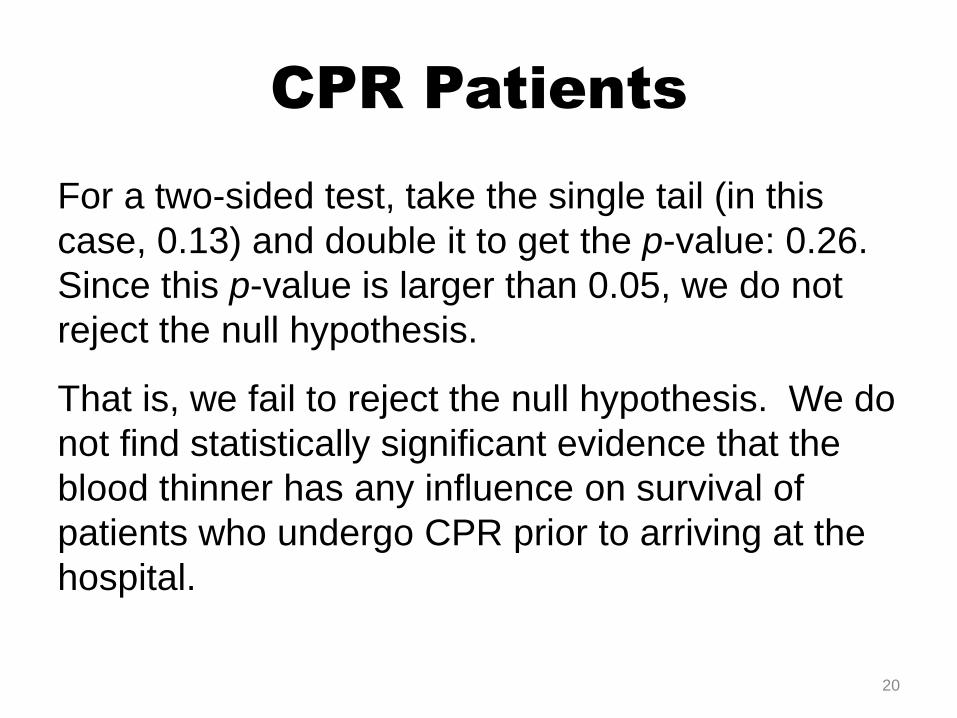
CPR Patients
For a two-sided test, take the single tail (in this
case, 0.13) and double it to get the p-value: 0.26.
Since this p-value is larger than 0.05, we do not
reject the null hypothesis.
That is, we fail to reject the null hypothesis. We do
not find statistically significant evidence that the
blood thinner has any influence on survival of
patients who undergo CPR prior to arriving at the
hospital.
20

Controlling the Type 1 Error Rate
We want to be rigorous and keep an open mind
when we analyze data and evidence. Use a one-
sided hypothesis only if you truly have interest in
only one direction.
Unless you have a specific reason otherwise, go
with a two-sided hypothesis. And if you have
chosen a two-sided test, it is never okay to change
to one-sided tests after observing the data.
21

Example 3
Suppose we are interested in finding any
difference from 0 (a two-sided test question).
We've created a smooth looking null distribution
presenting differences due to chance.
22

Example 3 continued
a) What would be the p-value under the two-sided
hypothesis HA: difference ≠ 0.
b) What would be the p-value if we switched to the
one-sided hypothesis HA: difference > 0.
23

Controlling the Type 1 Error Rate
Notice in the two-sided case we would have failed
to reject the null hypothesis, while in the one-sided
case we would have rejected (a false positive).
After observing data, it is tempting to turn a two-
sided test into a one-sided test. Avoid this
temptation. Hypotheses should be set up before
observing the data.
24

How to Use a Hypothesis Test
When conducting hypothesis tests, we will follow
the following steps:
1) Frame the research question in terms of
hypotheses.
2) Collect data with an observational study or
experiment.
3) Analyze the data.
4) Form a conclusion.
25

How to Use a Hypothesis Test
Frame the research question in terms of
hypotheses.
Hypothesis tests are appropriate for research
questions that can be summarized in two
competing hypotheses. The null hypothesis (H0)
usually represents a skeptical perspective or a
perspective of no difference. The alternative
hypothesis (HA) usually represents a new view or a
difference.
26

How to Use a Hypothesis Test
Collect data with an observational study or
experiment.
If a research question can be formed into two
hypotheses, we can collect data to run a
hypothesis test. If the research question focuses
on associations between variables but does not
concern causation, we would run an observational
study. If the research question seeks a causal
connection between two or more variables, then
an experiment should be used.
27

How to Use a Hypothesis Test
Analyze the data.
Choose an analysis technique appropriate for the
data and identify the p-value. So far, we've only
seen one analysis technique: randomization.
Throughout the rest of this course, we'll encounter
several new methods suitable for many other
contexts.
28

How to Use a Hypothesis Test
Form a conclusion.
Using the p-value from the analysis, determine
whether the data provide statistically significant
evidence against the null hypothesis. Also, be
sure to write the conclusion in plain language so
casual readers can understand the results.
29