14565A Quick Start Guide - Rochester Institute of...
16
Quick Start Guide Agilent Technologies 14565A Device Characterization Software for Windows 98, Windows NT 4.0, Windows 2000 and Windows XP sA
Transcript of 14565A Quick Start Guide - Rochester Institute of...

Quick Start Guide Agilent Technologies 14565A Device Characterization Software for Windows 98, Windows NT 4.0, Windows 2000 and Windows XP
sA
2
Contents
Description ..........................................................................................................3
System Requirements .........................................................................................3
Installing and Running the Software ................................................................4
Configuring the I/O ............................................................................................4
Performing Basic Operations ............................................................................5
Display Area........................................................................................................6
Making Triggered Measurements.....................................................................7
Performing Measurements on Waveforms.......................................................8
Placing a Waveform on the Display ..................................................................9
Generating CCDF Graphs...............................................................................10
Long Term Data Logging.................................................................................11
Saving and Printing Measurement Data ........................................................13
Advanced Controls ...........................................................................................13
Sample Waveforms...........................................................................................16
Warranty...........................................................................................................16

3
Description What the Agilent 14565A Will Do
The Agilent Technologies 14565A Device Characterization Software is an easy-to-use graphical user interface for the Agilent 66300-series dc sources. With it, you can:
Control output and measurement functions from a single window.
View output measurements on an oscilloscope-like display. Copy, save, or print captured waveforms. Recall saved waveforms for on-screen comparison with live
waveforms. Adjust horizontal and vertical markers to perform
measurements on a selected section of the waveform. Operate in either simulation mode (no hardware required),
or in instrument control mode. Long-term voltage and current data logging.1
• Generate CCDF graphs of battery current drain.1 1Available on 66319B/D and 66321B/D dc sources with firmware version A.03.00 or later.
What the Agilent 14565A Will Not Do
The Agilent 14565A Device Characterization Software does not: Control instruments other than Agilent dc sources. Provide drivers for other GPIB instruments. Operate with Windows 3.1.
Firmware Upgrade
66319B/D and 66321B/D firmware upgrade p/n = 5182-9091. Refer to the on-line help for firmware upgrade instructions.
System Requirements Computer Pentium 233 MHz (minimum)
64 Mbytes RAM
Platforms Windows 98 Windows NT 4.0 Windows 2000 Windows XP
Interface Libraries and Cards
Agilent IO Library version K.01.00 or later National Instruments VISA Run-time Engine version 2.6 National Instruments GPIB2 Agilent 82350A and 82341C RS 2323
2Requires NI-488.2 (Win32) version 1.6 or later
Supported dc Source Models
Agilent 66309B/D3 Agilent 66311A/B/D3 Agilent 66312A/66332A3 Agilent 66319B/D; 66321B/D
3Does not support CCDF measurements and long term data logging.

4
Installing and Running the Software
NOTE: Before running the Agilent 14565A application, you must have installed and connected the dc source to a computer with the appropriate interface cable. You must also have the appropriate interface card installed and configured. If you are using an Agilent interface card, you must have the appropriate SICL or VISA library drivers installed.
1. Place the CD-ROM in the CD-ROM drive and run Agilent14565A.exe. 2. Follow the directions on the screen to install the software. The Readme.txt
file contains product updates or corrections that are not documented in the on-line help file. Use any text editor to open and read this file.
3. To run the Agilent 14565A application, click on its desktop icon.You can also click on the Start button and select:
Programs | Agilent Technologies | 14565A Device Characterization Software Additional information about the Agilent 14565A application is available in
the on-line help that can be accessed from the application.
Configuring the I/O This step is necessary to establish communication with the dc source. Make sure that the dc source is turned on. To configure the I/O, select I/O Configuration command in the Source menu. The I/O configuration screen comes up automatically when you turn Simulation mode off in the Source menu. Note that VISA is the required I/O type for the Data Logging and CCDF functions.
If there seems to be no communication between the Agilent 14565A application and the dc source, select Auto Detect to detect any dc sources connected to your computer. If you still cannot communicate with the dc source and you wish to exit the application, select Simulation mode in the IO type field. Then exit the application.
NOTE: If you program the unit from its front panel while the Agilent 14565A application is running, you must refresh or update the application. Go to the View menu and select the Reread Instrument State command.
For HP-IB cardsonly. Must matchSICL name used
in GPIB card’sconfiguration.
Select I/O type. (Simulation,
HP-IB, GPIB, VISA, or serial)
Address mustmatch setting of
instrument.(HPIB/GPIB only)
Serial port only. Specifies the comm port on the PC.
Serial port only. Dc source must match these Baud rate, Parity and Flow control settings
Click to automatically search for any dc source on the interface.

5
Performing Basic Operations
The Main window appears when you run the Agilent 14565A application. From this window you can control the output of the dc source and view output measurements.
NOTE: Not all controls are displayed when you initially run the Agilent 14565A application. Output 2 controls are only available on Agilent 66309B/D and 66319B/D. DVM controls are only available on Agilent 66311D/66309D and 66319D/66321D.
To display a sample waveform:
Select the Load Waveform command in the File menu, and then select DemoWaveform1.txt.
Select Active Waveform in the Load Waveform Location dialog box. The waveform should match the one shown in the above figure.
To set the voltage, current, and resistance levels:
Click in the field labeled Voltage, type in the desired output voltage and press Enter.
Enter a current limit value in the field labeled Current.
For units that have programmable output resistance, enter a resistance value in the field labeled Resistance.
To turn on the output:
Enable the dc source output by moving the slide switch to ON. On some models, each output has its own output control. If the message OVLD appears in the display, set the Current Measurement control to the Hi Range.
Turn onoutput 1.
Click V to measure voltage; Click A to measure current.
Click to make a measurement. This overwrites the previous waveform.
Adjust values to vary sample rate and vertical scale.Can be done before or after measurement.
Enter voltageand currentfor output 1.
Output 2 andDVM controlsnot available
on all models.Use View menu
to display.

6
To make a measurement:
Click the A button to select current measurements; click the V button to select voltage measurements.
Click the Measure button to make the measurement.
Adjust the time/div and amps/div fields to adjust the sample rate and vertical scale. Click Auto Scale to fit the display to the acquired waveform.
To view the output 2 controls and the DVM display:
If your dc source has a second output or a DVM input, go to the View menu and check the item that you wish to display. ✔ Second Output ✔ Digital Voltmeter If the item is grayed out, your dc source does not have this feature.
Display Area
The display area displays the output measurement after the Measure button is pressed. Only measurements from the main output can be displayed. The following figure describes the various measurements displayed in the window.
The values in the measurement area at the bottom of the display are calculated from the all of the data that is captured in the display. If horizontal markers have been set, measurements are calculated only from the data between the markers. Refer to Performing Measurements on Waveforms.
Calculated measurements at the bottom of the display may not agree exactly with values shown on the front panel of the instrument if the sample rate of the display differs significantly from the instrument’s front panel sample rate.
Displays themeasurementscalculated fromthe waveform.
Average high level.
Average low level.
Maximum measured
value.
Vertical axis displays
amplitude.
Minimummeasured
value.

7
Making Triggered Measurements
Triggered measurements let you control when the measurement trigger will occur. The following figure describes the various trigger controls.
NOTE: If you do not know where to set the trigger level, you can make a measurement with the trigger set to Auto Trig. Then view the measurement to see where to place the trigger level. Set the trigger controls and make another measurement.
Click the A button to select current measurements; click the V button to select voltage measurements.
• Set the time/div control to a value that is appropriate for the load’s transient timing.
• Set up the measurement trigger. Choose from Auto, Pos Slope, Neg Slope, or Either Slope. External lets you apply an external trigger signal to the Output Port connector. Refer to the User’s Guide for more information.
• Adjust the Level slide control until the trigger level is at the point where the trigger should occur. The trigger level is displayed as a red horizontal line on the display.
NOTE: The trigger level cannot go negative. Set the trigger control to Auto Trig to trigger negative waveforms.
• Use the Pre-Trigger control to show pre-trigger waveform information. When this control is used, the trigger point will be displayed as a short vertical red line on the bottom of the waveform display graph.
Move slideto specify
the triggerlevel.
Specifies a hysteresis band around the trigger level.
Trigger point is identified by a vertical red line.
Click to initialize a triggered measurement
Trigger level is identified by a red line.
Specify the # ofsweeps. Refer to the on-line
help.
Set up thetriggered
measurement
Move slide tospecify a
trigger offset.
8
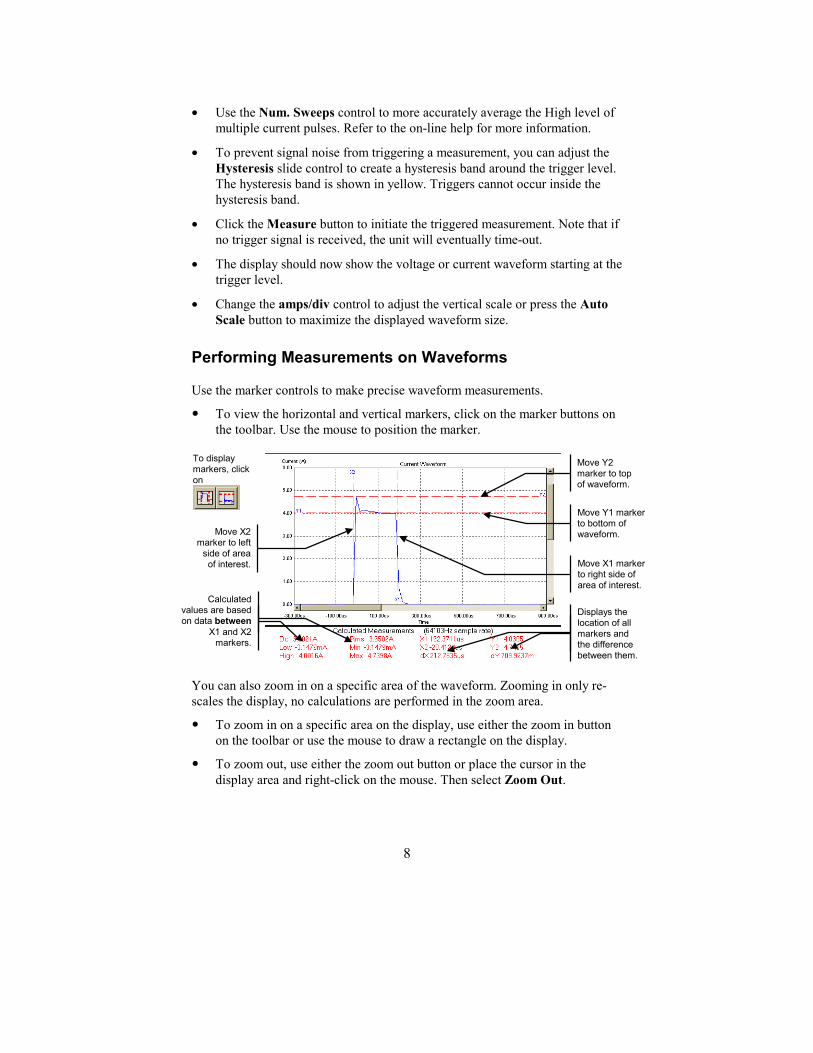
• Use the Num. Sweeps control to more accurately average the High level of multiple current pulses. Refer to the on-line help for more information.
• To prevent signal noise from triggering a measurement, you can adjust the Hysteresis slide control to create a hysteresis band around the trigger level. The hysteresis band is shown in yellow. Triggers cannot occur inside the hysteresis band.
• Click the Measure button to initiate the triggered measurement. Note that if no trigger signal is received, the unit will eventually time-out.
• The display should now show the voltage or current waveform starting at the trigger level.
• Change the amps/div control to adjust the vertical scale or press the Auto Scale button to maximize the displayed waveform size.
Performing Measurements on Waveforms
Use the marker controls to make precise waveform measurements.
To view the horizontal and vertical markers, click on the marker buttons on the toolbar. Use the mouse to position the marker.
To display markers, click on
You can also zoom in on a specific area of the waveform. Zooming in only re-scales the display, no calculations are performed in the zoom area.
To zoom in on a specific area on the display, use either the zoom in button on the toolbar or use the mouse to draw a rectangle on the display.
To zoom out, use either the zoom out button or place the cursor in the display area and right-click on the mouse. Then select Zoom Out.
Calculated values are based on data between
X1 and X2 markers.
Move X2marker to left
side of areaof interest.
Move Y2 marker to top of waveform.
Displays the location of all markers and the difference between them.
Move X1 marker to right side of area of interest.
Move Y1 marker to bottom of waveform.

9
To zoom, either click on
Placing a Waveform on the Display
Up to two reference waveforms can be shown on the display along with the measured or active waveform. This is useful if you want to compare waveform measurements to a “standard” or reference waveform to make a pass/fail determination on the measurement. Waveforms are displayed in different colors, which can be edited by selecting Edit/Preferences. Measurement calculations can only be done on active waveforms, not reference waveforms.
Select the Load Waveform command in the File menu to load a waveform.
Enter the filename of the waveform in the Open dialog box. The default location is C:\Program Files\Agilent Technologies\14565A DCS.
Select Active Waveform in the Select Waveform Location dialog box only if you want to perform measurements on the loaded waveform. Note that data logging and CCDF waveforms cannot be loaded as active waveforms, only reference waveforms.
Use the Remove Waveform command in the File menu to remove a loaded waveform from the display.
or draw arectangle with
the mouse in thearea of interest.
Marker calculations cannot bemade on reference waveformsLoading a reference waveformdoes not overwrite the display.
Marker calculations can only bemade on active waveforms.Loading an active waveform
overwrites the display..
Removing a waveformdoes not delete the
waveform file.
None of these measurements are affected by
the zoom controls.
Indicates location of mouse.

10
Generating CCDF Graphs
NOTE: The CCDF measurement capability is only available on Agilent 66319B/D and 66321B/D dc sources that have firmware version A.03.00 and up.
Complimentary Cumulative Distribution Function (CCDF) graphs are used to concisely summarize short and long-term battery drain measurements for analysis and comparison. It is a cumulative distribution of the amplitude versus the frequency (or percent) of occurrence. This is especially useful for analyzing signals that are random over time. CCDF graphs can be made for output 1 voltage, output 1 current, or the DVM input.
Once the measurement is started, the current or voltage is continuously sampled at the desired sampling rate. The software then creates a histogram comprised of 2048 elements or buckets. Each sampled value is placed into one of the buckets according to its amplitude. Each time a measurement sample is placed in a bucket, the value of the bucket is incremented by one. The value in each bucket only represents the number of times a measurement sample that corresponds to the bucket's amplitude has been detected. If any samples fall outside the range of the histogram, the values are clipped and placed in the end buckets.
As the measurement proceeds, all histogram values are normalized, summed, and then reordered from 100% to 0% to generate the CCDF graph.
Click the button to select the CCDF measurement window.
Select the Measurement mode on the left side of the screen. Select Current, Voltage, or DVM.
For Current measurements, select a range. Select High, Medium, or Low.
Select a currentrange and type.
Pulse is preferred.
X axis Indicates the amplitude of current/voltage.
Y axis indicates % occurrence of the data.
Click to start the CCDF measurement
Displays theremaining time of
the acquisition.
Select the kind ofmeasurement.
Specify theduration of the
acquisition.
Horizontal and vertical markers displayed.

11
For Current measurements, also select a Type. The preferred type is Pulse because it provides the best accuracy for waveform measurements.
Select the Acquisition Period (the duration of the CCDF measurement). Enter the time in hours, minutes, and seconds (hhhh:mm:ss). This controls a timer that tells the application when to stop the measurement.
Click the Measure button to start the CCDF measurement.
The display will now update periodically until the acquisition period is complete. The Remaining Period field indicates how much time has elapsed since the beginning of the test.
NOTE: If you use the front panel controls on the left side of the window to change any settings during the acquisition, this changes the conditions under which the data is collected and may invalidate the data. To prevent unauthorized access of the application during long tests, enable the password-protect feature of your computer's screen saver.
Long Term Data Logging
NOTE: The long-term data logging capability is only available on Agilent 66319B/D and 66321B/D dc sources that have firmware version A.03.00 and up.
Long-term data logging, for hours to days, of the current and voltage of the device under test is fundamental in measuring its power consumption and determining its battery operating time. Long-term data logging measurements can be made for output 1 current, output 1 current and voltage, or output 1 current and DVM input.
Once the measurement is started, the current or voltage is continuously integrated over the acquisition period. Current measurements are captured over a 5-millisecond to 1-second integration time at a 15.6 microsecond sampling rate. Three values are returned - dc, maximum, and minimum. The dc value is calculated by averaging all samples taken over the duration of the integration period. The highest sample is the maximum value; the lowest sample is the minimum value. If selected, voltage measurements are also taken at regular intervals during the acquisition period. Data acquisition is continuous - unless it is stopped or until the end of the measurement period is reached.
The graph displays three separate current waveforms; maximum, minimum and dc, each in a different color. If Grey Band is selected as the current graph type, the graph displays the minimum and maximum values as a gray band behind a red line. The red line indicates the dc value. If selected, voltage values are displayed as a blue line on the top of the display. The data appears as the

12
measurements are made. When the data fills the display, the display is resized to a larger resolution to allow more room for the data to be displayed.
Click the button to access the Data Logging measurement window.
Select the Measurement mode on the left side of the screen. Select Current, Voltage + Current, or DVM + Current.
Select the Current Measurement Range. Select High, Medium, or Low.
Select the Current Measurement Type. The preferred type is Pulse because it provides the best accuracy for waveform measurements.
Select the Acquisition Period (the duration of the data logging). Enter the time in hours, minutes, and seconds (hhh:mm:ss). This controls a timer that tells the application when to stop the measurement. The timer has a minimum resolution of 3 seconds.
Select which current measurements to graph. Select Max, DC, Min, or Gray Band. (Max, Dc, and Min. shown).
Press the Measure button to start the data logging.
The display will now update periodically until the acquisition period is complete. The Remaining Period field indicates how much time has elapsed since the beginning of the test. When the test completes, you are prompted to specify a filename in which to save the data in binary format.
NOTE: If you use the front panel controls on the left side of the window to change any settings during the acquisition, this changes the conditions under which the data is collected and may invalidate the data. To prevent unauthorized access of the application during long tests, enable the password-protect feature of your computer's screen saver.
Select a currentrange and type.
Pulse is preferred.
Voltage amplitude.
Click to start long-term data logging.
Displays theremaining time of
the acquisition.
Select the kind ofmeasurement.
Specify theduration of the
acquisition.Maximum current.
Select whichmeasurements to
graph.
Minimum current.
DC current.

13
Saving and Printing Measurement Data
Use the Save Waveform command in the File menu to save the voltage or current measurement data to an ASCII text file that you specify in the Save As dialog box. Voltage or current waveforms are saved in a 2-column Time/Voltage or Time/Current format. CCDF measurements are saved in a 2-column Amplitude and %Occurrence format. Data logging entries saved in a 5-column format: Time, CurrentMax, CurrentDC, CurrentMin, and Voltage.
This text information can be imported into a database or spreadsheet, or edited by a text editor. This is useful if you need to create a reference waveform that you would normally not be able to create by just taking a measurement.
The Agilent 14565A application supports printing and print previewing of the display. Use the Print Preview command in the File menu to preview the display. Use the Print command to print the display to your default printer.
Advanced Controls
To configure output measurements:
Select the Measurement Settings command in the Source menu.
To configure CCDF settings:
Select the CCDF Settings command in the Source menu. All parameters can also be set in the CCDF measurement window.
Selects the currenttype. Use Pulse for
waveforms. Refer tothe on-line help formore information.
Selects low, medium,or high current range
measurements.
Selects the windowing function for measurement calculations. Refer to the on-line help for more information.
Displays the sampletime in seconds.
Selects themeasurement input.
Displays totalacquisition time in
hours, minutes andseconds.
Selects a current type. Pulse is preferred.
Selects a current measurement range.
Displays the present sample point for which data is being collected.
Displays the initialhistogram size.
The high and low limit of the current range.
14
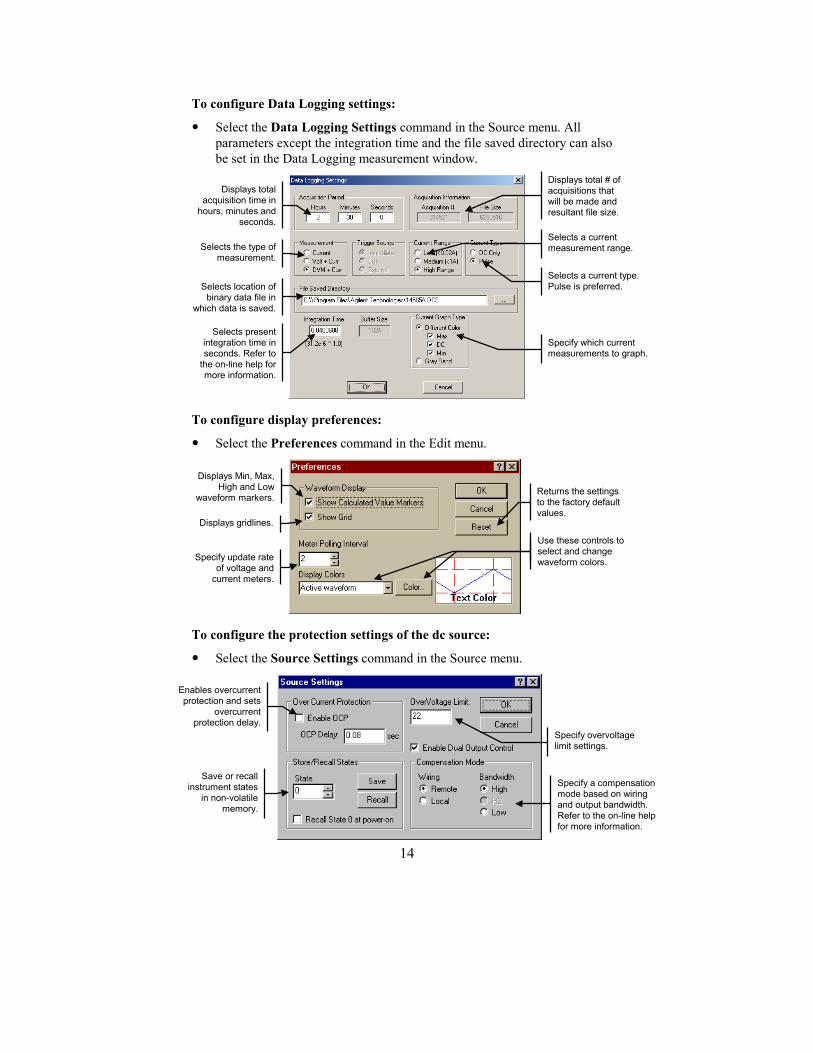
To configure Data Logging settings:
Select the Data Logging Settings command in the Source menu. All parameters except the integration time and the file saved directory can also be set in the Data Logging measurement window.
To configure display preferences:
Select the Preferences command in the Edit menu.
To configure the protection settings of the dc source:
Select the Source Settings command in the Source menu.
Enables overcurrentprotection and sets
overcurrentprotection delay.
Save or recallinstrument states
in non-volatilememory.
Specify overvoltage limit settings.
Specify a compensation mode based on wiring and output bandwidth. Refer to the on-line help for more information.
Selects location ofbinary data file in
which data is saved.
Selects the type ofmeasurement.
Displays totalacquisition time in
hours, minutes andseconds.
Selects a current type. Pulse is preferred.
Selects a current measurement range.
Displays total # of acquisitions that will be made and resultant file size.
Selects presentintegration time inseconds. Refer to
the on-line help formore information.
Specify which current measurements to graph.
Specify update rate of voltage and
current meters.
Displays gridlines.
Displays Min, Max, High and Low
waveform markers.
Use these controls to select and change waveform colors.
Returns the settings to the factory default values.

15
To export data log binary files to a Microsoft Excel or a text file:
Select the Export Data Log to Excel/Text command in the File menu. This is useful if you need to export the binary data from this application to other software applications.
To convert data log binary files to CCDF graphs:
Select the Convert Data Log to CCDF command in the File menu. This is useful for using the CCDF graph to analyze all or a specific portion of a previously captured data log binary file. Note that this command is only active when the application is in CCDF graph mode.
Displays information
about selected binary file.
Select the binary data file that you wish to export.
Select either the entire file or a
portion of the file to export.
Specify the start point of the
partial period.
Specify the end point of the partial period.
Number of data points in
the export file.
Processing time for
exporting data.
Export either to an Excel spreadsheet or a text file.
Specify a % of data reduction if the export file is too large.
Displays information
about selected binary file.
Select the binary data file that you wish to convert.
Select either the entire file or a
portion of the file to export.
Specify the start point of the
partial period.
Specify the end point of the partial period.
Number of data points in
the export file.
Processing time to convert data.

Manual part number: 5962-8293 Printed, August 2003
Sample Waveforms Five sample waveforms are provided with the Agilent 14565A application. If you do not have a dc source connected to your computer, you can still become familiar with the application by trying out the various display functions using the sample waveforms.
Use the Load Waveform command in the File menu to load one of the sample waveforms. Refer to the online help for a description of the sample waveforms.
Warranty This Agilent Technologies software product is warranted against defects in materials and workmanship for a period of 90 days from date of delivery. During the warranty period, Agilent Technologies will, at its option either repair or replace parts which prove to be defective.
Agilent Technologies makes no express or implied warranty of any kind, including, but not limited to the implied warranties of merchantability or fitness for a particular purpose, with regard to the program material contained herein. Agilent Technologies shall not be liable for incidental or consequential damages in connection with or arising out of the furnishing, performance, or use of this software.
Use of the supplied manual and software is restricted to Agilent Technologies dc source products only. The software is copyrighted and may not be copied except for archival purposes, to replace a defective copy, or for program error verification. Agilent Technologies warrants that this software designed for use with a personal computer, will execute its programming instructions when properly installed on that personal computer. Agilent Technologies does not warrant that the operation of the personal computer, software, or dc source will be uninterrupted or error free.
Limitation of Warranty The foregoing warranty shall not apply to defects resulting from: misuse, unauthorized modification, operation or storage outside the environmental specifications for the product, in-transit damage, improper maintenance, or defects resulting from use of non-Agilent Technologies software, accessories, media, or such items not designed for use with the product.
Notice This document contains proprietary information protected by copyright. All rights are reserved. No part of this document may be photocopied, reproduced, or translated into another language without the prior consent of Agilent Technologies. The information contained in this document is subject to change without notice.
Copyright 1998, 1999, 2000, 2002, 2003 Agilent Technologies, Inc.
Windows and Excel are registered trademarks of Microsoft Corporation.