140908 ING conference - NSI · ING conference London 9 September 2014. ... Cisco Headquarters...
36
ING conference London 9 September 2014
Transcript of 140908 ING conference - NSI · ING conference London 9 September 2014. ... Cisco Headquarters...
ING conference London9 September 2014

Contents
1 Introduction
2
2 Market
3 Portfolio strategy
4 Strategic and operational update
5 Financial
6 Conclusion
7 Appendix

INTRODUCTION1
3

NSI at a glance
Description
� Entrepreneurial Real Estate management company with
€1.7b assets under management, a GRI of €145m and a direct result of €46m
� Founded in 1993 and listed on Euronext Amsterdam since 1998
� Dutch REIT (fii): exempted from corporate income tax
on Dutch investment result
� Asset portfolio external appraised (50% per June and
50% per December)
� Manages real estate portfolios in the Netherlands and
Belgium (via 54.0% stake in listed REIT Intervest Offices & Warehouses, 100% consolidated):
− Netherlands €1.1b: offices and retail
− Belgium €0.6b: offices and logistics
� Strong letting platform with in-house teams for asset
management, marketing, development, business
development and technical building management
Offices
Retail
Logistics
Asset classes Netherlands
(market value)
Asset classes Belgium
(market value)
Offices55%
Retail33%
Other12%
Offices58%
Logistics42%
Netherlands66.0%
Belgium34.0%
Geographic breakdown
(market value)
4
Bookvalue in € mio GIY
Offices NL 622 12.9%
Retail NL 380 8.5%
Belgium 580 8.8%
5
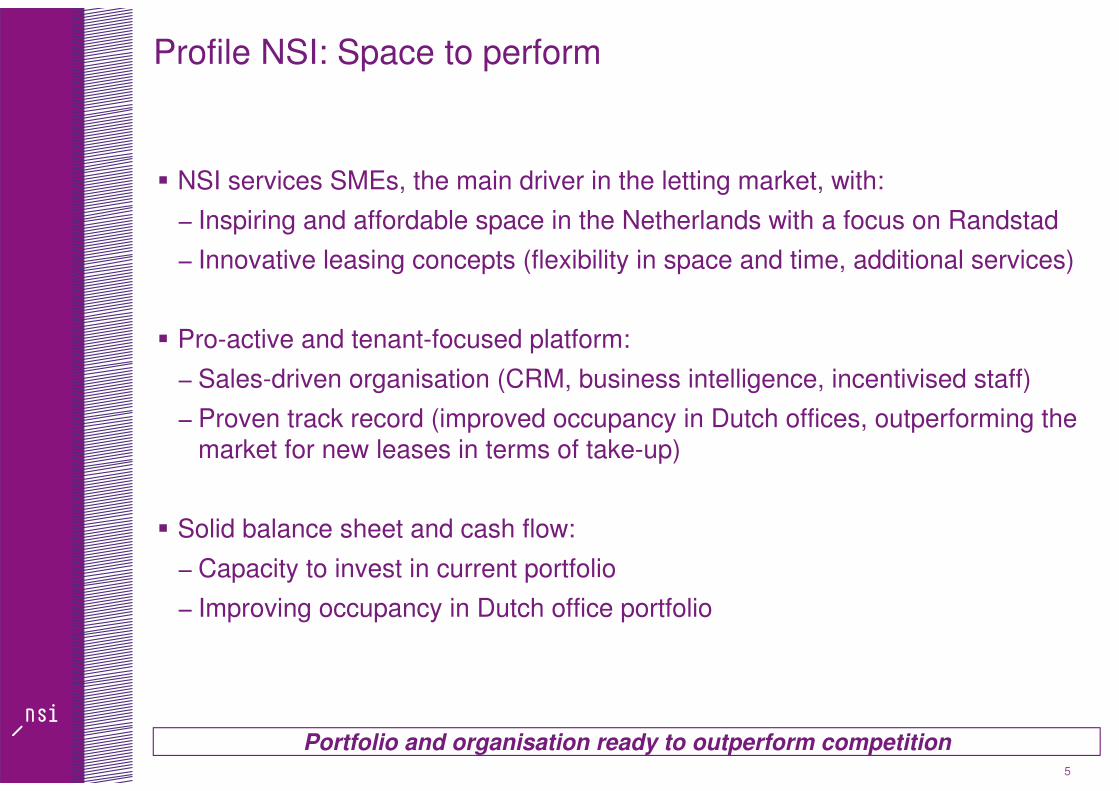
� NSI services SMEs, the main driver in the letting market, with:
− Inspiring and affordable space in the Netherlands with a focus on Randstad
− Innovative leasing concepts (flexibility in space and time, additional services)
� Pro-active and tenant-focused platform:
− Sales-driven organisation (CRM, business intelligence, incentivised staff)
− Proven track record (improved occupancy in Dutch offices, outperforming the market for new leases in terms of take-up)
� Solid balance sheet and cash flow:
− Capacity to invest in current portfolio
− Improving occupancy in Dutch office portfolio
Portfolio and organisation ready to outperform competition
Profile NSI: Space to perform

MARKET2
6

7
� Dutch economy shows cautious growth: 0.75% forecasted for 2014 with improving
underlying indicators:
− Recovery across the board; almost all sectors benefit
− Increasing investment volume
− Decreasing bankruptcies
− Unemployment rate is decreasing
− Housing market is improving
− Purchasing power is increasing
− Consumer confidence is gaining
− Consumer spending turned positive after years of decline
� Positive signals somewhat offset as result of increased uncertainty due to crisis
Ukraine/Russia
Dutch economy: lights turning green

8
� Investment market clearly picking up:
− Transaction volume year to date exceeds FY 2013*
• €600 mio offices/ €650 mio residential/ €200 retail & industrial
− More non-distressed transactions, also in mid segment at realistic prices
� Letting market relentlessly challenging
� Offices:
− Oversupply
» Persisting high vacancy in Dutch office market of 15.7% **
• Stable take-up HY14 compared with HY13**
» Effect from changes in tenant market expected to offset economic growth
» Decreasing sqm per employee
» New Way of working
» Hidden vacancy
» Increase in office-based employment is expected to offset decrease in overall employment
• Several market surveys forecast a further vacancy increase in the Ducth office market
� Retail:
− Consumer confidence and spending increasing, though at low levels still
− Increasing share of internet sales
− Resilience of supermarket-anchored convenience centres
Real Estate: mixed picture
Sources:
* vastgoedmarkt
** DTZ Research
Effect vary per size and type of company

Increased investment market activity
9
Property Location Date Buyer Value (€m)1 Size (sqm) €/sqm
Multiple offices (8)
CBRE Dutch Office
fund
Multiple, incl Utrecht,
Rotterdam, Den Haag,
Heerlen, Maastricht, Zwolle.
July 2014 Lone Star 385 302,000 1,275
LaGuardia Plaza Amsterdam Sloterdijk July 2014 MPC Capital/ Sloterdijk Cons. 84 60,000 1,400
The Edge Amsterdam Zuidas June 2014 Deka Immobilien 200.0 40,000 5,000
Cisco Headquarters Amsterdam (South East) May 2014 ING 42.0 46,500 900
Equinox portfolio Multiple locations May 2014 Valad Europe 37.8 50,200 750
Kromme Schaft Houten June 2014 MMZ properties 15.7 12,600 1,250
Som & Ito Amsterdam April 2014 Union INvestment 245.0 52,000 4,700
Stiibbe tower Amsterdam Jan 2014 Union INvestment 54.0 13,500 4,000
Wilhelminatoren Rotterdam Jan 2014 PPF Real Estate Holding 29.0 16,200 1,800
Nauta Dutihl
(Beethovenstraat)Amsterdam Dec 2014 HIH Investment 65.0 13,500 4,800
Multiple offices (8)
CBRE Office fund
Amsterdam, Rotterdam, Den
BoschSep-2013 JV OVG/ Goldman Sachs 120.0 62,000 1,935
Sanoma pand Hoofddorp Sept 2013PPF Real Estate Holding
47.0 30,000 1,550
HQ Siemens The Hague Sep-2013 PingProperties 61.3 30,000 2,040
Axa portefeuille Multiple Jun-2013 PPF Real Estate Holding 140.0 100,000 1,400
UBS Portfolio (EVA Multiple April 2013 Victory 85.0 85,000 1,012
Source: NSI
1. Market estimates

.. providing a more realistic benchmark
10
� Lone Star buying multiple DOF properties*
− Average quality of assets seems to be comparable with NSI portfolio
− Tenant risk profile, WALL and vacancy do not compare
favourably
− Price/ sqm of €1,275 per sqm significantly above average NSI (€1,012)
� La GuardiaPlaza
− Location ranks 19th position in JLL office locations ranking
− 4 towers, of which 2 vacant
− Transaction price of €1,400 sqm in line with valuation NSI’s core segment
� Equinox portfolio*
− Average quality of assets below NSI portfolio: mix of non-core and value-add
− High representation of government related tenants
− Distressed seller led to low transaction price of €750 per sqm
* Based on research NSI and market data

PORTFOLIO STRATEGY3
11

12
Portfolio strategy: NSI’s approach
� c€1,140 m portfolio in the Netherlands consisting of 147 office and 42 retail properties
� c€600m portfolio in Belgium consisting of 16 office and 17 logistics properties
Portfolio
Asset management
Client focus
Investment
Asset rotation
Split in core, value-add and non-core segments
Customer-centric approach to optimise occupancy
Finance capex to facilitate customers and upgrade portfolio
Dispose of assets where maximum value is reached or that structurally underperform
Maximise total return
Segmentation
Creating value through asset rotation and operational excellence

Full portfolio analysed asset-by-asset to set priorities, provide insights and support decision-making
13
� Well-performing propertiesCore
Value-add � Properties with upside potential
Non-core � Underperforming properties
Dutch portfolio: segmentation drives activities
Characteristics
Aim is to add value supported by stable cash flow from core portfolio
Segment
Sell or maintain
Reduce
Invest and sell
Approach

14
Targets 2014 – 2016 clearly set in FY13 presentation
Office
2013A
3%
41%
56%
70%
2016E
30%
Occupancy
# HNK
72%
3
>80%
20
Value-add
Non-core
Core
Retail
8%
50%
42%
2013A
8%
46%
2016E
46%
Value-add
Non-core
Core
Occupancy 87% >90%
STRATEGIC AND OPERATIONAL UPDATE4
15

16
Dutch Retail portfolio- Asset Rotation & Operational Excellence
� Focus on convenience shopping centres
� The occupancy rate improved from 83.9% as per 31 March 2014 to 87.7%, (31/12/13: 87.8%),
mainly due to Primark
� Like-for-like growth impacted by redevelopments� L-f-l excluding redevelopments -2.3%� L-f-l including redevelopments -10.1%
� Effective rent level new leases was €163 per sqm in the 1st half-year of 2014, compared with an average level of €187 for the total retail portfolio
� WALL: 4.2 years
Bookvalue
In €mLabel
Portfolio NSI
In #
Occupancy
rate
Value
In € per sqm
Area
In sqm
Passing rent
2013
In €m p.y.
Total
20
6
16
42
88.6%
88.4%
87.4%
88.1%
1,586
834
2,252
1,676
143,476
42,058
83,716
269,250
17.0
3.5
14.3
34.8
227.5
35.1
188.6
451.2
Value-add
Non-core
Core
(including Large Scale Retail):

Dutch Retail portfolio- Asset Rotation & Operational Excellence
17
� Redevelopment Zevenkamp
� Investment of €0.5 million resulted in strong uplift:
improved tenant mix, including Big Bazar
� Redevelopment Zuiderterras
� Investment of €5.2 million
� Proactively facilitating Primark, contract with Saturn
terminated� Redevelopment ground area and parking facilities
Before After Improvement
Occupancy 78% 85% 7%
GRI €1,282m €1,360m 6%
Before After Improvement
Occupancy 69% 100% 31%
GRI €1,328m €1,752m 32%

18
Dutch office portfolio – Asset Rotation & Operational Excellence
� Focus on SME is paying off
� Proven track record to retain and attract SME’s
� More receptive for new products, concepts and services
� SMEs growth engine Dutch economy
� SME contracts produce more stable rental income;
� Share of SME’s increase in GRI of NSI
� Continous effort to further strengthen the letting platform
� Further development of sales-driven organisation
� Proven track record of outperforming the market
� De-risking: expiry scheme
� HNK’s continue to perform stronglyNew Business
Tenant & market focus
Strong platform through active management
Dutch office portfolio - Asset Rotation & Operational Excellence
19
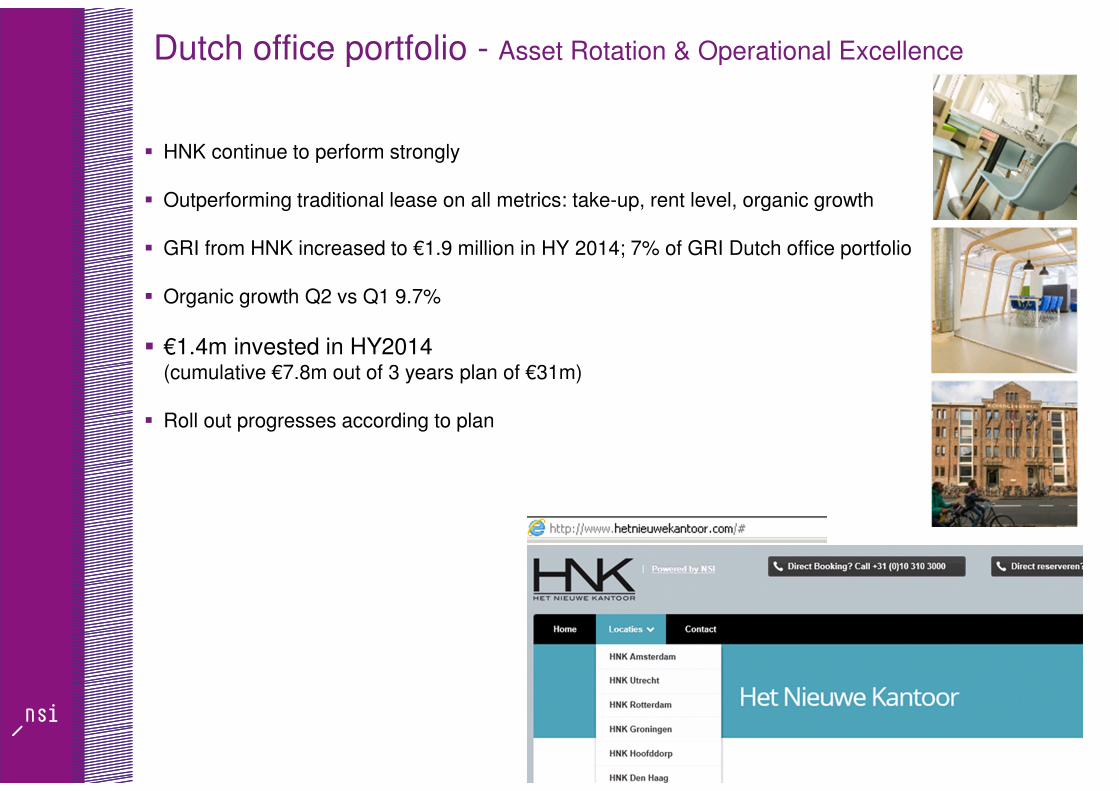
� HNK continue to perform strongly
� Outperforming traditional lease on all metrics: take-up, rent level, organic growth
� GRI from HNK increased to €1.9 million in HY 2014; 7% of GRI Dutch office portfolio
� Organic growth Q2 vs Q1 9.7%
� €1.4m invested in HY2014 (cumulative €7.8m out of 3 years plan of €31m)
� Roll out progresses according to plan

HNK roll-out: where we stand and going forward
20
� Roll out HNK:
• Target: 20 HNK’s in 2016• Total investment scheme €31 mio (€7.8 mio realized)
� Currently 5 locations in operation
− Rotterdam 18,000 sqm
− Hoofddorp 3,500 sqm− Utrecht 3,000 sqm
− Amsterdam Houthavens 11,000 sqm− Groningen 3,500 sqm
� 2 HNKs to be opened in H2:− The Hague 15,000 sqm
− Apeldoorn 14,000 sqm
� Totals # HNK to 7 by year end (ca 75,000 sqm,
12% of Dutch Portfolio)
HNK in operation
HNK transformation in progress
HNK transformation planned for 2014/2015
Rotterdam
Eindhoven
Den Haag Ede
Apeldoorn
Utrecht
Hoofddorp
Amsterdam
Groningen
0
20.000
40.000
60.000
2012 2013 2014 2015 2016 2017 2018 2019
0
4.000
8.000
12.000
Annual incomeCumulative investment
Investment
in €kIncome
in €k
6,500
Dutch office portfolio – Asset Rotation & Operational Excellence
21
� Asset Rotation
� Sale of 5 assets in Dutch portfolio, 3 office assets� Non core: Kobaltweg Utrecht 10,000 sqm, occupancy 19%, GRI €0.2 million
� Value-add: Luchthavenweg Eindhoven 2,000 sqm, occupancy 100% GRI €0.2
Max Euwelaan Rotterdam 650 sqm, occupancy 89% GRI €46k
� Two more assets sold
� Actively marketing non-core assets; serious interest from several parties

Dutch office portfolio - Asset Rotation & Operational Excellence
22
� Occupancy improved from 71.7% as per 31 March 2014 to 72.6% (31/12/13:
72.1%)
� Office asset Point West (7,500 sqm) leased out to Shi Hotel Group. The Shi Hotel
Group will transform the asset into a hotel.
� Like-for-like rent development was -1.6% negative
� WALL: 3.7 years
� Effective rent level was €129 per sqm in 1st half-year of 2014, compared with an
average level of €148 for the total Dutch office portfolio
LabelPortfolio
NSIIn #
Occupancy rate
Value In € per sqm
AreaIn sqm
Passing rent 2013
In €m p.y.
BookvalueIn €m
Value-add
Non-core
Core
Total
93
15
39
147
71.2%
26.5%
79.9%
72.6%
915
312
1,419
1,012
374,564
55,748
184,726
615,038
34.2
0.9
23.5
58.6
342.6
17.4
262.2
622.2
Belgian Portfolio – Pro–active and tenant focused market approach
23
� Offices
• Affordable and inspiring offices – feel real estate – hospitality like approach (events etc..)
• Innovative lease concepts
� Logistics
• Well identified client base – IOW top of mind
• Prime locations – Prime buildings
• In-depth market knowledge - real estate partnerships (tenants/developers) – creative deals
� Lease activities H1 2014:
• The occupancy rate was 84.8% (31 March 2014: 84.5%) due to
• a slight increase in the office portfolio to 82.6% (31 March 2014: 81.9%)
• a slight decline in the logistics portfolio to 90.2% (31 March 2014: 90.7%)
• Intervest Offices & Warehouses renewed office leases representing 16% of GRI
• WALL: 3.8 years in offices and 4.5 years in logistics

Belgian Portfolio - Portfolio strategy : increased focus on logistics
24
� Healthy fundamentals – logistics top region
� A matter of niche players – size matters – six specialists in top 10
Asset rotation
� Policy: divestments in office segment to reinvest in high quality logistic buildings
� Dispose of assets when maximum value is reached
� Towards 60 % logistics – 40 % offices
� + € 50 million potential logistic transactions identified
� Asset rotation over the last decade 2004 - 2013
• € 100 million of offices sold
• € 68 million of offices acquired
• € 34 million of semi-industrial/logistic buildings sold
• € 96 million of semi-industrial/logistic acquired

FINANCIAL5
25
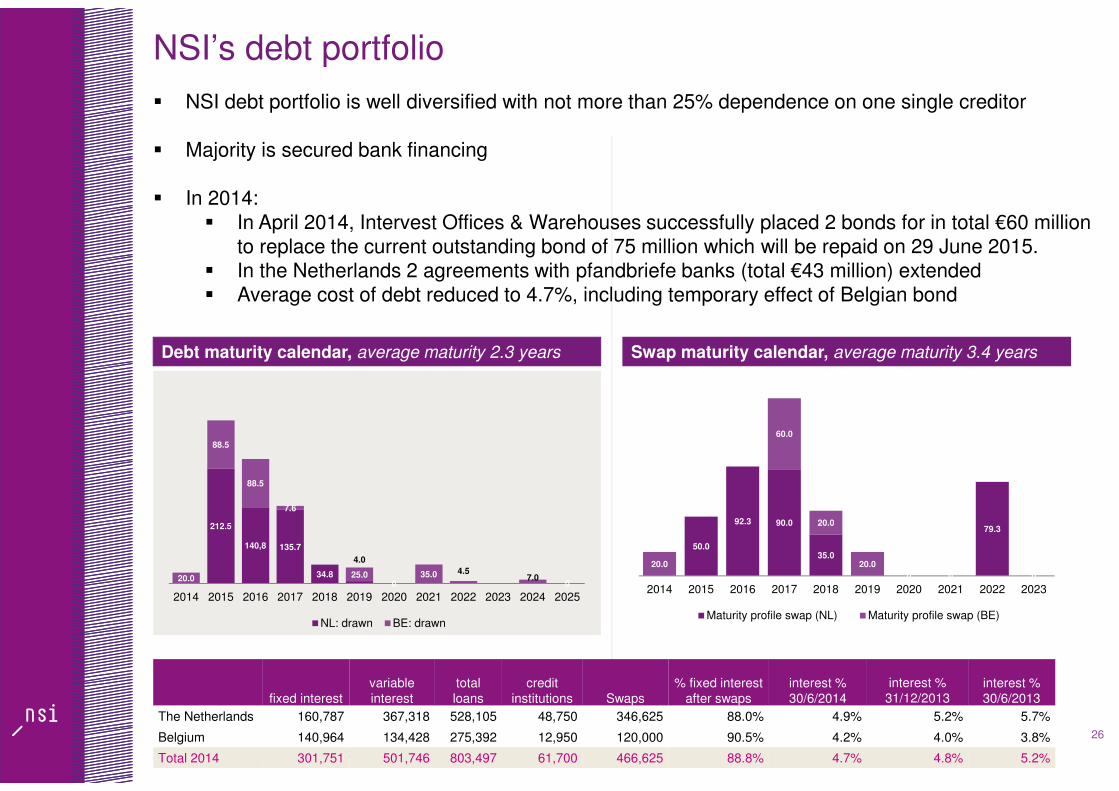
NSI’s debt portfolio
26
Debt maturity calendar, average maturity 2.3 years Swap maturity calendar, average maturity 3.4 years
5%
5%
7%
8%9%
10%
Information on this slide is per 30-Jun-2014
212.5
140,8 135.7
34.8
4.0
0 0 20.0
88.5
88.5
7.6
25.0 35.0 4.57.0
2014 2015 2016 2017 2018 2019 2020 2021 2022 2023 2024 2025
NL: drawn BE: drawn
� NSI debt portfolio is well diversified with not more than 25% dependence on one single creditor
� Majority is secured bank financing
� In 2014:
� In April 2014, Intervest Offices & Warehouses successfully placed 2 bonds for in total €60 million to replace the current outstanding bond of 75 million which will be repaid on 29 June 2015.
� In the Netherlands 2 agreements with pfandbriefe banks (total €43 million) extended� Average cost of debt reduced to 4.7%, including temporary effect of Belgian bond
50.0
92.3 90.0
35.0
0 0
79.3
0
20.0
60.0
20.0
20.0
2014 2015 2016 2017 2018 2019 2020 2021 2022 2023
Maturity profile swap (NL) Maturity profile swap (BE)
fixed interestvariableinterest
totalloans
credit institutions Swaps
% fixed interest after swaps
interest %30/6/2014
interest %31/12/2013
interest %30/6/2013
The Netherlands 160,787 367,318 528,105 48,750 346,625 88.0% 4.9% 5.2% 5.7%
Belgium 140,964 134,428 275,392 12,950 120,000 90.5% 4.2% 4.0% 3.8%
Total 2014 301,751 501,746 803,497 61,700 466,625 88.8% 4.7% 4.8% 5.2%

Strategic financing aims: focus on flexibility and
2015-2016 refinancing
� Decrease dependency of only one source of funding
27
Funding diversification
2014-2016
Debt maturity
Refinancing risk
Covenants
� Extend and maintain average debt maturity to over 3 years
� No more than 25% of loans maturing in any single year
� Aim to maintain LTV below 50%, peak-to-trough between 40-50%, with covenant at 60-65%
� Maintain ICR > 2.0
Move to unsecured financing
� Anticipate move to unsecured in refinancing 2015 – 2016 maturities
Reduce cost of debt� Increase number of (foreign) banks in syndications� Diversify source of funding

28
Creating an unsecured corporate syndicated facility
directly would be NSI’s preferred option
28
Envisaged development of NSI Netherlands’ funding structure
Current debt structure(100% = €704m)
Envisaged long-term debt structure
(100% = €704m)
~ 15 – 35%
Unsecured debt issue~ 50 – 70%
~ €350 – 500m*
~ 15%
1a 1b 2
Secured bilateral asset-
based bank financing
Unsecured syndicated corporate
bank financing
Secured bilateral and syndicated
asset-based bank
financing
~ 85%
~ 15%
1 2
Secured bilateral asset-
based bank financing
Secured syndicated corporate
bank financing
Preferred
Alternative
Conv. bond
Unsecured syndicated corporate
bankfinancing
USPP
EUPP
Schuldschein
Retail bond
Secured bilateral asset-
based bank financing
Other
* Based on current debt size/structure of approx. €704m

Financial highlights
29
x€1,000 HY 2014 HY2013 FY 2013
Gross rental income 67,003 73,612 144,564
Service costs not
recharged to tenants-2,926 -2,364 -4,723
Operating costs -9,223 -8,782 -18,050
Net rental income 54,854 62,466 121,791
Administrative costs -3,776 -3,087 -6,458
Financing income 123 156 477
Financing costs -21,328 -28,340 -58,042
Direct investment result before tax
29,872 31,195 57,768
Corporate income tax -67 -66 -121
Direct result att. to
minorities-5,316 -5,568 -11,375
Direct investment result 24,489 25,471 46,272
Indirect investment
result-93,487 -68,721 -180,347
Total result -68,998 -43,250 -134,075
� GRI down due to asset disposals (€3.2m), vacancy and lower reversionary rent levels
� Service costs up, also due to final settlement related to preceding years (€0.3 m)
� Operating costs influenced by higher letting
costs and a positive one-off (€0.5m) in 2013 comps in Belgium
� Operational margin: 81,4% (2013: 84%)
� Administrative costs includes one-off consultancy costs.
� Financing costs significantly down following the debt and derivative redemption after
equity issue in November, somewhat offset due to temporary effect of Belgian bond (until June 2015)
� Indirect result reflects downward revaluations of -€90.0m (HY 13: -€79m) in real estate
portfolio and -€3,9m of swaps (HY13:€17.6)

Property values Dutch portfolio
30
� All assets revalued per 30/6/2014, 65% of total portfolio externally valued
� Offices: 73% due to yield changes
� Retail: 85% due to yield changes
� HNK properties showed positive revaluations
revaluations in €m
(38)
(21)
(31)
(46)
(55)
(62)
(69)
(60)
(4)(1) (0)
(5) (6)
(13)
(25)(22)
(140)
(130)
(120)
(110)
(100)
(90)
(80)
(70)
(60)
(50)
(40)
(30)
(20)
(10)
0
10
20
H1 2014
H2 2013
H1 2013
H2 2012
H1 2012
201120102009
Offices Retail Large scale retail Industrial NL

Balance sheet highlights
31
x€1,000 HY 2014 HY 2013 FY 2013
Real estate investments 1,722,744 1,948,626 1,808,768
Total shareholders equity 847,790 735,400 932,915
Shareholders equity of
NSI719,272 609,269 801,159
Debt to credit institutions
(excl. derivatives)823,139 1,148,577 821,854
Average cost of debt (%) 4.7 5.2 4.8
Net loan to value (%) 47.9 58.9 45.4
Average debt maturity
(years)2.3 2.6 2.2
Fixed interest debt (%) 88,8 91.1 82.4
Interest coverage ratio 2.6 2.2 2.1
NAV (€/share) 5.02 8.93 5.59
EPRA NAV (€/share) 5.31 9.85 5.85
� Value real estate portfolio down by €86.1m due to revaluations (-€90.0 m) sales (€7.5
million) and investments (€11.4 m)
� Net proceeds of equity issue (€288.9 million) used to reduce long-term debt, unwind
derivatives and increase flexibility
� LtV significantly decreased, commitment to maintain below 50%
� Improved balance sheet resulted in more favourable financing terms to lower average
costs of funds
� Outstanding shares increased by 75.0m from 68.2m HY2013 to 143.2m shares

CONCLUSION6
32

33
Conclusion
� NSI still operates in challenging markets
� Decrease in NRI in 2014 to be compensated by lower financing costs
� Direct result expected to at least equal to 2013 (€46.3 million)
� Interim-dividend: €0.13 per share
� Investments market continues to pick up
� First steps in executing asset rotation strategy
− sale of (non-core) assets remains one of priorities
� Full focus on acquisitions

APPENDIX7
34
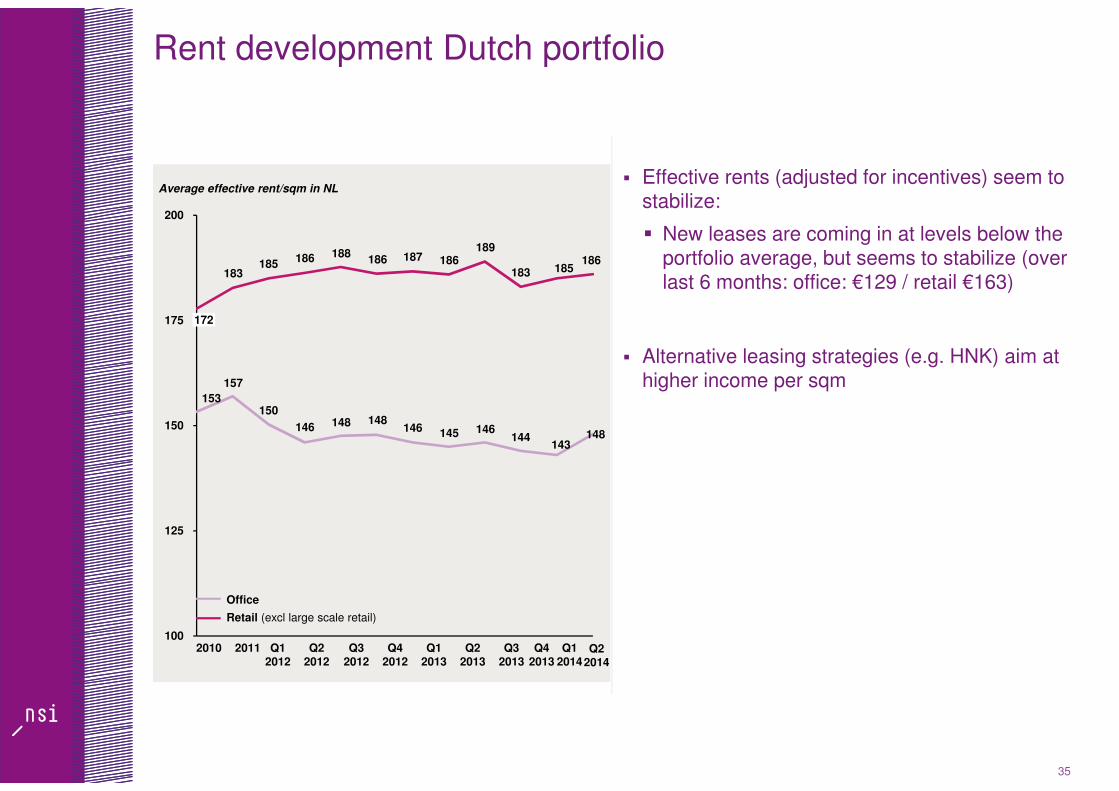
Rent development Dutch portfolio
35
� Effective rents (adjusted for incentives) seem to stabilize:
� New leases are coming in at levels below the portfolio average, but seems to stabilize (over last 6 months: office: €129 / retail €163)
� Alternative leasing strategies (e.g. HNK) aim at higher income per sqm
153
157
150
146 148 148 146 145 146
144 143
148
183 185
186 188 186 187 186
189
183 185 186
100
125
150
175
200
Q1 2013
172
Q4 2012
Q3 2012
Q2 2012
Q1 2012
20112010 Q2 2013
Q3 2013
Q4 2013
Retail (excl large scale retail)
Office
Average effective rent/sqm in NL
Q1 2014
Q2 2014

Lease expirations Dutch Portfolio
36
� Peak largest expiries at 31/12/14 include
− Prorail (9,200 sqm)
− RGD Goes (5,300 sqm)
− ROC Amsterdam (5,000 sqm)
GRI in €m
0
1
2
3
4
5
6
7
8
9
10
11
12
13
14
15
16
17
18
2018<
33%
25%
2018
14%
11%
2017
17%
15%
2016
11%
17%
2015
19%
20%
2014
3%
13%
7%7%
6% 13%
44%
23%
Retail
Offices
Industrial