14 - Indo-Pak Dialogue
92
-
Upload
south-asian-media-net -
Category
Documents
-
view
228 -
download
1
description
South Asian Journal, a quarterly periodical of South Asian journalists and scholars, October-December 2005. Editor Imtiaz Alam
Transcript of 14 - Indo-Pak Dialogue

Contents
S O U T H A S I A N
EditorImtiaz Alam
Senior Assistant EditorMaheen Pracha
Consulting Editors
BangladeshReazuddin Ahmed
IndiaK K Katyal
NepalYubaraj Ghimire
PakistanI A Rehman
Sri LankaSharmini Boyle
Publisher Free Media Foundation
FacilitatorSouth Asian Free Media
Association (SAFMA)
Designed byDESIGN 8
PrinterQaumi Press
Editor’s PostE-mail:
Address09 Lower Ground
Eden Heights, Jail RoadLahore, Pakistan.
Tel: 92 42 587 9251, 587 9253 Fax: 92 42 587 9254
Email:[email protected]
Website :www.southasianmedia.net
Indo-Pak Dialogue i
Health care in South Asia iii
In this Issue v
Health Conditions and Service 8Delivery in South AsiaFeyza Bhatti and Shazra Murad
The State of Health in India 25Dr Mohan Rao
Health Services and Resource 54Allocation in Pakistan Rabea Malik
Sri Lanka's “Health Miracle” 63Dr. Ravinder P. Rannan-Eliya
Forgotten Lessons: 74One Year after the EarthquakeMoeen H. Cheema
Local Governance and Human 94Rights in BangladeshMohammad Ehsan
Indian Public Diplomacy and the Nuclear Deal 105Radha Vij
Migrant Remittances and Poverty 111Alleviation in Sri LankaAyako Kageyama
Combating Child Labour in India's Services Sector 128Dr T. T. Sreekumar and Dr V. Gayathri
Indian Women and the Green Revolution 144Dr Rupinder Kaur
The Services Sector under SAFTA 155Shivraj Bhatt
Viewpoint: Seven Years under General Musharraf 170M. Ziauddin
Indo-Pak Dialogue
At last, the foreign secretaries of India and Pakistan are meeting on 14 November
2006 in New Delhi, to resume the composite dialogue process that was put on hold in
the wake of the 11 July serial train blasts by terrorists in Mumbai, which killed around
181 innocent people. The Havana summit meeting between Prime Minister
Manmohan Singh and President Pervez Musharraf not only broke the deadlock on the
resumption of bilateral dialogue, but also paved the way for the creation of an “India-
Pakistan institutional mechanism to identify and implement counter-terrorism
initiatives and investigations”. Both leaders seem to have covered some distance in
bridging their differences, agreeing on measures to curb terrorism, and exploring ways
towards conflict resolution. But the future prospects of the whole process depend on
how far Islamabad tries its best to satisfy India in curbing India-specific terrorism and
cross-border infiltration on the one hand, and on whether New Delhi appropriately
responds to the flexibility being shown by President Musharraf on the tedious issue of
Kashmir, on the other.
Followed by the Havana summit and yet-to-be-created joint anti-terrorism
institutional mechanism, India has formally charged 11 Pakistanis for having allegedly
carried out the Mumbai blasts, implicating the Inter-Services Intelligence (ISI), two
Pakistan-based outlawed militant outfits, and the banned Students Islamic Movement
of India (SIMI). Addressing a conference of armed forces' commanders, Prime
Minister Manmohan Singh has “put Pakistan on notice that any democratic
government of India would find it difficult to continue on the present path (of
dialogue) to address all outstanding issues unless the government of Pakistan clearly
deals with the issue of terrorism”. While India has provided “evidence” to other
powers, Islamabad has yet not received any kind of brief on Indian investigations into
the Mumbai blasts. It has to be appreciated, however, that it was President Musharraf
who raised the issue of hostility among the intelligence services of the two countries
against the backdrop of charges and counter-charges of interference in each other's
internal affairs, and who proposed, in his interview with Frontline, that “the
intelligence agencies of both sides should reach an agreement to stop interfering in
each other's internal affairs”.
Expressing their resolve at the Havana summit to sustain the peace process and
underlying the importance of its success for the whole South Asian region, Mr. Singh
and Mr. Musharraf decided “to continue the joint search for a peaceful settlement of
all issues between India and Pakistan, including the issue of Jammu and Kashmir, in a
sincere and purposeful manner”. In the context of the dispute over Kashmir, they
agreed to “build on convergences and narrow down divergences”. What are the
convergences and divergences, one might ask, over a most divisive issue?
i ii
Already, the two sides have drawn their bottom lines: India is not ready to alter
borders and any further divide on religious lines; and Pakistan is not ready to accept
the Line of Control (LoC) as an international border permanently dividing the
Kashmiris. However, both have agreed to make LoC “irrelevant” or, as Manmohan
Singh said on 25 May 2006, “just a line on the map”. If President Musharraf has
spoken about the “joint management” of the two parts of Kashmir, Mr. Singh prefers
the expression, “institutional arrangements”. On the Kashmiris' right to self-rule,
Musharraf is for “self-governance” and India is traditionally for maximum
“autonomy”, barring sovereignty. Both are against conceding “independence” to the
Kashmiris. The divergences are on what areas constitute Kashmir; whether Jammu,
Ladakh, and the Northern Areas will be out of it; the quantum of autonomy; exact
nature of joint-management/institutional arrangement between the two parts of
Kashmir; the autonomy component and residual powers to be retained by the two
countries; and the Indo-Pak coordinating “superstructure” and the nature of
Kashmiris' representation, demilitarization/end to militancy and security, etc.
If there is enough political will on both sides, as convergences expand, the remaining
divergences can be bridged and certain patterns and legal frameworks can be adapted
from the resolution of other such disputes, as on Kashmir, to suit our peculiar
circumstances. The dispute over Kashmir has lingered on for too long and has cost too
much, not only for the Kashmiris, but also for 1.4 billion people in the Subcontinent. It
may take time to set an irreversible process in motion to settle the issue, but it must be
resolved and removed from the gambit of Indo-Pak relations. Given their past
animosity, even the most ancillary issues have turned into perennial issues, such as
Siachin and Sir Creek, which could be solved without haggling over details and
wasting time. On water issues, both countries remain committed to the Indus Water
Treaty.
The real issue, or what we can describe as the core issue, is what kind of relationship
the twin-brothers of the Subcontinent might evolve while overcoming past enmities
and the mindset of enmity. No doubt, the bloody partition of the Subcontinent left
deep scars on both sides, yet the countries could have healed the wounds and started a
new chapter of a fraternal relationship. But this did not happen because the Indians
refused to accept the new reality and the Pakistanis continued to perceive India as an
eternal enemy, while both sides took opposite roads in entering into hostile
international alignments. This approach did not come to an end even after the end of
the Cold War.
The time has come to evolve a new paradigm of fraternal and mutually beneficial
partnership and cooperative relationship in the region and on the world stage. Both
Mahatma Gandhi and Quaid-i-Azam Mohammed Ali Jinnah wanted a fraternal
relationship between the two independent states. Instead of competing in an arms
race and planning to destroy each other, they need to develop cooperative security,
including measures to stabilise the nuclear regime, and universal nuclear
disarmament while in the same boat. Indeed, there are particular legitimate national
interests to pursue, but why should they be brought into conflict with our shared
destiny?

As India and Pakistan continue their efforts to peacefully resolve their contentious
issues, all areas of potential cooperation, both bilateral and regional, should be fully
exploited to the best advantage of our respective peoples. If Pakistan should grant
Most Favoured Nation (MFN) status to India and allow trade and investment between
the two countries, India needs to lower its tariffs and remove non/para-tariff barriers
to trade. While New Delhi repeatedly claims that India offers a great economic
opportunity to its neighbours, it should be taking concrete measures to translate its
words into deeds. Both big brothers of South Asia must, in the mean while, continue
the process of converting SAARC into a vibrant economic union.
The next phase of dialogue should be made productive and useful while narrowing
down the areas of differences to be resolved at the political level and fully
implementing the agreements already reached and various joint statements signed
between the two sides since 6 January 2004. For this to happen, Pakistan and India
must jointly curb the scourge of terrorism that threatens both countries, show greater
forbearance and patience for a better tomorrow, and not let terrorists derail the peace
process. In the mean while, let the two sides remove all hurdles in the way of people-
to-people contact by radically liberalising their visa regimes and removing all curbs on
the free flow of people and information across our borders to strengthen solidarity and
friendship among the people. Together with other South Asian countries, India and
Pakistan must strive to make the region yet another powerhouse of economic growth
and prosperity, side by side with our neighbour China, and not let others make Asians
fight Asians.
Healthcare in South Asia
Most South Asian countries continue to perform poorly on most social indicators,
something that is reflected in their human development indices. With the onset of
structural adjustment reforms, even the policy commitment to free, universal
healthcare has quietly slipped into the wings. The shifting emphasis on fiscal
management and structural adjustment has restricted the public sector's role to
'regulation' and little more. Evidently, healthcare provision is no longer the business of
the state, as against universal and equitable provision of healthcare, which is not only
a basic human right, but also the prerequisite of a dynamic human resource. Without
an elaborate healthcare system and effective population planning, focusing on women
and children's healthcare, South Asia cannot join the ranks of civilised nations.
In the case of India, Pakistan, and Bangladesh, the Government of India had affirmed
its policy commitment to providing universal and, more importantly free, healthcare
even before Partition in 1947. But policies and budget allocations within and outside
the health sector are not always made on the basis of need, but on what is politically
expedient and on the 'consumer's' ability to pay. Relegated as South Asia's poor are to
this euphemism, healthcare continues to be something the poor simply cannot afford.
iii
Meanwhile, acute inefficiencies in healthcare, inadequate and inefficient resource
allocation, and correspondingly poor service delivery have all triggered the growth of
private sector healthcare providers available only at a higher price, leaving the poor
and much of the lower-middle class - women and children in particular - at the mercy
of disease and ill health. In many cases, it has only encouraged 'over-diagnosis' and
'over-medication' with the aim of profiteering.
The blue-ribbon Commission on Social Determinants of Health (CSDH), convened in
2005 by the World Health Organization (WHO) maintains that longevity and
susceptibility to disease often have less to do with infections and genetics than with
the social determinants of health - factors such as income, education, occupation,
access to services such as sanitation, good medical treatment, and decent housing. In
South Asia, we have yet to come to terms with the interlocking relationships between
economic achievements, social investments, and health outcomes. Not only does a
country's state of health boost economic output, economics can and should promote
better health as well.
The urban and elitist biases inherent in health facilities in most South Asian countries,
and the neglect of primary and tertiary healthcare, mean that such facilities over-care
for the rich and neglect the poor. With the exception of Sri Lanka, these countries'
health sectors have tended to evolve in line with the broader dynamics of 'free' market
forces, the inherent class contradictions of which have led to the development of a
largely curative-care model. Medical education at local institutions in the region often
replicates what is found in developed countries, resulting in a demand for the 'latest'
(which does not necessarily mean the most appropriate) medical care.
This bleak picture aside, there are nonetheless instances that show that it is possible to
challenge the hegemony of laissez-faire economics under which health, and indeed
other social services, become profiteering ventures. Sri Lanka's success in developing a
highly dispersed rural health infrastructure and policies rooted in preventative
healthcare; and the success of Pakistan's community-embedded Lady Health Workers
Programme, show that health outcomes need be achieved even at the cost of economic
gains. As Nobel laureate Amartya Sen has often candidly pointed out, people can
hardly be expected to generate income when they are not healthy enough to hold a job. Improving the state of health in the region requires a creative and more far-reaching
approach to how the health and well-being of the region's people can be improved. Sri
Lanka, for instance, has been able to use efficiency gains to keep government health
spending limited to less than two percent of its GDP. By giving curative and
preventative healthcare priority in public health budgets, and allowing access to
precede quality, the country's public healthcare providers have not allowed themselves
to be dislodged by the private sector.
iv
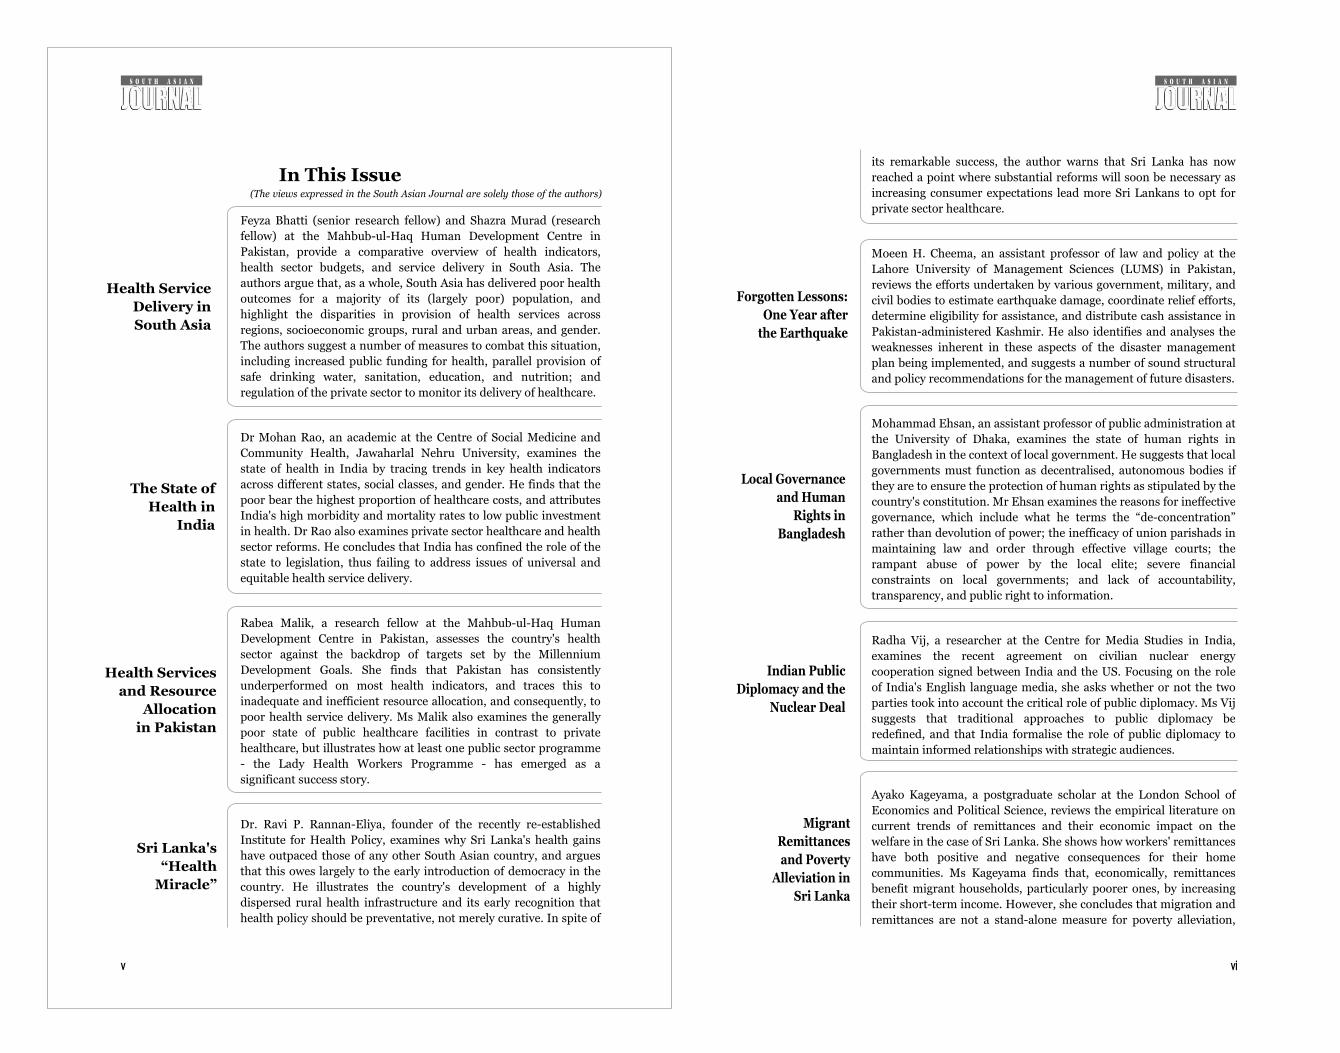
Feyza Bhatti (senior research fellow) and Shazra Murad (research
fellow) at the Mahbub-ul-Haq Human Development Centre in
Pakistan, provide a comparative overview of health indicators,
health sector budgets, and service delivery in South Asia. The
authors argue that, as a whole, South Asia has delivered poor health
outcomes for a majority of its (largely poor) population, and
highlight the disparities in provision of health services across
regions, socioeconomic groups, rural and urban areas, and gender.
The authors suggest a number of measures to combat this situation,
including increased public funding for health, parallel provision of
safe drinking water, sanitation, education, and nutrition; and
regulation of the private sector to monitor its delivery of healthcare.
Dr Mohan Rao, an academic at the Centre of Social Medicine and
Community Health, Jawaharlal Nehru University, examines the
state of health in India by tracing trends in key health indicators
across different states, social classes, and gender. He finds that the
poor bear the highest proportion of healthcare costs, and attributes
India's high morbidity and mortality rates to low public investment
in health. Dr Rao also examines private sector healthcare and health
sector reforms. He concludes that India has confined the role of the
state to legislation, thus failing to address issues of universal and
equitable health service delivery.
Rabea Malik, a research fellow at the Mahbub-ul-Haq Human
Development Centre in Pakistan, assesses the country's health
sector against the backdrop of targets set by the Millennium
Development Goals. She finds that Pakistan has consistently
underperformed on most health indicators, and traces this to
inadequate and inefficient resource allocation, and consequently, to
poor health service delivery. Ms Malik also examines the generally
poor state of public healthcare facilities in contrast to private
healthcare, but illustrates how at least one public sector programme
- the Lady Health Workers Programme - has emerged as a
significant success story.
Dr. Ravi P. Rannan-Eliya, founder of the recently re-established
Institute for Health Policy, examines why Sri Lanka's health gains
have outpaced those of any other South Asian country, and argues
that this owes largely to the early introduction of democracy in the
country. He illustrates the country's development of a highly
dispersed rural health infrastructure and its early recognition that
health policy should be preventative, not merely curative. In spite of
In This Issue(The views expressed in the South Asian Journal are solely those of the authors)
v
Health Service
Delivery in
South Asia
The State of
Health in
India
Health Services
and Resource
Allocation
in Pakistan
Sri Lanka's
“Health
Miracle”
vi
its remarkable success, the author warns that Sri Lanka has now
reached a point where substantial reforms will soon be necessary as
increasing consumer expectations lead more Sri Lankans to opt for
private sector healthcare.
Moeen H. Cheema, an assistant professor of law and policy at the
Lahore University of Management Sciences (LUMS) in Pakistan,
reviews the efforts undertaken by various government, military, and
civil bodies to estimate earthquake damage, coordinate relief efforts,
determine eligibility for assistance, and distribute cash assistance in
Pakistan-administered Kashmir. He also identifies and analyses the
weaknesses inherent in these aspects of the disaster management
plan being implemented, and suggests a number of sound structural
and policy recommendations for the management of future disasters.
Mohammad Ehsan, an assistant professor of public administration at
the University of Dhaka, examines the state of human rights in
Bangladesh in the context of local government. He suggests that local
governments must function as decentralised, autonomous bodies if
they are to ensure the protection of human rights as stipulated by the
country's constitution. Mr Ehsan examines the reasons for ineffective
governance, which include what he terms the “de-concentration”
rather than devolution of power; the inefficacy of union parishads in
maintaining law and order through effective village courts; the
rampant abuse of power by the local elite; severe financial
constraints on local governments; and lack of accountability,
transparency, and public right to information.
Radha Vij, a researcher at the Centre for Media Studies in India,
examines the recent agreement on civilian nuclear energy
cooperation signed between India and the US. Focusing on the role
of India's English language media, she asks whether or not the two
parties took into account the critical role of public diplomacy. Ms Vij
suggests that traditional approaches to public diplomacy be
redefined, and that India formalise the role of public diplomacy to
maintain informed relationships with strategic audiences.
Ayako Kageyama, a postgraduate scholar at the London School of
Economics and Political Science, reviews the empirical literature on
current trends of remittances and their economic impact on the
welfare in the case of Sri Lanka. She shows how workers' remittances
have both positive and negative consequences for their home
communities. Ms Kageyama finds that, economically, remittances
benefit migrant households, particularly poorer ones, by increasing
their short-term income. However, she concludes that migration and
remittances are not a stand-alone measure for poverty alleviation,
Forgotten Lessons:
One Year after
the Earthquake
Local Governance
and Human
Rights in
Bangladesh
Indian Public
Diplomacy and the
Nuclear Deal
Migrant
Remittances
and Poverty
Alleviation in
Sri Lanka

8
Health Conditions and Service Delivery in South Asia
Feyza Bhatti and Shazra Murad
mproving health outcomes through the provision of universal, equitable, and
high-quality public health services to all by the year 2000 has remained high on
the agenda of international organisations, governments, and civil society since Ithe Alma Ata Declaration of 1978. However, most governments failed to expand the
provision of healthcare services to all by 2000, and once again at the United Nations
Millennium Summit in September 2000, government representatives from 189
countries pledged to join hands to improve the health status of all, particularly women
and children, by 2015. The strong commitment by governments to improving health
outcomes is reflected in the Millennium Development Goals (MDGs), since three of 1the eight goals directly refer to health.
Improved health conditions undeniably boost economic growth and contribute
positively to poverty alleviation, as well as to a country's economic and human
development. Freedom from illness increases a person's physical and mental ability to
reallocate time - which might otherwise have been lost - to education and skill
building as well as to economic, social, and political participation. Better health also 2increases labour productivity, which brings about higher economic growth in the long
run. It also contributes to the demographic transition from high to low death and
birth rates, which in turn leads to progress in decreasing infant and under-five 3mortality rates, and thus fertility rates. Freedom from diseases, particularly
communicable diseases, not only contributes to individual well-being but improves 4the investment climate and encourages tourism and trade. Most importantly perhaps,
5the right to a healthy life and freedom from diseases is the right of every individual;
improving the health status of its citizens consequently improves a country's human
development and state of human rights.
Ensuring universal and equitable access to good-quality health services requires a
government to invest significantly in the health of its people by allocating a sufficient
share of public revenues for health sector development to (i) improve functioning
healthcare systems through better regulation and monitoring, and (ii) boost human
development by addressing income poverty, improving physical infrastructure (water,
sanitation, and roads) and education outcomes, and reducing gender inequalities.
Allocations to the health sector vary among countries depending on their income
levels as well as their governments' priorities. While high-income countries spend 11.2
percent of their GDP on health, spending on the health sector is only 6.0 percent and 64.6 percent for middle- and low-income countries, respectively. Furthermore,
and need to be addressed by appropriate policies to address
unexpected adverse effects.
Dr T. T. Sreekumar - assistant professor of communications and
media at the National University of Singapore - and Dr. Gayathri - a
consultant at the Institute for Human Development, India -
examine the nature and extent of child labour and child abuse in
India's services sector, focusing on the travel and catering industry.
The authors assess the response of civil society to this serious
concern against the backdrop of inadequate judicial and legal
interventions. They argue that an “obligations-based approach” is
preferable to a rights-based approach, given the difficulties of
enforcing “children's rights” in a developing country.
Dr Rupinder Kaur, an associate fellow at the National Council of
Applied Economic Research in India, provides a case study of
Indian Punjab in terms of how the “green revolution” has affected
women's productivity, and criticises the assumption that all
members of an agricultural household share equally in the benefits
and burden of technological change. She finds that data collection
methods and conceptual definitions in labour economics based on
western experience prove inadequate when applied to developing
countries such as India.
Shivraj Bhatt, a trade economist at South Asia Watch on Trade,
Economics and Environment (SAWTEE) in Nepal, argues that
integrating the services sector into the South Asian Free Trade
Agreement (SAFTA) framework is essential if South Asian countries
are to realise the benefits of a free-trade area. He evaluates the
importance of the services sector for SAARC member countries and
the country-specific challenges that this move would lead to in
terms of the benefits and cost of service trade liberalisation. He
finds that, despite certain inherent risks, the liberalisation of the
services sector could have positive spill-over effects on other
economic activities.
M. Ziauddin, a leading Pakistani journalist, takes an exceptionally
critical view of the seven-year rule of President General Pervez
Musharraf. Focusing on constitutional issues, and the North
Waziristan and Balochistan imbroglios, Mr Ziauddin laments the
overall performance of the government, its economic strategy, and
approach towards the Indo-Pak peace process. While ignoring what
good the Musharraf government has brought about with the
reversal of a pro-jihad policy, he criticises what he considers to be
quite devastative policies. Although he admits that the economy has
witnessed a respectable growth rate, he reveals serious fears that
the government's whole economic strategy has been instrumental
in widening the gap between rich and poor.
vii
Indian Women
and the Green
Revolution
The Services
Sector
under SAFTA
Viewpoint: Seven
Years under
General
Musharraf
Combating Child
Labour in India's
Services Sector

109
resources within countries are unevenly distributed between the poor and non-poor,
rural and urban areas, and between genders - the poor, the rural population, and
women emerge as the most disadvantaged. Progress in human development has also
been relatively slow in regions such as South Asia and sub-Saharan Africa. Besides
insufficient expenditure and unjust distribution of resources, increasing health
problems - such as the global HIV/AIDS epidemic - and the resurgence of
communicable diseases like malaria and tuberculosis have led to problems of
efficiency in the delivery of health services in low-income countries, weakened health 7management systems, and increased corruption in the health sector. Providing health
services to all is thus an enormous challenge for those South Asian countries that are
signatories to the Millennium Summit Declaration.
This paper is divided into four sections. The first section looks at the present health
conditions in South Asia relative to other regions of the world. The second section
compares the region's health sector expenditures with that of other developing and
developed regions. The third section analyses the problems in provision of healthcare
services to all in South Asia in absolute terms as well in comparison with other regions
of the world. The main challenges facing the health sector and possible remedies to
improve health outcomes are discussed in the concluding section.
The State of Health in South AsiaSouth Asia is one of the most heavily populated regions in the world and also one of
the world's poorest. Despite significant progress over the years in reducing poverty
and improving the lives of many of its people, there is still widespread deprivation and
neglect. The sheer magnitude of human distress in the region numbs the mind: more
than one-third of South Asians lack access to improved sanitation, one-third live in
poverty, one-quarter go hungry or are malnourished, one-fifth of children do not 8attend primary school, and almost one-tenth of children die before the age of five.
Health, despite being guaranteed in the constitutions of every South Asian country,
has been neglected in public budgets - spending on health has averaged a mere 1
percent of GDP. This has resulted in poor health outcomes for a majority of the largely
poor population of South Asia. What is even more disturbing is the inequality in
access and provision of health services among different regions, socioeconomic
groups, rural and urban areas, and also across gender. This disparity in the delivery of
health services to the poor, women, children, and people living in rural areas across
South Asia has resulted in large disparities in health outcomes among these groups.
Health conditions also vary among each of the countries within the region with some
countries having made more progress than others. For example, Sri Lanka and Kerala
in India have made significant progress in health, with most indicators comparable to
those in developed countries, while other countries like Pakistan and Nepal reveal
some of the poorest health outcomes in the region and in the world. Aggregate
numbers for the region mask the several layers of disparity that exist here and it is
only by analysing the health outcomes for each country - and where possible across
different regions and groups within countries - that a realistic assessment of the health
status in South Asia is possible.
While health spending remains insufficient, the region's large and growing population
continues to place an additional burden on already inadequate health facilities. South
Asia's population has nearly doubled in the last three decades and is expected to
increase to around 1.7 billion by 2015 (Table 1). India alone is home to more than 1
billion people. The region, which contains one-fifth of humanity, also has one of the
largest concentrations of poor people, with more than 400 million people living below
USD1 a day. This means that every two in five poor persons in the world live in South
Asia. The poor are more vulnerable to disease and malnutrition, and are also least
likely to access healthcare for themselves and their children. This results in a large
waste of human potential and human lives and a denial of the very basic “freedom to
survive” (Sen 1999).
A demographic transition is underway in South Asia, with crude birth rates and death
rates falling over the years. The crude death rate has declined constantly over the
years and fell by around 48 percent during 1970-2002. This decline in death rates has
also led to a decline in birth rates. While these health gains are commendable, they are
not equally distributed in the region and among the various groups. The poorest and
most vulnerable segments of society in the region have benefited least from
improvements in the health sector. In 2003, the crude birth rate in the region varied
from a low of 16 per 1,000 live births in Sri Lanka, to 24 in India, and relatively higher
Table 1: Population in South Asia, 1975-2015 (Million)
Country 1975 2003 2015
India 620.7 1071.0 1,260.0
Pakistan 68.3 151.8 193.4
Bangladesh 73.2 136.6 168.2
Nepal 13.5 26.1 32.7
Sri Lanka 14.0 20.4 22.3
Bhutan 1.2 2.1 2.7
Maldives 0.1 0.3 0.4
South Asia (Total) 791.0 1,408.0 1,680.0
Source: UNDP 2005.
Table 2: Demographic Trends in South Asia, 1994-2003
Crude Birth Rate (per 1,000 Live Births) Crude Death Rate (per 1,000 Live Births) Fertility RateCountry
1994 2003 1994 2003 1994 2003
India
29
24
10
8
3.8 3.0
Pakistan
41
36
9
10
6.1 5.0
Bangladesh
36
29
12
8
4.7 3.4
Nepal
39
33
13
10
5.4 4.2
Sri Lanka
21
16
6
7
2.5 2.0
Bhutan
40
35
15
9
5.8 5.0
Maldives
42
36
9
6
6.8 5.3
South Asia (Weighted Average) 32 26 10 8 4.2 3.3
Source: MHHDC 2005.
12
economic growth. It is thus important for policymakers to analyse the reasons for this
disparity that has emerged between growth and quality of human lives, especially
people's health.
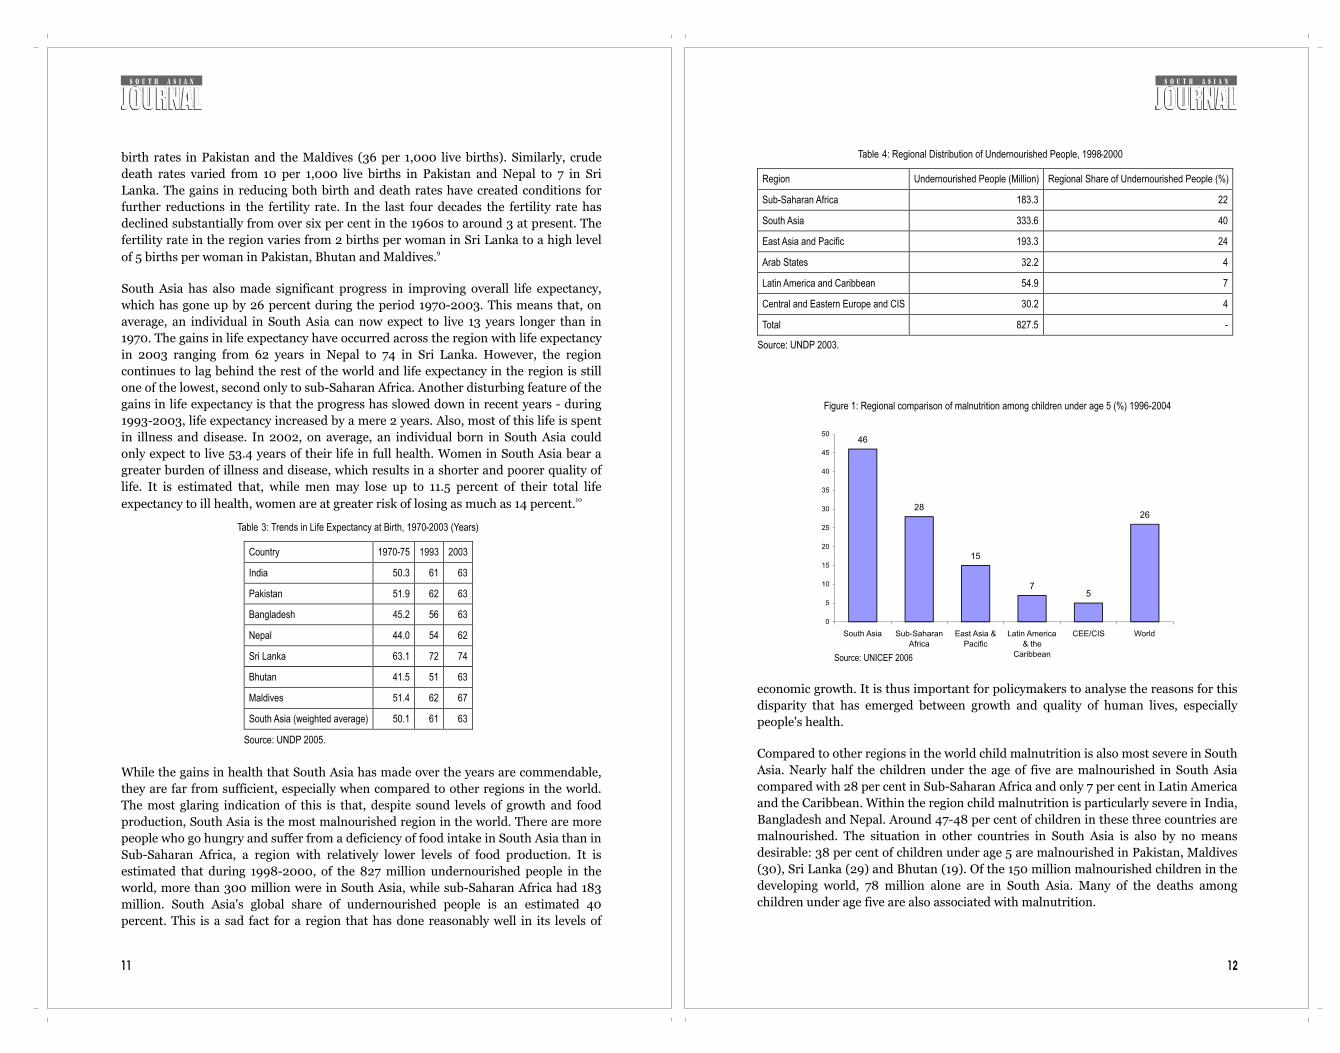
Compared to other regions in the world child malnutrition is also most severe in South
Asia. Nearly half the children under the age of five are malnourished in South Asia
compared with 28 per cent in Sub-Saharan Africa and only 7 per cent in Latin America
and the Caribbean. Within the region child malnutrition is particularly severe in India,
Bangladesh and Nepal. Around 47-48 per cent of children in these three countries are
malnourished. The situation in other countries in South Asia is also by no means
desirable: 38 per cent of children under age 5 are malnourished in Pakistan, Maldives
(30), Sri Lanka (29) and Bhutan (19). Of the 150 million malnourished children in the
developing world, 78 million alone are in South Asia. Many of the deaths among
children under age five are also associated with malnutrition.
Figure 1: Regional comparison of malnutrition among children under age 5 (%) 1996-2004
46
28
15
75
26
0
5
10
15
20
25
30
35
40
45
50
South Asia Sub-Saharan
Africa
East Asia &
Pacific
Latin America
& the
Caribbean
CEE/CIS World
Source: UNICEF 2006
Table 4: Regional Distribution of Undernourished People, 1998-2000
Region Undernourished People (Million) Regional Share of Undernourished People (%)
Sub-Saharan Africa 183.3 22
South Asia 333.6 40
East Asia and Pacific 193.3 24
Arab States 32.2 4
Latin America and Caribbean 54.9 7
Central and Eastern Europe and CIS 30.2 4
Total 827.5 -
Source: UNDP 2003.
11
birth rates in Pakistan and the Maldives (36 per 1,000 live births). Similarly, crude
death rates varied from 10 per 1,000 live births in Pakistan and Nepal to 7 in Sri
Lanka. The gains in reducing both birth and death rates have created conditions for
further reductions in the fertility rate. In the last four decades the fertility rate has
declined substantially from over six per cent in the 1960s to around 3 at present. The
fertility rate in the region varies from 2 births per woman in Sri Lanka to a high level 9of 5 births per woman in Pakistan, Bhutan and Maldives.
South Asia has also made significant progress in improving overall life expectancy,
which has gone up by 26 percent during the period 1970-2003. This means that, on
average, an individual in South Asia can now expect to live 13 years longer than in
1970. The gains in life expectancy have occurred across the region with life expectancy
in 2003 ranging from 62 years in Nepal to 74 in Sri Lanka. However, the region
continues to lag behind the rest of the world and life expectancy in the region is still
one of the lowest, second only to sub-Saharan Africa. Another disturbing feature of the
gains in life expectancy is that the progress has slowed down in recent years - during
1993-2003, life expectancy increased by a mere 2 years. Also, most of this life is spent
in illness and disease. In 2002, on average, an individual born in South Asia could
only expect to live 53.4 years of their life in full health. Women in South Asia bear a
greater burden of illness and disease, which results in a shorter and poorer quality of
life. It is estimated that, while men may lose up to 11.5 percent of their total life 10expectancy to ill health, women are at greater risk of losing as much as 14 percent.
While the gains in health that South Asia has made over the years are commendable,
they are far from sufficient, especially when compared to other regions in the world.
The most glaring indication of this is that, despite sound levels of growth and food
production, South Asia is the most malnourished region in the world. There are more
people who go hungry and suffer from a deficiency of food intake in South Asia than in
Sub-Saharan Africa, a region with relatively lower levels of food production. It is
estimated that during 1998-2000, of the 827 million undernourished people in the
world, more than 300 million were in South Asia, while sub-Saharan Africa had 183
million. South Asia's global share of undernourished people is an estimated 40
percent. This is a sad fact for a region that has done reasonably well in its levels of
Table 3: Trends in Life Expectancy at Birth, 1970-2003 (Years)
Country 1970-75 1993 2003
India 50.3 61 63
Pakistan 51.9 62 63
Bangladesh 45.2 56 63
Nepal 44.0 54 62
Sri Lanka 63.1 72 74
Bhutan 41.5 51 63
Maldives 51.4 62 67
South Asia (weighted average) 50.1 61 63
Source: UNDP 2005.

1413
South Asia has also made substantial progress in reducing both infant and child
mortality over the years. The improvements in reducing infant and child mortality
pregnancy related deaths in South Asia each year. This makes it the region with
second highest number of maternal deaths after Sub-Saharan Africa. The tragedy in a majority of the premature deaths that occur in South Asia is that
many of these are easily preventable by small investments in improving living
conditions for the masses and an emphasis by governments in the region on
preventive primary level care. These small changes in the focus of public policy in
health can go a long way in improving the lives a millions of health deprived South
Asians.
Health Sector Expenditures South Asia, in general, is characterised by a weak public financial commitment and a
significant dependence on private out-of pocket spending.
As Table 7 shows, South Asia's expenditure on health sector-both total and public
sector expenditure as percentage of GDP- is lowest when compared to other regions of
the world. Furthermore, in the absence of social security programmes, almost all the
private health expenditure is financed directly by households. Considering that one-
Figure 2: South Asia: Infant mortality rate (per 1,000 live births) 1990-2003
80
96 96100
19
7580
84
63
81
46
61
13
70
55
63
0
20
40
60
80
100
120
India Pakistan Bangladesh Nepal Sri Lanka Bhutan Maldives South Asia
1990 2003
Source: UNDP 2003 and 2005
Figure 3: South Asia: Under-five mortality rate (per 1,000 live births) 1990-2003
123128
144 145
23
166
115
126
87
103
69
82
15
85
72
86
0
20
40
60
80
100
120
140
160
180
India Pakistan Bangladesh Nepal Sri Lanka Bhutan Maldives South Asia
1990 2003
Source: UNDP 2003 and 2005
Table 5: Regional comparison: Infant and child mortality 1990-2003
Infant mortality rate (per 1,000 live births) Under-five mortality rate (per 1,000 live births) Region
1990 2003 1990 2003
Developing countries 70 60 104 88
Arab States 63 48 90 61
East Asia and Pacific 42 31 58 39
Latin America and Caribbean
42 27 53 32
Sub-Saharan Africa 111 105 180 179
South Asia 84 63 126 86
World 63 54 93 80
Sources: UNDP 2003 and 2005.
: The burden of maternal mortality in South Asia (2000)Table 6
Maternal deaths (total) Life time risk of maternal death 1 in: Maternal mortality ratio
India 136,000 48 540
Pakistan 26,000 31 500
Bangladesh 16,000 59 380
Nepal 6,000 24 740
Sri Lanka 300 430 92
Bhutan 310 37 420
Maldives 10 140 110
South Asia 184,620 52 516
Source: WHO, UNICEF, and UNFPA 2002

16
Analysing the data in terms of per capita health expenditure, the inadequacy of the
amount spent on healthcare becomes more obvious. Sachs (2001) estimated that in a
low income country the minimum required per capita expenditure on health in order
to be able to introduce basic essential health services would be US$30-45. South Asia
is the only region of the world that has lower than US$30 per capita health spending.
South Asian countries spend a total of US$35.5 billion, of which US$8.6 billion was
general government expenditure on health during 2003.13 The per capita health
spending, which was also mainly private, was only US$24 in 2003. This was two-
thirds of the spending of Sub-Saharan Africa and only 11% of what Latin America and
Caribbean spent in health during the same year.
Per capita total spending was US$24. Among the South Asian countries, except Sri
Lanka, which was at the lower bound of minimum required per capita spending, none
of the South Asian countries spent more than US$30 per capita on health sector. The
per capita health expenditure varies between US$12 in Nepal to US$31 in Sri Lanka
(table 10).
Table 8: Health expenditure in South Asia, 2003
Total Public Out-of-pocket
(as % of GDP) (as % of GDP) (% of total) (% of private expenditure)
Bangladesh 3.4 1.1 31.3 85.8
India 4.8 1.2 35.9 97.0
Nepal 5.3 1.5 27.8 92.2
Pakistan 2.4 0.7 27.7 98.0
Sri Lanka 3.5 1.6 45.0 88.9
Source: World Bank 2006
Table 9: Per capita health expenditure by regions in US$, 2003
Per capita health expenditure
Current US $
South Asia 24
East Asia & Pacific 64
Europe & Central Asia 194
Latin America and Caribbean 222
Middle East and North Africa 92
Sub-Saharan Africa 36
Source: World Bank 2006
15
11third of South Asians are poor, high dependence on out-of-pocket health expenditure
means a high number of poor in South Asia have to either sacrifice their spending on
food or other basic services to receive healthcare, or borrow money to cover health
expenditures. High out-of-pocket expenditures are also a push factor for driving
people into lifetime poverty. In India, each year 2.2 per cent of the population is
pushed below the poverty line as a result of health expenses that swell household
budgets.
As Table 7 shows, in 2003 the total health expenditure of South Asian countries was
only 4.4 per cent of GDP as compared to 5.1 per cent in Middle East and North Africa,
6.1 per cent in Sub-Saharan Africa and 6.8 per cent in Latin America and Caribbean.
Only one-quarter of this expenditure was financed by public sector; indicating that
public sector expenditure on health in South Asia was as low as 1.1 per cent of GDP.
Furthermore, 75 per cent of health spending came from private sources mainly from
out-of-pocket expenditures (95.7 percent of private expenditure) highlighting that a
high proportion of health sector expenditures are financed directly by individual
households in South Asia. Sri Lanka and Nepal are the countries which have highest public spending on health in
the region with around 1.5-1.6 per cent of their GDP being spent on health. However,
even this does not exclude them from being ranked among countries of the world with
lowest public health spending (as a percentage of GDP). Pakistan has the worst record
in public financing of health sector. Only 0.7 per cent of Pakistan's GDP is spent on
public health services. Indeed, with this spending level Pakistan is one of the four 12lowest spending countries (in terms of GDP share) in the world. Table 8 also
indicates that except Sri Lanka, the health expenditure is highly financed by private
sector.
Table 7: Health expenditure by region, 2003
Total Public Out-of-pocket
(as % of GDP) (as % of GDP) (% of total) (% of private expenditure)
South Asia 4.4 1.1 25.0 95.7
East Asia & Pacific 5.0 1.9 39.0 88.3
Europe & Central Asia 6.5 4.5 67.3 79.9
Latin America and Caribbean 6.8 3.3 48.2 75.3
Middle East and North Africa 5.6 2.7 50.9 89.2
Sub-Saharan Africa 6.1 2.4 41.2 47.4
Note: The figure for South Asia is calculated using weighted index according to the populations of countries
Source: World Bank 2006 and authors calculations

1817
South Asia with 61 per cent of measles immunisation rate has the lowest coverage in
the world. In DPT, South Asia has the second lowest coverage after Sub-Saharan
Africa.
Basic healthcare services also fail to reach all. There are significant differences
between rural and urban areas, and between rich and poor in receiving these services,
expect for Sri Lanka which has almost universal immunisation coverage and skilled
birth attendance both in rural and urban areas. To give some examples of these
differences:
lIn India, immunisation coverage of one-year olds in rural areas was 36.6% while
in urban areas it was 60.5%. Only 28% of children from poorest families were
immunised as oppose to 81% of children from richest families. Similarly, only a
small percentage of births are attended by skilled health staff (16.4%) in poorest
families while the births attended by skilled health staff in richest families are
84.4%. lIn rural Pakistan, the immunisation coverage of children was 46% while it was
70% in urban areas. The immunisation rate of children in richest households
(42%) was double of the rate in poorest households (20%). The percentage of
births attended by skilled health staff was 12 times higher in richest households
than it was in poorest households in Pakistan as well as in Bangladesh and Nepal.lIn Bangladesh, while the difference between rural and urban areas in
immunisation coverage of children was not as high as it was in India or Pakistan
(69.7% in urban and 58.3% in rural areas), the differences between income groups
are high both in immunisation coverage and percentage of births attended by
health staff.
Besides low coverage, inadequate reach and poor quality of health services provided
by the public sector corruption is also a major problem. There is widespread neglect
on the part of health providers in the public sector especially in remote areas. In many
countries in South Asia doctor absenteeism is common and doctors appointed to
villages often fail to be on duty and continue to extract pays. Along with this there is
also a problem of low drug availability often as a result of medicines meant to be given
free of charge being sold by nursing staff and doctors. A study by Transparency
International (2002) shows that among the families who were surveyed and used
government health services during one year prior to the survey, around half of the 22families in Bangladesh and 65% in Pakistan reported irregular admission processes,
and majority of families in Bangladesh (58%), Pakistan (96%) and Sri Lanka (92%) 23also reported corruption after admission to the hospital as well.
Other factors not directly emanating from the health sector also lead to poor health
condition for a large majority of people in South Asia. These are mainly related to
overall weak infrastructure (lack of safe water and proper sanitation facilities, roads),
low education and literacy levels, and widespread gender discrimination and social
and cultural factors that might influence health knowledge and behaviour such as
taboos on sexual health.
24There is a direct link between education, particularly female education and health.
Table 10: Per capita health expenditure in South Asia (US$), 2003
Total health expenditure
Per capita total health expenditure
Per capita public health expenditure
US$ (in billions) Current US $ Current US $
Bangladesh 1.92 14 4
India 28.64 27 7
Nepal 0.32 12 3
Pakistan 1.99 13 4
Sri Lanka 0.63 31 14
Source: World Bank 2006 and WHO 2006

20
treatment even if there is a life-threatening situation. For example, in most of the
countries of the region as high percentage of women cannot go to the health facilities
alone or without the permission of their husbands or in-laws. Lack of decision-making
power and the taboos about sex also curtails the bargaining power of women relating
to their reproductive choices and rights. Women in South Asia bear a heavy burden on
their health due to repeated and closely spaced births. In recent years, the risk of
HIV/AIDS is also poses a serious threat to health of women in South Asia.
Universal access to safe water and sanitation are crucial for improving the health 26outcomes, particularly infant and child mortality and nutrition. South Asia is the
region where out of 1.4 billion people 897.3 million are without access to sanitation 27and more than 200 million are without access to safe water. As compared to other
regions of the world South Asia has lowest access to sanitation and second lowest
access to safe water after Sub-Saharan Africa, in terms of percentage share of
population having access to these services.
Improving Health Services in South Asia: RecommendationsIn this paper, we have provided some snapshots of the health sector in South Asia
both in terms of inputs and outcomes. The available data and analysis showed that the
health sector outcomes are very low as compared to other developing regions of the
world. In addition, spending by the governments is inadequate and any possibility of
effective public provision is hampered by a complex range of weaknesses in the health
sector as well as low human development levels Improving health outcomes and attaining MDGs within the specified time period is
quite unlikely for all of South Asian countries, except Sri Lanka which has a fairly
higher per capita public spending and a comparatively fairer health sector. The
challenge for improving health for all in South Asia is huge and requires commitment
by its governments both in terms of increased spending and in ensuring that the
services reach the most vulnerable groups. Some of the steps that can be adopted to
improve the lives of millions of poor people in the region are outlined below:
lIncrease public funding for health: there is an urgent need to increase
investments in health in order to achieve lower death and disease rates. In order
to reach the goal of health for all South Asia governments must increase their
financial commitment to health.lIncrease public spending on primary level facilities: health budgets must focus
on providing basic health facilities for all and target specific groups that require
urgent attention. Focus of health budgets must shift from tertiary to primary
level care and from curative to preventive facilities.lEfficiency, equity and quality: whatever is spent on health must be used
efficiently minimising losses and waste. There is also a need to ensure that equal
levels and quality of care are available and accessible for all. Vertical
programmes that have been introduced in recent years to deal with specific
issues like the Lady Health Worker Programme in Pakistan need to be
integrated into the health system to make them more accessible, sustainable and
efficient.
19
South Asia is the most illiterate region of the world. The adult literacy rate was 46 per
cent for females and 72 per cent for male adult populations indicating that around 25 400 million adults were illiterate.
Gender discrimination is widespread in the region. Despite closing over the last
decade, still the female-male disparities in education and literacy, economic, social
and political participation are broad. Lower status of women as compared to men has
various negative repercussions on the health outcomes of women. First of all, gender
discrimination in distribution of food leads to malnourishment among girls, and this
decreases the chances of survival from childhood diseases. Secondly, gender
discrimination decreases the chances of getting a proper treatment or delaying the
Table 12: Population with sustainable access to affordable essential drugs (%), 1999
Bangladesh 50-79
India 0-49
Nepal 0-49
Pakistan 50-79
Sri Lanka 95-100
Source: UNDP 2004
Table 13: The ability of healthcare system to provide basic maternal
health and immunisation services in South Asia
Births attended by skilled health staff 2000-04
Immunisation coverage (% of all children under the age 1) 2004
(% of total) Measles DPT
Bangladesh 13 77 85
India 43 56 64
Nepal 15 73 80
Pakistan 23 67 65
Sri Lanka 96 96 97
South Asia 36 61 67
Source: World Bank 2006
Table 11: Physicians and hospital beds per 1,000 people
Physicians 1997-2004 Hospital beds
per 1,000 people Per 1,000 people
South Asia 0.6 0.9
East Asia & Pacific 1.3 2.4
Europe & Central Asia 3.0 7.6
Latin America and Caribbean 1.9 …
Middle East and North Africa 1.2 …
Sub-Saharan Africa 0.1 …
Source: World Bank 2006

2221
lProvision of safe drinking water and sanitation: a large number of diseases in
South Asia are the result of poor unhygienic living conditions. Improving these
York: Oxford University Press.lUNDP (United Nations Development Programme). 2005. Human Development Report
2005, International cooperation at a crossroads: Aid, trade and security in an unequal
world. New York: Oxford University Press. Also available at
http://hdr.undp.org/statistics/data/rc_2005.cfmlUtstein Anti-corruption Resource Centre. 2006. Corruption in the health sector-Causes and
consequences. Available at http://www.u4.no/themes/health/causesandconsequences.cfr lWagstaff, A. 2002. Inequalities in Health Developing Countries: Swimming against the
Tide? World Bank Policy Research Working Paper Series #2795. Available at http://www-
wds.worldbank.org/servlet/WDSContentServer/WDSP/IB/2002/03/22/000094946_020
31204013460/Rendered/PDF/multi0page.pdflWHO (World Health Organization), UNICEF (United Nations Children's Fund), and
UNFPA (United Nations Population Fund). 2002. Maternal Mortality in 2000: Estimates
Developed by WHO, UNICEF and UNFPA. Available at http://www.who.int/reproductive-
health/publciations/maternal_mortality_2000/mme.pdf lWorld Bank. 2006. World Development Indicators 2006. CD-ROM. Washington D.C.lWHO (World Health Organization). 2006. National Health Accounts. Available at
http://www.who.int/nha/country/en/

2423

2625
The State of Health in IndiaDr Mohan Rao
ince its independence in 1947, India has made some substantial gains in health.
The infant mortality rate (IMR) was 134 per 1,000 live births at the time of 1Sindependence (GOI 2002) and declined to around 70 in 1999. The crude birth
rate (CBR), reflecting the huge mortality load, stood at 39.9 in 1941-51, declining to
26.1 in 1999. The crude death rate (CDR) declined from 27.4 in 1941-51 to 8.7 in 1999.
As a consequence, life expectancy at birth is now in the early 60s, from a figure in the
early 30s at the time of independence.
While these are indeed substantial achievements, compared to China - the only other
country in the world with which India can legitimately be compared - they are,
however, relatively modest. Despite the fact that at the time of her revolution, China
was relatively more disadvantaged than India in health indices and food availability,
by the late 1990s China had surpassed India in health achievements. Thus China had
an IMR of 38 while India's was 71; the under-5 mortality rate (U5MR) for China was
47, while that for India was 108; life expectancy at birth was 69.8 years in China, while
it was 62.6 years in India; the proportion of low-birth weight infants was 9 percent in
China while it was 33 percent in India; the TB prevalence rate per 100,000 was 38.1 in 2China, while it was 136.9 in India (Acharya et al: 2000). One fundamental reason for
this is of course the wide prevalence of hunger and poverty in the country; indeed as
the National Health Policy (NHP) notes, 44.2 percent of the population of India
survive on less than a dollar a day.
Yet the very first health policy adopted by the Government of India (GOI) in 1983 set
out to provide “universal, comprehensive primary healthcare services, relevant to the 3actual needs and priorities of the community” (GOI 1983:3). India is also a signatory
to the Alma Ata Declaration, which resolutely states: “The Conference strongly affirms
that health, which is a state of complete physical, mental and social well-being, and
not merely the absence of disease or infirmity, is a fundamental human right and that
the attainment of the highest possible level of health is a most important world-wide
social goal whose realisation requires the action of many other social and economic 4sectors in addition to the health sector” (WHO 1978:2).
Clearly then, there has been a wide chasm between policy commitment and its
transformation into reality. What are the reasons for this chasm? The following
section provides an overview of the current health scenario, surveying some indices of
health such as the IMR, the CMR, the sex ratio, maternal mortality rate (MMR), and
nutritional situation. It also provides data on one of the important determinants of the
current scenario, namely, the financing of healthcare in the country. In particular, it
surveys private healthcare in the country, with whatever data is available. The final
section briefly surveys the efforts underway towards health sector reforms and raises
some questions.
The Current Health ScenarioInfant and Child SurvivalTable 1 and Figure 1 provide data on a key indicator of the health of the country - the
IMR.Table 1: All India Infant Mortality Rates
Year Total Rural Urban
1971 129 138 82
1976 129 139 80
1981 110 119 62
1984
104
113
66
1985
97
107
59
1986
97
105
62
1987
95
104
61
1988
95
102
62
1989
91
98
58
1990
80
86
50
1991*
80
87
53
1992*
79
85
53
1993*
74
82
45
1994*
74
80
52
1995*
74
80
48
1996*
72
77
46
1997*
71
77
45
1998
72
77
45
1999
70
75
44
2000
68
74
44
2001
66
72
42
2002
63
69
40
2003
60
66
38
2004
58
64
40
* Excludes Jammu and Kashmir
Sources: Office of the Registrar General of India (1999), Compendium of India’s Fertility and Mortality Indicators, Sample Registration System (SRS), New Delhi. Office of the Registrar General of India (2000), Selected Socio-Economic Statistics: India 1999,New Delhi. ORGI, Sample Registration System (2001), SRS Bulletin, Vol.35, No.1.
28
social differences between groups within the population, which do not receive the
attention they deserve. Thus, the SCs, STs, and OBCs bear a disproportionate burden
of infant deaths, as indeed do the poor in general. What should be more worrying is
the slackening in the rate of decline over the last decade.
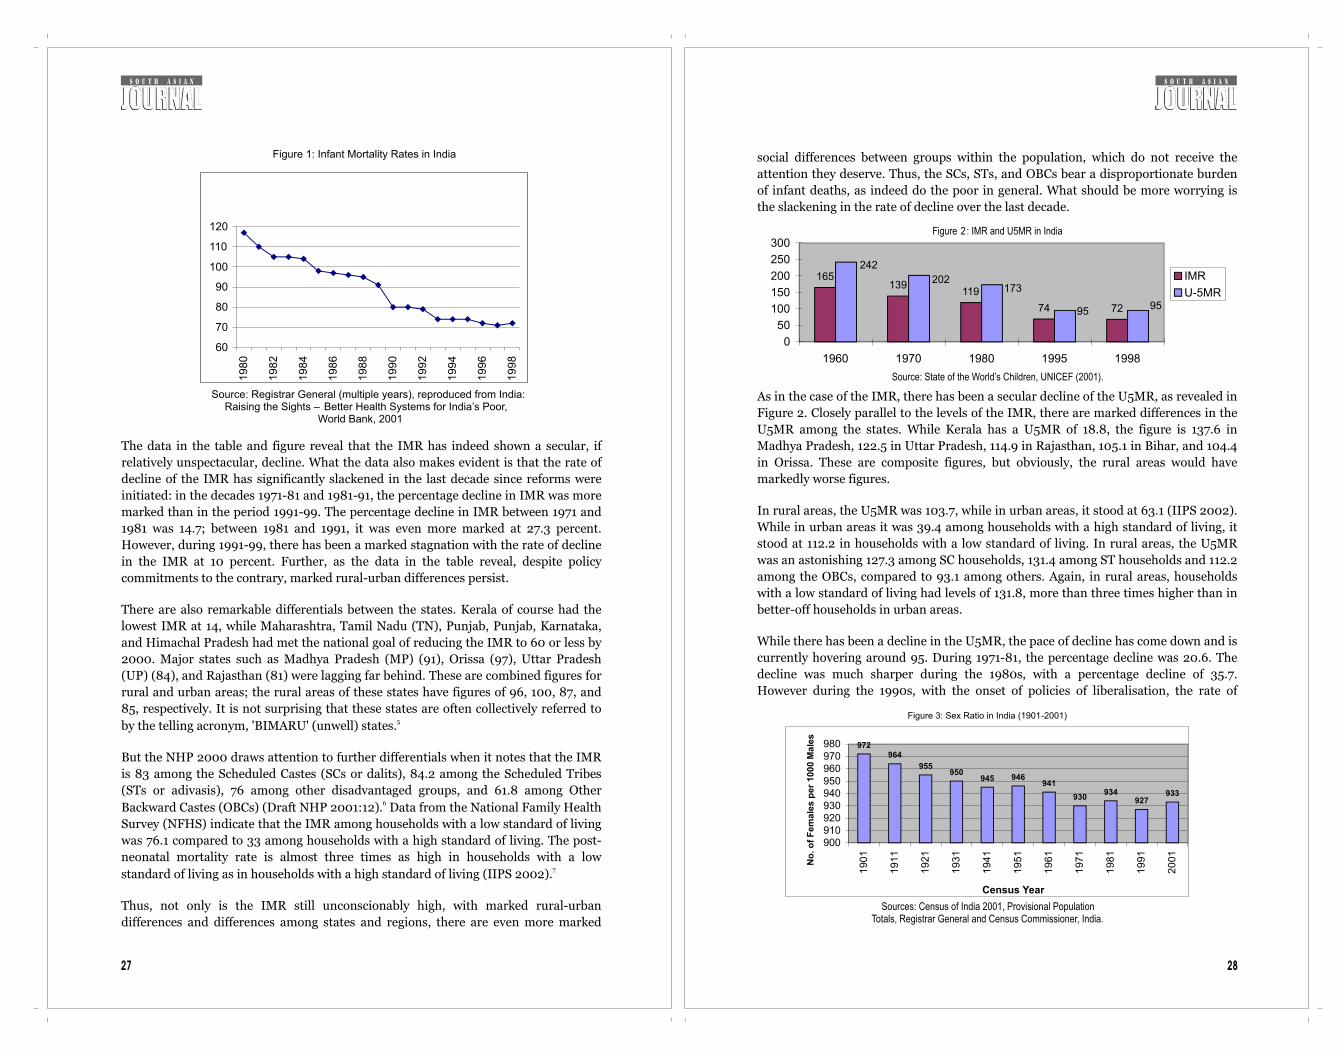
As in the case of the IMR, there has been a secular decline of the U5MR, as revealed in
Figure 2. Closely parallel to the levels of the IMR, there are marked differences in the
U5MR among the states. While Kerala has a U5MR of 18.8, the figure is 137.6 in
Madhya Pradesh, 122.5 in Uttar Pradesh, 114.9 in Rajasthan, 105.1 in Bihar, and 104.4
in Orissa. These are composite figures, but obviously, the rural areas would have
markedly worse figures.
In rural areas, the U5MR was 103.7, while in urban areas, it stood at 63.1 (IIPS 2002).
While in urban areas it was 39.4 among households with a high standard of living, it
stood at 112.2 in households with a low standard of living. In rural areas, the U5MR
was an astonishing 127.3 among SC households, 131.4 among ST households and 112.2
among the OBCs, compared to 93.1 among others. Again, in rural areas, households
with a low standard of living had levels of 131.8, more than three times higher than in
better-off households in urban areas.
While there has been a decline in the U5MR, the pace of decline has come down and is
currently hovering around 95. During 1971-81, the percentage decline was 20.6. The
decline was much sharper during the 1980s, with a percentage decline of 35.7.
However during the 1990s, with the onset of policies of liberalisation, the rate of
Figure 2 : IMR and U5MR in India
165139
119
7274 95
173202
242
95
0
50
100
150
200
250
300
1960 1970 1980 1995 1998
IMR
U-5MR
Source: State of the World’s Children, UNICEF (2001).
Figure 3: Sex Ratio in India (1901-2001)
972964
955950
945 946941
930934
927933
900910920930940950960970980
190
1
19
11
19
21
193
1
194
1
19
51
19
61
197
1
198
1
19
91
20
01
Census Year
No
.o
fF
em
ale
sp
er
1000
Male
s
Sources: Census of India 2001, Provisional Population Totals, Registrar General and Census Commissioner, India.
27
The data in the table and figure reveal that the IMR has indeed shown a secular, if
relatively unspectacular, decline. What the data also makes evident is that the rate of
decline of the IMR has significantly slackened in the last decade since reforms were
initiated: in the decades 1971-81 and 1981-91, the percentage decline in IMR was more
marked than in the period 1991-99. The percentage decline in IMR between 1971 and
1981 was 14.7; between 1981 and 1991, it was even more marked at 27.3 percent.
However, during 1991-99, there has been a marked stagnation with the rate of decline
in the IMR at 10 percent. Further, as the data in the table reveal, despite policy
commitments to the contrary, marked rural-urban differences persist.
There are also remarkable differentials between the states. Kerala of course had the
lowest IMR at 14, while Maharashtra, Tamil Nadu (TN), Punjab, Punjab, Karnataka,
and Himachal Pradesh had met the national goal of reducing the IMR to 60 or less by
2000. Major states such as Madhya Pradesh (MP) (91), Orissa (97), Uttar Pradesh
(UP) (84), and Rajasthan (81) were lagging far behind. These are combined figures for
rural and urban areas; the rural areas of these states have figures of 96, 100, 87, and
85, respectively. It is not surprising that these states are often collectively referred to 5by the telling acronym, 'BIMARU' (unwell) states.
But the NHP 2000 draws attention to further differentials when it notes that the IMR
is 83 among the Scheduled Castes (SCs or dalits), 84.2 among the Scheduled Tribes
(STs or adivasis), 76 among other disadvantaged groups, and 61.8 among Other 6Backward Castes (OBCs) (Draft NHP 2001:12). Data from the National Family Health
Survey (NFHS) indicate that the IMR among households with a low standard of living
was 76.1 compared to 33 among households with a high standard of living. The post-
neonatal mortality rate is almost three times as high in households with a low 7 standard of living as in households with a high standard of living (IIPS 2002).
Thus, not only is the IMR still unconscionably high, with marked rural-urban
differences and differences among states and regions, there are even more marked
Figure 1: Infant Mortality Rates in India
60
70
80
90
100
110
120
19
80
19
82
19
84
19
86
19
88
19
90
19
92
19
94
19
96
19
98
Source: Registrar General (multiple years), reproduced from India:
Raising the Sights – Better Health Systems for India’s Poor, World Bank, 2001

30 29
8 decline has reduced to 15.1 (Misra et al 2003).
The female-male ratio (FMR) in the world - that is, the number of females per 1,000
males - is 990. Western Europe has a figure of 1,064 females per 1,000 males, and
Africa, 1,015. Asia as a whole has FMRs of 953, but India shares extremely negative
sex ratios with a number of her neighbours in Asia. Values of less than 950 females
per 1,000 males are found in countries of West Asia (940), Pakistan (929), India
(933), Bangladesh (939), and China (41), an arc of 'anti-female' countries, cutting
across religions.
In India, there has been a steady decline in the sex ratio over the twentieth century.
The 1901 census showed 972 females per 1,000 males. It declined steadily to 946 in
1951, 941 in 1961, and 930 in 1971. The 1981 census threw up a happy figure of 934
females per 1,000 males. The optimistic thought that this indicated a halt in the
decline in the sex ratio. The 1991 figure, however, put paid to this optimism: it
revealed a further decline to 927. The 1981 figure, it is now accepted by demographers,
was caused by a significant under-counting of females due to a decline in the quality of
the 1971 census. Demographers are agreed that the 1991 and 2001 censuses are free
from this infirmity. This is to say that the 2001 census figures, of 933 females per
1,000 males, are real and indicative of an improvement in the overall survival of
females. Have we then turned the corner?
The sex ratio could turn feminine simply because more men than women have
migrated, but the juvenile or child sex ratio (CSR) is not subjected to this limitation,
and it is this that is deeply worrying. Despite the slight overall improvement in the SR,
the CSR in India as a whole has declined significantly - from 945 in 1991 to 927 in
2001. It is estimated that there are 35 million 'missing' females in India as per the 92001 census (Patel 2004).
This decline in the CSR has been particular notable in Himachal Pradesh (897),
Punjab (793), Chandigarh (845), Haryana (820), and Delhi (865). In all these states -
referred to as the 'Bermuda triangle' for missing females - the number of female
children per 1,000 male children in the 0-6-year-age-group declined by more than 50
between 1991 and 2001. Gujarat and Maharashtra, both better-governed states, have
also unfortunately joined this group of states.
A part of the declining CSR is due to continuing anti-female rates of infant and child
mortality. However, more significantly, there has also been a marked masculinisation
of the sex ratio at birth (SRB) In India, a figure of 105 male births for 100 female
births is considered the norm. However, estimates of the SRB for 1998 reveals an all-
India figure of 111 males per 100 females (Premi 2001).10 This is indicative of sex-
selective abortion (SSA) of females, or the pre-birth elimination of females (PBEF).
Figures above this national average of the SRB are seen in Gujarat (113.9), Haryana
(123.3), Punjab (122.8), Rajasthan (114.8), and Uttar Pradesh (118).
ti-female rates of infant and child mortality. However, more significantly, there has
also been a marked masculinisation of the sex ratio at birth (SRB) In India, a figure of
105 male births for 100 female births is considered the norm. However, estimates of
the SRB for 1998 reveals an all-India figure of 111 males per 100 females (Premi 102001). This is indicative of sex-selective abortion (SSA) of females, or the pre-birth
elimination of females (PBEF). Figures above this national average of the SRB are
seen in Gujarat (113.9), Haryana (123.3), Punjab (122.8), Rajasthan (114.8), and Uttar
Pradesh (118).
A 2003 report simply titled “Missing”, prepared by the United Nations Population
Fund (UNFPA), Ministry of Health and Family Welfare, and the Census
Commissioner, which mapped the adverse CSRs in India, captures the decline in the 11number of girls (UNFPA 2003). It reveals that 70 districts in 16 states and union
territories have recorded a more than 50-point decline in the CSR between 1991 and
2001. The decline in CSR has spread to regions and populations hitherto considered
immune, namely the states of the south and west of India and populations of dalits
and adivasis. What is also interesting is that the decline is more marked in the more
developed and better-off regions and in more literate and better-off social groups.
What is significant of course is that the worsening of the sex ratio is most marked in
those states that can claim to be better governed, and have a higher density of private
medical care services, and lower birth rates.
Maternal HealthThough reliable national estimates of maternal mortality are not available for many
countries, South Asia is believed to have among the highest MMRs in the world. As
Table 2 indicates, India's MMR is still extremely high, especially compared to China,
not to mention Sri Lanka. India and Pakistan have extremely high MMR, India's being
markedly higher than poorly governed Pakistan. The latest NFHS estimate is 540
deaths per 100,000 live births, compared to 350 among low- and middle-income
countries. Indeed the NFHS-II reveals that the MMR has actually increased in the
seven years since NFHS-1, which recorded a MMR of 424 deaths per 100,000 live
births. In both NFHS-I and II, the rural MMR was much higher than the urban (434
and 385 in NFHS-I and 619 and 267 in NFHS-II).
The 1998 Sample Registration Survey places MMR at 407 per 100,000 live births,
Table 2: MMR by Select Country
Country MMR
Korea 30
Sri Lanka 30
Malaysia 34
China 95
Pakistan 340
Indonesia 390
India 440
Bangladesh 850
Nepal 1500
Source: The State of the World’s Children, UNICEF, 2001
32
and an equal proportion of young adults. As we also saw, communicable diseases also
account for the largest proportion of deaths among women.
Reproductive HealthIndia commenced MCH and family planning services in the very first Five Year Plan;
indeed India was one of the first countries in the world to initiate an official policy and
programme for family planning. During the initial years, the focus was on antenatal
care and the training of traditional birth attendants to provide safe deliveries, along of
course with family planning, which has always stood at the heart of the programme,
its raison d'etre. Subsequently under the CSSM (Child Survival and Safe Motherhood)
programme launched in 1992, the focus was on encouraging institutional deliveries,
along with the Universal Immunisation Programme (UIP). These programmes have
been integrated into the Reproductive and Child Health Programme launched in 1996. Despite these initiatives, however, as the data we surveyed earlier revealed, they have
failed to have the expected impact in reducing the MMR or indeed the IMR and CMR.
The NFHS-II provides data indicating that MCH performance and coverage has been
extremely unsatisfactory. Only 65 percent of mothers received antenatal check-ups, 67
percent received two or more doses of tetanus toxoid, 58 percent received iron and
folic acid supplements, 34 percent of deliveries were institutional, and 42 percent of
deliveries were assisted by a health professional.
There are also significant disparities between states: Goa, Kerala, and TN consistently
rank in the top five, while UP, Bihar, and Rajasthan show a consistently poor
performance. Women not receiving antenatal checkups are disproportionately from
among the dalits, adivasis, and OBCs. Among women with a low standard of living, the
proportion receiving no antenatal care was 45.1 percent, compared with 12.4 percent
among women with a high standard of living. With reference to place of deliveries, 60
Figure 5: Burden of Disease in the World, High, Low and Middle Income Economies
Low & Middle Income
Injuries
17%
Non
Communicable
33%
Communicable
50%
World
Injuries
16%
Non-
Communicable
43%
Communicable
41%
High Income Economies
Communicable
7%
Non-
Communicable
81%
Injuries
12%
Source: World Health Report 1999, WHO, Geneva
31
apparently an underestimate, given the variations in state estimates (Office of the 12Registrar General, 2000). Even at this rate, more than 100,000 Indian women die of
pregnancy-related causes every year, which is about 18 percent of total global
maternal deaths.
While it is indeed the case that the MMR is extremely high in India, it is also true that
this is primarily due to the poor health status of women in general. In all age groups,
causes related to pregnancy account for 12 percent of all deaths. In other words,
causes other than pregnancy and childbirth account for much the larger proportion of
deaths, so that solutions to the problem focusing on maternal deaths alone would be
to miss the woods for the trees.
The trend of major causes of maternal death in rural India over time shows no
significant improvement. Haemorrhage and sepsis top the direct cause list, and
anaemia the indirect. Abortion-related deaths show a downward trend, while
toxaemia and malposition of the child remain almost at the same level. In short, they
attest not only to the poor health status of women in general, but to the lack of
adequate health facilities during pregnancy and childbirth, in particular the lack of
emergency obstetric care.
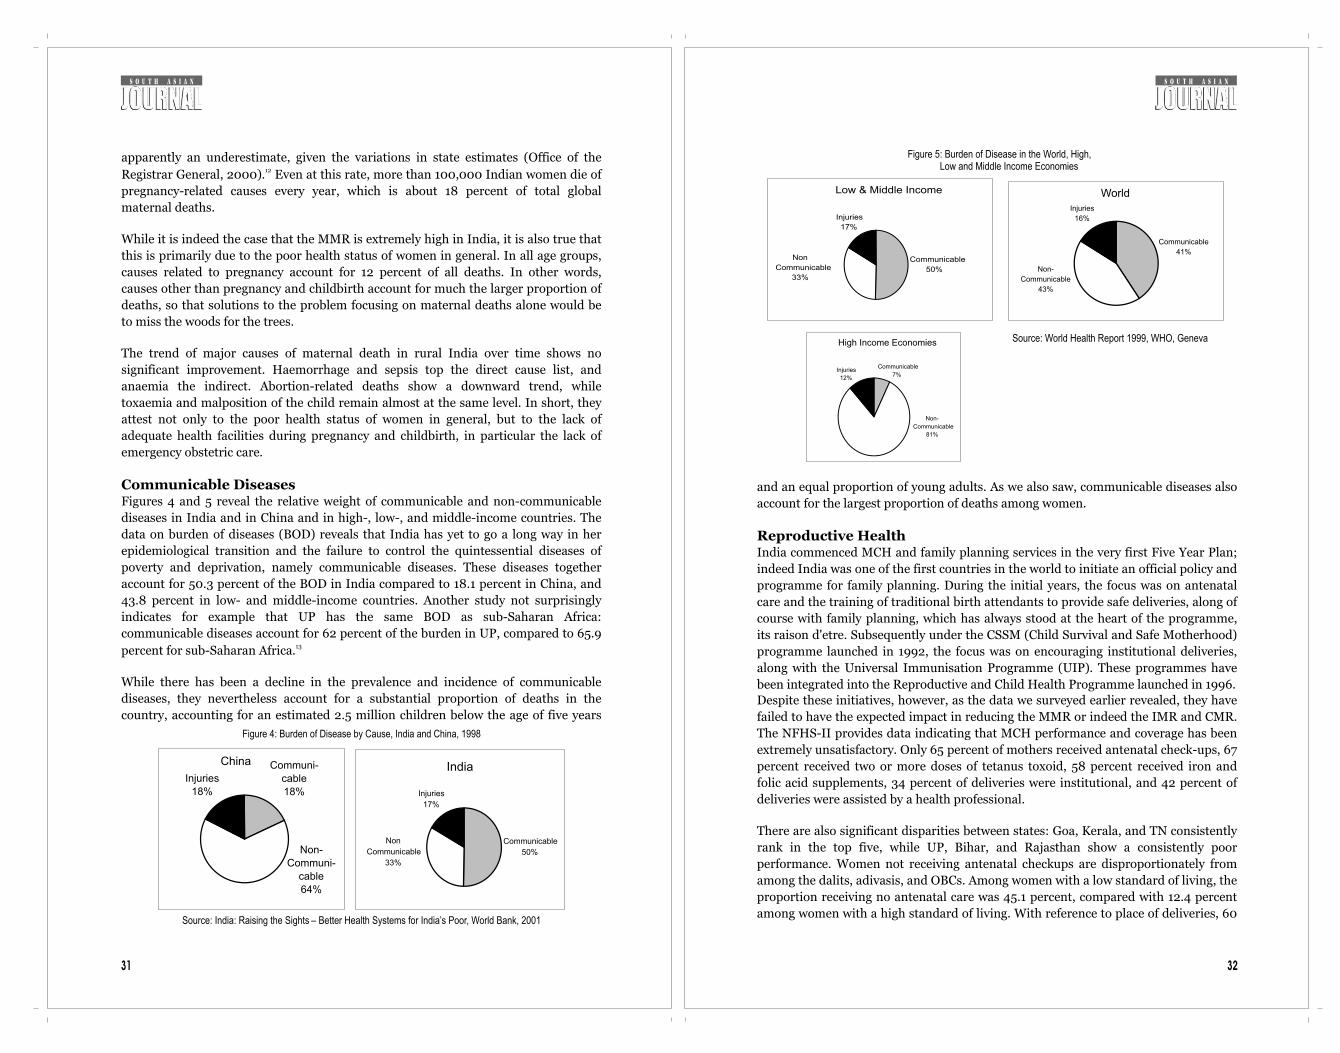
Communicable DiseasesFigures 4 and 5 reveal the relative weight of communicable and non-communicable
diseases in India and in China and in high-, low-, and middle-income countries. The
data on burden of diseases (BOD) reveals that India has yet to go a long way in her
epidemiological transition and the failure to control the quintessential diseases of
poverty and deprivation, namely communicable diseases. These diseases together
account for 50.3 percent of the BOD in India compared to 18.1 percent in China, and
43.8 percent in low- and middle-income countries. Another study not surprisingly
indicates for example that UP has the same BOD as sub-Saharan Africa:
communicable diseases account for 62 percent of the burden in UP, compared to 65.9 13percent for sub-Saharan Africa.
While there has been a decline in the prevalence and incidence of communicable
diseases, they nevertheless account for a substantial proportion of deaths in the
country, accounting for an estimated 2.5 million children below the age of five years
China
Non-
Communi-
cable
64%
Injuries
18%
Communi-
cable
18%
India
Injuries
17%
Non
Communicable
33%
Communicable
50%
Source: India: Raising the Sights – Better Health Systems for India’s Poor, World Bank, 2001
Figure 4: Burden of Disease by Cause, India and China, 1998

3433
percent of deliveries among the dalits and 70 percent among the adivasis took place at
home, while the figure for “Others” was 47 percent. 66 percent of women with a low
standard of living delivered at home, compared to 27.6 percent among women with a
high standard of living.
Similarly, according to the NFHS-II, vaccination coverage under the UIP left a lot to
be desired. In urban areas, 52 percent of children had received all immunisations by
12 months of age, while in rural areas only 29.3 percent had. Boys (43 percent) were
more likely to have received immunisation than girls (41 percent). Only 28 percent of
children of illiterate mothers were fully immunised, as compared to 73 percent of
children of mothers who had completed high school. Dalit children (40 percent),
adivasi children (26 percent), OBC children (43 percent) are less likely to be
immunised than others (47 percent). Only 30 percent of children from households
with a low standard of living were fully immunised as compared to 65 percent of
children from households with a high standard of living. Immunisation coverage
ranges from 11 percent in Bihar to 89 percent in TN. Among the major states, Bihar (11
percent), Rajasthan (17 percent), UP (21 percent), and MP (22 percent) had figures 14much below the national average of 42 percent (IIPS 2000). In urban areas, 72
percent of children were immunised by the public health services, 24 percent by the
private sector, and 1 percent by NGOs or charitable institutions, while in rural areas,
the public health system was responsible for 85 percent of immunisations, the private
sector for 9 percent, and the NGO sector for less than 1 percent.
Critics have argued that one reason for the failure of MCH programmes, indeed for a
host of other programmes, has been the focus on vertical programmes in general and 15family planning programmes in particular (Qadeer 1998). But as we see in Figure 6,
the TFR has declined over the years, along with a decrease in mortality, from 6.6 in
1960 to 3.2 in 1998. Here again, inter-state differentials are striking: the southern
states, Maharashtra, Gujarat and West Bengal show a fairly rapid decline in both
fertility and infant mortality; while the BIMARU states, accounting for over 40
percent of the country's population, have the highest maternal and child mortality as
well as fertility rates. Thus, while the TFR was 1.8 in Goa, 1.51 in Kerala, 2.07 in AP,
1.89 in Karnataka, and 2.11 in TN, it stood at 4.31 in UP, 4.06 in Rajasthan, 3.59 in
Bihar, and 3.3 in MP. In other words, as could be expected, states that are lagging
behind in epidemiological transition and have a weak healthcare delivery system, are
also those lagging behind significantly in demographic transition. It is nevertheless
significant that the fertility for the whole country has declined, between NFHS I and
II, by about half a child per women. Thus current policy initiatives, especially those
initiated by several states, focusing on a two-child norm to be encouraged through
punitive disincentives and targets and are not only in contravention of the NPP but 16also seriously misplaced (Rao 2002). Interestingly, the NFHS-II also reveals that the
fertility rate that is currently sought, 2.13, is lower by 0.72 child (that is, by 25 percent)
than the current TFR of 2.85. This is to say, if unwanted births could be reduced, the
TFR would drop to the replacement level of fertility. Indeed this is acknowledged in
the NPP, which therefore marks as its priority, meeting the unmet need for health and
family planning services.
What is also important to acknowledge is that, given the age structure of the
population, population growth will continue despite fall in the birth rate due to what
demographers call momentum, i.e., the effect of a young age structure caused by high
population growth rates in the recent past. With a large proportion of the population -
almost 60 percent - below the age of 30 years, further growth of population is
inevitable, unless of course mortality increases, which cannot be the aim of policy.
Population momentum contributes to as much as 69.7 percent of current population 17growth (Sen and Iyer 2002).
NutritionA fierce debate rages in the country on the levels of poverty. Without entering into the
debate, it is nevertheless the case that, even those arguing that there have been
substantial improvement in levels of poverty over the last decade, concede that close
to a third of the population still lives under the poverty line and is thus unable to meet
its calorie requirements. Data from the National Nutrition Monitoring Bureau
(NNMB) indicate that there has been an improvement in the prevalence of severe
under-nutrition in 1-5 year-old children, the level declining from 11.1 percent in 1992
to 6.9 percent in 1995. However, this compares to a prevalence rate of 6.2 percent in
1982. While this relatively modest improvement is heartening, the levels of moderate
under-nutrition remains substantially unchanged at 43.5 percent while mild under-
nutrition has increased from 36.6 percent in 1992 to 40.6 percent in 1995. Overall, the
proportion of children nutritionally normal has increased from 7.2 percent in 1992 to
8.5 percent in 1995. Again, this should be tempered with caution since the figure stood 18at 15.6 percent in 1982 (NNMB 1997). These data need to be placed in the context of
a dramatic decline in per capita availability of cereals commencing in 1991. Data
indicate that the per capita daily availability of cereals declined from 468.5 grams in
1991 to 428.8 grams in 1999; that of pulses declined from 41.1 grams to 38.6 grams 19(GOI 1999). Indeed the NNMB notes that the average calorie consumption in the
20population in 1995 was below the RDA (NNMB 1997).
Data from the NFHS II however indicate higher levels of hunger than the NNMB data;
they also pertain to the whole of India rather than just seven states, as is the case with
the NNMB data. The NFHS II reveals that almost half the children under three years
of age (47 percent) are underweight, and a similar proportion (46 percent) is stunted.
Figure 6:TFR, IMR & U5MR by Time Periods
Source: SRS of various years, Census, NFHS (Under-5 mortality for 1991 covers 1988-93).
165
129
110
8071 101
119
173
202
242
6.6
5.2
4.5
3.6
3.2
0
50
100
150
200
250
300
1960 1971 1981 1991 1998
0
1
2
3
4
5
6
7
IMR U-5MR TFR

36
availability of food: India now sits on a huge stock of food and indeed has, particularly
since the onset of reforms, commenced export of food grains. The high prevalence of
chronic hunger, in addition to acute hunger, is undoubtedly the cause of the
continuing high mortality and morbidity load in the country. This is doubly tragic
since it not only imposes suffering and diseases, it also represents a waste of the non-
realised potential among these population of the country. Yet although food is so
central to the health of the population, levels of hunger do not find mention in the
NHP. If they do find mention in health discourses, it is frequently only anaemia as a
cause of high maternal morbidity and mortality, and of high infant and child
mortality.
Given this epidemiological blindness, as it were, it is not entirely surprising that policy
initiatives are to place emphasis on the problems of obesity, and micro-nutrient
deficiencies; “a paradigm shift from food security to nutrition security” (GOI 242002:346). In another sleight of hand, there are moves to bring down the RDAs, and
thus achieve a remarkable decline in levels of poverty. Thus as India 'shines' for those
with problems of obesity, poverty is eliminated by governance and the poor through
family planning!
Health FinancesOne extremely important cause for the high morbidity and mortality rates in the
country, along of course with widespread hunger and poverty, is the remarkably low
public investment in health. As the NHP itself acknowledges, “public health
Table 3: Expenditure on Health and Family Welfare (in crore rupees)
Health (Centre and States)
Family Welfare Control of Communicable Diseases
Plan Period Amount Total Plan Investment (All Development Heads)
Outlay/Exp.
% of Total Plan
Outlay/Exp.
% of Total Plan
Outlay/Exp.
% of Total Health
First
51-56
Actual
1960
65.2
3.33
0.1
0.01
23.1
16.5
Second
56-61
Actual
4672
140.8
3.01
5
0.11
64
28.4
Third
61-66
Actual
8576.5
225.9
2.63
24.9
0.29
69
27.7
Annual
66-69
Actual
6625.4
140.2
2.12
70.4
1.06
23.1
10.2
Fourth
69-74
Actual
15778.8
335.5
2.13
278
1.76
127
11.1
Fifth
74-79
Actual
39426.2
760.8
1.93
491.8
1.25
268.12
11.5
79-80
Actual
12176.5
223.1
1.83
118.5
0.97
Sixth
80-85
Outlay
97500
1821
1.87
1010
1.04
524
27
Sixth
80-85
Actual
109291.7
2025.2
1.85
1387
1.27
Seventh
85-90
Outlay
180000
3392.9
1.88
3256.3
1.81
1012.7
7.7
Seventh
85-90
218729
3688.6
1.69
3120.8
1.43
90-91
Actual
61518
960.9
1.56
784.9
1.28
91-92
Actual
65855
1042.2
1.58
856.6
1.3
Eighth 92-97 Outlay 434100 7582.2 1.75 6500 1.5 1045
4.2
Ninth 97-02 Outlay 859200 5118.1 0.6 15120
Source: Government of India, Planning Commission (1997), Ninth Five Year Plan, 1997-2002, Vol. II, New Delhi.
35
18 percent of children below three years of age are severely undernourished, down
from 20 percent in the NFHS I. The proportion of children stunted stood at 23 21percent. Wasting, or acute under-nutrition, affects 16 percent of children under three
years of age. Under-nutrition is substantially higher in rural areas than in urban areas,
but even in urban areas, more than a third of children are either underweight or
stunted. Levels of under-nutrition are also substantially higher among dalits
(underweight 53.5 percent, severely underweight 21.2 percent; stunting 51.7 percent;
wasting 16 percent) and adivasis (underweight 55.9 percent, severely underweight 26
percent; stunting 52.8 percent; wasting 21.8 percent) Anaemia affects nearly three
quarters of children (74 percent), with 46 percent having moderate and 5 percent
having severe anaemia. Anaemia affects 78.3 percent of children among the dalits, 6.6
percent severely, and 79.8 percent among the adivasis, 6.9 percent severely. The
highest prevalence rates are found in Bihar, Rajasthan, and surprisingly, the
agriculturally advanced states of Haryana and Punjab. The proportion of children
weighing less than 2.5 kilograms at birth stood at 24 percent in rural areas and 21
percent in urban areas.
The NFHS II data also reveal a far from satisfactory nutritional status of women in the
country. Data reveals that more than a third (36 percent) of women in the country had 22a BMI of less than 18.5 indicative of chronic hunger or chronic energy deficiency. The
proportion of women who are poor, and thus more likely to be illiterate, with BMI less
than 18.5 is 42.6 percent. Among dalits, the proportion is 42.1 percent and among
adivasis, 46.3 percent. Women in households with a low standard of living index have
chronic hunger levels of 48.1 percent, compared to 17.3 among households with a high
standard of living. Prevalence rates of chronic hunger in rural areas (40.6 percent) are
almost double those in urban areas (22.6 percent). The prevalence of chronic energy
deficiency among women is also the highest in Rajasthan (39.3 percent), Orissa (48.0
percent), West Bengal (43.7 percent), UP (35.8 percent), Maharashtra (39.7 percent),
and Karnataka (38.8 percent), again cutting across the so-called governance divide.
The prevalence of anaemia is, not surprisingly, equally widespread; the overall
prevalence rate was 52 percent with 35 percent mildly anaemic, 15 percent moderately 23anaemic and 2 percent severely anaemic. Prevalence rates of anaemia are
considerably higher for rural women (54 percent) than among urban women (46
percent). The prevalence rates are 60.2 percent among women in households with a
low standard of living, and as high as 41.9 percent in those with a high standard of
living. Among the dalits the prevalence rates are 56 percent and among adivasis, 64.9
percent.
While there has been attention drawn to the poor health and nutritional status of
women, not enough attention has been paid to that of men. Indeed the NFHS has no
data on the prevalence of hunger among men. The NNMB however notes that 49
percent of adult males also suffered from chronic energy deficiency in 1990 (NNMB
1997).
In short, the nutritional data unambiguously reveals the continuing high prevalence of
hunger in the population. The issue is however complex, and goes beyond merely the
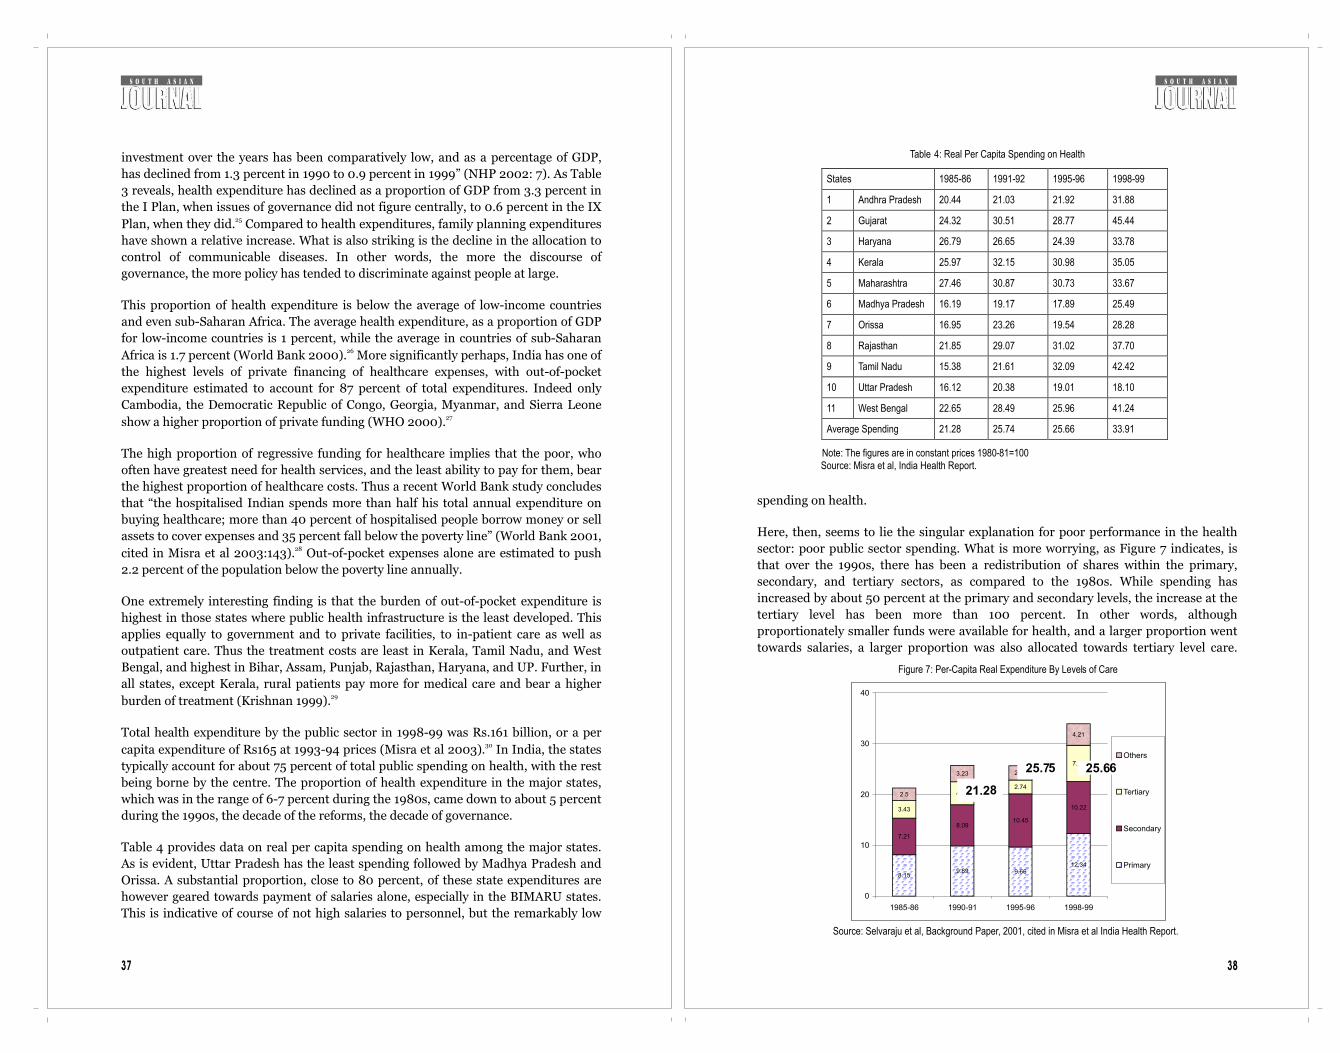
3837
investment over the years has been comparatively low, and as a percentage of GDP,
has declined from 1.3 percent in 1990 to 0.9 percent in 1999” (NHP 2002: 7). As Table
3 reveals, health expenditure has declined as a proportion of GDP from 3.3 percent in
the I Plan, when issues of governance did not figure centrally, to 0.6 percent in the IX 25Plan, when they did. Compared to health expenditures, family planning expenditures
have shown a relative increase. What is also striking is the decline in the allocation to
control of communicable diseases. In other words, the more the discourse of
governance, the more policy has tended to discriminate against people at large.
This proportion of health expenditure is below the average of low-income countries
and even sub-Saharan Africa. The average health expenditure, as a proportion of GDP
for low-income countries is 1 percent, while the average in countries of sub-Saharan 26Africa is 1.7 percent (World Bank 2000). More significantly perhaps, India has one of
the highest levels of private financing of healthcare expenses, with out-of-pocket
expenditure estimated to account for 87 percent of total expenditures. Indeed only
Cambodia, the Democratic Republic of Congo, Georgia, Myanmar, and Sierra Leone 27show a higher proportion of private funding (WHO 2000).
The high proportion of regressive funding for healthcare implies that the poor, who
often have greatest need for health services, and the least ability to pay for them, bear
the highest proportion of healthcare costs. Thus a recent World Bank study concludes
that “the hospitalised Indian spends more than half his total annual expenditure on
buying healthcare; more than 40 percent of hospitalised people borrow money or sell
assets to cover expenses and 35 percent fall below the poverty line” (World Bank 2001, 28cited in Misra et al 2003:143). Out-of-pocket expenses alone are estimated to push
2.2 percent of the population below the poverty line annually.
One extremely interesting finding is that the burden of out-of-pocket expenditure is
highest in those states where public health infrastructure is the least developed. This
applies equally to government and to private facilities, to in-patient care as well as
outpatient care. Thus the treatment costs are least in Kerala, Tamil Nadu, and West
Bengal, and highest in Bihar, Assam, Punjab, Rajasthan, Haryana, and UP. Further, in
all states, except Kerala, rural patients pay more for medical care and bear a higher 29burden of treatment (Krishnan 1999).
Total health expenditure by the public sector in 1998-99 was Rs.161 billion, or a per 30capita expenditure of Rs165 at 1993-94 prices (Misra et al 2003). In India, the states
typically account for about 75 percent of total public spending on health, with the rest
being borne by the centre. The proportion of health expenditure in the major states,
which was in the range of 6-7 percent during the 1980s, came down to about 5 percent
during the 1990s, the decade of the reforms, the decade of governance.
Table 4 provides data on real per capita spending on health among the major states.
As is evident, Uttar Pradesh has the least spending followed by Madhya Pradesh and
Orissa. A substantial proportion, close to 80 percent, of these state expenditures are
however geared towards payment of salaries alone, especially in the BIMARU states.
This is indicative of course of not high salaries to personnel, but the remarkably low
spending on health.
Here, then, seems to lie the singular explanation for poor performance in the health
sector: poor public sector spending. What is more worrying, as Figure 7 indicates, is
that over the 1990s, there has been a redistribution of shares within the primary,
secondary, and tertiary sectors, as compared to the 1980s. While spending has
increased by about 50 percent at the primary and secondary levels, the increase at the
tertiary level has been more than 100 percent. In other words, although
proportionately smaller funds were available for health, and a larger proportion went
towards salaries, a larger proportion was also allocated towards tertiary level care.
Table 4: Real Per Capita Spending on Health
States 1985-86 1991-92 1995-96 1998-99
1 Andhra Pradesh 20.44 21.03 21.92 31.88
2 Gujarat 24.32 30.51 28.77 45.44
3 Haryana 26.79 26.65 24.39 33.78
4 Kerala 25.97 32.15 30.98 35.05
5 Maharashtra 27.46 30.87 30.73 33.67
6 Madhya Pradesh 16.19 19.17 17.89 25.49
7 Orissa 16.95 23.26 19.54 28.28
8 Rajasthan 21.85 29.07 31.02 37.70
9 Tamil Nadu 15.38 21.61 32.09 42.42
10 Uttar Pradesh 16.12 20.38 19.01 18.10
11 West Bengal 22.65 28.49 25.96 41.24
Average Spending 21.28 25.74 25.66 33.91
Note: The figures are in constant prices 1980-81=100
Source: Misra et al, India Health Report.
Figure 7: Per-Capita Real Expenditure By Levels of Care
8.159.89 9.66
12.34
7.21
8.0910.45
10.223.43
4.532.74
7.15
2.5
3.23 2.81
4.21
0
10
20
30
40
1985-86 1990-91 1995-96 1998-99
Others
Tertiary
Secondary
Primary
Source: Selvaraju et al, Background Paper, 2001, cited in Misra et al India Health Report.
21.28
25.75
25.66

40
public sector hospitals and beds in the country.
The data clearly reveal that the share of private hospitals has increased remarkably
between 1974 and 1996, while that of beds has shown an increase although not as
significant as in the number of institutions. While there are exceptions, the majority of
these are small institutions, with 85 percent of them with less than 25 beds. Most such
institutions offer maternity and general services and are managed by doctor
entrepreneurs. Tertiary speciality and super-speciality private institutions comprise 36only 1-2 percent of the private sector institutions (GOI 2002).
The distribution of private sector facilities and doctors between states and regions is
even more inequitable than the public health facilities, reflecting the tendency to
concentrate in better-off states and better-off regions. As in the case of public services,
rural-urban differences are acute, with a clear urban bias as shown in Figure 8. Indeed
private hospitals are less urban-based than public ones at the all-India level. However,
what is to be remembered is that the bulk of medical care in rural areas, and a not-
insignificant amount in urban areas, is provided by unqualified medical practitioners,
estimated to be about one million. While the quality of medical care is said to be
dubious, this is not a characterisation that sticks to unqualified medical practitioners
alone.
The private sector today dominates the public in both in-patient (IP) care and out-
patient (OP) care. The reasons for this are many, and include the fact that medicines
are not available in the public services and indeed there are significant shortfalls of
human power; it is also due to the preoccupation of public health services with vertical
programmes in general and the family planning programme in particular. Data from
the National Sample Survey's 52nd Round reveal that 44 percent of respondents
preferred the private sector because the doctor was available, 36 percent because they
were dissatisfied with the quality of care in public facilities, and 7 percent because
Table 5: Growth and Share of Private Sector Hospitals and Beds
Year Hospitals Hospital Beds
Public Private Total Public Private Total
1974 2832
(81.4)
644
(18.6)
3176
(100)
211335
(78.5)
57550
(21.5)
268885
(100)
1979 3735
(64.7)
2031
(35.3)
5766
(100)
331233
(74.2)
115372
(25.8)
446605
(100)
1984 3925
(54.6)
3256
(45.4)
7181
(100)
362966
(72.5)
137662
(27.5)
500628
(100)
1988 4334
(44.1)
5497
(55.9)
9831
(100)
410772
(70.1)
175117
(29.9)
585889
(100)
1996 4808
(31.9)
10289
(68.1)
15097
(100)
395664
(63.4)
228155
(36.6)
623819
(100)
Figures in brackets denote percentage share.
Source: Health Information of India, CBHI, GOI, various years,
Directory of Hospitals in India, CBHI, DGHS, GOI, various years.
39
These are of course a result of political decisions made over this period, which was
accompanied by a squeeze on finances. This is a consequence of reforms of the health
sector, when issues of governance came to the fore. As in many other countries, then,
reforms were slated to increase health inequalities, and were not fortuitous outcomes
of the policy process. Again, these decisions were in line with policy prescriptions
emerging out of the World Bank and institutions owing allegiance to it. The squeeze
on resources for primary healthcare is the single most important factor for the dismal
state of primary healthcare services in the country. This is not to deny that tertiary
healthcare needed substantial strengthening, but draws attention to the fact that this
has occurred at the cost of lower levels of healthcare.
It is often argued that one reason that the government has introduced expenditure
cuts is that there is a squeeze on government finances. What is not highlighted is that,
over the 1990s, the government was either less willing or unwilling to collect taxes
even at levels that existed before the onset of reforms. Thus, the tax-GDP ratio has
declined from more than 13 percent in 1990-91 to 9 percent in 2000-2001. This of
course implies that regressive indirect taxes as a proportion of revenue has increased,
taxes paid for largely by the poor. But just the reduction in direct taxes represents
uncollected revenues of 4 percent of GDP, which is almost three times the entire
expenditure on public health, medicine, and family welfare by the central and state
governments combined. At the same time, India substantially subsidises healthcare in
the First World through transfer of skilled human power, trained at public expense, at 31an estimated cost of 160 million US dollars every year (VHAI 1997).
Private Sector HealthcareAny generalisation about the private sector in the country would be hazardous, if not
foolish, since it comprises a large and heterogeneous group of actors and institutions,
and indeed among (in that phrase now so popular among governance-wallahs) 32stakeholders. On the one hand, are state-of-the-art, super-speciality corporate
hospitals in urban areas that even the middle classes find difficult to access, and which
are to form the hub of the health tourism industry that the Government now plans to
promote. On the other hand, are the vast numbers of ill-qualified individual
practitioners who provide the bulk of curative care in the country, primary-level care
in particular. Between the two, is a range of not-for profit NGOs, trusts, charitable,
and religious institutions providing medical and healthcare. A growing concern is that
some of these have recently changed character and ought to classified as for-profit 33institutions (Misra et al). At the same time, a number of high-tech, for-profit
hospitals are registered as trusts and research centres to avail tax concessions.
As the Tenth Plan document notes, there is no uniform, nationwide system of
registering either practitioners or institutions in the private sector. Nor is there any 34system for obtaining and analysing information about this large sector (GOI 2002).
Studies on the private sector in India are thus plagued by unavailability of data, with
the sector unwilling, by and large, to share data with even academic investigators.
Based on admittedly unreliable available data, one study estimates that 93 percent of
hospitals and 64 percent of hospital beds in India are in the private sector (Nandraj 352000). Table 5 indicates government data on the growth and share of private and
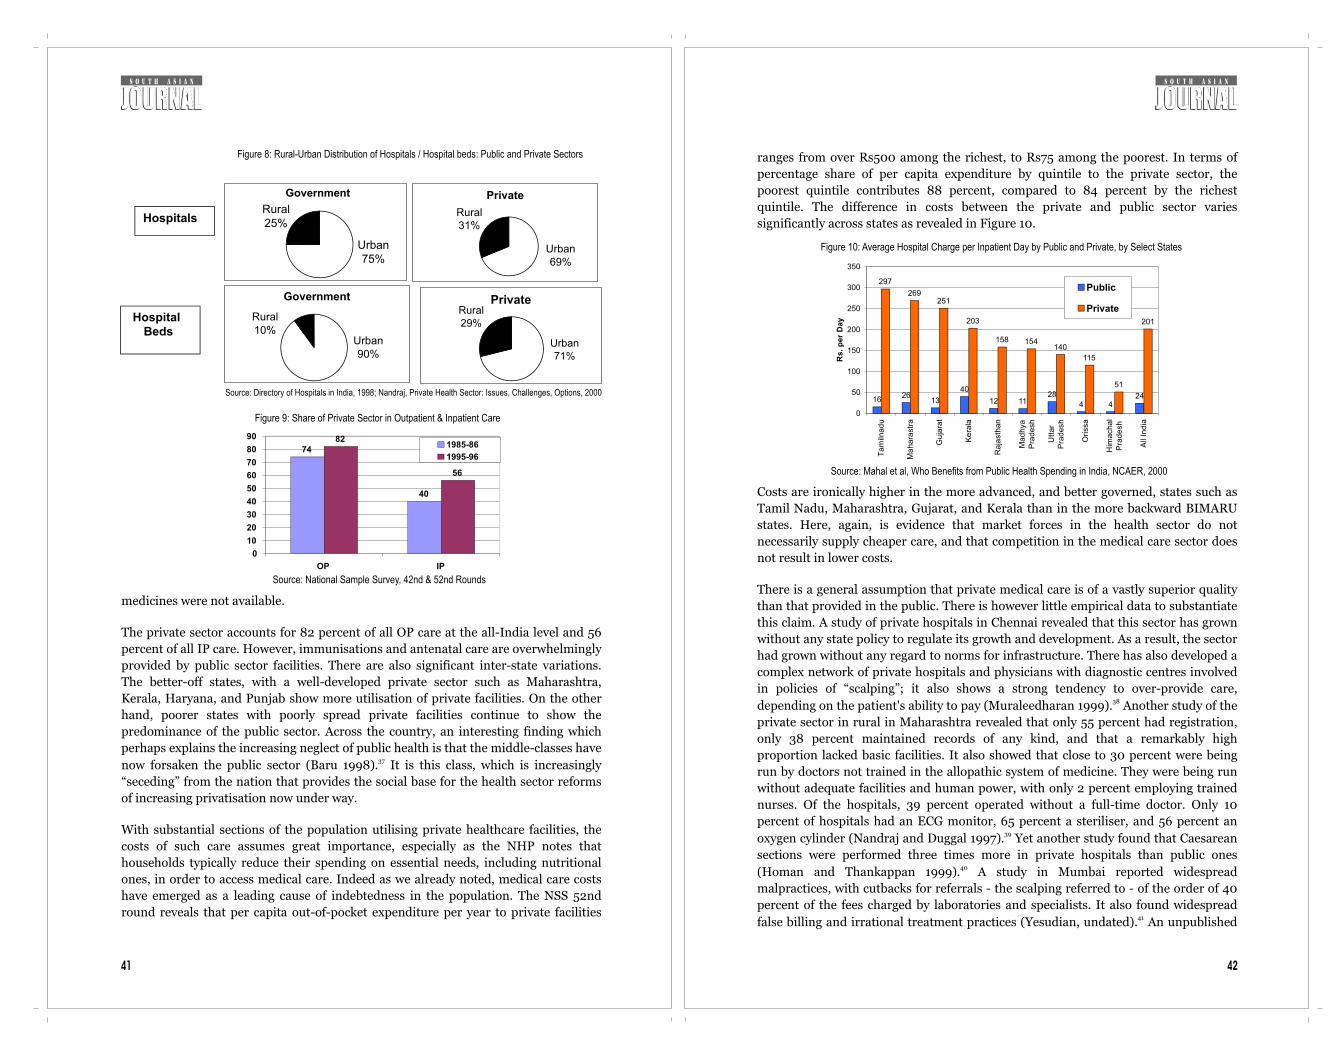
4241
medicines were not available.
The private sector accounts for 82 percent of all OP care at the all-India level and 56
percent of all IP care. However, immunisations and antenatal care are overwhelmingly
provided by public sector facilities. There are also significant inter-state variations.
The better-off states, with a well-developed private sector such as Maharashtra,
Kerala, Haryana, and Punjab show more utilisation of private facilities. On the other
hand, poorer states with poorly spread private facilities continue to show the
predominance of the public sector. Across the country, an interesting finding which
perhaps explains the increasing neglect of public health is that the middle-classes have 37now forsaken the public sector (Baru 1998). It is this class, which is increasingly
“seceding” from the nation that provides the social base for the health sector reforms
of increasing privatisation now under way.
With substantial sections of the population utilising private healthcare facilities, the
costs of such care assumes great importance, especially as the NHP notes that
households typically reduce their spending on essential needs, including nutritional
ones, in order to access medical care. Indeed as we already noted, medical care costs
have emerged as a leading cause of indebtedness in the population. The NSS 52nd
round reveals that per capita out-of-pocket expenditure per year to private facilities
ranges from over Rs500 among the richest, to Rs75 among the poorest. In terms of
percentage share of per capita expenditure by quintile to the private sector, the
poorest quintile contributes 88 percent, compared to 84 percent by the richest
quintile. The difference in costs between the private and public sector varies
significantly across states as revealed in Figure 10.
Costs are ironically higher in the more advanced, and better governed, states such as
Tamil Nadu, Maharashtra, Gujarat, and Kerala than in the more backward BIMARU
states. Here, again, is evidence that market forces in the health sector do not
necessarily supply cheaper care, and that competition in the medical care sector does
not result in lower costs.
There is a general assumption that private medical care is of a vastly superior quality
than that provided in the public. There is however little empirical data to substantiate
this claim. A study of private hospitals in Chennai revealed that this sector has grown
without any state policy to regulate its growth and development. As a result, the sector
had grown without any regard to norms for infrastructure. There has also developed a
complex network of private hospitals and physicians with diagnostic centres involved
in policies of “scalping”; it also shows a strong tendency to over-provide care, 38depending on the patient's ability to pay (Muraleedharan 1999). Another study of the
private sector in rural in Maharashtra revealed that only 55 percent had registration,
only 38 percent maintained records of any kind, and that a remarkably high
proportion lacked basic facilities. It also showed that close to 30 percent were being
run by doctors not trained in the allopathic system of medicine. They were being run
without adequate facilities and human power, with only 2 percent employing trained
nurses. Of the hospitals, 39 percent operated without a full-time doctor. Only 10
percent of hospitals had an ECG monitor, 65 percent a steriliser, and 56 percent an 39oxygen cylinder (Nandraj and Duggal 1997). Yet another study found that Caesarean
sections were performed three times more in private hospitals than public ones 40(Homan and Thankappan 1999). A study in Mumbai reported widespread
malpractices, with cutbacks for referrals - the scalping referred to - of the order of 40
percent of the fees charged by laboratories and specialists. It also found widespread 41false billing and irrational treatment practices (Yesudian, undated). An unpublished
Figure 8: Rural-Urban Distribution of Hospitals / Hospital beds: Public and Private Sectors
Source: Directory of Hospitals in India, 1998; Nandraj, Private Health Sector: Issues, Challenges, Options, 2000
Government
Rural25%
Urban75%
Private
Rural31%
Urban69%
Government
Rural10%
Urban90%
PrivateRural29%
Urban71%
Hospitals
Hospital Beds
Figure 9: Share of Private Sector in Outpatient & Inpatient Care
74
40
82
56
0
10
20
30
40
50
60
70
80
90
OP IP
1985-86
1995-96
Source: National Sample Survey, 42nd & 52nd Rounds
Figure 10: Average Hospital Charge per Inpatient Day by Public and Private, by Select States
Source: Mahal et al, Who Benefits from Public Health Spending in India, NCAER, 2000
1626
13
40
12 1128
4 424
297
269251
203
158 154140
115
51
201
0
50
100
150
200
250
300
350
Tam
ilnad
u
Ma
hara
str
a
Gu
jara
t
Ke
rala
Raja
sth
an
Mad
hya
Pra
desh
Utt
ar
Pra
desh
Ori
ssa
Him
achal
Pra
de
sh
All
India
Rs.
per
Day
Public
Private

44
people spend substantially on healthcare largely provided by unqualified persons in 46the private sector where services were even worse (Banerjee et al 2004). Yet over the
1990s, as India embarked upon its structural adjustment programme, state spending
on health declined. The decline in public investments was matched with growing 47subsidies to the private sector in healthcare in a variety of ways (Baru 1998). What is
interesting is that while wide-ranging reforms in the health sector were initiated, the
NHP itself makes no reference to this important policy change.
In essence, the reforms intend to reduce the role of the state in financing and
provision, while confining its role to that of regulation. The efforts underway in India
could thus be seen as part of much larger processes shaping the health sector globally;
in developing countries at the insistence of international financial institutions. Given
the desperate poverty of large sections of the population, the widespread prevalence of
hunger, the huge morbidity and mortality loads, and the abysmal role of the state in
health sector provision in the country, the direction of such reforms as carried out in
other countries, further curtail healthcare access to the poor.
While the consequences of reforms in Latin America and Africa are well known, that
of China is equally apposite. Reforms in China, for example, have meant an annual
real increase in GNP by 9 percent, quadrupling the size of the economy in merely 20
years. Yet this has been accompanied by increasing income inequalities between
regions and in sharpening health inequalities. In 1994, the prosperous coastal
province of Zhejiang had an MMR of 23.74 per 100,000 live births while the poorer
inland province of Quinhai had a figure of 215.37. Further, within provinces, rural-
urban differences in wealth and well- being have sharpened: the IMR is higher in rural
areas than in the urban, with a widening of the gap. A recent study of 30 of China's
poorest counties found that the IMR actually increased from 50 per 1,000 live births
in the late 1970s to 72 per 1,000 in the late 1980s, despite the relatively egalitarian
base at which the reforms commenced. Surveys in 1987 and 1992 revealed that the
proportion of stunted children in rural areas had increased. Data on growth of Chinese
children also indicate increasing disparities in height between rural and urban areas.
Despite the Chinese government's commitment to gender equity, the reforms have led
to an increase in gender differentials in child survival along with increased morbidity
rates among females. The economic changes, along with the “one child per family”
norm, since officially abandoned, has accentuated the problem of “missing girls”.
Poignantly, as in countries like India, medical expenditure is emerging as a leading
cause of the impoverishment of families as the health system collapsed. Efforts at 48decentralisation have merely sharpened the differentials (Liu et al 2001).
Health sector reforms in India have taken a variety of forms aimed at improving
efficiency and effectiveness and the quality of care provided by public health services.
Some of these include contracting, public-private partnerships, user fees, and
privatisation of public facilities.
Contracting has emerged as an important new mechanism for improving the efficiency
of services in the public health sector. Some or all aspects of health facilities and
functions could be contracted out to private parties, including clinical, para-clinical
43
study of pathology laboratories in Agra city founds costs extremely high, placing them
out of reach of the poor. Yet the services provided were not up to standards, although 42they had increasing patient referrals over the years (Singh 1993).
A study of prescription practices in Satara district found a high proportion of
irrational prescriptions among doctors in both the public and private sectors.
Although doctors with postgraduate degrees tended to use a higher proportion of
rational drugs, they also tend to prescribe more drugs than necessary. Public sector
prescriptions were more rational than private sector prescriptions. Indeed irrational
prescriptions in the private sector were more than double that in the private (Phadke 43et al 1995).
One undoubted contribution of the private sector, especially during the period of
reforms, has been the sharp masculinisation of the SRB, as we saw earlier. This is of
course a gift to the upwardly mobile classes, eliminating daughters before birth. For
example, between January and June this year, in Delhi the SRB indicates 819 females
being born for every 1,000 males; in the prosperous and educated South Delhi zone,
where demographic transition has by and large been completed, only 762 females
were born for every 1,000 males. This well off and educated population was thus
achieving population stabilisation, at the cost of population balance.
Perhaps the most telling comment on the private sector was during the plague
epidemic in Surat of 1994. The epidemic itself is partly attributed to the decay of the
public health system, including the slashing of budgets for the control of 44communicable diseases (Qadeer et al 1994). But once the epidemic commenced, it
was observed that the majority of private practitioners fled the city, while the
government doctors tried, with hands tied by lack of medicines and funds, to fight the 45 epidemic (Shah 1997).
Thus, issues of quality of care that plague the public sector are not unique to it. Indeed
the private sector provides the lead and sets norms for a culture of medicalisation that
the public sector is often forced to emulate. Yet without taking many of the systemic
factors that ail the public sector into account, efforts at reforms in the health sector are
all too often facile and simplistic and involve increasing public subsidies to the private
sector. While the private sector has thus grown, its quality, outcomes, and cost have
not been issues coming under a strong regulatory mechanism.
Citing inefficiencies of the public system, and financial stringency, India commenced
health sector reforms. What was not clearly articulated that these moves were initiated
at the behest of international financial institutions to which we were indebted. The
mantra was of course efficiency and governance. The following section briefly surveys,
on the basis of not very substantial evidence, what India's experience had been.
Health Sector ReformsThe data reviewed on the health scenario and of the health system in India
unfortunately project a none-too-happy picture. A small recent study, widely quoted,
for example, reveals the dismal state of public health services, even as it indicates that
4645
and non-clinical functions. The rationale for contracting was that it reduced costs,
introduced greater flexibility in the use of labour, or could be utilised to provide
services in areas that were under-served.
In India, contracting has been initiated under the blindness programme, the AIDS
control programme, and franchising arrangements have been set up with private 49providers under the RNTCP (Nandraj et al 2001). Many non-clinical support services
in public hospitals have also been contracted out. It has been suggested that NGOs be 50contracted to provide primary health services in rural areas (World Bank 1995).
The experience of contracting services in other countries has been mixed. In India
itself, given the systemic and wide-ranging nature of problems facing the health
sector, it is not likely to prove a solution to these myriad problems. It is also necessary
to review systematically the experience so far before extending it to other areas.
There is not enough documentation on the transfer of public health facilities to private
providers on a contract basis. One recent case involves the transfer of ownership of a
public tertiary care hospital in Mumbai as part of a state health system project funded 51by the World Bank (Nandraj et al 2001). The municipal corporation of Mumbai has
taken a policy decision to hand over many of its peripheral hospitals to the private
sector. In a controversial move, a peripheral hospital was also handed over to a private
medical college that did not have the necessary clinical facilities; the Medical Council
of India had not recognised the concerned medical college. Other cities, such as
Ahmedabad, have handed over facilities to NGOs. While it is indeed the case that
some NGOs have provided excellent services and have served as models of primary
healthcare, this cannot be generalised.
There are a number of other concerns that also need to be addressed. NGOs comprise
a broad and heterogeneous category in terms of ideology, activities, funding, outreach,
and effectiveness. Generalisations about their effectiveness, efficacy, and efficiency are
made out of ideological concerns, not necessarily out of concerns for public health.
Further, there is little empirical data to substantiate claims to justify greater public
support to NGOs on various grounds. They are not necessarily demonstrably either
more effective or efficient than any public-funded institution and cannot be used as a
substitute for a variety of reasons. First, NGOs, by definition, are discretionary and not
mandatory. Thus, they can be socially exclusive, and indeed the fear that NGO-isation
may be against the interests of dalits has been frequently voiced by dalit activists and 52scholars (Thorat: 2001). Second, they are not necessarily accountable, certainly not
to the people they work with. Third, the issue of monitoring and regulation of the
private and NGO sectors is an urgent and vexed question, but we have only to
remember that the scandal of quinacrine sterilisations in the country was largely 53carried out by NGOs (Rao 2001). Fourth, it is a well-worked out myth that NGOs are
somehow more “representative” than political bodies. Thus, the whole “space” for
“civil society organisations” in policymaking bodies that rigorously include NGOs but
exclude other civil society organisations like trade unions is problematic. Finally, it is
also not true that NGOs are internally more democratic: we have only to remember
that the RSS and the VHP, the largest network of foreign funded CSOs in the country
are deeply hierarchical, non-representative, anti-democratic, and indeed fascistic. It is
to be borne in mind that typically NGOs are small and often scattered; they are neither
universally available nor accessible. Baru has shown on the basis of available data that
NGOs providing health services are typically located in the better-off states and in 54better-off areas among them (Baru 1999). Similarly, Visaria has noted that in both
Rajasthan and Madhya Pradesh, NGOs involved in health and development activities 55are located in only a few developed districts (Visaria 2002). The same point has also
56been noted for the state of Maharashtra (Duggal et al 1986).
It is still too early to assess the benefits and pitfalls of these experiments but they need
to be examined for the benefits, if any, they bring to the poor. It could be argued that
this transfer of public resources to private sources represents further strengthening of
a private healthcare system that has shown itself to be exploitative and not sensitive to
wider social concerns. This does not then represent moves to improve the
administrative and managerial efficiency of the public health system as a whole, but
instead a simplistic response to a complex problem.
Yet another scheme has been the provision of a range of incentives to the private
health sector through provision of land at throwaway prices, grant of customs duty
exemptions for import of sophisticated medical technology, and loans from financial
institutions at low interest rates. These incentives have been provided for both private
for-profit and not-for-profit institutions. A study indicated that these had been utilised
primarily by urban-based institutions that had not always provided free services to the
poor as they were expected to as per the terms of the contractual agreement (Bhat 571998). Further, there were no mechanisms to monitor the project, with the
government's limited institutional ability to do so. A committee has been set up by the
Government to examine the violations by private hospitals of the terms of their
agreements.
Such arrangements have also led to the burgeoning of high-technology diagnostic
centres in urban areas, with excess capacities. Between 1984 and 1986, over 60
diagnostic centres entered the market with an investment of Rs20000 million 58(Nandraj et al 2001). Thus Mumbai has 13 body scanners, Delhi 11, Chennai eight,
59Kolkata three, Pune three and Hyderabad two (Jesani and Anantharam 1993). In
such a situation, not warranted by public health considerations, there has occurred the
irrational use and overuse of such technologies. The oversupply of doctors in the
private sector has also led to unnecessary or over-medication of healthy people 60 (Nandraj 1994).
Yet another reform measure has been the levying of user charges as an alternative
source of health financing. Although the experience of other countries from Latin
America and Africa indicated that user charges had neither generated adequate
resources as to justify it, nor led to an increase in efficiency and effectiveness, and
indeed had proved to exclude the poor and most needy, several states in the country
have attempted, with varying success, to implement the scheme. These moves have
met with varying degrees of opposition in the country, but were implemented over the
1990s in states such as Andhra Pradesh, Maharashtra, West Bengal, Madhya Pradesh,

48
Figure 11: Proportion of Patients Who Borrowed for Hospitalisation Across States
0 10 20 30 40 50 60 70 80
North East
Andhra Pradesh
Tamil Nadu
Karnataka
Bihar
Kerala
Maharashtra
All India
Haryana
Uttar Pradesh
West Bengal
Gujarat
Madhya Pradesh
Rajasthan
Public Private
0 10 20 30 40 50 60 70 80
North East
Andhra Pradesh
Tamil Nadu
Karnataka
Bihar
Kerala
Maharashtra
All India
Haryana
Uttar Pradesh
West Bengal
Gujarat
Madhya Pradesh
Rajasthan
Public Private
Figure 12: Proportion of In-Patients below the Poverty Line that Borrowed or Sold
Assets for Public and Private Hospitalisations, by State 1995-96
47
Orissa, and Uttar Pradesh. Given the weak infrastructure in most public institutions
and their poor outreach, user fees tend also to push more people to the private health
sector. In India, the average across states for cost recovery through user fees was as
low as 3.8 percent.
The Tenth Plan document notes that an appropriate institutional framework for
reviewing user charges has not yet been established and that the level of cost recovery 61has been minimal (GOI 2002). Further, it also notes that mechanisms for identifying
and exempting the poor were ill defined.
Reviewing the cluster of projects that could be termed public-private partnership in
healthcare, the Tenth Plan notes that many of the efforts have not been successful.
Thus contractual appointment of healthcare staff and hiring of private practitioners
has not been able to fill the gaps in infrastructure, nor has it been able to fill posts in 62under-served areas (GOI 2002). It also notes that many of the project initiatives have
not been evaluated, and that institutional mechanisms to monitor and implement
these projects have yet to be evolved.
Further, over the 1990s, studies have documented a sharp increase in medical care
costs. There have been far reaching changes in drug policies. Thus India - earlier
characterised by relatively low costs of drugs and pharmaceuticals, along with a
significant indigenous production of drugs - has witnessed a greater concentration of
drug production, a larger role for multinationals, a higher proportion of imported 63drugs, and unbelievably steep rises in the costs of drugs (Sengupta 1996).
Concurrently, marked shifts have occurred in healthcare utilisation. Among people
who sought out-patient services in 1995-96, more than 80 percent did so in the private 64sector, a sharp increase in even the poorer states of the country (Sen et al 2002). In
1995-96, 55 percent and 57 percent in rural and urban areas, respectively, were
hospitalised in the private sector compared to 40 percent in 1986-87. NSS data
indicate greater inequality in use of health facilities by economic class gradients. In
rural areas, the class gradient in in-patient use of public hospitals - which was
insignificant in the mid-1980s - became statistically significant in the mid-1990s. In
urban areas, inequality in use of public facilities did not worsen significantly, but
inequality in use of private facilities did. The steep fall in rural hospitalisation rates,
along with increasing use by the better off indicates that the poor are being squeezed
out. Fee-for-services is undoubtedly one important mechanism that has succeeded in
doing this.
Costs of both OP and IP care increased sharply in both rural and urban areas,
compared to the mid-1980s. Private OP costs increased by 142 percent as against 77
percent in the public sector in rural areas. In urban areas, private OP costs increased
by 150 percent compared to 124 percent in the public sector. The increase in costs in
IP care is even more striking: average costs rose by 436 percent in rural and 320 65percent in urban areas (Sen et al 2002). Thus as Figure 11 reveals, a substantial
proportion of patients borrowed money in order to meet their healthcare costs. Figure
12 provides data on IPs below the poverty line who borrowed money or sold assets for
hospitalisation in both the public and private healthcare systems.
5049
Ironically, the better off states, such as Andhra Pradesh, Tamil Nadu, and Karnataka -
states with a thick spread of private facilities - revealed more poor people borrowing
money to pay for IP care. As is evident, the share of borrowing money is greater in the
private sector than the public. In states such as Rajasthan, Madhya Pradesh, and Uttar
Pradesh - given the thin spread of private care, the poor are borrowing money even to
access the public health system for IP care. Clearly, this cannot be allowed to continue
on grounds of equity, if not for epidemiological considerations.
Any effort to improve public health in the country must not only emphasise the
important determinants of health but also the salient role of public spending. The
reforms however singularly lack a health system perspective and instead comprise an
agglomeration of projects with an implicit belief that the market will cure the
problems that ail the health system.
Some IssuesIt is often assumed that India is characterised by widespread state presence in all
sectors of the economy and polity. In the case of the health sector, this, as we have
seen, is simply not the case. Along with a weak state sector, an unregulated and
powerful private healthcare sector raises several issues of universal care, of
comprehensive care, and above all, of equity. Failing this, efforts at tinkering through
projects, as we have seen, carries the risk of consolidating the dual healthcare system
that the country now possesses: one weak and under-funded for the vast majority of
the population with no access to primary healthcare, and the other largely urban-
based curative high technology healthcare for a minority of the population whose
public health needs are taken care of. Larger macroeconomic changes that have
increased regional, rural-urban, and class inequalities have compounded the problem.
It is thus not surprising to note that despite the fact that economic growth over the
1990s has been described as 'shining', India's position on the HDI globally, already
low to begin with, has fallen further from 127 to 132.
India of course was never a welfare state in the European tradition. Nevertheless,
there was a policy commitment to provide universal, comprehensive, and free
healthcare, going back to the Bhore Committee report of 1943, which affirmed the
principle of access to healthcare “irrespective of the ability to pay for it”. This was seen
both as a citizen's right in itself and in the interests of the welfare of the nation. Since
the onset of reforms, however, this policy commitment has disappeared from the
public agenda.
Healthcare reforms in India have to be located within the context of the “trans-66national healthcare reform movement” (Twaddle 2002: 341) commencing in the
1980s and enveloping the entire world in the 1990s under the aegis of international
financial institutions. The impetus supposedly came from rising healthcare costs in
the developed and developing world. More significantly, the impetus arose from the
rise of a global neo-liberal agenda, with the collapse of the Berlin war as much as the
overthrow of the Keynesian ideas on the role of the state - in demand management,
the creation of effective demand on a mass scale that was to see the world through its
post-war golden age of capitalism. The profound new ordering of the world also saw a
new direction to health policy: reducing the role of the state and increasing that of the
private sector. Central to this was the ideology of introducing market principles into
hitherto sacrosanct areas of public good, converting healthcare into a market-driven,
profit-driven enterprise.
In its influential 1987 document, “Financing Health Services in Developing Countries:
An Agenda for Reform”, the World Bank stated, “the approach to healthcare in
developing countries has been to has been to treat it a right of citizenry and to attempt
to provide free services for everyone. This approach does not work” (cited in 67Gershman and Irwin 2000:30). The role of the state, then, was to be confined to
regulation - and hence the salience of the phrase governance - while the private sector
was to be encouraged, often through state subsidy, to take on the role of provisioning
of health services, with the exception of a minimum clinical package, that ironically
included family planning. Over this period, of course, the role of the World Bank in
health sector development had increased enormously, while that of the WHO had
shrivelled; indeed World Bank loans for one programme, malaria, exceeds the entire 68budget of the WHO (Rao and Lowenson 2000). The Bank is today “the largest single
source of healthcare finance in developing countries with an unparalleled degree of 69policy-making authority” (Kim et al 2000:143). At the same time, the health sector
itself emerged as a leading source of multinational profits as the health sector in
developing countries was prised open for investment in a range of areas from high-
level technologies to insurance.
The social base for these changes within India was provided by a large middle class,
who, having benefited in the post-Independence period from state-led import
substituting growth, were now anxious to secede from the country, gather the fruits of
international integration, even on neo-colonial terms. Equally, they were anxious, in
post-Mandal times, to do away with state intervention itself, not least for those who
had not benefited from it in the past.
That the public health system in India is dysfunctional or inefficient is not the
question; the question is, did we ever seek to create a public system that was different
- our budgetary allocations do not seem to indicate that. Yet these very features of the
public health system - created by public policy - have been utilised in the age of
globalised governance to further weaken the public health sector, introducing
incommensurable principles of the market into it, for the private sector to squeeze out
further profits.
Dr Mohan Rao is an academic at the Centre of Social Medicine and Community
Health, Jawaharlal Nehru University, India.
Endnotes1 Government of India, Ministry of Health and Family Welfare (2002), Health Information
of India 1999, New Delhi.2 Acharya, Alka, Baru, Rama V. and Nambissan, Geetha B (2000), “The State and Human
Development: Health and Education” in G.P.Deshpande and Alka Acharya (Eds.), Fifty
Years of Crossing a Bridge of Dreams: India and China, Tulika, New Delhi.3 GOI, Ministry of Health and Family Welfare (1983), National Health Policy, New Delhi.
52
34 GOI, Planning Commission (2002), op cit.35 Nandraj, S. (2000), The Private Health Sector: Concerns, Challenges and Options, Cehat,
Mumbai.36 GOI (2002), op cit.37 Baru, R.V. (1998) Private Healthcare in India: Social Characteristics and Trends, Sage, New
Delhi.38 Muraleedharan, V.R. (1999), “Characteristics and Structure of Private Hospital Structure in
Urban India: A Study of Madras City”, Small Applied Area Research Paper 5, Bethesda,
Washington D.C.39 Nandraj, S. and Duggal, R (1997), Physical Standards in the Private Health Sector A Case
Study of Rural Maharashtra, Cehat, Mumbai.40 Homan, R.K. and Thankappan. K.R. (1999), “An Examination of Public and Private Sector
Sources of In-patient Care in Trivandrm District, Kerala”, Achuta Menon Centre for Health
Services, Thiruvananthapuram.41 Yesudian, C.A.K. (undated), “Behaviour of the Private Sector in the Health Services Market
of Mumbai”, Tata Institute of Social Sciences, Mumbai.42 Singh, T.V (1993), “A Study of the State of Medicare Facilities in Agra City (With Special
Reference to Pathology Labs), Unpublished MSW Report, Agra University.43 Phadke, Anant et al (1995), A Study of Supply and Use of Pharmaceuticals in Satara
District, FRCH, Pune.44 Qadeer, Imrana et al (1994), “Contextualising Plague: A Reconstruction and an Analysis”,
Economic and Political Weekly, Vol.XXIX, No.47.45 Shah, Ghanshyam (1997), Public Health and Urban Development: The Plague in Surat,
Sage, New Delhi.46 Banerjee A. et al (2004), “Healthcare Delivery in Rural Rajasthan”, Economic and Political
Weekly, Vol. XXXIX, No.9.47 Baru, Rama (1998), Private Health in India: Social Chracteristics and Trends, Sage, New
Delhi.48 Yuanli Liu et al (2001), “China: Increasing Health Gaps in a Transitional Economy” in
Timothy Evans et al (Eds), Challenging Inequalities in Health: From Ethics to Action,
Oxford University Press, New York.49 Nandraj, S. et al (2001), Private Health Sector in India: Review and Annotated
Bibliography, Cehat, Mumbai.50 World Bank (1995), “India: Policy and Finance Strategies for Strengthening Primary
Healthcare Services”, Report No.13042-IN, Population and Human Resource Division,
Washington DC.51 Nandraj, S et al, op cit.52 Thorat, Sukhdeo (2001), “Strategy of Disincentives and targeting for Population Control:
Implications for Dalits and Tribals”, paper presented at the National Colloquium on
Population Policies, Center of Social Medicine and Community Health and the Singamma
Sreenivasan Foundation, New Delhi. 53 Rao, Mohan (2001), “The Rhetoric of Reproductive Rights: Quinacrine Sterilisation in
India” in Qadeer et al (ed), Public Health and the Poverty of Reforms, Sage, New Delhi.54 Baru, Rama (1999), “The Structure and Utilisation of Health Services: An Inter-State
Analysis” in Rao, Mohan (ed), Disinvesting in Health: The World Bank's Prescriptions for
Health, Sage, New Delhi.55 Visaria, Pravin (2002), “Population Policy in India: Evolution, Performance and
Challenges”, The National Medical Journal of India, Vol.15, Supplement 1. 56 Duggal, Ravi, Gupta, Manishe and Jesani, Amar (1986), NGOs in Rural Healthcare,Cehat,
Mumbai57 Bhat, R (1998), “Private Healthcare Sector in India: Issues Arising out of its Growth and the
Role of the State in Strengthening Public-Private Interaction”, Unpublished, I.I.M.,
Ahmedabad.
51
4 World Health Organization (1978), Primary Healthcare: Report of the International
Conference on Primary Healthcare, Geneva.5 BIMARU stands for Bihar, Madhya Pradesh, Rajasthan, Uttar Pradesh and Orissa.
Together they account for more than 40 percent of India's population.6 GOI, MOHFW (2001), Draft National Health Policy 2001, New Delhi.7 International Institute of Population Sciences (2002), National Family Health Survey
(NFHS 2) 1998-99, Mumbai.8 Misra, Rajiv, Chatterjee, Rachel and Rao, Sujatha (2003), India Health Report, Oxford
University Press, New Delhi.9 Patel, Tulsi (2004), “Missing Girls in India”, Economic and Political Weekly, Vol.39, No.39.10 Premi, M.K. (2001), “The Missing Girl Child”, Economic and Political Weekly, Vol.XXXVI,
No.21, May.11 UNFPA (2003), Missing: Mapping the Adverse Child Sex Ratio in India, New Delhi.12 Government of India, Office of the Registrar General (2000), SRS Bulletin, Vol.34, No.1,
New Delhi.13 Ad Hoc Committee on Health Research, WHO, 1996, cited in Misra et al, op cit.14 IIPS (2000), op cit.15 Qadeer, Imrana (1998), “Reproductive Health: A Public Health Perspective”, Economic and
Political Weekly, Vol.33, No.44.16 Rao, Mohan (2002), “Population Policies: From Bad to Worse”, Economic and Political
Weekly, Vol. 37, No.22.17 Sen, Gita and Iyer, Aditi (2002), “Incentives and Disncentives: Necessary, Effective, Just?”,
Seminar 511. 18 National Nutrition Monitoring Bureau (1997), Twenty Five Years of NNMB 1972-1995,
Hyderabad.19 Government of India, Ministry of Health and Family Welfare (1999), Health Information of
India 1999, New Delhi.20 The average calorie consumption was 2172 Kcal as against the RDA of 2425 Kcal (NNMP,
op cit).21 A comparison cannot be made with NFHS I on stunting since height was not measured in
five states during NFHS I.22 The Body Mass Index (BMI) is defined as the weight in kilograms divided by the height in
metres.23 Mild anaemia is defined as haemoglobin levels between 10-10.9 grams/dl for pregnant and
10.11.9 grams/dl for non-pregnant women; moderate anaemia as 7-9.9gms/dl and severe
anaemia as less than 7.0 gms/dl. Anaemia is one of the leading underlying causes of death
in the country among women, not just among the pregnant.24 Government of India, Planning Commission (2002), Tenth Five Year Plan, New Delhi.25 There are discrepancies in the Government documents, as is evident. The World Bank's
World Development Report, 1999-2000, provides a figure of 0.7 percent.26 World Bank (2000), “Entering the 21st Century”, World Development Report 1999-2000,
O.U.P. New Delhi.27 WHO, World Health Report 2000, Geneva.28 Misra, Rajiv et al (2003), op cit.29 Krishnan T.N. (1999), “Access to Healthcare and Burden of Treatment in India” in Mohan
Rao (Ed), Disinvesting in Health: The World Bank's Prescriptions for Health, Sage, New
Delhi.30 Misra, Rajiv et al (2003), op cit.31 Voluntary Health Association of India (1997), Report of the Independent Commission on
Health in India, New Delhi. 32 It needs hardly be added that this phrase more than metaphorically resonates with share-
holders. This metonymic use of language is not accidental, but stems from the utilisation of
market principles in health sector planning in the age of reforms.33 Misra et al (2003), op cit.
5453
58 Nandraj et al (2001), op cit.59 Jesani, A. and Anantharam, S. (1993), Private Sector and Privatisation in Healthcare
Health Services and Resource Allocation in Pakistan
Rabea Malik
ecent academic and policy discourse has identified lack of adequate finances
and the role of governance structures and policy design as the main reasons
for the underperformance of social sectors in developing countries. In this Rregard, the Millennium Development Conference marks a point of departure for
developing countries with regard to social sector policy. The objective of the
Millennium Development Goals (MDGs), in addition to bringing to attention the
worsening human development crisis in low- and middle-income countries, was to
take systematic, coordinated steps to curtail it by (i) tracking the progress (or lack
thereof) of universal indicators of well being for the most vulnerable citizens (the poor,
women, and children); and (ii) to use the tracking as a basis to identify the financial
gap required to ensure that minimum standards of income levels, education, health,
and security be met within a specified timeframe. By becoming signatories to these
goals, governments were acknowledging the need to commit policy support as well as
financial support for ensuring that their citizens be granted these rights. The
significance of healthcare can be judged by the fact that Goals 4, 5, and 6 are all target
healthcare indicators - reducing under-five mortality rate by two-thirds, reducing the
maternal mortality ratio by three quarters, and halting and reversing the spread of
HIV/AIDS, malaria, and other major diseases by 2015. The increased resource
allocation from national and international sources was to be used to improve
infrastructure and increase coverage with the ultimate objective of improving health
outcomes.
South Asia, as a region, is off track in meeting the MDGs, and health outcomes in
particular are only better than regions of sub-Saharan Africa. While there has been a
clear improvement since the early 1990s, key healthcare indicators reveal the failure of
healthcare policies in the region - a very high level of malnutrition prevalence in
children under five (45 percent of children under age five), undernourishment (22
percent the population), high infant mortality rates (65 deaths per 1,000 live births),
under-five mortality rates, and maternal mortality rates, and the prevalence of
preventable and curable diseases (World Bank 2006).
On a sub-regional level, Pakistan despite having achieved respectable per capita
growth rates has consistently underperformed on most social indicators including
health. The problem of health sector service provision in Pakistan can broadly be
classified under two principle categories - that of service delivery and of (in effect
stemming from) inadequate and inefficient resource allocation. While the state of
health has improved, the challenges that remain are chronic and point to inadequate

56
involved in healthcare provision. The public healthcare infrastructure in Pakistan is
largely decentralised - basic health units (BHUs) and rural health centres in rural
areas, and district and divisional hospitals in urban areas for all districts. A report on
the state of health in South Asia, Human Development in South Asia, notes a rapid
expansion in public healthcare facilities in Pakistan in recent times with more than
5,000 BHUs, 552 RHCs, 45,000 dispensaries, and 9,000 hospitals (Mahbub-ul-Haq
Human Development Centre [MHHDC] 2005). Despite the expansion, health service
statistics reveal that less than one hospital bed is available per 1,000 people and less
than one physician available to treat 1,000 people (World Bank 2006). The demand
for public healthcare facilities has continued to decline in rural as well as urban areas
due to its poor state and quality. The private healthcare sector has, in recent years,
accounted for a greater percentage of service provision in Pakistan. In 1999, more
than 57 percent of the population was utilising private healthcare facilities in rural
areas and more than 70 percent in urban areas (Government of Pakistan [GOP] 1999).
The growth of the private sector in healthcare provision has helped to improve the
state of health in the country but given that it remains largely unregulated, the
probability of exploitation and malpractice remains high. Furthermore, with health
insurance coverage more of a privilege for the few rather than the right of the many,
the burden is heavier to bear for the poor.
Another aspect of healthcare service delivery is the medical services provided by the
public sector. Immunisation against diseases such as measles, diarrhea, whooping
cough, and tetanus (DPT), leading causes of mortality among children, is funded by
the governments in developing countries. Within preventative services,
immunisations are given high priority in national as well as international policy
programmes. Health-related MDGs target increases in immunisation rates and
reductions in deaths related to preventable diseases; improvements in these indicators
are indicative of the quality of service delivery in developing countries. Indicators on
conditions surrounding childbirth are indicative of access to and quality of service
delivery. Statistics for Pakistan reveal that immunisation rates among children are
better than the regional average (United Nations Development Programme [UNDP]
2005). In 2003, 82 percent of one-year-olds were fully immunised against
tuberculosis and 66 percent against measles. Thirty-three percent of children under
age five with diarrhoea were receiving oral rehydration (ORS) treatment in 2003.
Pakistan provides immunisation services through around 8,000 vaccinators from
2,600 fixed centres, 82 mobile centres, and 4,562 outreach centres under the
Expanded Programme of Immunisation. The programme currently covers about 68
percent of the population (MHHDC 2005). Despite the improvements, regional and
class disparities remain. Balochistan lags behind other provinces in terms of full
immunisation coverage. Children from high-income quintiles have higher
immunisation coverage than those in lower-income quintile households. Incidence of
ORS administration, considered a simple economical and effective preventative
measure for diarrhea deaths, is available to only 49 percent of the poor in Pakistan
(World Bank 2002). Comparing the disparities in access in rural and urban areas
reveals the gap between classes to be much larger in rural areas than in urban
Pakistan (Table 1).
55
service delivery, inequality in access, inefficient utilisation of funds, and a disconnect
between ground realities and policy design. Furthermore, regional, gender, and
income disparities in coverage and access to healthcare services remains stark after
almost six decades of the country's existence.
Taking stock of Pakistan's progress on the various health-related MDG targets reveals
(World Bank 2006): lReduce under-five mortality rate by two-thirds between 1990 and 2015: The
under-five mortality rate declined from 130 per 1,000 in 1990 to 101 per 1,000 in
2004. The regional average is 92 and Pakistan records the highest child mortality
rate in the region. The country has decreased mortality rates by 22 percent and
needs to bring the ratio down to 86 per 1,000 live births, which requires a further
reduction of 14 percent over the next ten years. lReduce infant mortality rate by two-thirds between 1990 and 2015: The infant
mortality rate is down from 122 per 1,000 in 1990-91 to 82 per 1,000 in 2001/02,
a reduction of 32 percent over ten years. lImprove the contraceptive prevalence rate: The contraceptive prevalence rate
improved from 13 percent in 1995-96 to 19 percent in 2001-02, and is projected to
further increase to 42 percent by 2005-06. lReduce by three-quarters the maternal mortality ratio between 1990 and 2015:
The maternal mortality ratio has increased from 200 per 100,000 live births to
500 in 2000-04. The worsening situation is puzzling as improvements in
maternal healthcare are evident in the increase in proportion of births attended
by skilled health personnel, from 19 percent of total births in 1998 to 23 percent
in 2000-04. lHave halted by 2015 and begun to reverse the spread of HIV/AIDS: HIV
prevalence among the adult population (15-49 years) has been steady at 0.10
percent of the population since 2001. The trend appears to have halted but given
that the population is increasing, this means the actual number of people afflicted
is also rising. lHave halted by 2015 and begun to reverse the incidence of malaria and other
major diseases: The number of malaria cases per 100,000 people was 58 in 2000
and number of tuberculosis cases was 181 in 2004.
These health outcomes need to be related to the provision of healthcare by the state.
The health sector, along with other social sectors in Pakistan, competes with ever-
burgeoning defence budgets and interest payments on debt that divert much-needed
resources away. This neglect has taken its toll on public health infrastructure in the
country and the quality of service delivery, which has declined considerably over the
decades to the point where even the poorest prefer to go to private practitioners often
paying exorbitant prices. The stark disparities in access to healthcare reveal failures of
governance and policy design in a system lagging far behind the needs of a growing
population.
Service Delivery Healthcare infrastructure is possibly the most important aspect of healthcare service
delivery. The healthcare provision structure in Pakistan is extensive and the coverage
in line with other developing countries, with both the public and private sector being

5857
The rural urban divide is of particular importance in the context of inequality of
coverage. Rural areas lag behind significantly in terms of coverage with only 46
services.
The Lady Health Worker (LHW) Programme stands out among the plethora of
government- and donor-sponsored initiatives in the sector as a significant success
story. By creating a large organisation of female community health workers with
national coverage, the programme has been effectively delivering low-cost primary
healthcare services to women in rural as well as urban areas. Funded by the ministry
of health, the programme was started in 1994 and delivers promotive, preventative,
and curative services at people's doorsteps. Each LHW programme serves 1,000
women in a community, creating a bridge between the community and healthcare
system and building the local community's capacity as the workers that are trained by
medical professionals are part of the local community. The services provided include
provision of health education, informing and motivating clients on family planning,
educating them on how to improve family health and hygiene, treating simple
diseases, and referring more serious ones to high-level health facilities. The number of
LHWs has risen from 21,000 in 1994 to more than 70,000 by 2003-04, serving more
than 63 million people (MHHDC 2005). Evaluations by international organisations
have revealed that communities with LHWs record a marked improvement in the
health status of women and children as compared to the communities without their
presence.
Resource AllocationHistorically, social sectors over all have assumed low priority in resource allocation in
Pakistan. The health sector has suffered from a lack of adequate resources.
Expenditure on health has two main sources of finance - public and private. Public
health expenditure consists of spending by the central and local governments, and is
lower in Pakistan than other countries in the region as well as countries with
comparable aggregate income levels (Figure 1). Not only is expenditure low, it has not
improved at all in the last three decades. Even a cursory comparison reveals that
defence spending per year (at 4.1 percent of GDP in 2003) outstrips health sector
spending (at 3.2 percent of GDP) by a significant margin, a trend that can be traced
back for decades. Health sector allocations have accounted for around 1 percent of
GDP since the 1970s and for only about 3.5 percent of total government expenditure.
The World Health Organization provides $34 per capita as a benchmark for the
minimum level of expenditure considered adequate to meet the needs of healthcare
demands in developing countries. Pakistan's per capita expenditure on health is a
meagre $13, which, at less than half that recommended, is lower than the regional
average (South Asia as a whole spends $24 per capita, India spends 30 $ per capita).
Private expenditure consists of direct out-of-pocket expenses of households. Private
health spending in Pakistan (65 percent of total spending on health) is double what
the state spends (34.9 percent of total health spending). Out-of-pocket expenditures
constitute 98.3 percent of private spending as health insurance is still a negligibly
small portion of public health expenditure. It is estimated that, on average,
households with less than US$130 a month spend about 3.4 percent of their
household incomes on heath. High levels of private and out-of-pocket expenditure in
developing countries is taken as an indication of the heightened vulnerability of the
Table 1: Inequalities in Maternal and Child Health 1990-99
Indicator Poorest (percent) Richest (percent)
Births attended by skilled health personnel 4.6 55.2
One-year-olds fully immunized 22.5 54.7
Infant mortality 88.7 62.5
Under-five mortality rate 124.5 73.8
Pre-natal consultation – Urban
– Rural
36.4
11.9
84.2
31.9
Delivery occurred at home – Urban
– Rural
80.7
95.5
29.9
80.3
Delivery unassisted by trained personnel – Urban
– Rural
38.7
49.4
7.9
38.3
Pre-natal consultation – Urban
– Rural
8.4
3.9
34
9.7
Sources: UNDP. 2005. Human Development Report; and World Bank. 2002. Pakistan Poverty Assessment.
Table 2: Access to Healthcare – Urban-Rural Gap in Pakistan 2004
Indicator Rural Urban
Prenatal consultation 22 60
Delivery occurred at home 90 60
Delivery unassisted by trained personnel 46 24
Post natal consultation 6 17
Medical consultation for diarrhoea 81 87
Use of ORS 50 64
First consultation at govt. facility 30.4 23.6
Source: PIHS 1998-99 as cited in Pakistan Poverty Assessment, World Bank 2002.
Table 3: Prevention of Disease in Pakistan 2002-2003
Child Immunization rate - Measles
(percentage of children ages - DPT
12-10 months) 2003
61
67
Tuberculosis treatment success rate (percentage of registered cases) 2003 77
DOTS detection rate (percentage of estimated cases) 2003 16
Access to an improved water source (percentage of population) 2002 90
Access to improved sanitation facilities (percentage of population) 2002 54
Source: World Bank. 2006. World Development Indicators.
Table 4: Reproductive Health Service Delivery
Indicator 2004
Contraceptive prevalence (percentage of women between 15-49) 2003 28
Births attended by skilled health staff (percentage of total) 2000-03 23
Women at risk of unintended pregnancies (percentage of married women) 1990-2003 32
Maternal mortality ratio 500
Source: World Bank. 2006. World Development Indicators.

60
preventative public health schemes involving sanitation and clean water than to focus
on access to facilities” (Poverty Assessment 3.60 with footnote reference 37). Public
expenditure allocation in Pakistan seems to suffer from skewed priorities. It is
primarily geared towards tertiary care facilities, such as hospitals, at the expense of
the primary and secondary tiers of care facilities, especially in rural areas.
Public Policy ResponseThere are a sufficient number of policy documents explicitly addressing issues of
healthcare in Pakistan. The Health Policy 2001 cites reduction in communicable
diseases, promotion of preventable care, removal of urban-rural, gender and income
biases, quality improvement of primary healthcare, and regulation pf private providers
of healthcare as priorities. Other policy documents of import, such as the PRSPs,
emphasise the same targets. Although the five-year plans make provision for resource
allocations to the health sector, the problems remain in implementation of policies
and efficient use of allocated resources. While increasing outlays to the sector is
required to improve infrastructure and quality of public health services, it is equally
important to directly address the disparities in access, whether these stem from lack of
provision of health facilities, lack of money to access those provided, or lack of public
awareness.
Furthermore, health sector allocations needs to be informed by better quality health
data. Pakistan lacks information on mortality and morbidity figures, the number of
children with diarrhea and ARI, and indicators of access with regard to various
primary healthcare services such as medical personnel and medications. It is also
important to differentiate between the impact of supply-side policy that improve
access to medical care and those that improve knowledge of healthcare within
households. This has implications for policy decisions regarding preventative health
schemes versus access to curative healthcare, depending on which is more effective
and efficient.
Rabea Malik is a research fellow at the Mahbub-ul-Haq Human Development Centre
in Pakistan.
Figure 1: Health Expenditure per Capita (current US$) - Regional Comparison
Source: World Bank. 2006. World Development Indicators.
0
10
20
30
40
50
60
70
Pakistan South Asia East Asia &
Pacific
Sub-Saharan
Africa
Low income
2000 2003
59
poor to the impoverishing effects of healthcare needs.
The skewed trend in the distribution of expenditure heads goes back to the early
1990s, indicating persistent policy insensitivity. The health sector suffered further
during the structural reforms of the 1990s as the Government cut back on
expenditures to reduce fiscal imbalances. Outlays to the social sectors decreased as an
immediate consequence and within the health sector, it was development rather than
recurring expenditure than was curtailed. Associated with the expansion of health
infrastructure, already low levels of development expenditure (8 percent of GDP and
30 percent of the health budget) declined further to less than 2 percent of GDP in the
early 2000s while recurring expenditure remained as high as 70 percent (staff salaries
being the highest component therein) (MHHDC 2005). The expenditure cut worsened
the coverage and quality of health provision.
The decrease under the structural adjustment programmes was offset to some extent
by the Government and donor-supported Social Action Programme (SAP), but with
less than stellar results. Policy interventions under SAP I (1993-97) and SAP II (1997-
2002) were geared towards increasing targeted outlays to the sector (non-salary
development expenditure in particular), decentralising service delivery to local levels
and increasing accountability with the ultimate objective of improving service delivery
and making it more efficient and effective. Both programmes are widely acknowledged
to have failed to achieve their set objectives. Apart from the LHW Programme, the
benefits were marginal. The SAP led to some improvements in health indicators such
as access to health infrastructure and immunisation of children. Allocations to the
sector increased during the SAP period but towards the end of the 1990s, as the
programmes were shelved, budget allocations fell to pre-SAP levels. Lack of political
will, politicisation of distribution of benefits, inadequate governance structure, and
elite capture are all cited as reasons for failure of the SAP.
Furthermore, the gap between promise and reality remains a gaping one as the
performance of the five-year health plans is reviewed (MHHDC 2005). The financial
allocation to the health sector, as a percentage of the total development budget, has
fluctuated around 5 percent or less for the past 30 years. Even as a promissory figure,
these levels are abysmally low. The situation worsens when the actual utilisation of
resources is evaluated. Over the years, Pakistan has effectively utilised less than 40
percent of the minimal budget allocated to the health sector. The sixth five-year plan
stands out in this regard, 1983-85 being the only years in Pakistan's history where
more than 92 percent of the funds allocated were utilised. The shortfall is painfully
apparent in the dismal service levels of service delivery - with only one bed per 1,000
people since the 1990s and only one physician per 1,000 people since 1990 (World
Bank 2006).
Misdirection of already meagre resources is another serious concern. Studies have
recognised the marginal benefits of spending on preventative rather than curative
care. It has been noted that Pakistan has erroneously been paying greater attention to
curative rather than preventative and promotive healthcare services. “A number of
development studies have suggested that it may actually be more beneficial to sponsor

6261
ReferenceslGOP. 1999. Study of the Role and Extent of Regulation of Private Sector in Healthcare

64
social policies, including provision of universal education and a basic nutritional floor
through food subsidies, improvements in water and sanitation, and social
emancipation of women. In contrast, many development economists have seen a basic
dilemma at the heart of Sri Lanka's achievements. For them, the social gains and
health miracle have come at too high a cost in terms of economic development (Bhalla
and Glewwe, 1986), although others, notably Amartya Sen (1999), have disagreed. The
country is thought to have invested too much in terms of government spending to
underpin these achievements, and this has fatally undermined economic growth.
Unfortunately, both perspectives obscure more than illuminate the key issues, and fail
to identify the critical lessons of Sri Lanka's experience. Instead, most of Sri Lanka's
health gains have come from the impact of curative medical care, and this has been
achieved by spending rather little in terms of government budgets.
Establishment of Sri Lanka's Health SystemUndeniably, Sri Lanka enjoys a number of intrinsic advantages when it comes to
health, many of which have their counterparts in Kerala (Caldwell, 1986). One is a
greater level of female autonomy in traditional society and lack of cultural resistance
to women's empowerment, which is a legacy of the island's Buddhist influences. These
made it easier to introduce mass education of girls, and also facilitated women taking
responsibility for looking after their own health and that of their children. The second
is a tradition of state activism in social and health provision, which has its origins in
the pre-colonial era when Sri Lankan kings constructed public hospitals and nursing
homes (Uragoda, 1987). Sri Lankan society is much more state-oriented in its
mobilisation and organisation than others in the region. The third, which is connected
with the plentiful rainfall and rivers in the island, has been a culture encouraging
cleanliness and frequent bathing, which was noted even by Marco Polo.
These advantages were not by themselves enough to make a difference, since, as noted
earlier, health indicators in Sri Lanka were in no way remarkable in the 1920s. What
changed this were two critical advances in governance that occurred during the British
occupation of the country. The first arose from the development of the colonial
economy by the British. They introduced the large-scale plantation cultivation and
export of tea, rubber and coconut, which required the importation of large numbers of
indentured labour from India. It provided a motivation for the British to develop an
efficient colonial administration to maintain the necessary infrastructure, and at the
same time provided the occupation regime with a ready source of taxation in the form
of export taxes to pay for it. As a consequence, by the early 20th century, the colonial
state had unusual administrative capacity, as well as financial means. One reflection of
this is that the bureaucracy was able to register almost all births and deaths as early as
the 1930s. The second and related development was the introduction of democracy. In
contrast to British India, British Ceylon had since the 18th Century been administered
directly from London as a Crown Colony, with early establishment of relatively
advanced features of governance such as independence of the judiciary, legislature
and executive. This paved the way in 1931 for a radical attempt at social and
constitutional engineering, when two decades before the rest of the region, the British
granted self-rule in all domestic affairs to Sri Lankans on the basis of national
63
Sri Lanka's “Health Miracle” Dr. Ravi P. Rannan-Eliya
n development terms, Sri Lanka's health gains compare with the income gains of
the East Asian tigers, and deserve the epithet of a “health miracle”. Although its
continuing civil strife has in the past three decades overshadowed it, this health Imiracle has for a long time attracted the interest of others both in South Asia and
elsewhere. Whilst the attention has been justified, Sri Lanka's experience has in
practice neither been adequately understood both within and outside the country, nor,
and this is probably not unconnected, has it led to widespread emulation in the region.
At the same time, Sri Lanka is edging closer to a point where it needs to adjust its
health strategies to maintain further progress.
Sri Lanka's Health Miracle: Achievement or Serendipity?Culture and geography partly explain the good health of Sri Lankans today, but Sri
Lanka's good health conditions owe far more to public policy than anything else. If we
go back to the early 1920s, these were quite similar to the rest of the region (Langford
and Storey, 1993). Average life expectancy at birth in pre-partition British India was
about 27 years. In British Ceylon, it was little better at 31 years, but was lower than in
several Indian provinces, such as Madras (42), Punjab (33) and Bombay (35). Yet,
starting in the 1930s, mortality rates have consistently fallen in Sri Lanka at a faster
rate than the rest of the region. Life expectancy at birth is now 72 years in Sri Lanka
compared with 61-65 in the rest of the region, and the infant mortality rate is less than
12 deaths per 1,000 live births compared with 60-85 elsewhere (WHO, 2005). Even
though its infant mortality rate has reached such low levels, the percentage decline
each year continues to outpace most of the developing world. At the same time, the
number of children that the average Sri Lankan women bears has fallen from more
than five to less than two, which implies that by 2030 Sri Lanka's population will stop
growing and begin to shrink. All this was achieved whilst Sri Lanka was still a lower-
income developing economy, and Sri Lanka's health performance in relation to its
level of economic development continues to place it amongst the top performers in the
world.
Sri Lanka in Contemporary DebatesIn the public health community, Sri Lanka is often presented as the classic proof of the
greater impact on mortality of public health and social interventions than curative
medical care. This has its roots in two observations. First, Sri Lanka's initial rapid
mortality decline during the 1940-50s coincided with the introduction of DDT
spraying to control mosquitoes. This proved highly effective and reduced almost to
zero deaths from what was then the number one killer in the island. Second, as in
Kerala, health gains in Sri Lanka have been accompanied and promoted by other
6665
elections held on the principle of universal franchise.
In 1927, the Constitutional Commissioners, who had been entrusted with
recommending the impending constitutional changes, argued that giving women an
equal vote and making the government accountable to the population were a necessity
for improvement in social conditions and improvement of child health (Rannan-Eliya
and de Mel, 1997). Almost certainly, they did not anticipate how prescient they were.
Democracy in Sri Lanka was to fundamentally alter the dynamics of social policy in
the island. It led to pressures on politicians to respond to social concerns, and chief
amongst these at the time were roads, schools, healthcare and food. These pressures
were to escalate in the subsequent decades as electoral competition between the two
major political parties in Sri Lanka today, the UNP and SLFP, became established in
the 1950s, and as after 1956 successive governments experienced the power and
willingness of the voters to turn out of office incumbent regimes.
Roots of Unorthodoxy in Health PolicyThe first elected government moved to rapidly expand into rural areas the existing
network of urban schools and hospitals. It was able to fund this, because of the
availability of plantation taxes. In doing this, the pressure was chiefly to respond to a
demand for equity, with each electorate having to benefit. In this regard, the political
pressures in Sri Lanka are far more concerned with issues related to local service
provision than in India or Bangladesh, owing to the small size of electorates; in the
1930s, the typical Member of Parliament represented 10-40,000 voters. This was to
structure Sri Lanka's current health system, which is characterised by a huge number
of hospitals widely dispersed and readily accessible in rural areas. For example, by the
time of independence in 1948, Sri Lanka's health ministry was operating more than
1,000 treatment facilities for a population of 7 million people, which is more than the
total number today in Bangladesh. In 1951, access to health services was further
extended, by abolishing all user charges for government medical services, a policy
which continues.
In this milieu occurred an event with profound influence on the future course of Sri
Lanka's health policy. In 1934-35, the island was struck by the Ceylon Malaria
Epidemic, which remains the most damaging natural disaster to strike the island in
modern times (including the 2004 tsunami). Unusual climatic conditions resulted in
an epidemic of malaria spreading to the non-malarial areas of the island where it
infected almost the whole population, and killed more than 100,000. Rural areas were
already impoverished in the midst of the 1930s Great Depression, and the malaria
epidemic made things much worse. Other than the direct sickness caused by the
illness, the biggest impact was on rural households, who suffered loss of incomes
when their men were unable to tend to their crops, and suffered again when the rest of
the family was forced to abandon their normal responsibilities to nurse the sick. In the
face of this devastation, the conservative political elite of the day chose to do little,
leaving the response to charitable and private action. Opposition leftist politicians
organised well-publicised aide missions into rural areas to exploit this. In reality these
were not that effective, but they caused considerable political anxiety. Following the
epidemic, the government instituted an official inquiry, which made two important
observations. First, it observed that the health crisis had impoverished large numbers
and that private and charitable actions had proved totally inadequate. Second, it noted
that there was a clear need for direct state intervention through provision of hospitals,
which could care and feed the sick, so as to lift the burden on affected families.Two important and distinctive features of Sri Lankan health policy thus emerged in
the first two decades following the granting of universal franchise in 1931. The first
was the emphasis on a highly dispersed rural health infrastructure, where almost all
rural people lived within walking distance of some facility. The second was the early
recognition, some six decades before WHO (2000) came to the same conclusion, that
a major objective of health policy should not be to cure disease but to provide
protection against financial impoverishment from serious illness.
Roles of Preventive and Curative Health ServicesSri Lanka does have a very effective and comprehensive system for delivering
preventive services. Using a model developed in the 1920s, all areas of the country are
covered by specialised teams of doctors, midwives and nurses who are responsible for
monitoring their local communities, identifying and registering pregnant mothers,
and then ensuring that these mothers and their children receive all indicated antenatal
and postnatal services, as well as subsequent child interventions such as
immunisation. This infrastructure enables it to achieve high levels of coverage with
basic preventive services, has essentially eradicated all immunisable diseases, and
reduced significantly maternal mortality (Pathmanathan et al., 2003).
The undeniable success of its preventive services and the well-documented success of
DDT-spraying in almost eliminating malaria in the 1940s might suggest that Sri
Lanka's health achievements are largely a result of a focus emphasis on preventive
care, much as many in the public health community would like to believe. However,
this is not the case, and some of the key evidence for this concerns malaria.
The control of malaria with DDT in the late 1940s and early 1950s is one of the most
studied episodes in public health (Gray, 1974). For a long-time, demographers
believed that the reduction in malaria alone accounted for most of Sri Lanka's health
gains during that period. However, recent research has debunked this idea. Meegama
(1986) first pointed out that the mortality decline that occurred benefited both
malarial and non-malarial parts of the island, so making malaria control an unlikely
explanation. More recent analysis by Langford (1996) of district records confirms this.
The best estimate is now that malaria control may have accounted for at most only a
quarter of the health gains in that period.
This recent reinterpretation of the malaria story provides an important piece of
evidence, which fits with others. It is now clear that the main reason why malarial
areas benefited the most in health terms in the 1950s is not that they benefited the
most from DDT-spraying, but instead that these areas were the ones which saw the
biggest expansion in government curative health institutions in the 1930s-40s
(Langford, 1996). This expansion did not have much of an impact before, because
budgetary constraints and later wartime restrictions meant that most of these facilities
were under-staffed and under-stocked with medicines. It was only after 1947 that

68
financially exorbitant and unfeasible in the setting of a developing economy. This
perception has contributed to a belief that Sri Lanka has been overspending on health
at the expense of economic growth, and may have discouraged others in the region
from emulating the Sri Lankan experience. However, these fears are misplaced.
Remarkably, Sri Lanka's government has not been a high spender on health services.
In recent years, government health spending has averaged 1.3-1.7 percent of GDP.
Although this is modestly higher than the 1.0-1.2 percent of GDP spent by the other
major countries of South Asia, it is actually less than the 2.0-3.0 percent of GDP that
other countries at Sri Lanka's income level typically spend. In fact, for most of the
period before 1990, Sri Lanka was spending less in per capita terms than the majority
even of countries in Sub-Saharan Africa (Rannan-Eliya and de Mel, 1997). Moreover,
as a share of national income, Sri Lanka spends less than 4 percent of its GDP, which
is considerably less than India's 6 percent of GDP (WHO, 2005).
When Sri Lanka launched its massive expansion of government health services in the
1930s, it was able to finance it through plantation export taxes. By 1959, it reached the
limits of this strategy, and economic difficulties forced the government to cut the
health budget. However, during the same period the expansion in facilities resulted in
massive surges in patient demand, of the order of 10-30 percent per annum. The
health ministry was caught in a bind it faced stringent budget constraints, was
experiencing increasing and unprecedented demands for its services, and faced
political pressures not to do anything that would restrict demand or access
(Cumpston, 1950). How did Sri Lanka solve this contradiction? The answer to this has
four parts. First, it relied on efficiency gains, second it prioritised curative services and
hospital care in the government health budget, third it prioritised access for the poor
over quality, and fourth the government has appropriately substituted for the private
sector.
Efficiency GainsIn the 1950s, doctors, nurses and hospitals were forced to treat ever more patients
with existing resources and personnel, and to adapt without sacrificing basic quality or
access of the poor to government hospitals. The ministry contributed by adapting its
own regulations and hospital designs to allow each facility to serve more patients. This
approach was not only successful, but it created a public sector culture that became
institutionalised. More than two-thirds of the expansion of government health services
during the critical 1945-60 period was financed not by increased money, but
productivity gains in the public sector. Since then, average productivity in the public
sector has continued to increase at 1-2 percent per year. One of the consequences of
this is that Sri Lanka as a middle-income economy can now produce many hospital
services at a lower dollar cost than government hospitals in many parts of India and
Bangladesh (Rannan-Eliya and Somanathan, 2003).
Prioritisation of Spending on HospitalsAlthough the reputation of its preventive health services and the scale of the malaria
control programme in the 1950s has made observers think otherwise, the government
has always placed the greatest priority in its health budget elsewhere on hospitals.
Since at least the 1950s, more than 75 percent of the recurrent budget has been spent
67
supplies improved, and this in turn was responsible for most of the subsequent health
improvements.
The importance of curative services in preventing malaria deaths becomes clearer in
later years. As DDT became less effective owing to resistance and other concerns,
malaria made a massive resurgence in the 1960s, and continues today to cause more
than a million of cases each year. However, the difference is that today almost nobody
in Sri Lanka actually dies of malaria. Annual deaths number a few hundreds, and most
of these are in the conflict areas of the east and north where curative medical services
are disrupted. The reason why more don't die is that today Sri Lankans who fall ill
with malaria seek and receive effective curative treatment in government hospitals. It
is this easy access to effective medical treatment and readiness of even poor Sri
Lankans to use it that largely explains Sri Lanka's good health indicators, as has been
confirmed in a range of other studies (Caldwell et al., 1989; De Silva et al., 2001).
Moreover, the statistics also show that even when comparison is made with countries
with similar educational indices, higher incomes, better sanitation access and lower
levels of malnutrition, Sri Lankans still have better health outcomes. The crucial
difference is that owing to the decades of government investment in an extensive
health infrastructure, Sri Lankans can and do resort to medical care more often than
almost any other lower-income developing country. As Table 1 shows, Sri Lankans not
only benefit from levels of access to modern medical services seen only in developed
countries, but were benefiting as early as 1948 from better access than most people in
most South Asian countries today.
Prioritisation of Government Health SpendingAt first glance, Sri Lanka's strategy of providing developed country levels of access to
free curative services, supported by effective preventive health services, seems
Table 1: Annual Contacts per Capita with Modern Providers Compared with Selected Countries
Country Time period Outpatient visits per capita Inpatient admissions per 100 capita
Sri Lanka 1930 1 4
Sri Lanka 1948 2 9
Sri Lanka 2003 5 22
Indonesia 2000 1 1
Bangladesh 1996 1 2
Pakistan 1995 3 -
Thailand 1993 2 8
Malaysia 2000 4 10
USA 2000 9 12
United Kingdom 2000 5 15
Hong Kong 2000 14 18
Germany 2000 6 24
Source: World Bank HNP Stats Online Database (http://devdata.worldbank.org/hnpstats),
OECD Health Data, official national statistics and IHP databases.
7069
on hospitals, and this share is not appreciably different today. This can be contrasted
with the 45-50 percent spent in Bangladesh, 30-35 percent in Nepal and 29 percent in
India (Data International, 2003; Institute of Policy Studies, 2003; Ministry of Health
and Family Welfare, 2005). This high budgetary allocation assisted the country to
maintain its extensive network of health facilities in rural areas. Evidently, this
unorthodox budget allocation was primarily due to the political pressures made by
voters, who have always preferred the government to increase this type of
expenditure, but it has also been quite rational for two reasons. First, a key need of the
rural poor has been protection against the financial impoverishment arising from
sickness, officially recognised in the 1930s. This type of protection requires
government spending on the most expensive inpatient care, and not primary or
routine outpatient care, which many poor people can afford to and do pay for
privately. In most parts of South Asia, sickness is a major cause of impoverishment of
households, but in Sri Lanka this is quite rare (van Doorslaer et al., forthcoming).
Second, once the preventive services have reached near universal levels of coverage
(almost all children immunised, couples given contraception, mothers provided
antenatal care), there is little to be gained from increasing preventive spending. The
public sector preventive services have already reached this point, so further increases
are not warranted.
Trade-off between Access and QualityDespite all this, efficiency gains and prioritising spending on hospitals were still not
sufficient to meet the demand created by allowing free access to government services.
At an early point, as in all healthcare systems, Sri Lanka faced a choice between
maintaining quality or protecting access to services. This was most acute when in the
1950s, when there were often more than twice as many patients as there were beds in
government hospitals. Yet when faced with this choice then and later, the unrelenting
pressure of most voters has forced the public sector to sacrifice quality to preserve
access. Overcrowding, under-equipped hospitals and overworked staff are often the
consequence. For example, lower-level hospitals in Sri Lanka typically lack X-ray
machines, a piece of equipment that is almost universal in comparable hospitals in
Bangladesh. At the same time, it must be emphasised that the loss of quality has been
felt most in the hotel or consumer aspects of care, and basic professional standards of
treatment have been maintained.
Public-Private MixIn retrospect, by adopting such a pro-active role in the provision and financing of
hospital services, the health ministry at each stage chose the most appropriate role for
the public sector. Prior to the 1930s-50s, there were essentially no qualified physicians
working in rural areas. What the massive government expansion of free clinics and
hospitals did was to wean rural people away from their traditional treatments to use
the services of qualified professionals. Today, unlike elsewhere in the region, even
poor Sri Lankans disdain from using traditional or unqualified doctors. Later as even
the rural poor became accustomed to using qualified doctors and began to seek out
private options, the government continued to focus on providing the expensive
hospital care, which the private sector could not provide. Today, the public sector still
continues to provide the bulk of inpatient care (<95 percent), but has ceded most
outpatient provision to the private sector. Even then, it continues to be the
predominant source of such care for the very poor, who cannot afford to see private
doctors. This approach can be contrasted with other countries, where the public sector
attempts to focus on providing primary care, whilst leaving hospital services to the
private sector.
Prospects and ChallengesThe explanation presented here has highlighted many of the paradoxes and
unorthodoxies of health policy in Sri Lanka. They did not develop as part of some
grand design, but arose fortuitously as a result of political pressures that were
generated in the context of a democratic system after 1931. Often key changes were
not desired by the political leaders, or recommended by experts, but were forced upon
them. These include the initial state involvement in rural health care, the policy of
focusing spending on hospitals and curative care, the policy of not charging user fees,
and the pursuit of efficiency in the public sector. Despite this and only after many
decades, is it now possible to begin to engage in the necessary post-hoc rationalisation
of what was a complex and dynamic process, and to understand why Sri Lanka's
health strategies made sense.
The Cycle of Reform and Non-reformThe reality that Sri Lanka's health strategy has been driven more by the preferences of
voters, than the conscious deliberation of experts, is linked to current challenges and
prospects for the health sector. A key element in this is that there is little
understanding of why the system works so well. It represents a historical compromise
between the demands of the rural poor for equitable access and risk protection, the
interests of the middle-classes in better quality, the professional judgements of health
planners, and the desire of the political and business elites to reduce social spending
and cut taxes. As such it satisfies almost nobody important, except the poor majority
who continue to report high levels of satisfaction in the system. It is nevertheless a
stable compromise, and since the key features of Sri Lanka's health system were put in
place in the 1950s, little has changed.
Characteristic of this lack of understanding has been a continuous cycle of attempts to
reform the system, which inevitably end in failure with no changes being made.
Typically, this starts with increasing demands from the middle-classes to improve
quality or provide services that the public sector does not, and a growing belief of the
usually cash-strapped government that the health sector is simply not efficient. It is
often fed by the feeling that since the system has not changed in an unfashionably long
time, it must somehow be reformed to keep up with the times. So reforms are
proposed to restructure the public sector delivery system, and to bring in other forms
of private financing to take the burden off the public sector. At this point the whole
process typically stalls as the different stakeholders articulate opposition, and
governments realise that any reforms are likely to be quite expensive, and that
increases in private financing will undermine equity.
The current cycle started in 1996 with the appointment by President Kumaratunga of
a Presidential Task Force to reform the health sector. This task force was convinced

72
consumer satisfaction are not to suffer. This conclusion is no longer that controversial,
having been reaffirmed in the past five years by three different sets of international
consultants tasked by the government with reviewing the health sector, and funded by
the World Bank and the Government of Japan.
The critical and unanswered question is how this increase in spending will be
afforded. Two options that have been identified are either to increase tax-funding for
the health services, or to introduce a universal health insurance system to supplement
the tax-funding. The main argument against the first option is that the political
leadership will find it very difficult to raises taxes to do this. On the other hand, the
second option represents a major social and administrative challenge, for which Sri
Lanka has no previous experience, and which has never been attempted in a country
at Sri Lanka's level of development (in Asia the only previous examples are Japan,
Taiwan and Korea).
It is unlikely that this question will be answered in the near future. Just as much as the
current system has survived for five decades owing to the constraints imposed by the
voters, any changes will not occur until there is sufficient political urgency to force the
political leaders to choose one option or the other. Currently, these political pressures
for change are not sufficient, and the system is likely to drift for at least five to seven
more years. However, this scenario would quickly change in the unlikely event that the
ongoing conflict is resolved soon, since the conflict has tended to push social issues off
the political agenda.
Dr. Ravi P. Rannan-Eliya is founder of the Institute for Health Policy in Sri Lanka.Any opinions expressed in this paper are those of the author alone, and not
necessarily those of the Institute for Health Policy.
ReferenceslBhalla, SS, and P Glewwe. 1986. Growth and Equity in Developing Countries: A
Reinterpretation of the Sri Lankan Experience. World Bank Economic Review 1 (1):35-63.lCaldwell, J.C. 1986. Routes to Low Mortality in Poor Countries. Population and
Development Review 12 (2):171-220.lCaldwell, John, Indra Gajanayake, Pat Caldwell, and Indrani Peiris. 1989. Sensitization to
illness and the risk of death: An explanation for Sri Lanka's approach to good health for all.
Social Science and Medicine 28 (4):365-79.lCentral Bank of Sri Lanka. 2005. The Consumer Finances and Socio Economic Survey
Report 2003/04. 2 vols. Part 1. Colombo, Sri Lanka: Central Bank of Sri Lanka.lCumpston, J.H.L. 1950. Report on the Medical and Public Health Organizations of Ceylon.
Sessional Papers. 1950: III. Colombo: Ceylon Government Press.lData International. 2003. Bangladesh National Health Accounts, 1999-2001. Dhaka,
Bangladesh: Health Economics Unit, Ministry of Health and Family Welfare.lDe Silva, M.W. Amarasiri, Ananda Wijekoon, Robert Hornik, and Jose Martines. 2001. Care
seeking in Sri Lanka: one possible explanation for low childhood mortality. Social Science
and Medicine 53:1363-1372.lGovernment of Sri Lanka. 2002. Regaining Sri Lanka: Vision and Strategy for Accelerated
Development. Colombo, Sri Lanka.lGray, R. H. 1974. The Decline of Mortality in Ceylon and the Demographic Effects of
Malaria Control. Population Studies 28 (2):205-229.lHsiao, William C., and Associates. 2001. A Preliminary Assessment of Sri Lanka's Health
71
that the core problem was the health system's inefficiency and excessive
centralisation, and proposed a range of restructuring initiatives, clearly inspired by
international trends. Its report did not even reach formal publication owing to
growing criticism by key groups and by the government's own international advisor
(Hsiao and Associates, 2001). The subsequent administration of Prime Minister
Wickremasinghe took a different tack by emphasising the need to increase private
spending. In its Poverty Reduction Strategy Paper or PRSP (Government of Sri Lanka,
2002), prepared in agreement with the World Bank, it proposed a poverty-reduction
strategy that would cut recurrent government health spending as a share of GDP and a
shift away from hospitals to preventive care. However, even this explicitness did not
take into account electoral realities, and the PRSP's targets were quietly ditched with
the change in government in 2005.
Emerging ChallengesDespite its stability and success, the Sri Lankan health system is nevertheless reaching
a point when substantial reforms will become unavoidable. Two trends underlie this.
First, its very success in reducing deaths in children and mothers and from infectious
disease means that future health gains require progress to be made in combating non-
communicable and chronic diseases, such as heart disease, diabetes and strokes. Sri
Lanka's population is rapidly ageing, and its disease profile resembles that of a
developed country. There is increasing evidence that the system is failing to meet the
challenge of providing the appropriate treatments for these diseases. A disturbing
indicator of this is that male adult life expectancy has barely increased in the past
thirty years. Effective responses will most likely involve spending more on treatment
interventions, and modernising the current system of primary care to introduce family
practitioners to manage chronic disease on a continuing basis. None of these are
affordable with current levels of government spending.
Second, increasing consumer expectations for better quality and improved
responsiveness healthcare facilities is leading more Sri Lankans to opt for the private
sector. This is mostly still for outpatient care, but the small private hospital sector is
growing rapidly. Already in the most developed Western Province, more than 62
percent of outpatient care is now obtained in the private sector (Central Bank of Sri
Lanka, 2005). If this trend continues, it risks destabilising the public sector if
government doctors decide to leave for the private sector, and if the crucial middle-
classes withdraw their political support for maintaining public sector services.
Ultimately, improving the responsiveness of public sector services will require some
degree of organisational reform, but such changes together with improvements in
quality are not feasible without increases in government spending (Hsiao and
Associates, 2001).
As implied, both these trends point to the need for substantially increased government
spending. Sri Lanka has maintained its government health budget at 1.2-1.7 percent of
GDP since the 1960s, but as a middle-income economy with an ageing and educated
population this level is no longer adequate. Government health spending will need to
increase to 2.0-3.0 percent of GDP in coming decades if quality of care, equity and
7473
Sector and Steps Forward. Cambridge, MA, USA: Harvard University.lInstitute of Policy Studies, Sri Lanka. 2003. Equity in Financing and Delivery of Health
Services in Bangladesh, Nepal, and Sri Lanka. In Health Policy Research in Asia: Guiding
Reforms and Building Capacity, edited by A. S. Yazbeck and D. H. Peters. Washington, DC,
USA: World Bank.lLangford, Christopher M. 1996. Reasons for the decline in mortality in Sri Lanka
immediately after the Second World War: a re-examination of the evidence. Health
Transition Review 6 (1):263-282.lLangford, Christopher, and Pamela Storey. 1993. Sex Differentials in Mortality Early in the
Twentieth Century: Sri Lanka and India Compared. Population and Development Review 19
(2):263-282.lMeegama, A. 1986. The Mortality Transition in Sri Lanka. In Determinants of Mortality
Change and Differentials in Developing Countries: The Five-Country Case Study Project.
Population Studies, No. 94; ST/ESA/SER.A/94, Pub. Order No. E.85.XIII.4. New York,
USA: United Nations.lMinistry of Health and Family Welfare. 2005. National Health Accounts: India 2001-02.
New Delhi: Ministry of Health and Family Welfare.lPathmanathan, Indra, Jerker Liljestrand, Jo M. Martins, Lalini Rajapaksa, Craig Lissner,
Amala de Silva, Swarna Selvaraju, and Prabha Joginder Singh. 2003. Investing in Maternal
Health: Learning from Malaysia and Sri Lanka. A. S. Preker, Health, Nutrition, and
Population Series. Washington, D.C.: World Bank.lRannan-Eliya, Ravi P., and Nishan de Mel. 1997. Resource Mobilization for the Health
Sector in Sri Lanka. Data for Decision Making Publication. Boston, MA, USA: Harvard
School of Public Health.lRannan-Eliya, Ravi P., and Aparnaa Somanathan. 2003. The Bangladesh Health Facility
Efficiency Study. In Health Policy Research in Asia: Guiding Reforms and Building
Capacity, edited by A. S. Yazbeck and D. H. Peters. Washington, DC, USA: World Bank.lSen, Amartya. 1999. Development as Freedom. Oxford, UK: Oxford University Press.lUragoda, C. G. 1987. A History of Medicine in Sri Lanka. Colombo: Sri Lanka Medical
Association.lvan Doorslaer, Eddy, Owen O'Donnell, Ravi P. Rannan-Eliya, Aparnaa Somanathan, Shiva
Raj Adhikari, Charu C. Garg, Deni Harbianto, Alejandro N. Herrin, Mohammed Nazmul
Huq, Shamsia Ibragimova, Anup Karan, Chiu Wan Ng, Badri Raj Pande, Rachel Racelis,
Sihai Tao, Keith Tin, Kanjana Tisayaticom, Laksono Trisnantoro, Chitpranee Visasvid, and
Yuxin Zhao. Forthcoming. The hidden poor: health payments and poverty in Asia. Lancet.lWHO. 2005. World Health Report 2005: Make every mother and child count. Geneva,
Switzerland: World Health Organization.lWorld Health Organization. 2000. World Health Report 2000. Geneva, Switzerland: World
Health Organization.
Forgotten Lessons: One Year after the Earthquake
Moeen H. Cheema
n 8 October 2005, a devastating earthquake struck the northern parts of
Pakistan, causing large-scale death and destruction in many parts of the ONorth-West Frontier Province (NWFP) and Pakistan-administered Kashmir.
In the immediate aftermath, the scale of the disaster was not fully appreciated and the
attention of the Government of Pakistan, the media, and the public remained fixed on
the visible tragedy of the Margalla Towers in Islamabad. This was in some measure
due to the shock suffered by government institutions in the affected areas and a
breakdown in communications. Pakistan's armed forces - the only institution
possessing the manpower, discipline, experience, equipment, and resources to 1undertake large-scale rescue and relief efforts - geared into action. However, it quickly
became apparent that managing a disaster on this scale was beyond even the army's 2capability. In the days that followed, Pakistan's media played an unprecedented role
in bringing the magnitude of the tragedy to the public's attention and mobilised the
nation into action. Citizens all over the country began collecting funds, medical
supplies, and relief goods; truckloads of relief supplies and volunteers started pouring 3into the earthquake-affected areas. Foreign nations and donor agencies pledged
billions of dollars in soft loans or aid, and a host of local as well as international non-4 government organisations (NGOs) set up medical camps and relief operations.
Many parts of the affected region were remote and inaccessible even prior to the
earthquake. Due to the destruction of roads and bridges during the earthquake and
subsequent landslides, many such areas were completely cut off and it was only 5possible to reach the victims via helicopter. While reports of severe damage in such
inaccessible areas filtered through, private aid flooded into the areas adjacent to the
open roads. This caused a glut of aid in some of the more accessible areas while the
remoter areas continued to be dependent on the military's overstretched efforts. To
compound this disparity, certain areas caught the media's attention, which resulted in
its inadvertently directing citizens' aid efforts to these areas, usually belatedly.
Concerns soon emerged regarding the wastage of civil relief efforts and the imminent
need for the Government to coordinate the efforts of the army, civil society, and
international organisations in order to avoid duplication and ensure that no gaps were 6left in the relief effort. Gaps in relief meant a possible and unnecessary rise in the
death toll of the earthquake.
In a bid to foster coordination between the army, local government institutions,
international NGOs (INGOs), civil society organisations, and citizens' relief efforts, the
Government announced the creation of an ad hoc federal agency, the Federal Relief

76
15security grounds since they indicated the positions of military installations. Despite
these advantages, the army had historically been stationed only along the LoC in
Pakistan-administered Kashmir and did not possess localised institutional knowledge 16of the hinterland, thus suffering certain drawbacks in its relief efforts on that count.
The state government of Pakistan-administered Kashmir and the district
administrations could have brought to the table knowledge of local conditions and
needs, which the army lacked. Unlike the federal bureaucracy in Pakistan, the top
bureaucrats in Pakistan-administered Kashmir, including the deputy commissioners
(DC) and assistant commissioners (ACs), all belong to Kashmir and have served in 17different parts of the state throughout their careers. However, in the first few weeks
after the earthquake, the state and district administrations were incapacitated by the
massive loss of life and infrastructure they had suffered. It was only by the end of
October 2005 that the civil administration started to find its feet. Around the same
time, UN agencies, especially the Office for the Coordination of Humanitarian Affairs
(OCHA), also developed their presence in the affected areas. The UN was deemed to
possess the large-scale disaster management experience that the army and civil
administrations lacked and could foster better working relationships with
international organisations and several local NGOs. OCHA was entrusted the task of
facilitating the coordination between the army and these organisations. However,
many of the local organisations, especially those with Islamist ideological leanings,
refused to work with the UN and preferred to liaise directly with the army and district 18administrations. The situation was further complicated by the failure of UN agencies
19to coordinate effectively among themselves and with various INGOs.
Before the end of October 2005, the army field units completed a credible, albeit
preliminary, assessment of damage and needs in the affected parts of Pakistan-20administered Kashmir. The army units also began preparing records of the amounts
of relief goods distributed in each village. The district administrations conducted a
separate damage assessment exercise utilising the local knowledge of the patwaris 21(keeper of land records). These assessments should have enabled the army field
commanders to assess their capabilities and to focus on the remoter high-altitude
areas, allocating the remaining areas to the district administrations and the UN to
divide between international and local NGOs.
UN OCHA attempted to prepare a sophisticated delivery tracking tool that would
match the relief needs in every village to the relief goods distributed by all the relief 22providers, including the army, in order to identify any gaps. However, attempts to
23track relief at the village level failed miserably. It soon emerged that the army and 24district administrations' damage and needs assessments could not be collated. This
was primarily because the district administration uses a revenue village (or mauza) as 25its basic administrative unit (Figure 1). In Pakistan-administered Kashmir's
mountainous terrain, the revenue village is not a centralised community as it is in the
planned villages of Punjab and Sindh. In fact, there may be a number of scattered
settlements (sometimes referred to as mohallas) in one revenue village, one of which
may bear the same name as that of the revenue village itself. Other settlements in the
revenue village bear different names given by the local residents with some of these
75
7Commission (FRC). The command of this institution was entrusted to a serving 8military officer, Major General Farooq Ahmad Khan, despite objections from certain
political quarters, perhaps because the bulk of the relief efforts were already in the 9hands of the army. The Government also invited the United Nations (UN) to facilitate
the coordination of relief efforts among international agencies and local NGOs, and
between them and the FRC.
Within a few days of the earthquake - even as the immediate medical and relief efforts
geared up - rains alerted the FRC, the army, and relief organisations to the threat of a
'disaster within a disaster' posed by the approaching harsh winters of the earthquake-10affected areas. Provision of temporary shelter to those rendered homeless or
11displaced by the earthquake became the next high-priority item on the agenda. As the
FRC and various relief organisations struggled to secure enough tents, it became
evident that non-winterised tents would not offer sufficient protection from the cold 12weather and heavy snowfalls, especially at higher altitudes. However, the drive to
secure scarce winterised tents was soon bypassed as the FRC decided that provision of
corrugated iron sheets was arguably a better means of enabling the affected 13population to construct temporary shelters or 'warm rooms'. In addition, the
Government decided to provide cash grants as compensation for deaths, injuries, and
house damage, under an expedited process to enable affected people to take measures
for their survival during winter.
This paper reviews the efforts undertaken by the Government, FRC, and the army to
estimate earthquake damage, coordinate relief efforts, determine eligibility for
assistance, and distribute cash assistance in Pakistan-administered Kashmir. The
paper also identifies and analyses the weaknesses inherent in these aspects of the
disaster management plan being implemented under the supervision of the FRC.
Structural and policy recommendations for the management of future disasters follow.
Coordinating Relief and Shelter Provision EffortsIn order to achieve efficient relief delivery and ensure that no one is left out, it is
necessary to establish effective coordination so that there is no wastage or 14duplication. This is only possible if a complete picture of the affected area's needs as
well as relief delivery is created and shared with all relief providers. As noted, the FRC
was entrusted with the challenging task of coordinating the relief and shelter provision
efforts undertaken by the army, the Pakistan-administered Kashmir state government,
district administrations, civil society, and international organisations. However, the
FRC lacked the capacity to undertake such a task on its own and by default, this
responsibility fell upon the army's field formations. The FRC appeared to be merely a
spokesperson for the army, which - as the first and foremost relief provider - was
arguably most capable of identifying gaps in the relief and shelter provision efforts.
The army also had the ability to access the remotest and most difficult high-altitude
areas. Further, the strategic value of villages close to the Line of Control (LoC) dictated
that only the army could undertake relief work in these parts to the exclusion of
others, especially international organisations. The army was also in possession of the
most detailed maps of the area, prepared by the Geological Survey of Pakistan and
improved upon by the army itself - maps that were kept confidential on national

7877
names being repeated all too often. While some of the settlements may be located at
the base of a ridge and easily accessible, others might be towards the top of the ridge stimulate local economies or provide affectees with the means to move their families
out of the affected areas. However, since economic rehabilitation was not a high-
priority agenda item, cash assistance for destroyed shops or other means of livelihood 35was not included in the first stage of the plan. Rehabilitation of the economy
continued to occupy an unduly low position among the Government's priorities and,
thus far, no plans have been unveiled to compensate for affectees' means of 36livelihood.
Previously, cash assistance was provided under the Azad Jammu and Kashmir
Distressed Persons Relief Act 1985 and the Azad Jammu and Kashmir Distressed
Persons Relief Rules 1982 to those who had suffered a physical or financial loss in any 37“accident, epidemic, rains, or any other calamity”. Furthermore, the stated amounts
were the maximum allowed for any category of property damage rather than fixed 38determinations. After the earthquake, the Government decided to increase the level
of cash assistance and to pay it at the given flat rates. In the absence of detailed
guidelines from the Government or the FRC, the Azad Jammu and Kashmir Board of
Revenue amended the Rules via the Distressed Persons Relief Rules 2005, and 39adopted a notification on 24 October 2005 to this effect. The Rules clearly defined
the criteria for eligibility and identified the recipients of cash assistance in certain
cases. However, there were complaints concerning lack of uniformity in the
administration of the scheme, which the FRC attempted to clarify on several 40occasions. This resulted in significant confusion regarding vital aspects of the cash
assistance scheme and considerable disparities in its implementation concerning the
eligibility and identity of recipients as explained in the following sections. Further,
many citizens complained that they had been left out of the cash assistance scheme
altogether due to corruption or maladministration.
Under the pre-earthquake legal regime governing cash assistance for disaster
affectees, the district administration was responsible for determining eligibility at its 41own discretion. However, given the magnitude of the losses caused by the
earthquake, the political sensitivity of the cash assistance programme, and risks of
corruption or politicisation, the Government modified the eligibility determination
process. Under a notification issued by its Board of Revenue on 29 October 2005, the
Government of Pakistan-administered Kashmir mandated that a number of three-
member Union Council Relief Committees (UCRCs) be formed. The committee was to
comprise (i) a gazetted civil official (ranked at Service Grade 17 or 18) as chairperson,
(ii) a representative of the Pakistan Armed Forces, and (iii) a representative of the
local member of the Legislative Assembly of Pakistan-administered Kashmir 42(popularly termed an MLA). Patwaris were deputed to the UCRCs to assist with their
43work.
44Issues Arising from the Cash Assistance Programme1. Gaps in Coverage and Lack of Grievance Resolution MechanismsA frequent complaint is that people who had temporarily migrated to places outside
Pakistan-administered Kashmir or moved to relief camps missed their opportunity to
avail the cash assistance to which they would have been entitled. In the event that the
UCRCs missed any bereaved family or residents of a damaged/destroyed house for
Figure 1: Different Administrative Units
Union council (UC) boundary
Mohalla/settlement
Revenue village/mauza boundary
Army sectors (grid boundary)

80
This discrepancy in the application of the rules becomes pertinent in at least three
categories of cases. The widow of the deceased would be entitled to receive the entire
cash assistance amount under the 2005 Rules, whereas under the Islamic laws of
inheritance, she would be eligible to receive as little as one-eighth of the total cash
assistance. Likewise, upon the death of a single parent or both parents, all the
surviving children are entitled to equal shares under the 2005 Rules. In contrast,
under the Islamic law, the surviving female children are entitled to half what male
children receive. In the case of a single (unmarried) person's death, the mother of the
deceased - if the father is not alive - should receive the entire cash assistance amount
as per the 2005 Rules. However, under the Islamic law, a major share of the cash
assistance would go to the children of the deceased, if any. Since the purpose of cash
assistance to compensate for death in a natural disaster is arguably to provide
financial support to all the dependents of the deceased, both the distribution schemes
proved defective. According to the 2005 Rules, the entire cash assistance amount was
given to one person on behalf of all of the dependants. On the other hand, according to
the Islamic rules of inheritance - which were being applied to cash assistance in the
aftermath of a natural disaster - the money was distributed among most dependants
according to shares that might have been 'culturally acceptable' in many cases but
discriminated against women dependents, for instance. In any case, the biggest
problem was that the Rules were not consistently applied - different people in similar
positions were treated differently, resulting in inequity and disputes.
The tehsil/district administrations claim that agreements (presumably verbal
understandings) between the relatives of the deceased were elicited prior to
distributing cash assistance. Even if that were the case, it is likely that many relatives,
especially women, would have accepted a compromise that offered less than what they
believed their shares ought to be rather than risking losing everything in a protracted
dispute. A study of court cases filed after the earthquake in Muzaffarabad district
reveals that compensation was constantly an issue. However, given the prevalence of
non-litigious social attitudes and a general distrust of legal means of dispute
resolution, it is reasonable to expect that a great many disputes have either been
resolved through informal arbitration or mediation, or have simply not been resolved
at all.
4. Definition of Household for Housing and Death Cash AssistanceAs noted earlier, both the Act and the 1982 Rules gave substantial discretion to the
tehsil/district administrations to determine the amount of cash assistance for
damaged/destroyed housing structures - below a stated maximum amount -
depending on the size and type of the structure and the needs and financial position of
the residents. However, in the present programme, the Government and FRC fixed the
amount of cash assistance per house (structure) while announcing to the public that 50cash assistance would be paid to each household. It is common practice in Pakistan-
administered Kashmir for a joint family (comprising more than one nuclear family) to
reside in one house as well as for multiple households with separate kitchens 51(choolahs) to occupy adjacent and structurally joined housing structures. While it
may be appropriate to treat a joint family as one household, it is not appropriate to
treat multiple households under the same roof in the same manner. In the present
79
any reason, those left out had the option of petitioning the district administration.
Thousands of such petitions were filed by people aggrieved at the administration of 45the cash grants programme. Complainants had to travel to the tehsil/district
headquarters and stand in queue for hours in order to file their grievance petitions
(darkhwasts). This process was especially difficult for widows, orphans, the disabled,
elderly, and other vulnerable segments of the affected population. However, since the
tehsil/district administrations lacked the capacity to investigate these complaints, no
action was taken on the vast majority. It was hoped that the second-phase survey for
housing assistance would at least record and remedy gaps in housing assistance-
related grievances. However, no action has been taken in that direction, even though
the results of the surveys for the second phase housing grants have been completed.
Although NADRA and the PPAF's partner organisations have recorded the grievances
emanating from the first phase of the cash assistance programme, neither
organisation has showed any willingness to publicise this crucial data. Exclusion from
death and housing assistance has been challenged in writ petitions before the High
Court as well as in several civil suits in various courts in Pakistan-administered
Kashmir.
2. Multiple Deaths within a FamilyUnfortunately, multiple deaths occurred within a family/household in many cases.
Although, the UCRCs appear to have recorded most deaths, including multiple deaths 46within a family, cash assistance was paid for only one death per family. Meanwhile,
various representatives of the Government and FRC announced that cash assistance
would be paid as compensation for all deaths. The historical application of the
relevant laws as well as such promises on the part of the Government and FRC created
legitimate expectations that families who had suffered multiple deaths would receive
additional cash assistance. Nonetheless, the Government has consistently refused to
pay cash assistance for more than one death per household. Due to an extended
definition of a household and a mistaken belief among many citizens of Pakistan-
administered Kashmir that cash assistance was paid for every death in NWFP,
resentment against the FRC's policies has simmered throughout the relief period.
3. Identity of the Recipients of Death Assistance CompensationThe 2005 Rules clearly identify the recipients of death assistance compensation in
certain cases - to the wife in case of her husband's death and vice versa; in the joint
accounts of adult children in case of both parents' death; to the father, or the mother if
the father is not alive, in case of a single person's death; to the grandparents of
orphaned minors, or in case they are not alive, to the real brother of the deceased for 47“the betterment of the minors”. The Rules also state that cash assistance would be
48paid to the legal heirs of the deceased. Several UCRC members as well as
complainants have reported that, in many cases, the 2005 Rules have been interpreted
to mean that cash assistance has to be treated as if it were the inheritance of the
deceased to be distributed in the same ratios as dictated by Islamic laws of 49inheritance. It appears that the directives of the 2005 Rules were followed in some
cases, while in others, the rules of Islamic inheritance, at least as regards the
proximate relatives of the deceased.

8281
scheme, no distinction was made between the houses compensated for, irrespective of
the number of residents or the number of households occupying that structure. This
scheme was generously devised and executed fairly efficiently by the Government and
tehsil/district administrations. Nonetheless, these programmes also suffered from
several problems, many of which could have easily been avoided. These policy and
administrative failures can be attributed to the causes discussed below.
Military-Mindedness of PolicymakersThe command and coordination of the relief efforts was in the hands of the army and
61the army-run FRC. Although the civilian government of Pakistan-administered
Kashmir attempted to take a lead in the administration of the cash assistance scheme
and sought to utilise its prior experience of managing post-disaster cash grant
schemes, the FRC stepped in and assumed complete control over this aspect of the
disaster management programme. The FRC showed a distinct preference for
centralised policymaking and uniformity across the entire earthquake-affected area.
The exclusion of civil institutions, especially the tehsil/district administrations,
resulted in the framing of policies that could not appreciate local conditions and hence
failed to anticipate particular issues. Further, the military-run FRC did not possess a
sufficient understanding of relevant laws or government procedures, or an
institutional memory of disaster-management issues, which resulted in bare policies
that lacked vital details.
The FRC and the army field formations' relationships with other institutional players,
including the tehsil/district administrations and international organisations, were not
fully functional. The tehsil/district administrations were assigned some of the most
difficult tasks - especially in administering the cash assistance programme and dealing
with public grievances - but had no say in devising the policies they were
implementing, which caused most of the grievances. Very little effort was made to
develop capacity in the severely under-resourced tehsil/district administrations to
undertake the functions assigned to them. Similarly, the army's reluctance in dealing
with international agencies and in sharing vital information with them at the early
stages of the relief effort created mutual distrust and acrimony. It was hoped that the
UN would play a positive role in bridging these gaps, but its inability to grasp the
complex sociopolitical dynamics and institutional arrangements, due in part to a very
high rate of personnel turnover, resulted in serious coordination issues between these
players.
Lack of Information Management CapacityBoth the relief coordination efforts and cash assistance programmes suffered heavily
from the army and tehsil/district administrations' information management failures.
Arguably, the tehsil/district administrations have always lacked the capacity to gather
and disseminate relevant information, but the army's failure was one of will rather 62than capacity. The army possessed vital information throughout the relief effort but
chose to share this information with tehsil/district administrations, the UN,
international organisations, and local NGOs only on a very strictly defined 'need-to-63know basis'. There was distinct reluctance to put any information in the public
domain for fear it might lead to scrutiny and criticism of the army's role in the relief
efforts. Only aggregated data was provided by the army and the FRC from time to
time, which provided very little meaningful information to the media and the public.

84
lAppropriate mechanisms should be established to track aid flows from source to
end-user; the publication of this information is crucial for transparency…lKnowledge of disaster response needs to be increased within society and among
the general public.lAll local and international NGOs and UN organisations must be registered, and
this information must be kept up to date.lPeople-centred solutions must be found. We must all constantly remind ourselves
that the path of recovery is not for us to determine, but for the people who
suffered [sic]”.
To the above well-considered propositions, one might add that it is paramount that
the full-time disaster management agency suggested above be a civilian agency that is
politically and legally accountable to the public. Further, the experience of RISEPAK
informs us that this agency should have the capacity and authority to undertake timely
and adequate needs assessments, map all affected areas, and track and coordinate
relief delivery by all major providers. Lastly, the experience of administering a cash
assistance scheme in Pakistan-administered Kashmir should lead to the drafting of
updated national legislation on this matter. The new law should provide the key
elements of the programme in the text of the primary legislation itself, rather than
leaving these to be framed through subordinate legislation. The amounts of various
cash grants should be stated in terms of percentages of diyat so that these are
automatically increased at the start of each fiscal year. This would provide a safeguard
against the erosion of these entitlements at the time of a disaster. Further, this
legislation should include a fair regime for determining eligibility, requiring adequate
and effective notice of the schedules of inspections and disbursement. The criteria for
eligibility and identities of recipients should also be clearly defined rather than left to
the discretion of the bureaucracy, as is currently the case. The legislation should also
identify a comprehensive grievance resolution mechanism, preferably based at the
local government level.
Unfortunately, it appears that the lessons of the tragedy of 8 October 2005 have not
been heeded. It is imperative that the governmental framework for disaster relief and
management be reorganised in the light of the experience of this earthquake.
Moeen H Cheema is an assistant professor of law and policy at the Lahore
University of Management Sciences (LUMS) in Pakistan.
Editor's note: The author is associated with Relief Information Systems for
Earthquake Pakistan (RISEPAK), an association of academics, social activists, and
student volunteers dedicated to data collection and research on earthquake-related
issues in Pakistan. RISEPAK was conceived in the immediate aftermath of the 8
October earthquake with the belief that coordinating relief efforts in disaster
situations is of paramount importance. RISEPAK's goal was to gather and provide
information through a web portal (www.risepak.com) so that “no village be left
behind”. In recognition for its work, RISEPAK was awarded the prestigious
Stockholm Challenge Award for innovative communication technology in 2006.Author's note: Parts of this paper were included earlier in a RISEPAK policy brief
83
Now that NADRA and the PPAF are in possession of a complete electronic database of
information gathered in the second phase survey of housing assistance, the
Government's failure to place this information in the public domain is a continuing
violation of the public's right of access to information.
In contrast to the army, the tehsil/district administrations lacked trained personnel,
equipment, and other resources to adequately manage and share their information.
The tehsil/district administrations failed to gather all the necessary information in
their first round of surveys, with the result that further surveys had to be conducted at
every successive stage of the programme at considerable expense of time and
resources. For example, separate surveys were conducted for the first and second
phases of housing assistance, and for the World Bank-sponsored livelihood support
grants. The tehsil/district administrations also failed to share their data on a timely
basis, primarily because they did not have the capacity to generate electronic
databases. This weakness could have been easily remedied at limited cost by providing
them computers, software, and trained personnel; unfortunately, whatever effort was
made in this regard was too little and too late.
Lack of Public Ownership and AccountabilityThe failure to provide up-to-date and relevant information to the affected public and
the absence of clear guidance on relevant policies and procedures caused insecurity 64and undue hardship. The exclusion of local politicians and tehsil/district
administrations resulted in the formation of policies that alienated a public who
became increasingly resentful about the relief and assistance programmes. The FRC
and tehsil/district administrations' failure to announce schedules for different aspects
of the relief and cash assistance programmes left people constantly waiting for aid and
rendered the affected population largely dependent on relief. The absence of a
comprehensive grievance resolution mechanism left people disillusioned and helpless.
The citizens of Pakistan-administered Kashmir, lacking definite knowledge of the roles
of various institutional players, have held the army and the Government ultimately
responsible for all the failings in the relief and cash assistance programmes, with long-
term political ramifications for the relationship between Pakistan-administered
Kashmir and Pakistan itself.
ConclusionThe administration of the post-earthquake relief and cash assistance programme
should have alerted us to the need for devising a comprehensive regime for disaster
relief and rehabilitation. Major General Farooq, the Federal Relief Commissioner, has
himself identified some key lessons learnt in the course of what he described as the 65“world's most successful relief operation”. These include the following:
l“There must be a full-time disaster management agency, with contingency plans
for a quick and effective response. Ad hoc arrangements will not work in all
circumstances…lSpeedy decision-making needs no emphasis. Provincial and district leaders
should play stronger coordinating and executing roles…lTake the media on board by providing access, continuous interaction and sharing
of data with them.

8685
published on the RISEPAK website (www.risepak.com). See Moeen Cheema, “The
Appraisal of the Government Compensation Scheme for Citizens of Azad Jammu &
should play in a state, i.e., the defence of borders. The army has not been directly involved
in running civil institutions in Pakistan-administered Kashmir in the past. 17 Pakistan-administered Kashmir retains the pre-devolution bureaucratic structure.18 For example, an OCHA situation report noted: “A number of private NGOs, mostly with
religious affiliations are acting outside the established coordination mechanisms. Recently
a number of privately run camps have been created, without adequate level of services and
accommodation facilities in place to sustain large populations. A strengthened policy
decision from the national authorities to underscore the importance of planning
interventions in a collaborative manner through established coordination structures, is
recommended.' See OCHA Situation Report No. 25, 24 November, 2005, available at
http://www.reliefweb.int/rw/rwb.nsf/db900SID/EGUA-6JGMEF?OpenDocument.19 For a description of communication failures between various UN agencies and INGOs, see
Paul Currion (endnote 15), pp. 20-21. In interviews with the author, UN OCHA personnel
acknowledged that they were failing to get information from various INGOs housed in
neighbouring tents in the UN compounds in Muzaffarabad and Bagh. For a rare public
admission, see OCHA Situation Report No. 37, 17 February 2006, available at
http://cidi.org/disaster/06a/ixl39.html. According to the Information Management
Strategic Information Cell (SIC) update, “The SIC is developing cross-cluster maps
combining indicators from Health, Emergency Shelter and WATSAN. Under development
are spreadsheet management tools that allow direct data sharing between databases. This
synergy produces results which are limited to the above-mentioned clusters, as (active)
participation in the SIC from all clusters is still lacking.” The new an experimental 'cluster
approach' that the UN employed in attempting to coordinate relief operations was also
criticised by many relief organisations. For example, an earlier OCHA situation report
commented: “The Muzaffarabad hub reports an apparent disconnect between field clusters
and the counter-part cluster in Islamabad. Attention on jurisdictions / expectations of each
and inter-cluster communication is required. Muzaffarabad also reports that large
international NGOs have become increasingly outspoken about their dissatisfaction with
the cluster format and have described that they find little opportunity to discuss policy
orientated or cross-cluster questions within the individual cluster.” See OCHA Situation
Report No. 32, 13 January 2006, available at http://www.reliefweb.int/rw/rwb.nsf/
db900SID/ EGUA-6KZRMZ?OpenDocument&emid= EQ-2005-000174-PAK.20 Electronic records of initial damage assessments conducted by the field units in the
Muzaffarabad and Bagh sectors of Pakistan-administered Kashmir are available on file with
RISEPAK. 21 Electronic records of initial damage assessments conducted by the district administrations
in Muzaffarabad and Bagh are available on file with RISEPAK. 22 This tool was referred to as the Integrated Monitoring Matrix (IMM). 23 Electronic records of OCHA's efforts at delivery tracking in the Muzaffarabad sector using
the IMM, earlier at the village/settlement level and later at the UC level, are available on file
with RISEPAK. 24 See Miguel Loureiro (endnote 6).25 See “Glossary of Political and Administrative Structures in the Earthquake-Affected Areas”
at www.risepak.com. 26 For a discussion on the causes and impact of high turnover of personnel in the UN's relief
and rehabilitation agencies, see Paul Currion (endnote 15), p. 21; the OCHA Report “The
c o m p l e x i t i e s o f d e l i v e r i n g a i d ” , J u n e 2 0 0 6 , a v a i l a b l e a t
http://www.irinnews.org/webspecials/PakistanEq/default.asp; and the UN Report “The
Evolving UN Cluster Approach in the Aftermath of the Pakistan Earthquake”, available at
http://www.humanitarianinfo.org/iasc/_tools/download.asp?docID=1582&type=pdf.27 See “PAKISTAN: Rapid village assessment under way for quake-hit north”, IRIN, 20
October 2005, available at http://www.irinnews.org/report.asp?ReportID
=49658&SelectRegion=Asia&SelectCountry=PAKISTAN. The HIC also attempted to

88
follows:Pakka (cement structure) house Complete damage PRs20,000 (USD330)Pakka house Partial damage PRs10,000 (USD165)Kachha (mud) house Complete damage PRs10,000 (USD165)Katchha house Partial damage PRs5,000 (USD83)Pakka shop Complete damage PRs5,000 (USD83)Kachha shop Complete damage PRs3,000 (USD50)
38 Cash assistance may not paid if a person who has suffered property damage “has got a
sound financial position [sic]”; if paid, it can range from 1 to 10% of the total loss suffered
“keeping in view the financial position of the distressed person”. See Rule 4(3) and (4) of
the Azad Jammu and Kashmir Distressed Persons Relief Rules 1982.39 See Azad Jammu and Kashmir Board of Revenue Notification # BAR/1698-1718/2005,
issued on 24 October 2005.40 For example, in a letter to the chief secretaries of the governments of Pakistan-
administered Kashmir and NWFP, the Federal Relief Commissioner observed that “several
anomalies and non-standard practices have been brought to the notice” and demanded
“express implementation” of certain decisions relating to death, injury, and housing grants
in order to “obviate the chances of varying interpretation at various levels”. The subject
heading of the letter reads: “Anomalies observed in the distribution of compensation”. See
FRC letter dated 5 November 2005 (No. F.1(1)2005-FRC). Also, see Azad Jammu and
Kashmir Board of Revenue Notification # BAR/12-7005/2005, issued on 15 November
2005, titled “Revised Compensation Policy”, which attempted to clarify the policy for injury
grants; and FRC Ruling No.01/11/Ruling/FRC, dated 15 December 2005, which clarified
policies regarding death, injury, and housing assistance.41 See Rule 3 of the Azad Jammu and Kashmir Distressed Persons Relief Rules 1982. The
responsibility of determining whether a claimant is eligible for cash assistance was vested in
the district administration officials. A tehsildar or naib (deputy) tehsildar “may visit
personally the place of distress to make assessment of the actual loss” and submit a detailed
report through the assistant commissioner to the Board of Officers constituted to supervise
the cash assistance process, of which board the assistant commissioner is chairperson. The
tehsildar or naib tehsildar concerned was also required to include in the report information
on the financial position of the distressed person.42 Azad Jammu and Kashmir Board of Revenue Notification # BAR/382-97/2005 issued on
29 October 2005.43 For a detailed review of the processes followed by the UCRC, see the RISEPAK Report.44 Issues with the cash assistance programme have been widely reported. See, for example,
“Rising inequality, unequal access to compensation”, IRIN, available at
http://www.irinnews.org/webspecials/PakistanEq/53714.asp; “Tremors to come”, The
Economist, 4 May 2006, available at http://www.economist.com/displayStory.cfm
?story_id= 6888906; and “Assessment report reveals far reaching damage to livelihoods”,
IRIN, 24 February 2006, available at http://iys.cidi.org/disaster/pak.05j08/ixl153.html. 45 More than 30,000 such complaints were filed in Muzaffarabad district alone prior to the
second phase survey of housing assistance. 46 In a ruling dated 15 December 2005, the FRC notified the policy decision that,
“Compensation for the dead to a household is restricted to Rs. 100,000… for the time being,
irrespective of the number of dead.” See FRC Ruling No.01/11/Ruling/FRC. Also, see FRC
letter dated 5 November 2005 (endnote 40).47 Clause 4 of the Distressed Persons Relief Rules 2005.48 Clause 3 of the Distressed Persons Relief Rules 2005.49 The Islamic laws of inheritance are complicated and require significant knowledge and
understanding on the part of the decision maker, which the military and MLA's
representative members of the UCRCs may not have possessed. However, it may be argued
that the patwaris deputed to the UCRCs possess sufficient understanding of these laws,
87
belatedly prepare “a survey of surveys and databases” in order to establish a “library of
relief surveys and databases”. See OCHA Situation Report No. 39, 10 March, available at
h t t p : / / w w w . r e l i e f w e b . i n t / r w / r w b . n s f / d b 9 0 0 S I D / E G U A -
6MRPWH?OpenDocument&emid=EQ-2005-000174-PAK.28 See Paul Currion (endnote 15), pp. 19-20.29 The UN HIC website describes P-codes, an abbreviation for “place codes”, as follows: “P-
codes are similar to zip codes and postal codes and are part of a data management system
that provides unique reference codes to thousands of locations in northern Pakistan. These
codes provide a systematic means of linking and exchanging data and analysing
relationships between them. Any information that is linked to one location with a p-code
can be linked and analysed with any other.” A complete list of P-codes is available at
http://www.unhic.org/usr/ShowContents.aspx?I=1&h=11&sh=-1.30 For a description of the attempt by UN agencies to identify settlements on army maps, see
“PAKISTAN: Data standardisation to improve quake relief coordination”, IRIN, 15
November 2005, available at http://www.irinnews.org/report.asp?ReportID=
50117&SelectRegion=Asia&SelectCountry=PAKISTAN. The OCHA Situation Report No. 23,
16 November 2005, available at http://www.reliefweb.int/rw/rwb.nsf/db900SID/EGUA-
6J7RR2?OpenDocument, also noted: “Information management has improved with
stronger links now in place between HIC and FRC data management structures. Regular
data and information exchange, shared assessments and sharing of geographic data will
help build a more comprehensive picture. The HIC is also helping to build FRC mapping
capacity.” 31 For the actual breakdown, see http://www.earthquakepakistan.com/Cash
assistance_Policy.htm and Appendix A. This website, maintained by the FRC, fails to
provide any statistics on the distribution of cash assistance or details of the cash assistance
scheme.32 Initially, cash assistance for destroyed/damaged houses was set at PRs25,000.
Subsequently, it was decided that a total of PRs175,000 would be paid as cash assistance for
those structures that met certain structural requirements. See, for example,
http://www.jang.com.pk/thenews/nov2005-daily/22-11-2005/main/main1.htm.33 See endnote 32. The total amount earmarked for cash assistance was initially set at PRs20
billion, but was later increased to PRs80 billion. 34 For a discussion of the advantages of the cash assistance scheme, see
http://www.refugeesinternational.org/content/article/detail/7555/?PHPSESSID=5ce00f9
2779c166324e1d.35 There was widespread loss of livestock. According to the FAO, as many as 200,000
livestock died as a result of the earthquake. See OCHA Situation Report No. 23, 16
November 2005, available at http://www.reliefweb.int/rw/rwb.nsf/db900SID/EGUA-
6J7RR2?OpenDocument. Further, as observed in an Inter-agency situation report: “There
has also been a dramatic loss of income as males who usually work during the winter
months as labourers in cities outside Pakistan-administered Kashmir to pay for food stocks,
have been busy coping with the aftermath of the quake. Hence, due to this serious loss of
income the condition of the population is even more vulnerable.” See the Inter-agency
Situation Report No. 16, 16 November 2005, available at
http://www.reliefweb.int/rw/rwb.nsf/db900SID/KHII-6J97XL?OpenDocument.36 See, for example, “PAKISTAN: Livelihoods still a concern for thousands of quake victims”,
IRINnews.org, 6 September 2006, available at http://www.irinnews.org/ report.
asp?ReportID= 55418&SelectRegion=Asia. 37 See Section 2(b)(i) of the Azad Jammu and Kashmir Distressed Persons Relief Act, 1985. As
per the Schedule attached to the Act, the amount of cash assistance normally payable for
loss of life is PRs20,000; for grievous hurt/injury as defined in Section 320 of the Penal
Code, PRs10,000; for property damage, it ranges from PRs3,000-5,000 based on the type
of structure and extent of damage. Cash assistance for building structures was paid as

9089
since they determine and transfer inheritance shares upon the deaths of registered
landowners, and would have guided the UCRCs in this regard.

9291

9493
Local Governance and Human Rights in Bangladesh
Mohammad Ehsan
he issue of human rights has not figured prominently in discussions on
decentralisation in Bangladesh for long. This is partly why human rights
advocates have focused on getting central governments to accept basic human Trights principles in the first instance, and only recently begun to consider the effects of
decentralising decision-making power at the lower levels of government. There is
increasing recognition that this process creates new opportunities to promote human
rights. Indeed, issues of justice, accountability, poverty reduction,
employment/livelihood, environment, women, and children are fundamental
concerns of local development.
Human rights cover a broad spectrum of ideas and concepts, which are predominantly
rooted in western political thought. Numerous charters and agreements exist to
protect the rights of citizens of their respective countries. According to the Universal
Declaration of Human Rights, human rights constitute both civil and political rights
(Articles 1 to 21) as well as economic, social, and cultural rights (Articles 22 to 28). The
Declaration reflected the immediate post-war consensus on human rights based on
what US President Roosevelt described as the “four freedoms” - including the freedom
from want - which he wanted incorporated in an international bill of rights. There was
also consensus in Vienna at the Second United Nations World Conference on Human
Rights in 1993, where the “right to development” was recognised as a universal and 1inalienable right and an integral part of fundamental human rights. The Bangladesh
perspective on human rights and, for that matter, on other major concerns of national
governance and development, including local government, is framed by the
Constitution of the People's Republic of Bangladesh, 1972.
Bangladesh Framework on Decentralisation and Local GovernmentA clear vision of local government is found in the preamble to the Constitution of
Bangladesh (Article 9), where the fundamental principles of state policy are also
articulated in the chapter on local government (Articles 59 and 60), (Ehsan 2003:
47). Decentralisation in Bangladesh began before the country's liberation in 1971. The
British colonial administration established local governments through the Local Self-
Government Act of 1885 to maximise land revenue collection and maintain law and
order. Reforms in local governance were also introduced during the Pakistan period
through the system of 'basic democracy' in the late 1950s.
Since independence in 1971, various governments have formed commissions to

96
(ICESCR). It is the obligation of all states to respect, protect, and fulfil the economic
and social rights of its citizens as per the human rights framework, and there are
several ways to test the performance of this obligation. One that is increasingly used
assesses performance against four essential features or standards. These ask whether
services or rights are (i) available, (ii) accessible, (iii) acceptable, and (iv) adapted to
context (ICHRP, 2005: 14). The ICHRP does not claim that the human rights
framework is the best approach or that its methods are suitable in every circumstance,
but it argues that, if combined with other approaches, it can improve the performance
of local governments since it draws attention to issues and groups of people to which
other approaches give less or insufficient attention.
It is easily understood from the above table that the human rights framework scores
well compared to other approaches as it accommodates most of the central principles
of other approaches as well as highlighting several values that other frameworks do
not. The United Nations Committee on Economic, Social and Cultural Rights has
developed tools for measuring whether economic and social rights are being achieved,
and whether the process for achieving them is likely to give long-lasting results. They
Table 1: Human Rights Approach Matrix
Approaches Principles/Features
Good Governance Sustainable Development
Gender Analysis Capabilities Human Rights
Participation
*
*
*
*
*
Non-discrimination
**
*
**
*
Accountability
*
**
*
Rule of law
*
**
**
*
Transparency/right to information
*
*
Prioritises poverty reduction
*
*
**
*
Empowerment
**
*
*
*
Availability
**
*
Accessibility
**
*
*
Acceptability
*
*
Adaptability
*
*
Legally binding framework
*
Effective remedy
*
Entitlement
*
Indivisibility
*
Recognises future generations’
claims
**
**
Capacity building
*
*
*
Institutional efficiency
*
*
Basic needs and services * ** ** *
*: explicit recognition of a principle, **: implicit recognition
95
recommend local government reforms. Most have dealt with nomenclatural changes,
focusing less on quality. The political parties in power have used local government
bodies to consolidate their own power base and, to a large extent, politicised these
institutions. Various steps taken in the last 35 years to develop local governance
include the introduction of union parishads (UPs) - which are still functional - and the
now-defunct upazila parishads. Local governments in the urban areas (municipalities
and city corporations) also remain more or less successful. In the 1990s, there were
attempts to create more opportunities for women in rural local bodies, but these have
been limited.
Bangladesh Framework on Human Rights The Constitution of Bangladesh, reflecting the people's commitment to safeguard
human rights, is based on the 1948 Universal Declaration of Human Rights. The
Constitution pledges 18 fundamental civil and political rights, including equality
before law, the right to life and personal liberty, safeguards in arrest and detention,
freedom of assembly, freedom of occupation, protection with respect to trial and 2punishment, and the right to property. In addition, the Constitution also promises to
safeguard certain social and economic rights for specific segments of the population 3and social sectors. However, as far as human rights is concerned, Bangladesh has
hardly achieved positive results over the last 35 years. Democratic norms and civil
liberties have been difficult to establish due to frequent military intervention in state
affairs, during which times the Constitution has either been either suspended or
tampered with by the regimes in power. As a result, nearly three and a half decades
after independence, governance remains ineffective in a volatile political order. There
is a lack of political consensus, weak legislative authority, unhealthy modes of political
competition, undemocratic political party structures, political and administrative
patronage, and weak local governance. There is also a lack of accountability and
transparency of political and administrative institutions. All these problems have
produced social tension, lack of equal access to natural justice, and abuses of human
rights.
The ICHRP Human Rights FrameworkIn recent years, the International Council on Human Rights Policy (ICHRP) has shed
light on an important aspect, i.e., assessing decentralised local governance from a
human rights perspective. Over the last few decades, decentralisation has been
analysed and promoted by disciplines like public administration, sociology, political
science, sustainable human development, gender analysis, and poverty reduction
approaches (ICHRP, 2005:15-17). Though these are all important mechanisms
through which local government can be analysed, the ICHRP suggests that the human
rights approach is also very important and can play a complementary role. Human
rights and local governance are both essentially concerned with the provision of
certain entitlements, including participation in local political processes and access to
essential services.
Worldwide, existing human rights instruments include the Universal Declaration of
Human Rights (UDHR), the International Covenant on Civil and Political Rights
(ICCPR) and the International Covenant on Economic, Social and Cultural Rights
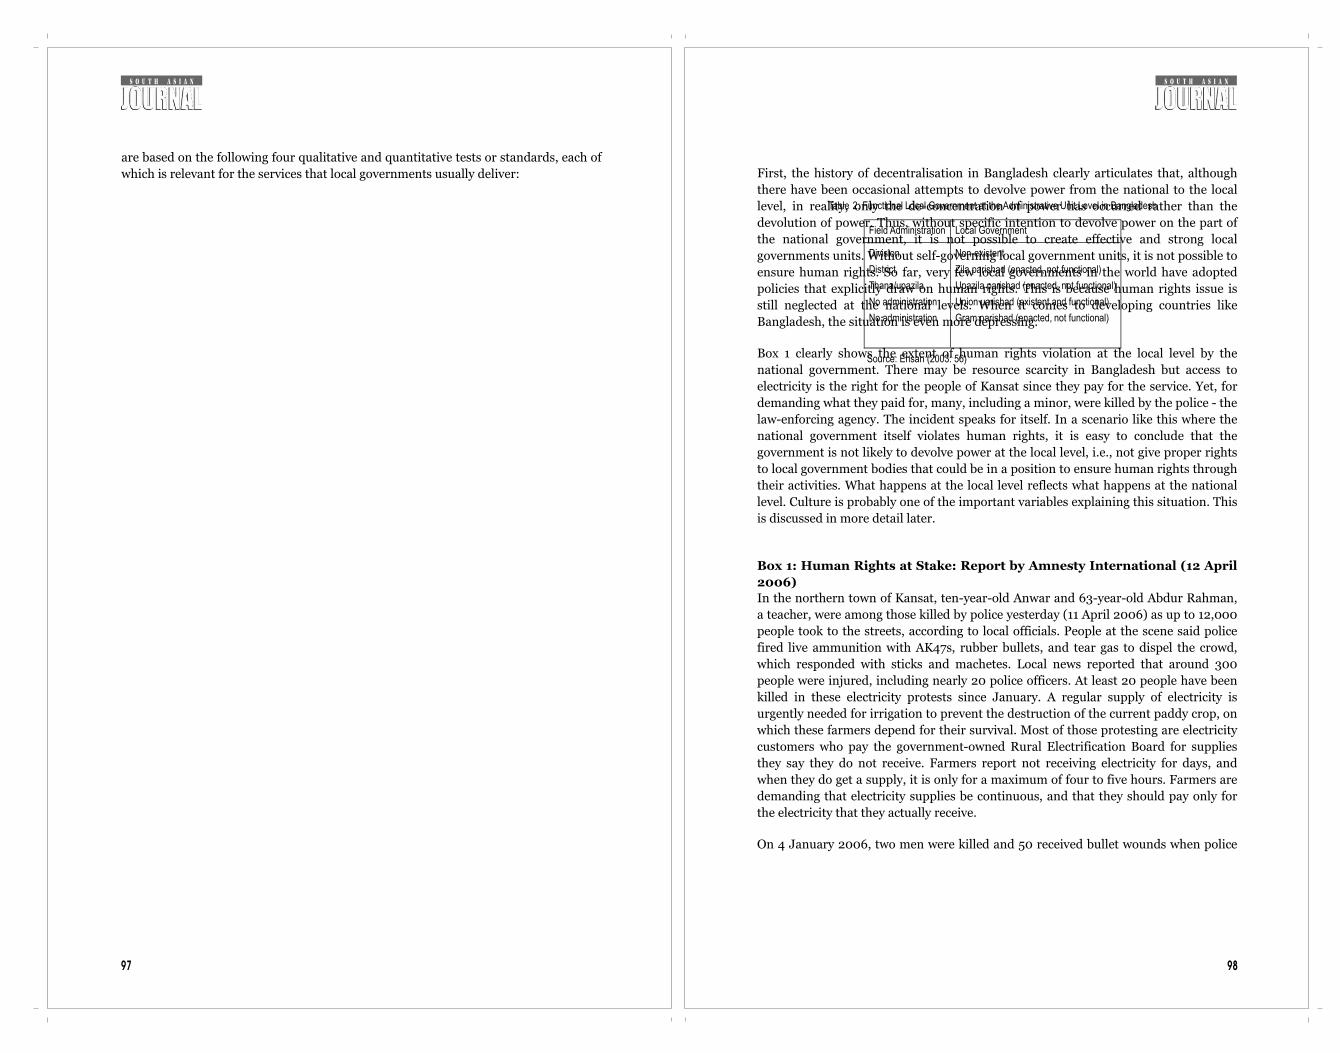
9897
are based on the following four qualitative and quantitative tests or standards, each of
which is relevant for the services that local governments usually deliver: First, the history of decentralisation in Bangladesh clearly articulates that, although
there have been occasional attempts to devolve power from the national to the local
level, in reality, only the de-concentration of power has occurred rather than the
devolution of power. Thus, without specific intention to devolve power on the part of
the national government, it is not possible to create effective and strong local
governments units. Without self-governing local government units, it is not possible to
ensure human rights. So far, very few local governments in the world have adopted
policies that explicitly draw on human rights. This is because human rights issue is
still neglected at the national levels. When it comes to developing countries like
Bangladesh, the situation is even more depressing.
Box 1 clearly shows the extent of human rights violation at the local level by the
national government. There may be resource scarcity in Bangladesh but access to
electricity is the right for the people of Kansat since they pay for the service. Yet, for
demanding what they paid for, many, including a minor, were killed by the police - the
law-enforcing agency. The incident speaks for itself. In a scenario like this where the
national government itself violates human rights, it is easy to conclude that the
government is not likely to devolve power at the local level, i.e., not give proper rights
to local government bodies that could be in a position to ensure human rights through
their activities. What happens at the local level reflects what happens at the national
level. Culture is probably one of the important variables explaining this situation. This
is discussed in more detail later.
Box 1: Human Rights at Stake: Report by Amnesty International (12 April
2006)In the northern town of Kansat, ten-year-old Anwar and 63-year-old Abdur Rahman,
a teacher, were among those killed by police yesterday (11 April 2006) as up to 12,000
people took to the streets, according to local officials. People at the scene said police
fired live ammunition with AK47s, rubber bullets, and tear gas to dispel the crowd,
which responded with sticks and machetes. Local news reported that around 300
people were injured, including nearly 20 police officers. At least 20 people have been
killed in these electricity protests since January. A regular supply of electricity is
urgently needed for irrigation to prevent the destruction of the current paddy crop, on
which these farmers depend for their survival. Most of those protesting are electricity
customers who pay the government-owned Rural Electrification Board for supplies
they say they do not receive. Farmers report not receiving electricity for days, and
when they do get a supply, it is only for a maximum of four to five hours. Farmers are
demanding that electricity supplies be continuous, and that they should pay only for
the electricity that they actually receive.
On 4 January 2006, two men were killed and 50 received bullet wounds when police
Table 2: Functional Local Government at the Administrative Unit Level in Bangladesh
Field Administration Local Government
Division
District
Thana/upazila
No administration
No administration
Non-existent
Zila parishad (enacted, not functional)
Upazila parishad (enacted, not functional)
Union uarishad (existent and functional)
Gram parishad (enacted, not functional)
Source: Ehsan (2003: 56)
100
landless, gender and environmental issues, and social justice.
Fourth, accountability, transparency, and/or right to information are important
principles of the human rights approach. In Bangladesh, these are often denied. The
UPs operate without basic procedures for accountability, and even though required by
law, the practice of public posting of UP budgets, minutes of UP meetings, or UP
accounts does not exist. Nor are accounts often presented at a full meeting of the UP
for approval. Lack of local consultation and the absence of adequate auditing
procedures add to this non-accountability.
Fifth, as indicated earlier, local government bodies like the UPs are not free and
autonomous. For instance, the UP budget remains subject to the scrutiny and
approval of an upazila nirbahi officer (UNO), assistant director, local government and
district commissioner (DC) - representatives of the central government at the district
and upazila levels. Besides this, annual development program block grants for
development projects at the UP level are totally controlled by the UNO and upazila
engineer. Eight schemes of 25,000 taka ($500 Canadian) each are allocated to the UPs
to be implemented by Project Implementation Committees (PICs) - these also have to
be technically approved and supervised by the upazila engineer. Moreover, local level
planning by the UPs is heavily influenced by central guidelines and upazila direction
and approval. UP plans, therefore, fail to be need-based and lack community
consultation and acceptance. It is clear that one of the few functional local government
bodies there is, is not free to move forward as per local needs. This situation is not
conducive to ensuring human rights at the local level.
Sixth, local government representatives in developing countries such as Bangladesh
are not always educated, or properly trained and sensitised to take up their
responsibilities and fulfil the expectations of local people. They often work only under
the direction of the central government. In the present circumstances, the UPs cannot
operate in a fully democratic manner. This is not only because of the pre-dominant
role of the UP chairman, but also because both the chairmen and other members,
particularly the newly-elected women members, lack knowledge about the functions
and operational procedures of a UP. Most councillors are largely unaware of the rules
and procedures of budgeting, planning, resource mobilisation, and allocation. For
example, most UP councillors are not aware of the magistracy powers of the chairman
in collecting taxes, fees, and licenses in business and trade. Further, politicisation has
corrupted the system and turned it into a cycle of inefficiency. Traditional sources of
local revenue are not fully exploited by the UPs for political/election expediency and
are overlooked by the central government and local administration, allowing the
mechanisms of UP inspection, monitoring, and evaluation to remain dormant. Most
UP councillors are unaware of many sources of local revenue while their chairmen
often intentionally avoids tapping them to avoid evoking the displeasure of potential
voters or because they are involved in corrupt practices of raising revenue that are not
accounted for. Moreover, in the case of market leasing, many chairmen, in
collaboration with the ijaradar (the person who is leased the market) undervalue
leases, taking an official cut. In this way, the political culture is corrupted and the
value of human rights degraded.
99
opened fire at demonstrators in Kansat in Chapainawabganj district. The killings
triggered further protests. On 23 January 2006, seven people were killed and more
than 100 injured by police firing at demonstrators. A 12-year-old boy died the
following day from his injuries. On 5 April 2006, at least four people were killed when
local Bangladeshi Nationalist Party (the party in power) members mounted bomb
attacks on a farmers' rally.
The Bangladesh Bar Council's Human Rights Committee feared police would resort to
arresting large numbers of people and filed a public interest petition before the High
Court. On 10 April, the High Court ruled that none of the protesting farmers should be
arrested or harassed except in compliance with the law. It also gave the government
three weeks to explain why the killings on 4 and 23 January should not be considered
unlawful; why compensation should not be paid to the bereaved families; and why the
authorities should not be directed to provide electricity to the area for a specified
period.
Second, one of the important functions of the UPs is to maintain law and order in
their jurisdiction through effective village courts. Although there has been provision
for effective village courts since the 1970s, the practice in reality is not even
satisfactory. For people in the village, regular judicial services are expensive and not
easily accessible, especially for women, the disabled, and elderly. Therefore, village
courts that work under the UPs are necessary to ensure many rights. However, due to
their non-representative nature (for instance, women are seldom members of the
courts), the village courts cannot play an effective role in ensuring human rights for
disadvantaged groups. Besides this, the legal jurisdiction of the village courts to deal
with cases up to a ceiling of 5,000 taka (Canadian $100) is a chief barrier to their
effective functioning. The nature of cases they deal with include money-related cases,
which generally originate from NGO-distributed micro-credit/money lending
programmes; and husband-wife separation/divorce/quarrel cases. Due to lack of
training, members of the village court (particularly those in the UPs) have been known
to confuse issues of arbitration with village court jurisdiction. Therefore, a non-
representative village court, when compounded with obsolete rules and regulations, is
ineffective in ensuring human rights.
Third, though decentralisation can have a positive impact on local services and
consequently on the realisation of political, economic, and social rights, in countries
like Bangladesh, where power is abused by the local elite and local government is
severely under-financed, the effect on human rights protection can be highly
damaging, and recourse to human rights principles to achieve reform is likely to be
less effective. For instance, in the case of most UPs, participatory practices to involve
the community in UP activities, such as planning and implementation of programs,
are missing. Most UP chairpersons and many members believe that they understand
people's problems and can make all decisions on behalf of the people without
consulting them. One of the reasons for this is the lack of public interest in the UPs as
well as UP representatives; and the lack of training or orientation in participatory
approaches. There is also need for further orientation and training in development
processes and strategies, a growing consciousness of the needs of the poor and
102 101
Seventh, in the late 1990s, through an amendment in the law, women were given the avoidance and masculinity provide reasons and incentives for violation of human
rights in Bangladesh”. To explain one aspect of the values, i.e., power distance, it can
be said that, in Bangladeshi society, power is unequal and therefore local government
accepts the power of national government over local administration. Simultaneously,
it tries to rule over citizens as children who need to be taken care of. Such a culture
does not ensure human rights in a society.
ConclusionIt is evident that, to ensure human rights in the functions as well as jurisdiction of
local governments, they must themselves be autonomous, free, and strong. Although
there are provisions for local government and human rights in the Constitution,
human rights continue to be violated and local government bodies remain ineffective.
This subsequently hinders their capacity to fulfil grassroots expectations by employing
a human rights approach. Culture may be an important variable in understanding the
situation but there are other reasons. Only the national government's political will to
devolve power at the level of local governments can help change the situation.
Mohammad Ehsan is an assistant professor of public administration at the
University of Dhaka in Bangladesh.
The author wishes to thank Farzana Naz, research fellow at JANIPOP, Dhaka, for
her assistance in writing this paper.
Endnotes1 Arjun Sengupta, Right to Development as a Human Right, Economic and Political Weekly,
July 7, 2001, p.25-27.2 See Constitution of Bangladesh articles 27-44. The Constitution also made promises to
safeguard fundamental rights of people. For example, it states, “the Republic shall be a
democracy in which fundamental human rights and freedoms and respect for the dignity
and worth of the human person shall be guaranteed.3 See Constitution of Bangladesh, article 10 (on women), article 14 (on peasants and
workers), article 17 (on education), article 18 (on health). Regarding women, in Article 10,
the Constitution pledges that “steps shall be taken to ensure participation of women in all
spheres of national life”. On education, in Article 17, the Constitution declares that “the
State shall adopt effective measures for the purpose of (a) establishing a uniform, mass-
oriented and universal system education and extending free compulsory education to all
children to such stage as may be determined by law; (b) relating education to the needs of
society and producing properly trained and motivated citizens to serve those needs; (c)
removing illiteracy within such time as may be determined by law”. 4 Among others, these include (a) formation of five additional standing committees making
the total number to twelve, so that every male and female UP member can become the
chairman of the committees; (b) every union can design eight development projects (in
place of five) each worth up to Taka 25,000 (earlier Taka 10,000). This measure is to create
space for women members to become chairman of at least on-third project implementation
committees; (c) every women member would be the chairman of ward-based Hand Tube-
well site selection committee. Further to the above instructions the government notified the
concerned people that the Local Government Division was facilitating the empowerment of
women members by allowing them to have membership in other important union-level
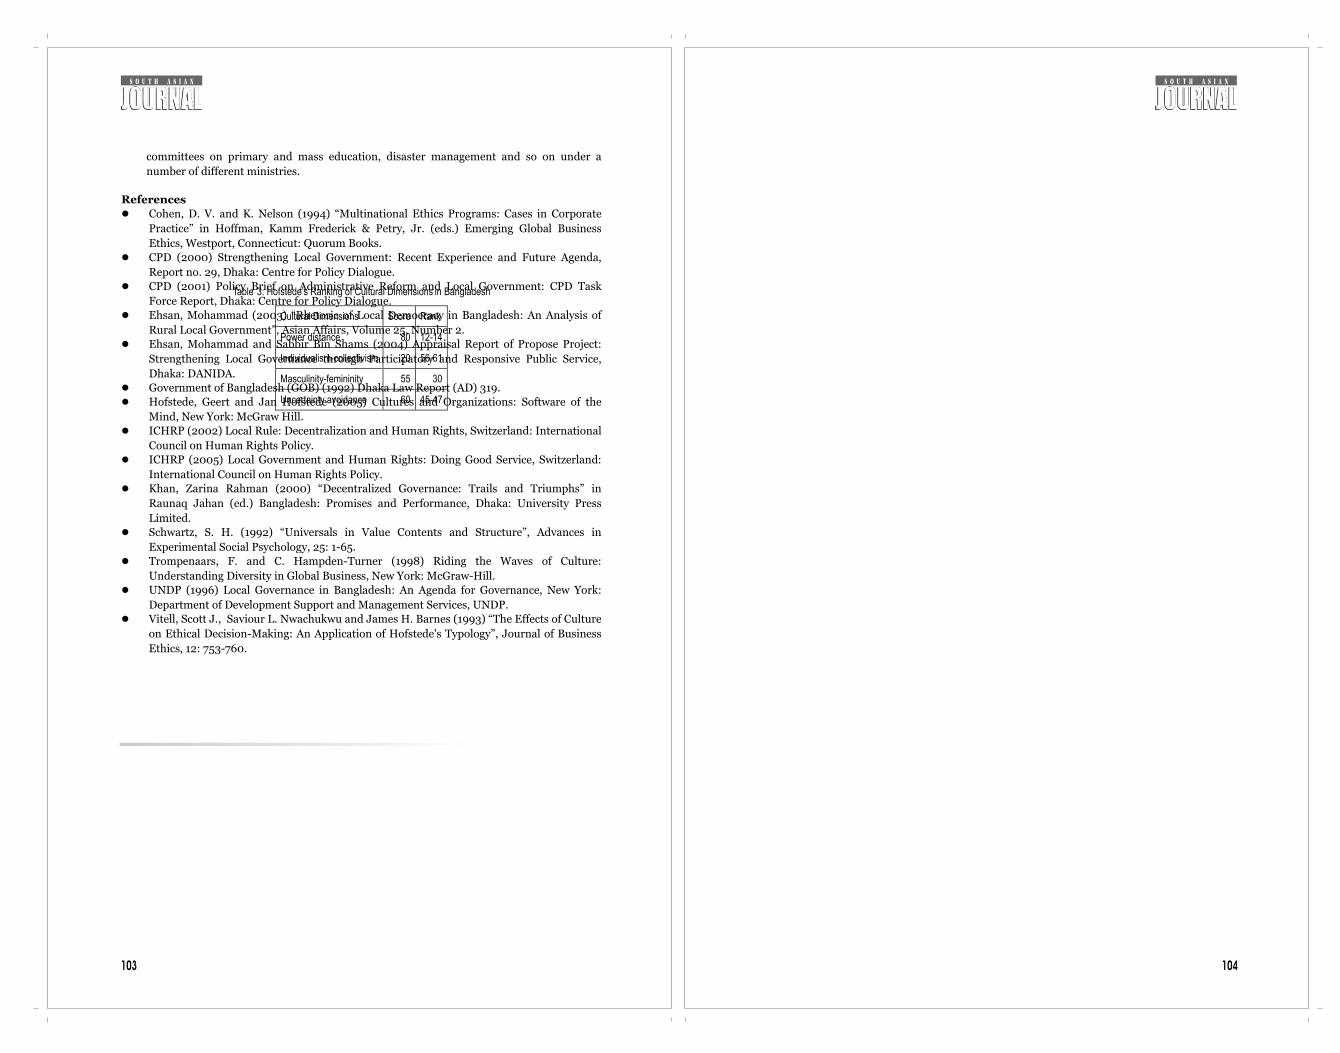
104103
committees on primary and mass education, disaster management and so on under a
number of different ministries.
ReferenceslCohen, D. V. and K. Nelson (1994) “Multinational Ethics Programs: Cases in Corporate
Practice” in Hoffman, Kamm Frederick & Petry, Jr. (eds.) Emerging Global Business
Ethics, Westport, Connecticut: Quorum Books. lCPD (2000) Strengthening Local Government: Recent Experience and Future Agenda,
Report no. 29, Dhaka: Centre for Policy Dialogue.lCPD (2001) Policy Brief on Administrative Reform and Local Government: CPD Task
Force Report, Dhaka: Centre for Policy Dialogue.lEhsan, Mohammad (2003) “Rhetoric of Local Democracy in Bangladesh: An Analysis of
Rural Local Government”, Asian Affairs, Volume 25, Number 2. lEhsan, Mohammad and Sabbir Bin Shams (2004) Appraisal Report of Propose Project:
Strengthening Local Governance through Participatory and Responsive Public Service,
Dhaka: DANIDA. lGovernment of Bangladesh (GOB) (1992) Dhaka Law Report (AD) 319. lHofstede, Geert and Jan Hofstede (2005) Cultures and Organizations: Software of the
Mind, New York: McGraw Hill. lICHRP (2002) Local Rule: Decentralization and Human Rights, Switzerland: International
Council on Human Rights Policy.lICHRP (2005) Local Government and Human Rights: Doing Good Service, Switzerland:
International Council on Human Rights Policy.lKhan, Zarina Rahman (2000) “Decentralized Governance: Trails and Triumphs” in
Raunaq Jahan (ed.) Bangladesh: Promises and Performance, Dhaka: University Press
Limited. lSchwartz, S. H. (1992) “Universals in Value Contents and Structure”, Advances in
Experimental Social Psychology, 25: 1-65.lTrompenaars, F. and C. Hampden-Turner (1998) Riding the Waves of Culture:
Understanding Diversity in Global Business, New York: McGraw-Hill. lUNDP (1996) Local Governance in Bangladesh: An Agenda for Governance, New York:
Department of Development Support and Management Services, UNDP.lVitell, Scott J., Saviour L. Nwachukwu and James H. Barnes (1993) “The Effects of Culture
on Ethical Decision-Making: An Application of Hofstede's Typology”, Journal of Business
Ethics, 12: 753-760.
Table 3: Hofstede’s Ranking of Cultural Dimensions in Bangladesh
Cultural Dimensions Score Rank
Power distance 80 12-14
Individualism-collectivism 20 56-61
Masculinity-femininity 55 30
Uncertainty avoidance 60 45-47
106105
Indian Public Diplomacy and the Nuclear Deal Radha Vij
n context of the recent agreement signed between India and the US on civilian
nuclear energy cooperation, this paper seeks to raise several questions. Were the
parties cognisant of the critical role of public diplomacy? If so, was public Idiplomacy deployed to reflect modern realities? How do the English language Indian
media play a role in realising public diplomacy? Finally, the paper suggests that it is a
need to redefine traditional top-down approaches of public diplomacy in line with an
ever-evolving concept of foreign relations.
In recent months, there has been a flurry of activity to set up a public diplomacy wing
in the External Affairs Ministry of the Indian government. The official reason for this
step states that the Government has not effectively explained its stance on the Indo-
US nuclear deal while also misreading public mood in Nepal. Prime Minister Singh
came dangerously close to endorsing King Gyanendra's rule, only to later recant the
statement as his own personal view. Furthermore, the Manmohan Singh-led UPA
coalition government systematically neglected to address details of the nuclear deal to
key domestic and international audiences. In both instances, official explanations and
clarifications were too late and found inadequate. The 3 March 3rd visit of US
President George Bush and the subsequent nuclear deal concluded is a perfect
crossroads from which to analyse the kinds of public dialogue processes
communication strategies in Indian diplomacy.
Foremost, however, it is necessary to understand that Bush's visit was part of a larger
historical perceptual change not only in the way that the US regards India, but also in
terms of a hierarchy of power unfolding within Southeast Asia. Viewed within a
historical trajectory beginning from Nehruvian-era anti-colonialism in the Cold War,
President Bush's recent visit re-signified the Indo-US relationship in terms of a
Clintonian delineation of India as regional hegemon. By visiting India and Pakistan on
the same tour, denying Pakistan a nuclear deal and proclaiming the two neighbors as 1“different countries with different histories and different needs”, Bush essentially
acknowledged the changing phase of South Asian power dynamics. Since the rise of
India and China and the onset of 9/11, geopolitics has shifted to create a new axis of 2power. The role of US as “off-shore balancer” must also take different form.
Subsequently, one must ask to what degree Indo-US relations and the new nuclear
deal an extension of strategic US-interests to counterweight China and thus secure a
foothold in the new economic and political hot-zone of South Asia?
Even more significant is the question, what signs denote that India has anticipated all
possible US intentions and publicly responded with an effective autonomous
diplomacy campaign? How India plans to reconcile its newfound geopolitical
prominence with the West as well as within South Asia is an issue in dire need of
attention. For this reason, it is important to see whether the Indian government and
its policymakers - as representatives of rising regional power - are aware of the critical 3role of public diplomacy. To secure a sustainable sense of political and economic
growth, it is more important than ever for India to ascertain and to market a sense of
itself to key domestic and international constituencies.
To a large extent, the formation of the nuclear deal reflects the missed opportunities
for Indian public diplomacy or, more specifically, the absence of strategic thinking
stemming from a lack of infrastructural mechanisms in place within the Indian public
diplomacy field. The lack of organised, cohesive and timely information-dissemination
starting with Prime Minister Singh's July 2005 US visit to strike a deal on civilian
nuclear cooperation and spanning through the signing of the nuclear accord during
President Bush's visit - created unnecessary post facto secrecy around a process that
should have been held transparent. For instance, the Government should have
publicly explicated their rationale as to why India should become a formally
recognised nuclear power. The establishment should have included reasons such as
the need for: sustainable energy, increased flow of technology exchange for space and
oceanography programs, economic independence from fossil fuels, the creation of new
economic and political markets and increased geopolitical mobility. The absence of
details and of a well-defined campaign of autonomous official statements released by
the Government to the Indian public and/or its regional neighbors through the media
set poor precedent for future Indian dealings with the US and allowed less political
space for dissenting voices to effectively challenge the establishment.
The sensitive Indo-US nuclear deal required nuanced diplomatic efforts, through both
official and informal channels in order to involve influential non-traditional opinions
of both countries. Members of the nuclear fuel suppliers group, consisting of
signatories to the nuclear non-proliferation treaty (NPT), adopted close interest in the
deal; influential media in the west such as the Economist, New York Times and
Washington Post had already expressed their concern over the deal as setting a bad
precedent by attempting to breach NPT. Yet, major voices were simply inadequately
engaged in diplomacy efforts. Some important constituencies required to be engaged
in a larger dialogue were: media, traditional anti-US sections in the left-wing political
parties, scholars and students, former foreign ministry bureaucrats and a highly
charged and divided scientific establishment, which had prospered under India's
search for self reliance when confronted with denial of western technology. Also in
need of engagement were the large Muslim populations enraged at US intervention in
Iraq, the main opposition party and the section of pro-American opinion in favour of
the nuclear deal.
There was also a need for Indian public diplomacy to address external regional
interests. These interests come from neighbours like Pakistan and China - countries
that had once benefited by the unabridged distance between the two large
democracies - as well as the Arab world and, most specifically, Iran, with which India
was entering into a deal for a natural gas supply pipeline running through Pakistan. In

108
players the TOI marks as “behind-the-scenes” were, most accurately, at the forefront 6of information and policymaking.
The TOI recently partnered with BBC and Reuters, tried to present a diverse view of
the nuclear deal, but resulted in regurgitating institutional jargon from traditional
diplomatic constituencies. The paper filtered out an eclectic and confused progression 7of editorials: from Indian Foreign Secretary Salman Haidar on Indo-US relations, to
8former US ambassador Tersita C Schaffer on the commonalities of democracies to 9Princeton University Professor of Bioethics Peter Singer, on US policy in Iraq. A sense
of apprehension and confusion surrounding the Presidential visit was palpable.
Stories on Aishwarya Rai's 'invitation' to Bush's luncheon, the President's tailor in
Khan Market and the security at Maurya Sheraton presented a lighter cultural side of
public diplomacy conveyance for a disengaged and uninformed Indian middle class.
The Hindustan Times (HT), known to be an establishment newspaper, continued on a
path of covering top-down diplomacy. HT presented an example of public diplomacy
coverage as front-page news when it noticed, “countries like the UK, France and
Russian are already lobbying to get the 45-member NSG to agree to special status to 10India”. HT also presented the voice of former ambassador to Pakistan, K Shankar
Bajpai, who wrote “As always, the endlessly baffling blindness of our governments to
the elementary needs of persuasive PR has done this issue no less harm than the 11criticisms hurled at it.” Bajpai brings up the central point of this paper: the necessity
of public diplomacy. Had such diplomacy been intact, many more informed civilian
channels could have been widely put to use in a broader debate on Indo-US relations
and the nuclear deal.
Instead, many dissenting voices- as covered most adequately by The Hindu in its
reports on Delhi and Lucknow protestors from JNU, the Muslim community and the
left unorganised in their criticisms of the nuclear deal and President Bush's visit. In
fact, the major complaint of Left parties such as the CPI (M) dealt with inadequate
government information surrounding Indo-US cooperation released to the public and 12political parties. While the CPI (M) made a point to articulate the error in viewing the
nuclear deal from an isolationist perspective incognisant of geopolitical factors and
warned that the n-deal would accompany limitless strings to US self-interests, greater
information from the Government could have led to a more comprehensive and
poignant reaction. In contrast to overt political statement, more subtle reportage of
public diplomacy was the recall of Ambassador David C Mulford's invitations to Bush's
Purana Qila address and the redistribution of cards sent from the Federation of Indian 13Chamber of Commerce and Industry.
The Indian Express, with its pro-nuclear deal stance, explored a less traditional role in
public information dissemination through its reliance on quotes and editorials by such
non-career politicians as Dr Anil Kakodkar, chairman of India's Atomic Energy
Commission and secretary of the Department of Atomic Energy. Dr Kakodkar, a
powerful behind-scenes player in the N-deal fought to secure the country's
autonomous nuclear research interests- interests that were virtually unknown to the
public. Furthermore, political commentator C Raja Mohan became an important pro-
107
the interest of setting multidimensional and progressive political precedent, India
should not have treated these societies and governments as passive bystanders but
rather as viable geopolitical elements included in diplomatic discussion. Such
discussion would have better informed various constituencies and international
governments to productively in an intelligent debate on the issues at hand.
Though there were over 15 other elements to the Indo-US relationship (sharing of
technology and US grants given to agriculture and space cooperation, enhanced trade
and commerce amongst the CEOs of both nations, joint health commitment to fight
HIV/AIDS, and the prominence of global security), both India and the US put their
reputations on the line by declaring the nuclear deal the lynch pin of their newfound
friendship. Thus, it is interesting to look back on the way elements of public diplomacy
has been and continue to be played out.
Media and Public DiplomacyIn the modern political context it is futile to speak of processes of public
4understanding and communication without speaking simultaneously of the media.
While multiple sides extracted and enacted their versions of meaning from the Bush
visit, the Indian media became the prevailing vehicle through which foreign policy was
reprocessed and defined. As Israeli communications scholar Chanan Naveh writes on
the role of the media in foreign policy:
...mass communication channels have two, sometimes opposing, dimensions - they
are an input variable, influencing the foreign policy decision-making process, and at
the same time they serves as an output media environment (a 'sounding board'
towards which the spokespersons of governments work) which compels leaders to 5relate to it in their decisions.
Given our assertion of media as powerful interlocutor of truth, our analysis of public
diplomacy uses four prominent English language newspapers to see if/how both sides
used public diplomacy as a tool to advance national self-interests. Here, the English
language media was privileged as it represents the most widely accessible source of
information for involved interests in both the US and India.
What we found was not out of the ordinary. The inclusion of traditional public
diplomacy voices was, of course, the cornerstone of all diplomatic strategies used in
the media. President Bush, Secretary of State Condoleezza Rice, Undersecretary of
State for Political Affairs R. Nicolas Burns and National Security Advisor Stephen
Hadley aligned against Prime Minister Manmohan Singh, Foreign Secretary Shyam
Saran and newly appointed National Security Advisor MK Narayanan to form the
institutional voices giving weight to the most important aspect of the Bush visit: the
Nuclear Deal. Adding to top-level discussions, US ambassadors Robert Blackwill and
David Mulford as well as Indian ambassador Ronen Sen also presented positive
institutional support to the nuclear process. The Times of India (TOI) presented a
feature on the various sides of debate forming the N-deal. The TOI included Sonia
Gandhi (on the Indian side) and Ashley Tellis (on the American side) in their list of
behind-the-scenes players, an assertion that is undoubtedly true. However, these
nuclear deal voice in highlighting India's newfound geopolitical importance. Raja
Mohan states that, regardless of the n-deal's passing, “Rice's defence of the nuclear
deal…would be remembered for long in New Delhi… [as] the strongest public defence
of India's policies by a foreign leader since the nation's founding nearly sixty years 14ago.” However, for India to attain a sustainable status as world power, the nuclear
deal must be remembered for more than simply its US-written praise. It must be
remembered for the written and spoken efforts of the Indian establishment as well. All three newspapers analyzed reported on the group of critics countering, and
sometimes overpowering, institutional attempts at public diplomacy. American
skeptics, fueled by partisan politics, 9/11 hysteria now applied to Iran and India's non-
signatory status of the NPT matched those Indian sceptics clinging to a historical
legacy of anti-Americanism in India today. From the US Congress to the streets of
Lucknow, their voices gained considerable press and, notably, a lack of public
acknowledgement by the establishment. At a time when the Indian government's
exigency for information distribution and public relations runs high, the presence of
such dissenting voices have more potential than ever to affect everything from public
opinion to international relations to the terms of the nuclear deal itself. For this
reason, a national public diplomacy campaign must strategically employ creative
efforts that interact with criticisms and reflect the changing face of foreign policy,
communication and geopolitics.
ConclusionUndeniably, formalising the role of public diplomacy is crucial for the Indian
government to maintain informed relationships with strategic audiences. Without
public diplomacy, a nation cannot prosper as a regional force of power. The US,
India's most prominent ally, has traditionally pioneered in this arena, converting its
national PR experts into political-makeover gurus. However, in the current Iraq War
era, US foreign relations policy is tenuous at best. India, thus, must not look to
become carbon copy of US diplomacy but rather to contrive its own agenda in a
progressive, geopolitically conscious and communication-savvy manner.
Foremost, a conversation on public diplomacy is incomplete without acknowledging
the changing role of foreign relations, as both are intricately connected. Primarily,
public diplomacy in its conventional sense of privileged political communication
between governments is no longer sufficient or effective in and of itself. Public
diplomacy must be thought of more as a dialogic process of people-to-people
interaction via trade, commerce and culture. Given the ever-increasing rate of travel
and information dissemination through fast-paced telecommunicative and mobile
transport devices, it is impossible to relegate and control the boundaries of
information simply top-level politics. As global citizens engaged in democratic
practice, we are constantly interfacing with a borderless world where the average
citizen has realised his/her potential power to create change in the political system.
Thus, information must be accurate, accessible/readily available and universally
comprehensible.
The new Public Diplomacy Department must work with the media to distribute
information acknowledging these changing communicative and geopolitical realities.
A campaign of public diplomacy must, consistently and in timely manner, dialogue
with the commerce and trade/financial sector as well as the cultural sector to spread
truthful and responsible information about government plans and key geopolitical
interests. The Government must work with individuals and organisations to promote
free film festivals, public events and cultural showcases dealing with regional and
strategic powers. Such cultural promotion will only serve to increase the possibility for
cross-border understanding among members of society. The media must also react by
broadening their coverage of public diplomacy to analyse grass-roots messages
conveyed by the Government.
India has the opportunity to lead the way as a progressive potential superpower. With
its rise to global notoriety in a privileged location in time, the nation has the vantage
point of history on its side. India must learn from past mistakes of other nations'
public diplomacy strategies. It must enact an honest, innovative, politically forward-
thinking and inclusive public diplomacy campaign that is cognisant of present ground
realities and incorporates voices of dissension. The country stands at yet another
crossroads. What will it do?
Radha Vij is a researcher at the Centre for Media Studies in India.The author wishes to thank S Narendra at the Centre for Media Studies for his
insight and contribution, without which this paper could not have been written.
Endnotes1 President George Bush, “No nuclear aid for Pakistan as Bush departs,” 5 March 2006, 28
April 2006 <CNN.com>.2 Lloyd I. Rudolph and Susanne Hoeber Rudolph. “The Making of US Foreign Policy for
South Asia”, Economic and Political Weekly, 25 February - 3 March: 703.3 In this paper, we take public diplomacy to be a set of communicative actions (similar to
public relations) taken up by the Government in the national self-interest to inform and
influence key international and domestic audiences with regard to India's foreign policy.4 Although this paper speaks in terms of the more traditionally privileged (English) print
media, the emergence of sensationalistic tabloidesque 24-hour TV news channels and the
presence of such new media as web logs (blogs), SMS-news and other telecommunicative
expressions are important to note. In the case of the latter, in particular, new media marks
an increasingly individualised and market-liberated phase of media while both
demonstrate the speed-oriented immediacy priorities of the media industry. Also important
for future analysis is the Hindi news media's understanding of public diplomacy.5 Chanan Naveh, “The Role of the Media in Foreign Policy Decision-Making: A Theoretical
Framework”, Conflict and Communication online, 1 (2), 2002, 4 May 2006
<www.cco.regener-online.de> 7.6 “People Behind the Deal”, Times of India, 3 March 2006: TimesNation 8.7 “Towards Partnership”, Times of India, 28 February 2006: Editorial Opinion 32.8 “Bond of Democracy”, Times of India, 2 March 2006: Editorial Opinion 32.9 “Blood on his hands”, Times of India, 3 March 2006: Editorial Opinion 32.10 “The Four Steps”, The Hindustan Times, 3 March 2006: Front Page.11 “Treading limits”, The Hindustan Times, 1 March 2006: Editorial.12 “Inform people about terms of Umbrella pact: CPI (M)”, The Hindu, 2 March 2006: News
12.13 “Mulford invitation not valid”, The Hindu, 2 March 2006: News 13.14 “Rice rebuts critics on the Hill, point by point”, The Indian Express, 7 April 2006: Editorial.
110109
112
How does poverty associate with migration? Skeldon theorises this. First, he argues
that, depending on geographical and other conditions, poverty may be a root cause of
migration, with migration offering a way out of poverty (2005: 253). Secondly, he
suggests that “survival migration of the poorest is likely to be … primarily intra-
country” by evidencing that the poorest cannot afford “the cost and risk” of migration
(2005: 255). Thirdly, he explains that migration as the result of poverty can shift the
focus to the issue of feeling poor, i.e. relative rather than absolute deprivation” (2005:
256). For instance, there are links established between migrants and non-migrants
that inform the latter about the wider world. Such knowledge would transform one's
perception from “subsistence affluence” to “relative deprivation,” without changing
“the quality of subsistence in the community” (2005: 256). His arguments are mostly
drawn by his observation of cases in particular countries and not entirely concluding,
but it is reasonable to understand that migration is “both the creator and the product
of poverty” (2005: 256). While migration has great potential, “the present system is
open to abuse, is inefficient, and may at times even exacerbate inequalities.
Migration and Social PolicyWhile migration itself has increasingly called for attention in academic and
practitioner's circles, there are limited studies that approach issues of migration from
the social policy point of view. Instead, existing social policy studies concerning
migration tend to focus on issues such as access to welfare benefits and services (e.g.
pension provision), the links between immigration, nationality and asylum policy, the
treatment of migrants and national identity (Lewis, 2003: 323), in addition to
protection of rights of migrants (Dean, 2002) and freedom of movement for adjusting
labour markets. In other words, most of the existing social policy literatures dealing
with migration issues have limitations that they tend to discuss based on a “debate
about open borders versus protected societies” (Engelen, 2005:313). They tend to treat
migration as domestic or national topics, adopting the perspective of receiving
countries (Sassen, 1988: 6). They rarely explore the causality and impacts for migrants
sending countries. Even in the area of international social policy, this issue does not
receive sufficient attention considering the interrelatedness of social policy both in
sending and receiving countries. In addition to this, Lewis suggested that the difficulty
of exploration of connections between migrants and social welfare might come from a
“rapidly changing policy environment” and obscurity of terminology (2003: 323).
However, we argue that migrant's remittance has salience in social policy studies
because the income distribution effects of remittance are strongly associated with the
public value, such as social justice and equality.
Labour Migration Migration refers to “the temporary or permanent movement of persons between
countries to pursue employment or education or to escape adverse political climate”
(Goldin and Reinert, 2006: 14).
A number of scholars have attempted to theorise a mechanism of labour migration
flows (Castles and Miller 2003). For example, Ghosh defines labour migration as
inter-country movements primarily caused or motivated by economic factors (1996).
He presents two models, including classical economic (or liberal choice) theories and
111
Migrant Remittances and Poverty Alleviation in Sri Lanka
Ayako Kageyama
ith the increase of total remittances from labour migration in the world,
there have been more debates on their influence on people's life, Wparticularly for receiving countries. Most recently, we have seen a number
of policy initiatives by international organisations to upstream the agenda of
migration and development (e.g. High Level Dialogue on Migration and Development
at the UN General Assembly, held on September 14-15, 2006).
In terms of reception of remittance as a percentage of GDP, Sri Lanka was ranked
26th in 2002 and has promoted foreign employment in the last three decades. Some
economists and policy makers in government claimed that the remittances have
considerably benefited economic development (Korale, 1983). The major part of
remittances into Sri Lanka comes from unskilled migrants engaging in work in the
Middle East. However, there are fewer studies which have examined the link between
their remittances and people in migrant sending communities in Sri Lanka, compared
to similar study made for elsewhere, e.g. Mexico.
The paper comprises three parts. First, we will review the existing theoretical and
empirical studies on labour migration and remittances. Second, this paper will outline
the profiles of labour migration from Sri Lanka and examine the various evidences
shown by a series of existing investigations. Third, on the basis of the theoretical and
empirical data discussed, we will explore the merits and demerits of remittances in
relation to poverty alleviation in communities in Sri Lanka. Finally, the conclusion
summarises the major findings and discussions, with brief policy implications.
Relation between Poverty and MigrationThe notion of poverty has long been discussed among social scientists. Major
contention surrounds the cause and measurement of poverty relativity versus
absolutism (Rowntree, 1901, Sen, 1983), and objectivity versus subjectivity
(Townsend, 1979, Piachaud, 1987), whereas these accounts are not excluding each
other. There are various methods of measurements of poverty (Walker, 2005). It is
mostly about how to assess those with adequacy or inadequacy. One of the standards
is a headcount poverty rate threshold, expressed as a percentage of the total
population (Walker, 2005: 146). It has a merit in straightforwardness, but is unable to
indicate severity of poverty. On the other hand, physical poverty is the state physical
survival is threatened (Sen, 1983). In fact, some scholars, for instance, Flaherty and
others, emphasise the importance of “secondary poverty” that refers to those who had
more than primary items but still suffered poverty life styles (Flaherty, et al., 2004).
the core-periphery conflict (or structural) theories. The economic theories refer to
workers moving from low-wage to high-wage countries. This implies the efficient use
of labour and narrows inter-country wage gaps. In contrast to this, the conflict
theories discuss that migration rather widens wage and income disparities because it
occurs between economically and politically unequal units. Meanwhile, there are other
schools of thoughts on labour migration, which emphasise the structural side of
migration. A sociologist, Sassen, takes a Marxist view claiming that in the middle of
1960s there were “significant transformations in the magnitude and composition of
global foreign investment flows … [and] [t]his is also the period of massive new
migrations” (1988: 3). In other words, this means that the subordination of large areas
of the world in the form of a periphery also brought about a shift in the flow of labour
and thus the major international labour flows from the developing countries and went
to meet the labour needs of the developed countries. However, as Ghosh points out,
the realities of contemporary labour migration are “far more complex” than these two
models (1996: 83). Two sociologists, Zai and Wenzhen, support that it is more a sense
of “relative deprivation” or “villa envy” (2001).
RemittancesAccording to OECD, migrant remittances rose 17.3% in 2002, reaching US$149.4
billion and continue to grow (2006: 143). Chart 1 shows the constant growth in
migrant remittances, while other economic indexes, such as foreign direct investment
decreases. Therefore, developing countries and international organisations are keen to
develop the potential use of remittances as a replacement or complement of existing
financial tools.
The remittances are unequally distributed in the world, according to the IMF statistics
(2005). As Chart 2 shows, Asia receives the most (40%-44%), and Latin America and
Caribbean (17%-21%), Eastern Europe (14%-18%), Middle East (10%-13%) and Africa
(10%-12%) follow. The large share of Asia can be explained by the fact that it is the
most populous region and has a large number of diasporas in the world.
Informal channels, for instance, hand-carries by friends or family members, in-kind 1remittances of jewellery or hawala and other consumer goods (OECD, 2006), are not
to be ignored, as in some countries informal remittances range from 10 % to 50 % of
total remittances (Puri and Ritzema, 1999). Meanwhile, some analysts note that due to
better technology and efforts to crack down on money laundering, the unrecorded
remittances are heading down (Ratha, 2005: 43). Therefore, while the recorded
remittances are reported to increase, we do not know how much this increase is
reflected by better reporting or net increase.
While the transfer channels of remittances and the cost they incur are of importance
to migrants who send the remittances and to those who receive them in the migrant
sending communities, this paper is more concerned with the broader economic
impacts of remittances on migrant sending communities.
Economic Impacts on Remittance Receiving CountriesMany studies have adopted the Gini index to empirically evaluate income distribution
114113
effects of remittances. The empirical evidence is fairly mixed. One group of scholars,
such as Ahlburg (1996), and Taylor (1999) discovered positive results confirming the
hypothesis that remittances had an equalising effect on income distribution (e.g.
Tonga and Mexico). For example, the Gini coefficient for total income in Tongan
households declined from 0.37 to 0.34 by receiving remittances. On the contrary,
others, such as Adams (1991), indicate that remittances foster inequality as measured
by the Gini coefficient. This is explained by the finding that better off families are
more able to pay for the costs of migration (Straubhaar and Vãdean, 2006). For
instance, in the Philippines, remittances contributed to a 7.5% rise in rural income
inequality in the 1980s, despite a low share of remittances in the households' income
(Rodriguez, 1998).
Meanwhile, some researchers have used a dynamic model to investigate the dynamics
of migration and income distribution. Stark, Taylor and Yitzhaki (1986, 1988)
analyzed the case in two Mexican villages and discovered that the income distribution
effect of remittances depends critically on the migration history and on the degree to
which migration opportunities are diffused across households. They further suggested
that the dynamics of migration and income distribution would follow an inverse U-
shape relationship. This means that in the early period only wealthy families benefit
due to limited information about migration, causing income inequality to rise. Later,
as poor families obtain information and benefit from remittances, it has an equalizing
effect on income distribution. However, this evidence differs from Milanovic's survey
in Yugoslavia (1987), which found that remittances lead to income divergence and that
the effects differ according to the periods and social categories.
As such, there is no conclusive evidence whether migrants' remittances induce income
convergence or divergence at home countries. According to Straubhaar and Vãdean
(2006), there are two reasons for this. First, there is diversity in the environments
researched in terms of initial inequality. Second, there are differences in the empirical
methods applied, such as “static versus dynamic, with or without endogenous
migration costs, and with or without factoring in the effects of migration on domestic
income sources” (Docquier and Rapport, 2003). They argue that the inequality impact
of remittances and local wage adjustment tend to reinforce each other in the case of
high initial inequality, but may offset one another in the low initial inequality case (c.f.
high inequality in Mexico and low inequality in Yugoslavia).
Having reviewed the existing theoretical and empirical evidences that discuss the link
between migration, remittances and poverty in various migration active countries, we
will closely examine the particular case of Sri Lanka so that a more profound
understanding on such link can be gained.
Poverty Profiles of Sri LankaEconomically, Sri Lanka's GDP was $16.4billion in 2002 (World Bank, 2005b) and its
GDP per capita was at $1,031 in 2004 (Central Bank of Sri Lanka, 2006). It is
considered a lower middle income country and ranks at the 93rd out of 177 countries
on the Human Development Index. It has enjoyed high levels of social indicators, such
as high rate of adult literacy (90.7% in 2004, World Bank, 2006) and life expectancy

116
Profiles of Labour MigrantsTraditionally, Sri Lankans have not been a migrant sending community (Korale,
1983). However, since the early 1970s, there was an exodus of professionally qualified
personnel for foreign employment (Government of Sri Lanka, 1974). The majority
(about 70%) went to developed countries for permanent settlement, while the rest
went to less developed countries, such as African countries, by fixed term work
contracts (Athukorala, 1990). Meanwhile, such contract migration became forefront in
the labour migration process with the opening opportunities in oil producing Middle
East countries. According to the latest survey by SLBFE (2005), the total number of
departures for foreign employment has increased by 1.7% from 209,846 in 2003 to
213,453 in 2004 (Male: 79,979 Female: 133,474). As total population is about
18,797,000 (Census in 2001), the net migrants amount to about 1.1%.
Earnings and RemittancesRemittances from labour migrants into Sri Lanka are increasing (Lasagabaster,
Maimbo and Hulugalle, 2005: 1). Sri Lanka was the 26th in receiving remittances as a
percentage of GDP in 2002 (Lasagabaster, et al., 2005). With regard to the macro
economic arena, Sri Lanka received remittances of US$1.3billion at the end of 2004
(World Bank, 2005a). The data shows that “on a per capita basis, worker's remittances
to Sri Lanka are the highest in South Asia and have exceeded FDI inflows by 2 to 3
times; more than double the net receipts of foreign assistance and reached close to
25% of export earnings, second only to the garment industry and ahead of tourism and
tea” (Lasagabaster, et al. 2005: 1). Remittances amount to 7% of gross domestic
product. According to Rodrigo and Jayatissa, unrecorded remittances are estimated to
account for 13% of total remittances from 1980 to 1985 (1989).
In micro economic terms, about 10% of households are recipient of overseas and
domestic remittances and, according to the 2001-2002 household survey, overseas 4remittances account for 20.7% of total income of recipient households. For the
unskilled temporary migrants to the Middle East, their earnings can be 8 times greater
than those expected at home (Lasagabaster et al. 2005: 2). The survey shows that
about 28% of remittance recipient households stand in the top income quintile and
about 27% stand in the lowest two income quintiles (ibid: 3). Of course, these ratios
would change according to their pre-remittance situation. Lasababaster and others
suggest that if remittances are removed from total household expenditure, nearly 45%
of recipient households stand in the lowest two income quintiles (ibid). While we
cannot conclude here, it is fair to say that remittances can have a significant impact on
recipient households. At the country level, “remittances can help improve a country's
development prospects, maintain macroeconomic stability, mitigate the impact of
adverse shocks, and reduce poverty” (IMF, 2005).
In general, similar research shows that remittances can enable families to maintain or
increase expenditure on basic consumption, housing, education, and small-business
formation and that they can also promote financial development in cash-based
developing economies (IMF, 2005, Lasagabaster et al, 2005).
115
(74.4 years in 2004, ibid.).
According to the Sri Lankan government, the estimated poverty line for the year 2002 2is Rs1,423 (US$13.6) per month (DCS, 2004). Despite many achievements, physical
poverty is prevailing (ADB, 1998: 19) and 22.7% of the population is classified as
below poverty line according to the national level poverty head count (DCS, 2004). Foreign Employment Policy
As one of the national poverty alleviation policies, the government of Sri Lanka has
promoted a foreign employment programme in the last few decades. The former head
of the foreign employment office, Korale, clearly noted that “the government policy on
migration has been guided by … economic advantages” (1983: 16).
Why has foreign employment been promoted in Sri Lanka? There are no concerted
views, but, there is general agreement on three possible reasons. First, the principal
positive objective of migration is withdrawal of surplus labour. Korale argues that the
current emigration for foreign employment of about 180,000 annually has
contributed to lower intensity of the unemployment problem through withdrawal of
surplus labour and also reduction of public protests over the educated unemployment
problem. Second, wage out of foreign employment becomes a source of foreign
exchange. In fact, migrants' remittances, in the form of private transfer are the second
largest source of foreign exchange in Sri Lanka other than earnings from apparel
exports. Some analysts suggest that the remittances contributed to national income
and ease foreign exchange needs, particularly when military expenditures and
government borrowing were increasing (Sriskandarajah, 2003: 267). Third, political
instability due to communal violence has been disturbing the development of
domestic labour markets. Sri Lanka has experienced intensified civil war since the
beginning of 1980s.
Furthermore, the government of Sri Lanka has introduced some other policies on
foreign employment. The government promotes the mechanism of the sending of
remittances through the Sri Lankan banking system to stimulate saving and
investments and discourage lavish consumption (Spaan, 1989:89). The Sri Lankan
Ministry of Labour and the Merchant Bank of Ceylon initiated an orientation
programme in 1981, aimed at the training of returnees who wanted to start business
ventures with their remittances. However, Spaan points out that it brought limited
success. In addition to this, Additional Secretary of the Ministry of Labour Relations
and Foreign Employment noted that the government has a dilemma that it cannot 3control the flow of remittances and use for effective investment.
Labour Migration and RemittancesSri Lankan outward migration in the 1980s and 1990s comprised of four channels: (a)
the temporary migration for employment to the Middle East and other destinations,
(b) more permanent migration arising from brain drain mainly to Western Europe,
North America and Australia, (c) refugee migration, and (d) illegal migration to
destinations such as Japan, Italy, South Korea, Australia and Western Europe via
former Soviet block (Korale, 2004: 301).
118117
Female Domestic WorkersFor the purpose of discussion, we will focus on temporary unskilled migrant workers,
in particular, female workers engaging in domestic labours (Gunatilleke, 1986, 1998,
Spaan, 1989, Brochmann, 1992, 1993, Mook, 1992, Gamburd, 2003). Primary and
secondary data on female migration from Sri Lanka are scarce. They usually focus
exclusively on male migration or gender neutral migration where women appear only
occasionally (Brochmann, 1992: 9).
Profiles of Female MigrantsAccording to the government's statistics, 136,998 (59.32%) of the total number of
departures 230,963 in 2005 were female and 91.28% of the total female workers went
to work as housemaids (SLBFE, 2005). Sri Lanka is one of the few countries which
does not legally constrain female emigration for domestic service (Rodrigo and
Jayatissa, 1989: 256). Though women from Pakistan, India, Bangladesh and the
Philippines were recruited on a small scale as domestic servants, the governments of
Pakistan, India and Bangladesh formally prohibited the recruitment of housemaids,
due to religious values of the Koran and reports of many malpractices (Eelens, Mook
and Schampers, 1992). The majority of 97.3% of total female migrants go to Middle
Eastern countries, such as Saudi Arabia (40.0%), Kuwait (22.8%), Lebanon (12.7%)
and U.A.E (10.9%). Many migrants are from the (commercial) capital city, Colombo or
its neighbouring districts.
Private remittances for year 2005 is Rs.191.8billion (US$1.84billion) and recorded
sources of foreign exchange earnings shows that migrant workers for Middle East
remitted Rs.108.9billion (US$1.04billion) in 2005 of total private remittances, which
consist of 56.8% of all remittances (SLBFE, 2005). Meanwhile, there are no
disaggregate data on how much money female domestic migrants are remitting to
home communities in Sri Lanka. However, an ARTEP study in 1985 showed that the
level of remittances per migrant is between Rs130,000-Rs.150,000 (US$1,248 -
US$1,440). Rodrigo and Jayatissa estimate that “the critical groups appear to be
housemaids and skilled males, who, … accounted between them for 81% of the total
money transferred” (1989: 264).
Motivations to work as domestic worker abroad are said to vary. Gunatilleke argues
that migrant candidates want to earn as much as possible in a short period. However,
he reports that it is unclear if unemployment or conditions in the domestic labour
market were a major push factor (Gunatilleke, 1995). Gunatilleke notes that there is a
shortage in household service in middle or upper income households in Sri Lanka
indicating that young educated female were “no longer prepared to go into low-income
household employment in Sri Lanka.” Some would consider that a job abroad with
higher income will offset the low status of the occupation (Gunatilleke, 1998: 120).
A few studies are available to disclose the details on wage. For instance, Athukorala's
study shows that there is a 8.4times wage differential for housemaids in 1983 as local
wage is at Rs.468 (US$4.4) against Rs.2.911 (US$27.9) (1986). Migrant women's
earnings ranged between Rs.5,000 (US$48.0) to Rs.8,000 (US$76.8) per month,
while female returnees was as low as Rs.2,300 (US$22.0) (INSTRAW and IOM,
2000:128).
Regarding the rate of savings and remittances, the group of housemaid workers mark
other distinctive features. According to two separate surveys conducted in the middle
of 1980s, they have a higher rate of savings (71.9% in MPI, 93.0% in Marga Institute,
1986) and remittances (68.8% in MPI, 70.3% in Marga Institute, 1986) than any other 5skill group. For instance, a high level skill group has 35.6% of remittances.
Though some analysts observe that migrants use different methods, many remit
through bank accounts (Mook, 1992: 122). Here we should note that the origin of
private transfers do not necessarily mean the true origin of remittances and that some
of the Middle East migrants may be using banking channels in West European
countries (Gunatilleke, 1986: 179). Furthermore, it is also important to mention that
migrants saving in receiving countries are not included in private transfers.
Overall, there is little research on the specific channels female housemaid workers use
for remittances. However, one study shows that due to the constraints of work
conditions, housemaids prefer to use informal channels to remit their earnings,
whereas many of women are unaware that their informal contacts do not give them a
fair exchange rate and that they are losing on the transaction (Dias et al. 1999).
Use of RemittancesThere are some small scale studies which were conducted at regional or local levels,
which have mixed results. Like in the rest of the other Asian subcontinent, a majority
of migrant savings goes to “house construction and renovation, in Sri Lanka, this
tendency is confirmed by many surveys on record” (Rodrigo and Jayatissa, 1989:273,
also Gunatilleke, 1986). According to the Marga's survey (1986), housemaids had used
nearly two-thirds of their investments on construction and improvement of houses.
Meanwhile, for male skilled and unskilled workers the corresponding figure was
around 30% and for the middle skill level category, 37%.
Socio-economic Impacts of Migrants RemittancesA limited number of studies have attempted to reveal the link between migrant
remittances and its economic and social impacts on people's welfare in Sri Lanka (See
a comparison table annexed in the end).6 As it is difficult to dissociate remittances
with returnee's use of savings, we aggregate them for the purpose of this thesis.
Economic ImpactsIn terms of economic impacts, as Gunatilleke argues, in the absence of detailed
surveys of the patterns of consumption and investment of migrants and their families,
it is difficult to make reliable and representative generalisations (1986: 188). However,
there are some interesting findings in economic impacts.
As we saw the Mexican case in the literature review section (Stark, Taylor and
Yitzhaki, 1986, 1988), small scale studies show that the use of the remittances and
income from foreign employment depends a great deal on the type of community and
the migrants' socio-economic background, as we found in economic impacts on

120
remittances may be surmised to have played a contributory role helping to moderate
the widening of distributional disparities at the national level under the open economy
strategy (1989: 285).
Social ImpactsFor social impacts, reports point out a wide range of elements, including “the steep
increase in incomes, the relatively long separation of family members, the exposure of
low-income social strata to a foreign environment, and the high rate of female
participation (INSTRAW/IOM, 2000, Korale, 1983). They may further trigger various
social changes, ranging from the lowering of fertility and some alleviation of poverty,
to an improvement in the status and role of women and changes in life-styles and
values (Gunatilleke, 1986: 206, Brochmann, 1993).
Other social effects include a possible change in women's role in families. Some
studies show that this depends on which family members migrate male or female.
Dias finds that in almost every households experience change of gender role and when
a husband migrates, women tend to cope well by taking a double role of household
chief and wife (1983). Dias further mentions that women are most likely to spend
earnings prudently and luxurious articles found in the surveyed households were
more often brought by male migrants upon return (Dias, 1983).
Furthermore, other studies discussed the negative impacts on families due to negative
impacts of the long separation of spouses (e.g. husbands' drinking problems,
Gamburd, 2004). For example, the incidence of divorce among migrants appears to be
above average (Gunatilleke, 1986: 208). Meanwhile, Dias concludes that the impact of
the migration on rural families are not adverse as in most cases the structures of
kinship and extended family relations can cope with the problem and there is no
evidence of neglect of children or unusual increase of school drop out. On the
contrary, Dias's survey on single parent migrants shows that it is in the urban lower
income groups that absence and separation have led to neglect of children and to
serious disorganisation of family life (in Gunatilleke, 1986: 209). In a sample of 100
female migrants, one found that 64 were able to make arrangements with grand-
parents or elderly for the care of the children left behind. Thirty-four had to leave
children with working fathers who could not provide adequate care. Therefore, the
evidence suggests that the impacts on family relations are mixed. Shaw, however,
cautioned that the children of women working overseas bear a disproportionate share
of the costs of migration, with above average rates of under-nutrition and weaker
educational performance (Shaw, 2005).
In summing social impacts, we can emphasise that there is no concluding evidence.
The disorientation of the migrant and his or her family may vary. While some studies
indicate that migrants and families have been capable of a relatively balanced and
stable adjustment to the emigration and its experience, others have emphasised that
such situation depends on kinship and social networks.
Impacts on Poverty AlleviationThere are only a few studies that attempted to reveal the impact of remittances on
119
remittance receiving countries in the literature review. Two of the most significant
sectors which are associated with migrants' impact are housing and self employment
(Gunatilleke, 1986). Particularly, housing is “reported to receive high priority by most
migrants and their families” (ibid. 188). Such investments include “purchase of land,
construction of new houses, repairs and extensions of existing houses, redemption of
mortgages and liquidation of debts” (ibid.). Meanwhile, incomes are used to create
new employment to invest in an income earning piece of equipment such as a tractor,
truck or van or setting up small trading enterprises or grocery stores. Dias quoted that
3 families out of a total of 90 migrant households set up in trade and one opened a
lathe workshop providing employment to four others, and another purchased three
acres of agricultural land (1983).
Worker remittances not only assured the viability of the external payment system, but
also avoided Sri Lanka falling into a severe external debt-trap over the period after
1979. Furthermore, the regular flows of inward remittances helped to a significant
extent to maintain the country's liberalised trade and payments strategy and the
flexible exchange rate system of the post 1977 policy package (Rodrigo and Jayatissa,
1989:281 and Sriskandarajah, 2003:267).
Meanwhile, one of the most beneficial effects of the Middle East migration is the
improvement in the unemployment problem through the withdrawal of surplus labour
(Gunatilleke, 1986: 193), as we discussed relevant evidence in the literature review
(Ghosh, 1996). With more than 50% of unskilled migrants, Gunatilleke argues that
this would have directly reduced the backlog of unemployment, by quoting the decline
of unemployment from 14.8% in 1978-79 to 11.8% in 1981-82 (1986: 193). Also, as the
participation of the female work force increased, the unemployment rate, particularly
among the young overtook that of the males. Therefore, we can assume that female
unskilled workers took the opportunities eagerly.
Concerning distribution of remittances within households, unfortunately, there is no
adequate statistical information available to analyse distributional dimensions of the
migration phenomenon in depth. However, some researchers attempted to link them
(see Rodrigo and Jayatissa, 1989). Consumer finance survey reveals that (a) 2.6% of
the spending units have been receiving dependent allowances from abroad during the
survey year, (b) transfer incomes from abroad accounted for 3.03 % of the total
income of the households involved. The leverage that the phenomenon has exerted on
the income distribution at the lower end of the scale should be noted. Meanwhile, as
Chart 4 shows, Shaw's study in Hambantota suggests the following two interesting
results. First, families of migrants and returnees enjoy more incomes. Second,
returnees' households show a higher percentage of participation of microenterprise
activity than any other household (migrant-sending and non-migrant).
While lifting many migrant households over the poverty line (at least initially),
migration has simultaneously created a new class of incomes in the existing hierarchy.
Rodrigo and Jayatissa find that, compared to the 9 point increase of Gini coefficient in
1973 and 1978-1979, the increase in the figure of the consumer finance surveys of
1978-79 and 1981-82 is marginal (from 44 to 45). Thus, they assume that worker

122121
poverty alleviation in Sri Lankan. Gunatilleke assumes that about 75% of the migrants
come from the bottom four income deciles (1986:207). This means that 11% of low
income households had an opportunity to move out of poverty from 1976 to 1982.
However, the depth of the poverty alleviation effect and its sustainability will depend
on the background of migrants and families and the prudent use of resources. There
are a few studies, giving varying accounts of the improvements of households as a
result of labour migration, for instance Tilakasiri and De Silva (1981) and Dias (1983).
Their studies confirm that migrant households succeed in improving their life
conditions. The major findings include (a) all families of labour migrants employed in
the Middle East hold bank accounts, while prior to 1976 only 28% of the household
did, (b) all households posses cassette recorders, electric clocks, foreign clothes and
various foreign made articles, (c) 55% of the households buy new furniture and 75%
obtain electricity, (d) there is a greater desire to provide better schooling and tuition
for school children, (e) thefts and robberies virtually disappear in the surveyed areas.
On the contrary, Dias' findings were less favourable. His observations include (a) rural
migrants spend earnings on short term improvement of their family's living standards,
while there was no evidence of conspicuous consumption, (b) only a few families could
save, (c) there is no decrease in the number of food stamp holders, (d) in most cases
the well-being was temporary, and only lasts until the migrant returned. While the
findings from two studies draw interesting aspects of social conditions of labour
migrants' households, we still cannot conclude because they are limited to particular
locations and are not sufficiently representative. Besides, these two studies did not
provide specific impacts unique to female migrants, which are the most visible feature
of Sri Lankan migration.
Discussion While theoretical debates on causality of migration and poverty are unresolved
(Skeldon, 2005:256), the Sri Lankan case shows that remittances give positive
leverage of increase of income of almost all households that sent migrants. To answer
the research question, we could argue that international migrants' remittances in
general can positively help poverty alleviation in Sri Lanka. But its effect is rather
limited as a short-term income maintenance support to households particularly for
contract migrants from poorer income group. It cannot become a durable safeguard
tool guaranteeing a way out of poverty. Why is that? One of the reasons may result
from structural settings in Sri Lanka. The Sri Lankan government has adopted pro-
foreign employment policy as adjusting a change in economic structure since 1970s.
As a consequence, some migrants and their families benefited from an increased
income (e.g. better education of children, de Bruijn, et al. 1992), while also losing lost
social and family values and changing behaviours.
However, in relation to a notion of poverty and inequality, we should note that
migration stimulates potential growth of relative deprivation, as Skeldon argued
(2005). As a number of Sri Lankan migrants decide to migrate based on the verbal
information of ex-migrants, “chain migration” has been observed (Spaan, 1989). We
could argue that there is a cyclical relation between inequality, migration and
remittances. On inequality, regional economic disparity needs to be emphasised as a
possible structural variable when discussing the case of Sri Lanka.
In this context, we must be aware that we cannot be fully confident that remittances
are efficient development tools, which can be replaced traditional development tools,
such as official development aid. Rather, we need to be reminded of downsides like a
possible loss of familial or social values.
ConclusionWith the increase of international remittances, this thesis has attempted to unpack the
myth of “usefulness” of migrants' remittances in alleviating poverty in developing
countries, namely in Sri Lanka. To fulfill this aim, we have first reviewed the available
literatures and found three major arguments. First, the correlation between migration
and poverty remains debated. There are two migration theories, but they cannot
capture the real and entire picture of international labour migration today. The debate
results from complex nature of migration and poverty. Second, remittances have
increased but there is a difficulty in estimating the real amount because of diversity of
channels. Third, economic impacts of remittances in many parts of the world vary,
which depends on socio-economic variables.
The country case of Sri Lanka has challenged the applicability of the findings of the
literature review. First, the study illustrated that there are more female migrants
unlike other migrant sending countries and their patterns of migration and
remittances differ from others. Second, small scale studies indicate that there are
some positive evidences confirming economic impacts of remittances on poorer
households. However, thirdly, social impacts, such as including pressure of household
and adverse effects of children were also evidenced.
The discussion part reemphasised the arguments by debating findings from the
literature and the country case. We confirmed that international remittances to Sri
Lanka have given some positive impacts in poverty alleviation by increasing income.
However, its effect is generally not lasting and it tends to further bring the sense of
relative poverty to non-migrants. Also, we found that the short term merit of
remittances may result from national policy of promotion of foreign employment for
macro economics benefits. Therefore, we argue that the analysis of remittances and of
their impacts on home countries still needs to take into account broader socio-
economic variables.
In the process of progressing this research and arguments, we have encountered
various problems, mainly lack of reliable data and conceptual debates of terminologies
or phenomena, such as “poverty” and “migration.” These difficulties bring us back to
the questions; what constitutes “poverty”, how far public policy is able to address the
challenge of poverty alleviation by using remittances, whether the government can
intervene optimally in migration management and address the challenge to mitigate
regional economic disparity. To be able to answer these questions further empirical
research is needed.
Ayako Kageyama, is a postgraduate scholar at the London School of Economics and
Political Science.

124
Schampers T., and Speckmann, J.D. (eds.), Labour Migration to the Middle East: From Sri
Lanka to the Gulf, London: Kegan Paul International.lDepartment of Census and Statistics (2004) Official Poverty Line for Sri Lanka, June 2004.lDe Prabal, K. and Ratha, D. (2006) International Migration Behaviour and Impact of
Remittances on Human Capital: Evidence from Sri Lanka Integrated Household Survey,
unpublished.lDias, M. (1983) Migration to the Middle East: Sri Lanka Case Study, Colombo: Ministry of
Plan Implementation.lDias, M. and Jayasuriya, R. (1999) Sri Lanka: Good Practice to Prevent Women Migrant
Workers Going into Exploitative Forms of Labour, Geneva: ILO.lDocquier, F. and H. Rapoport (2003) Remittances and Inequality: A Dynamic Migration
Model, IZA Discussion Paper No. 808, Institute for the Study of Labor, Bonn.lEelens, F., Mook, T. and Schampers, T. (1992) Introduction, in Eelens, F., Schampers T.,
and Speckmann, J.D. (eds.), Labour Migration to the Middle East: From Sri Lanka to the
Gulf, London: Kegan Paul International.lEl-Qorchi, M. (2002) Hawala, Finance and Development, vol.39, no.4, Washington D.C.:
IMF.lEngelen, E. (2005) Migration and the Contemporary Welfare State, in World Migration
2005, Geneva: IOM.lFarrant, M., MacDonald, A., and Sriskandarajah, D. (2006) Migration and Development:
Opportunities and Challenges for Policymakers, IOM Migration Research Series No. 22,
Geneva: IOM.lFlaherty, J. Veit-Wilson, J. and Dornan, P. (2004) Poverty: The Facts, London: Child
Poverty Action Group.lGalbraith, J. (1979) On Migration, in The Nature of Mass Poverty, Boston: Harvard
University Press.lGamburd, M. (2003) Breadwinner No More, In Ehrenreich and Hochschild, Global
Woman: Nannies, Maids and Sex Workers in the New Economy, London: Granta Books.lGamburd, M. (2004) The Economics of Enlisting: A Village View of Armed Service, in
Winslow, D. and Woost, M.D., Economy, Culture, and Civil War in Sri Lanka, Bloomington:
Indiana University Press.lGhosh, B. (1996) Economic Migration and the Sending Countries, van den Broeck (ed), The
Economics of Labour Migration, pp. 77- 113, Cheltnham: Edward Elgar.lGoldin, I. and Reinert, K. (2006) Globalization for Development: Trade, Finance, Aid,
Migration, and Poverty, Washington D.C.: World Bank and MacMillan.lGunatilleke, G. (1986) Sri Lanka, Migration of Asian Workers to the Arab World, Tokyo:
UNU.lGunatilleke, G. (1995) The economic, demographic, sociocultural and political setting of
emigration from Sri Lanka, International Migration, XXXIII, 3/4, pp. 669-97.lGunatilleke, G. (1998) Macroeconomic Implications of International Migration from Sri
Lanka, in Appleyard, R. (ed.) Emigration Dynamics in Developing Countries, II: South
Asia, Hants: Ashgate.lIMF (2005) World Economic Outlook: Globalization and External Imbalances (Chapter
20), Washington D.C.: the World Bank.lINSTRAW and IOM (2000) Temporary Labour Migration of Women: Case Study of
Bangladesh and Sri Lanka, United Nations International Research and Training Institute
for the Advancement of Women (INSTRAW) and International Organization for Migration
(IOM). lIOM (2005) Labor Migration in Asia: Protection of Migrant Workers, Support Services and
Enhancing Development Benefits, Co-report by IOM, DFID and ADB. Geneva: IOM.lKorale, R.B.M. (1983), Migration for Employment to the middle East: Its Demographic and
Socio-economic Effects, Colombo: Ministry of Plan Implementation.lLasagabaster, E., Maimbo, S.M. and Hulugalle, S. (2005) Sri Lanka's Migrant Labor
123
The author gratefully acknowledges valuable comments and encouragement from
Dr. Hartley Dean and Dr. Hanne Beirens and generous provision of statistics from
M. M. Deshapriya.
Endnotes1 This is one of informal remittance systems, meaning transfer, mainly done in Bangladesh
and Pakistan. It is known as underground banking, ethnic banking and informal value
transfer systems (El-Qorchi, 2002 and Mamibo, Adams, Aggarwal and Passas, 2005; 43-
46). See Chart 3.2 A currency rate we use in this thesis is; Sri Lankan rupee = US$ 0.0096, or, Sri Lankan
rupees 1,000 = US$ 9.6 (Bloomsberg, August 22, 2006).3 The author interviewed this high ranking officer in his office on April 8, 2005.4 “Approximately one person from every 50 households has migrated, and during the past 5
years, on the average a member from 5%-6% of all households has benefited from foreign
employment.” (Korale, 1983: 19)5 Note that the number of sample for this group is low as 8 and 3.6 See Korale, 1983, Bruijn, Schampers, Speckmann and Zijleman, 1992, De Prabal and Ratha,
2006.
ReferenceslAdams, R.H. (1991) The Effects of International Remittances on Poverty, Inequality and
Development in Rural Egypt, Research Report No.96, International Ford Policy Research
Institute.lAdams, R.H. and Page, J. (2005) Do International Migration and Remittances Reduce
Poverty in Developing Countries? World Development, vol. 33, no. 10, pp. 1645-1669.lADB (1998) Social Sector Development in Sri Lanka: Issues and Options: A Background
Study Prepared for the 1998-2001 Country Operational Strategy, Manila: ADB.lAhlburg, D.A. (1996) “Remittances and the Income Distribution in Tonga”, Population
Research and Policy Review, Vol. 15(4), pp. 391-400.lAsian Regional Team for Employment Promotion, ARTEP (1985) Impact of Out and
Return migration on Domestic Employment in Sri Lanka: A Preliminary Analysis,
Bangkok: Mimeo. lAthukorala, P. (1986) Sri Lanka's experience with international contract migration and
reintegration of return migrants, International Migration for Employment, Working Paper
26, Geneva: ILO.lAthukorala, P. (1990), International Contract Migration and the Reintegration of Return
Migrants: The Experience of Sri Lanka, International Migration Review, vol. 24, no. 2,
Special Issue: Labor Recruiting Organizations in the Developing World, Summer, pp. 323-
346.lBrochmann, G. (1992) Sri Lankan Housemaids in the Middle East: An Avenue for Social
and Economic Improvement?, in Shampers, F.E. and Speckmann, J.D. (eds.) Labour
Migration to the Middle East: From Sri Lanka to the Gulf, London: Kegan Paul
International.lBrochmann, G. (1993) Middle East Avenue: Female Migration from Sri Lanka to the Gulf,
Oxford: Westview Press.lCastles, S. and Miller, M. (2003) The Age of Migration: International Population
Movements in the Modern World, New York: Guilford Press.lCentral Bank of Sri Lanka (2006) National Output and Expenditure, available at
http://www.centralbanklanka.org/y-gdp_National%20_%20Out_Exp.html. Accessed on
August 23, 2006.lDean, H. (2002) Welfare Rights and Social Policy, Harlow: Prentice Hall.lDe Bruijn, B.J., Shampers, T., Speckmann, J.D. and Zijleman, E. (1992), Labour Migration,
Household Structure and their Impact on the Well-Being of Children, in Eelens, F.,

126125
Remittances: Enhancing the Quality and Outreach of the Rural Remittance Infrastructure,
Policy Research Working Paper 3789, Washington D.C.: World Bank.lLewis, G. (2003), Migrants, in Alcock, P., Erskine, A. and May, M. (eds) The Student's
Companion to Social Policy, Oxford: Blackwell.lLister, R. (2004) Poverty, Cambridge: Polity Press.lMaimbo, S., Adams, R., Aggarwal, R. and Passas, N. (2005) Migrant Labor Remittances in
South Asia, Washington D.C.: World Bank. lMaimbo, S.M. and Ratha, D. (2005) Remittances: Development Impact and Future
Prospects, Washington D.C.: The World Bank.lMarga Institute (1986) Migrant Workers to the Arab World, Colombo.lMilanovic, B. (1987) Remittances and Income Distribution, Journal of Economic Studies,
14 (5) pp. 24-37.lMinistry of Plan Implementation Survey (1985) Foreign Employment: Sri Lanka
Experience, Employment and Manpower Planning Division, Colombo.lMook (1992) Midddle East Migration at the Micro-Level: A village Case-Study, in Eelens,
F., Schampers T., and Speckmann, J.D. (eds.), Labour Migration to the Middle East: From
Sri Lanka to the Gulf, London: Kegan Paul International.lOECD (2005) Migration, Remittances and Development, Paris: OECD.lOECD (2006) International Migration Outlook, No. 18, SOPEMI, Paris: OECD.lOlesen, H. (2002) Migration, Return and Development: An Institutional Perspective, in
van Hear, N. and Sorensen, N.N. (eds.), The Migration-Development Nexus, Geneva: IOM. lPiachaud, D. (1987) Problems of the Definition and Measurement of Poverty, Journal of
Social Policy, Volume 116, Issue 2, pp. 147-164.lPuri, S. and Ritzema, T. (1999) Migrant Worker Remittances, Micro Finance, and the
Informal Economy: Prospects and Issues, Working Paper 21, Geneva: International Labour
Organization, Social Finance Unit. Available at http://www.ilo.org/public/english
/employment/ finance/papers/wpap21.htm.lRatha, D. (2005) Worker's Remittances: An Important and Stable Source of External
Development Finance, in Maimbo, S.M. and Ratha, D. (2005), Remittances: Development
Impact and Future Prospects, Washington D.C.: The World Bank.lRodriguez, E. (1998) “International Migration and Income Distribution in the Philippines”,
Economic Development and Cultural Change, Vol. 46(2), pp. 329-350.lRodrigo, C. and R.A. Jayatissa (1989) "Maximising Benefits from Labour Migration:
Thailand" In Amjad (ed.) 1989a, pp.255-303.lRowntree, B.S. (1901) Poverty: a study of town life, London: Macmillan.lSassen, S. (1988) The Mobility of Labor and Capital: A study in international investment
and labor flow, Cambridge: Cambridge University Press.lSen, A. (1983) Poor, Relatively Speaking, Oxford Economic Papers, Volume 35, Issue 1, pp.
153-169.lShaw, J. (2005) Overseas migration in the household economies of microfinance clients:
evidence from Sri Lanka, Shaw (ed), Remittances, Microfinance and Development: building
the links, vol. 1 Global View, The Foundation for Development Cooperation, Brisbane.lSkeldon, R. (2005) Migration and Poverty: Some Issues in the Context of Asia, World
Migration 2005, pp. 253-268, Geneva: International Organization for Migration.lSpaan, E. (1989) Labour Migration from Sri Lanka to the Middle East, Leiden: University
of Leiden, Institute of Cultural Anthropology and Sociology of Non-Western Societies, ICA
publication no. 83.lSri Lanka Bureau of Foreign Employment (2004) Annual Statistical Report of Foreign
Employment, Battaramulla: SLBFE.lSri Lanka Bureau of Foreign Employment (2005) Annual Statistical Report of Foreign
Employment, Battaramulla: SLBFE.lSriskandarajah, D. (2003) The Migration-Development Nexus: Sri Lanka Case Study, in
van Hear and Sorensen, N.N. (eds.) The Migration-Development Nexus, Geneva: IOM.
lStark, O., J.E. Taylor and S. Yitzhaki (1986) “Remittances and Inequality”, The Economic
Journal, No. 96, pp. 722-740. Stark, O., J.E. Taylor and S. Yitzhaki (1988) “Migration
Remittances and Inequality: A Sensitivity Analysis using the Extended Gini Index”, Journal
of Development Economics, No. 28, pp. 309-322.lStraubhaar, T. and Vãdean, F.P. (2006) International Migrant Remittances and their Role
in Development, in OECD, International Migration Outlook, No. 18, SOPEMI, Paris:
OECD.lTaylor, J.E. (1999) “The New Economics of Labor Migration and the Role of Remittances”,
International Migration, Vol. 37(1), pp. 63-86.lTaylor, S. (2005) From Border Control to Migration Management: The Case for a Paradigm
Change in the Western Response to Transborder Population Movement, Social Policy and
Administration, vol. 39, no. 6, December, pp. 563-586.lTownsend, P. (1979) Poverty in the United Kingdom: a survey of household resources and
standards of living, Harmondsworth: Penguin.lWalker, R. (2005) Social Security and Welfare: Concepts and Comparison, Berkshire: Open
University Press.lWorld Bank (2005a) Global Economic Prospects: Economic Implications of Remittances
and Migration 2006, Washington D.C.: the World Bank.lWorld Bank (2005b) Sri Lanka at a glance, November 2005, available at
http://devdata.worldbank.org/AAG/lka.aag.pdflWorld Bank (2006) World Development Indicators, Washington D.C.: the World Bank.lZai, L. and Wenzhen, Y. (2001) From Fujian to New York: Understanding the New Chinese
Immigration, in Kyle, D. and Koslowski, R. (eds.), Global Human Smuggling: Comparative
Perspectives, The Johns Hopkins University Press.
Annexes
Chart 1 Migrants' Remittances and Other Capital Flows to Developing Countries 1988-2002
Billions of US$
Note: Remittances refer to the sum of the compensation of employees, worker’s remittances and other current transfers in other sectors. Official flows include general government transfers both current and capital.
Source: IMF, Balance of Payments Statistics Yearbook , various issues.
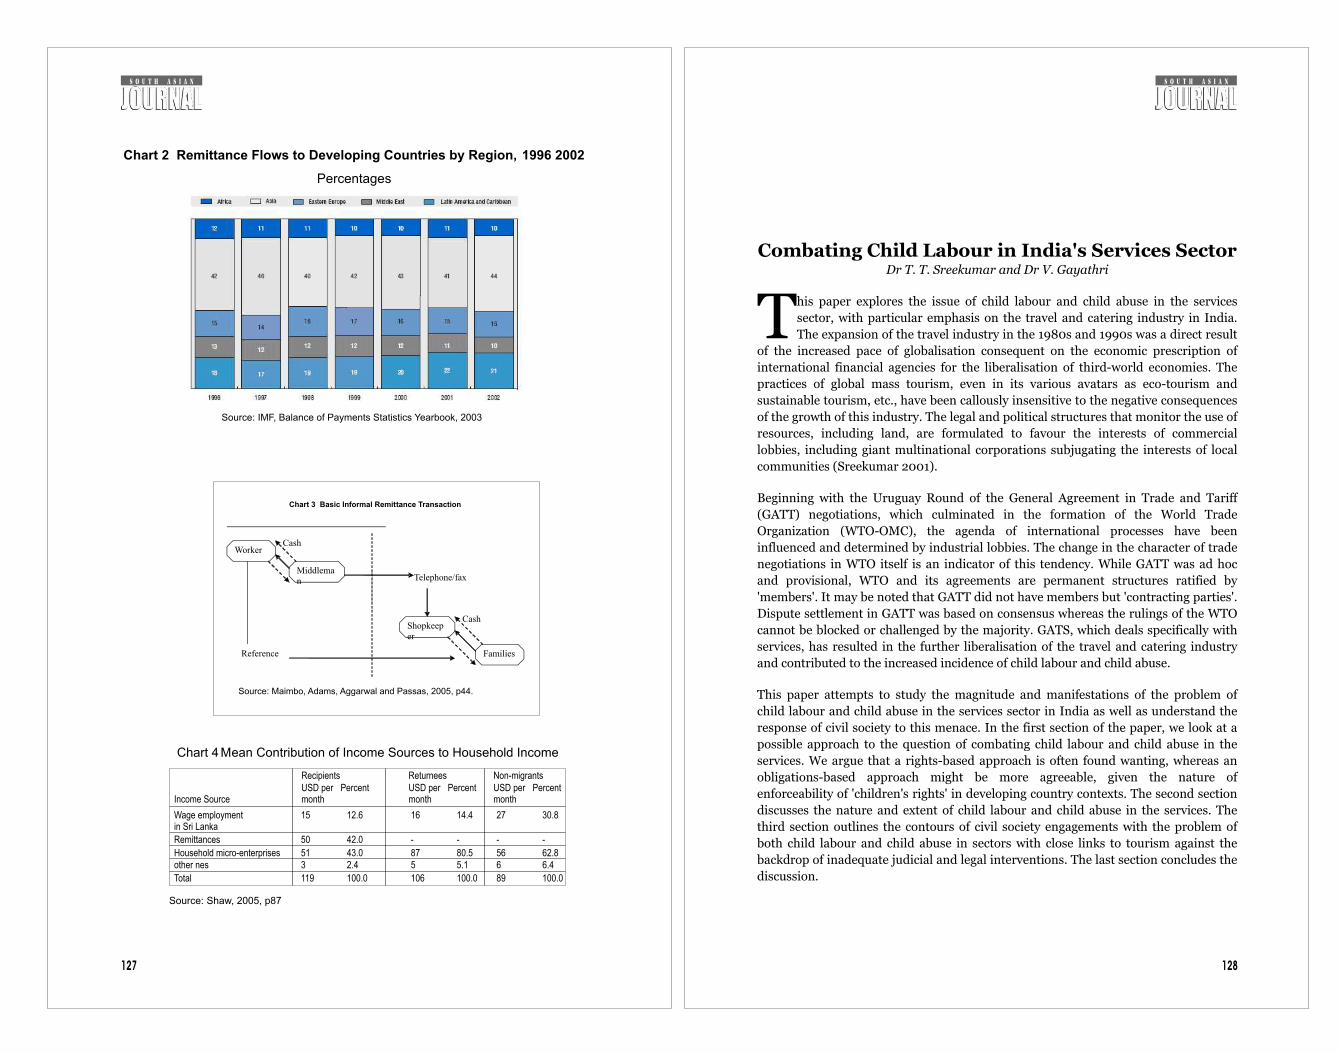
Combating Child Labour in India's Services SectorDr T. T. Sreekumar and Dr V. Gayathri
his paper explores the issue of child labour and child abuse in the services
sector, with particular emphasis on the travel and catering industry in India.
The expansion of the travel industry in the 1980s and 1990s was a direct result Tof the increased pace of globalisation consequent on the economic prescription of
international financial agencies for the liberalisation of third-world economies. The
practices of global mass tourism, even in its various avatars as eco-tourism and
sustainable tourism, etc., have been callously insensitive to the negative consequences
of the growth of this industry. The legal and political structures that monitor the use of
resources, including land, are formulated to favour the interests of commercial
lobbies, including giant multinational corporations subjugating the interests of local
communities (Sreekumar 2001).
Beginning with the Uruguay Round of the General Agreement in Trade and Tariff
(GATT) negotiations, which culminated in the formation of the World Trade
Organization (WTO-OMC), the agenda of international processes have been
influenced and determined by industrial lobbies. The change in the character of trade
negotiations in WTO itself is an indicator of this tendency. While GATT was ad hoc
and provisional, WTO and its agreements are permanent structures ratified by
'members'. It may be noted that GATT did not have members but 'contracting parties'.
Dispute settlement in GATT was based on consensus whereas the rulings of the WTO
cannot be blocked or challenged by the majority. GATS, which deals specifically with
services, has resulted in the further liberalisation of the travel and catering industry
and contributed to the increased incidence of child labour and child abuse.
This paper attempts to study the magnitude and manifestations of the problem of
child labour and child abuse in the services sector in India as well as understand the
response of civil society to this menace. In the first section of the paper, we look at a
possible approach to the question of combating child labour and child abuse in the
services. We argue that a rights-based approach is often found wanting, whereas an
obligations-based approach might be more agreeable, given the nature of
enforceability of 'children's rights' in developing country contexts. The second section
discusses the nature and extent of child labour and child abuse in the services. The
third section outlines the contours of civil society engagements with the problem of
both child labour and child abuse in sectors with close links to tourism against the
backdrop of inadequate judicial and legal interventions. The last section concludes the
discussion.
128
Chart 2 Remittance Flows to Developing Countries by Region, 1996 2002
Percentages
Source: IMF, Balance of Payments Statistics Yearbook, 2003
Worker
Middleman
Shopkeeper
FamiliesReference
Telephone/fax
Cash
Cash
Chart 3
Basic Informal Remittance Transaction
Source: Maimbo, Adams, Aggarwal and Passas, 2005, p44.
Chart 4 Mean Contribution of Income Sources to Household Income
Source: Shaw, 2005, p87
127
RecipientsUSD permonth
PercentReturneesUSD permonth
PercentNon-migrantsUSD permonth
PercentIncome Source
Wage employmentin Sri Lanka
Remittances
Household micro-enterprisesother nes
15
50
513
Total 119
12.6
42.0
43.02.4
100.0
16
-
875
106
14.4
-
80.55.1
100.0
27
-
566
89
30.8
-
62.86.4
100.0
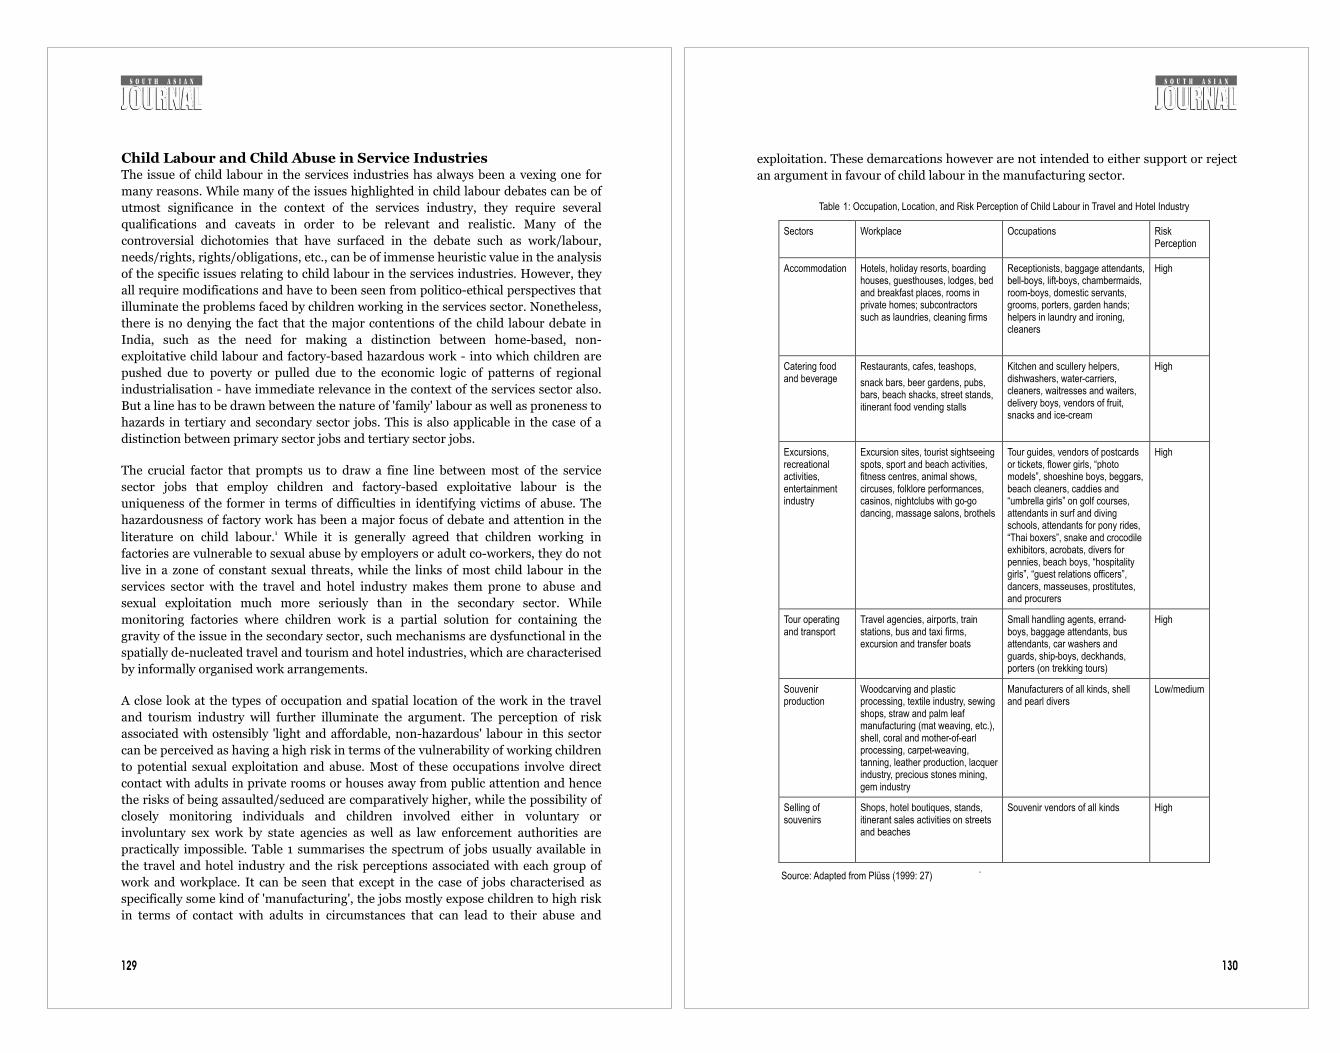
Child Labour and Child Abuse in Service IndustriesThe issue of child labour in the services industries has always been a vexing one for
many reasons. While many of the issues highlighted in child labour debates can be of
utmost significance in the context of the services industry, they require several
qualifications and caveats in order to be relevant and realistic. Many of the
controversial dichotomies that have surfaced in the debate such as work/labour,
needs/rights, rights/obligations, etc., can be of immense heuristic value in the analysis
of the specific issues relating to child labour in the services industries. However, they
all require modifications and have to been seen from politico-ethical perspectives that
illuminate the problems faced by children working in the services sector. Nonetheless,
there is no denying the fact that the major contentions of the child labour debate in
India, such as the need for making a distinction between home-based, non-
exploitative child labour and factory-based hazardous work - into which children are
pushed due to poverty or pulled due to the economic logic of patterns of regional
industrialisation - have immediate relevance in the context of the services sector also.
But a line has to be drawn between the nature of 'family' labour as well as proneness to
hazards in tertiary and secondary sector jobs. This is also applicable in the case of a
distinction between primary sector jobs and tertiary sector jobs.
The crucial factor that prompts us to draw a fine line between most of the service
sector jobs that employ children and factory-based exploitative labour is the
uniqueness of the former in terms of difficulties in identifying victims of abuse. The
hazardousness of factory work has been a major focus of debate and attention in the 1literature on child labour. While it is generally agreed that children working in
factories are vulnerable to sexual abuse by employers or adult co-workers, they do not
live in a zone of constant sexual threats, while the links of most child labour in the
services sector with the travel and hotel industry makes them prone to abuse and
sexual exploitation much more seriously than in the secondary sector. While
monitoring factories where children work is a partial solution for containing the
gravity of the issue in the secondary sector, such mechanisms are dysfunctional in the
spatially de-nucleated travel and tourism and hotel industries, which are characterised
by informally organised work arrangements.
A close look at the types of occupation and spatial location of the work in the travel
and tourism industry will further illuminate the argument. The perception of risk
associated with ostensibly 'light and affordable, non-hazardous' labour in this sector
can be perceived as having a high risk in terms of the vulnerability of working children
to potential sexual exploitation and abuse. Most of these occupations involve direct
contact with adults in private rooms or houses away from public attention and hence
the risks of being assaulted/seduced are comparatively higher, while the possibility of
closely monitoring individuals and children involved either in voluntary or
involuntary sex work by state agencies as well as law enforcement authorities are
practically impossible. Table 1 summarises the spectrum of jobs usually available in
the travel and hotel industry and the risk perceptions associated with each group of
work and workplace. It can be seen that except in the case of jobs characterised as
specifically some kind of 'manufacturing', the jobs mostly expose children to high risk
in terms of contact with adults in circumstances that can lead to their abuse and
exploitation. These demarcations however are not intended to either support or reject
an argument in favour of child labour in the manufacturing sector.
Table 1: Occupation, Location, and Risk Perception of Child Labour in Travel and Hotel Industry
Sectors
Workplace Occupations Risk Perception
Accommodation
Hotels, holiday resorts, boarding houses, guesthouses, lodges, bed and breakfast places, rooms in private homes; subcontractors such as laundries, cleaning firms
Receptionists, baggage attendants, bell-boys, lift-boys, chambermaids, room-boys, domestic servants, grooms, porters, garden hands; helpers in laundry and ironing, cleaners
High
Catering food and beverage
Restaurants, cafes, teashops,
snack bars, beer gardens, pubs, bars, beach shacks, street stands, itinerant food vending stalls
Kitchen and scullery helpers, dishwashers, water-carriers, cleaners, waitresses and waiters, delivery boys, vendors of fruit, snacks and ice-cream
High
Excursions, recreational activities, entertainment industry
Excursion sites, tourist sightseeing spots, sport and beach activities, fitness centres, animal shows, circuses, folklore performances, casinos, nightclubs with go-go dancing, massage salons, brothels
Tour guides, vendors of postcards or tickets, flower girls, “photo models”, shoeshine boys, beggars, beach cleaners, caddies and “umbrella girls” on golf courses, attendants in surf and diving schools, attendants for pony rides, “Thai boxers”, snake and crocodile exhibitors, acrobats, divers for pennies, beach boys, “hospitality girls”, “guest relations officers”, dancers, masseuses, prostitutes, and procurers
High
Tour operating and transport
Travel agencies, airports, train stations, bus and taxi firms, excursion and transfer boats
Small handling agents, errand-boys, baggage attendants, bus attendants, car washers and guards, ship-boys, deckhands, porters (on trekking tours)
High
Souvenir production
Woodcarving and plastic processing, textile industry, sewing shops, straw and palm leaf manufacturing (mat weaving, etc.), shell, coral and mother-of-earl processing, carpet-weaving, tanning, leather production, lacquer industry, precious stones mining, gem industry
Manufacturers of all kinds, shell and pearl divers
Low/medium
Selling of souvenirs
Shops, hotel boutiques, stands, itinerant sales activities on streets and beaches
Souvenir vendors of all kinds High
Source: Adapted from Plüss (1999: 27)
.
130129

132
neither universal nor perfect but does not have any corresponding right. Nonetheless,
as O'Neill points out, “Although imperfect obligations lack corresponding rights, their
fulfilment has not traditionally been thought of as optional: the very term imperfect
obligations tells us that what is left optional by a fundamental imperfect obligation is
selection not merely of a specific way of enacting the obligation but of those for whom
the obligation is to be performed.” (Ibid: 191). Imperfect obligations need to be
institutionalised, and institutionalisation of the ways that specify for whom the
obligation is to be performed is perhaps the only route through which these can be
claimed.
An approach based on obligations rather than rights has both ethical and political
significance. Moreover, the rights-based approach is flawed in believing that children
are an oppressed group whose problems can be resolved if they had a claim to
fundamental rights. Civil society interventions on behalf of children, particularly in
the services sector, have highlighted the need for an approach based on social
obligations rather than purely on children's rights. Children in the developing world
have a baggage of manifesto rights like those enshrined in the constitutions of their
respective countries or international organisations. O'Neill gives the example of the
United Nations Declaration of the Rights of the Child, which includes 'the right to
grow and develop in health', the right to receive an atmosphere of affection and of
moral and material security, and to an education which will promote general culture
etc. For him, “none of these rights is well formed as an enforceable claim; but can be
seen as ideals that should inform the construction of institutions that secure
enforceable claims” (Ibid: 201).
While the problem of children who are commercially and sexually exploited and
trafficked as well as those who are not trafficked but face situations of similar abuse
are different from the position of children who are placed in work situations/locations
that makes them vulnerable to abuse, the nature of psychological and ethical pressure
on these three different groups is likely to be similar and painful. The problem of child
labour and child sexual abuse in the travel and hotel industry has become acute, and
civil society interventions in this area has become correspondingly intense and
focused. Before we discuss how civil society attempts to address the issue of child
labour and child abuse in the services, we take a look at the magnitude of the issue.
The Impact of Tourism on Child Labour and Child AbuseThe growth of the travel industry in the last few decades has been phenomenal. It has
become the fourth-largest economic activity in the world, surpassed only by
armaments, petroleum, and motor vehicles. World tourist arrivals increased from 25.3
million in 1950 to 698.8 in 2000. But it is immediately striking that the bulk of tourist
arrivals was in developed countries. Receipts from international tourism have also
been steadily increasing at a rate of 7 percent per annum since 1992. In 2000, receipts
totalled US$475.4 billion, which would be approximately 1.5 percent of world GDP.
Identified as one of the major high-growth industries of the new century, the WTO-
OMC estimates that income from tourism and related activities will amount to over
US$1.5 trillion in the year 2010. More optimistic calculations are available from the
World Travel and Tourism Council (WTTC), which forecasts that the global turnover
131
Two competing perspectives on the question of child labour in the manufacturing
sector are from utilitarian and consequentialist viewpoints. The utilitarian argument
focuses on the economic benefits of abolishing child labour, which will maximise
welfare in the long run by readjusting labour market parameters in favour of increased
adult wages, while the dislocations caused as result of loss of income for specific
groups due to abolition can be managed by short-term prescriptive policy
interventions aimed to ameliorate their condition. This approach does not look at the
work done by children in domestic or familial contexts as exploitative. The latter view,
on the other hand, questions the Chayanovian reasoning underling this approach and
warns that the emotional considerations of filial love and parental affection are
embedded in the logic of the market and hence cannot be disentangled from the realm 2of economic circulation. Rather, it is argued that elimination of child labour outside
the family can obstruct the goals of maximising benefits or minimising harm by
arbitrarily denying earning opportunities for children in the wrong assumption that
family labour is non-exploitative.
This latter perspective can arguably be considered to echo the views proposed by the
first International Meeting of Working Children in Kundapur, India in 1996. The
Kundapur meeting resolved that, rather than abolishing child labour, there was need
to evolve a legal and institutional environment that protected working children from 3abuse and exploitation. The 'Kundapur ten points' thus offer a manifesto for the
working child, which includes a rejection of approaches that advocate boycotting
products made by children, a demand for the respect and security of working children
as well as their work, and an appeal to provide them work with dignity and set up
mechanisms ensuring appropriate working hours and conditions. While the meeting
condemned exploitative labour practices, it asserted the need for continued job
opportunities for deprived children. The fundamental rights of education and healthy
living are not undermined in this perspective. Rather, an appeal to universal education
and care are simply not seen as an attempt to undermine the moral economy of
working children.
It may be noted that these approaches in a sense also point to the futility of an appeal
to fundamental rights as a possible political solution to the problem of child labour in
general. O'Neill (1989: 201) has argued that the discourse of rights neglects one crucial
aspect of children's lives. According to him, rights would remain 'manifesto rights'
“which cannot be claimed unless or until practices and institutions are established
that determine against whom claims on behalf of a particular child may be lodged”
(Ibid: 201-2). As an alternative, he provides a typology of obligations of adults to
children that may or may not have a corresponding claim to a 'right'. The inventory of
obligations that he proposes includes perfect and imperfect obligations. The first is an
obligation to all others irrespective of the agent's relationship to any particular child or
children. Hence, it is a universal perfect obligation and probably corresponds to a
fundamental right. The second is an obligation to specified children by specified
agents. Hence, it is not a universal obligation, but most certainly a perfect one. These
special obligations will have special rights as their counterparts. However, they are not
by definition fundamental. The third is a fundamental obligation that agents may be
capable of discharging only in well-defined contexts to any particular child. This is

134133
from tourism by 2006 could be as high as US$7.1 trillion.
Table 2: International Tourist Arrivals and Receipts by Region, 1996 and 2001
1996 2001 Region
Arrivals as % of Total
Receipts as % of Total
Arrivals as % of Total
Receipts as % of Total
Africa 3.5 1.9 3.9 2.5
US and Canada 10.5 17.3 11.9 20.2
Europe 59.2 51.0 57.5 49.7
Middle East 2.6 1.9 3.3 2.5
East Asia and Pacific
14.7 19.1 16.6 17.7
South Asia 0.7 0.9 0.8 1.1
Others
World 100 100 100 100
Source: World Tourism Organization, compiled from various newsletters.
abuse of working children as well as child trafficking has already attracted public
attention. Black (Ibid: 8) notes “The growth of international tourism is unquestionably
a factor in promoting the sexual exploitation of children and young people,
particularly where the availability of easy sex is emphasised as an integral part of tour 6marketing.” The mechanism by which the link is established has been now been
documented (Equations, 2002). It is argued that,
“(T)he problems involved in trafficking of children for immoral purposes (sexual
exploitation and abuse of children) are situated in a delicate twilight zone. They are
characterised by a high degree of invisibility and mobility; they involve the necessity to
balance carefully different objectives and to adopt an approach that is child friendly;
they tend to be overemphasised by the media and sometimes underestimated by
criminal justice, welfare and educational agencies” (Ibid).
Equations point out that the invisibility of the problem is intensified by its mobility.
Pornography involving children produced in one country using children take from
another country while the destination of the final product could possibly be yet
another country. Consequently, prevention and detection becomes difficult and
requires international and interstate cooperation. It is also noted “the anonymity and
unaccountability of the tourist make the link between tourism and child sex abuse
particularly pernicious” and in India, the child abuse and child trafficking is hidden
“unlike in the other countries such as Thailand or Sri Lanka” (Ibid). Hence it is
unlikely that the abusers are booked or brought to justice. This view is corroborated by
the national figures showing very little action taken against the agents of trafficking or
abusers themselves. Equations also observe that the problem is compounded by the
silence of local people/community. It is also important to remember that the social
and legal system is inadequate to reach families or children before the traffickers catch
them.
The regional dimensions of tourism related trafficking in India shows the problem is 7acute in most states spanning over several districts. The main routes of interstate
trafficking are (i) Agra-Dholpur-Jaipur (also called the 'Pink Triangle'), (ii) Waltair-
Vishakhapatnam-Miraj, (iii) Belgam-Bijapore-Miraj, (iv) Tuticorin-Tirunelveli-
Madurai-Salem, (v) Murshidabad-Jalpaiguri-Nadiad, and (vi) Goalpara and Darrang
(Equations 2000a). It is also observed that 80 percent of India's child sex workers are
located in the five metropolitan cities of Delhi, Mumbai, Bangalore, Kolkatta, and
Chennai.
According to the Centre of Concern for Child Labour, there are about 900,000 sex
workers in India, of which roughly 30 percent are children (quoted in ibid). This
would mean that India is home to nearly 300,000 child sex workers. The profile of
child sex workers points to the interplay of push and pull factors in child trafficking.
The industry's demand for younger sex workers has resulted in an increased incidence 8of entry of children into sex work. Most of the children who enter sex work belong to
9dalit and adivasi communities as well as backward castes. While poverty can be
considered a major push factor in the case of socially and economically backward
communities, studies have shown that the link between poverty and child labour,
Table 3: Tourism and Total Export Receipts in South Asia, 1995
Country Tourism as % of Total Exports
Percentage of World Receipts
India 6.9 0.700
Pakistan 1.1 0.030
Nepal 11.4 0.030
Sri Lanka 4.8 0.060
Bhutan 4.5 0.001
Bangladesh 0.6 0.006
Source: Computed from Sinclair (1999)
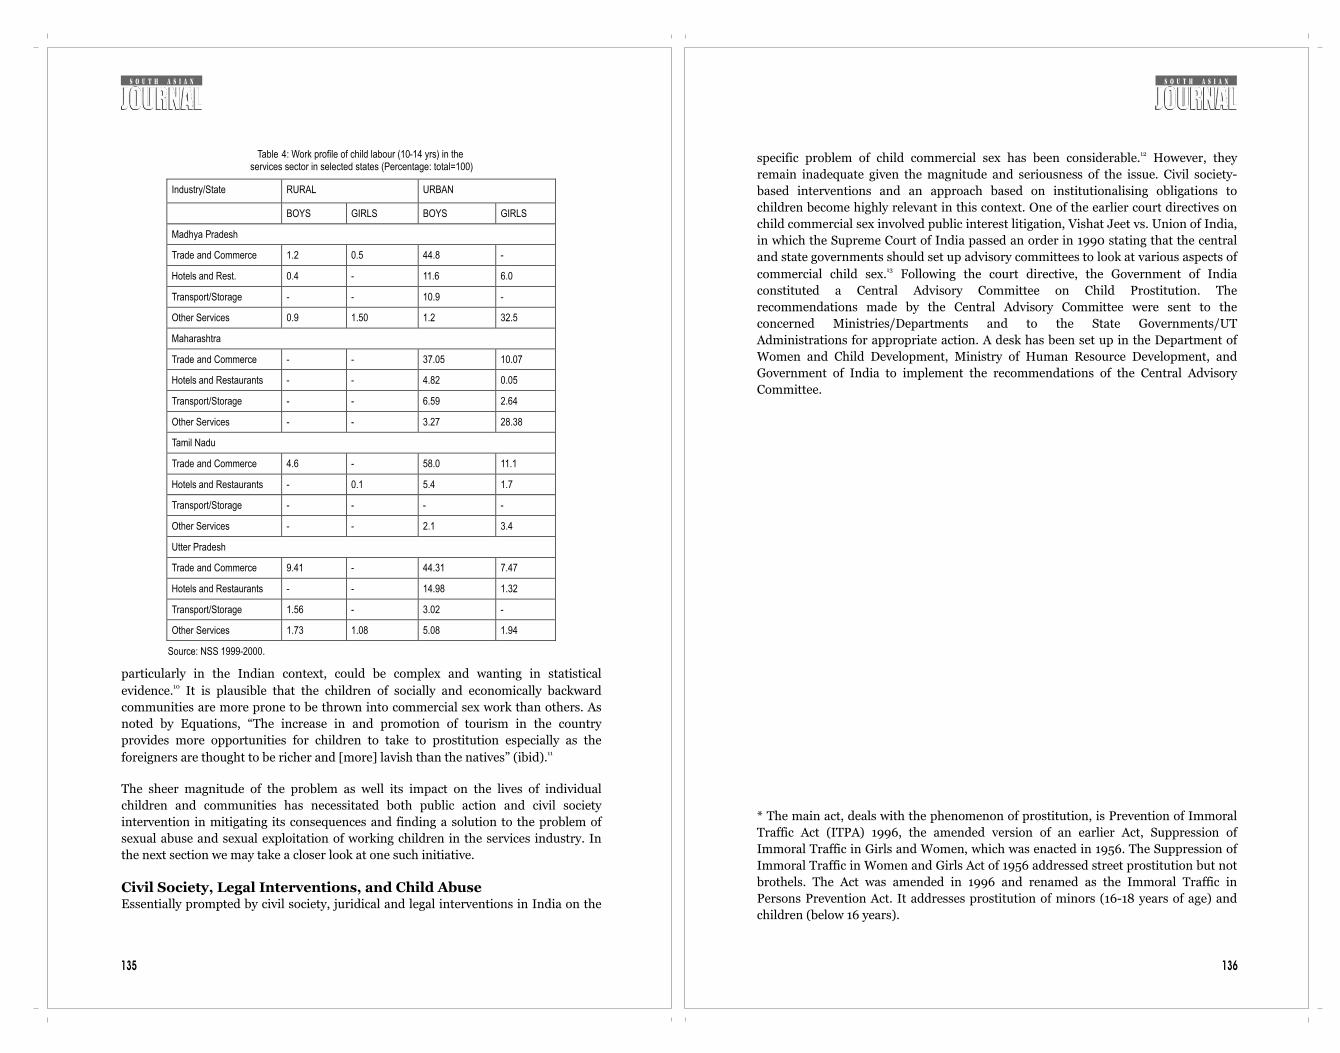
136
12specific problem of child commercial sex has been considerable. However, they
remain inadequate given the magnitude and seriousness of the issue. Civil society-
based interventions and an approach based on institutionalising obligations to
children become highly relevant in this context. One of the earlier court directives on
child commercial sex involved public interest litigation, Vishat Jeet vs. Union of India,
in which the Supreme Court of India passed an order in 1990 stating that the central
and state governments should set up advisory committees to look at various aspects of 13commercial child sex. Following the court directive, the Government of India
constituted a Central Advisory Committee on Child Prostitution. The
recommendations made by the Central Advisory Committee were sent to the
concerned Ministries/Departments and to the State Governments/UT
Administrations for appropriate action. A desk has been set up in the Department of
Women and Child Development, Ministry of Human Resource Development, and
Government of India to implement the recommendations of the Central Advisory
Committee.
* The main act, deals with the phenomenon of prostitution, is Prevention of Immoral
Traffic Act (ITPA) 1996, the amended version of an earlier Act, Suppression of
Immoral Traffic in Girls and Women, which was enacted in 1956. The Suppression of
Immoral Traffic in Women and Girls Act of 1956 addressed street prostitution but not
brothels. The Act was amended in 1996 and renamed as the Immoral Traffic in
Persons Prevention Act. It addresses prostitution of minors (16-18 years of age) and
children (below 16 years).
135
Table 4: Work profile of child labour (10-14 yrs) in the services sector in selected states (Percentage: total=100)
Industry/State RURAL URBAN
BOYS GIRLS BOYS GIRLS
Madhya Pradesh
Trade and Commerce 1.2 0.5 44.8 -
Hotels and Rest. 0.4 - 11.6 6.0
Transport/Storage - - 10.9 -
Other Services 0.9 1.50 1.2 32.5
Maharashtra
Trade and Commerce - - 37.05 10.07
Hotels and Restaurants - - 4.82 0.05
Transport/Storage - - 6.59 2.64
Other Services - - 3.27 28.38
Tamil Nadu
Trade and Commerce 4.6 - 58.0 11.1
Hotels and Restaurants - 0.1 5.4 1.7
Transport/Storage - - - -
Other Services - - 2.1 3.4
Utter Pradesh
Trade and Commerce 9.41 - 44.31 7.47
Hotels and Restaurants - - 14.98 1.32
Transport/Storage 1.56 - 3.02 -
Other Services 1.73 1.08 5.08 1.94
Source: NSS 1999-2000.
particularly in the Indian context, could be complex and wanting in statistical 10evidence. It is plausible that the children of socially and economically backward
communities are more prone to be thrown into commercial sex work than others. As
noted by Equations, “The increase in and promotion of tourism in the country
provides more opportunities for children to take to prostitution especially as the 11foreigners are thought to be richer and [more] lavish than the natives” (ibid).
The sheer magnitude of the problem as well its impact on the lives of individual
children and communities has necessitated both public action and civil society
intervention in mitigating its consequences and finding a solution to the problem of
sexual abuse and sexual exploitation of working children in the services industry. In
the next section we may take a closer look at one such initiative.
Civil Society, Legal Interventions, and Child Abuse Essentially prompted by civil society, juridical and legal interventions in India on the
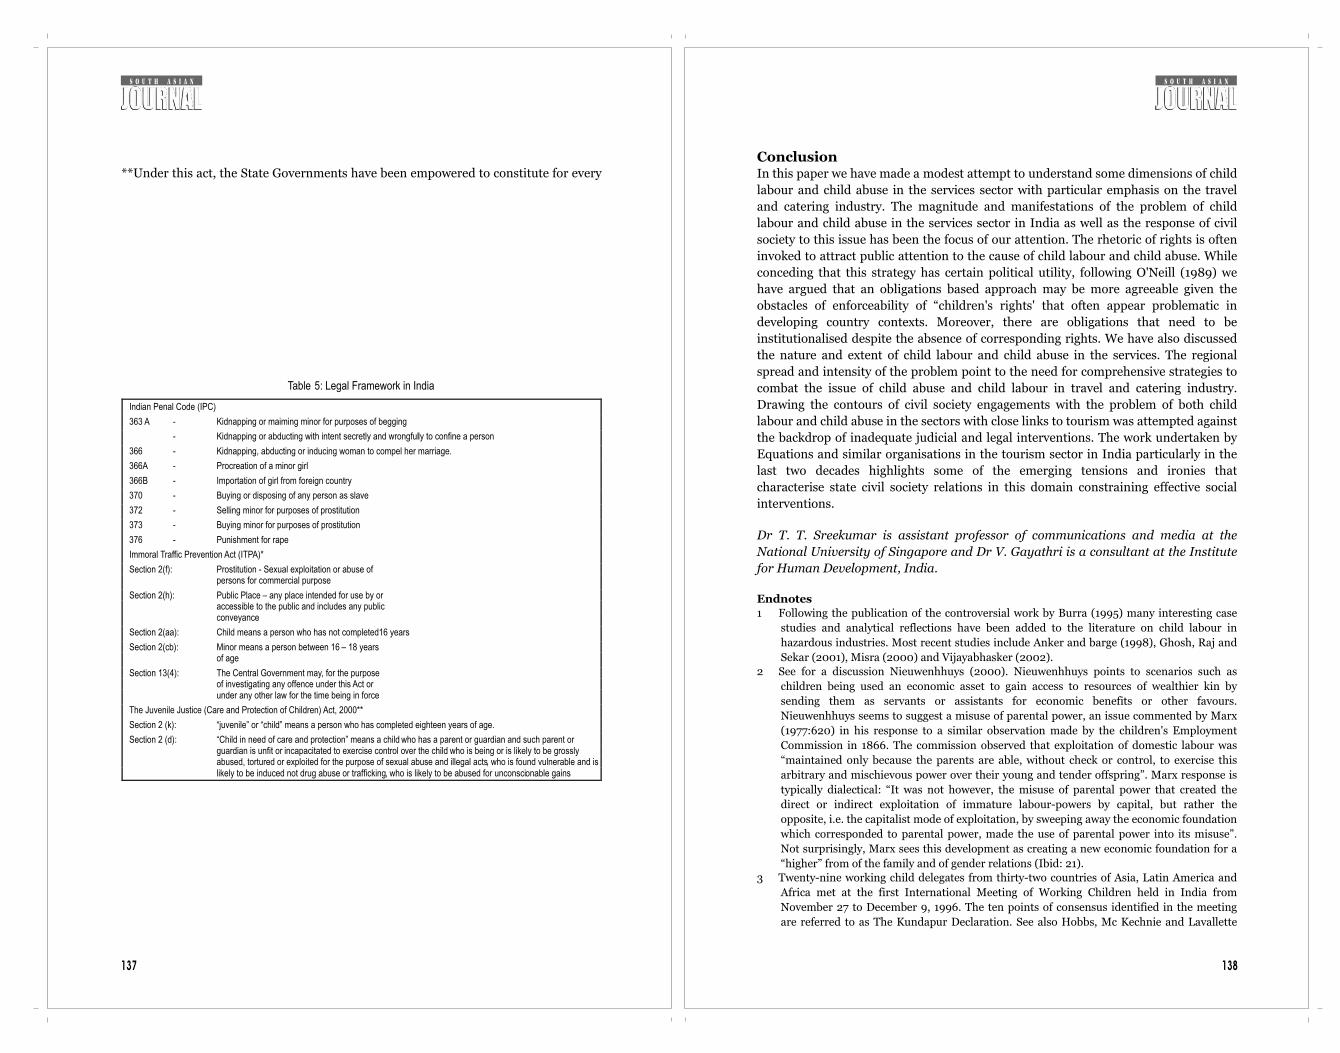
138137
**Under this act, the State Governments have been empowered to constitute for every
Table 5: Legal Framework in India
Indian Penal Code (IPC) 363 A - Kidnapping or maiming minor for purposes of begging
-
Kidnapping or abducting with intent secretly and wrongfully to confine a person
366
-
Kidnapping, abducting or inducing woman to compel her marriage.
366A
-
Procreation of a minor girl
366B
-
Importation of girl from foreign country
370
-
Buying or disposing of any person as slave 372
-
Selling minor for purposes of prostitution
373
-
Buying minor for purposes of prostitution
376
-
Punishment for rape
Immoral Traffic Prevention Act (ITPA)*
Section 2(f):
Prostitution
- Sexual exploitation or abuse of
persons for commercial purpose
Section 2(h):
Public Place – any place intended for use by or
accessible to the public and includes any public
conveyance
Section 2(aa):
Child means a person who has not completed16 years
Section 2(cb):
Minor means a person between 16 – 18 years
of age
Section 13(4):
The Central Government may, for the purpose
of investigating any offence under this Act or
under any other law for the time being in force
The Juvenile Justice (Care and Protection of Children) Act, 2000**
Section 2 (k):
“juvenile” or “child” means a person who has completed eighteen years of age.
Section 2 (d):
“Child in need of care and protection” means a child
who has a parent or guardian and such parent or guardian is unfit or incapacitated to exercise control over the child who is being or is likely to be grossly abused, tortured or exploited for the purpose of sexual abuse and illegal acts, who is found vulnerable and is likely to be induced not drug abuse or trafficking, who is likely to be abused for unconscionable gains
ConclusionIn this paper we have made a modest attempt to understand some dimensions of child
labour and child abuse in the services sector with particular emphasis on the travel
and catering industry. The magnitude and manifestations of the problem of child
labour and child abuse in the services sector in India as well as the response of civil
society to this issue has been the focus of our attention. The rhetoric of rights is often
invoked to attract public attention to the cause of child labour and child abuse. While
conceding that this strategy has certain political utility, following O'Neill (1989) we
have argued that an obligations based approach may be more agreeable given the
obstacles of enforceability of “children's rights' that often appear problematic in
developing country contexts. Moreover, there are obligations that need to be
institutionalised despite the absence of corresponding rights. We have also discussed
the nature and extent of child labour and child abuse in the services. The regional
spread and intensity of the problem point to the need for comprehensive strategies to
combat the issue of child abuse and child labour in travel and catering industry.
Drawing the contours of civil society engagements with the problem of both child
labour and child abuse in the sectors with close links to tourism was attempted against
the backdrop of inadequate judicial and legal interventions. The work undertaken by
Equations and similar organisations in the tourism sector in India particularly in the
last two decades highlights some of the emerging tensions and ironies that
characterise state civil society relations in this domain constraining effective social
interventions.
Dr T. T. Sreekumar is assistant professor of communications and media at the
National University of Singapore and Dr V. Gayathri is a consultant at the Institute
for Human Development, India.
Endnotes1 Following the publication of the controversial work by Burra (1995) many interesting case
studies and analytical reflections have been added to the literature on child labour in
hazardous industries. Most recent studies include Anker and barge (1998), Ghosh, Raj and
Sekar (2001), Misra (2000) and Vijayabhasker (2002). 2 See for a discussion Nieuwenhhuys (2000). Nieuwenhhuys points to scenarios such as
children being used an economic asset to gain access to resources of wealthier kin by
sending them as servants or assistants for economic benefits or other favours.
Nieuwenhhuys seems to suggest a misuse of parental power, an issue commented by Marx
(1977:620) in his response to a similar observation made by the children's Employment
Commission in 1866. The commission observed that exploitation of domestic labour was
“maintained only because the parents are able, without check or control, to exercise this
arbitrary and mischievous power over their young and tender offspring”. Marx response is
typically dialectical: “It was not however, the misuse of parental power that created the
direct or indirect exploitation of immature labour-powers by capital, but rather the
opposite, i.e. the capitalist mode of exploitation, by sweeping away the economic foundation
which corresponded to parental power, made the use of parental power into its misuse”.
Not surprisingly, Marx sees this development as creating a new economic foundation for a
“higher” from of the family and of gender relations (Ibid: 21). 3 Twenty-nine working child delegates from thirty-two countries of Asia, Latin America and
Africa met at the first International Meeting of Working Children held in India from
November 27 to December 9, 1996. The ten points of consensus identified in the meeting
are referred to as The Kundapur Declaration. See also Hobbs, Mc Kechnie and Lavallette
140
10 The two major approaches to understanding child labour in India are identified as being the
poverty argument and education argument respectively (Gayathri, 2002). Kabeer et.al.,
(2003) provide a detailed discussions on the debate on child labour and right to education
in south Asia. See also for discussion, (Chandrashekhar (1995) and Leiten (2002).11 Equations (2002b: 45) conducted a major study supported by the National Commission on
Women, New Delhi on the tourism related sexual exploitation of children in India. The
study was conducted to identify the demand factors that pull children into commercial sex.
Nevertheless, 70 percent of the children interviewed for the study reportedly believe that
poverty has been the main cause of their misery. 12 Recent years have seen a close attention on legal provisions in various countries for
combating trafficking of children. See for example Chuensiri (2000) and Equations
(2000b).13 The order specified that the committees should come up with suggestions on the measures
to be taken in eradicating child prostitution; on the social welfare programmes to be
implemented for the care, protection, treatment, development and on the rehabilitation of
the victims mainly children and girls rescued either from the brothel houses or from
commercial sex. It also ordered to give suggestions for amendments of the existing laws or
for enactment of any new law if so warranted for the prevention of sexual exploitation of
children. Another aspect that received the attention of the court was Devadasi and Jogin
traditions. The committees were asked to give suggestions for their welfare and
rehabilitation and devising suitable machinery for implementing the suggestions made by
the Committee.14 The plan of action include the following components: prevention of trafficking, provision of
health care services, education and child care, housing, shelter and civic amenities,
economic empowerment, legal reforms and law enforcement, rescue and rehabilitation and
strengthening institutional mechanisms. 15 The Devadasi rehabilitation scheme of the Karnataka Government implemented in 6
districts of the State and formation of self-help groups of devadasis is an example of
positive initiatives by state governments. The scheme has four components: training in skill
development in different vocations like handloom weaving, agarbathi making, tailoring etc,
linked up with marketing centers after the formation of Industrial Co-operative Units in
various trades; imparting of social and moral education; health care of devadasis with
emphasis on research and co-ordination and provision for seminars/Workshops to
disseminate experience and formation of residential schools to admit children of Devadasis
as well as other children have been set up in the districts where the practice was prevalent
(Equations,2002a).16 E-mail communication from Joyatri Roy, Equations17 Ibid18 For example in AndhraPradesh, APCRAF, an organisation with a network of 300 civil
society groups in Vijaywada is collaborating with Equations on work relating to combating
commercial sexual exploitation of children in tourism.
ReferenceslBlack, M (1995) In the twilight zone: Child workers in the hotel, tourism and catering
industry, Geneva: international Labour OfficelBurra, N (1995) Born to work: child labor in India. New Delhi: Oxford University Press.lChandrashekhar, C. P (1997) 'The economic consequences of the abolition of child labour:
An Indian case study', The Journal of Peasant Studies, 24(3): 137-79.lChuensiri, K (2000) 'Comparative study of the legal provisions of the six countries in the
Mekong sub-region with respect to trafficking in women and children', Bangkok:
International save the Children Alliance lEquations (2000a) 'Final document-Information gathered for ECPAT survey, Processed.lEquations (2000b) 'Tourism and commercial sexual exploitation of children-Towards
139
(1999: 131-2). 4 Although it is noted that long haul travel will grow faster than intra-regional travel in the
period 1995-2020, the market share of different regions are projected to be surprisingly
similar to the scenario observable in 1995 World Tourism Organization,' Tourism highlights
2002' (Retrievable at www.world-tourism.org). 5 See for discussion, Sreekumar and Parayil (2002).6 Nevertheless, Black is quick to point out that “it is far from the exclusive dynamics at
work…. evidence from Thailand (shows) that the majority of female child prostitutes serve
local customers and considerable local custom is reported from Philippines”. According to
her, “(it is) the visibility of the foreign tourists, and the sensitiveness surrounding child
prostitution which make it easier to blame the 'unclean other'”. However, the civil society
organisation working in the area of child trafficking have pointed to tourism as the most
important factor perpetuating child abuse in India.7 The Centre for Concern for Child Labour has
found that the problem of trafficking is acute
in 79 districts in India:
8 The Report of the Central Advisory Committee on Child
Prostitution (1994) observed that the age of children at
the time of entering sex work is as follows:
9 It is estimated that 60 percent of the trafficked child sex workers belong to dalit adivasi and
backward caste communities. Devadasi community also contributes a substantial number
of child sex workers in India.

142141
developing a better legal perspective' paper presented at The National conference on
human rights, social movements, globalization and law, December.
State Number of districts
Madhyapradesh 10
Rajasthan 9
Maharashtra 9
Uttarpradesh 8
West Bengal 8
Bihar 8
Karnataka 7
Andhraparadesh 6
Orissa 5
Tamilnadu 4
Assam 2
Gia 1
Meghalaya 1
Total 90
Source: Equations (2002a)
Age group Percentage of Children
> 15 14.9
16-18 24.5
19-21 27.7
22-32 9.0
Total 100
Source: Equations (2002a)

144
Indian Women and the Green RevolutionDr Rupinder Kaur
here has been a great deal of recent emphasis on overall improvement in
people's quality of life, based on their full participation in the development
process. Scholars have begun to question the meaning of 'development', given Tthat the continued exclusion of women from most economic and political
opportunities is an indictment of modern progress. It is argued (World Bank 2000:
20-21) that improvement in gender equality is an objective that reinforces other
development goals. Gender-based discrimination can be significantly detrimental to
other elements of a sustainable development agenda because it reduces women's
productivity.
Scholars have tried to link the low economic participation of women to increasing
crime against them and the practice of dowry. Becker (1981) argues that a dowry is a
compensatory transfer made between spouses when the division of output within the
household is inflexible. In another study, Rajaraman (1983) explains the shift from
bride price to the dowry system in terms of the decrease in female employment. In this
context, the bride represents an economic liability for the groom's family. Dowry thus
appears as a form of compensation paid by the bride's family. Many studies focus
specifically on the implications of dowry on women' well being. In particular, dowry
practices contribute to gender inequalities in terms of resource allocation in favour of
boys (Rosenzweig, Schultz, 1982). The custom of dowry in coercive forms also leads to
domestic violence, female infanticide, and foeticide (Sen 1999; Dreze and Khera
2000).
Punjab, which has second place in per capita income among Indian states, also stands
eighth in terms of the gender development index (Seeta Prabhu et. al., 1996). In fact,
Punjab has always played a pioneering role in converting food deficits to food
surpluses by adopting 'green' revolution technology. Unfortunately, this success story
remains unfolded. While studying the impact of agricultural development as a result
of new technology, most studies ignore the gender aspect. This neglect, according to
Agarwal (1987), reflects an uncritical acceptance of the assumption that the household
is a unit, and that all its members will share equally in the benefits and burden of
technological change.
In spite of increasing per capita income and increasing levels of education, women
rarely get their due share of recognition. The declining female sex ratio is another
indicator of the devaluation of women. The results of the recent census on child sex
ratio in Punjab present an alarming situation. The female child sex ratio in the age
group 0-6 years has come down from 875 in 1991 to 793 in 2001. It shows an 82-point
143
146145
difference over a decade. It is obvious that economic development does not lead
automatically to equal distribution of output between the sexes. It is rightly pointed
out (Agnihotri 2000) that unless women's contribution to economic prosperity is
recognised, they will not get their due share.
The present study questions the non-recognition of women workers and women
seeking work in rural areas. This has led to a lack of attention to women when
formulating policies with regard to providing incentives, including credit, forming co-
operatives, and inclusion in training and extension programmes. The underestimation
of female work in the case of Punjab is much more serious.
In agrarian economies, where only a part of the product is exchanged, the distinction
between domestic work and 'economic activity' is blurred. The problem arises in the
case of unpaid family work. Female participation in crop production, for instance, is
not recognised by the household, enumerator, or even by the women themselves. In
various cropping activities such as harvesting maize cobs, vegetables, fruits, potatoes,
and cotton, and rice transplantation, women play a significant role in landless and
scheduled caste household. In Punjab, cotton picking can last for up to 40 days,
during which period all the able-bodied women of a household go to the fields without
any leave, by postponing all other engagements. Moreover, when wheat sowing is
delayed, the remaining pods are brought home - after finishing their household
chores, women sit up late at night for two or three hours to pull out the cotton flower
from the pods. Yet it is not considered a part of economic activity, and women
themselves consider it an extension of their household work.
In fact, there are a number of economic activities in Punjab in which women's role is
significant. Dairy farming is another (largely household-based) activity in which
women play a significant role across landholding-size class, and caste. In fact,
livestock (which is largely the rearing of dairy animals in Punjab) contributes around
16 percent to the net state domestic product. In Punjab, the granary of India, livestock
contributes around Rs62 against every Rs100 contributed by crop output. The state,
with around 7.4 million tones of annual milk production, is the most important
producer of milk in the country. It has the highest per capita availability of milk (855
g/per person/per day), almost four times the Indian average. The contribution of
women is substantial in ushering in this 'white' revolution.
Underestimating female work in census data in the case of Punjab is also a serious
concern. Both 1981 and 1991, census data show that the proportion of main female
workers to the rural female population is around 2 percent. If marginal workers are
added to this, the proportion barely reaches 7 percent. The 2001 census, spurred by
efforts of the media and concerned officials, registered some impact, and female work
participation in Punjab reached 11.9 percent. Such results indicate the need to dig
deeper into this issue.
MethodologyThe study draws its inferences from two primary data sets collected by the author. The
first data set was gathered in 1989 from 410 households in three different regions of
1Punjab, representing three levels of development. Central Punjab, with its fertile land
and widespread tube-well irrigation, has witnessed the most profound change in
agricultural technology and is the seedbed of the green revolution in the state.
Southwest Punjab comes next in order of agricultural development. The northeast
part of the state has lagged behind the other two regions in adopting new agricultural
technology.
The second data set is based on a sample of 200 households in four villages from the
Ludhiana and Moga districts of Central Punjab. The survey was conducted in 2000 to
investigate the gender aspect of dairy farming in Punjab. Since a large part of dairy
work is performed within the household, it is considered part of domestic work and
thus missed out in calculating output or participation. Census enumerators are neither
sufficiently trained nor interested to spend time on rectifying this, because invariably
census enumeration is a responsibility given them in addition to their normal duties.
Female Work ParticipationFollowing national sample survey and international standard definitions of economic
activity, the present study recognises as economic activity not only subsistence work
outside the home, which is generally performed by men, but also the production of
goods in the primary sector by women inside the home. Among other activities, it also
includes labour employed in the care of milch cattle, even if the product is used for
home consumption.
In the first stage, detailed information on people's roles in different activities was
collected, and their main occupation determined on the basis of the maximum time
spent on a particular activity. Given that, in rural areas, people participate in different
activities at one time or at different times, the total time spent in productive and
reproductive activities were measured. Women's share in total work as well as per
worker was calculated in order to avoid a number bias. Similarly, in calculating their
total work time, work participation rates have been compared with official figures.
Females' Share in Different Occupational CategoriesTo examine the extent and nature of work participation, the share of female workers
2in the total workforce in each occupational category is calculated on the basis of their
main occupation (Table 1). The main occupation of each person is determined on the
basis of the greatest number of days spent per year in any gainful activity. For each
region, the first column is based on the number of persons involved in a particular
activity, whereas the second is based on their actual contribution (in terms of hours)
under that particular activity. It shows that, with agricultural development, women's
role in crop production declines. Table 1 reveals that animal husbandry is
predominantly a female-specific occupation in all three regions. The most important
reason for this is that a large part of the work is organised within the house. Thus,
even in those households where social values and attitudes exclude women from
outside work, animal husbandry substantially remains women's domain. This clearly
brings out the 'inside' vs. 'outside' dichotomy of women' participation in the
workforce.
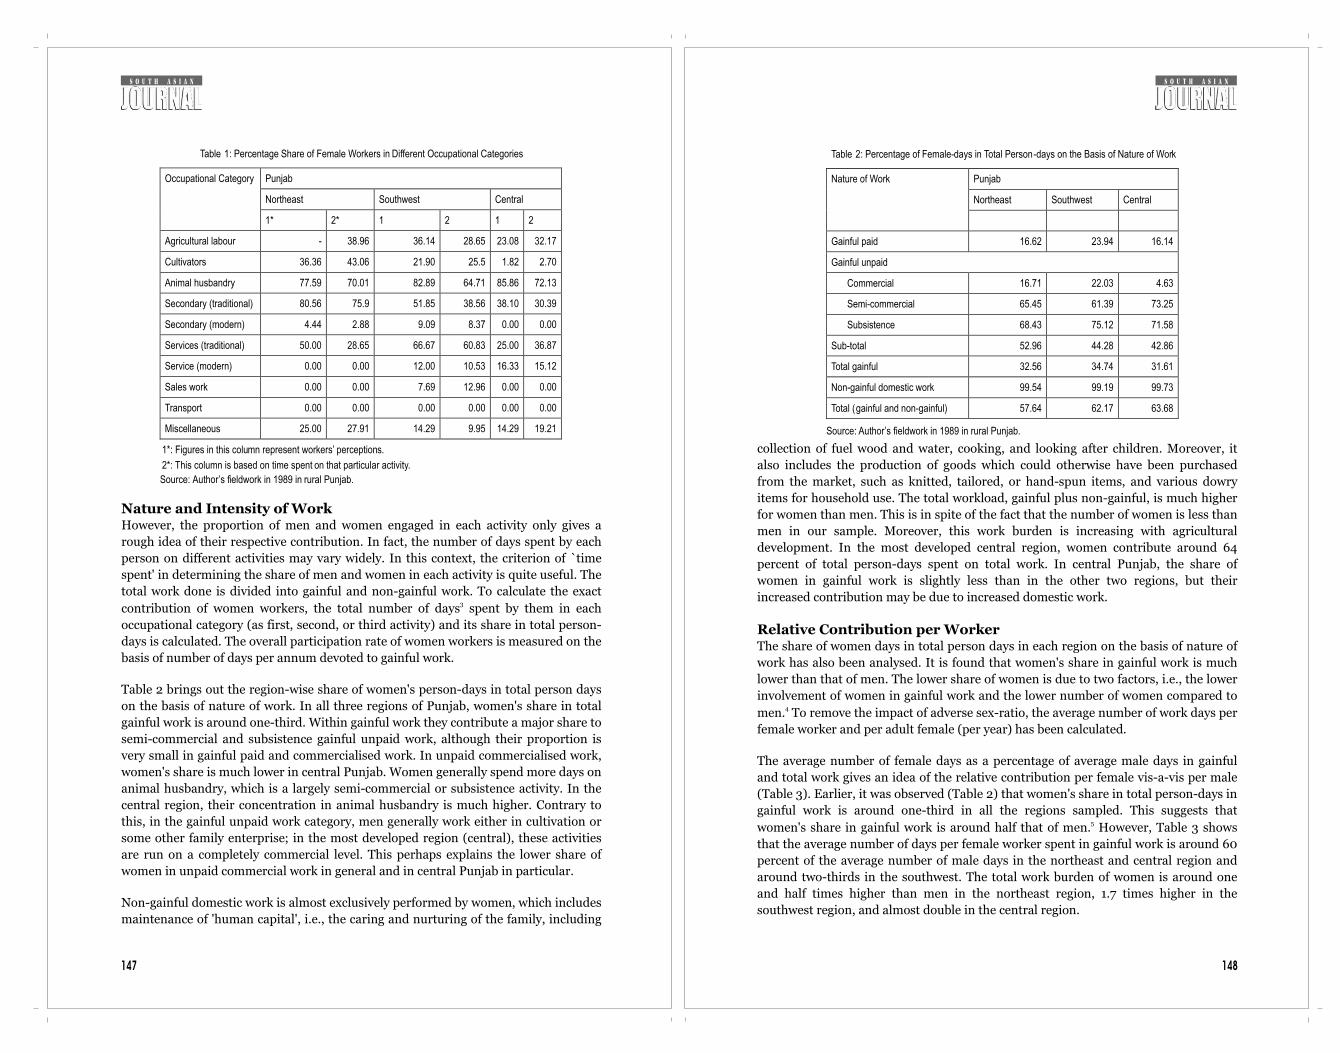
148
collection of fuel wood and water, cooking, and looking after children. Moreover, it
also includes the production of goods which could otherwise have been purchased
from the market, such as knitted, tailored, or hand-spun items, and various dowry
items for household use. The total workload, gainful plus non-gainful, is much higher
for women than men. This is in spite of the fact that the number of women is less than
men in our sample. Moreover, this work burden is increasing with agricultural
development. In the most developed central region, women contribute around 64
percent of total person-days spent on total work. In central Punjab, the share of
women in gainful work is slightly less than in the other two regions, but their
increased contribution may be due to increased domestic work.
Relative Contribution per WorkerThe share of women days in total person days in each region on the basis of nature of
work has also been analysed. It is found that women's share in gainful work is much
lower than that of men. The lower share of women is due to two factors, i.e., the lower
involvement of women in gainful work and the lower number of women compared to 4men. To remove the impact of adverse sex-ratio, the average number of work days per
female worker and per adult female (per year) has been calculated.
The average number of female days as a percentage of average male days in gainful
and total work gives an idea of the relative contribution per female vis-a-vis per male
(Table 3). Earlier, it was observed (Table 2) that women's share in total person-days in
gainful work is around one-third in all the regions sampled. This suggests that 5women's share in gainful work is around half that of men. However, Table 3 shows
that the average number of days per female worker spent in gainful work is around 60
percent of the average number of male days in the northeast and central region and
around two-thirds in the southwest. The total work burden of women is around one
and half times higher than men in the northeast region, 1.7 times higher in the
southwest region, and almost double in the central region.
Table 2: Percentage of Female-days in Total Person-days on the Basis of Nature of Work
Punjab
Northeast Southwest Central
Nature of Work
Gainful paid 16.62 23.94 16.14
Gainful unpaid
Commercial 16.71 22.03 4.63
Semi-commercial 65.45 61.39 73.25
Subsistence 68.43 75.12 71.58
Sub-total 52.96 44.28 42.86
Total gainful 32.56 34.74 31.61
Non-gainful domestic work 99.54 99.19 99.73
Total (gainful and non-gainful) 57.64 62.17 63.68
Source: Author’s fieldwork in 1989 in rural Punjab.
147
Nature and Intensity of WorkHowever, the proportion of men and women engaged in each activity only gives a
rough idea of their respective contribution. In fact, the number of days spent by each
person on different activities may vary widely. In this context, the criterion of `time
spent' in determining the share of men and women in each activity is quite useful. The
total work done is divided into gainful and non-gainful work. To calculate the exact 3contribution of women workers, the total number of days spent by them in each
occupational category (as first, second, or third activity) and its share in total person-
days is calculated. The overall participation rate of women workers is measured on the
basis of number of days per annum devoted to gainful work.
Table 2 brings out the region-wise share of women's person-days in total person days
on the basis of nature of work. In all three regions of Punjab, women's share in total
gainful work is around one-third. Within gainful work they contribute a major share to
semi-commercial and subsistence gainful unpaid work, although their proportion is
very small in gainful paid and commercialised work. In unpaid commercialised work,
women's share is much lower in central Punjab. Women generally spend more days on
animal husbandry, which is a largely semi-commercial or subsistence activity. In the
central region, their concentration in animal husbandry is much higher. Contrary to
this, in the gainful unpaid work category, men generally work either in cultivation or
some other family enterprise; in the most developed region (central), these activities
are run on a completely commercial level. This perhaps explains the lower share of
women in unpaid commercial work in general and in central Punjab in particular.
Non-gainful domestic work is almost exclusively performed by women, which includes
maintenance of 'human capital', i.e., the caring and nurturing of the family, including
Table 1: Percentage Share of Female Workers in Different Occupational Categories
Punjab
Northeast Southwest Central
Occupational Category
1* 2* 1 2 1 2
Agricultural labour - 38.96 36.14 28.65 23.08 32.17
Cultivators 36.36 43.06 21.90 25.5 1.82 2.70
Animal husbandry 77.59 70.01 82.89 64.71 85.86 72.13
Secondary (traditional) 80.56 75.9 51.85 38.56 38.10 30.39
Secondary (modern) 4.44 2.88 9.09 8.37 0.00 0.00
Services (traditional) 50.00 28.65 66.67 60.83 25.00 36.87
Service (modern) 0.00 0.00 12.00 10.53 16.33 15.12
Sales work 0.00 0.00 7.69 12.96 0.00 0.00
Transport 0.00 0.00 0.00 0.00 0.00 0.00
Miscellaneous 25.00 27.91 14.29 9.95 14.29 19.21
1*: Figures in this column represent workers’ perceptions.
2*: This column is based on time spent on that particular activity.
Source: Author’s fieldwork in 1989 in rural Punjab.
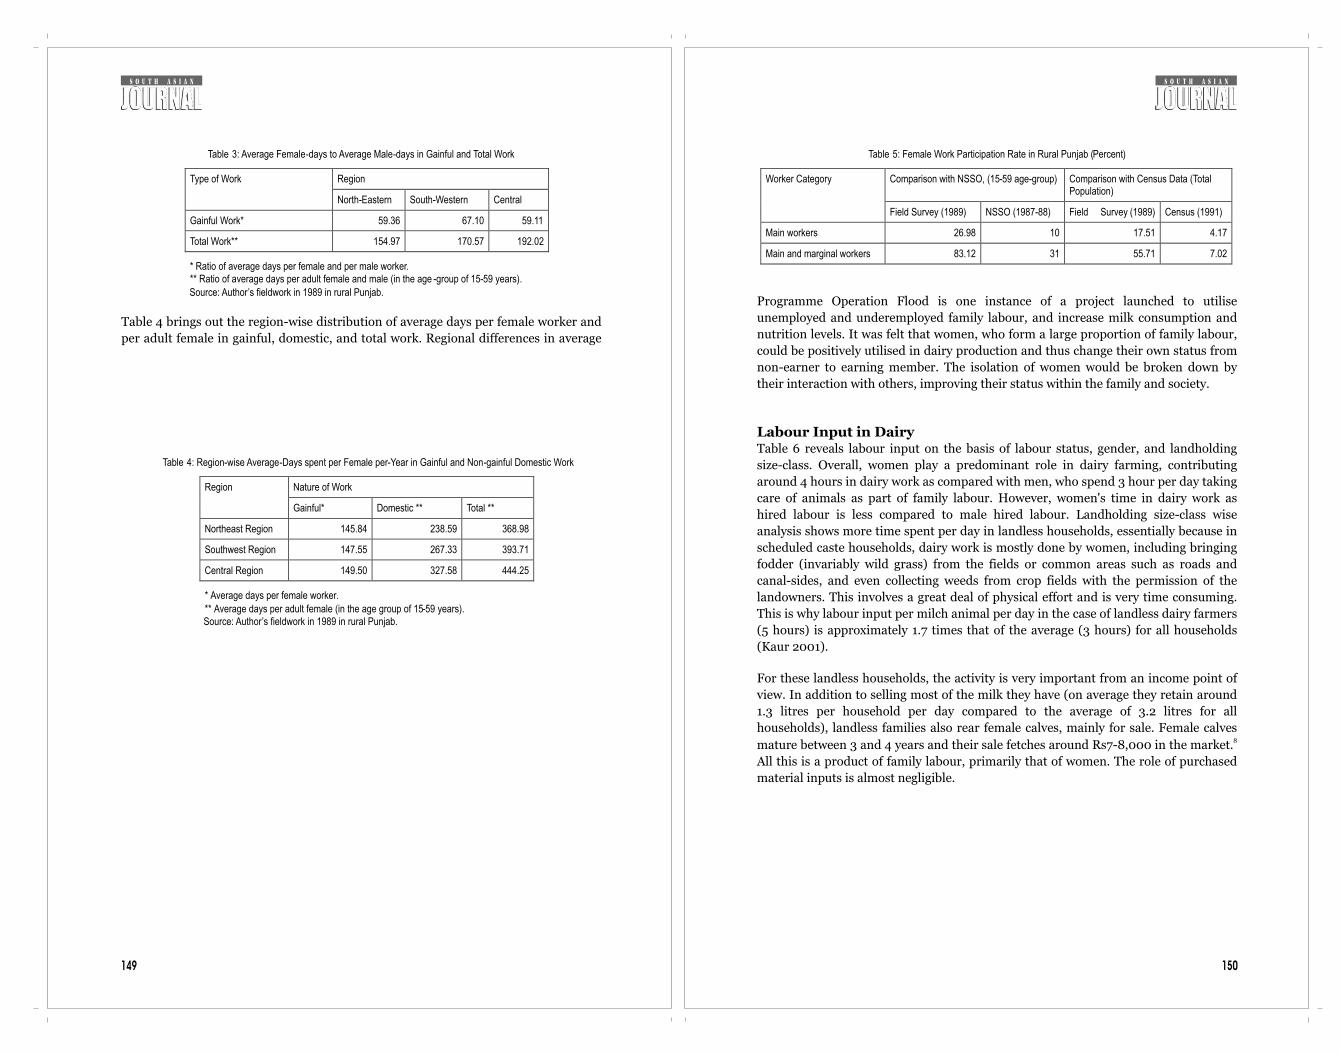
150149
Table 4 brings out the region-wise distribution of average days per female worker and
per adult female in gainful, domestic, and total work. Regional differences in average
Table 3: Average Female-days to Average Male-days in Gainful and Total Work
Region Type of Work
North-Eastern South-Western Central
Gainful Work* 59.36 67.10 59.11
Total Work** 154.97 170.57 192.02
* Ratio of average days per female and per male worker. ** Ratio of average days per adult female and male (in the age -group of 15-59 years).
Source: Author’s fieldwork in 1989 in rural Punjab.
Table 4: Region-wise Average-Days spent per Female per-Year in Gainful and Non-gainful Domestic Work
Nature of Work Region
Gainful* Domestic ** Total **
Northeast Region 145.84 238.59 368.98
Southwest Region 147.55 267.33 393.71
Central Region 149.50 327.58 444.25
* Average days per female worker.
** Average days per adult female (in the age group of 15-59 years). Source: Author’s fieldwork in 1989 in rural Punjab.
Programme Operation Flood is one instance of a project launched to utilise
unemployed and underemployed family labour, and increase milk consumption and
nutrition levels. It was felt that women, who form a large proportion of family labour,
could be positively utilised in dairy production and thus change their own status from
non-earner to earning member. The isolation of women would be broken down by
their interaction with others, improving their status within the family and society.
Labour Input in DairyTable 6 reveals labour input on the basis of labour status, gender, and landholding
size-class. Overall, women play a predominant role in dairy farming, contributing
around 4 hours in dairy work as compared with men, who spend 3 hour per day taking
care of animals as part of family labour. However, women's time in dairy work as
hired labour is less compared to male hired labour. Landholding size-class wise
analysis shows more time spent per day in landless households, essentially because in
scheduled caste households, dairy work is mostly done by women, including bringing
fodder (invariably wild grass) from the fields or common areas such as roads and
canal-sides, and even collecting weeds from crop fields with the permission of the
landowners. This involves a great deal of physical effort and is very time consuming.
This is why labour input per milch animal per day in the case of landless dairy farmers
(5 hours) is approximately 1.7 times that of the average (3 hours) for all households
(Kaur 2001).
For these landless households, the activity is very important from an income point of
view. In addition to selling most of the milk they have (on average they retain around
1.3 litres per household per day compared to the average of 3.2 litres for all
households), landless families also rear female calves, mainly for sale. Female calves 8mature between 3 and 4 years and their sale fetches around Rs7-8,000 in the market.
All this is a product of family labour, primarily that of women. The role of purchased
material inputs is almost negligible.
Table 5: Female Work Participation Rate in Rural Punjab (Percent)
Comparison with NSSO, (15-59 age-group) Comparison with Census Data (Total Population)
Worker Category
Field Survey (1989) NSSO (1987-88) Field Survey (1989) Census (1991)
Main workers 26.98 10 17.51 4.17
Main and marginal workers 83.12 31 55.71 7.02
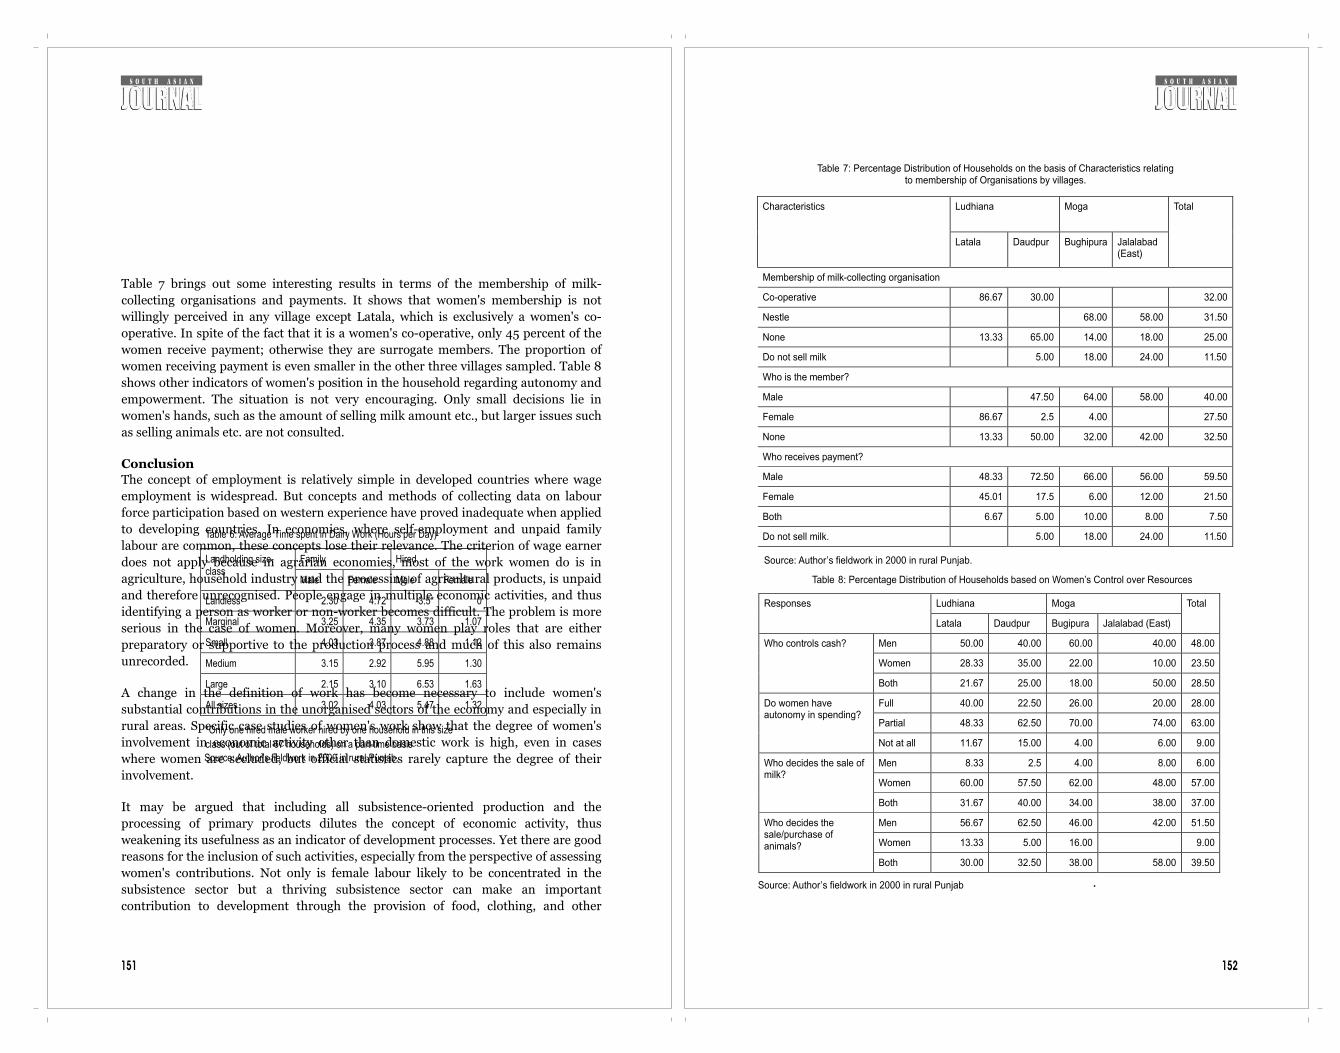
152
Table 7: Percentage Distribution of Households on the basis of Characteristics relating to membership of Organisations by villages.
Ludhiana
Moga Characteristics
Latala Daudpur Bughipura
Jalalabad (East)
Total
Membership of milk-collecting organisation
Co-operative
86.67
30.00
32.00
Nestle
68.00
58.00
31.50
None
13.33
65.00
14.00
18.00
25.00
Do not sell milk
5.00
18.00
24.00
11.50
Who is the member?
Male
47.50
64.00
58.00
40.00
Female
86.67
2.5
4.00
27.50
None
13.33
50.00
32.00
42.00
32.50
Who receives payment?
Male
48.33
72.50
66.00
56.00
59.50
Female
45.01
17.5
6.00
12.00
21.50
Both
6.67
5.00
10.00
8.00
7.50
Do not sell milk.
5.00
18.00
24.00
11.50
Source: Author’s fieldwork in 2000 in rural Punjab.
Table 8: Percentage Distribution of Households based on Women’s Control over Resources
Ludhiana
Moga
Responses
Latala
Daudpur
Bugipura
Jalalabad (East)
Total
Men
50.00
40.00
60.00
40.00
48.00
Women
28.33
35.00
22.00
10.00
23.50
Who controls cash?
Both
21.67
25.00
18.00
50.00
28.50
Full
40.00
22.50
26.00
20.00
28.00
Partial
48.33
62.50
70.00
74.00
63.00
Do women have autonomy in spending?
Not at all
11.67
15.00
4.00
6.00
9.00
Men
8.33
2.5
4.00
8.00
6.00
Women
60.00
57.50
62.00
48.00
57.00
Who decides the sale of milk?
Both
31.67
40.00
34.00
38.00
37.00
Men
56.67
62.50
46.00
42.00
51.50
Women
13.33
5.00
16.00
9.00
Who decides the
sale/purchase of animals?
Both 30.00 32.50 38.00 58.00 39.50
Source: Author’s fieldwork in 2000 in rural Punjab .
151
Table 7 brings out some interesting results in terms of the membership of milk-
collecting organisations and payments. It shows that women's membership is not
willingly perceived in any village except Latala, which is exclusively a women's co-
operative. In spite of the fact that it is a women's co-operative, only 45 percent of the
women receive payment; otherwise they are surrogate members. The proportion of
women receiving payment is even smaller in the other three villages sampled. Table 8
shows other indicators of women's position in the household regarding autonomy and
empowerment. The situation is not very encouraging. Only small decisions lie in
women's hands, such as the amount of selling milk amount etc., but larger issues such
as selling animals etc. are not consulted.
ConclusionThe concept of employment is relatively simple in developed countries where wage
employment is widespread. But concepts and methods of collecting data on labour
force participation based on western experience have proved inadequate when applied
to developing countries. In economies, where self-employment and unpaid family
labour are common, these concepts lose their relevance. The criterion of wage earner
does not apply because in agrarian economies, most of the work women do is in
agriculture, household industry and the processing of agricultural products, is unpaid
and therefore unrecognised. People engage in multiple economic activities, and thus
identifying a person as worker or non-worker becomes difficult. The problem is more
serious in the case of women. Moreover, many women play roles that are either
preparatory or supportive to the production process and much of this also remains
unrecorded.
A change in the definition of work has become necessary to include women's
substantial contributions in the unorganised sectors of the economy and especially in
rural areas. Specific case studies of women's work show that the degree of women's
involvement in economic activity other than domestic work is high, even in cases
where women are secluded, but official statistics rarely capture the degree of their
involvement.
It may be argued that including all subsistence-oriented production and the
processing of primary products dilutes the concept of economic activity, thus
weakening its usefulness as an indicator of development processes. Yet there are good
reasons for the inclusion of such activities, especially from the perspective of assessing
women's contributions. Not only is female labour likely to be concentrated in the
subsistence sector but a thriving subsistence sector can make an important
contribution to development through the provision of food, clothing, and other
Table 6: Average Time spent in Dairy Work (Hours per Day)
Family Hired Landholding size-class
Male Female Male Female
Landless 2.30 4.72 3.5* 0
Marginal 3.25 4.35 3.73 1.07
Small 4.03 3.87 4.88 1.12
Medium 3.15 2.92 5.95 1.30
Large 2.15 3.10 6.53 1.63
All sizes 3.02 4.03 5.47 1.32
*Only one hired male worker hired by one household in this size
class (out of total 67 households) on a part-time basis
Source: Author’s fieldwork in 2000 in rural Punjab.

154153
necessities of life that improve the health and well being of the population and raise
the productivity of labour.
In Punjab, animal husbandry is an important and flourishing activity. In spite of the
substantial contribution of women in small and marginal landholding households,
their contribution is neither recognised by their households, nor by data-collecting
agencies. Unless this backbreaking work is recognised, it is not going to help register
the need for extension services and other needs such as credit and improved
technology, much less the worth of women themselves.
Dr Rupinder Kaur is an associate fellow at the National Council of Applied Economic
Research in India.
Endnotes1 For detailed regional information, sample design, and complete methodology, see Kaur
(1999).2 For activities included in each occupational category see Kaur (1996)3 Eight hours work is considered as one work day.4 In our sample in all the three regions number of women is less than men. 5 If women's share in total person days is around one-third it means men's share will be
around two-third i.e. double than women's share. 6 One work day is equal to 8 hours work.7 Census data gives even much lower figures of female work participation rate in rural Punjab.
However in the census, while calculating female participation rates, total female population,
rather than females of working age-group, are taken into account8 This is on the lower side of the prevailing prices of buffaloes and cross-breed cows in this
area. However, quality of animals with landless households is invariably poor.
ReferenceslAgarwal, Bina (1987) “Gender Issues in the Agricultural Modernization of India,” in J. H.
Momsen and J. G. Townsend (eds.) Geography of gender in Third World, State University of
New York Press, Hutchinson, 334-36 lAgnihotri, S. B. (2000) Sex Ratio Patterns in the Indian Population, A Fresh Exploration,
Sage publications, New Delhi.lBecker, G. [1981], Treatise on the Family, Harvard University PresslKaur, Rupinder (1996) Agricultural Development, Occupational Structure and Gender: A
case Study of Punjab, The Indian Journal of Labour Economics, 39,4, 827-840lKaur, Rupinder (1999) Agricultural Development and Women's Role: A Study of Punjab,
Margin, vol.31, No. 3&4 , 67-83.lKaur, Rupinder (2001) A Gender and Social Analysis of Dairy Farming in Rural Punjab,
Unpublished Report, NCAER, New Delhi.lNCAER (1990) Baseline Study of Operation Flood Areas 1988-89, Vol.I, Part-A, New Delhi.lRajaraman I. (1983) "Economics of bride-price and dowry", Economic and Political Weekly,
19/02lRosenzweig, M-R., Schultz, T.P, (1982), "Market opportunities, genetic endowments and
intra-family resource distribution: Child survival in rural India", American Economic
Review, 72, 4, 803-815lSen, P. (1999) "Enhancing women's choices in responding to domestic violence in Calcutta:
a comparison of employment and education", The European Journal of Development
Research, vol 11, no 2, Décember, 65-86lSeeta Prabhu, K., P.C. Sarker and A. Radha (1996) “Gender-related Development Index for
Indian States: A preliminary Exercise”, in Sites of Change: the Structural Context For
Empowering women in India, (ed.) by N. Rao, L. Rurup and R. Sudarshan, UNDP, New
Delhi.lThe World Bank (2000) Entering the 21st Century World Development Report 1999/2000,
OUP, New York.
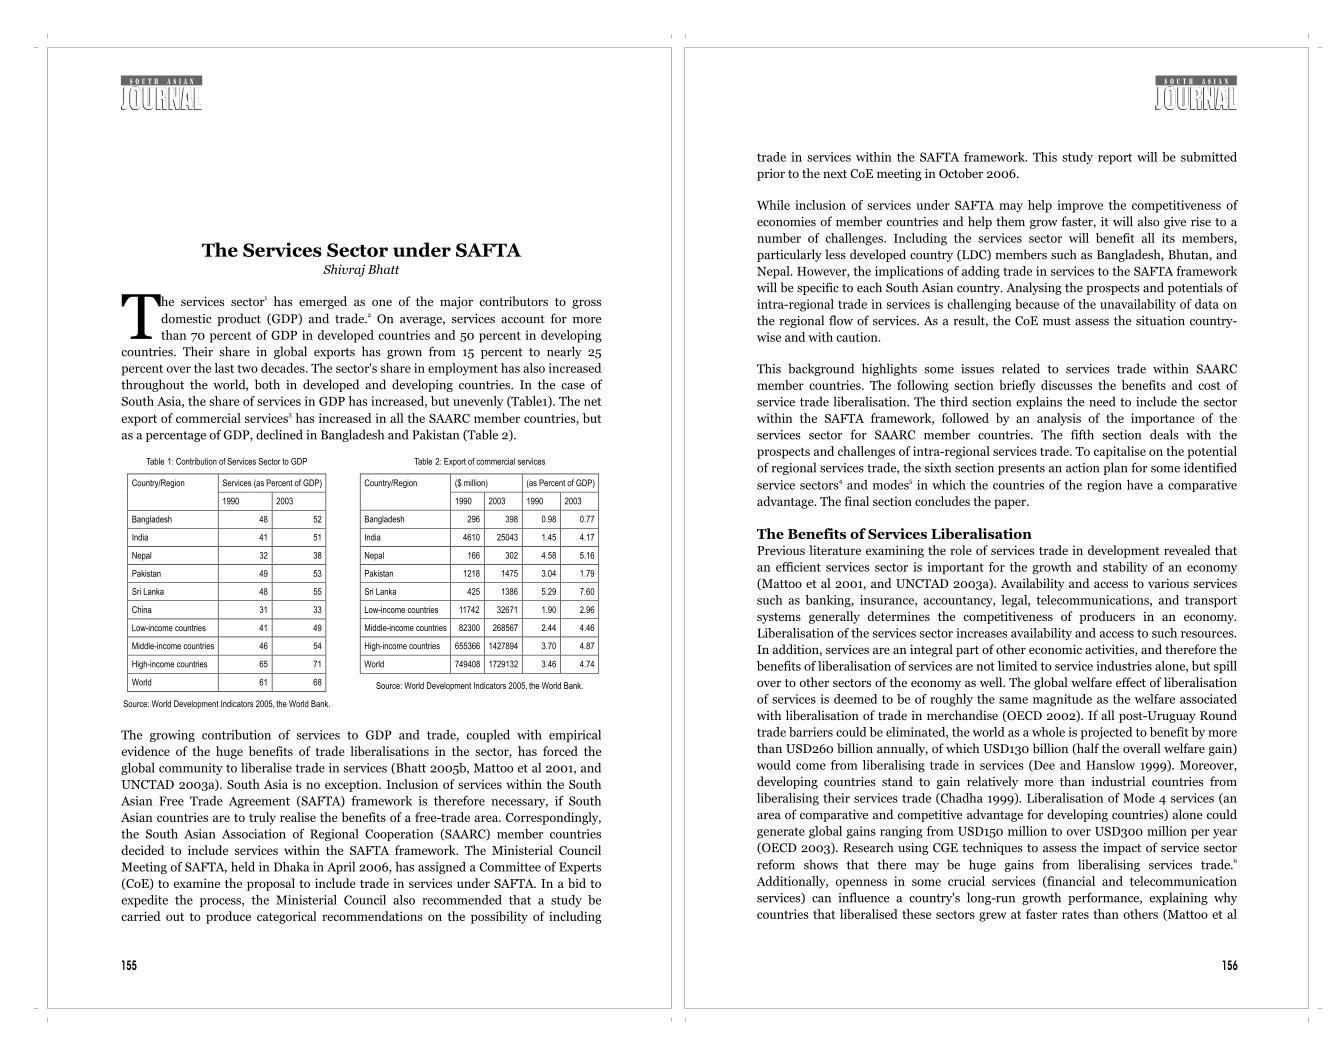
156
trade in services within the SAFTA framework. This study report will be submitted
prior to the next CoE meeting in October 2006.
While inclusion of services under SAFTA may help improve the competitiveness of
economies of member countries and help them grow faster, it will also give rise to a
number of challenges. Including the services sector will benefit all its members,
particularly less developed country (LDC) members such as Bangladesh, Bhutan, and
Nepal. However, the implications of adding trade in services to the SAFTA framework
will be specific to each South Asian country. Analysing the prospects and potentials of
intra-regional trade in services is challenging because of the unavailability of data on
the regional flow of services. As a result, the CoE must assess the situation country-
wise and with caution.
This background highlights some issues related to services trade within SAARC
member countries. The following section briefly discusses the benefits and cost of
service trade liberalisation. The third section explains the need to include the sector
within the SAFTA framework, followed by an analysis of the importance of the
services sector for SAARC member countries. The fifth section deals with the
prospects and challenges of intra-regional services trade. To capitalise on the potential
of regional services trade, the sixth section presents an action plan for some identified 4 5service sectors and modes in which the countries of the region have a comparative
advantage. The final section concludes the paper.
The Benefits of Services LiberalisationPrevious literature examining the role of services trade in development revealed that
an efficient services sector is important for the growth and stability of an economy
(Mattoo et al 2001, and UNCTAD 2003a). Availability and access to various services
such as banking, insurance, accountancy, legal, telecommunications, and transport
systems generally determines the competitiveness of producers in an economy.
Liberalisation of the services sector increases availability and access to such resources.
In addition, services are an integral part of other economic activities, and therefore the
benefits of liberalisation of services are not limited to service industries alone, but spill
over to other sectors of the economy as well. The global welfare effect of liberalisation
of services is deemed to be of roughly the same magnitude as the welfare associated
with liberalisation of trade in merchandise (OECD 2002). If all post-Uruguay Round
trade barriers could be eliminated, the world as a whole is projected to benefit by more
than USD260 billion annually, of which USD130 billion (half the overall welfare gain)
would come from liberalising trade in services (Dee and Hanslow 1999). Moreover,
developing countries stand to gain relatively more than industrial countries from
liberalising their services trade (Chadha 1999). Liberalisation of Mode 4 services (an
area of comparative and competitive advantage for developing countries) alone could
generate global gains ranging from USD150 million to over USD300 million per year
(OECD 2003). Research using CGE techniques to assess the impact of service sector 6reform shows that there may be huge gains from liberalising services trade.
Additionally, openness in some crucial services (financial and telecommunication
services) can influence a country's long-run growth performance, explaining why
countries that liberalised these sectors grew at faster rates than others (Mattoo et al
155
The Services Sector under SAFTAShivraj Bhatt
1he services sector has emerged as one of the major contributors to gross 2domestic product (GDP) and trade. On average, services account for more Tthan 70 percent of GDP in developed countries and 50 percent in developing
countries. Their share in global exports has grown from 15 percent to nearly 25
percent over the last two decades. The sector's share in employment has also increased
throughout the world, both in developed and developing countries. In the case of
South Asia, the share of services in GDP has increased, but unevenly (Table1). The net 3export of commercial services has increased in all the SAARC member countries, but
as a percentage of GDP, declined in Bangladesh and Pakistan (Table 2).
The growing contribution of services to GDP and trade, coupled with empirical
evidence of the huge benefits of trade liberalisations in the sector, has forced the
global community to liberalise trade in services (Bhatt 2005b, Mattoo et al 2001, and
UNCTAD 2003a). South Asia is no exception. Inclusion of services within the South
Asian Free Trade Agreement (SAFTA) framework is therefore necessary, if South
Asian countries are to truly realise the benefits of a free-trade area. Correspondingly,
the South Asian Association of Regional Cooperation (SAARC) member countries
decided to include services within the SAFTA framework. The Ministerial Council
Meeting of SAFTA, held in Dhaka in April 2006, has assigned a Committee of Experts
(CoE) to examine the proposal to include trade in services under SAFTA. In a bid to
expedite the process, the Ministerial Council also recommended that a study be
carried out to produce categorical recommendations on the possibility of including
Table 1: Contribution of Services Sector to GDP
Services (as Percent of GDP) Country/Region
1990
2003
Bangladesh
48
52
India
41
51
Nepal
32
38
Pakistan
49
53
Sri Lanka
48
55
China
31
33
Low-income countries
41
49
Middle-income countries
46
54
High-income countries
65
71
World 61 68
Source: World Development Indicators 2005, the World Bank.
Table 2: Export of commercial services
($ million) (as Percent of GDP)Country/Region
1990
2003
1990
2003
Bangladesh
296
398
0.98
0.77
India
4610
25043
1.45
4.17
Nepal
166
302
4.58
5.16
Pakistan
1218
1475
3.04
1.79
Sri Lanka
425
1386
5.29
7.60
Low-income countries
11742
32671
1.90
2.96
Middle-income countries
82300
268567
2.44
4.46
High-income countries
655366
1427894
3.70
4.87
World 749408 1729132 3.46 4.74
Source: World Development Indicators 2005, the World Bank.

158157
2001).
Apart from being an important source of foreign earnings, free trade in services and
entry of foreign suppliers ought to stimulate competition, which in turn improves the
efficiency, i.e., lower cost and better quality, of domestic service industries.
Improvement in the delivery of services such as research and development, business
services, communication, transport, financial, and insurance services is also critical to
the development of efficient and successful manufacturing and agricultural sectors in
LDCs. Moreover, in LDCs, where the provision for both essential and commercial
services is inadequate, imports of services can add to the overall availability, variety,
and quality of services from which individual and corporate consumers can choose.
The growth of the services sector can also create employment opportunities for skilled
university graduates and school leavers, helping to stem the 'brain drain' that
negatively affects many developing countries (OECD 2002b and UNCTAD 2003a).
However, many researchers and civil society organisations, especially in LDCs, are not
very optimistic about services trade liberalisation, generally citing instances where
services liberalisation, especially when coupled with privatisation, has led to decreased
employment, price increases, and discontinuation of unprofitable services to the poor
(Bhatt 2005b and UNDP 2003). This can be especially contentious where public
services such as water, electricity, and healthcare are involved. They also claim that,
because gains from technology transfer, i.e., improvement in local capacity in both
technology and skills, from foreign direct investment (FDI) in services is limited to
high-tech and information-intensive services - such as communications, finance, and
public services in health and environment - LDCs have very little to gain from them.
Moreover, the promised technology transfer often fails to take place due to intellectual
property protection.
Specific commitments in a country's General Agreement on Trade in Services (GATS)
schedule constitute a minimum standard that helps foreign firms enter a country's
market (Hoekman 2000, UNCTAD 2003b, and UNDP 2003). The extent to which the
stability and certainty of GATS policies attracts FDI is debatable because there are
many other factors that influence the decision to invest. There is no empirical
evidence to link significant flows of FDI to developing countries and LDCs with the
conclusion of the GATS. As with liberalisation of trade in goods, there may be negative
impacts of incorrectly planned liberalisation of trade in services (Bhatt 2005b).
Indeed, there is still no consensus as to whether certain critical services such as health
and education should be subject to liberalisation at all. Hence, in undertaking
liberalisation, developing countries need to pay close attention to sequencing, pacing,
and ensuring that appropriate regulatory frameworks are put in place.
The bottom line is that an open and liberal trade regime in services is an important
part of growth and development policy. Protection imposes not only direct and
sectoral costs, but also limits economic opportunities and restricts economic growth.
As a result, liberalisation in services is inevitable to countries that seek development,
but without carefully planned and sequenced liberalisation, there may be serious
challenges for SAARC member countries, both individually and collectively, and their
citizen, especially the poor.
Box 1: Examples of the Cost of Protecting ServicesIn Chile, deregulation and liberalisation of international maritime transport services
led to a saving of 22-25 percent of the freight bill on Chile's exports to the US
(Bennathan 1993). For a small economy confronting given world prices of traded
goods, higher transport costs reduce export prices and increases prices of delivered
imports. The poor export performance of sub-Saharan African countries has also been
attributed to high transport costs, which were in turn adversely influenced by the anti-
competitive cargo reservation policies adopted by most of these countries (Yeats et al
1996).
Poor infrastructure and logistics may lead to high inventories, with adverse effects on
companies' costs and competitiveness. A recent study found that raw materials'
inventories in the manufacturing sector in the 1970s, 1980s, and 1990s were two to
five times higher in developing countries than in the US, despite the fact that, in most
developing countries, real interest rates are at least twice as high. Poor infrastructure,
ineffective regulation, and deficiencies in market development have been identified as
the main arguments for this result. Cross-country estimates show that a one-standard
deviation worsening of infrastructure increases raw materials inventories by 27 to 47
percent (Guasch and Kogan 2001).
An important sector in the context of trade reform is distribution. If there are barriers
to entry into distribution, those who control this sector may be the primary
beneficiaries of trade liberalisation, impeding the distributional effects in favour of
consumers. In agriculture, para-statal marketing boards often strongly restrict
competition for the products of poor farmers and restrain their incomes. For example,
in Francophone African countries, the absence of any competition in the purchase of
seed cotton from farmers has implied that farmers have been paid prices for their seed
cotton that tend to be far below competitive levels. In terms of lint equivalent, seed
cotton prices in these countries have generally been within a range of 40 to 50 percent
of the export price of cotton lint, compared to ratios averaging almost 90 percent in
India and around 80 percent in Zimbabwe (Hoekman et al 2001).
Another example concerning distribution services is that of Zambia, where the
government abolished the official purchasing monopsony in maize; the activity
became dominated by two private firms which probably colluded to keep prices low
and which abandoned purchasing altogether in remote areas. In Zimbabwe, on the
other hand, three private buyers emerged after privatisation, including one owned by
the farmers. Here the abolition of the government monopoly resulted in increased
competition and prices and farm incomes rose appreciably (Winters 2000).
Source: Marchetti Juan, A. (2004), Developing Countries in the WTO Services
Negotiations, Staff Working Paper ERSD-2004-06, WTO Geneva.
The Rationale for Services under SAFTAThere are many reasons in favour of an immediate inclusion of services within the
SAFTA framework. First, the services sector is emerging as the sector with the greatest

160
and other commercial services are very important for Bangladesh and India,
constituting more than a 50 percent-share in both countries' commercial services
export for 2003). For Nepal, travel-related services are more important as this sector
contributes nearly a two-third share to commercial services export. Transport services
are important for Pakistan, where the sector contributes more than a 50 percent-share
to commercial services export. However, for Sri Lanka, transport, travel and
computer, information, communications, and other commercial services are all
equally important. The share of these three services sectors in Sri Lankan commercial
services export is 40.5, 30.6 and 25.4 percent, respectively in the year 2003 (Table 3).
The discussion above shows that services sector in general is emerging as the dynamic
sector of the economy in SAARC member countries, therefore, there is potential for
trade in services within the region.
Sectors of Comparative AdvantageComparative advantage and services trade potential can be identified in more detail in
10 terms of revealed comparative advantage (RCA).
RCA calculations show that, in South Asia, Nepal had the most significant
comparative advantage in commercial services in 1990. Nepal's RCA score declined in
2003, but remained the highest in South Asia, followed by India. Similarly, Sri Lanka
also has an RCA in commercial services export. While South Asia as a group of
countries has a comparative advantage in commercial services export, Bangladesh and
Pakistan individually do not share this comparative advantage. However, the
disaggregated RCA shows that Bangladesh has a comparative advantage in computer,
information, communications, and other commercial services, while Pakistan has a
comparative advantage in transport services (Table 5). The table also shows that India,
Nepal, and Sri Lanka have a comparative advantage in computer, information,
Table 3: Structure of Service Exports (Percent)
Transport Travel Insurance and Financial Services
Computer, Information, Communications, and Other Commercial Services
Country/Region
1990 2003 1990 2003 1990 2003 1990 2003
Bangladesh 12.9 18.1 6.4 14.3 0.1 8.1 80.6 59.5
India 20.8 10.9 33.8 12.5 2.7 1.5 42.7 75.1
Nepal 3.6 11.9 65.6 65.9 -- 0.2 30.8 22
Pakistan 59.3 56.7 12 8.1 1.4 2.3 27.3 32.8
Sri Lanka 39.7 40.5 30.2 30.6 4.2 3.5 25.9 25.4
China 47.1 17.0 30.2 37.5 3.9 1.0 18.7 44.4
Low-income countries 29.2 16.3 28.4 19.7 2.5 1.8 40.3 62.4
Middle-income countries 27.0 24.1 45.4 46.9 3.2 2.6 25.0 26.5
High-income countries 26.5 22.1 33.8 26.7 7.1 10.0 32.9 41.7
World 26.6 22.5 35.2 30.2 6.6 8.7 32.1 38.8
Source: World Development Indicators 2005, the World Bank.
159
potential for intra-regional trade in South Asia. Second, all SAARC members, except
India, have little ability to produce and trade in manufactured goods, and would
therefore benefit greatly from the inclusion of services within SAFTA. Third, the
availability of services (especially tourism, health, education, and labour) within the
region will also help attract consumers from other parts of the world. The
development of a services infrastructure within the region will boost its share in global
trade in services.
As a result, there is no alternative to including the services sector within the SAFTA
framework if members wish to realise the gains of a free-trade zone. Thus, SAFTA
members should spend more on resources to abolish barriers to trade in services such
as transport, tourism, investment, insurance, freight, and energy rather than in goods
(Pohit 2004). In this context, the inclusion of services in SAFTA presents a mixed
bundle of opportunities and risks. Although such a measure is necessary, its
implications for SAFTA members have yet to be assessed. The consequences of
including services need to be analysed from different perspectives, including
economic, political, macro-level, and micro-level.
Importance of Services in SAARC Countries The share of services in GDP has increased globally as well as in individual Asian
countries (Table 1). However, this growth has been uneven. India shows the highest
recorded growth in services' contribution to GDP (10 percent); followed by Sri Lanka
(7 percent), Nepal (6 percent), Bangladesh and Pakistan (4 percent), and China (2
percent). Similarly, its share in low-income countries grew from 41 to 49 percent, from
46 to 54 percent in middle-income countries, and from 65 to 71 percent in high-
income countries. The share of services in GDP at a global level has increased from 61
percent in 1990 to 68 percent in 2003.
The export of commercial services as a percentage of GDP grew for all SAARC member
countries, except for Bangladesh and Pakistan (Table 2). The growth rate was faster
for India (from 1.45 to 4.17 percent). Nepal's export of commercial services as a
percentage of GDP reached 5.16 percent in 2003, from 4.58 percent in 1990. In 2003,
the share of commercial services as a percentage of GDP was highest for Sri Lanka
(7.60 percent). Similarly, the share of commercial services as a percentage of GDP was
2.96 percent for low-income countries, 4.46 percent for middle-, and 4.87 percent for
high-income countries.
As shown in Table 3, computer, information, communications, and other commercial 7services are emerging as the most dynamic service sectors globally as well as in South
8Asia. At the global level, the share of the transport sector declined from 26.6 percent 9in 1990 to 22.5 percent in 2003, and of the travel sector from 35.2 percent to 30.2
percent in the same period. However, the share of financial and insurance services
increased slightly from 6.6 to 8.7 percent, while computer, information,
communications, and other commercial services recorded their highest growth from
32.1 to 38.8 percent in the same period at the global level.
The table above shows that, in South Asia, computer, information, communications,

162161
communications, and other commercial services; and in travel and transport services,
respectively.
Intra-regional Services Trade: Prospects and ChallengesNow that the SAARC member countries are ready to include services within the
SAFTA framework, it is imperative that the potential of intra-regional services trade
and its implications for the group's members be examined. Apart from being an
important source of foreign earnings and attracting investment, the entry of foreign
(regional) suppliers as a result of free trade in services ought to stimulate competition,
which in turn improves the efficiency of domestic industries. As mentioned earlier,
improvement in the delivery of services is critical to developing efficient and
Table 4: SAARC: Revealed Comparative Advantage in Commercial Services
Year Region/Economy
1990 2003
Bangladesh 0.8 0.2
Pakistan 1.0 0.5
Sri Lanka 1.0 1.1
India 1.1 1.6
Nepal 2.5 1.6
South Asia 1.1 1.4
Low- and middle-income countries 0.7 0.7
High-income countries 1.1 1.0
Source: Bhatt Shiv Raj (2005), “Service Trade Liberalization under WTO:
Implications and Strategies for Nepal” A research report prepared
for Nepal Window II Trade Related Capacity Building Programme,
UNDP/Government of Nepal, December 2005.
Table 5: Sector-wise Revealed Comparative Advantage
Transport Travel Insurance
and Financial
Computer, Information, and Other Communication Services
Region/Economy
1990 2003 1990 2003 1990 2003 1990 2003
Bangladesh 0.5 0.8 0.2 0.4 0.01 0.9 2.5 1.5
India 0.7 0.4 1.0 0.4 0.4 0.1 1.3 1.9
Nepal - 0.5 1.8 2.1 - 0.02 0.9 0.5
Pakistan 2.1 2.5 0.4 0.2 0.2 0.2 0.8 0.8
Sri Lanka 1.4 1.8 0.9 1.0 0.6 0.4 0.8 0.6
South Asia 1.0 1.2 0.9 0.4 0.3 0.1 1.2 1.7
Low- and middle-income countries 1.0 1.0 1.2 1.5 0.4 0.2 0.8 0.6
High-income countries 1.0 0.9 1.0 0.8 1.07 1.1 1.0 1.0
Source: Bhatt Shiv Raj (2005), “Service Trade Liberalization under WTO: Implications and Strategies for Nepal”
A research report prepared for Nepal Window II Trade Related Capacity Building Programme,
UNDP/Government of Nepal, December 2005.
successful manufacturing and agricultural sectors in LDCs. Moreover, liberalisation
could increase the import of services that can add to their overall availability and to
the variety and quality from which individual and corporate consumers can choose
and benefit from.
The claimed benefits, however, are not automatic. While regional approaches to
liberalising services may benefit relatively more advanced countries, such as India, it
can also lead to job losses, price increases, and discontinuation of essential services
such as health, education, or water in LDCs. It can also be argued that its effects on
the poor may not be equally favourable, mainly because suppliers are likely to focus on
more profitable segments of the region. For example, after liberalisation of the
services sector within SAARC, a Nepalese investor wanting to invest in the health
sector may be more inclined to invest in other countries in the region that offer better
returns on his investment, rather than in Nepal. This would deprive Nepal's health
sector of any possible investment benefits.
Such doubts and claims, however, can be nullified and the benefits of trade
liberalisation can be seized by employing appropriate strategies and actions at the
regional level. In order to capitalise on the inclusion of services within SAFTA, an
initiative to increase the availability of services in less developed parts of the LDCs is
desirable. Such an initiative should also include a regional investment cooperation
mechanism, particularly for less-developed parts of the region. For instance, through
capital investment and technology transfer cooperation, India's rapidly growing
economy and technological advancements could be used to catalyse growth in other
capital-scarce and technologically weak member countries. Similarly, since all the
SAARC member countries are labour-abundant, there is huge potential to gain from
the supply of labour in labour-scarce developed countries, provided these South Asian
countries develop the skills of their labour force as per global requirements. The
inclusion of services within SAFTA thus also demands a regional strategy to develop
the skills of the labour force and a means of directing labour supply towards the global
labour market.
Need for a Collective Services Action PlanTo capitalise on the potential of services trade, SAARC countries need to prepare and
implement a collective action plan for liberalisation of services. The Islamabad
Summit took some far-reaching decisions, including a commitment to create a South
Asian Economic Union. The Summit also committed itself to intensify cooperation in
a number of services areas, including energy, transport, transit and communication
links across the region, establishment of a South Asian Development Bank,
cooperation among central banks, and development of tourism within the region.
Various decisions were taken at the recent Dhaka Summit, to achieve the goals set out
at the Islamabad Summit. To move towards achieving the goal of creating a South
Asian Economic Union, SAARC members decided to include services under the
SAFTA framework.
It is anticipated that the inclusion of services within the SAFTA framework will be
beneficial for all its members. However, as mentioned earlier, to benefit from trade
liberalisation of the services sector, an action plan is imperative. First, it is necessary
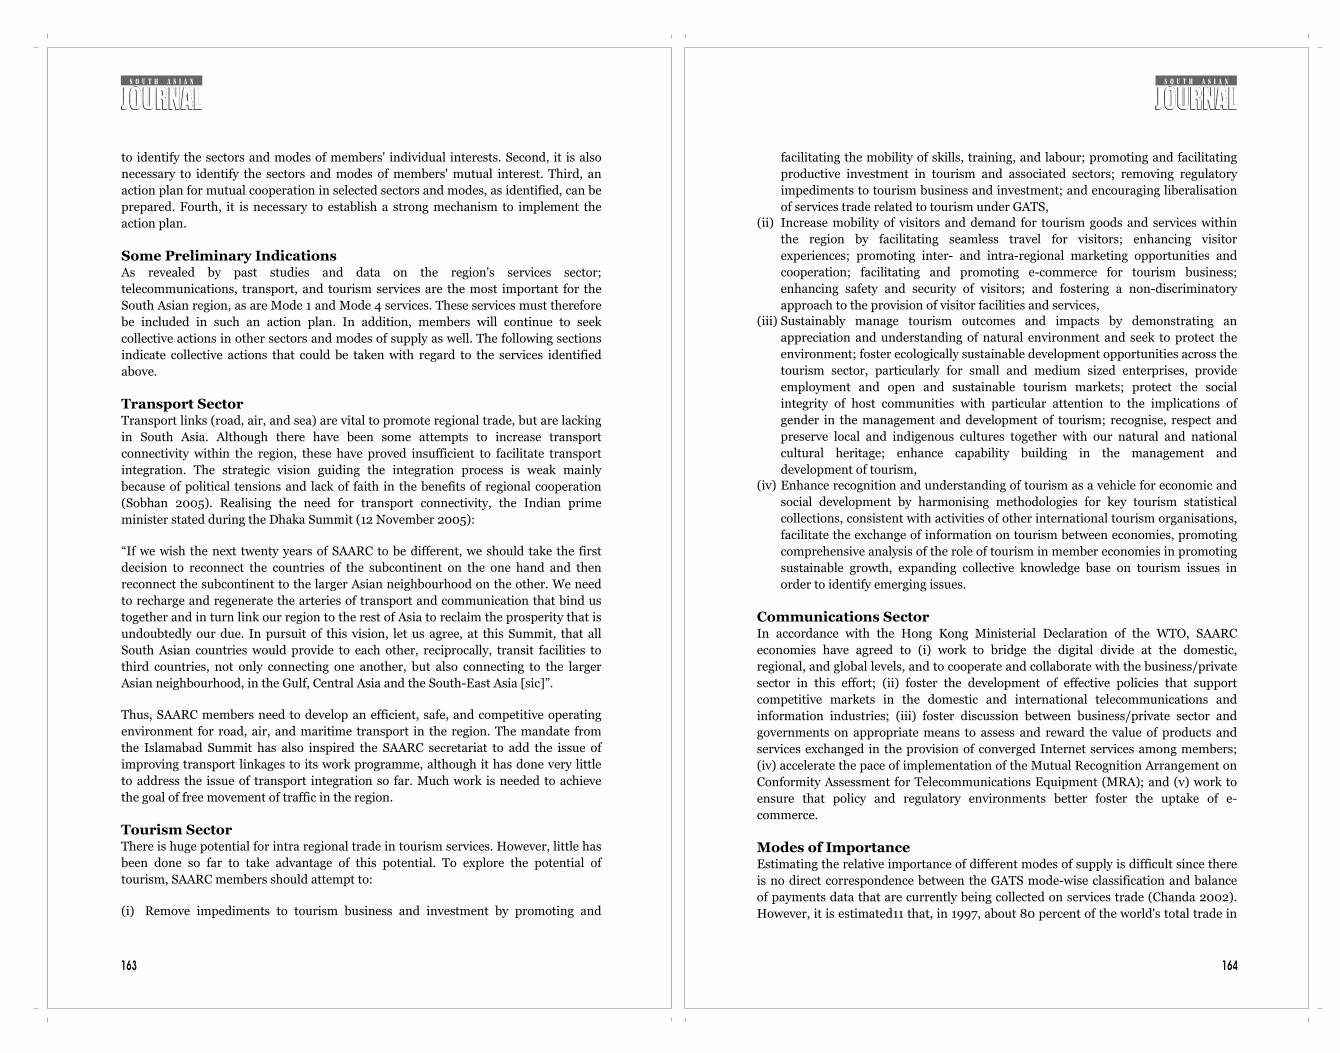
164
facilitating the mobility of skills, training, and labour; promoting and facilitating
productive investment in tourism and associated sectors; removing regulatory
impediments to tourism business and investment; and encouraging liberalisation
of services trade related to tourism under GATS, (ii) Increase mobility of visitors and demand for tourism goods and services within
the region by facilitating seamless travel for visitors; enhancing visitor
experiences; promoting inter- and intra-regional marketing opportunities and
cooperation; facilitating and promoting e-commerce for tourism business;
enhancing safety and security of visitors; and fostering a non-discriminatory
approach to the provision of visitor facilities and services, (iii) Sustainably manage tourism outcomes and impacts by demonstrating an
appreciation and understanding of natural environment and seek to protect the
environment; foster ecologically sustainable development opportunities across the
tourism sector, particularly for small and medium sized enterprises, provide
employment and open and sustainable tourism markets; protect the social
integrity of host communities with particular attention to the implications of
gender in the management and development of tourism; recognise, respect and
preserve local and indigenous cultures together with our natural and national
cultural heritage; enhance capability building in the management and
development of tourism, (iv) Enhance recognition and understanding of tourism as a vehicle for economic and
social development by harmonising methodologies for key tourism statistical
collections, consistent with activities of other international tourism organisations,
facilitate the exchange of information on tourism between economies, promoting
comprehensive analysis of the role of tourism in member economies in promoting
sustainable growth, expanding collective knowledge base on tourism issues in
order to identify emerging issues.
Communications SectorIn accordance with the Hong Kong Ministerial Declaration of the WTO, SAARC
economies have agreed to (i) work to bridge the digital divide at the domestic,
regional, and global levels, and to cooperate and collaborate with the business/private
sector in this effort; (ii) foster the development of effective policies that support
competitive markets in the domestic and international telecommunications and
information industries; (iii) foster discussion between business/private sector and
governments on appropriate means to assess and reward the value of products and
services exchanged in the provision of converged Internet services among members;
(iv) accelerate the pace of implementation of the Mutual Recognition Arrangement on
Conformity Assessment for Telecommunications Equipment (MRA); and (v) work to
ensure that policy and regulatory environments better foster the uptake of e-
commerce.
Modes of ImportanceEstimating the relative importance of different modes of supply is difficult since there
is no direct correspondence between the GATS mode-wise classification and balance
of payments data that are currently being collected on services trade (Chanda 2002).
However, it is estimated11 that, in 1997, about 80 percent of the world's total trade in
163
to identify the sectors and modes of members' individual interests. Second, it is also
necessary to identify the sectors and modes of members' mutual interest. Third, an
action plan for mutual cooperation in selected sectors and modes, as identified, can be
prepared. Fourth, it is necessary to establish a strong mechanism to implement the
action plan.
Some Preliminary IndicationsAs revealed by past studies and data on the region's services sector;
telecommunications, transport, and tourism services are the most important for the
South Asian region, as are Mode 1 and Mode 4 services. These services must therefore
be included in such an action plan. In addition, members will continue to seek
collective actions in other sectors and modes of supply as well. The following sections
indicate collective actions that could be taken with regard to the services identified
above.
Transport SectorTransport links (road, air, and sea) are vital to promote regional trade, but are lacking
in South Asia. Although there have been some attempts to increase transport
connectivity within the region, these have proved insufficient to facilitate transport
integration. The strategic vision guiding the integration process is weak mainly
because of political tensions and lack of faith in the benefits of regional cooperation
(Sobhan 2005). Realising the need for transport connectivity, the Indian prime
minister stated during the Dhaka Summit (12 November 2005):
“If we wish the next twenty years of SAARC to be different, we should take the first
decision to reconnect the countries of the subcontinent on the one hand and then
reconnect the subcontinent to the larger Asian neighbourhood on the other. We need
to recharge and regenerate the arteries of transport and communication that bind us
together and in turn link our region to the rest of Asia to reclaim the prosperity that is
undoubtedly our due. In pursuit of this vision, let us agree, at this Summit, that all
South Asian countries would provide to each other, reciprocally, transit facilities to
third countries, not only connecting one another, but also connecting to the larger
Asian neighbourhood, in the Gulf, Central Asia and the South-East Asia [sic]”.
Thus, SAARC members need to develop an efficient, safe, and competitive operating
environment for road, air, and maritime transport in the region. The mandate from
the Islamabad Summit has also inspired the SAARC secretariat to add the issue of
improving transport linkages to its work programme, although it has done very little
to address the issue of transport integration so far. Much work is needed to achieve
the goal of free movement of traffic in the region.
Tourism SectorThere is huge potential for intra regional trade in tourism services. However, little has
been done so far to take advantage of this potential. To explore the potential of
tourism, SAARC members should attempt to:
(i) Remove impediments to tourism business and investment by promoting and

166165
services was via Mode 1 (cross-border supply) and Mode 3 (commercial presence). Of
the remaining 20 percent, only 1.4 percent of services trade occurred via Mode 4
(movement of persons).
In South Asia, Mode 1-related services (information technology [IT]-related) are
important for India and Bangladesh (Tables 3 and 4). Moreover, India is now
emerging as one of the world's major exporters of IT services. Other South Asian
countries, particularly Sri Lanka, Pakistan, Bangladesh, and even the Maldives and
Nepal have the potential to share in the rapidly growing IT market. India's expanding
IT sector can play a crucial role in facilitating spill-over effects in other South Asian
countries, which may be critical to the development of LDCs in particular because they
enhance capacity and encourage investment in the IT sector, allowing such countries a
foothold in the global IT market. Therefore, effective planning and coordination
among member countries, with India in a lead role, could help South Asian countries
explore the potential of a 'regional IT industry'.
Travel-related activities that are usually associated with Mode 2 are most important
for Nepal and Sri Lanka (Tables 3 and 4). Similarly, the volume of remittances shows
the relative importance of trade in Mode 4 for labour-abundant South Asian countries
such as Bangladesh, Nepal, and Sri Lanka. In these countries, remittances are a large
source of private financial flows and could provide an additional source for poverty
reduction (Table 6).
As discussed above, Modes 1, 2, and 4 are the most important for South Asia,
requiring a regional action plan to shape favourable policies and infrastructure to
facilitate proper utilisation of available resources. The action plan should include,
among other things, cooperation in IT (e.g., establishment of regional IT
hubs/centres), introduction of single SAARC visa for travellers from within the region
and outside, a cooperative human resource development strategy targeting global
labour markets, and establishment of technical institutes for human resource
development.
ConclusionThe competitiveness of producers largely depends on access to efficient services.
Moreover, services are an integral part of other economic activities, on which the
liberalisation of services produces positive spill-over effects. Increased efficiency and
Table 6: Workers’ Remittances and Compensation of Employees
US$ Million As % of GDP Country
1990 2004 1990 2004
Bangladesh 779 3584 2.59 6.33
India 2384 21727 0.75 3.14
Nepal 0 823 0.0 12.27
Pakistan 2006 3945 5.01 4.10
Sri Lanka 401 1590 4.99 7.93
Source: Compiled from World Development Indicators 2006.
productivity gains in services and other sectors of the economy will help South Asian
countries grow faster. The service sector's liberalisation could also help
ensure/increase consumers' right to choose. However, the benefits of services
liberalisation cannot be achieved automatically, and there are risks associated with it.
Although the inclusion of services within SAFTA may improve the living conditions of
people in the region, each South Asian country will be affected differently. Appropriate
planning and sequencing is needed to maximise gains, while minimising the
disadvantages. An action plan built on these realities may help seize opportunities
while mitigating the associated risks of liberalising trade in services under SAFTA.
Shivraj Bhatt is a trade economist at South Asia Watch on Trade, Economics and
Environment (SAWTEE) in Nepal.
Endnotes1 The term services cover a heterogeneous range of intangible products and activities that are
difficult to encapsulate within a simple definition. System of National Accounting 1993
(SNA 1993) defined the term services as follows: “Services are not separate entities over
which ownership rights can be established. They cannot be traded separately from their
production. Services are heterogeneous outputs produced to order and typically consist of
changes in the condition of the consuming units realised by the activities of the producers at
the demand of the customers. By the time their production is completed they must have
been provided to the consumers.” Under International Standard Industrial Classification
System (ISIC), services correspond to ISIC divisions 50-99. For simplicity we can define
services as 'intangible, invisible and perishable products, requiring simultaneous
production and consumption'.2 International transactions (trade) in services are defined by the IMF's Balance of Payments
Manual (1993) as the economic output of intangible commodities that may be produced,
transferred, and consumed at the same time.3 Commercial service exports are total service exports minus exports of government services
not included elsewhere (The World Bank, World Development Indicators 2006, p 217).4 The United Nations Central Product Classification (CPC) system identifies 11 basic service
sectors (plus a twelfth category for miscellaneous services). The GATS agreement of the
WTO largely follows this classification of services in the specific schedule of commitments
of the member countries. The sectors are: (i) Business services (including professional and
computer), (ii) Communication services, (iii) Construction and related engineering services,
(iv) Distribution services, (v) Educational services, (vi) Environmental services, (vii)
Financial services (including banking and insurance), (viii) Health-related and social
services, (ix) Tourism and Travel-related services, (x) Recreational, cultural and sporting
services, (xi) Transport services, and (xii) Other services not included elsewhere. These
sectors are subdivided into some 160 sub-sectors or separate service activities, which
themselves contain sub-groups. As an example, the 'financial services' category breaks
down into two sub-sectors (a) Insurance and Insurance Related Services and (b) Banking
and other Financial Services. The insurance services category further sub divided into 3
categories: direct insurance (life and non-life), re-insurance and retrocession, and services
auxiliary to insurance. While the banking services category further sub divided into 11
categories, which are: acceptance of deposits and other repayable funds from the public;
Lending of all types, including, inter-alia, consumer credit, mortgage credit, factoring and
financing of commercial transactions; Financial leasing; All payment and money
transmission services; Guarantees and commitments; Trading for own account or for
account of customers, whether on an exchange, an over-the-counter market or otherwise;
Participation in issues of all kinds of securities, including under-writing and placement as

168
lChadha R (1999), GATS and Developing Countries: A Case Study of India, mimeo, National
Center for Advanced Economic Research, New Delhi. lChanda Rupa (2002), Globalization of Services: India's Opportunities and Constraints,
Oxford University Press, New Delhi.lDee, P. and K. Hanslow (2000) 'Multilateral Liberalization of Services Trade', Staff
Research Paper, Productivity Commission, Canberra.lFindlay, C. (2003) 'Services', background paper for the UN Millennium Project Task Force
on Trade, March 2003.lHoekman, Bernard (2000), The Next Round of Services Negotiations: Identifying Priorities
and Options, Federal Reserve Bank of St. Louis Economic Review, July/August 2000.lHoekman B., Carlos A Primo Braga (1997), Protection and Trade in Services: A Survey, The
World Bank. lJane Drake-Brockman (2003), Regional Approaches to Services and Investment
Liberalization, Pacific Economic Papers No. 337, AustraliaJapan Research Centre, Asia
Pacific School of Economics and Government, The Australian National University,
Canberra.lJansen Marton (2006), Service Trade Liberalization at the Regional Level: Does Southern
and Eastern Africa Stand to Gain From EPA Negotiations, Economic Research and
Statistical Unit, The WTO. lMarchetti Juan A. (2004), Developing Countries in the WTO Services Negotiations, Staff
Working Paper ERSD-2004-06, WTO Geneva.lMattoo A. and Sauve Pierre (2003), Domestic Regulation and service Trade Liberalization,
World Bank and Oxford University Press.lMattoo A. and Fink Carsten (2002), Regional Agreement and Trade in Services: Policy
Issues, Policy Research Working Paper No. 2852, The World Bank Development Research
Group. lMattoo A., Rathindran R. and Subramanian A. (2001), Measuring Services Trade
Liberalization and its Impact on Economic Growth: An Illustration, World Bank Research
Working Paper, No. 2655, Washington, D.C.: The World Bank.lOECD (2003), Service Providers on the Move, Policy Brief, OECD publication section,
Paris, August 2003.lOECD (2002a), GATS: The Case for Open Services Markets, OECD publication section,
Paris.lOECD (2002b), Service Providers on the Move: a Closer Look at Labour Mobility and the
GATS, Working Party of the Trade Committee, TD/TC/WP(2001)26/FINAL, Paris, 20
February 2002.lOECD (2002c), Service Providers on the Move: the Economic Impact of Mode 4, Working
Party of the Trade Committee, TD/TC/WP(2002)12/FINAL, Paris,19 March 2003.lOECD (2002d), Service Providers on the Move: Mutual Recognition Agreements, Working
Party of the Trade Committee, TD/TC/WP (2002)48, Paris, 6 February 2003.lPohit Sanjib (2004), “SAFTA: Much effort for little gains?” in Business Line, Financial
Daily from Hindu Group of publications, January 03, 2004lhttp://www.thehindubusinessline.com/2004/01/03/stories/2004010300070800.htmlSauve, P. (2002) 'The relationship between regional trade agreements and the multilateral
trading system services', Working Party of the Trade Committee, OECD Trade Directorate,
19 October.lSobhan Rehman (2005), Roadmap for South Asian Cooperation, South Asian Journal,
Issue 6, January 2005.lStephenson, S. and D. Nikomborirak (2002) 'Regional liberalisation of services', in S.
Stephenson, C. Findlay and S. Yi (eds), Services Trade Liberalisation and Facilitation, Asia
Pacific Press, The Australian National University.lUNCTAD (2003a), Trade in Services and Development Implications, Note by the UNCTAD
Secretariat, TD/B/COM.1/62, 16 December 2003.
167
agent (whether publicly or privately) and provision of service related to such issues; Money
broking; Asset management, such as cash or portfolio management, all forms of collective
investment management, pension fund management, custodial depository and trust
services; Settlement of and clearing services for financial assets, including securities,
derivative products, and other negotiable instruments; Provision and transfer of financial
information, and financial data processing and related software by providers of other
financial services; and advisory services on all the activities listed above.5 According to Article 1 of the General Agreement on Trade in Services (GATS) of the World
Trade Organization (WTO) services can be supplied through four different modes: Mode 1:
Cross Boarder Supply: Services supplied from the territory of one Member into the territory
of another. An example is software services supplied by a supplier in one country through
mail or electronic means to consumers in another country. Mode 2: Consumption Abroad:
Services supplied in the territory of one Member to the consumers of another. Examples are
where the consumer moves, (e.g. to consume tourism or education services in another
country). Mode 3: Commercial Presence: Services supplied through any type of business or
professional establishment of one Member in the territory of another. An example is a bank
owned by citizens of one country establishing a branch in another country. Mode 4:
Movement of Natural Persons: Services supplied by nationals of one Member in the
territory of another. Examples are a doctor of one country supplying through his physical
presence services in another country, or the foreign employees of a foreign bank.6 For a summary of the most important studies see Hoekman, 2000.7 Computer, information, communications, and other commercial services include such
activities as international telecommunications and postal and courier services; computer
data, news-related service transactions between residents and nonresidents; construction
services; royalties and license fees; miscellaneous business, professional, and technical
services; and personal, cultural, and recreational services (World Development Indicators
2006, p 217).8 Transport covers all transport services (sea, air, land, internal waterway, space and
pipeline) performed by residents of one economy for those of another (World Development
Indicators 2006, p 217). 9 Travel covers goods and services acquired from an economy by travelers in that economy
for their own use during visits of less than one year for business or personal purposes
(World Development Indicators 2006, p 217).10 Revealed comparative advantage is the ratio of a region/country's export of commercial
services/services of particular sector or mode to its total exports divided by the ratio of
world's exports of commercial services/services of particular sector or mode to the world's
total exports. It is the ratio of two ratios. An RCA greater than on reveals the presence of
comparative advantage while an RCA less than one reveals absence of comparative
advantage. An RCA of unity reveals neutrality to the presence or absence of comparative
advantage.11 For more details, see Table 2.2 (page 17) in Chanda 2002.
ReferenceslBhatt Shiv Raj (2006a), “Make SAFTA Work for South Asia” an article published in The
Kathmandu Post, an English Daily published from Kathmandu, Nepal, June 26, 2006.lBhatt Shiv Raj (2006b), “Nepal's WTO Membership: Opportunities and Challenges” South
Asian Journal Vol. 12, South Asian Free Media Association (SAFMA), April-June 2006. lBhatt Shiv Raj (2005a), “Services Trade Liberalization under WTO: How could Nepal
Benefit”, New Business Age, a Monthly Magazine published from Kathmandu, Nepal,
December 2005.lBhatt Shiv Raj (2005b), “Service Trade Liberalization Under WTO: Implications and
Strategies for Nepal” A research report prepared for Nepal Window II Trade Related
Capacity Building Programme, UNDP/HMG Nepal, December 2005.

170169
lUNCTAD (2003b), Increasing the Participation of Developing Countries through
Liberalization of Market Access in GATS Mode 4 for Movement of Natural Persons
Supplying Services, Note by the UNCTAD Secretariat, TD/B/COM.1/EM.22/2, 18 June
2003.lUNCTAD (2003c), Report of the Expert Meeting on Market Access Issues in Mode
(Movement of Natural Persons Supplying Services) and Effective Implementation of Article
IV on Increasing the Participation of Developing Countries, TD/B/COM.1/64 and
TD/B/COM.1/EM.22/3, 27 November 2003.lUNDP (2005), Voices of the Least Developed Countries of Asia and the Pacific, UNDP and
UNESCAP.lUNDP (2003), Making Global Trade Work for People, Earthscan Publications Ltd., UNDP.lWorld Bank (2005), World Development Indicators, the World Bank.lWorld Bank (2004), Global Economic Prospects: Realizing the Development Promise of the
Doha Agenda, The World Bank.lWorld Bank (2003), Moving People to Deliver Services: How Can the WTO Help? World
Bank Policy Research Working Paper No. 3238.
Seven Years under General Pervez Musharraf
M. Ziauddin
(Editor's note: The South Asian Journal has initiated debate on various topics in its 'Viewpoint' column, and invites comments or articles offering
different perspectives on this or any other subject.)
resident General Pervez Musharraf enters the eighth year of his rule with many
achievements as well as political, economic, and social baggage, not the least of
which is his ribbon-laden uniform. Will he give up the uniform or not? This will Pbe, perhaps, the biggest question the nation will be debating in the next 12 months.
According to one interpretation of the Constitution, he is bound to give up one of his
two jobs by October 2007. According to another, he has to be elected 60 days before
the demise of the current National Assembly, which will happen in November 2007.
This will then allow him to contest the election in uniform, if he chooses to, in or
around August 2007.
The UniformCompounding this debate is the question of all questions: will the President repeat the
charade of 2004 when the constitution was bent under the 17th amendment to allow
him to be endorsed in presidential office rather than be elected in a democratic contest
by the Electoral College (the National Assembly, Senate, and four provincial
assemblies)? If the answer to this question is no, then will he contest in his military
regalia against civilian candidates put up by the opposition parties? But if the answer
to this question is yes, then what is to stop Musharraf's successor chiefs of army staff
from offering themselves as candidates for office in the future? If Musharraf wants to
contest the election as a civilian, then the constitutional provision barring government
officials from contesting an elective office before a lapse of two years from the date
they leave their government job would disqualify him from contesting the election,
unless of course he manages to wangle a one-time exemption from this proviso.
The question of uniform has chased Musharraf doggedly ever since he reneged on his
promise to doff his uniform by 31 December 2003. He has never given a convincing
answer to the question. While addressing the nation on 30 December 2003,
Musharraf said that he needed the uniform to tackle, among other things, extremism
and terrorism; to maintain the much-needed continuity in economic policies; and
deepen harmony among political, bureaucratic, and military institutions. Last year, at
the height of the earthquake crisis, he had the temerity to say that, had he not been in
uniform, the chief of army staff would have taken his own sweet time responding to an
SOS from a civilian prime minister calling for assistance in the relief and rescue
Viewpoint
fairly good progress India is making. The chances are that the car making plans will be
shelved after having satisfied local demand over the next three years with imports, and
the land acquired in the name of putting up the car plants will either be sold off in
profitable parcels or developed for luxury housing or commercial plazas. The biggest
scam of the last 12 months was, however, the privatisation of the Pakistan Steel Mills
which was cancelled by the Supreme Court when it pointed out a number of
commissions and omissions in the process. The government has now filed a review
petition with the Supreme Court seeking reversal of its judgment.
Political HarmonyThe next was Musharraf's promise to introduce political harmony among the
federating units. Instead, on three occasions in the last 12 months, he has brought the
country almost to breaking point. The first occasion was when he tried to use the
bluster of his uniform to force the three smaller provinces to consent to the
construction of the controversial Kalabagh dam. Not only this did not happen, but in
the process he unleashed political chaos of unprecedented volatility on the national
scene. Kalabagh dam was a dead and buried project long before Musharraf came onto
the scene. It was proposed in the tenure of President General Ziaul-Haq in 1986 but
shot down immediately by his own colleague, the then governor of NWFP, General
Fazl-e-Haq. Nawaz Sharif attempted to revive the project during his last tenure, but
even his heady two-thirds majority in Parliament could not force the smaller provinces
to give up their opposition to the controversial dam. Musharraf thought he could
succeed where others had failed. In his over-confidence in the power of his uniform to
succeed, he lost precious years, and by the time he was forced by the government's
coalition partners from Sindh to abandon his Kalabagh dream and take a decision on
the Diamir Bhasha dam, the country had already started suffering water shortages and
considerable power load-shedding
The Balochistan CrisisThe second time Musharraf pushed the country to the political precipice was when
Nawab Akbar Khan Bugti, the sardar of the Bugti tribe in Balochistan was killed in an
army operation. One is unsure at this point if the events that started unfolding
following his assassination and the callous way his body was buried are amenable to
political appeasement. It was indeed, the pointless killing of an 80-year-old man
whose only fault was his pride. As of today, Balochistan is on the boil. The military-led
central government in Islamabad appears overly determined to establish the writ of
the state and 'protect' the country's strategic assets at all costs. The 'rebellious' Baloch
leadership, on the other hand, appears set to fight to the last Baloch to defeat this writ
and re-establish its proprietary right over these very assets.
Unfortunately for Pakistan, it looks as if both its friends and foes have decided to take
advantage of the alienation that had seeped into the Baloch people in the wake of the
two-year long military action against what the government claims to be 'miscreants'.
Of course, India is to be at the top of the list of interested parties. The Indians perhaps
feel they have a legitimate right to jump into the Balochistan fray in retaliation for
what they think Pakistan has been doing inside Indian-administered Kashmir. Indeed,
Musharraf seems to have given the Indians an opportunity of a lifetime on a platter.
172
operations. Things have only deteriorated on all these fronts over the last three years.
The October 2005 EarthquakeThe relief work mounted by the Pakistan army following last year's colossal
earthquake tragedy in which over 70,000 people died, millions were rendered
homeless and destitute, and thousands orphaned, widowed and physically
incapacitated has been rated by impartial observers as excellent. But one should also
not ignore the crucial role played by Pakistan's independent electronic media, which
braved the worst odds to reach the most difficult places to report extensively and alert
the army on the geography and magnitude of the disaster. The country is beholden to
timely and generous international help. The air sorties that were undertaken in an
unprecedented number by NATO and the airforces of other countries to bring in relief
goods, doctors, and even complete hospitals, did more than half the relief job.
However, the reconstruction work for which donors have already pledged huge sums
(over $5 billion) has been disappointingly slow. With winter about to set in, only 10
percent of reconstruction is said to have been completed. The Earthquake
Reconstruction and Rehabilitation Agency (ERRA) has been accused of dragging its
feet either because of the inbuilt difficulties of official red tape or because of alleged
corruption within its hierarchy.
CorruptionWhen Musharraf took over on 12 October 1999, he promised a corruption-free
government and one that would bring harmony among the federating units. But all
through the last seven years, he has appeared to let himself be guided by big business
on the corruption score and allowed his local neo-conservative advisors to smash to
smithereens whatever provincial harmony had existed in the country by launching two
mini-domestic wars, one in Waziristan (now almost over) and the other in
Balochistan, to establish what his advisors perceived as the so-called writ of the state.
Let us first take the issue of corruption. A recent survey conducted by the Pakistan
chapter of Transparency International has estimated that Pakistanis pay as much as
Rs45 billion annually to grease their way out of manmade jams at the lower officials
echelons. Then there are the mega-corruption cases that have erupted all of a sudden
during the last 12 months. First, it was the crash of the stock exchanges, allegedly
manipulated by a cartel of four or five big stockbrokers; then it was hoarding and
black marketing by the sugar and cement cartels made up of cabinet members; earlier
it was oil price fixing by oil marketing companies, which functioned as a cartel under
government patronage. This is not all. Huge tracts of land are being allotted to
favourite parties at throwaway prices, ostensibly to set up plants to make luxury cars
(black cabs, Daimler Chryslers, and Mercedes Benz, etc). Simultaneously, these parties
have been allowed to import these cars at depressed duties over the next three years,
the time that sponsors claim it would take them to set up the plants to manufacture
these cars in Pakistan. If this is not a rip-off on a grand scale, one does not know what
it is, because without an export market, such car plants make no economic sense and
there is no possibility of Pakistan becoming a genuine car exporter in the foreseeable
period considering the rapid progress China has already made in this sector and the
171
174173
India would only too happy to see Pakistan bogged down in troubled Balochistan to
lessen the pressure on its part of Kashmir. India has another reason to eye Balochistan
to flush out so-called foreign Al-Qaeda militants from the tribal belt. Almost the entire
nation - except of course the government which came into being through an allegedly
rigged election in 2002 - opposed the move on two counts. First, nobody liked the idea
of the army being used against their own brothers, and second, wiser counsels knew
that there was no way the Pakistan army could subjugate the battle-hardened tribal
population. This is exactly what happened. For the first time, the Pakistan army seems
to have been defeated comprehensively by a section of its own population. The 'peace'
accord that was signed between the army and tribal leaders in September reads like a
surrender document, with the former agreeing to all the terms and conditions laid
down by the latter. What is more tragic is that Musharraf, who had kept denying it all
these years, admitted in Kabul in the first week of September that the Taliban do cross
over from Pakistan to Afghanistan, but that the Pakistan government and its agencies
were not involved in this clandestine use of Pakistani soil to launch militancy across
the Afghan border. In essence what Musharraf was saying was that, since he could not
eliminate the Taliban, he had decided to live with them, and that Afghanistan should
do the same! If anything, his handling of the entire Waziristan situation has been a
total failure and its repercussions are likely to be horrendous for Pakistan.
The Peace ProcessThe peace process between India and Pakistan seems to be withering away. No sane
person in Pakistan would be happy to see the process stop or go into reverse gear, but
when one keeps insisting, and that too from a position of total weakness, that without
the resolution of the Kashmir problem there cannot be lasting peace in the region,
then one must also be prepared to suffer the consequences of this folly. India is not a
regional superpower. It is not even a developed country, but in the last one and a half
decades, it has come a long way in economic and social progress. It is respected in the
comity of the nation because it is the world's largest democracy, and it is counted as
one of the two Asian countries, the other being China, that will lead the Asian century
to success. To even think that Pakistan can on its own, or with the help of others like
the US and Europe, force India to give up Kashmir to earn its friendship is nothing
less than madness. Here, it should also be noted that there is no such thing as
magnanimity in inter-state relationships. It is also wrong to expect India to offer us
Kashmir on a platter out of magnanimity. It was indeed wrong to think that India
would give up its constitutional position on Kashmir to reciprocate Pakistan's offer to
give up its stated position on the relevant UN resolutions.
The best time for Pakistan to have come to some kind of settlement with India on
Kashmir was at the Agra summit. At the time, India was bleeding in Kashmir; it was
on the defensive and looking for a reasonable way out of the crisis. But instead of
allowing Prime Minister Atal Behari Vajpayee to save face by distancing itself, at least
in words if not in deed, from the ongoing militancy inside Indian-administered
Kashmir, Pakistan insisted that India start talks on Kashmir immediately as a trade-
off to the vague offer that Pakistan was prepared to go beyond its stated position on
the core issue.
We really did miss the bus in Agra because after 9/11, its so-called and perhaps under
the circumstances reasonably effective foreign policy instrument of jihad had become
176
With over 75 percent of its population living on $2 or less a day, poverty in Pakistan
has assumed epidemic proportions and is increasingly concentrated in backward
regions such as Balochistan, large parts of NWFP, the tribal areas, southern Punjab,
and interior Sindh. In fact, together, central Punjab and urban Sindh are said to have
been contributing as much as 95 percent to Pakistan's GDP growth all these years.
Faster growth without equitable distribution only ends up choking all development
avenues over time.
There are many factors contributing to this painful state of affairs. First is the policy of
overworking the principles of the free market and relying solely on the trickle-down
theory. What this means is that fiscal and monetary policies are framed in such a way
that only those who have bankable collaterals and influential contacts, and have
acquired an elitist education, can enter the commanding heights of industry, trade,
commerce, and lucrative professions. The crumbs that trickle down in consequence of
this rich-becoming-richer process are expected to take care of the poor. The belief is
that the more prosperous these richer classes become, the more crumbs will trickle
down to feed more of the poor. However, there is no in-built mechanism in this
system to ensure distributive justice. The system ensures that the poor remain
perpetually poor while the rich keep prospering in perpetuity. As a result, there have
emerged two Pakistans, one relatively very rich, the other very poor.
In civilised societies, the crass practices of capitalism and the consequences of free-
for-all are constantly corrected and tempered by well-entrenched statutory regulatory
mechanisms with oversight from democratic institutions conforming to a constitution
in which the interests of even the poorest are safeguarded. In Pakistan, such statutory
regulatory institutions do not exist. Those that have been set up for form's sake have
been rendered impotent by keeping them under the executive rather than overseen by
the parliament.
Another factor that has contributed to the emergence of two Pakistans and
consolidated the barrier between the two is the rise of a ruling elite, comprising the
feudal aristocracy, big business, the military, and the civil bureaucracy. Over the years,
these elite have acquired a vice-like grip over all the instruments of political,
administrative, financial, and social power. They have also used this comprehensive
power to accumulate for themselves the fruits of development by shutting out
completely the shirtless millions from the national economy.
The modus operandi here is simple: make policies that render it impossible to
redistribute land and facilitate big business to avoid paying in full the taxes due from
them. The civil and military bureaucracy has colluded with the feudal aristocracy and
big business in this matter for a generous fee from the loot. In fact, with inter-
marriages and business collaborations, these four members of the ruling elite have
become one seamless entity. They have framed the national education policy in such a
manner that a permanent and non-scalable intellectual wall has been erected between
the children of the rulers and the ruled.
No matter who is perched at the top of the heap at a particular time - feudal
175
extremely unpopular internationally, and started to be associated with international
terrorism. Without this instrument in its hands and sans anything worthwhile either
in the political or economic sphere to offer India in return for talks on Kashmir, it was
not the right time for Pakistan to keep insisting, 'Kashmir or bust'. Banking perhaps
on the perceived magnanimity of India and America's creeping economic and
anticipated nuclear hold over India, we put the cart before the horse.
For its part, India has been negotiating from a position of strength since January 2004
when a joint statement was signed between Vajpayee and Musharraf in Islamabad on
the sidelines of the SAARC summit. For New Delhi, the CBMs rather than Kashmir
was the core problem. It pursued this CBM policy relentlessly, both on the Indo-
Pakistan front as well as on the Kashmir front. As a result, firing across the Line of
Control (LoC) stopped, bus services started on more than one point on the LoC
rendering it relatively softer, and people-to-people exchanges between India and
Pakistan on the one hand and between the two Kashmirs on the other have started
and are being sustained, even when relations between the two countries cooled off
considerably following the train bombings of 11 July 2006.
India is now interested in getting Pakistan to offer it Most Favoured Nation (MFN)
status and transit facilities to trade with Afghanistan and the Central Asian states.
Pakistan, perhaps thinking that it has India where it wants it, has linked these two
Indian demands to the 'core' issue - talks. What Musharraf has failed to understand is
that fast-paced globalisation and the demands of SAFTA make it impossible for
Pakistan to hold on to these conditions for long. More importantly, if Pakistan is to
become a real economic hub and the main trading route of the region, it has to offer
and seek transit trade facilities with all its neighbours. It would thus be in the national
interest of Pakistan to stop pressing India for immediate talks on Kashmir and focus
on enlarging the CBMs for Pakistan's own - and that of the people of Kashmir's -
economic gains. At the moment, Pakistan is in no position to discuss Kashmir with
India on an equal footing. Even the US 'tilt' towards Pakistan on the Kashmir issue has
disappeared. Let us wait for a more favourable and opportune time, which is bound to
arise if we concentrate on economic progress and join China and India in making the
Asian century a success story. China waited a hundred years to get Hong Kong and is
still awaiting the return of Taiwan. Why can Pakistan not bide its time?
The EconomyAs Musharraf enters the eighth year of his rule, he should certainly be more than
satisfied with the way the economy has advanced since 2001. The country has
achieved an annual average growth rate of nearly 7 percent in the last three years.
Foreign exchange reserves are more than adequate to meet the import bill for almost
six months. Remittances from overseas Pakistanis and proceeds from the privatisation
process have encouraged liberal imports for investment activity. Income from revenue
collection has more than tripled since 1999; exports have more than doubled.
However, the veneer of sunshine in the economy still appears to be a largely borrowed
one. 9/11-related global assistance, particularly US aid, has stabilised the domestic
economy but, in the process, the disparity between rich and poor has widened
dangerously.
178177
politicians, big business, the army, the civil bureaucracy or a combination of any two
or three of them - the result is the same. The ruler of the day keeps the bulk of the loot
causing the import bill to inflate.
Even with the high rates of nominal GDP growth recorded over the last three years,
the share of imports as a percentage of GDP has risen cumulatively by 6.4 percent
since 2004. It is likely that the high consumption demand supported by simulative
policy settings will continue in the next year, further expanding the current account
deficit to nearly $12 billion. FE reserves are not likely to go beyond $14 billion.
Perhaps the Government hopes that the anticipated privatisation of the two gas
distribution companies - OGDCL and PSO - and a couple of power distribution
companies will bring in the needed resources to bridge the widening gaps in the
current account. But how long will the family silver last?
M. Ziauddin is resident editor of Dawn, Islamabad, Pakistan.

180179