13Sep2010 SAT Marketing TGS 2011 to 2013...
93
The Marketing Tourism Growth Strategy for South Africa 2011 2013 2011- 2013 2010 Edition
Transcript of 13Sep2010 SAT Marketing TGS 2011 to 2013...
The Marketing Tourism Growth Strategy for South Africa
2011 20132011- 2013
2010 Edition
Table of Contents
Introduction Page 3
Core Business of SA Tourism Page 13
Key challenges for tourism Page 21
SA Tourism Focus: Where to Play
– Review of the portfolio of markets Page 48
– International consumers Page 65
– Domestic market Page 73
R i f 2003 2008 P 79Review of 2003 – 2008 Page 79
Conclusion Page 87
2 Copyright © 2010 SA Tourism. Not to be reproduced without permission

Introduction
The information and strategic plans contained in this document are based on extensive researchand consultation conducted by SA Tourism over the past five years.y p y
The process of developing the strategy was guided by a set of core principles to which we believewe have remained true.
The insights we have gained and used to inform our strategic choices were generated through twoThe insights we have gained and used to inform our strategic choices were generated through twoparallel, but integrated, processes:
1. The Tourism Growth Strategy started in 2001 and is a market-facing process that involves on-going research and analysis to support critical choices around which markets and consumerg g y ppsegments to focus on, and specifically how to activate growth through marketing, brand positioningand channel fulfillment in the chosen focus areas while at the same time monitoring and evaluatingour work.
2 Th Gl b l C i i j d i h i 2003/4 j i j i h2. The Global Competitiveness project was done in two phases in 2003/4 as a joint project withthe National Department of Tourism and the Department of Trade and Industry. It studied howcompetitive the South African tourism sector is and has initiated a set of actions to adjust thecompetitive platforms and micro-economic context of the industry to fill key product gaps andp p y y p g pupgrade the overall performance and rate of innovation in South Africa’s tourism industry. In 2010,SA Tourism conducted a review of progress made since the first study.
This document details the Tourism Marketing Strategy of South Africa which forms part of theb d T i G h S M i f i i b i h f i / h
3 Copyright © 2010 SA Tourism. Not to be reproduced without permission
broader Tourism Growth Strategy. More information is our website www.southafrica.net/research

Guiding principles of the Marketing Tourism Growth Strategy (TGS)
We have limited human and financial resources so must be focused in all our activities so we make choices and explicit trade-offs which have a long-term
The strategic decisions that drive the TGS are based on sound data and analysis
FocusedFocused strategic impact on South African tourism. This is not about doing everything on offer but making choices based on ROI and business objectives, and making clear decisions on what to do and do not do
Data Driven and Data Driven and customer focusedcustomer focused
The strategic decisions that drive the TGS are based on sound data and analysis, and not anecdote. It is about understanding consumers who are attractive for South Africa in terms of our objectives, with the immediate focus on people who are interested in traveling to South Africa.
Consultative to buildConsultative to buildsector ‘cosector ‘co--opetitionopetition11’ ’
The TGS process is consultative and incorporates input from as many stakeholders as possible. The principle is to build “co-opetition” in the sector so that we co-operate on building volume and compete on service and move away from the current destructive competition
Goals are GDP, jobsGoals are GDP, jobsand transformationand transformation
Choices are made in relation to our mandate and the national tourism goals in the Tourism Act: to promote GDP growth and job creation and the transformation of our economy through six key objectives (growing volume, spend, length of stay and
i i l di t ib ti hil d i lit d ti t f ti )provincial distribution while reducing seasonality and promoting transformation)
TransparentTransparentThe choice-making processes and source of data is transparent to build consensus on building tourism against the broader nation’s goals while informing business-level
4 Copyright © 2010 SA Tourism. Not to be reproduced without permission
TransparentTransparent g g g gdecision making within a broader context.
1 The concept of “Co-opetition” is used here with the same meaning as that described by Adam Brandenburger and Barry Nalebuff in their book of the same title

SA Tourism’s business focuses on three purposes of travel and caters to both domestic and international travellers
South AfricaTourism Brand
EventsLeisureBusiness1 2 3
Purpose of Travel
(eg 2010 Soccer World Cup) LeisureBusiness
International Events Tourism GrowthBusiness Unusual
Focus of provinces and cities
International Travellers
Domestic Travellers
It’s possible
Sho’t Left
Events Tourism Growth Strategy
Events Tourism Growth Strategy
5 Copyright © 2010 SA Tourism. Not to be reproduced without permission
Travellers Strategy
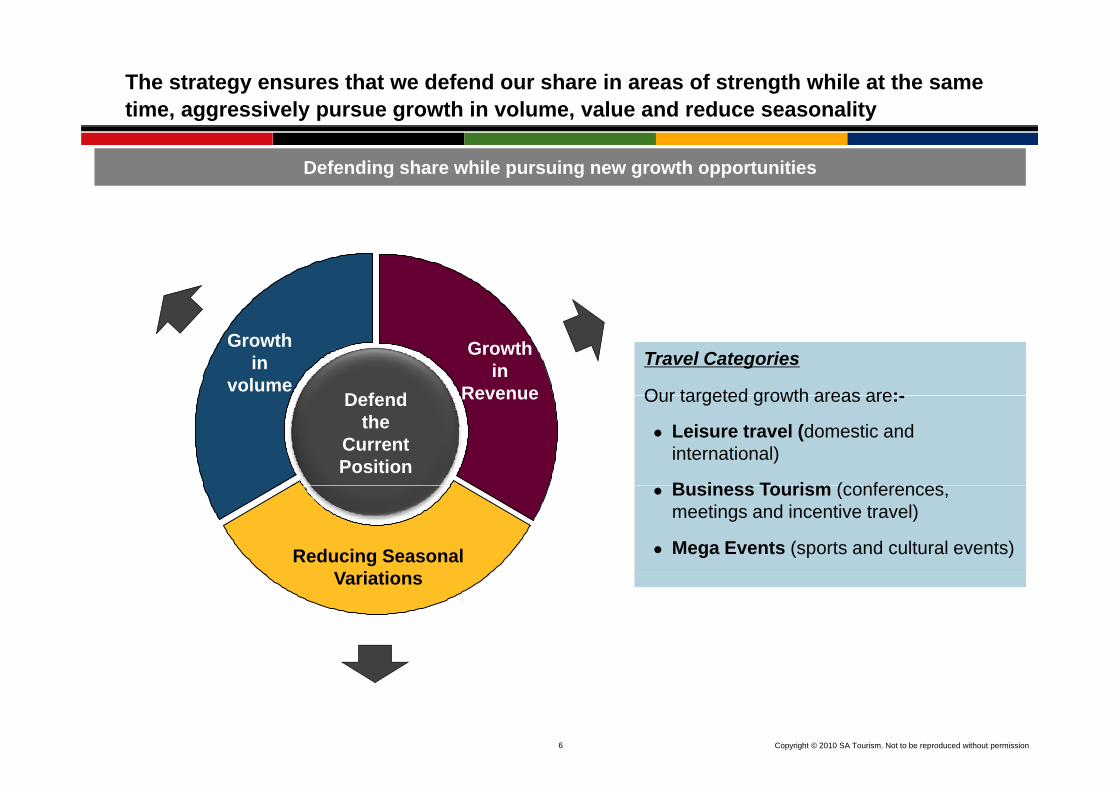
The strategy ensures that we defend our share in areas of strength while at the same time, aggressively pursue growth in volume, value and reduce seasonality
Defending share while pursuing new growth opportunities
Travel Categories
Our targeted growth areas are:
Growth in
volume
Growth in
RevenueD f d Our targeted growth areas are:-
Leisure travel (domestic and international)
B i T i ( f
RevenueDefend the
Current Position
Business Tourism (conferences, meetings and incentive travel)
Mega Events (sports and cultural events)Reducing Seasonal VariationsVariations
6 Copyright © 2010 SA Tourism. Not to be reproduced without permission
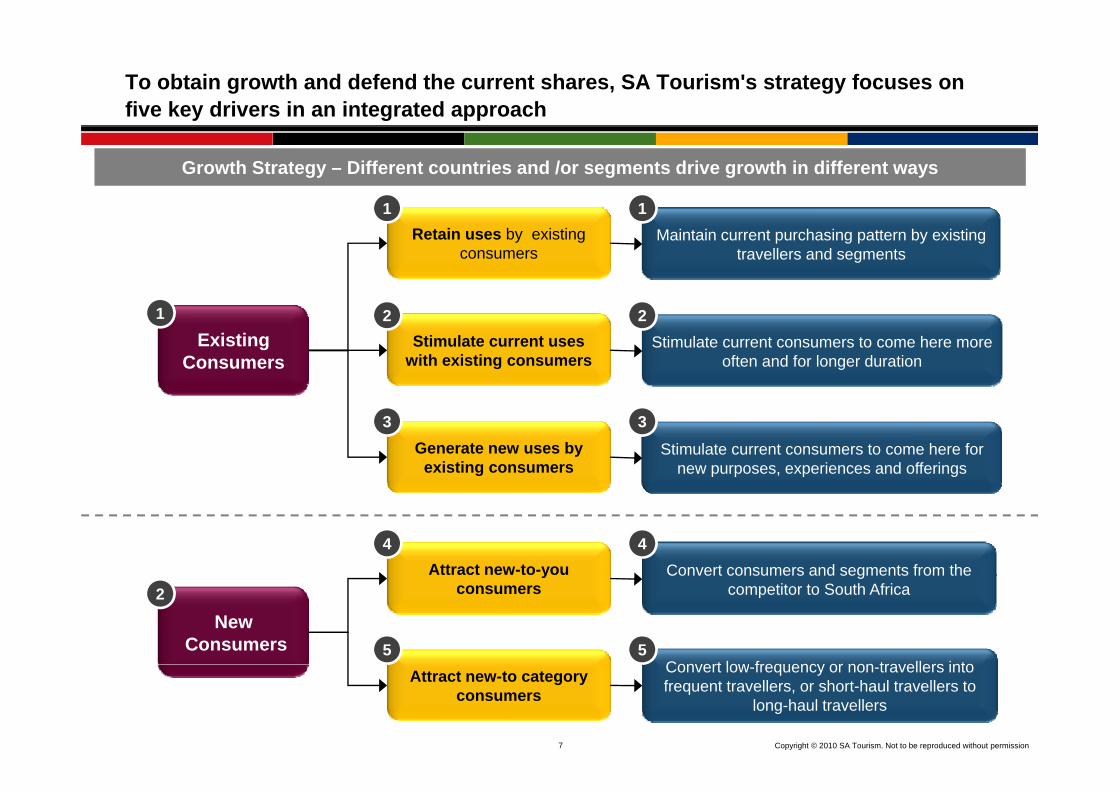
To obtain growth and defend the current shares, SA Tourism's strategy focuses on five key drivers in an integrated approach
1 1
Growth Strategy – Different countries and /or segments drive growth in different ways
Retain uses by existing consumers
Maintain current purchasing pattern by existing travellers and segments
Existing Consumers
Stimulate current uses with existing consumers
Stimulate current consumers to come here more often and for longer duration
1 2 2
Generate new uses by existing consumers
Stimulate current consumers to come here for new purposes, experiences and offerings
3 3
Attract new-to-you Convert consumers and segments from the4 4
NewConsumers
yconsumers
Convert low frequency or non travellers into
Convert consumers and segments from the competitor to South Africa2
5 5
7 Copyright © 2010 SA Tourism. Not to be reproduced without permission
Attract new-to category consumers
Convert low-frequency or non-travellers into frequent travellers, or short-haul travellers to
long-haul travellers

72% of South Africa’s arrivals are from our 6 neighbouring states
1
Growth from African Continent
E i ti
Retain uses by existing consumers
2Existing
Consumers(SADC)
Stimulate current uses with existing consumers
3Generate new uses by
existing consumers
3
4
NewConsumers
(East and West
Attract new-to-you consumers
4
5(East and West Africa) Attract new-to category
consumers
5
Given the high market share already in SADC and the absence of any true competition the strategy for SADC shifts to
8 Copyright © 2010 SA Tourism. Not to be reproduced without permission
Given the high market share already in SADC and the absence of any true competition, the strategy for SADC shifts to one of ‘defend’ and the extraction of additional value Outside of neighboring SADC, however, there is scope to attract
smaller high-end leisure volumes which in the long term may provide growth in markets in East and West Africa
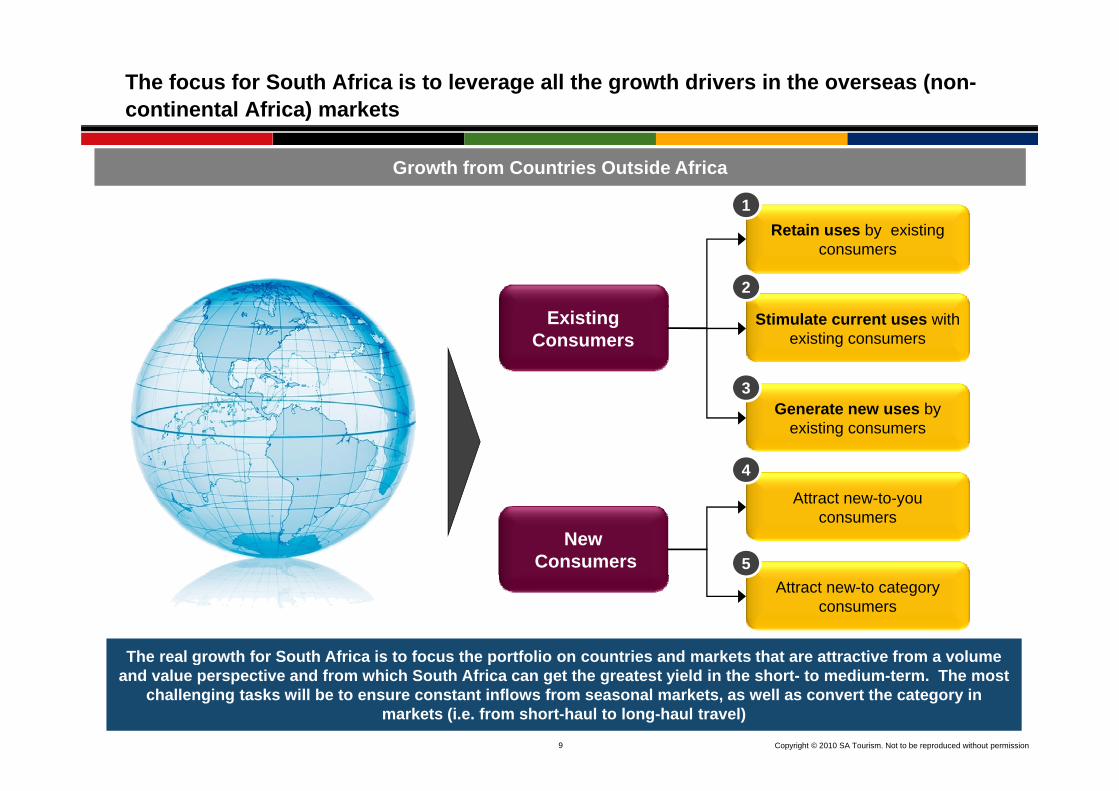
The focus for South Africa is to leverage all the growth drivers in the overseas (non-continental Africa) markets
1
Growth from Countries Outside Africa
Retain uses by existing consumers
2
Existing Consumers
Stimulate current uses with existing consumers
3
4
Generate new uses by existing consumers
NewConsumers
Attract new-to-you consumers
5
The real growth for South Africa is to focus the portfolio on countries and markets that are attractive from a volume
Attract new-to category consumers
9 Copyright © 2010 SA Tourism. Not to be reproduced without permission
g pand value perspective and from which South Africa can get the greatest yield in the short- to medium-term. The most
challenging tasks will be to ensure constant inflows from seasonal markets, as well as convert the category in markets (i.e. from short-haul to long-haul travel)
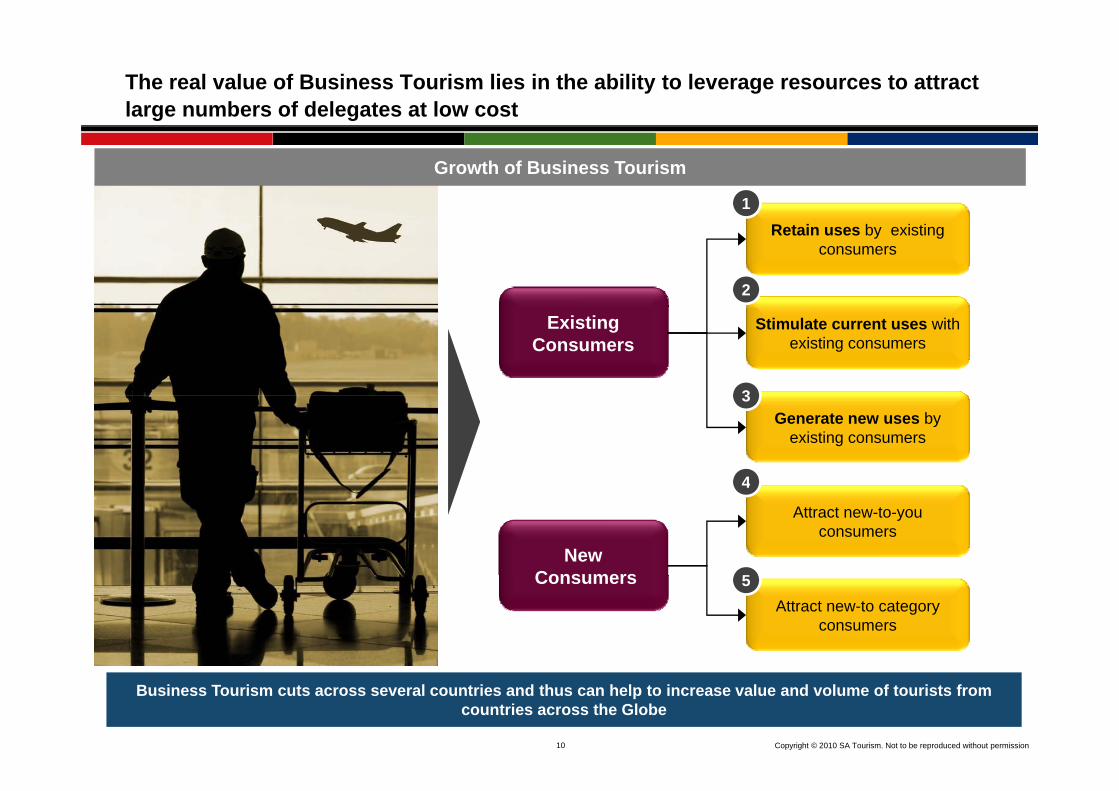
The real value of Business Tourism lies in the ability to leverage resources to attract large numbers of delegates at low cost
1
Growth of Business Tourism
Retain uses by existing consumers
2
Existing Consumers
Stimulate current uses with existing consumers
3
4
Generate new uses by existing consumers
3
NewConsumers
Attract new-to-you consumers
4
5ConsumersAttract new-to category
consumers
5
10 Copyright © 2010 SA Tourism. Not to be reproduced without permission
Business Tourism cuts across several countries and thus can help to increase value and volume of tourists from countries across the Globe
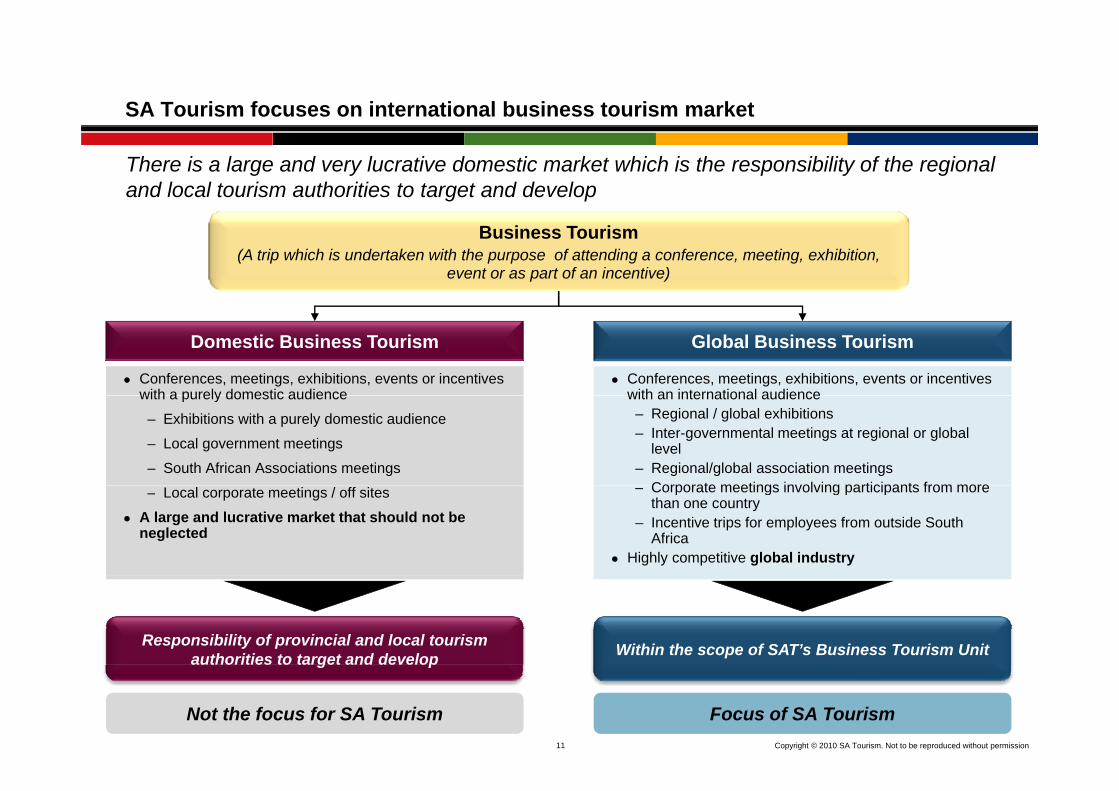
SA Tourism focuses on international business tourism market
There is a large and very lucrative domestic market which is the responsibility of the regional and local tourism authorities to target and develop
Business Tourism(A trip which is undertaken with the purpose of attending a conference, meeting, exhibition,
event or as part of an incentive)
Domestic Business Tourism
Conferences, meetings, exhibitions, events or incentives with a purely domestic audience
Global Business Tourism
Conferences, meetings, exhibitions, events or incentives with an international audiencewith a purely domestic audience
– Exhibitions with a purely domestic audience
– Local government meetings
– South African Associations meetings
with an international audience– Regional / global exhibitions– Inter-governmental meetings at regional or global
level– Regional/global association meetings
Corporate meetings involving participants from more– Local corporate meetings / off sites
A large and lucrative market that should not be neglected
– Corporate meetings involving participants from more than one country
– Incentive trips for employees from outside South Africa
Highly competitive global industry
Responsibility of provincial and local tourism authorities to target and develop Within the scope of SAT’s Business Tourism Unit
11 Copyright © 2010 SA Tourism. Not to be reproduced without permission
g p
Not the focus for SA Tourism Focus of SA Tourism
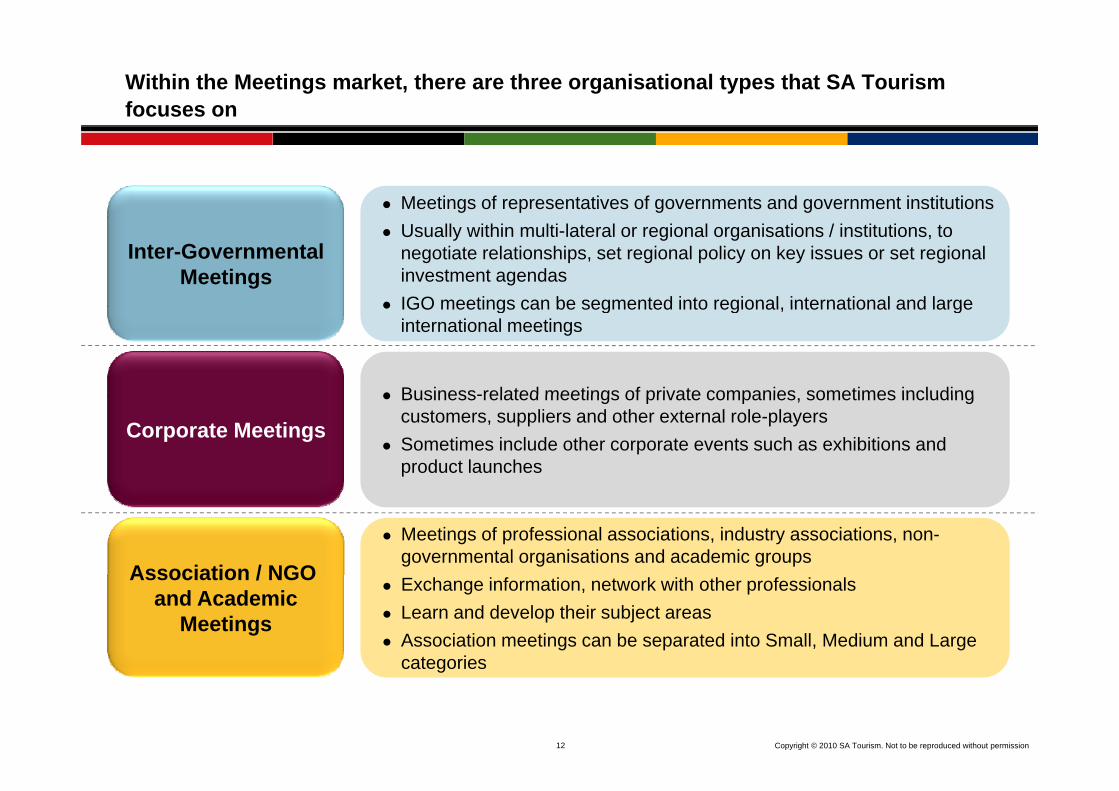
Within the Meetings market, there are three organisational types that SA Tourism focuses on
Meetings of representatives of governments and government institutions
Inter-GovernmentalMeetings
Usually within multi-lateral or regional organisations / institutions, to negotiate relationships, set regional policy on key issues or set regional investment agendasIGO meetings can be segmented into regional international and largeIGO meetings can be segmented into regional, international and large international meetings
Business-related meetings of private companies sometimes including
Corporate Meetings
Business-related meetings of private companies, sometimes including customers, suppliers and other external role-playersSometimes include other corporate events such as exhibitions and product launches
Association / NGO
Meetings of professional associations, industry associations, non-governmental organisations and academic groups
Association / NGO and Academic
Meetings
Exchange information, network with other professionalsLearn and develop their subject areas Association meetings can be separated into Small, Medium and Large categories
12 Copyright © 2010 SA Tourism. Not to be reproduced without permission
categories
Table of Contents
Introduction Page 3
Core Business of SA Tourism Page 13
Key challenges for tourism Page 21
SA Tourism Focus: Where to Play
– Review of the portfolio of markets Page 48
– International consumers Page 65
– Domestic market Page 73
R i f 2003 2008 P 79Review of 2003 – 2008 Page 79
Conclusion Page 87
13 Copyright © 2010 SA Tourism. Not to be reproduced without permission
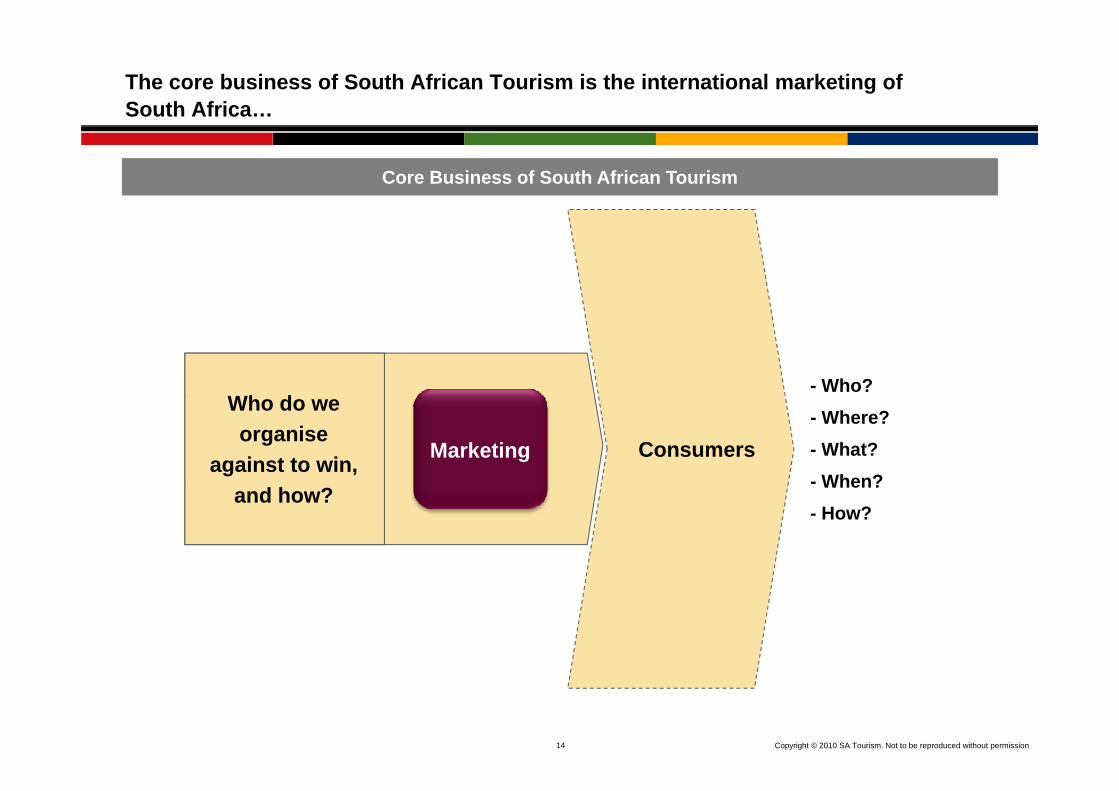
The core business of South African Tourism is the international marketing of South Africa…
Core Business of South African Tourism
Wh d- Who?
Consumers
Who do we organise
against to win,
- Where? - What? - When?
Marketing
and how?When?
- How?
14 Copyright © 2010 SA Tourism. Not to be reproduced without permission
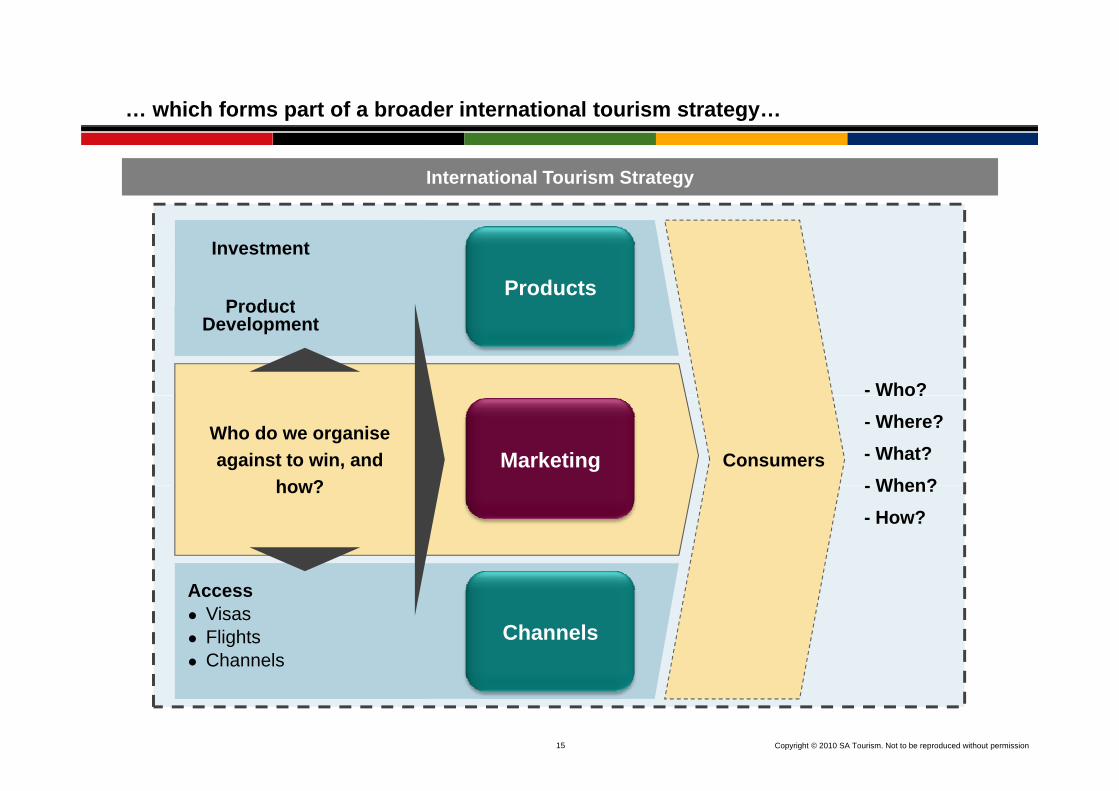
… which forms part of a broader international tourism strategy…
International Tourism Strategy
Investment
ProductProducts
ProductDevelopment
- Who?
ConsumersWho do we organise against to win, and
how?
Who? - Where? - What?
When?Marketing
how? - When? - How?
AccessVisasFlightsChannels
Channels
15 Copyright © 2010 SA Tourism. Not to be reproduced without permission
Channels
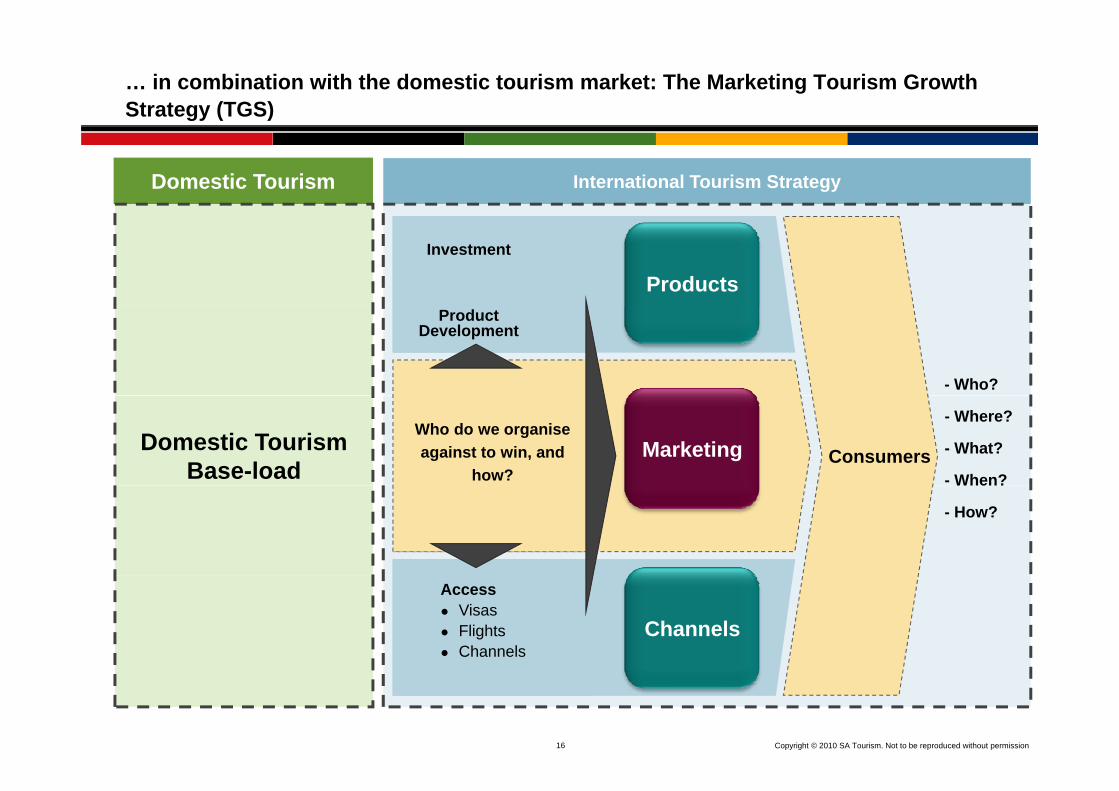
… in combination with the domestic tourism market: The Marketing Tourism Growth Strategy (TGS)
International Tourism StrategyDomestic Tourism
Investment
ProductsProduct
Development
- Who?
Domestic Tourism Base-load Consumers
Who do we organise against to win, and
how?
- Where?
- What?
- When?
MarketingWhen?
- How?
Channels
AccessVisasFlightsChannels
16 Copyright © 2010 SA Tourism. Not to be reproduced without permission
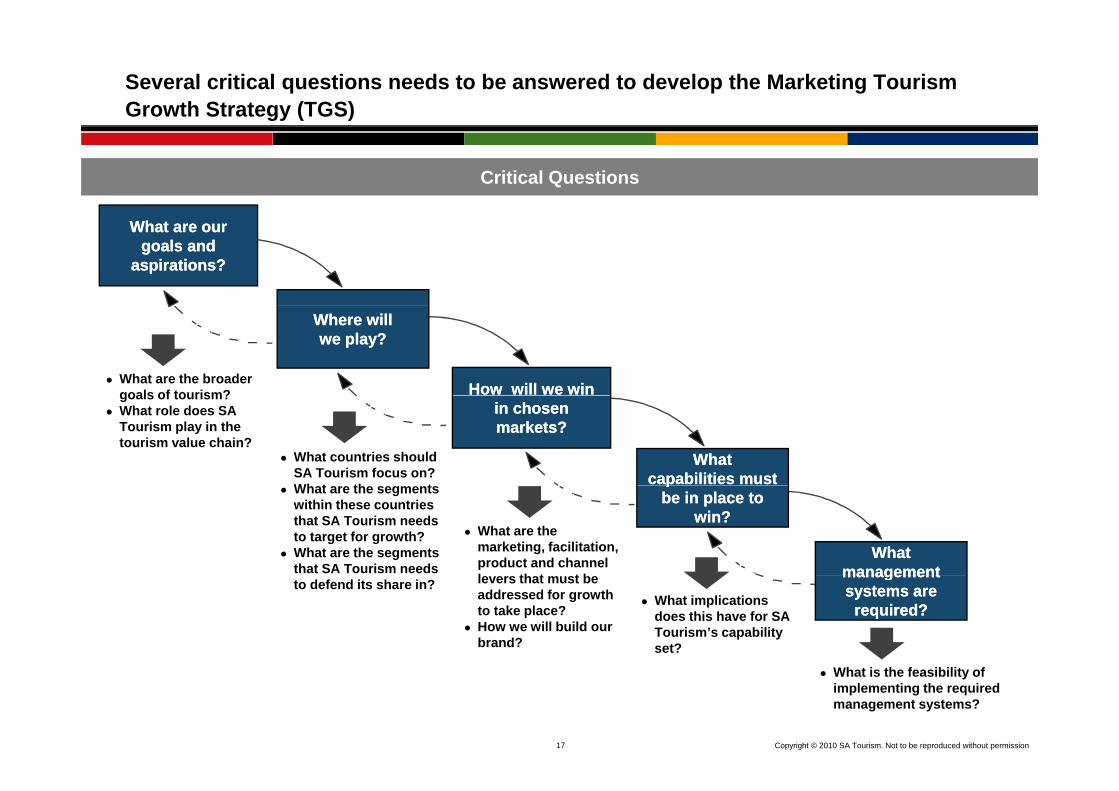
Several critical questions needs to be answered to develop the Marketing Tourism Growth Strategy (TGS)
Critical Questions
What are our What are our goals and goals and
aspirations?aspirations?
How will we win How will we win
Where willWhere willwe play?we play?
What are the broader goals of tourism?
in chosen in chosen markets?markets?
What What capabilities must capabilities must
goals of tourism?What role does SA Tourism play in the tourism value chain?
What countries should SA Tourism focus on?Wh t th t
What What managementmanagement
ppbe in place to be in place to
win?win?
What are the segments within these countries that SA Tourism needs to target for growth?What are the segments that SA Tourism needs
What are the marketing, facilitation, product and channel l th t t b management management
systems are systems are required?required?
to defend its share in? levers that must be addressed for growth to take place?How we will build our brand?
What implications does this have for SA Tourism’s capability set?
17 Copyright © 2010 SA Tourism. Not to be reproduced without permission
What is the feasibility of implementing the required management systems?

Government has set a agenda for tourism and SA Tourism has made clear choices on how to deliver against its mandate
Th d t
Mandate and Key Strategic Objectives
Sustainable GDP Growth Sustainable job creation Redistribution and transformation
The mandate to SA Tourism
is ...
throughIncrease in tourist
volume Increase in tourist spend Increase length of stay. . . through six key
objectives . . .
o u e
Improve geographic spread
Improve seasonality patterns Promote transformation
. . . by acting in a focused way to
Understand the market Choose the attractive segments Market the Destination
18 Copyright © 2010 SA Tourism. Not to be reproduced without permission
way to . . . Facilitate the removal of obstacles
Monitor and learn from tourist experience
Facilitate the product platform

In order to develop an integrated marketing strategy for SA Tourism, trade-offs are needed to be made across three key dimensions
Mandate and Key Strategic Objectives
Time
Demands for rapid– Economic growth
Social improvement
ScopeResources
– Social improvement– Poverty alleviation– Profitability
ScopeResources
Political capital Range of objectivesPolitical capitalLegislative attentionFinancial capital– Investment
Range of objectivesRange of markets and customersRange of productsRange of channels
19 Copyright © 2010 SA Tourism. Not to be reproduced without permission
– OperationsLeadership
Breadth of participation
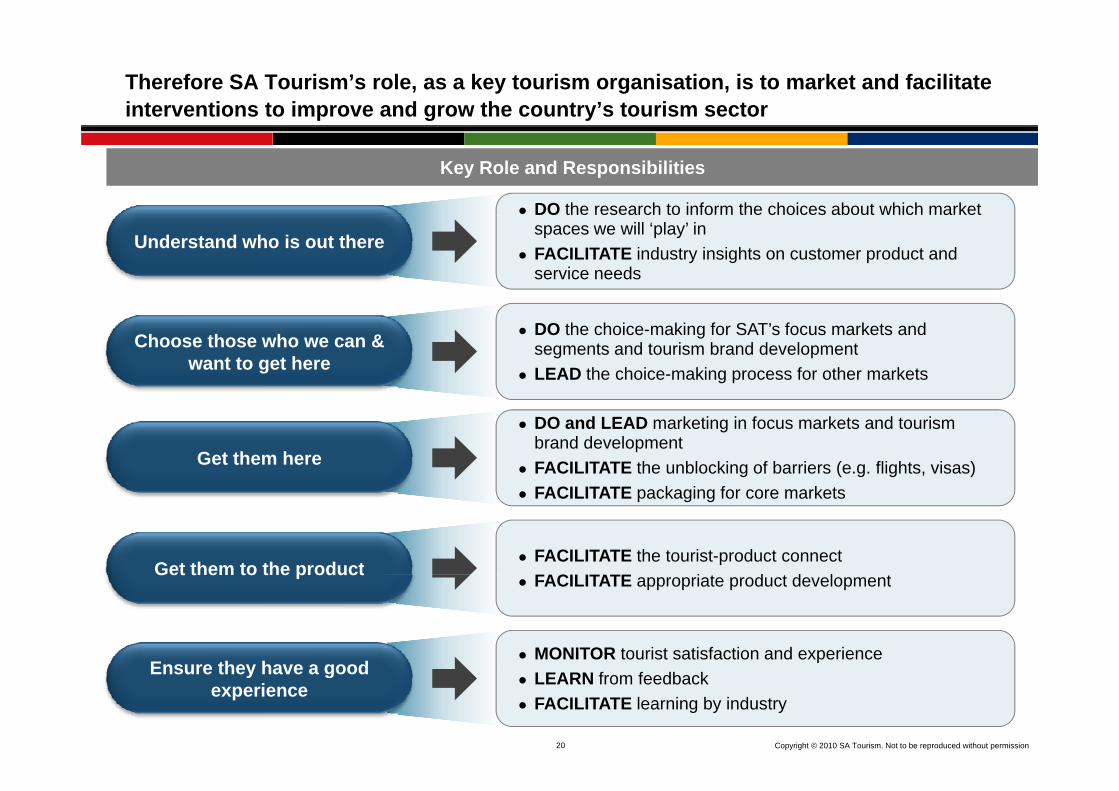
Therefore SA Tourism’s role, as a key tourism organisation, is to market and facilitate interventions to improve and grow the country’s tourism sector
DO the research to inform the choices about which market
Key Role and Responsibilities
Understand who is out therespaces we will ‘play’ inFACILITATE industry insights on customer product and service needs
DO the choice-making for SAT’s focus markets and segments and tourism brand developmentLEAD the choice-making process for other markets
Choose those who we can & want to get here
DO and LEAD marketing in focus markets and tourism brand developmentFACILITATE the unblocking of barriers (e.g. flights, visas)Get them here
FACILITATE packaging for core markets
FACILITATE the tourist-product connectFACILITATE i t d t d l tGet them to the product FACILITATE appropriate product developmentGet t e to t e p oduct
MONITOR tourist satisfaction and experienceEnsure they have a good
20 Copyright © 2010 SA Tourism. Not to be reproduced without permission
LEARN from feedbackFACILITATE learning by industry
Ensure they have a good experience

Table of Contents
Introduction Page 3
Core Business of SA Tourism Page 12
Key challenges for tourism Page 21
SA Tourism Focus: Where to Play
– Review of the portfolio of markets Page 48
– International consumers Page 65
– Domestic market Page 73
R i f 2003 2008 P 79Review of 2003 – 2008 Page 79
Conclusion Page 87
21 Copyright © 2010 SA Tourism. Not to be reproduced without permission

A vision for tourism: the key challenges for tourism
The Tourism Act sets out clearly the mandate for SA Tourism and it is against that mandate thatwe make the strategic choices in the organisation. The mandate is delivered through the six keyobjectives that are levers for tourism growth What is important to remember is that no one touristobjectives that are levers for tourism growth. What is important to remember is that no one touristcan deliver all six objectives and that the strategy must look across the globe for consumersegments and markets that can help us realise our goals.
Since the transition to democracy in 1994, South Africans have become aware of the potential fortourism to play a meaningful role in contributing to the economic development of our country andour people. Government has prioritised tourism as one of five economic growth sectors on whichto focus its efforts to support investment and facilitate growthto focus its efforts to support investment and facilitate growth.
The period of strong growth since 1990 has fundamentally changed the face of the tourismindustry in South Africa. With a small domestic market and less than 1 million annual foreigny garrivals in the two decades before 1990, we have grown to a destination that welcomed almostthan 10 million visitors by 2009.
Th l f h TGS i l d id i i i h i d dThe early stages of the TGS process involved wide-ranging interviews across the industry and adata-rich assessment of what key challenges needed to be addressed. In that process, the factsaround past performance and the experience of the industry was that whatever strategy emerged,it could only deliver against the mandate if it set an action programme that would successfully
22 Copyright © 2010 SA Tourism. Not to be reproduced without permission
y g p g yaddress eight key strategic challenges on an on-going basis. These eight challenges wereidentified as follows:
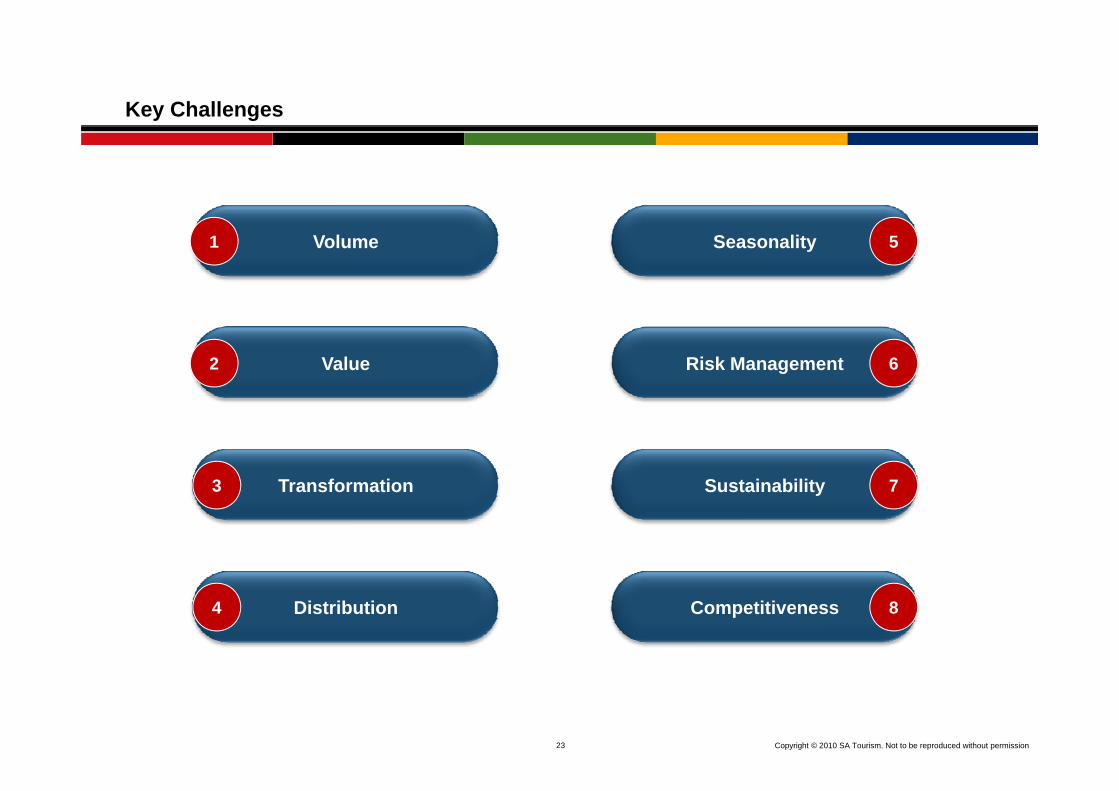
Key Challenges
Volume Seasonality1 5
Value Risk Management2 6
Transformation Sustainability3 7Transformation Sustainability3 7
Distribution Competitiveness 84
23 Copyright © 2010 SA Tourism. Not to be reproduced without permission
CHALLENGE: Volume
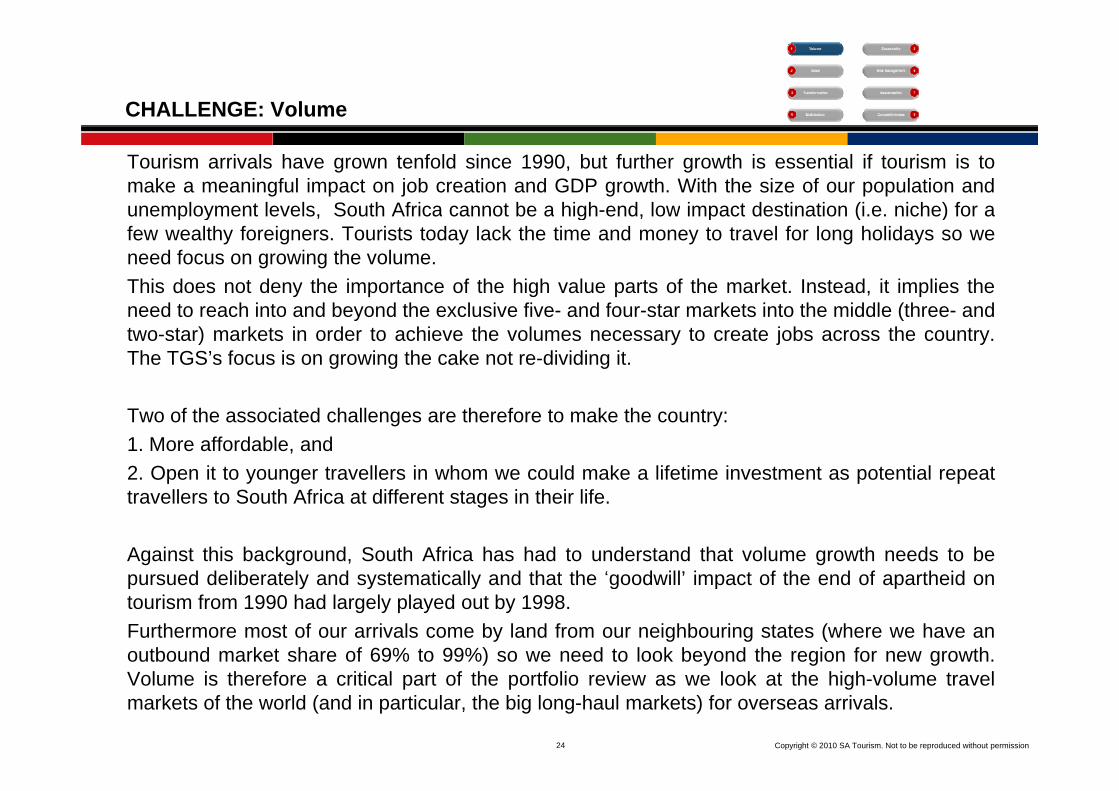
Tourism arrivals have grown tenfold since 1990, but further growth is essential if tourism is tomake a meaningful impact on job creation and GDP growth. With the size of our population andunemployment levels, South Africa cannot be a high-end, low impact destination (i.e. niche) for aunemployment levels, South Africa cannot be a high end, low impact destination (i.e. niche) for afew wealthy foreigners. Tourists today lack the time and money to travel for long holidays so weneed focus on growing the volume.This does not deny the importance of the high value parts of the market. Instead, it implies the
d t h i t d b d th l i fi d f t k t i t th iddl (th dneed to reach into and beyond the exclusive five- and four-star markets into the middle (three- andtwo-star) markets in order to achieve the volumes necessary to create jobs across the country.The TGS’s focus is on growing the cake not re-dividing it.
Two of the associated challenges are therefore to make the country:1. More affordable, and2. Open it to younger travellers in whom we could make a lifetime investment as potential repeattravellers to South Africa at different stages in their life.
Against this background, South Africa has had to understand that volume growth needs to bepursued deliberately and systematically and that the ‘goodwill’ impact of the end of apartheid onpursued deliberately and systematically and that the goodwill’ impact of the end of apartheid ontourism from 1990 had largely played out by 1998.Furthermore most of our arrivals come by land from our neighbouring states (where we have anoutbound market share of 69% to 99%) so we need to look beyond the region for new growth.
24 Copyright © 2010 SA Tourism. Not to be reproduced without permission
) y g gVolume is therefore a critical part of the portfolio review as we look at the high-volume travelmarkets of the world (and in particular, the big long-haul markets) for overseas arrivals.

Arrivals to South Africa continues its upward climb reaching 9,9 million arrivals in 2009
12
Foreign Tourist Arrivals to South Africa, 1967-2009s)
First D ti
9,9 million arrivals in
2009
Rugby
World Cup9/11
8
10
als
(Mill
ions Democratic
Elections
Nelson Mandela
Sanctions against South
Africa lifted6
8
State of Emergency
Arr
iv Mandela released
Sanctions Era2
4
0
1967
1969
1971
1973
1975
1977
1979
1981
1983
1985
1987
1989
1991
1993
1995
1997
1999
2001
2003
2005
2007
2009
1970s and 80s – StagnationStagnation drove low investment, focus on narrow white domestic market and costs
1990-1998 – GrowthInitial period of short-term profit-taking followed by period of investment growth and entry of
1998-2004 – CyclicalityGlobal events, currency volatility drove uncertainty and short-term strategy by firms
25 Copyright © 2010 SA Tourism. Not to be reproduced without permission
white domestic market and costs investment growth and entry of foreign players
firmsInvestment rates remain weak overall
Source: StatsSA, Tourism & Migration release
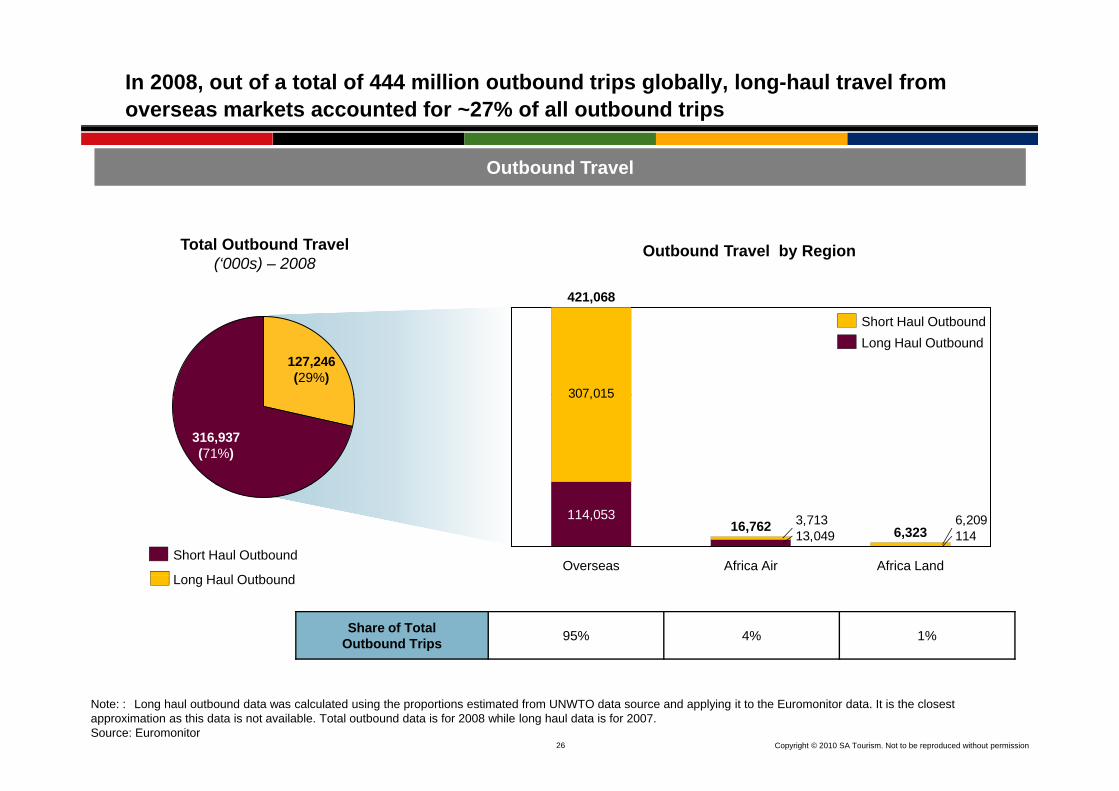
In 2008, out of a total of 444 million outbound trips globally, long-haul travel from overseas markets accounted for ~27% of all outbound trips
Outbound Travel
Total Outbound Travel (‘000s) – 2008
Outbound Travel by Region
421,068
127,246(29%)
307 015
Long Haul OutboundShort Haul Outbound
316,937(71%)
307,015
11413,0496,2093,713
Overseas
114,053
Africa Land
6,323
Africa Air
16,762
L H l O tb d
Short Haul Outbound
Share of Total Outbound Trips 95% 4% 1%
Long Haul Outbound
26 Copyright © 2010 SA Tourism. Not to be reproduced without permission
Note: : Long haul outbound data was calculated using the proportions estimated from UNWTO data source and applying it to the Euromonitor data. It is the closest approximation as this data is not available. Total outbound data is for 2008 while long haul data is for 2007.Source: Euromonitor

Overseas markets present significant opportunity given the high incidence of long-haul travel and the small market share South Africa presently holds
85,510Total Outbound Vs Long Haul Outbound
Overseas Markets
40,955
,
67,23664,052
36,510
Long HaulTotal Outbound
1,926
17,2907,8535,5087,507
13,37511,83417,888
23,15626,700
5,141
25,138
8117,1338,023
2,0384,6821,1062,4561,6571,9643,0575,0908,248
19,917
2,8028,559
JapanChina New Zealand
BrazilCanadaUSA UK IndiaAustraliaIrelandSwedenBelgium NetherlandsItaly France Germany
% LH 57% 34% 55% 30% 10% 19% 13% 11% 14% 18% 15% 85% 26% 20% 41% 42%
Long Haul Outbound / Arrivals and Saturation36,510
19,917
Total Outbound Arrivals
811
7,1338,023
2,0384,682
1,1062,4561,6571,9643,057
5,0908,248
2,802
8,559
20284052100424442128561282384853657287
USA New Zealand
JapanChina IndiaAustraliaIrelandSwedenBelgium NetherlandsItaly France GermanyUKBrazilCanada
27 Copyright © 2010 SA Tourism. Not to be reproduced without permission
Market Share/
Situation0.8% 0.7% 1.3% 2.4% 2.9% 2.5% 1.8% 6.5% 2.6% 1.8% 3.8% 2.1% 2.6% 0.5% 0.4% 2.5%
Note: : Long haul outbound data was calculated using the proportions estimated from UNWTO data source and applying it to the Euromonitor data. It is the closest approximation as this data is not available. Total outbound data is for 2008 while long haul data is for 2007. Arrivals to South Africa is for the year 2008Source: Euromonitor ; Statistics SA

South Africa has a larger market share in Africa air markets relative to the overseas markets
8 938
Africa Air MarketsTotal Outbound Vs Long Haul Outbound
8,938
1 114
LH OutboundOutbound 2007
2484767237071,11413082228
9501404174540191301211
TurkeyMauritiusNigeriaKenya GhanaDRCAngola UgandaTanzania
% LH 5% 15% 23% 17% 76% 10% 9% 56% 11%
950Long Haul Outbound / Arrivals and Saturation
540
191217
ArrivalsOutbound 2007
Market
1084174
191
307091613164427133236
Mauritius TurkeyGhanaDRCAngola UgandaTanzaniaNigeriaKenya
28 Copyright © 2010 SA Tourism. Not to be reproduced without permission
Share/ Situation
17% 45% 44% 14% 8% 21% 31% 15% 1%
Represents SH market
Note: : Long haul outbound data was calculated using the proportions estimated from UNWTO data source and applying it to the Euromonitor data. It is the closest approximation as this data is not available. Total outbound data is for 2008 while long haul data is for 2007. Arrivals to South Africa is for the year 2008Source: Euromonitor ; Statistics SA
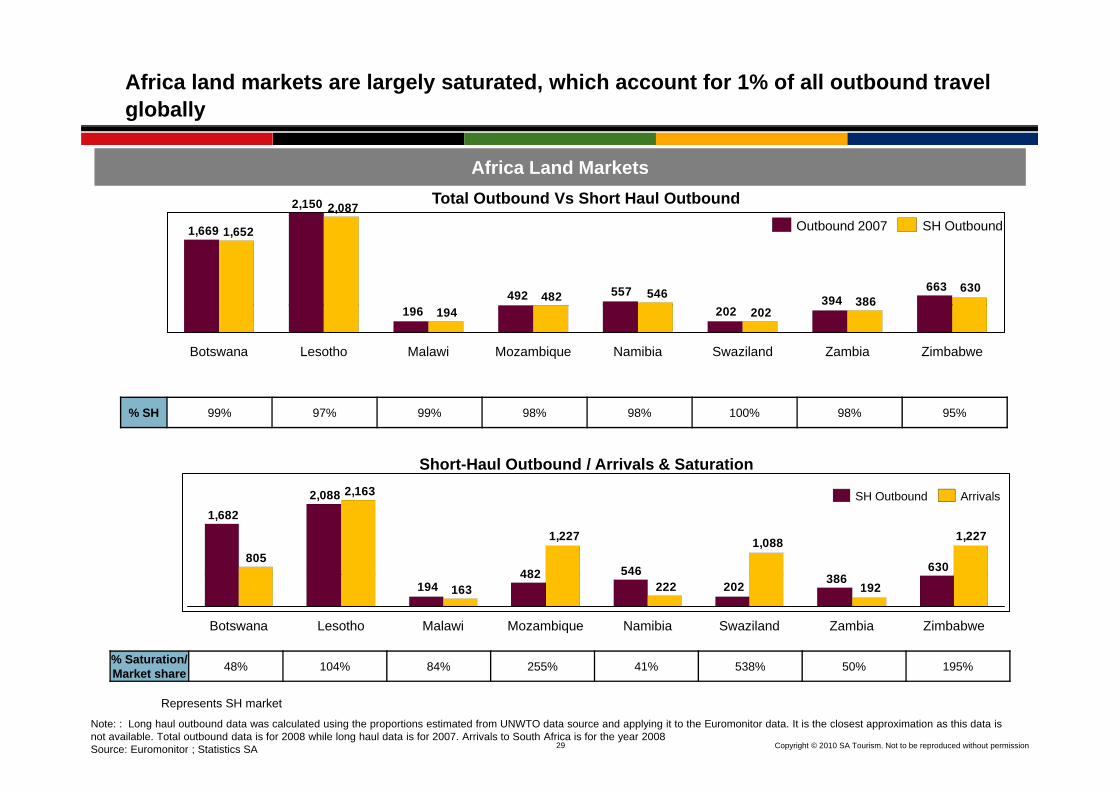
Africa land markets are largely saturated, which account for 1% of all outbound travel globally
2,150 2,087
Africa Land MarketsTotal Outbound Vs Short Haul Outbound
1,669
492 557394
663
1,652
482 546 386630
SH OutboundOutbound 2007
196 202194 202
ZimbabweZambiaSwazilandNamibiaMozambiqueMalawiLesothoBotswana
% SH 99% 97% 99% 98% 98% 100% 98% 95%
Short-Haul Outbound / Arrivals & Saturation
630386546482
2,0881,682
1,2271,0881,227
2,163
805
ArrivalsSH Outbound
% Saturation/ 48% 104% 84% 255% 41% 538% 50% 195%
386202482
194 192222163
Lesotho ZimbabweZambiaSwazilandMalawi NamibiaMozambiqueBotswana
29 Copyright © 2010 SA Tourism. Not to be reproduced without permission
Market share 48% 104% 84% 255% 41% 538% 50% 195%
Represents SH market
Note: : Long haul outbound data was calculated using the proportions estimated from UNWTO data source and applying it to the Euromonitor data. It is the closest approximation as this data is not available. Total outbound data is for 2008 while long haul data is for 2007. Arrivals to South Africa is for the year 2008Source: Euromonitor ; Statistics SA

South Africa’s positioning in overseas markets has historically been predominantly aimed at the high-value, low impact market making our country an expensive destination that few tourists could afford
Opening up the appeal of the
12High 12High
Where we are Where we want to be
destination DOES NOT mean that we will no longer serve the high value end of 8
10
8
10
the market, rather it implies that clusters of tourism products will reconfigure th l t
6
8
Value6
8
Value
themselves to successfully serve a range of segments from the high-end
t t th
4 4
Where we DON’Tsegment to three-
and two-star tourists
0
2
Low
Low
High0
2
Low
Low
High
DON’T want to be
30 Copyright © 2010 SA Tourism. Not to be reproduced without permission
0 2 4 6 8 10 12Volume
Low High0 2 4 6 8 10 12
VolumeLow High
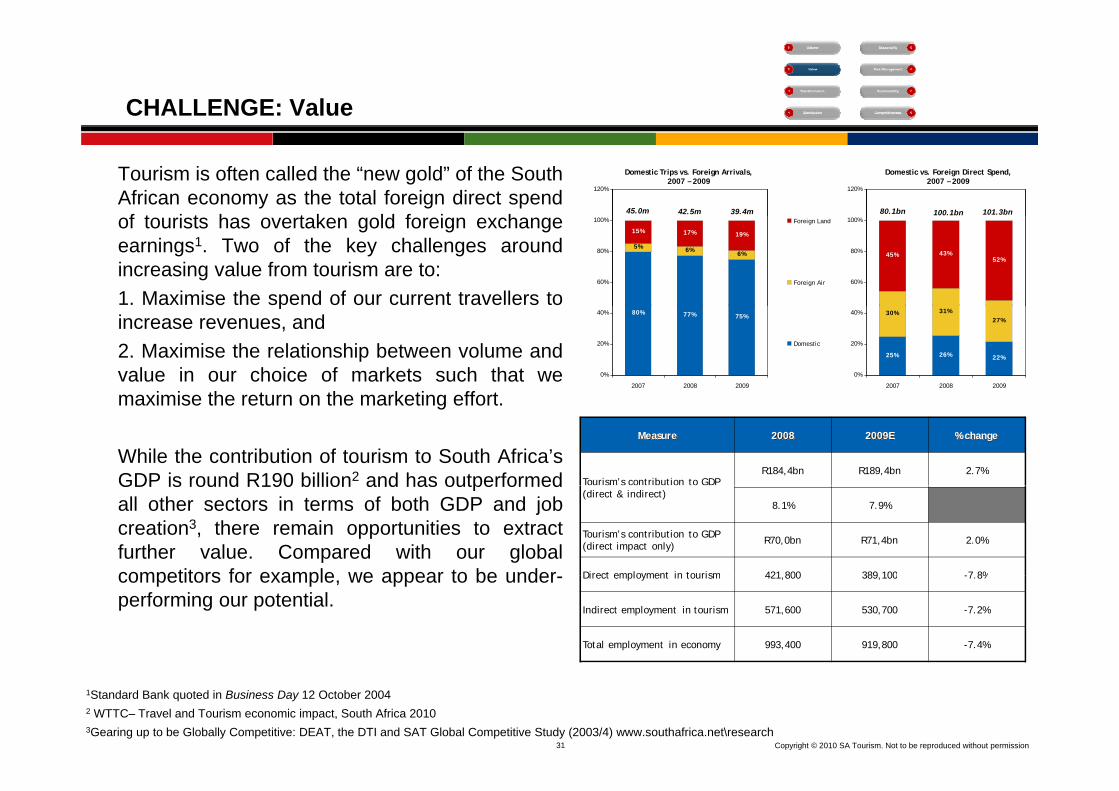
CHALLENGE: Value
Tourism is often called the “new gold” of the SouthAfrican economy as the total foreign direct spend
f t i t h t k ld f i h
120%
Domestic Trips vs. Foreign Arrivals, 2007 – 2009
Domestic vs. Foreign Direct Spend, 2007 – 2009
120%
45.0m 80.1bn42.5m 101.3bn39.4m 100.1bnof tourists has overtaken gold foreign exchangeearnings1. Two of the key challenges aroundincreasing value from tourism are to:1. Maximise the spend of our current travellers to
45% 43%52%
60%
80%
100%
6% 6%
15% 17% 19%
5%
60%
80%
100% Foreign Land
Foreign Air
pincrease revenues, and2. Maximise the relationship between volume andvalue in our choice of markets such that wemaximise the return on the marketing effort
25% 26% 22%
30% 31%27%
0%
20%
40%
2007 2008 2009
80% 77% 75%
0%
20%
40%
2007 2008 2009
Domestic
maximise the return on the marketing effort.
While the contribution of tourism to South Africa’sGDP is round R190 billion2 and has outperformed
Measure 2008 2009E % change
Tourism’s contribution to GDPR184,4bn R189,4bn 2.7%GDP is round R190 billion and has outperformed
all other sectors in terms of both GDP and jobcreation3, there remain opportunities to extractfurther value. Compared with our globalcompetitors for example we appear to be under
(direct & indirect)8.1% 7.9%
Tourism’s contribution to GDP (direct impact only) R70,0bn R71,4bn 2.0%
Direct employment in tourism 421 800 389 100 -7 8%competitors for example, we appear to be under-performing our potential.
Direct employment in tourism 421,800 389,100 -7.8%
Indirect employment in tourism 571,600 530,700 -7.2%
Total employment in economy 993,400 919,800 -7.4%
31 Copyright © 2010 SA Tourism. Not to be reproduced without permission
1Standard Bank quoted in Business Day 12 October 20042 WTTC– Travel and Tourism economic impact, South Africa 20103Gearing up to be Globally Competitive: DEAT, the DTI and SAT Global Competitive Study (2003/4) www.southafrica.net\research
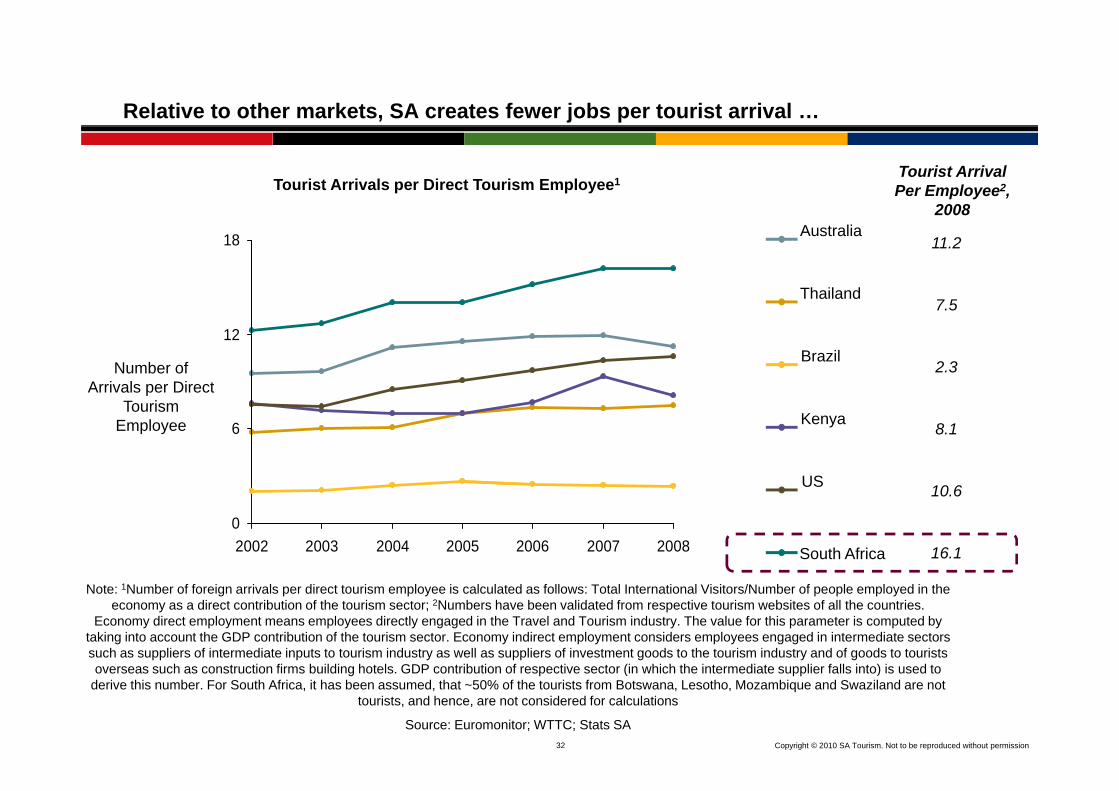
Relative to other markets, SA creates fewer jobs per tourist arrival …
Tourist Arrivals per Direct Tourism Employee1Tourist Arrival Per Employee2,
2008
7 5
11.2
Thailand
Australia18
Number of Arrivals per Direct
7.5
2.3Brazil
12
pTourism
Employee
10 6
8.1
US
Kenya6
10.6
16.1South Africa
US
02002 2003 2004 2005 2006 2007 2008
Note: 1Number of foreign arrivals per direct tourism employee is calculated as follows: Total International Visitors/Number of people employed in the economy as a direct contribution of the tourism sector; 2Numbers have been validated from respective tourism websites of all the countries.
Economy direct employment means employees directly engaged in the Travel and Tourism industry. The value for this parameter is computed by taking into account the GDP contribution of the tourism sector. Economy indirect employment considers employees engaged in intermediate sectors such as suppliers of intermediate inputs to tourism industry as well as suppliers of investment goods to the tourism industry and of goods to tourists
h t ti fi b ildi h t l GDP t ib ti f ti t (i hi h th i t di t li f ll i t ) i d t
32 Copyright © 2010 SA Tourism. Not to be reproduced without permission
overseas such as construction firms building hotels. GDP contribution of respective sector (in which the intermediate supplier falls into) is used to derive this number. For South Africa, it has been assumed, that ~50% of the tourists from Botswana, Lesotho, Mozambique and Swaziland are not
tourists, and hence, are not considered for calculations
Source: Euromonitor; WTTC; Stats SA
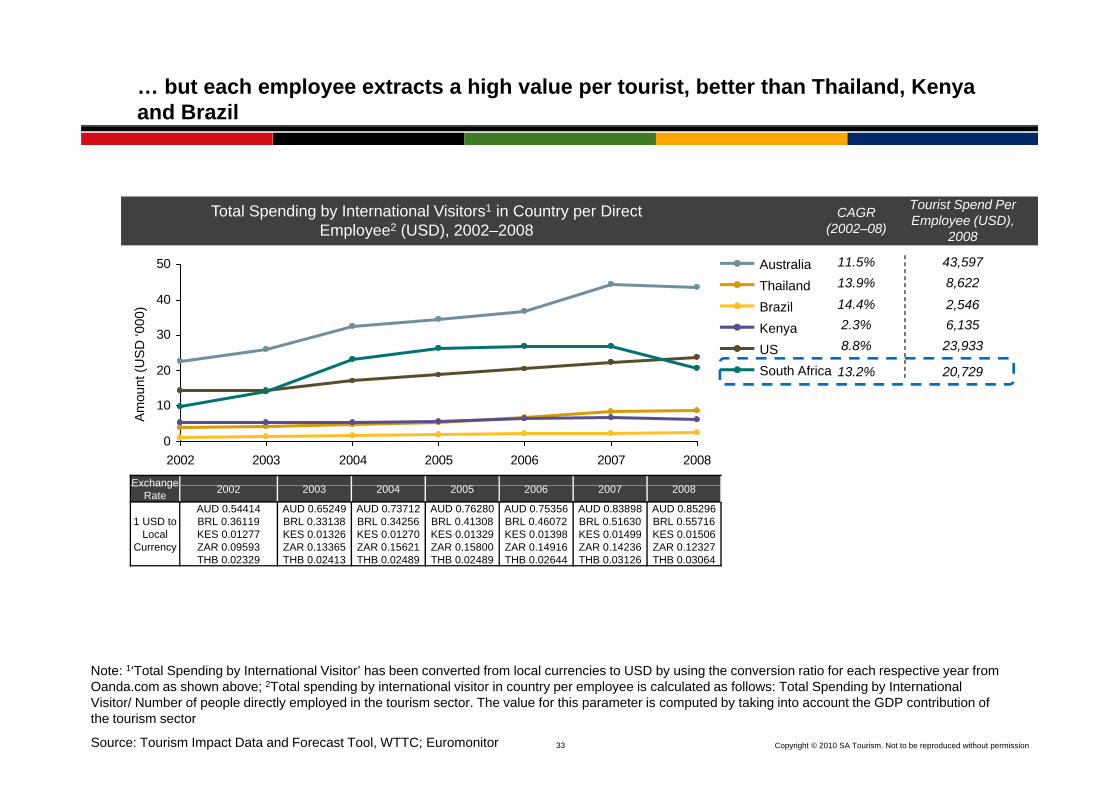
… but each employee extracts a high value per tourist, better than Thailand, Kenya and Brazil
Tourist Spend Per E l (USD)Total Spending by International Visitors1 in Country per Direct CAGR
40
50
Employee (USD), 2008
8,62243,597
2 546
11.5% 13.9%14 4%
Total Spending by International Visitors in Country per Direct Employee2 (USD), 2002–2008
CAGR (2002–08)
AustraliaThailandBrazil
20
30
ount
(US
D ‘0
00)
23,933
20,729
2,5466,135
8.8%
14.4%2.3%
13.2%
BrazilKenyaUSSouth Africa
0
10
2002 2003 2004 2005 2006 2007 2008
Amo
Exchange 2002 2003 2004 2005 2006 2007 2008Exchange Rate 2002 2003 2004 2005 2006 2007 2008
1 USD to Local
Currency
AUD 0.54414BRL 0.36119KES 0.01277ZAR 0.09593THB 0.02329
AUD 0.65249BRL 0.33138KES 0.01326ZAR 0.13365THB 0.02413
AUD 0.73712BRL 0.34256KES 0.01270ZAR 0.15621THB 0.02489
AUD 0.76280BRL 0.41308KES 0.01329ZAR 0.15800THB 0.02489
AUD 0.75356BRL 0.46072KES 0.01398ZAR 0.14916THB 0.02644
AUD 0.83898BRL 0.51630KES 0.01499ZAR 0.14236THB 0.03126
AUD 0.85296BRL 0.55716KES 0.01506ZAR 0.12327THB 0.03064
1
33 Copyright © 2010 SA Tourism. Not to be reproduced without permission
Note: 1‘Total Spending by International Visitor’ has been converted from local currencies to USD by using the conversion ratio for each respective year from Oanda.com as shown above; 2Total spending by international visitor in country per employee is calculated as follows: Total Spending by International Visitor/ Number of people directly employed in the tourism sector. The value for this parameter is computed by taking into account the GDP contribution of the tourism sector
Source: Tourism Impact Data and Forecast Tool, WTTC; Euromonitor
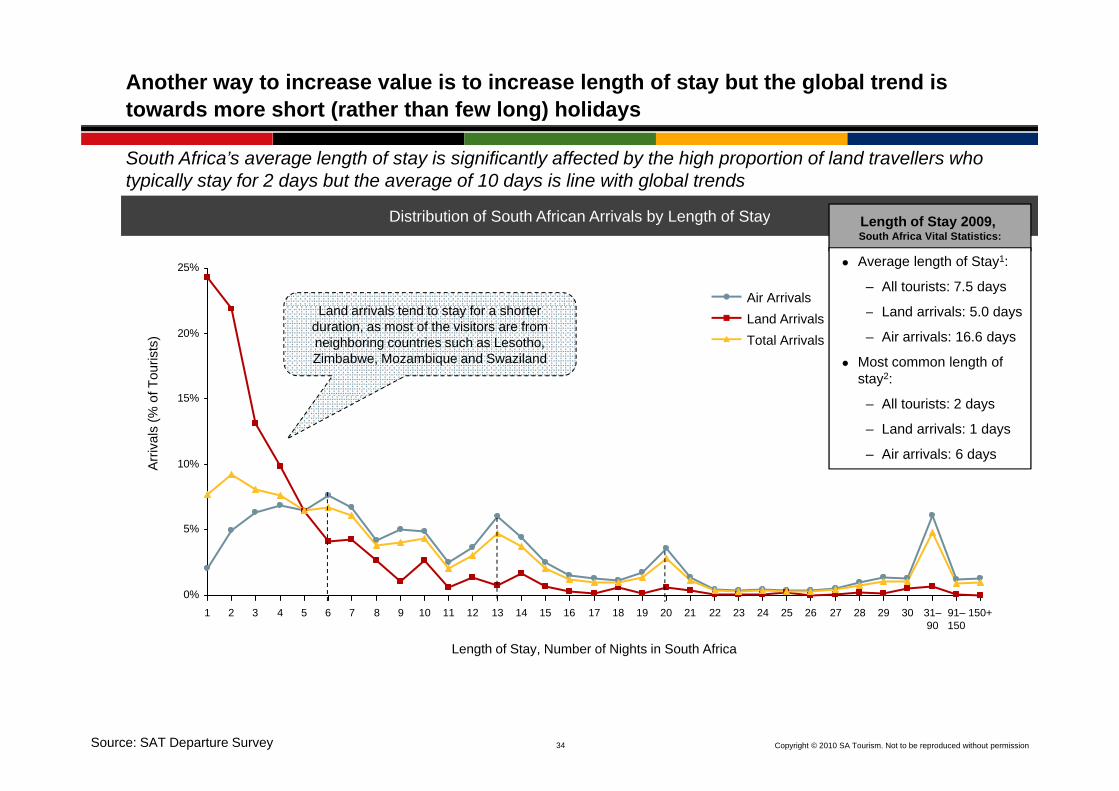
Another way to increase value is to increase length of stay but the global trend is towards more short (rather than few long) holidays
Distribution of South African Arrivals by Length of Stay f S
South Africa’s average length of stay is significantly affected by the high proportion of land travellers who typically stay for 2 days but the average of 10 days is line with global trends
Distribution of South African Arrivals by Length of Stay
25%
Air ArrivalsL d i l t d t t f h t
Length of Stay 2009, South Africa Vital Statistics:
Average length of Stay1:
– All tourists: 7.5 days
15%
20% Total ArrivalsLand Arrivals
f Tou
rists
)
Land arrivals tend to stay for a shorter duration, as most of the visitors are from neighboring countries such as Lesotho, Zimbabwe, Mozambique and Swaziland
– Land arrivals: 5.0 days
– Air arrivals: 16.6 days
Most common length of stay2:
10%
15%
Arr
ival
s (%
o – All tourists: 2 days
– Land arrivals: 1 days
– Air arrivals: 6 days
5%
0%31–90
302928272625242322212019181716151413121110987654321 91–150
150+
Length of Stay, Number of Nights in South Africa
34 Copyright © 2010 SA Tourism. Not to be reproduced without permissionSource: SAT Departure Survey
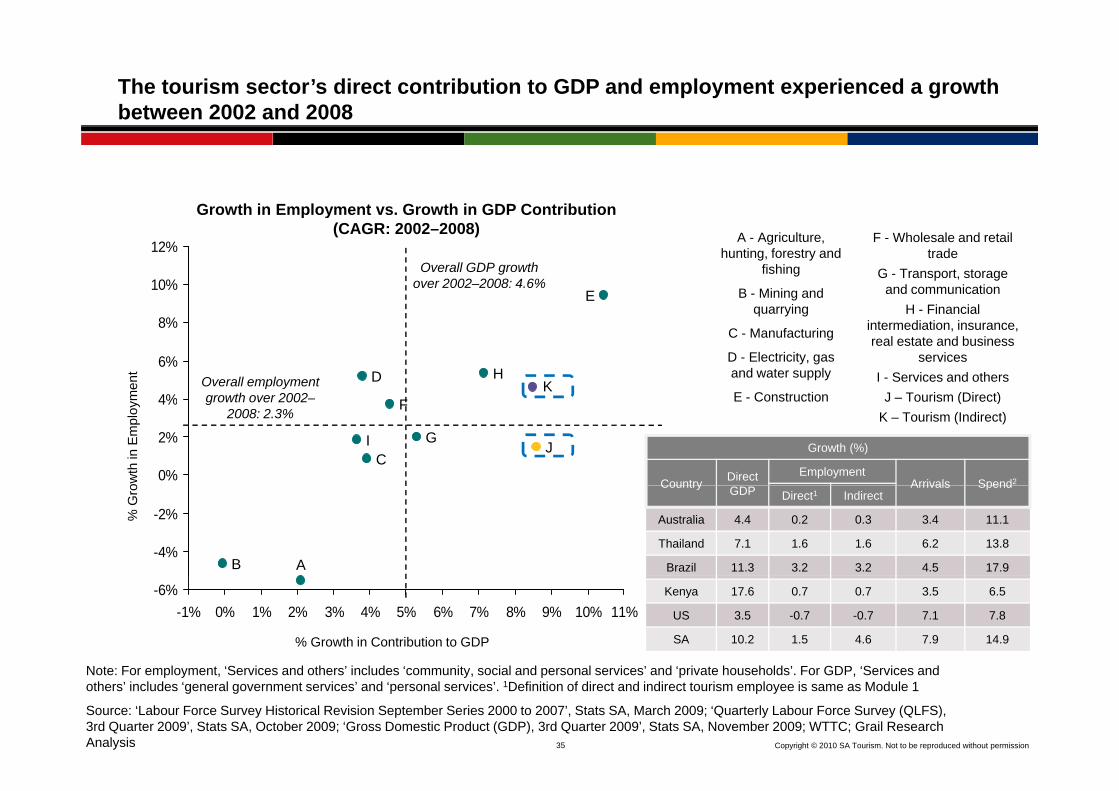
The tourism sector’s direct contribution to GDP and employment experienced a growth between 2002 and 2008
Growth in Employment vs. Growth in GDP Contribution A - Agriculture,
hunting, forestry and fishing
B - Mining and i
F - Wholesale and retail trade
G - Transport, storage and communication
H Fi i l
10%
12%
E
Overall GDP growth over 2002–2008: 4.6%
p y(CAGR: 2002–2008)
quarrying
C - Manufacturing
D - Electricity, gas and water supply
E Construction
H - Financial intermediation, insurance, real estate and business
servicesI - Services and others
J Tourism (Direct)men
t
4%
6%
8%
DK
HOverall employment growth over 2002 E - Construction
Country Growthin Direct
Growth in Employment (%)
Growth in Arrivals
J – Tourism (Direct)K – Tourism (Indirect)
owth
in E
mpl
oym
0%
2%
4% F
JI GC
growth over 2002–2008: 2.3%
Growth (%)
Country Direct EmploymentArrivals Spend2
GDP (%) (%)Direct1 Indirect
Australia 4.4 0.2 0.3 3.4
Thailand 7.1 1.6 1.6 6.2
Brazil 11.3 3.2 3.2 4.5
% G
ro
-4%
-2%
AB
Country GDP Arrivals SpendDirect1 Indirect
Australia 4.4 0.2 0.3 3.4 11.1
Thailand 7.1 1.6 1.6 6.2 13.8
Brazil 11.3 3.2 3.2 4.5 17.9
Kenya 17.6 0.7 0.7 3.5
US 3.5 -0.7 -0.7 7.1
South Africa 10.2 1.5 4.6 7.9% Growth in Contribution to GDP
-6%-1% 0% 1% 2% 3% 4% 5% 6% 7% 8% 9% 10% 11%
Kenya 17.6 0.7 0.7 3.5 6.5
US 3.5 -0.7 -0.7 7.1 7.8
SA 10.2 1.5 4.6 7.9 14.9
35 Copyright © 2010 SA Tourism. Not to be reproduced without permission
Note: For employment, ‘Services and others’ includes ‘community, social and personal services’ and ‘private households’. For GDP, ‘Services and others’ includes ‘general government services’ and ‘personal services’. 1Definition of direct and indirect tourism employee is same as Module 1
Source: ‘Labour Force Survey Historical Revision September Series 2000 to 2007’, Stats SA, March 2009; ‘Quarterly Labour Force Survey (QLFS), 3rd Quarter 2009’, Stats SA, October 2009; ‘Gross Domestic Product (GDP), 3rd Quarter 2009’, Stats SA, November 2009; WTTC; Grail Research Analysis

CHALLENGE: Transformation
Aligned to the goal of tourism value reaching an ever-widening circle of our nation is the importantchallenge of ensuring the direct participation by the previously disadvantaged majority in theindustry Tourism is still predominantly white–owned and white-managedindustry. Tourism is still predominantly white owned and white managed.The imperative to transform goes beyond the desire to extend economic participation alone.Transformation is in many ways a key opportunity and requirement for future growth. Apart fromthe fact that unless transformation occurs there won’t be enough managers or businesses to meetth d d f it Th i t l i l i th k t th t t f ti ill bthe demand for new capacity. There exist clear signals in the market that transformation will bethe key to unlocking new opportunities for growth.Consumer research has revealed that foreign tourists are exposed to fewer and less authenticcultural experiences than they expect or desire. The uniqueness of our diverse cultures, both incu tu a e pe e ces t a t ey e pect o des e e u que ess o ou d e se cu tu es, bottheir historical and modern forms, represent a significant opportunity for South Africa’scompetitiveness globally – exactly because this speaks directly to one of the key drivers ofoutbound Western markets: the desire to experience another culture.I th d ti k t th h ll f i t i i i t i t i iIn the domestic market, the challenges of growing tourism in emerging tourism segments is inmany respects dependent on new offerings becoming available. Despite conventional wisdom,emerging tourism segments want many of the same things as the foreign market – and they wantit delivered by an industry that represents the totality of South African society.The mandate of the TGS process is to develop an approach that not only supports thetransformation agenda, but which also specifically seeks out sources of growth throughtransformation.
36 Copyright © 2010 SA Tourism. Not to be reproduced without permission
CHALLENGE: Distribution
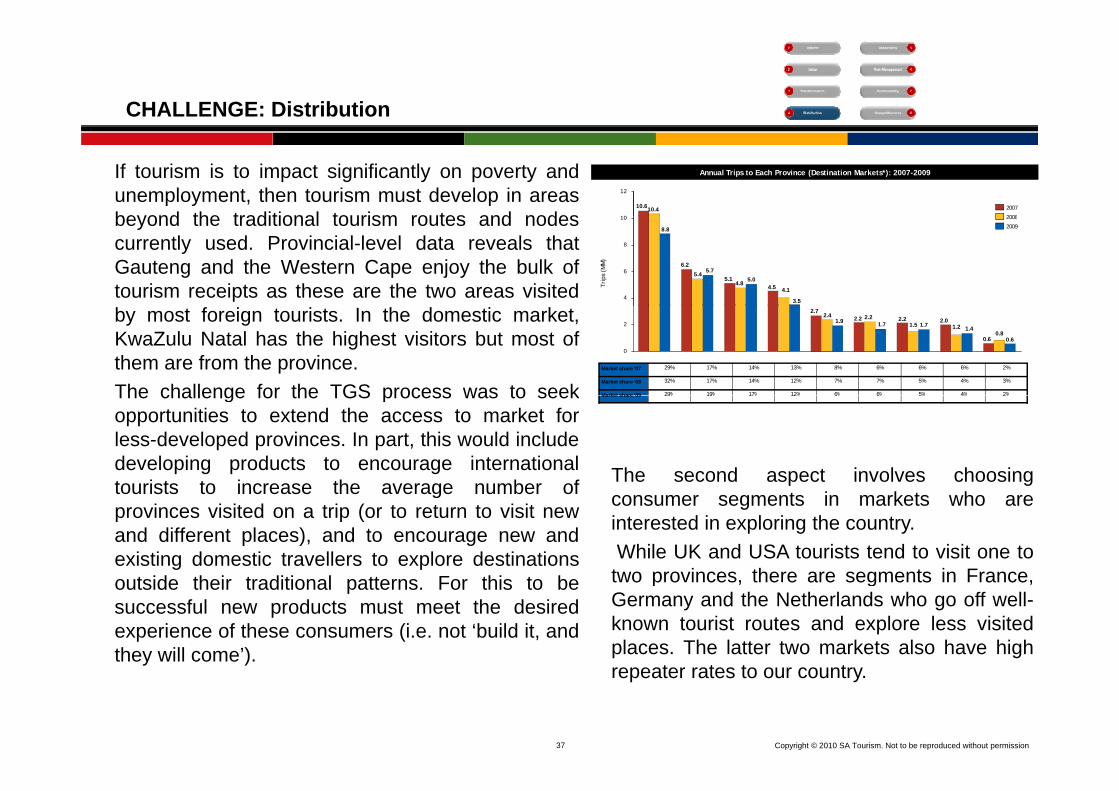
If tourism is to impact significantly on poverty andunemployment, then tourism must develop in areasbeyond the traditional tourism routes and nodes
Annual Trips to Each Province (Destination Markets*): 2007-2009
10.610.410
12
2008
2007
beyond the traditional tourism routes and nodescurrently used. Provincial-level data reveals thatGauteng and the Western Cape enjoy the bulk oftourism receipts as these are the two areas visited 4.5
5.1
6.2
4.14.8
5.4
3.5
5.05.7
8.8
4
6
8
102009
2008
Tri
ps (
MM
)
by most foreign tourists. In the domestic market,KwaZulu Natal has the highest visitors but most ofthem are from the province.The challenge for the TGS process was to seek
0.6
2.02.22.22.7
1.22.22.4
0.81.5
0.6
1.41.71.71.9
0
2
Market share ‘07 29% 17% 14% 13% 8% 6% 6% 6% 2%
Market share ‘08 32% 17% 14% 12% 7% 7% 5% 4% 3%
Market share ‘09 29% 19% 17% 12% 6% 6% 5% 4% 2%The challenge for the TGS process was to seekopportunities to extend the access to market forless-developed provinces. In part, this would includedeveloping products to encourage internationaltourists to increase the average number of The second aspect involves choosing
Market share 09 29% 19% 17% 12% 6% 6% 5% 4% 2%
tourists to increase the average number ofprovinces visited on a trip (or to return to visit newand different places), and to encourage new andexisting domestic travellers to explore destinations
p gconsumer segments in markets who areinterested in exploring the country.While UK and USA tourists tend to visit one totwo provinces there are segments in Franceoutside their traditional patterns. For this to be
successful new products must meet the desiredexperience of these consumers (i.e. not ‘build it, andthey will come’).
two provinces, there are segments in France,Germany and the Netherlands who go off well-known tourist routes and explore less visitedplaces. The latter two markets also have high
t t t t
37 Copyright © 2010 SA Tourism. Not to be reproduced without permission
y )repeater rates to our country.

CHALLENGE: Tourism value from long-haul travel was being captured mainly by three provinces — adding up to 81% of the tourism receipts
13.0
Average Length of Stay per Province by Long-Haul Tourists to South Africa — Departure Surveys (2009)
LowMediumHigh
9.15.5
3.3
10.16.9Share of Nights Spent by
Province (2009)
KZN11.4%
Other 19.1%
7.3
Gauteng26.7% Western
Cape 42.8%
12 9
9.2
38 Copyright © 2010 SA Tourism. Not to be reproduced without permission
12.9
CHALLENGE: Seasonality
Like many other destinations, South Africa faces the challenge of seasonality in domestic andforeign arrivals. Domestic travel patterns follow the patterns around school, religious andtraditional holidays with strong peaks at year-end and Eastertraditional holidays, with strong peaks at year end and Easter.The seasonality of foreign arrivals varies by region (driven by market-specific and traditionalholiday patterns). Overseas arrivals, dominated by significant numbers of VFR arrivals and thetradition of the “big trip” being in the European winter, result in a strong peak starting in October
S f fand ending in February. June is traditionally South Africa’s lowest month and for some keyoverseas markets represents almost half of the arrivals for the year-end peak.These seasonal patterns present a significant challenge for product owners and transportoperators as business profitability and job sustainability is a function of activity throughout theoperators as business profitability and job sustainability is a function of activity throughout theyear. Both costs and investment must therefore be made in line with expected total annualrevenues.To invest ahead of growth in an environment where new demand will be further concentrated at
ti l ti f th d ’t k b i F thi i thone particular time of the year doesn’t make business sense. For this reason we experience theperennial issue of limited seat availability on airlines in the peak. At the same time, the impact ofemployment is also sub-optimal as jobs increasingly become seasonal and temporary in nature.Against this background, the TGS and Portfolio Review looks for opportunities to address thisg g , ppchallenge – particularly through finding new market segments (domestic and international) whosetravel patterns may be more flexible so we can extend the season and/and reduce the level of thegap between high and low months.
39 Copyright © 2010 SA Tourism. Not to be reproduced without permission
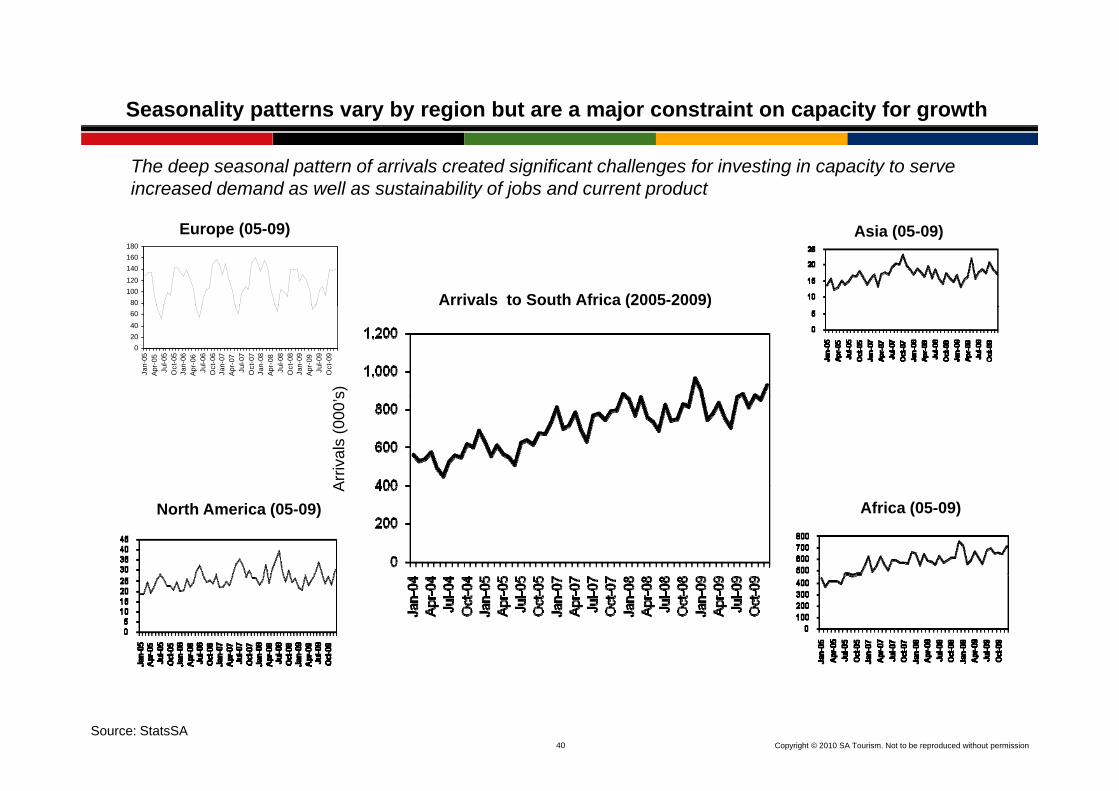
Seasonality patterns vary by region but are a major constraint on capacity for growth
The deep seasonal pattern of arrivals created significant challenges for investing in capacity to serve increased demand as well as sustainability of jobs and current product
80100120140160180
Arrivals to South Africa (2005-2009)
Europe (05-09) Asia (05-09)
0204060
Jan-
05Ap
r-05
Jul-0
5O
ct-0
5Ja
n-06
Apr-
06Ju
l-06
Oct
-06
Jan-
07Ap
r-07
Jul-0
7O
ct-0
7Ja
n-08
Apr-
08Ju
l-08
Oct
-08
Jan-
09Ap
r-09
Jul-0
9O
ct-0
9
( )
s)Ar
rival
s (0
00’s
A
North America (05-09) Africa (05-09)
40 Copyright © 2010 SA Tourism. Not to be reproduced without permissionSource: StatsSA

Over-exposure to Europe and Africa raised the need to spread the risk globally and invest in Asia and the Americas
North AmericaNorth America
314 696 arrivals
EuropeEurope
1,348,502 arrivals14% of total arrivals
314,696 arrivals3% of total arrivals Middle East
44,625 arrivals0.4% of total arrivals
C & S
AsiaAsia
209,110 arrivals2% of total arrivals
Central & South America
65,211 arrivals1% of total arrivals
AustralasiaAustralasia
113,180 arrivals1% of total arrivals
AFRICAAFRICA
7,744,176 arrivals78% of total arrivals
Indian Ocean Islands
18 745 arrivals
41 Copyright © 2010 SA Tourism. Not to be reproduced without permission
Neighbouring countries7,173,791 arrivals72% of total
18,745 arrivals0.2% of total arrivals
Source: SAT Table A December 2009
CHALLENGE: Risk Management
Tourism industries, particularly those which are heavily dependent on foreign source markets, arevulnerable to unpredictable events outside of their spheres of direct influence. The last twodecades have seen national tourism industries rocked by a series of events from the globaldecades have seen national tourism industries rocked by a series of events from the globalfinancial crisis, the events of 9/11, the Asian SARS virus, the Tsunami of December 2004 to theoutbreak of the H1N1 virus in 2009.
Destinations like Australia, South Africa and Brazil have in addition faced challenges aroundglobal exchange rate fluctuations which have made price consistency management andcompetitiveness challenging.
Some of the cyclicality in South Africa’s growth performance can be attributed in part to an over-dependence on a narrow set of source markets – mainly neighbouring states and Europe.The TGS process was therefore mandated to find an approach that ensured that limited marketingp pp gresources were deployed in a fashion that achieved an appropriate balance between the need tofocus as well as reducing the level of dependence on a set of markets in one or two economicregions.
42 Copyright © 2010 SA Tourism. Not to be reproduced without permission
CHALLENGE: Sustainability
The recognition that South Africa’s competitive strategy needed a fundamental review wasaccompanied by a clear desire that future growth must be sustainable in the long run.While the patterns of growth in recent years suggest that there will always be periods of growthWhile the patterns of growth in recent years suggest that there will always be periods of growthand followed by periods of consolidation, these should not become patterns of boom and bustdriven by short-term tactical approaches to market opportunities. Instead, growth in our industrymust become about sustained investment behind clear choices around how to differentiateourselves in important target markets for the future development of our destinationourselves in important target markets for the future development of our destination.
Thus the mandate to the TGS process was that the choices made about which markets to target,how to re-position the brand, and how we compete in the channel and the market, needed to behow to re position the brand, and how we compete in the channel and the market, needed to bechoices about the long term.
These choices would have to enable South Africa to differentiate itself from the world in a way thatis compelling to consumers, internally consistent, practical to implement, inspiring of confidence ininvestors and the industry, and clear and action-oriented in its message about what needs to bedone.
43 Copyright © 2010 SA Tourism. Not to be reproduced without permission
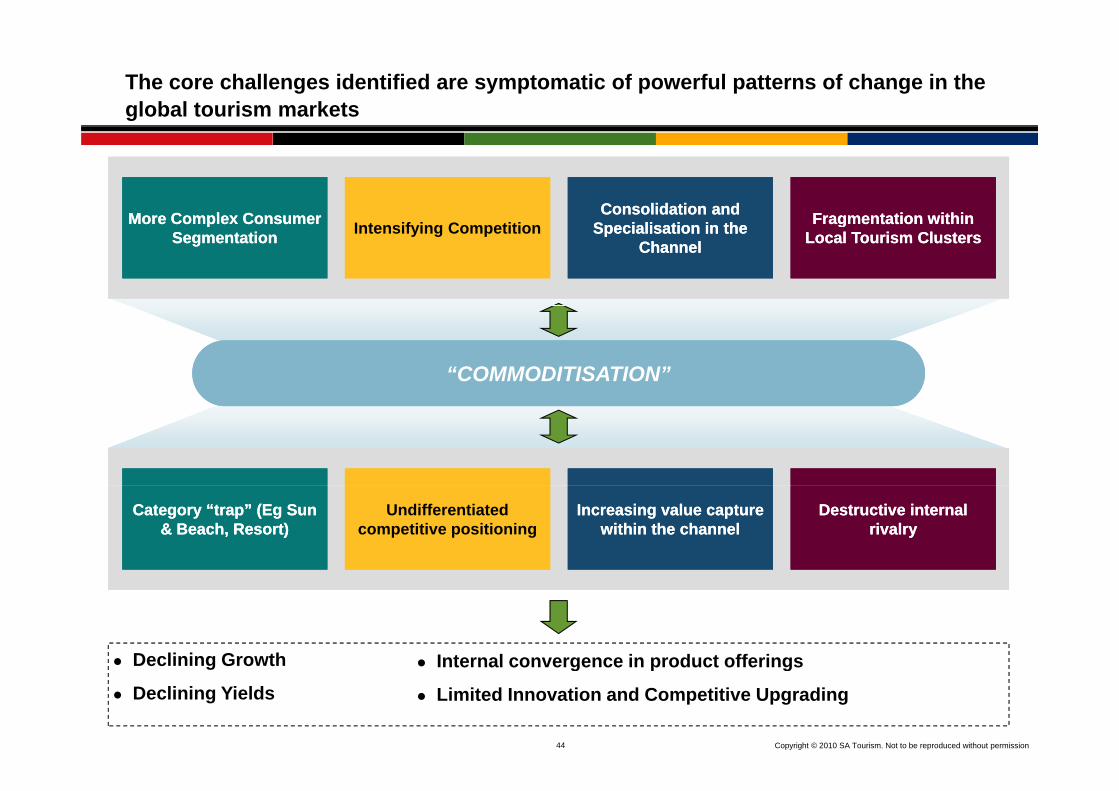
The core challenges identified are symptomatic of powerful patterns of change in the global tourism markets
More Complex ConsumerMore Complex Consumer Consolidation and Consolidation and Fragmentation withinFragmentation withinMore Complex Consumer More Complex Consumer SegmentationSegmentation Intensifying Competition Specialisation in the Specialisation in the
ChannelChannel
Fragmentation within Fragmentation within Local Tourism ClustersLocal Tourism Clusters
“COMMODITISATION”
Category “trap” (Eg Sun Category “trap” (Eg Sun & Beach, Resort)& Beach, Resort)
Undifferentiated competitive positioning
Increasing value capture Increasing value capture within the channelwithin the channel
Destructive internal Destructive internal rivalryrivalry
Declining Growth Internal convergence in product offerings
44 Copyright © 2010 SA Tourism. Not to be reproduced without permission
Declining Growth
Declining YieldsInternal convergence in product offerings
Limited Innovation and Competitive Upgrading

With product offerings that overlap so much, it’s easy to offer a diversity of offerings -and become commoditized in the process
‘CULTURE’‘ADVENTURE’
‘EXOTIC’
The combined
‘CUISINE’‘SPORT’
The combined product offerings of
‘ANY
COUNTRY’‘SUN AND SAND’
‘DISCOVERY’COUNTRY
‘NATURAL BEAUTY’
‘DISCOVERY’
‘CITIES’
45 Copyright © 2010 SA Tourism. Not to be reproduced without permissionSource: Composite of offerings/pictures from the countries studied
‘MOUNTAINS’‘WILDLIFE’
CHALLENGE: Competitiveness
All of the challenges described before ultimately come back to a single key proposition: SouthAfrica, in order to achieve sustained growth, must to be able to differentiate itself from itscompetitors now and for future growthcompetitors now and for future growth.
In a dynamic world market, differentiation requires constant innovation and renewal becausetourism is rife with the practice of replicating good ideas and not so good at creating new ones. Sop p g g g gflavour of the month soon becomes yesterday’s news.
An industry that is innovative is one that is characterised by businesses, institutions andi ti th t i f d hi ti t d i th i tl k d t tl i ti t dorganisations that are informed, sophisticated in their outlook and constantly investing to upgrade
their performance against their consumer’s every changing needs and choices.
While there is evidence of many new and interesting things happening all the time – in terms ofWhile there is evidence of many new and interesting things happening all the time – in terms ofofferings, products, and experiences – in the mind of consumers globally, South Africa remains,on the whole, much the same as what it was 10 to 15 years ago. South Africa is still perceivedmainly as an adventurous wildlife destination with striking natural beauty.
Most consumers globally have low levels of travel awareness about South Africa and regard ourcountry as generally unsafe and often unstable as well. While the 2010 FIFA World CupTM helpedraised the profile of South Africa on the global stage our cultural assets are largely unclear in the
46 Copyright © 2010 SA Tourism. Not to be reproduced without permission
raised the profile of South Africa on the global stage, our cultural assets are largely unclear in theconsumer’s mind, and undifferentiated from the rest of the continent.

Challenges that remain going forward
Of all the the global events, the economic crisis had the most pronounced effect on the tourism industry.Consumer and business confidence fell as global unemployment rose. Globally, businesses are dealing
ith th f t th t ill “ l” C d hift th k l fwith the fact that recovery will mean a “new normal”. Consumers need shift as they seek value for moneyofferings and become increasingly conscious of their carbon footprint.Internally, our tourism industry remains fragmented, and often inter-company, inter-provincial and inter-city competitive behaviour is destructive. Firms at different parts of the value chain often struggle to findopportunities for co-operation and collaboration, leaving the space open for stronger players higher up thevalue chain to exert considerable influence over pricing, packaging and the shape of the valueproposition.Tourism value-chains are still under-developed, and linkages across the industry are still generallyp , g y g yfragmented and shallow. Supporting institutions and organisations, whether public or private, arerelatively new and face periodic crises of confidence and legitimacy as they struggle to find adequateskills and resources.Thus the mandate for the TGS process was extended in 2003 to move beyond the challenges ofThus the mandate for the TGS process was extended in 2003 to move beyond the challenges ofcompetitive go-to-market strategies in target markets, which themselves are struggling to recoverfollowing the global financial crisis of 2008. The next stage had to extend into identifying what needed tobe done in order to upgrade the micro-economic context within which tourism firms operate (i.e. thebusiness environment) and where new platforms to support competitiveness need to be established.business environment) and where new platforms to support competitiveness need to be established.
All of the eight challenges described above have to be addressed in ways that recognise the realities of adynamic and difficult global market. Whatever the TGS process came up with, it had to be bold in its
biti d t th ti li ti b t h t t i t i d b th liti f l b l
47 Copyright © 2010 SA Tourism. Not to be reproduced without permission
ambitions, and at the same time realistic about what constraints are imposed by the realities of globalmarkets.

The global context continues to challenge us to make tough choices
Despite increases in overall funding of the marketing campaign, the total budget is small in global terms. SA Tourism needs to focus its efforts and resources on th t i d t t hi h t l bl t S th
Focus effort and Focus effort and resourcesresources those countries and customer segments which are most valuable to South
Africa.resourcesresources
A i l t S th Af i till t d d t f l k t Th iArrivals to South Africa are still too dependent on a few large markets. The mix of arrivals needs to lessen dependence on volatile markets and at the same time increase our share in high-value markets.
ReRe--balance the balance the portfolioportfolio
Generic ‘spray and pray’ marketing, and increased commoditisation of the offering by channels, results in averaging and low returns. SA’s marketing has to focus on specific sets of consumers (and the specific channels that serveMarketing to be Marketing to be
b d ib d i to focus on specific sets of consumers (and the specific channels that serve them), and speak directly to their specific holiday buying criteria. We need to move from pushing what we like about SA to delivering to consumers what they want and in line with our tourism brand.
based on a view based on a view of customersof customers
Behind the strategy the tourism industry needs to redefine and upgrade products and services to deliver against the promise offered by the marketing message.
Create alignment Create alignment within the within the
tourism sectortourism sector
48 Copyright © 2010 SA Tourism. Not to be reproduced without permission
marketing message.tourism sectortourism sector

Table of Contents
Introduction Page 3
Core Business of SA Tourism Page 12
Key challenges for tourism Page 21
SA Tourism Focus: Where to Play
– Review of the portfolio of markets Page 48
– International consumers Page 65
– Domestic market Page 73
R i f 2003 2008 P 79Review of 2003 – 2008 Page 79
Conclusion Page 87
49 Copyright © 2010 SA Tourism. Not to be reproduced without permission
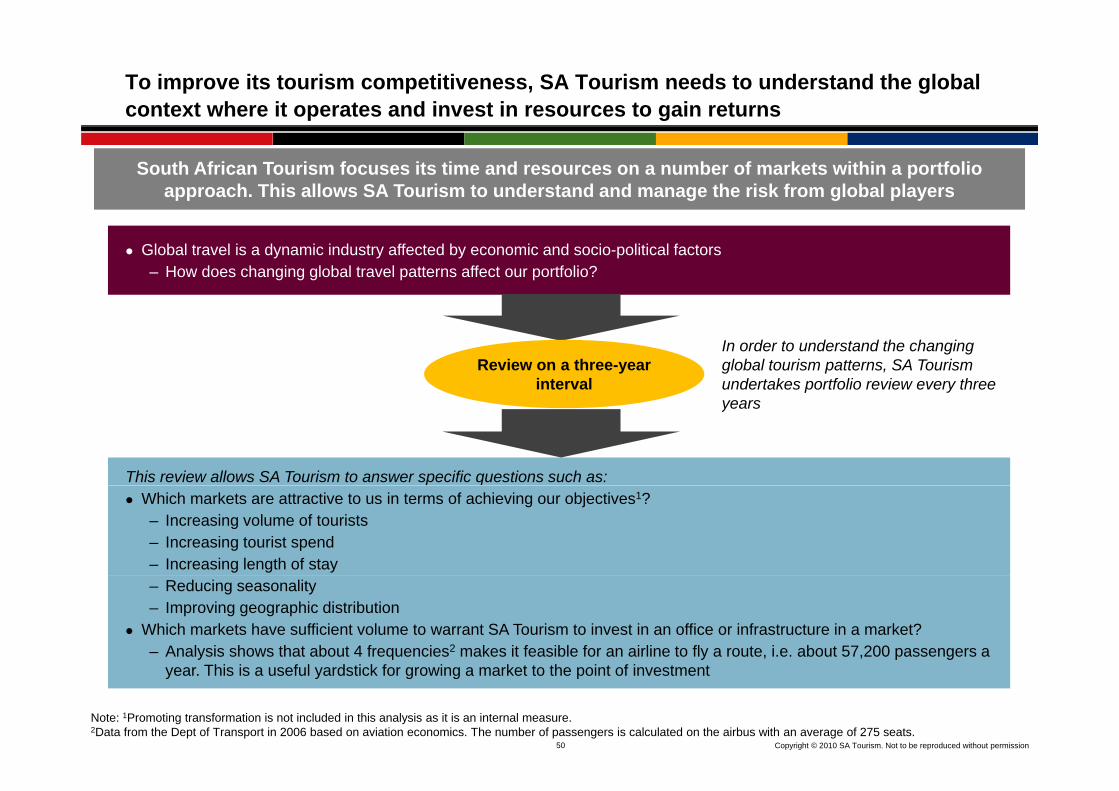
To improve its tourism competitiveness, SA Tourism needs to understand the global context where it operates and invest in resources to gain returns
South African Tourism focuses its time and resources on a number of markets within a portfolio approach. This allows SA Tourism to understand and manage the risk from global players
Global travel is a dynamic industry affected by economic and socio-political factors– How does changing global travel patterns affect our portfolio?
Review on a three-year interval
In order to understand the changing global tourism patterns, SA Tourism undertakes portfolio review every three
This review allows SA Tourism to answer specific questions such as:
years
Which markets are attractive to us in terms of achieving our objectives1?– Increasing volume of tourists– Increasing tourist spend– Increasing length of stay– Reducing seasonality– Improving geographic distribution
Which markets have sufficient volume to warrant SA Tourism to invest in an office or infrastructure in a market?– Analysis shows that about 4 frequencies2 makes it feasible for an airline to fly a route, i.e. about 57,200 passengers a
Thi i f l d ti k f i k t t th i t f i t t
50 Copyright © 2010 SA Tourism. Not to be reproduced without permission
Note: 1Promoting transformation is not included in this analysis as it is an internal measure.2Data from the Dept of Transport in 2006 based on aviation economics. The number of passengers is calculated on the airbus with an average of 275 seats.
year. This is a useful yardstick for growing a market to the point of investment

Review of SA Tourism’s portfolio is the key process that helps to update and develop the Marketing Tourism Growth Strategy every three years
T i l b l t d t d t d hi h k t tt ti i th h t
The key objectives of Portfolio Review are:1
ReviewTo review global trends to understand which markets are attractive in the short-and the long-term against the organisation’s key objectives taking into account events, e.g. 2010 FIFA World Cup
UpdateTo understand which markets we should consider playing and how we should play in these markets ahead of the following year’s business plan, i.e. setting up the organisation’s investment decisions for the next three years
2
Cost-benefit Evaluation
To understand the cost and related benefit of investing in each market in terms of the return on investment for South Africa
3
This is the fourth portfolio review done by SAT. Prior to 2002, SAT was a largely response-led
Evaluation of the return on investment for South Africa
p y , g y porganisation without clear strategic objectives and focus. The methodology of the review has
deepened our knowledge of markets and has increased our ability to measure resultsIn business tourism, the prime focus is on the global association market, while in event tourism, sport and culture
are the focus areas. These choices are not geographically based and are therefore not part of the portfolio review
51 Copyright © 2010 SA Tourism. Not to be reproduced without permission
are the focus areas. These choices are not geographically based and are therefore not part of the portfolio review

The review considers that markets are at different stages of development and therefore need market specific strategies to activate
Introduction Growth Maturity
Tourism Industry Life Cycle
USA
Germany, Netherlands,
France, UK, Japan
% of population
Italy
KenyaNigeria
traveling for leisure
SADCChina, IndiaSouth Africa
Australia
Botswana
This phase may be very long
Consumer Uninformed, Price insensitive, multi-purpose
V i di id li d
Seek information & opportunity, discover leisure
E f k
Very informed, price sensitive, focus on leisure
Time*
Product
Competitor
Ch l
Very individualizedStatus oriented
FewOne-stop-shops
Unsophisticated isolated
Emergence of packages (seeking scale effects)
Emerging specialization / focus
Integrate products;
Specialized packages
High competitionClear focus
Specialization Information
MarketSymptoms
Marketing
O ll
Channel Unsophisticated, isolated, experience based
Combine with trade initiatives
D l iti i
Integrate products; information/choice provider
“Shout”: get as many as you can
Facilitate scale effects (e.g.,
Specialization, Information provider
Adapt trade and market to select segments
U d t d t & l t
TourismAuthorityActions
52 Copyright © 2010 SA Tourism. Not to be reproduced without permission
Overall strategy Develop positioning Facilitate scale effects (e.g., packages) Understand segments & selectActions
* The duration of the phases of the life cycle may vary significantly; their graphical representation with equal distances may thus be misleading. Note: Framework based on Michael Porter: Competitive Strategy, 1980, Chapter 8 (Industry Evolution)
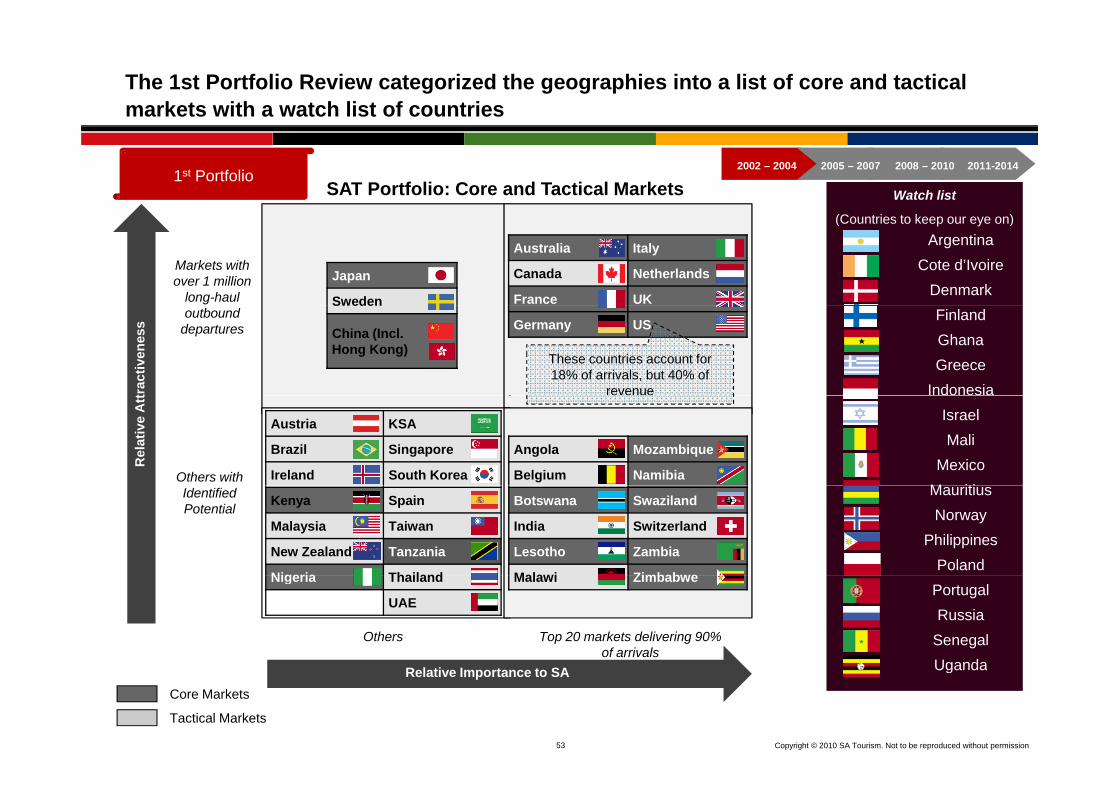
The 1st Portfolio Review categorized the geographies into a list of core and tactical markets with a watch list of countries
SAT Portfolio: Core and Tactical Markets Watch list
(C t i t k )
2011-20142008 – 20102005 – 20072002 – 20041st Portfolio
Markets with over 1 million
long-haul
(Countries to keep our eye on)Argentina
Cote d’IvoireDenmark
Japan
Sweden
Australia Italy
Canada Netherlands
France UKoutbound
departuresFinlandGhanaGreece
Indonesia
S ede
China (Incl. Hong Kong)
Germany US
These countries account for 18% of arrivals, but 40% of
revenuetrac
tiven
ess
Others with
IsraelMali
MexicoM iti
Angola Mozambique
Belgium Namibia
Austria KSA
Brazil Singapore
Ireland South Korea
Rel
ativ
e A
tt
Identified Potential
MauritiusNorway
PhilippinesPoland
Botswana Swaziland
India Switzerland
Lesotho Zambia
Malawi Zimbabwe
Kenya Spain
Malaysia Taiwan
New Zealand Tanzania
Nigeria Thailand
Top 20 markets delivering 90% of arrivals
Others
PortugalRussia
SenegalUganda
Malawi ZimbabweNigeria Thailand
UAE
53 Copyright © 2010 SA Tourism. Not to be reproduced without permission
Core Markets
Tactical Markets
UgandaRelative Importance to SA
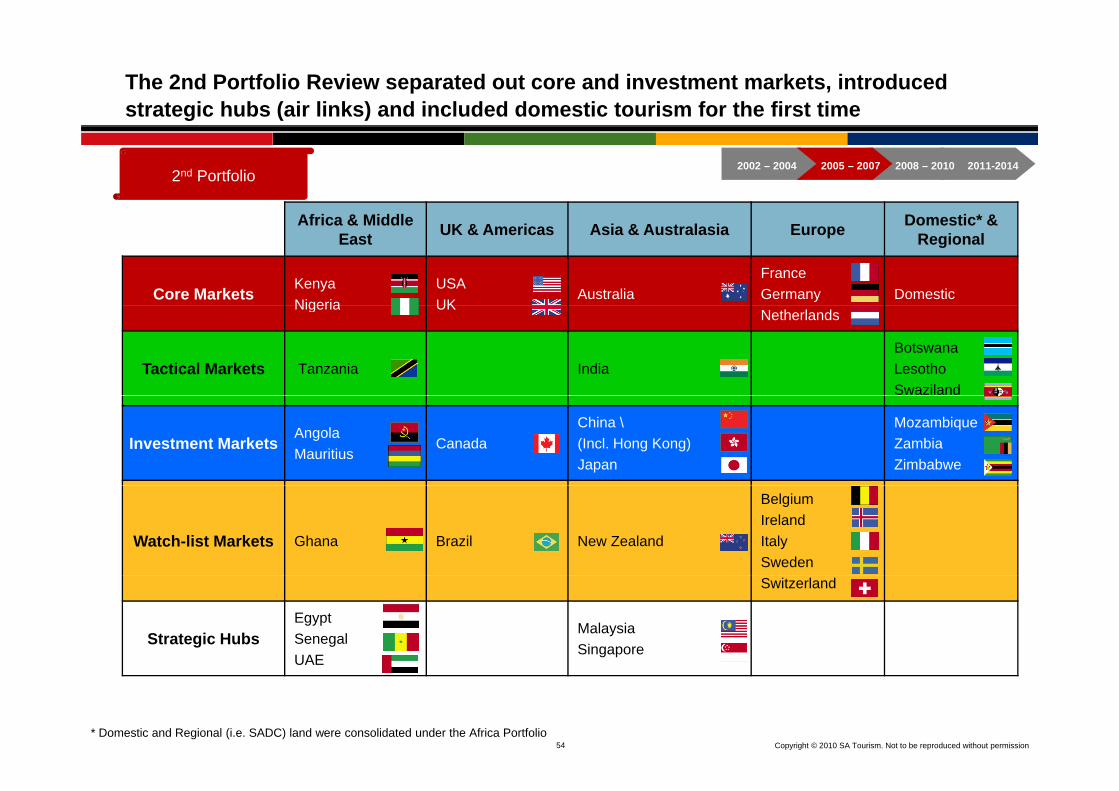
The 2nd Portfolio Review separated out core and investment markets, introduced strategic hubs (air links) and included domestic tourism for the first time
Af i & Middl D ti * &
2nd Portfolio2011-20142008 – 20102005 – 20072002 – 2004
Africa & Middle East UK & Americas Asia & Australasia Europe Domestic* &
Regional
Core Markets KenyaNigeria
USAUK
AustraliaFranceGermany Domestic
Nigeria UKNetherlands
Tactical Markets Tanzania IndiaBotswanaLesothoSwaziland
Investment Markets AngolaMauritius
CanadaChina \(Incl. Hong Kong)Japan
MozambiqueZambiaZimbabwe
Watch-list Markets Ghana Brazil New Zealand
BelgiumIrelandItalySwedenSwitzerland
Strategic HubsEgyptSenegalUAE
MalaysiaSingapore
54 Copyright © 2010 SA Tourism. Not to be reproduced without permission
U
* Domestic and Regional (i.e. SADC) land were consolidated under the Africa Portfolio
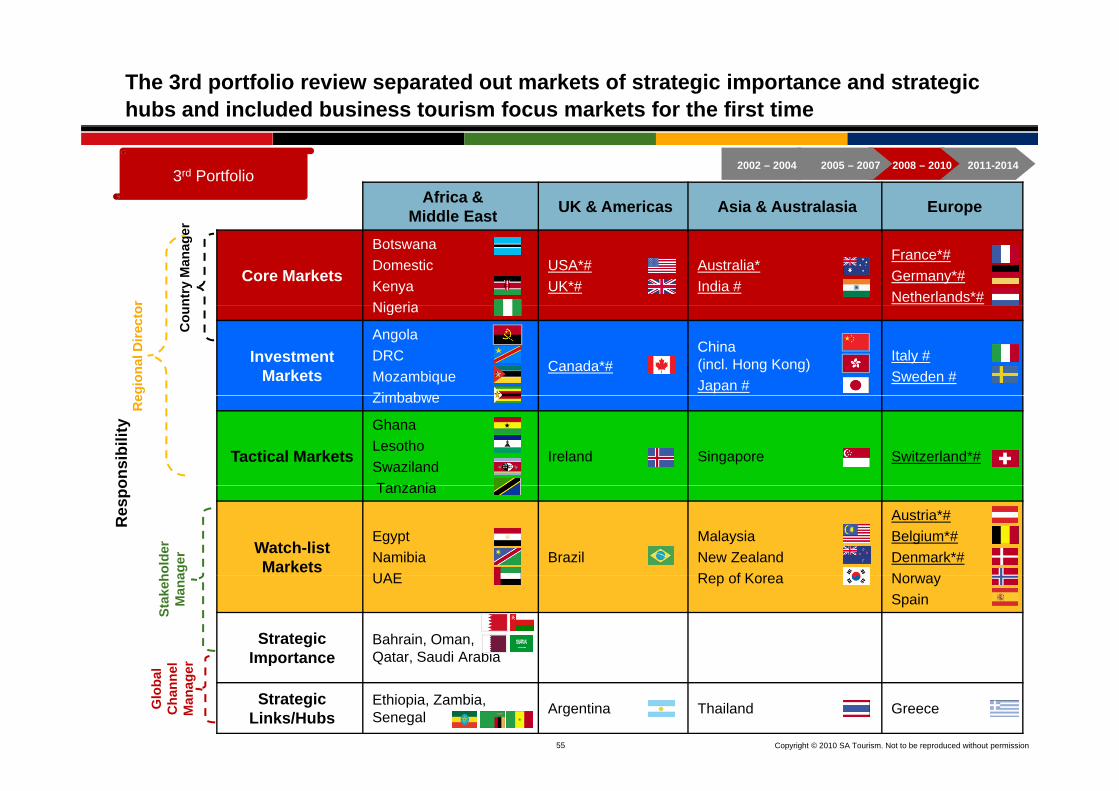
The 3rd portfolio review separated out markets of strategic importance and strategic hubs and included business tourism focus markets for the first time
Africa & Middle East UK & Americas Asia & Australasia Europe
3rd Portfolio2011-20142008 – 20102005 – 20072002 – 2004
Middle East
Core Markets
BotswanaDomesticKenyaNigeria
USA*#UK*#
Australia*India #
France*#Germany*#Netherlands*#nt
ry M
anag
er
r Nigeria
Investment Markets
AngolaDRCMozambiqueZimbabwe
Canada*#China (incl. Hong Kong)Japan #
Italy #Sweden #
Cou
egio
nal D
irect
o
Zimbabwe
Tactical Markets
GhanaLesothoSwazilandTanzania
Ireland Singapore Switzerland*#
Re
onsi
bilit
y
Tanzania
Watch-list Markets
EgyptNamibiaUAE
BrazilMalaysiaNew ZealandR f K
Austria*#Belgium*#Denmark*#Nho
lder
ag
er
Res
po
UAE Rep of Korea NorwaySpain
Strategic Importance
Bahrain, Oman, Qatar, Saudi Arabia
Stak
ehM
ana
l r
55 Copyright © 2010 SA Tourism. Not to be reproduced without permission
p
Strategic Links/Hubs
Ethiopia, Zambia, Senegal Argentina Thailand GreeceG
loba
l C
hann
e lM
anag
er
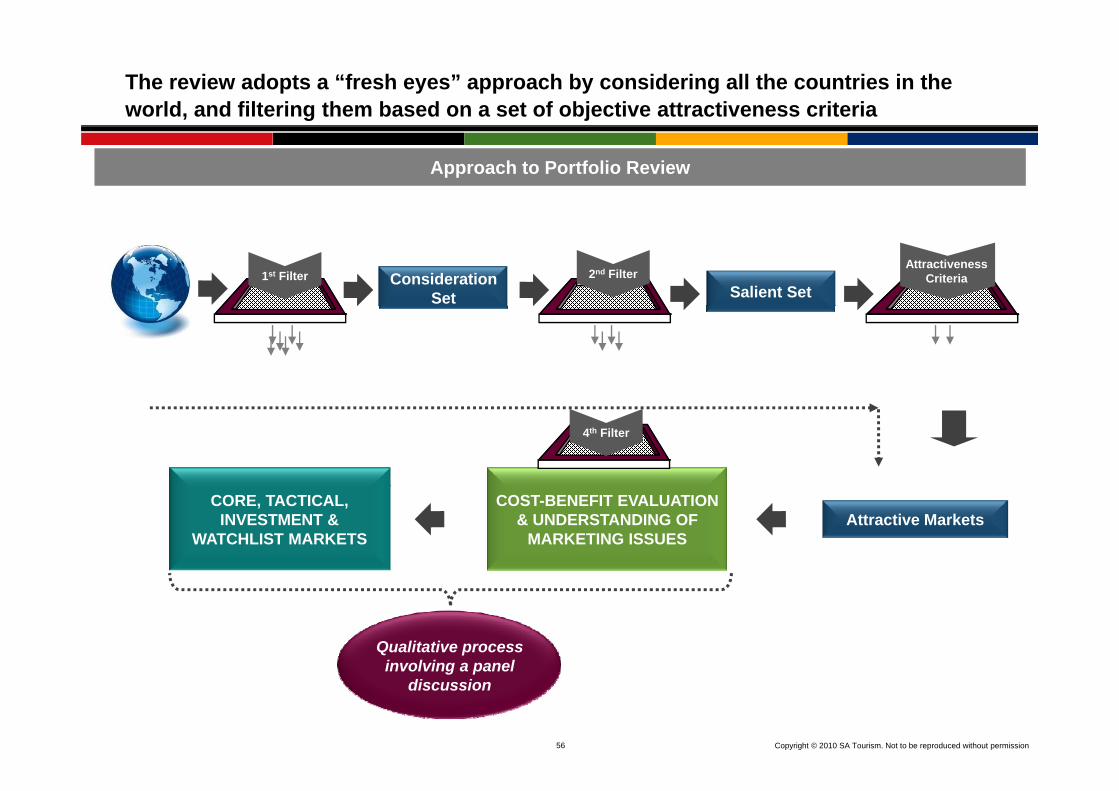
The review adopts a “fresh eyes” approach by considering all the countries in the world, and filtering them based on a set of objective attractiveness criteria
Approach to Portfolio Review
Consideration Set Salient Set
1st FilterAttractiveness
Criteria2nd Filter
4th Filter
Attractive MarketsCOST-BENEFIT EVALUATION
& UNDERSTANDING OF MARKETING ISSUES
CORE, TACTICAL, INVESTMENT &
WATCHLIST MARKETS
Qualitative process involving a panel
56 Copyright © 2010 SA Tourism. Not to be reproduced without permission
involving a panel discussion

Key steps of the Portfolio Review Process
2nd filter1st filter 3rd filter
Exclude sub-Saharan Exclude markets of less T 50 k t i t fExclude sub-Saharan Africa
Exclude markets with less than 4 million people
Exclude markets of less than 3 million people or
GDP per capita is less than US$2,000
Top 50 markets in terms of outbound volume and
value
Exclude markets with less than 20,000 arrivals p.a. or
no airliftMarkets with less than
20,000 arrivals p.a. in 2008 but with airlift (strategic
h b )
than 4 million people living in urban areas and less than 20,000 arrivals
p.a. or no airlift
hubs)Include all Africa land markets*
Top sub-Saharan Africa markets PLUS Africa land
marketsSalient set
How attractive are these markets in the short term Core, tactical, investment
and watch-list marketsApplication of cost-benefit evaluation
4th filter
Final portfolio
57 Copyright © 2010 SA Tourism. Not to be reproduced without permission
and the long term?and watch-list markets benefit evaluation
*Africa land markets are markets where more than 60% of arrivals to SA arrive by land.

Twelve African markets meet the criteria to be added to the “salient” set
A l B t
Africa – land markets
Africa – air markets
Ethi i
Strategichubs
AngolaDem Rep Congo
KenyaNigeriaS b S h Af i
BotswanaLesothoMalawi
Mozambique
EthiopiaGhana
MauritiusSenegal
Exclude markets with an urban population of less than
4 million and arrivals less
NigeriaSub-Saharan Africa MozambiqueNamibia
SwazilandZambia
SenegalTanzania
than 20,000 p.a. or no airlift Zimbabwe
Salient set to which attractiveness criteria Set added to
final portfolio
Africa air markets: >60% of
will be applied final portfolio
58 Copyright © 2010 SA Tourism. Not to be reproduced without permission
Africa – air markets: >60% of arrivals to SA are by airAfrica – land markets: >60% of arrivals to SA are by land

For the most part, the top countries in terms of outbound volume (total) are also the top countries in terms of outbound value
Australia
Austria
Belgium
Japan
Korea, Rep
Mexico
Brazil
Canada
China
Denmark
Argentina
Greece
Belarus
Bulgaria
Netherlands
Norway
Poland
RomaniaDenmark
Egypt
Finland
France
Israel
New Zealand
Czech Rep
Hungary
Kazakhstan
Romania
Russia
Singapore
Spain
Germany
Hong Kong
India
Indonesia
Portugal
Saudi Arabia
UAE
Kazakhstan
Malaysia
Turkey
Sweden
Switzerland
Taiwan
UkraineIndonesia
Iran
Ireland
Italy
UAEUkraine
UK
USA
Total volume Total volume
59 Copyright © 2010 SA Tourism. Not to be reproduced without permission
y

Each market is then evaluated against a set of attractiveness criteria
Short term (2 years) Long term (5 years)
Criteria Weight Criteria Weight
Size of long haul outbound market 30
5 year forward projected LH outbound market 25
Travel intensity (measure of the intensity of travel amongst the population taking the population not living in poverty and the outbound travel volume)
40 5
Total value of the outbound market1 30 20
5 year forward projected GDP / capita at PPP 305 year forward projected GDP / capita at PPP 30
GDP per capita @ PPP 5
I fl ti t 10Inflation rate 10
Political stability of the market 5
60 Copyright © 2010 SA Tourism. Not to be reproduced without permission
Note: 1This figure represents the value of the total outbound market. It is not possible to split this into the value of long-haul travel. Therefore, this criteria must be treated as indicative only.
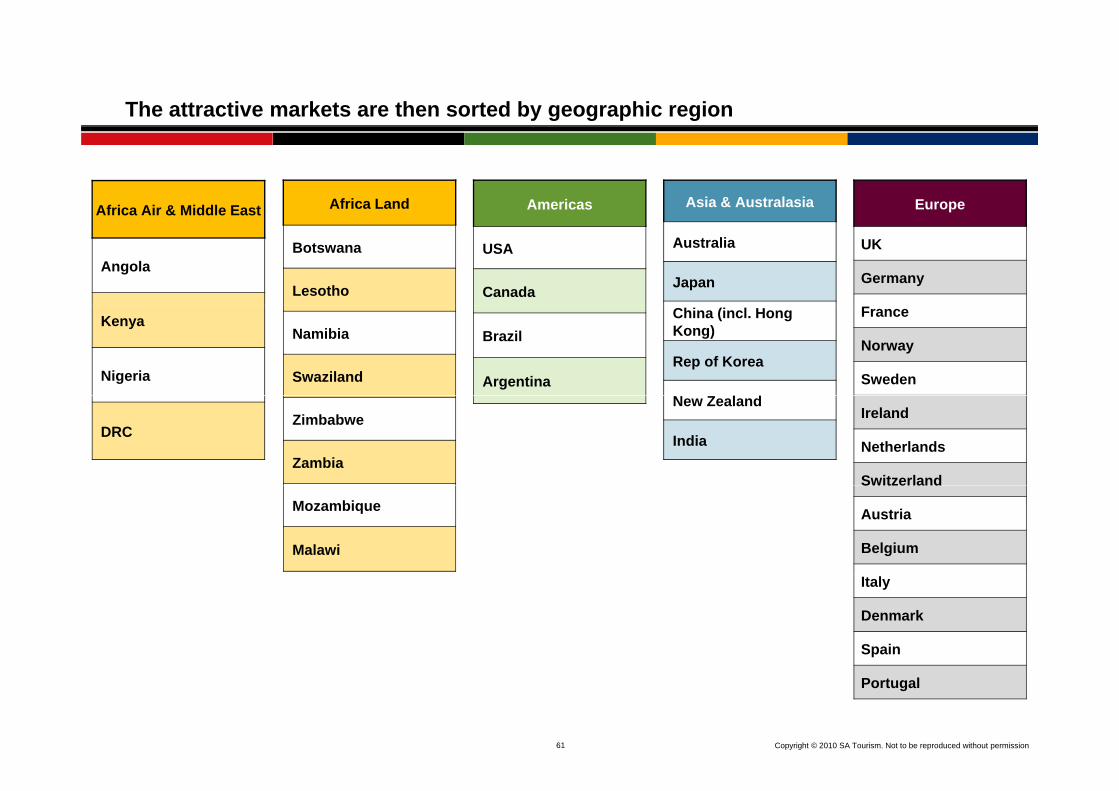
The attractive markets are then sorted by geographic region
Americas EuropeAfrica LandAfrica Air & Middle East Asia & Australasia
USA
Canada
UK
Germany
Botswana
LesothoAngola
Australia
Japan
Brazil
Argentina
France
Norway
Sweden
Namibia
Swaziland
Kenya
Nigeria
China (incl. Hong Kong)
Rep of Korea
Ireland
Netherlands
Switzerland
Zimbabwe
Zambia
DRC
New Zealand
India
Switzerland
Austria
Belgium
Mozambique
Malawi
Italy
Denmark
Spain
61 Copyright © 2010 SA Tourism. Not to be reproduced without permission
Portugal
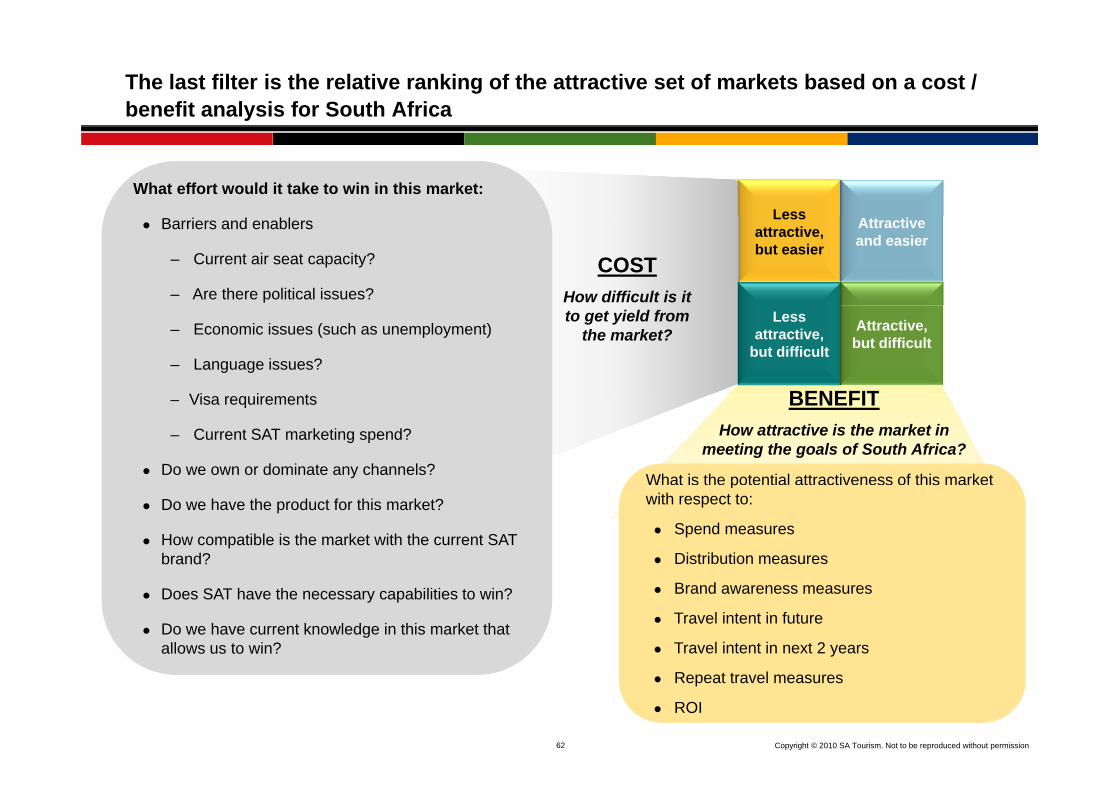
The last filter is the relative ranking of the attractive set of markets based on a cost / benefit analysis for South Africa
LessWhat effort would it take to win in this market:
Less attractive, but easier
Attractive and easier
Barriers and enablers
– Current air seat capacity?
– Are there political issues?
COSTHow difficult is it
Less attractive,
but difficult
Attractive, but difficult
– Economic issues (such as unemployment)
– Language issues?
Vi i t BENEFIT
to get yield from the market?
What is the potential attractiveness of this market
– Visa requirements
– Current SAT marketing spend?
Do we own or dominate any channels?
BENEFITHow attractive is the market in
meeting the goals of South Africa?
pwith respect to:
Spend measures
Distribution measures
Do we have the product for this market?
How compatible is the market with the current SAT brand?
Brand awareness measures
Travel intent in future
Travel intent in next 2 years
Does SAT have the necessary capabilities to win?
Do we have current knowledge in this market that allows us to win?
62 Copyright © 2010 SA Tourism. Not to be reproduced without permission
Repeat travel measures
ROI

The results of the evaluation will illustrate the suggested core, tactical, investment and watch-list markets within each region
Results of Portfolio ReviewCore markets are those
which present the greatestTactical markets are those which
should be considered for
Less Attractive But Easier
T i l M kAttractive And Easier
C M k
which present the greatest opportunity
should be considered for specific, tactical opportunities
Tactical MarketsMarkets where there are particular opportunities, i.e. “low hanging fruit”15% of organisation’s effort deployed
Core MarketsMarkets that deliver the “bread & butter” 60% of organisation’s effort deployed against these marketsge
t
15% of organisation s effort deployed against these markets
against these marketsBest capabilities allocated to these markets
Less Attractive And Difficult Attractive But Difficultasie
r to
Targ
Watch-list MarketsMarkets that are on the radarActivity in these markets will only occur if
Investment MarketsInvest in these markets ahead of return, i.e. invest for the future
Ea
there is spare capacity in the organisation5% of organisation’s effort deployed against these markets
20% of organisation’s effort deployed against these markets
Investment markets are those
63 Copyright © 2010 SA Tourism. Not to be reproduced without permission
Watch-list markets need to be watched for value segments
Attractiveness of MarketInvestment markets are those
where some investment is made for returns in future

Markets that fall into the Watch-list category need to be further rationalised to understand the relative attractiveness of each market in this set
An evaluation of the effort vs. gain of investing was conducted for the watch-list markets, resulting in a ranking of watch-list markets
Less Attractive But Easier
Tactical MarketsMarkets where there are particular opportunities, i.e. “low hanging fruit”15% of organisation’s effort deployed
Attractive & Easier
Core MarketsMarkets that deliver the “bread & butter” 60% of organisation’s effort deployed against these markets
15% of organisation s effort deployed against these markets Best capabilities allocated to these
markets
Less Attractive & Difficult
Watch-list MarketsAttractive But Difficult
Investment MarketsEasi
er to
Tar
get
Markets that are on the radarActivity in these markets will only occur if there is spare capacity in the organisation5% of organisation’s effort deployed against these markets
Invest in these markets ahead of return, i.e. invest for the future20% of organisation’s effort deployed against these markets
Less attractive but easier Attractive & easier Watch-list markets
Attractiveness
Less attractive & difficult Attractive but difficult Markets that have
possible strategic value*
Markets to drop off the list
64 Copyright © 2010 SA Tourism. Not to be reproduced without permission
Note: Core, tactical and strategic markets were excluded from the original effort vs. gain evaluation to give the scores for just the watch-list markets.*This depends on the air lift and air capacity in the market as well as national imperatives.

The 4th Portfolio Review took place during July/ August 2009 and the outcomes will be implemented in full by 01 April 2011
Africa & Middl E t UK & Americas Asia & Australasia Europe
4th Portfolio
2011-20142008 – 20102005 – 20072002 – 2004
Middle East UK & Americas Asia & Australasia Europe
Core Markets
AngolaBotswanaKenya USA*
Australia*India
France*GermanyNetherlandsr tr
y M
anag
er
NigeriaSouth Africa*
India NetherlandsUK*
Investment Markets
DRCMozambique
BrazilCanada
China (incl. Hong Kong)J
BelgiumItaly
egio
nal D
irect
o
Cou
n t
Markets Mozambique Canada Japan Sweden
Tactical Markets LesothoSwaziland
New Zealand Ireland
M l iAustria
Re
onsi
bilit
y
Watch-list Markets
MalawiNamibiaZambiaZimbabwe
Argentina Republic of KoreaDenmarkPortugalSpainSwitzerland
hold
er
ager
Res
po
Strategic Importance
Bahrain, Oman,
Qatar, Saudi Arabia
Egypt, Ethiopia,
Stak
ehM
ana
l r
65 Copyright © 2010 SA Tourism. Not to be reproduced without permission
Strategic Air Links/Hubs
Ghana, Mauritius, Tanzania, Senegal, UAE
MalaysiaSingapore
Glo
bal
Cha
nne l
Man
ager
*Indicates Business Tourism Hubs

Table of Contents
Introduction Page 3
Core Business of SA Tourism Page 12
Key challenges for tourism Page 21
SA Tourism Focus: Where to Play
– Review of the portfolio of markets Page 48
– International consumers Page 65
– Domestic market Page 73
R i f 2003 2008 P 79Review of 2003 – 2008 Page 79
Conclusion Page 87
66 Copyright © 2010 SA Tourism. Not to be reproduced without permission
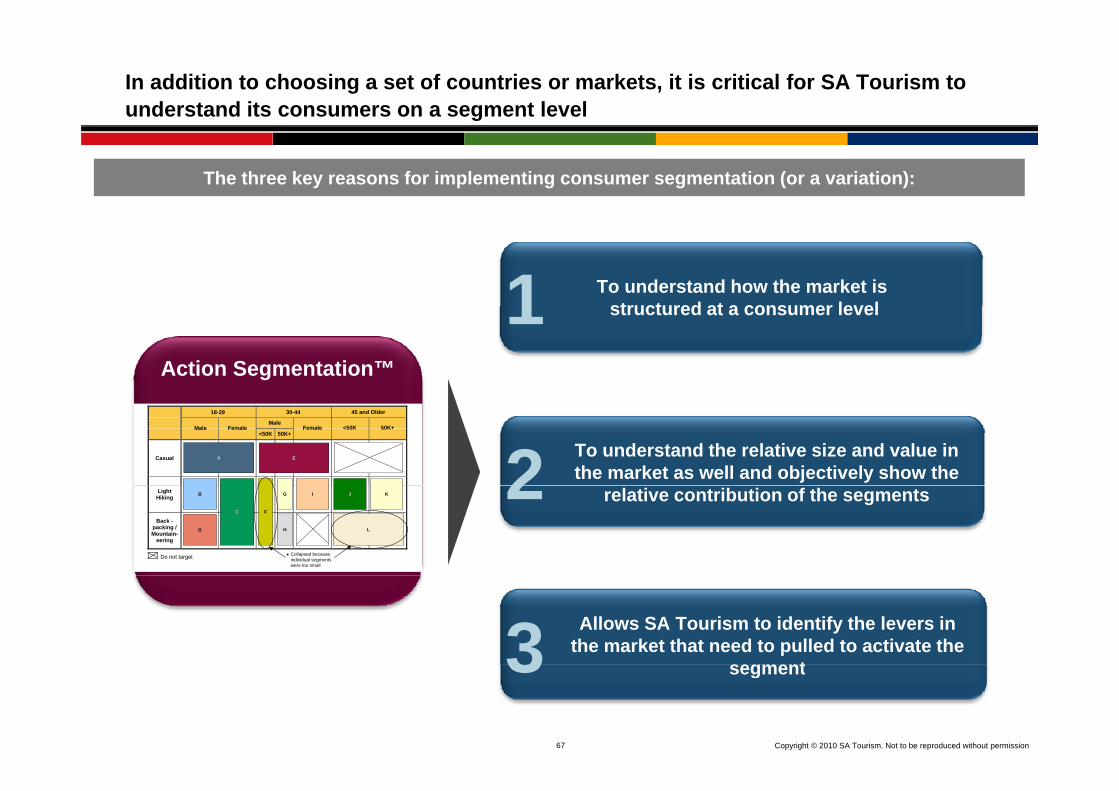
In addition to choosing a set of countries or markets, it is critical for SA Tourism to understand its consumers on a segment level
The three key reasons for implementing consumer segmentation (or a variation):
To understand how the market isstructured at a consumer level1
Action Segmentation™
structured at a consumer level 1
To understand the relative size and value in the market as well and objectively show the 2
<50K 50K+
Casual
18-29 30-44 45 and Older
MaleMale Female Female <50K 50K+
AA EE
relative contribution of the segments2LightHiking
Back -packing /Mountain-
eering
CC
D
IB
F
H
G
L
JJ K
Collapsed becauseindividual segmentswere too small
Do not target
Allows SA Tourism to identify the levers in the market that need to pulled to activate the
segment367 Copyright © 2010 SA Tourism. Not to be reproduced without permission
segment3
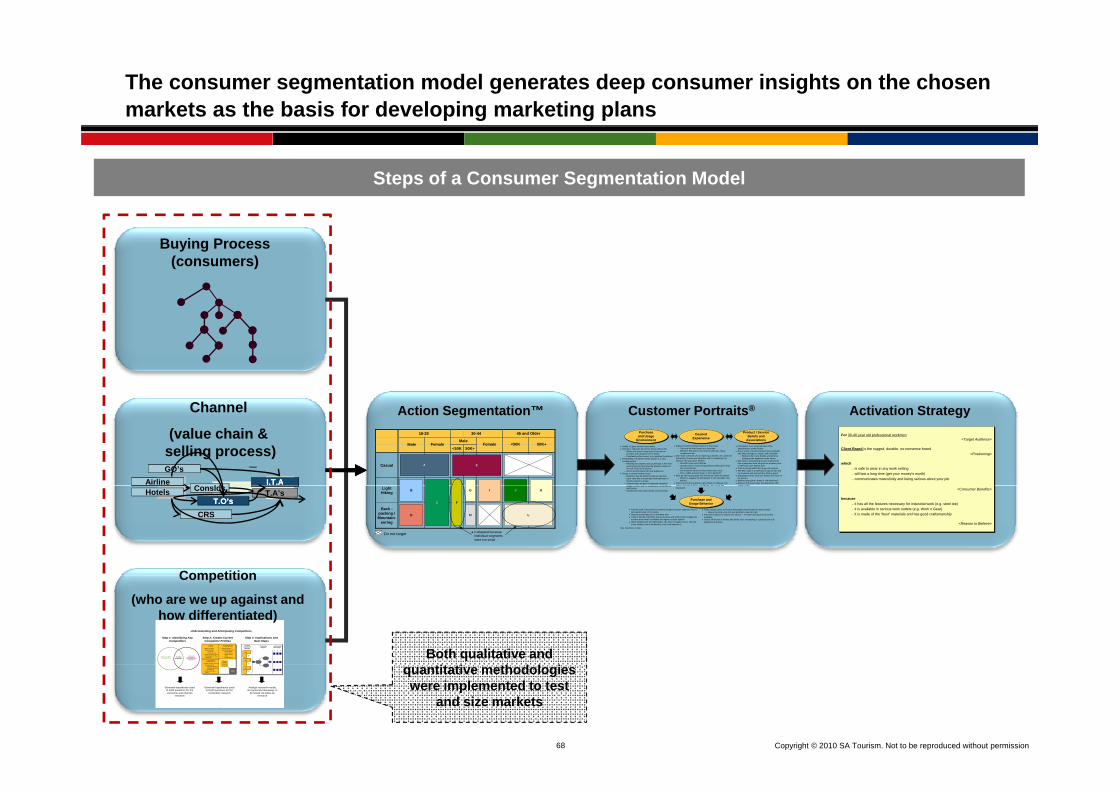
The consumer segmentation model generates deep consumer insights on the chosen markets as the basis for developing marketing plans
Steps of a Consumer Segmentation Model
Buying Process (consumers)
Action Segmentation™ Customer Portraits® Activation Strategy
Middle to upper income householdsKitchen is important part of her home and her life
– Where she plays a large part of her role asprovider and caregiver for her family
– Entertaining often occurs in or includes the kitchenRemodeling to build her dream kitchen is a veryexciting project
– Redoing the cabinets and countertops is the mostexciting part as they have the greatest impact onthe look / feel of the kitchen
– Not as excited about the new appliancesShops at several nearby stores
– Husband may go along to endorse selection– Each store has a reasonably wide selection of
brands and price ranges– Cabinet depth product is displayed alongside
l d t ith l ti f b fit t
Wants to build her dream kitchen in this house– This may be their home for a long time– Wants to feel good in her kitchen and have others
complement herMore than someone who is replacing a broken unit, wants herdishwasher to also look attractive and to complement orenhance the look of her kitchen
– Shouldn’t stick out in kitchen– Usually wants a more energy-efficient dishwasher than
she currently has– Her husband wants one that makes less noise– Price, within a broad range, is not a big factor
Must be able to physically see and touch it before buying it– Wants to imagine the dishwasher in her beautiful, new
kitchenWants to feel she is getting a good deal on whatever sheselects (though all things considered price is not that
Dishwasher is an important part of theattractiveness of the kitchenHas a sense of some brands being acceptableand others being too “cheap” and unreliable
– Believes that some brands are better atmaking some appliances than others
May have a view (based on prior experience)that a particular store will give her a better priceor will have more helpful staffPrice is usually within the range she expectsThe best value is a style that is right for her andher husband and a brand they think is goodDishwashers that “stick out” destroy the “look” ofthe kitchenBelieves that client’s brand is ‘old-fashioned’Believes that most major manufacturers offersimilar quality
DesiredExperience
DesiredExperience
Product / ServiceBeliefs and
Associations
Product / ServiceBeliefs and
Associations
Purchaseand Usage
Environment
Purchaseand Usage
EnvironmentFor 30-40 year old professional workmen
<Target Audience>
Client Brand is the rugged, durable, no-nonsense brand<Positioning>
which– is safe to wear in any work setting– will last a long time (get your money’s worth)– communicates masculinity and being serious about your job
For 30-40 year old professional workmen<Target Audience>
Client Brand is the rugged, durable, no-nonsense brand<Positioning>
which– is safe to wear in any work setting– will last a long time (get your money’s worth)– communicates masculinity and being serious about your job
<50K 50K+
Casual
18-29 30-44 45 and Older
MaleMale Female Female <50K 50K+
AA EE
Channel
(value chain &selling process)
C ldI.T.AI.T.AAirline
GO’s
regular product with no explanation of benefits tojustify price
– Dishwashers look quite similar across brands
selects (though all things considered, price is not thatimportant)
similar quality
Purchase andUsage BehaviorPurchase and
Usage BehaviorFemale head of household is primary shopper because appliance has tolook good based on her tastesRejects brands that she is unfamiliar withTalks to friends and family, browses stores and reads shelter magazinesto learn about what is available and figure out style optionsWhen shopping for her dishwasher, she tries to imagine how it will lookin her kitchen, how it will blend-in, how it will enhance it
Visits several stores to find the dishwasher that best fits her desired style– May price shop once she has identified a specific SKU
Asks her husband to endorse her choice — he may have input on price anddurabilityShows off kitchen to friends and family once remodeling is complete and newappliance is in place
Note: Hypothesis in italics
<Consumer Benefits>
because– it has all the features necessary for industrial work (e.g. steel toe)– it is available in serious work outlets (e.g. Work n Gear)– it is made of the “best” materials and has good craftsmanship
<Reason to Believe>
<Consumer Benefits>
because– it has all the features necessary for industrial work (e.g. steel toe)– it is available in serious work outlets (e.g. Work n Gear)– it is made of the “best” materials and has good craftsmanship
<Reason to Believe>
LightHiking
Back -packing /Mountain-
eering
CC
D
IB
F
H
G
L
JJ K
Collapsed becauseindividual segmentswere too small
Do not target
ConsldsT.O’sT.O’s
T.A’sHotels
CRS
Competition
Understanding and Anticipating Competitors
Step 2: Create Current Competitor Profiles
Goals Assumptions
Capabilities
What are theirtourism goals?
– financial– non-financial
What are their goalswith respect to thecustomer?
What do they have attheir disposal?
What are theirassumptions about...
– the market?– themselves?– South Africa?– other
competitors?
CurrentStrategy
• What choices havethey made / howare they behaving?
CompetitorCompetitorActionsActions
MarketMarketEventsEvents
CustomerCustomer
CurrentCompetitor
Strategy Next StepsImplications
1 2 3A
B
CompetitorAnalysis
Step 1: Identifying Key Competitors
Perceived Offerings of
South Africa and Competitors
FeasibleDestinations
What Long-Haul Customers Want
Step 3: Implications and Next Steps
Competition
(who are we up against and how differentiated)
Both qualitative and tit ti th d l i
68 Copyright © 2010 SA Tourism. Not to be reproduced without permission
3
their disposal?– Tourism offerings– Channel alliances– Reputation
What don’t theyhave?
are they behaving?• How might they try
to evolve? Why?
Future Strategy
CustomerCustomerChangesChanges
C
Generate hypotheses used to build questions for the consumer and channel
research
Generate hypotheses used to build questions for the
competitor research
Analyze research results and generate takeaways to
be tested via follow-up research
quantitative methodologies were implemented to test
and size markets
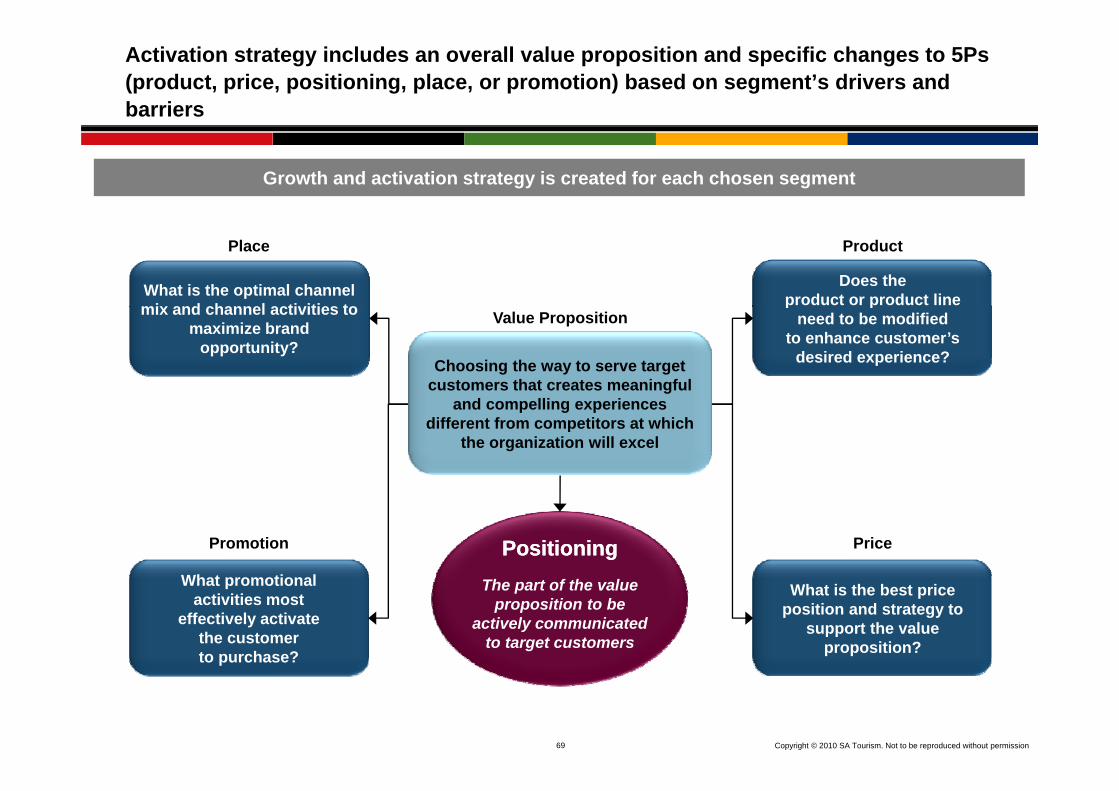
Activation strategy includes an overall value proposition and specific changes to 5Ps (product, price, positioning, place, or promotion) based on segment’s drivers and barriers
Growth and activation strategy is created for each chosen segment
Place Product
Does theproduct or product lineWhat is the optimal channel
i d h l ti iti t Value Propositionp p
need to be modifiedto enhance customer’s
desired experience?
mix and channel activities to maximize brand
opportunity?Choosing the way to serve target
customers that creates meaningful and compelling experiences
different from competitors at which the organization will excel
Promotion PricePositioningPositioningWh t ti l The part of the value
proposition to be actively communicated
to target customers
What promotionalactivities most
effectively activatethe customerto purchase?
What is the best price position and strategy to
support the value proposition?
69 Copyright © 2010 SA Tourism. Not to be reproduced without permission
p

Consumer segmentation allows SA Tourism to develop a consumer focused strategy, instead of its previous product-driven strategy
Consumer Focused Strategy
SA’s tourism
Product Driven Customer-Focused
Understand the consumer
In-depth consumer research in portfolio markets is consistent with the decision taken in the first phase of the TGS: to focus on consumers and not products. In the past SA was marketed
products the consumer/ channel
on consumers and not products. In the past SA was marketed in terms of what products were on offer with little reference to the desired experience of the consumer or a brand positioning for the country.
Decide where to sell the products
TO Develop the products
The second major value of consumer research is the ability to accurately measure the real opportunity for growth. Historically SAT worked with national totals and averages –i.e. total population, average spend and total outbound travel. Thi i i i t b i t k t thThis is inappropriate because in most source markets, the majority of the population travels short-haul if they travel (at all) beyond their own borders
Sell to the consumer /
channel
Execute on marketing
South Africa, being a long-haul market for all major tourism source markets, has to focus on people who are worldly, well travelled and are interested in other cultures. They are also the most positive about our country and interested in travelling here
70 Copyright © 2010 SA Tourism. Not to be reproduced without permission
travelling here

SA Tourism has identified key segments in its focus markets across the world…
Key Focus Segments
Wanderlusters (USA)Upscale Wanderlusters (USA)Wanderlusters (UK)
Wanderlusters NSSAs
Family TravellersAdventurous, explorative
(Grown-Up Wanderlusters)Relaxation & luxury with
some discoveryWanderlusters (UK)Upscale Wanderlusters (UK)Wanderlusters (De)Wandlerlusters (Fr)Wanderlusters (In)Wanderlusters (Ne)E i W d l t (A t )
‘Cocooned’/Low AdventureFamily Explorers (USA)Hyper Wealthy (With Kids) (Ni)Ex-Pat Low Adventure Family Travellers (Ni, Ke)
NSSA Explorers Pampered NSSAs
US Adventure/Culture NSSA’sUK NSSA’s (UK)
US Relaxer NSSA’sHigh End Package (Ne)Emerging Wanderlusters (Aust.)
Wanderlusters (Aust)Expat Wanderlusters (Ni, K)Organized Wanderlusters (Ch)Experienced Wanderlusters (Ch)Organized Wanderlusters (Jp)
Young Families (in)Explorers/Adventurous
Family Explorers (De)French Family ExplorersExpat Family Explorers (Ni, Ke)New Family Explorers (in)
UK NSSA s (UK)German NSSA’s (De)French NSSA’s (Fr)Dutch NSSA’s (Ne)Expat NSSAs (Ni, Ke)NSSA’s (Ke)
High End Package (Ne)Luxury Elderly Break (Ne)High Spend Package (A)Hyper Wealthy (Without Kids) (Ni)Expat Pampered NSSA’s (Ni, Ke)
g ( p)Experienced Wanderlusters (Jp)Wanderlusters (Jp)
New Family Explorers (in)Experienced Family Explorers (In)NSSA’s (Japan)
NSSAs (Aust)
Positive Convertibles Senior Explorers Purpose Travellers
Convertible Short Haul (Ne)Positive Convertibles (USA)Positive Convertible Couples (UK)Positive Convertibles (Japan)
Positive Convertibles
Senior Explorers (De)Senior Explorers (Fr)Senior Explorers (Japan)Empty Nesters (In)
Senior Explorers
Independent Business People (Ni)Traders/Importers (Ni)Purpose Travelers (China)Business Professionals (SADC)
Purpose Travellers
71 Copyright © 2010 SA Tourism. Not to be reproduced without permission
( p ) p y ( )Senior Explorers (Aust).
( )Private Traders (SADC)Taxi Traders (SADC)Trading Truckers (SADC)

…Wanderlusters and NSSA’s (Next Stop South Africa) are the core segments in the international leisure travel markets
Marketing in international markets is focused principally on worldly, well-travelled segments who seek new experiences. SA Tourism’s brand and marketing strategies are focused on two priority segments,
which form the heart of all global marketing campaigns
The ‘Wanderluster’ Segment The “Wanderluster” segment is made up of younger singles or couples between the ages of 25 and 40 and generally do not have children They are young urban professionals earning higher
which form the heart of all global marketing campaigns
and 40 and generally do not have children. They are young urban professionals earning higher incomes, and they already have considerable travel experience. Their desired experience centres on nature, culture and adventure with a strong liking for “urban vibe”. While also concerned with issues of safety and comfort, these consumers are driven more by the emotional appeal of a destination compared to the more practical NSSAs. They are generally more positive about South Africa in every market than any other segment but they also want to travel the world.
The ‘Next Stop South Africa’ (NSSA) segmentThe Next Stop South Africa (NSSA) segment The NSSA segment represents our traditional market. They are wealthier experienced international travellers, usually between the ages of 40 and 60 whose children (if any) have left home. They typically look for natural beauty and authentic cultural experiences. They prefer independent or small group travel, and look for luxury and comfort as part of their experience. S f t i k id ti h h i d ti ti S f i i bi d d hSafety is a key consideration when choosing a new destination. Safari is a big draw-card when travelling to Africa.
72 Copyright © 2010 SA Tourism. Not to be reproduced without permission
The other segment categories are pursued on a tactical or opportunistic basis only
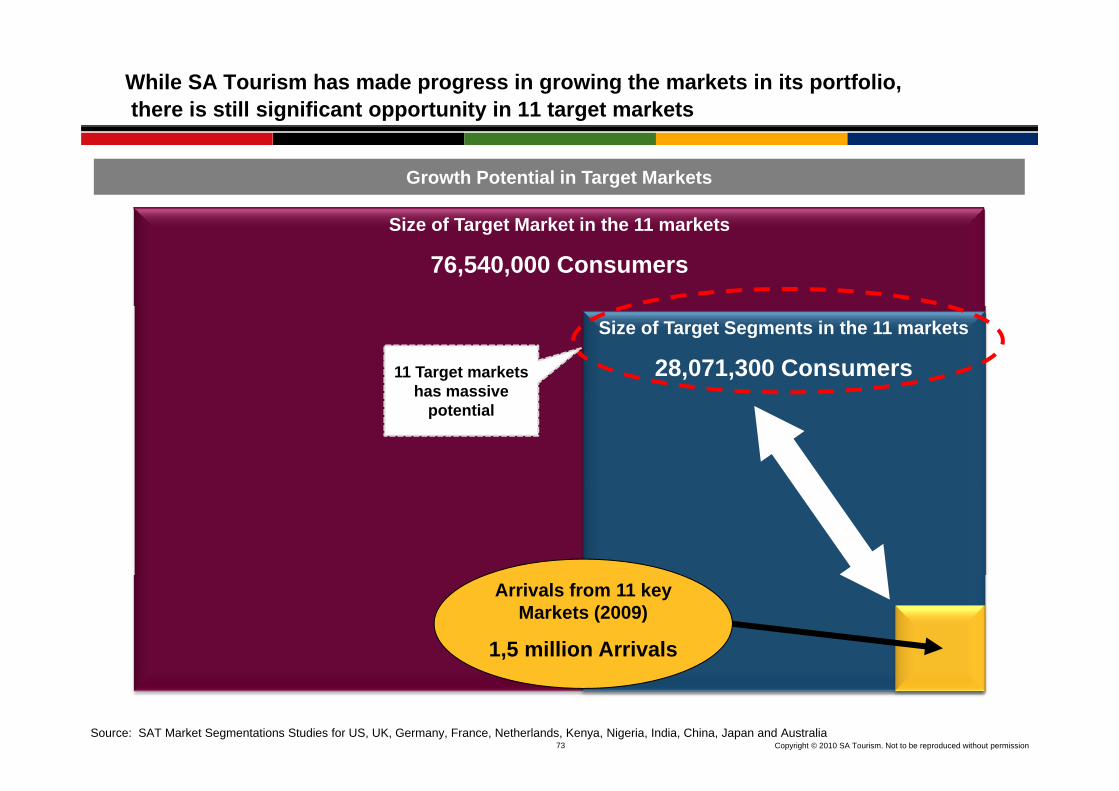
While SA Tourism has made progress in growing the markets in its portfolio,there is still significant opportunity in 11 target markets
Growth Potential in Target Markets
Size of Target Market in the 11 markets
76,540,000 Consumers
Size of Target Segments in the 11 markets
28,071,300 Consumers11 Target markets has massivehas massive
potential
Arrivals from 11 key Markets (2009)
1,5 million Arrivals
73 Copyright © 2010 SA Tourism. Not to be reproduced without permissionSource: SAT Market Segmentations Studies for US, UK, Germany, France, Netherlands, Kenya, Nigeria, India, China, Japan and Australia

Table of Contents
Introduction Page 3
Core Business of SA Tourism Page 12
Key challenges for tourism Page 21
SA Tourism Focus: Where to Play
– Review of the portfolio of markets Page 48
– International consumers Page 65
– Domestic market Page 73
R i f 2003 2008 P 79Review of 2003 – 2008 Page 79
Conclusion Page 87
74 Copyright © 2010 SA Tourism. Not to be reproduced without permission

The Domestic Market is important – and will become more so in future…
Domestic Tourism Market
The South Africanpopulation travel within the country
49% of South Africans undertake travel each yearOn average, domestic travelers take 2.1 trips per year
…
generating huge Domestic travelers generated a total of 30 million trips in 2009 compared to 9 9… generating huge volumes …
Domestic travelers generated a total of 30 million trips in 2009, compared to 9.9 million generated by foreign arrivals
… and significant value
In 2009, domestic tourists spent R 22.4 billion, compared to a total direct spend of R 79.4 billion spent by foreign tourists
BUT the market is still emerging
75 Copyright © 2010 SA Tourism. Not to be reproduced without permission
BUT, the market is still emerging …
Note: Spend includes Capital ExpenditureSource: SAT Analysis

…as there is huge opportunity to grow holiday travel which accounts for 12% of volume and 22% of revenue
Domestic Tourism Market
55% of all trips originate from KZN and GautengThe holiday market is concentrated with 79% of contribution by four provinces (Gauteng, Western Cape, Eastern Cape and KZN)The highest rates of holiday travel incidence are found in the Western Cape (27% of
Where the Volume is
g y p (adults) and Gauteng (26% of adults)
Where the Value is41% of the domestic tourism spend comes from GautengThe highest spenders per trip are from Gauteng and the Western Cape
Holiday travel is the
Holidays made up only 3.6 million trips in 2009 (12%), BUTContribute 22% to the total domestic tourism spend (an average of R 1,330 per trip Holiday travel is the
futurecompared to R 560 for VFR)Have a high average length-of-stay (4.5 nights), ANDHave the highest incidence amongst younger adults (25 – 44 years)
76 Copyright © 2010 SA Tourism. Not to be reproduced without permission
Note: Spend includes Capital ExpenditureSource: SAT Analysis

SA Tourism has a well defined Domestic Tourism Marketing Strategy with the key objective to improve the domestic tourism in the country
D ti t i
Domestic Tourism Objectives
Sustainable GDP growth
Sustainable job creation
Redistribution and transformation
Domestic tourism marketing strategy
strives to contribute to …
Increases in tourist volume
Increases in tourist spend
Increased length of stay
th h d li i
Improved geographic spread
Improved seasonality patterns
Promote transformation
… through delivering sustained ...
Developing a holiday travel lt
Creating year round d ti ticulture
Optimizing spend amongst key segments
destinations
Reducing the geographic polarization of holiday travel
… by focusing on…
77 Copyright © 2010 SA Tourism. Not to be reproduced without permission
y g
Source: South African Tourism Domestic Tourism Growth Strategy

Similar to the international consumer segmentation, SA Tourism segmented the domestic tourism market to identify the key domestic segments and formulate segment specific strategies
Segment A: Segment C:
Domestic Consumer Segmentation
Segment A: Young &
Upcoming
Segment B: IYCF 1
Segment C: Striving Families
Segment D: WOHC 2
Segment E: HBLIC1
Segment F: BNOF2
Segment G: GAC3
Age: 18 - 35 <50 31 - 50 >30 31 - 50 >30 >50
# of People: 5,100 k 700 k 400 k 800 k 400 k 5,500 k 200 k
Average Spend per holiday: R1,367 R4,585 R2,578 R2,258 R1,392 R1,449 R3,985
Average length of 6 Ni h 10 Ni h Ni h Ni h Ni h Ni h 13 Ni hAverage length of stay: 6 Nights 10 Nights 5.5 Nights 7.5 Nights 5 Nights 5 Nights 13 Nights
78 Copyright © 2010 SA Tourism. Not to be reproduced without permission
Note: 1IYCF – Independent Young Couples & Families ; 2WOHC – Well Off Homely Couples fSource: South African Tourism Domestic Tourism Growth Strategy; KPMG analysis (2003)
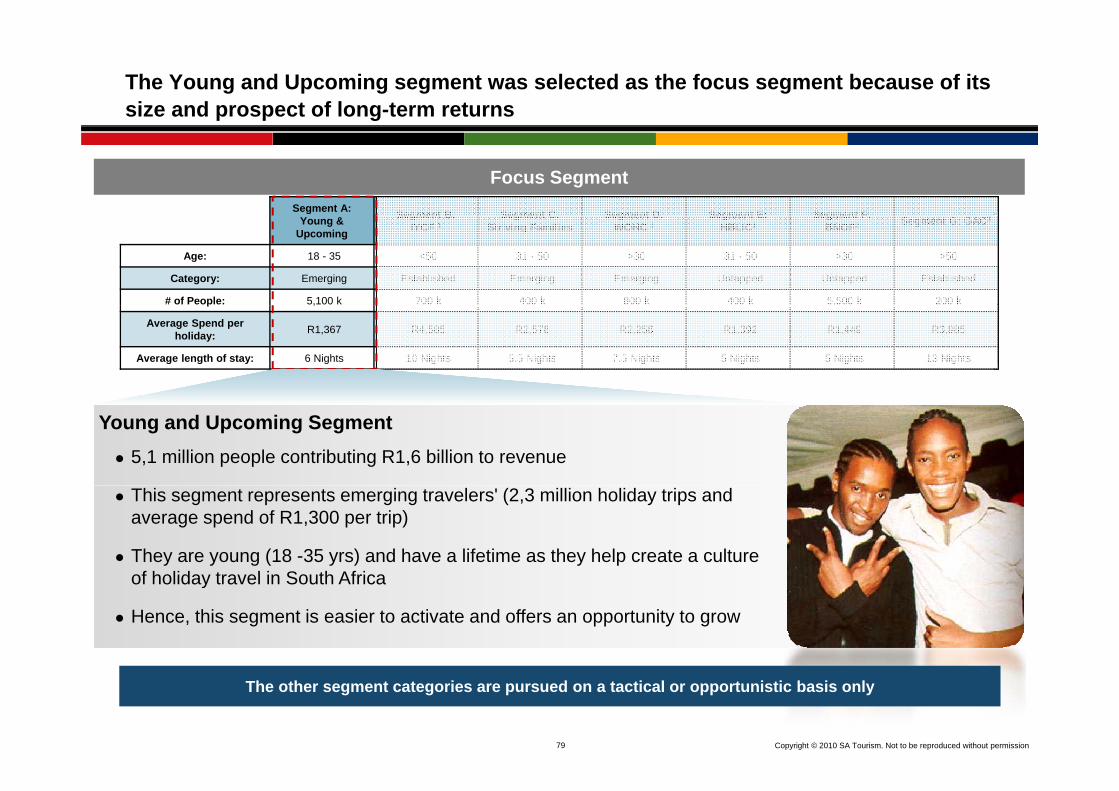
The Young and Upcoming segment was selected as the focus segment because of its size and prospect of long-term returns
Focus SegmentSegment A: Segment B: Segment C: Segment D: Segment E: Segment F:Young & Upcoming
Segment B: IYCF 1
Segment C: Striving Families
Segment D: WOHC 2
Segment E: HBLIC1
Segment F: BNOF2 Segment G: GAC3
Age: 18 - 35 <50 31 - 50 >30 31 - 50 >30 >50
Category: Emerging Established Emerging Emerging Untapped Untapped Established
# of People: 5,100 k 700 k 400 k 800 k 400 k 5,500 k 200 kp
Average Spend per holiday: R1,367 R4,585 R2,578 R2,258 R1,392 R1,449 R3,985
Average length of stay: 6 Nights 10 Nights 5.5 Nights 7.5 Nights 5 Nights 5 Nights 13 Nights
Young and Upcoming Segment 5,1 million people contributing R1,6 billion to revenue
This segment represents emerging travelers' (2,3 million holiday trips and average spend of R1,300 per trip)
They are young (18 -35 yrs) and have a lifetime as they help create a culture of holiday travel in South Africaof holiday travel in South Africa
Hence, this segment is easier to activate and offers an opportunity to grow
79 Copyright © 2010 SA Tourism. Not to be reproduced without permission
The other segment categories are pursued on a tactical or opportunistic basis only
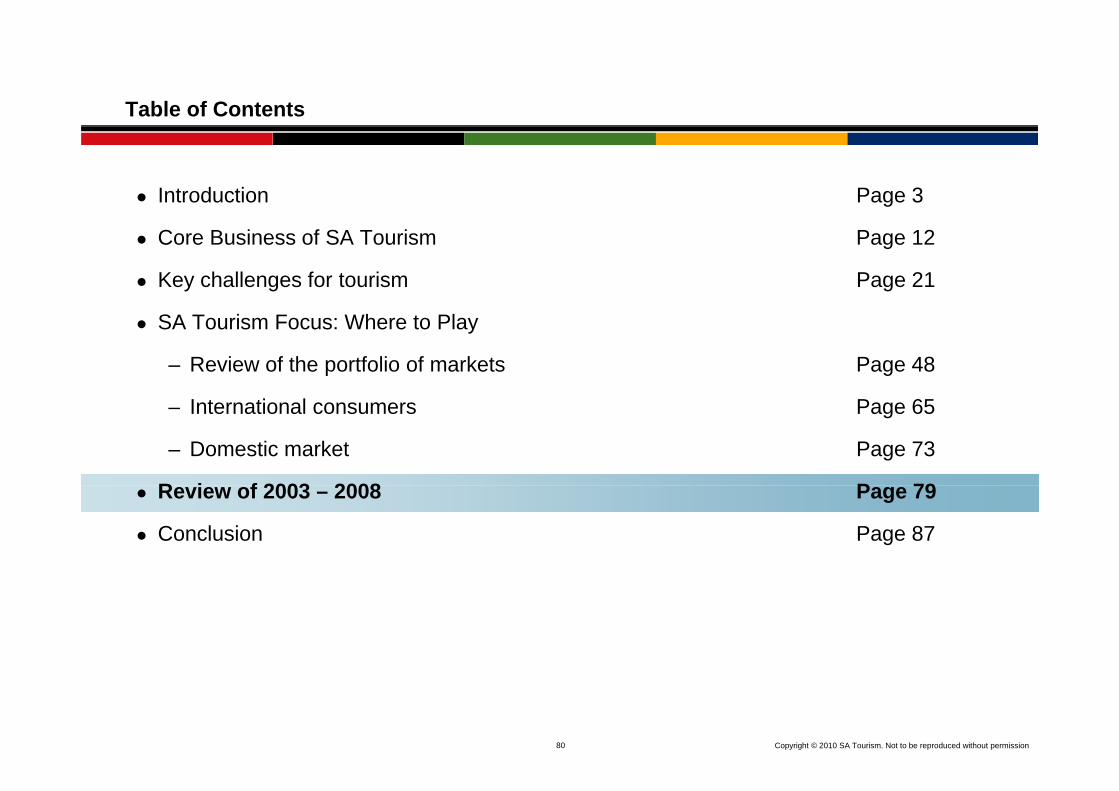
Table of Contents
Introduction Page 3
Core Business of SA Tourism Page 12
Key challenges for tourism Page 21
SA Tourism Focus: Where to Play
– Review of the portfolio of markets Page 48
– International consumers Page 65
– Domestic market Page 73
R i f 2003 2008 P 79Review of 2003 – 2008 Page 79
Conclusion Page 87
80 Copyright © 2010 SA Tourism. Not to be reproduced without permission

While the domestic market accounts for 75% of total tourism volume to SA, foreign markets contribute the most to total tourism revenue
Domestic Trips vs. Foreign Arrivals, 2007 – 2009 Domestic vs. Foreign Direct Spend, 2007 – 2009
Contribution of Domestic and International Tourism
Domestic Trips vs. Foreign Arrivals, 2007 2009 Domestic vs. Foreign Direct Spend, 2007 2009
15%
45.0m
17% 19%
42.5m 39.4m 80.1bn 101.3bn100.1bn
6%6%5%52%45% 43%
80% 75%77% 30% 31%27%
22%26%25%
2007 20092008
Foreign Air DomesticForeign Land
200920082007
22%
DomesticForeign Land Foreign Air
CAGR 07 - 09
Total -6.4%
Foreign Land 6.3%
CAGR 07 - 09
Total 12.4%
Foreign Land 19.8%
81 Copyright © 2010 SA Tourism. Not to be reproduced without permission
Foreign Air -0.4%
Domestic -9.4%
Foreign Air 7.1%
Domestic 4.5%
Source: StatsSA, SAT Departure and Domestic surveys for 2007 to 2009
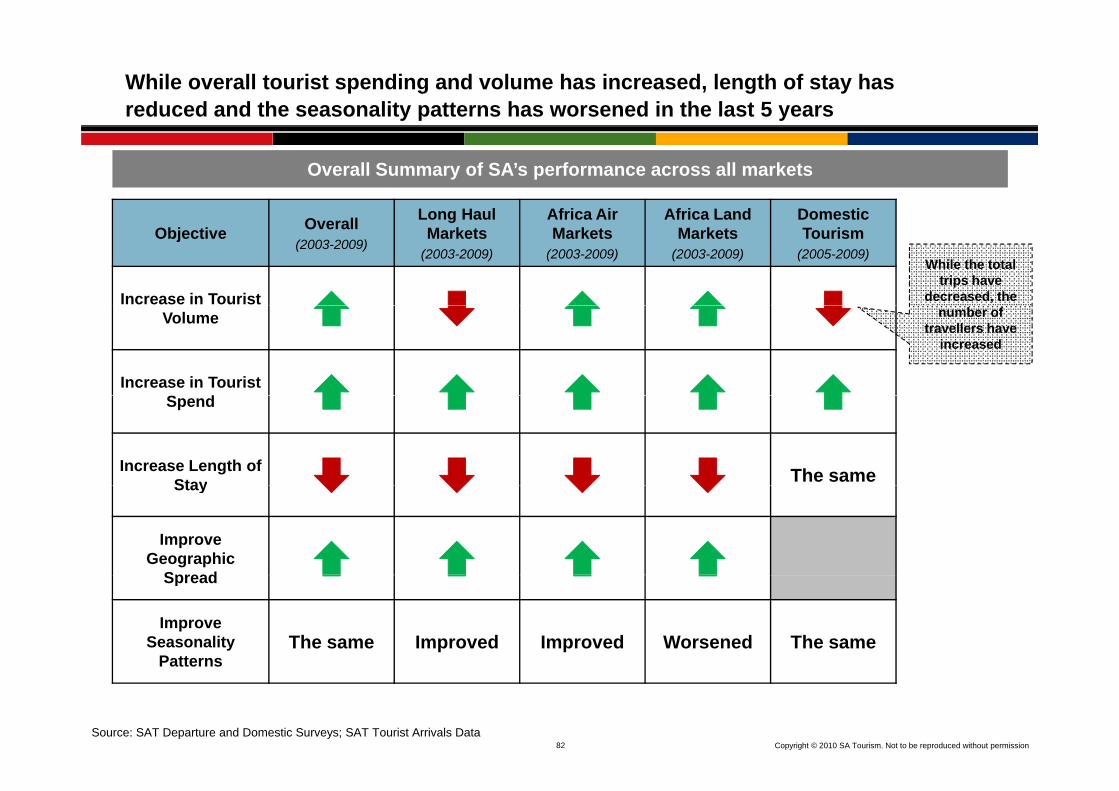
While overall tourist spending and volume has increased, length of stay has reduced and the seasonality patterns has worsened in the last 5 years
Long Haul Africa Air Africa Land Domestic
Overall Summary of SA’s performance across all markets
Objective Overall(2003-2009)
Long Haul Markets
(2003-2009)
Africa Air Markets
(2003-2009)
Africa Land Markets
(2003-2009)
Domestic Tourism
(2005-2009)
Increase in Tourist
While the total trips have
decreased, the Volume
Increase in Tourist S d
number of travellers have
increased
Spend
Increase Length of Stay The sameStay
Improve Geographic
SpreadSpread
Improve Seasonality
PatternsThe same Improved Improved Worsened The same
82 Copyright © 2010 SA Tourism. Not to be reproduced without permission
Patterns
Source: SAT Departure and Domestic Surveys; SAT Tourist Arrivals Data
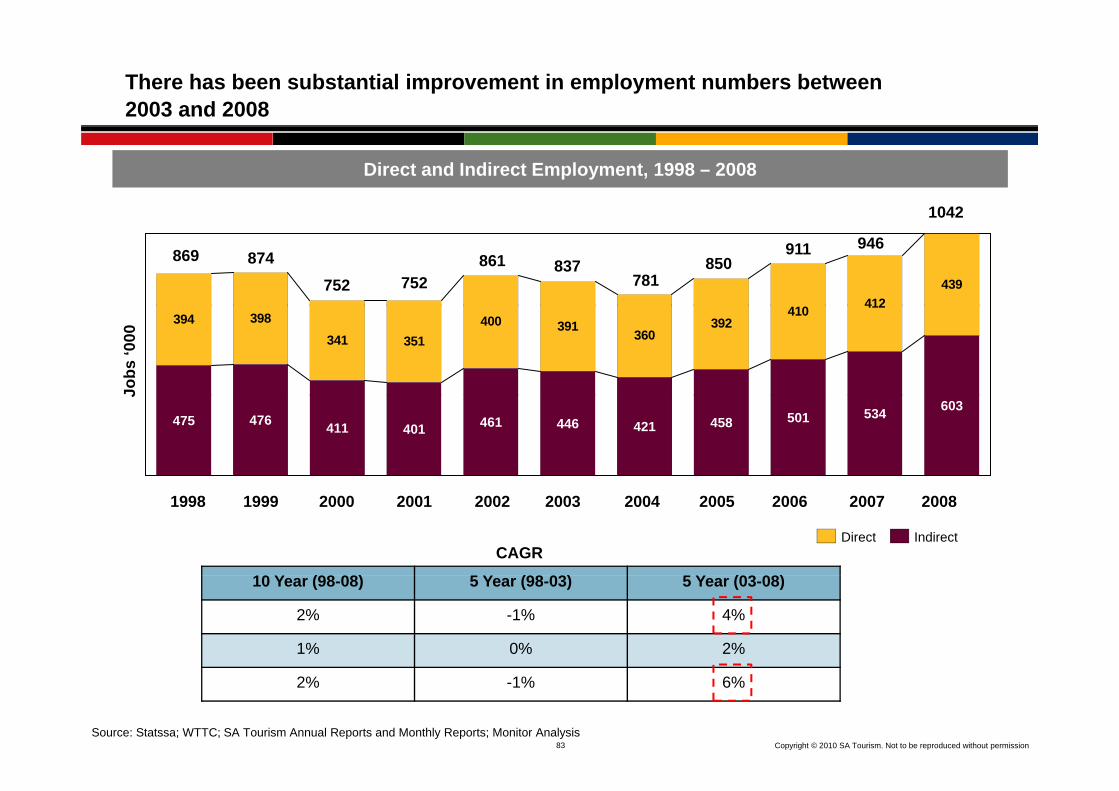
There has been substantial improvement in employment numbers between 2003 and 2008
1042
Direct and Indirect Employment, 1998 – 2008
412439
869 874752 752
861 837781
850
1042
946911
398341 351
400 391 360392
410 412394
Jobs
‘000
401411501458476
603475 421
534461 446
J
IndirectDirect
1998 1999 2000 2001 2002 2003 2004 2005 2006 2007 2008
10 Y (98 08) Y (98 03) Y (03 08)
CAGR
10 Year (98-08) 5 Year (98-03) 5 Year (03-08)
2% -1% 4%
1% 0% 2%
83 Copyright © 2010 SA Tourism. Not to be reproduced without permissionSource: Statssa; WTTC; SA Tourism Annual Reports and Monthly Reports; Monitor Analysis
2% -1% 6%

SA has maintained a double-digit growth rate of tourism industry GDP contribution over the 5-year period ending in 2008
CAGRCurrent GCP StudyPrevious GCP Study
Direct and Indirect Contribution to GDP
GDP Contribution DirectGDP Contribution Direct & Indirect
CAGR
14%
10 year
98-08
5 year
98-03
14%
5 year
03-08
13%
Current GCP StudyPrevious GCP Study
163
195
Ran
d B
n
% % %
98 103 106121
140
163
13% 15% 11%53 58 64
73
21 24 26 3141 43 44 50 57 63
73
20082000 20011998 1999 2003 20072002 200620052004 Growth in direct GDP contribution in 2003-2008 is
slower than the growthContribution as % of GDP
Direct 2.8 2.9 2.8 3.0 3.5 3.4 3.1 3.2 3.2 3.1 3.2Direct & Indirect 7.1 7.2 6.9 7.2 8.3 8.1 7.5 7.7 7.9 8.1 8.5
The tourism industry contribution to GDP grew by
140 basis points between
slower than the growth achieved during 1998-2003
84 Copyright © 2010 SA Tourism. Not to be reproduced without permission
Note: Direct industry GDP measures the value added of the traditional Travel & Tourism industries, excluding any indirect effects generated throughout the supply chain and all tourism-related investment, collective public spending and export of tourism-related goodsSource: WTTC; StatSA; World Economic Outlook Database; Monitor Analysis
p1998 and 2008

During 2007, tourism contributed substantially (~15% to ~44%) to the employment in other sectors of the country…
Tourism’s Direct and Indirect Contribution to South Africa’s Employment by Sectors, 2007
4,000 3,806
27.5% NA1 14.6% 43.6% 21.2% 31.8% 37.7% 22.8% 23.0%
T i ’ t t ib ti t t ’ ll 2007
3,000
,
6643,410
682
3,806213
Indirect Tourism EmploymentDirect Tourism Employment
Tourism’s percentage contribution to a sector’s overall 2007 employment. Both direct and indirect contribution by Tourism
have been added to calculate the percentage figures
oym
ent (
‘000
)
81
702,000
403
2141,447
2,929
1,941
p yNon-Tourism Employment
Em
plo
47323 28148
81
60
48
864
0
1,0001,657
1,093
84
184770
861 1,117457217
2482,326734
5580
Agriculture,hunting,forestry
and fishing
Miningand
quarrying1
Manufacturing Electricity,gas and
water supply
Construction Wholesaleand retail
trade
Transport, storage and
comm.
Finance, real estate,
insurance and business services
Services and others
85 Copyright © 2010 SA Tourism. Not to be reproduced without permission
Note: 1Tourism’s contribution to ‘Mining and quarrying’ is not available; Data available for 2007 only; Total Tourism contribution has been calculated by subtracting Tourism’s direct and indirect contribution from the total employment in a particular sector for 2007Source: ‘The Impact of Tourism on the Economy of South Africa – 2007’, SAT, August 2008; ‘Tourism’ reports by Stats SA

…It also made a significant contribution (7.5% to ~12%) to the gross value added (GVA) by other sectors
Tourism’s Direct and Indirect Contribution to SA’s Gross Value Added (GVA)1 by Sectors, 2007
10.0% NA2 7.5% 12.4% 9.5% 11.3% 11.8% 9.3% 9.7%3
Tourism’s overall (direct and indirect) percentage Non-Tourism GVAIndirect Tourism GVADirect Tourism GVA
( ) p gcontribution to South Africa’s GVA1 in 2007
% C
ontri
butio
n%
32
3
86 Copyright © 2010 SA Tourism. Not to be reproduced without permission
Note: 1Tourism’s sectoral contribution to GDP is not available. This slide is for GVA, defined as Gross Value Added (GVA) = GDP – taxes on products – subsidies on products; 2Tourism’s contribution to ‘Mining and quarrying’ is not available; Data available for 2007 only; Total Tourism contribution has been calculated by subtracting Tourism’s direct and indirect GVA contribution percentage from 100%; Totals may not add to 100% due to rounding off; 3Weighted average of Real composition of GDP per sector in Q4 of 2007, of the two sectors, viz. personal and government servicesSource: ‘The Impact of Tourism on the Economy of South Africa – 2007’, SAT, August 2008; ‘Tourism’ reports by Stats SA
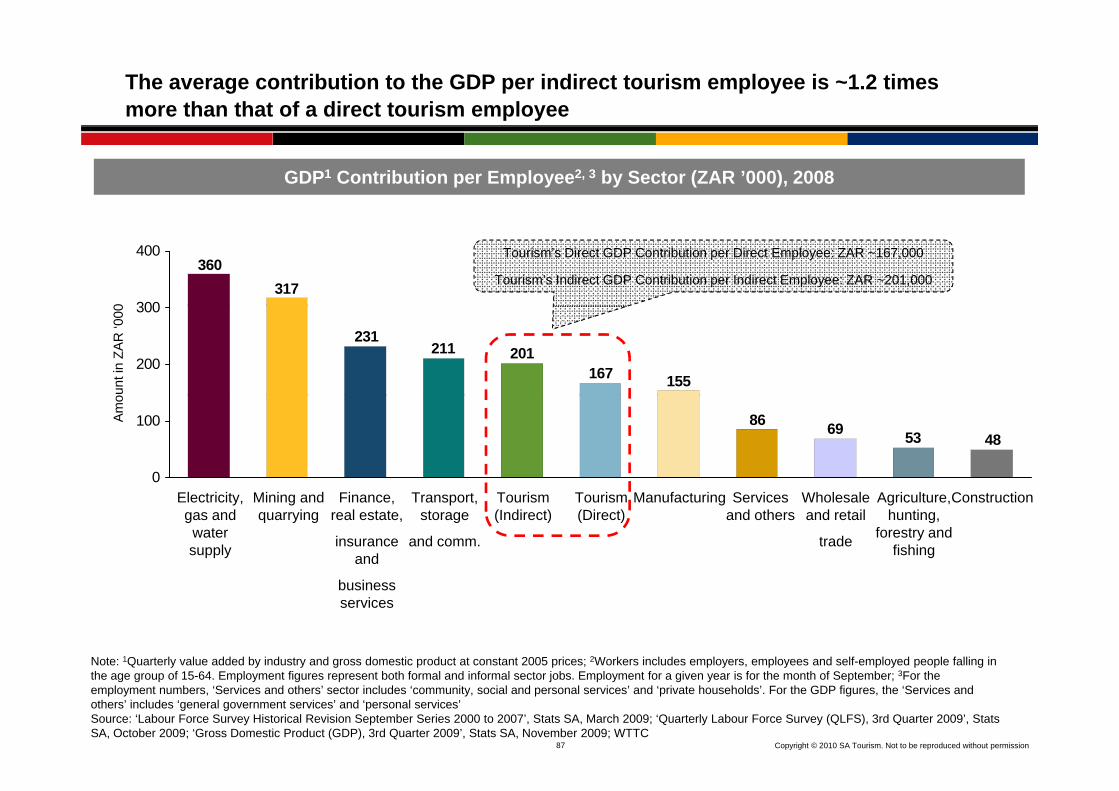
The average contribution to the GDP per indirect tourism employee is ~1.2 times more than that of a direct tourism employee
GDP1 Contribution per Employee2, 3 by Sector (ZAR ’000), 2008
0
317360
300
400 Tourism’s Direct GDP Contribution per Direct Employee: ZAR ~167,000
Tourism’s Indirect GDP Contribution per Indirect Employee: ZAR ~201,000
ount
in Z
AR
‘000
155167201211
231
200
300
Amo
48536986
0
100
Tourism(Indirect)
ConstructionAgriculture, hunting,
forestry and fishing
Wholesale and retail
trade
Services and others
ManufacturingTransport, storage
and comm.
Finance, real estate,
insurance and
Tourism(Direct)
Mining and quarrying
Electricity, gas and water supply
business services
Note: 1Quarterly value added by industry and gross domestic product at constant 2005 prices; 2Workers includes employers, employees and self-employed people falling in
87 Copyright © 2010 SA Tourism. Not to be reproduced without permission
Note: Quarterly value added by industry and gross domestic product at constant 2005 prices; Workers includes employers, employees and self employed people falling in the age group of 15-64. Employment figures represent both formal and informal sector jobs. Employment for a given year is for the month of September; 3For the employment numbers, ‘Services and others’ sector includes ‘community, social and personal services’ and ‘private households’. For the GDP figures, the ‘Services and others’ includes ‘general government services’ and ‘personal services’Source: ‘Labour Force Survey Historical Revision September Series 2000 to 2007’, Stats SA, March 2009; ‘Quarterly Labour Force Survey (QLFS), 3rd Quarter 2009’, Stats SA, October 2009; ‘Gross Domestic Product (GDP), 3rd Quarter 2009’, Stats SA, November 2009; WTTC
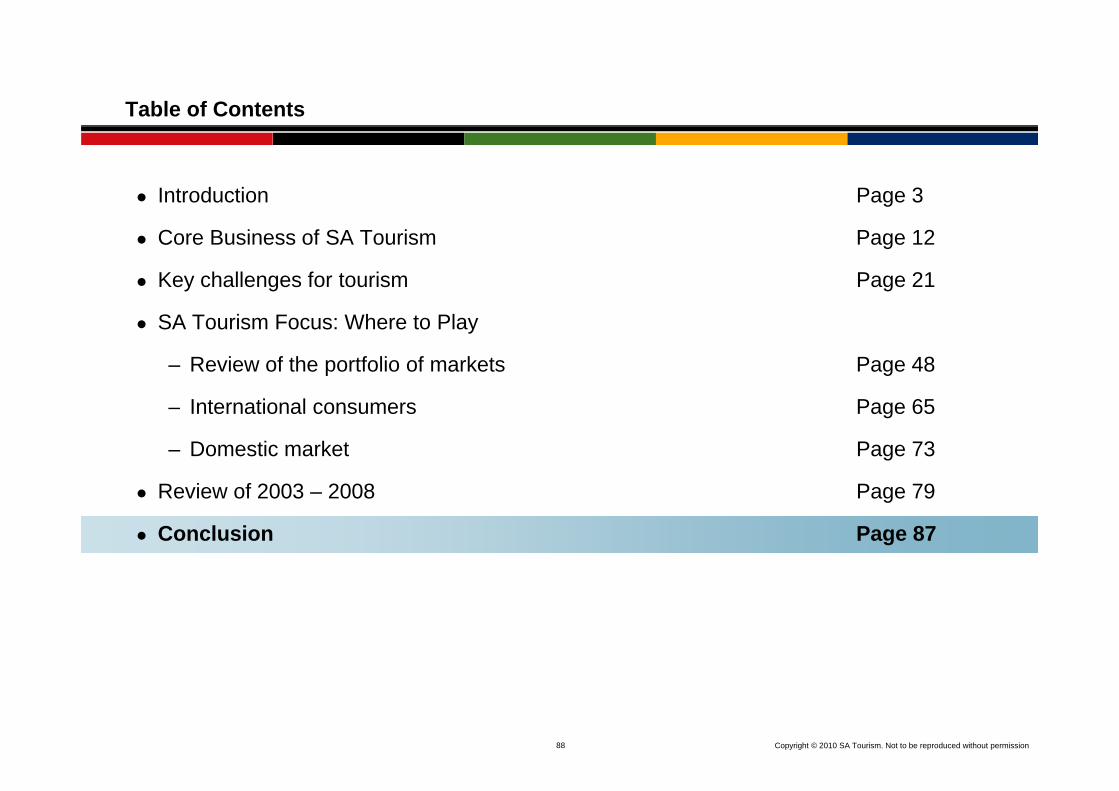
Table of Contents
Introduction Page 3
Core Business of SA Tourism Page 12
Key challenges for tourism Page 21
SA Tourism Focus: Where to Play
– Review of the portfolio of markets Page 48
– International consumers Page 65
– Domestic market Page 73
R i f 2003 2008 P 79Review of 2003 – 2008 Page 79
Conclusion Page 87
88 Copyright © 2010 SA Tourism. Not to be reproduced without permission

SA Tourism is responsible for branding and creating awareness – tourism service providers are responsible for the experience delivery
Awareness and desireTHESE ARE GOVERNMENT
Awareness created by SAT marketing
campaigns
LEVEL CHOICES
Channels:
Delivery and Experience
Tour operators, Internet, etc
The South African Tourism Product
Offering
Transport:Airline, rail, car, ship
Awareness created by marketing campaigns of
89 Copyright © 2010 SA Tourism. Not to be reproduced without permission
industry THESE ARE COMPANY - LEVEL CHOICES

The Theory of Travel Evolution: Markets are at different stages of development and therefore need specific strategies to activate
Introduction Growth Maturity
Tourism Industry Life Cycle
USA
Germany, Netherlands,
France, UK, Japan
% of population
Italy
KenyaNigeria
% of population traveling for leisure
SADCChina, IndiaSouth Africa
Australia
Botswana
This phase may be very long
Consumer Uninformed, Price insensitive, multi-purpose
Seek information & opportunity, discover leisure
Very informed, price sensitive, focus on leisure
Botswana
Time*
Product
Competitor
Very individualizedStatus oriented
FewOne-stop-shops
Unsophisticated isolated
Emergence of packages (seeking scale effects)
Emerging specialization / focus
Integrate products;
Specialized packages
High competitionClear focus
Specialization Information
MarketSymptoms
Marketing
Overall
Channel Unsophisticated, isolated, experience based
Combine with trade initiatives
Integrate products; information/choice provider
“Shout”: get as many as you can
Facilitate scale effects (e g
Specialization, Information provider
Adapt trade and market to select segmentsTourism
Authority
90 Copyright © 2010 SA Tourism. Not to be reproduced without permission
Overall strategy Develop positioning Facilitate scale effects (e.g.,
packages) Understand segments & selectActions
* The duration of the phases of the life cycle may vary significantly; their graphical representation with equal distances may thus be misleading. Note: Framework based on Michael Porter: Competitive Strategy, 1980, Chapter 8 (Industry Evolution)
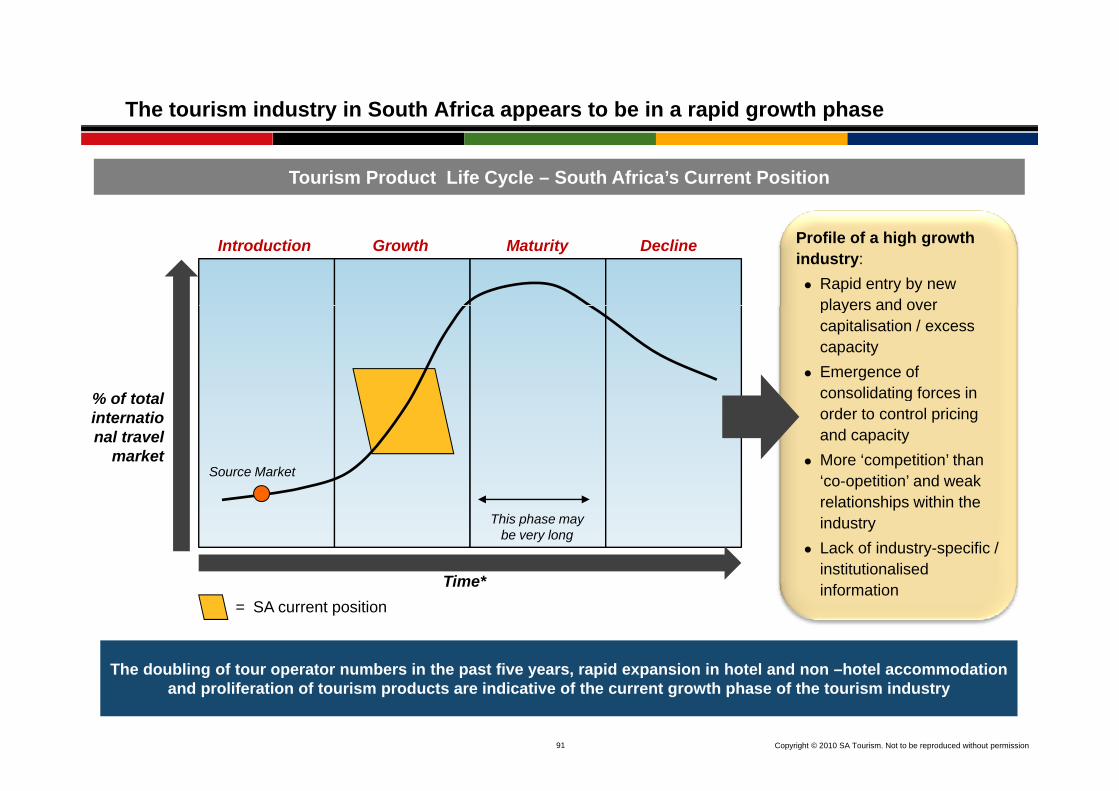
The tourism industry in South Africa appears to be in a rapid growth phase
Tourism Product Life Cycle – South Africa’s Current Position
Profile of a high growth industry:
Rapid entry by new players and over
Introduction Growth Maturity Decline
players and over capitalisation / excess capacityEmergence of consolidating forces in% of total consolidating forces in order to control pricing and capacityMore ‘competition’ than ‘co-opetition’ and weakSource Market
% of total international travel
marketco opetition and weak relationships within the industryLack of industry-specific / institutionalised
This phase may be very long
* information= SA current position
Time*
Th d bli f t t b i th t fi id i i h t l d h t l d ti
91 Copyright © 2010 SA Tourism. Not to be reproduced without permission
The doubling of tour operator numbers in the past five years, rapid expansion in hotel and non –hotel accommodation and proliferation of tourism products are indicative of the current growth phase of the tourism industry
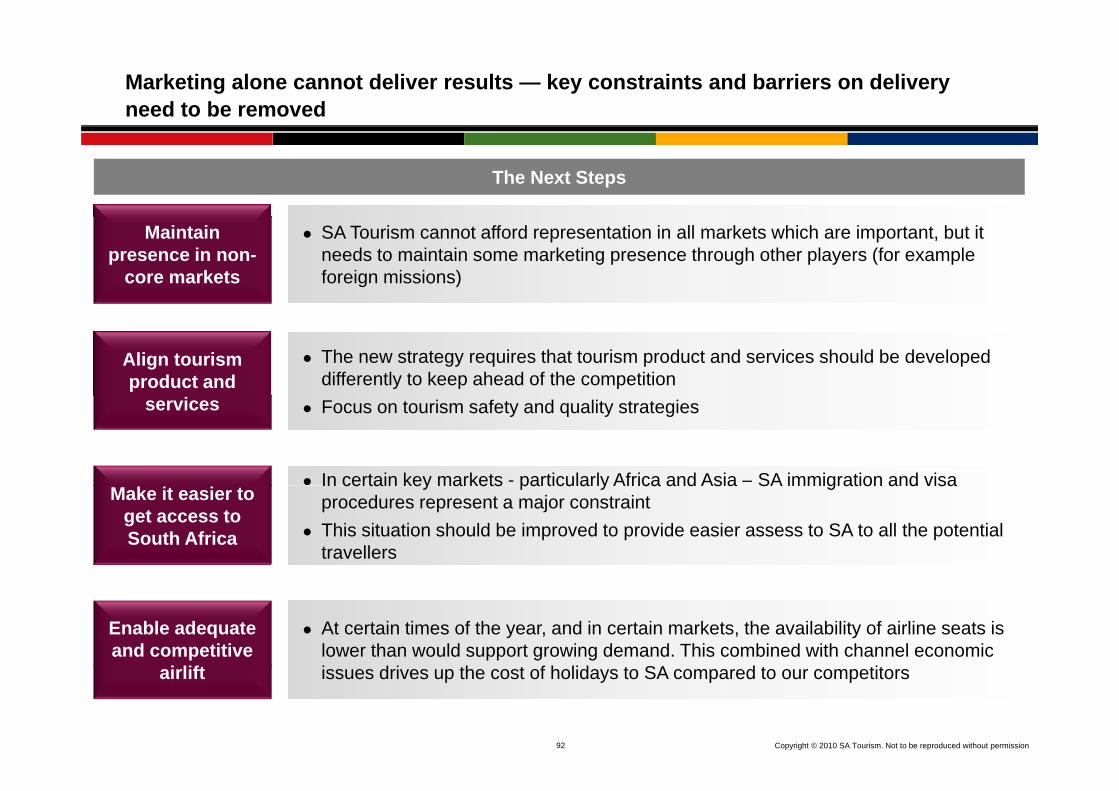
Marketing alone cannot deliver results — key constraints and barriers on delivery need to be removed
The Next Steps
SA Tourism cannot afford representation in all markets which are important, but it needs to maintain some marketing presence through other players (for example foreign missions)
Maintain presence in non-
core markets
The new strategy requires that tourism product and services should be developed differently to keep ahead of the competition
Align tourism product and
Focus on tourism safety and quality strategiesservices
In certain key markets - particularly Africa and Asia – SA immigration and visaIn certain key markets particularly Africa and Asia SA immigration and visa procedures represent a major constraintThis situation should be improved to provide easier assess to SA to all the potential travellers
Make it easier to get access to South Africa
At certain times of the year, and in certain markets, the availability of airline seats is lower than would support growing demand. This combined with channel economic
Enable adequate and competitive
92 Copyright © 2010 SA Tourism. Not to be reproduced without permission
issues drives up the cost of holidays to SA compared to our competitorsairlift
For more information contactFor more information contactSouth African TourismPrivate Bag X10012
SandtonJohannesburgJohannesburg
2146Tel: +2711 895 3000
Email: [email protected]
93 Copyright © 2010 SA Tourism. Not to be reproduced without permission
www.southafrica.net